Next Article in Journal
Early Risk Warning of Highway Soft Rock Slope Group Using Fuzzy-Based Machine Learning
Previous Article in Journal
A Review on Environmental Efficiency Evaluation of New Energy Vehicles Using Life Cycle Analysis
 
 
sustainability-logo
Article Menu

Article Menu

Article

Study on Influencing Factors and Simulation of Watershed Ecological Compensation Based on Evolutionary Game

State Key Laboratory of Eco-Hydraulics in Northwest Arid Region of China, Xi’an University of Technology, No. 5 South Jinhua Road, Xi’an 710048, China
*
Author to whom correspondence should be addressed.
Sustainability 2022, 14(6), 3374; https://doi.org/10.3390/su14063374
Submission received: 14 February 2022 / Revised: 7 March 2022 / Accepted: 11 March 2022 / Published: 13 March 2022
(This article belongs to the Topic Sustainable Built Environment)

Abstract

:
In the practice of watershed ecological compensation, due to the inconsistency between the interests of economic development and the objectives of ecological protection, there are typical game characteristics among the relevant stakeholders. Taking the ecological compensation between Henan and Shaanxi in the Yellow River Basin as an example, this paper constructs an evolutionary game model, obtains the external conditions for various stakeholders to achieve stable cooperation from the perspective of the government, and demonstrates the necessity of combining vertical and horizontal ecological compensation. The sensitivity of each party’s decision making to key elements is analyzed through a simulation. The results show that: (1) the optimal strategy is mainly affected by the initial willingness of the upstream government and the central government; the strong regulatory power of the central government can eliminate the influence of the initial will; (2) development opportunity costs and vertical fiscal transfer payments have the most obvious influence on upstream government decision-making; (3) the effect on optimal decision state of downstream paying upstream ecological compensation is higher than that of upstream paying downstream ecological compensation; (4) the punishment of the central government should ensure the binding force on the lower governments, and the revenue and expenditure under its supervision strategy should ensure the effectiveness of the supervision public power. The above conclusions provide support for improving the ecological compensation mechanism of transboundary basins.

1. Introduction

With the rapid development of society, the economy, and the rapid growth in population, the damage that human production and life causes to watershed ecosystems is increasing. In order to ensure the sustainable and coordinated development of the watershed economy and society, watershed ecological governance has become a necessity [1,2,3]. Watershed ecological governance often involves multiple administrative units [4,5,6]. The dynamic characteristics of a river system mean that the main upstream and downstream bodies of a river basin involve different interests and unclear rights and responsibilities in terms of the development and utilization of water resources, environmental protection, and ecological governance [7,8,9]. How to solve or alleviate the problems of ecological externalities has become the key to the ecological governance of river basins [10,11,12].
In order to reduce or eliminate the problems caused by watershed ecological externality, many scholars around the world have carried out research on it and put forward solutions, among which is ecological (environmental) system services payments [13,14,15]. In the 1990s, this concept attracted the attention of many countries. On the one hand, economic marketization promoted the market allocation of eco-environmental resources; on the other hand, payment for ecosystem services not only played a role in the restoration of the environment, but also reduced poverty in economically underdeveloped areas to a certain extent [8,16]. In the late 1990s, ecosystem services payment was widely recognized by many countries in the field of watershed governance [17,18,19]. Its advantage is that it can make multiple administrative units cooperate to manage a watershed and effectively solve the problem of equity imbalance in the process of watershed ecological governance. For example, in order to ensure the quality of urban drinking water, New York City, USA reached a clean water supply agreement to levy fees on drinkers and provide funds and technology to farmers in the basin to change their mode of production [20,21,22]. A downstream hydropower station in Costa Rica makes ecosystem services payments to maintain and repair the forest coverage in the upstream area, so as to prevent the deposition of sediment in the downstream reservoir and obtain a stable water flow [23,24,25]. The establishment of emission trading rights in the USA has helped with the efficient allocation of environmental capacity resources [26,27,28]. Canada’s Grand River ecosystem services payment project adopts directional compensation to maximize the environmental protection benefits [29,30].
In China, the ecological compensation system is similar to the payment for ecosystem services [31,32,33]. The public nature of natural resources means that the river basin ecological compensation is dominated by top-down vertical financial transfers, supplemented by horizontal payments or market trade [34,35]. For example, for the project of returning farmland to forest (grassland) in the Yangtze River Basin, the government will compensate rural landowners and other providers who provide ecosystem services [36,37,38]. The water rights transaction between Yiwu and Dongyang in Zhejiang Province is the first water rights transaction in China. It not only reduces the cost of obtaining water resources in Yiwu, but also helps Dongyang obtain economic benefits exceeding the cost of water savings, so as to achieve a win-win situation [39,40]. Based on the principle of cost sharing and benefit sharing, the Xin’anjiang River basin ecological compensation project has established a cross-province river basin ecological protection mechanism in Anhui and Zhejiang provinces, which has greatly improved the water quality and quantity of Xin’anjiang River. It is a successful pilot for China to actively explore the cross-basin horizontal ecological compensation mechanism [41,42].
Based on the practice of ecological compensation, the central government issued guiding opinions on accelerating the establishment of a horizontal ecological protection compensation mechanism upstream and downstream of the basin in 2016 [43]. The document stipulated that the central government will provide financial support for the project according to the river basin ecological compensation agreement between provincial administrative regions. Given that it is the “Mother River” in China, the Yellow River Basin ecological protection and high-quality development is a major national development strategy [44]. The Yellow River Basin covers an area of 795,000 square kilometers and flows through nine provinces in China. Stakeholders have conflicting needs in terms of ecological protection and governance and economic development [45,46]. The imbalance or even separation of input and output of ecological protection has a serious impact on the enthusiasm for ecological protection investment [47] and contradicts the urgent need for ecological protection in the Yellow River Basin. Therefore, it is urgent to promote a horizontal ecological compensation mechanism in the upper and lower reaches of the Yellow River Basin and carry out cross-regional joint prevention and governance [12,48]. Domestic research on the basin ecological compensation mechanism has mostly focused on the construction of a single vertical ecological compensation [49] or horizontal ecological compensation mechanism between governments at the same level [50,51]; there is little research on the collaborative construction of a basin ecological compensation mechanism by higher-level governments and upstream and downstream governments. Many studies on the single compensation mechanism show that the effect of vertical ecological compensation on watershed ecological governance is more significant in the short term. The main reason is that the local government of the watershed, as the first beneficiary receiving compensation or financial incentives, has more impetus to improve the environment and control pollution. However, the single form and source of compensation lead to a lack of sustainability for vertical ecological compensation. Horizontal ecological compensation has strong sustainability in ecological governance, and is more in line with the compensation principle of “who pollutes, who governs, who benefits, who compensates.” However, horizontal ecological compensation is not perfect in terms of standard accounting and implementation constraints, which means the internal motivation of actors to participate in river basin ecological compensation is insufficient; in addition, the mechanism construction is difficult and the compensation effect is not significant. In some cross-regional water pollution control studies, the higher-level government as the regulator is considered to participate in the construction of an intergovernmental ecological compensation mechanism in the upstream and downstream of the river basin. However, in the practice of river basin ecological governance, the higher-level government is not only the regulator, but also often bears the responsibility of the compensation subject [10].
The local upstream and downstream governments of the basin disagree with the central government about economic development and the objectives of ecological and environmental protection, which means the three parties have typical game characteristics. The evolutionary game theory was put forward by the ecologist John Maynard Smith; on the basis of studying the phenomenon of ecological evolution in combination with biological evolutionary theory and classical game theory, it is free of the total focus on rationality in the classical game theory [52,53]. Evolutionary game theory holds that human beings cannot be completely rational, as described in traditional game theory, and obtain the best response strategy through complex calculation [54]. Evolutionary game theory combines game theory analysis with dynamic evolutionary process analysis; the difference between them is that game theory focuses on static equilibrium and comparative static equilibrium, while evolutionary game theory emphasizes dynamic equilibrium. In the practice of water pollution control of the East Route of the South-to-North Water Transfer Project, the evolutionary game theory is used to study the ecological compensation mechanism between the water-receiving area and the water transfer area with game characteristics [55], which plays an important role in the construction of a cross-regional water pollution control system. Therefore, this paper chooses the evolutionary game model to study the ecological mechanism of cross-regional watersheds. This model can study the behavioral change process of participants, and modify the strategies of participants in a continuous game to achieve the optimal state.
At present, the design of a cross-regional watershed ecological compensation mechanism is not perfect. Based on the tripartite evolutionary game framework, this paper takes the superior government, the upstream government, and the downstream government as the research object, and dynamically describes the watershed ecological governance interests of the superior government and the upstream and downstream government. We intend to study the constraints required by all parties to jointly manage the watershed ecology, and to analyze the factors influencing the compensation mechanism in terms of sustainability, fairness, and incentives, so as to provide a basis for the formulation of compensation standards and schemes.

2. Materials and Methods

2.1. Study Area

The Yellow River flows through nine provinces and regions: Qinghai, Sichuan, Gansu, Ningxia, Inner Mongolia, Shaanxi, Shanxi, Henan, and Shandong. The development and utilization rate of water resources in the whole basin is as high as 80%, far exceeding the recognized warning line of 40% [56]. According to the bulletin on China’s ecological environment in 2019, the water in the Yellow River Basin is generally slightly polluted. Among the 137 water quality monitoring sections monitored, class I–III water quality sections account for 73.0%, class IV and V water quality sections account for 18.2%, and inferior class V water quality sections account for 8.8% [57]. The discharge of wastewater and waste gas from large industrial cities and the inflow of heavily polluted tributaries are the main reasons for the deterioration of water quality in some sections of the Yellow River Basin. Domestic sewage discharge and agricultural nonpoint source pollution are also important reasons for water pollution in the Yellow River Basin [58,59]. In addition to the problem of water pollution, the disharmony of water and sediment in the Yellow River is also an urgent problem to be solved. The Loess Plateau, located in the middle and upper reaches of the Yellow River, is the most serious area of soil and water loss in China and even in the world. The soil and water loss area of the Loess Plateau accounts for 98% of the total area of soil and water loss in the Yellow River Basin and contributes 97% of the sediment to the Yellow River, which is the root cause of the flooding of the Yellow River [60]. On April 20, 2020, the Ministry of Finance, the Ministry of Ecology Environment, the Ministry of Water Resources, and the National Forestry and Grassland Administration jointly issued a pilot implementation plan for supporting and guiding the establishment of a horizontal ecological compensation mechanism in the whole Yellow River Basin, exploring the establishment of a horizontal ecological compensation scheme. This policy indicates that the central government will provide technical guidance and policy and financial support for the cross-regional horizontal ecological compensation pilot. This paper takes the central government and the upstream and downstream governments of the river basin as the research object, which is in line with the actual situation of the combination of horizontal and vertical ecological compensation mechanisms in the policy.
The Yellow River Basin in Shaanxi Province flows from north to south through the junction of Shaanxi and Shanxi provinces, with a total length of 723.6 km. The basin covers Xi’an, Tongchuan, Baoji, Xianyang, Weinan, Yan’an, Yulin, Shangluo (part), and Yangling Demonstration Area. According to the Bulletin of Soil and Water Conservation in 2019, the total area of soil and water loss in China is 2.7108 million km2, while that in Shaanxi Province is 48,800 km2, accounting for 1.80% of the total area of soil and water loss in China, and 18.47% of the total area of 264,200 km2 of the Yellow River. Eight cities and one district in Shaanxi Province are located in the Yellow River Basin, covering an area of 133,600 km2, of which the area of water and soil loss decreased from 101,000 km2 before the 1980s to 48,800 km2 in 2019; the average amount of yellow mud and sand decreased from 800 million tons to less than 300 million tons. It can be seen that the environment of the Yellow River Basin in Shaanxi Province is very fragile, but if it undertakes important tasks of ecological environment construction and protection more than the upstream and downstream provinces, this could restrict the development of the local economy to a certain extent. The Shanxi–Shaanxi section of the Yellow River flows through the junction of Shaanxi and Shanxi provinces, as shown in Figure 1. In order to explore the tripartite relationship, this paper only takes the relationship between the central government, Shaanxi provincial government, and Henan provincial government as an example to study the construction of an ecological compensation mechanism for the Yellow River Basin. The three parties represent the superior government, the upstream government, and the downstream government of the basin ecological compensation, respectively.

2.2. Stakeholders in the Construction of Ecological Compensation Mechanism in the Yellow River Basin of Shaanxi Province

In the ecological compensation of the Yellow River Basin in Shaanxi Province, Shaanxi provincial government and Henan provincial government, as the upstream and downstream managers of the study area, bear the responsibility for the ecological governance. As the superior government of the upstream and downstream governments of the basin, the central government should not only coordinate the establishment of a horizontal ecological compensation mechanism between the upstream and downstream governments of the basin and supervise the watershed governance of the upstream and downstream governments, but also make financial transfer payments to the key ecological functional areas of the basin. Financial transfer payments in key ecological functional areas of the basin is a fair mechanism to reasonably compensate for restrictions on development in important ecological areas. Therefore, in the ecological management of the Yellow River Basin, the central government is not only the regulator but also the main body of compensation.
The interests of the three governments in river basin governance are different, so the decision-making behaviors of all parties are also different. In the construction of a river basin ecological compensation system, a two-way regulation mechanism of ecological compensation is constructed based on the water quality and quantity of the cross-border section of the river basins of the two provinces. When the upstream government invests in the ecological management of the river basin to improve the water quality and quantity, as the beneficiary, the downstream government should compensate the upstream government; when the upstream government does not protect the ecology of the basin, so that the water quality and quantity of the cross-border section are lower than the standard value, the upstream government should compensate the downstream government. In river basin ecological governance, the central government should not only supervise the upstream and downstream governments to oversee river basin ecological compensation, but also make financial transfer payments to the upstream ecological functional areas of the river basin, and punish the upstream and downstream areas when they fail to engage in river basin protection. At the same time, the supervision of the central government is restricted by the supervision costs, punishment benefits, and overall benefits. The logical relationship of ecological compensation in the Yellow River Basin of Shaanxi Province is shown in Figure 2.

3. Model Construction and Analysis

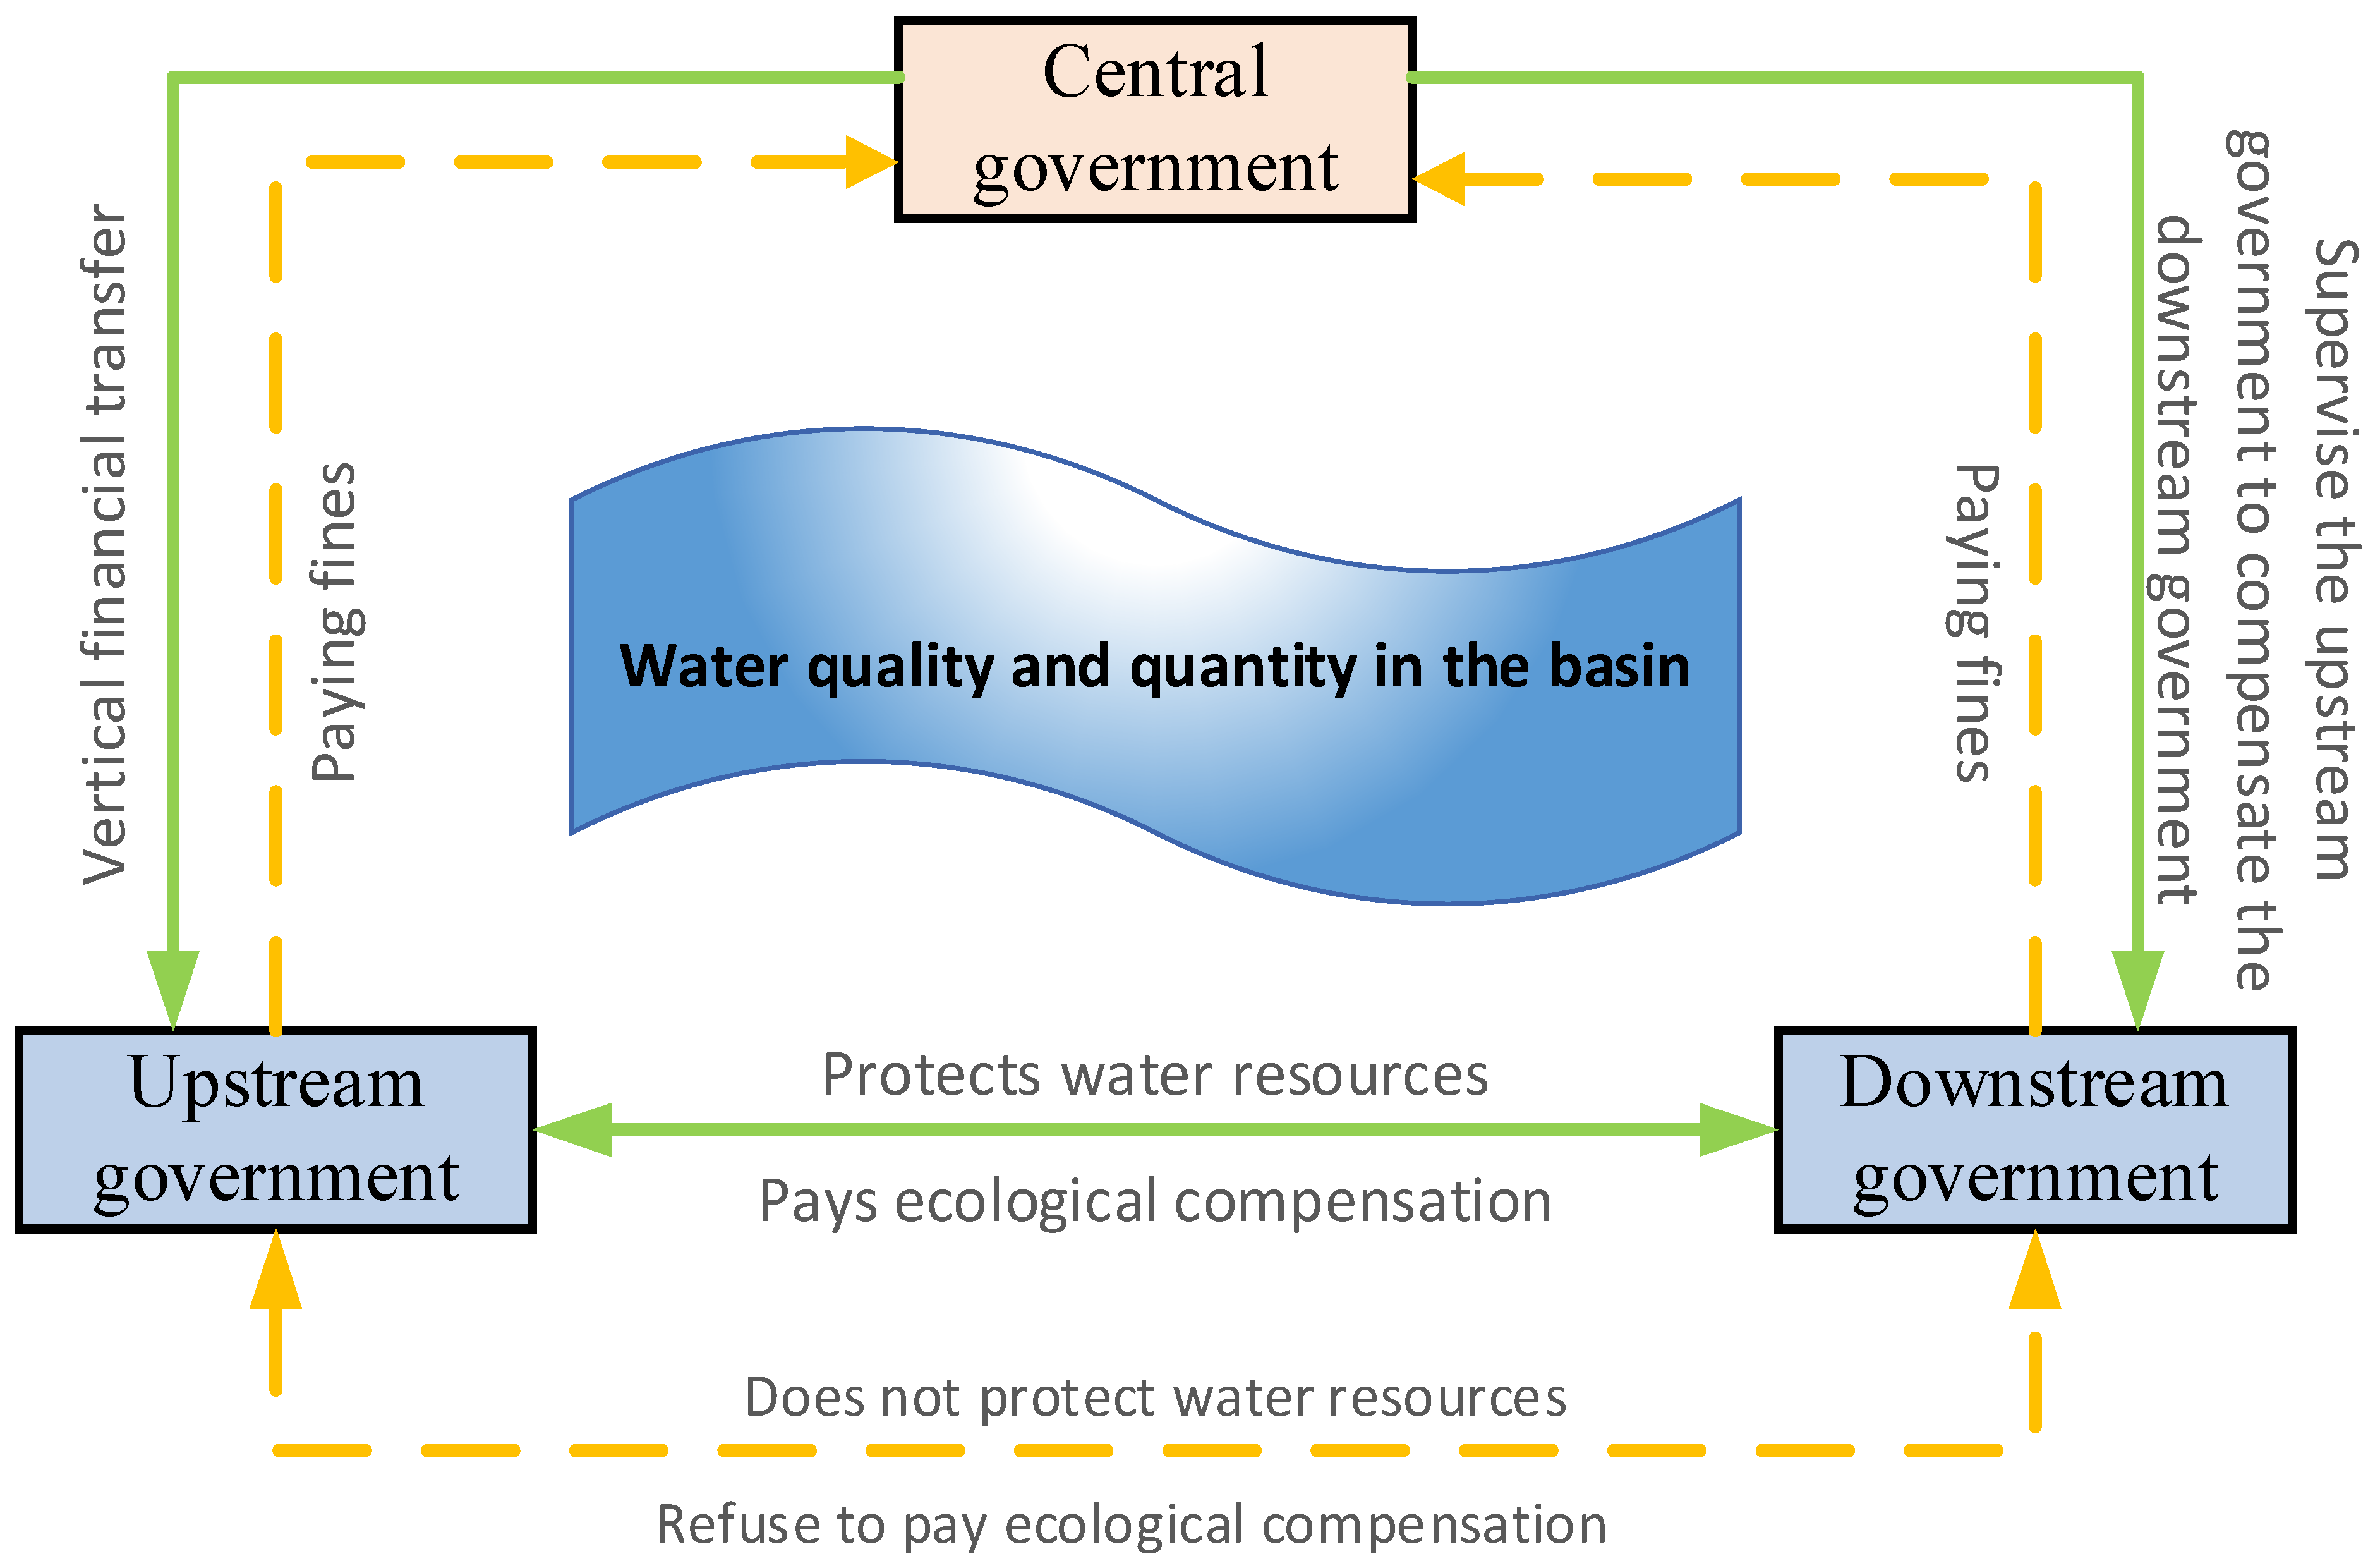
3.1. Construction of Evolutionary Game Model

3.1.1. Model Assumptions

The players of ecological compensation in the Shaanxi Henan section of the Yellow River Basin include the upstream government of Shaanxi Province, the downstream government of Henan Province, and the central government. In river basin ecological compensation, each game subject with limited rationality will make decisions to maximize their own interests according to the specific contents of a river basin ecological compensation agreement. In order to analyze the stability of strategies and equilibrium points of all parties, the following assumptions are made:
Hypothesis 1.
The upstream Shaanxi provincial government, the downstream Henan provincial government, and the central government are limited rational participants; the information between them is not completely equal, so they may not be able to determine their own optimal strategy in one game, but determine the most favorable strategy through multiple games.
Hypothesis 2.
The strategy space of the upstream governments of the basin is to protect the basin ecology or not to protect the basin ecology, and the probabilities of the two strategies are x and 1 – x, respectively, x ∈ [0, 1]; the strategy space of the government in the lower reaches of the basin is to participate in the ecological cogovernance of the basin or not to participate in the ecological cogovernance of the basin, and the probability of the government in the lower reaches of the basin choosing the two strategies is y and 1 – y, y∈ [0, 1], respectively; the strategy space of the central government is regulatory and nonregulatory, and the probability of the central government choosing the two strategies is z and 1 – z, z∈ [0, 1], respectively.
Hypothesis 3.
In reality, in addition to the protection funds directly invested in river basin protection, the upstream areas often restrict industrial development due to the protection of water sources; therefore, these two variables are considered separately.When the upstream government of the basin chooses an ecological protection strategy to improve the water quality and quantity of the basin, the development opportunity cost is C0 and the ecological protection cost is C1. At the same time, it needs to pay for the management and transaction costs C2 of the joint prevention and cogovernance of the ecological environment and ecological compensation mechanism, so the ecological benefit is M1. When choosing the strategy of not protecting the watershed ecology, there is no need to pay the cost of ecological protection, but when the central government is involved in the regulatory strategy and the downstream government participates in the cogovernance of the watershed, it should pay compensation E2 to the downstream. In the construction of a realistic ecological compensation program, the ecological benefits obtained by the upstream government through protecting the watershed ecology are far lower than the direct protection costs and sacrificial development opportunity costs, resulting in the upstream government refusing to protect the watershed ecology. Referring to this situation, this paper assumes that the ecological benefits in the upstream of the watershed are lower than the protection costs invested.
Hypothesis 4.
The ecological benefit obtained by the downstream government of the basin when the upstream government chooses to protect the basin ecology is M2, and the downstream government does not obtain ecological benefits when the upstream government chooses not to protect the basin ecology strategy. When the downstream government chooses to participate in the watershed cogovernance strategy, if the upstream government chooses to protect the watershed ecology strategy, the downstream government will pay ecological compensation E1 to the upstream government, At the same time, it needs to pay the management and transaction cost C3 of ecological environment joint prevention and cogovernance and ecological compensation mechanism. When the downstream government chooses not to participate in the basin cogovernance strategy, there is no need to compensate and invest in the cogovernance cost. By default, in this case, the upstream government does not need to compensate the downstream government if the upstream does not protect the basin ecology. In order to conform to the river basin protection principle of “who pollutes, who protects, who benefits, who compensates” in the actual situation, the two-way ecological compensation between the upstream government and the downstream government of the river basin is designed based on the above assumptions.
Hypothesis 5.
When the central government chooses the supervision strategy, the supervision cost of the watershed environment is B. Under the supervision of the central government, if the upstream government of the basin chooses the strategy of protecting the basin ecology, the vertical financial transfer to the upstream government of the basin is A. If the upstream or downstream government fails to fulfill the obligation of basin ecological protection, the upper government will punish the upstream and downstream governments by H1 and H2, respectively. When the upstream government chooses not to protect the ecological environment of the basin, the water quality and quantity of the basin decline, and the amount spent by the central government to repair the ecological environment of the basin is D; when the government in the upper reaches of the basin carries out the ecological protection of the basin, the ecological environment of the basin is improved, and the ecological benefits brought to the superior government are M. If the central government chooses the supervision strategy at the same time, the credibility of the central government is improved and the social benefits brought to the superior government are V due to the remarkable effect of supervising the ecological governance of the basin. When the central government chooses the nonsupervision strategy, it will not reward or punish the upstream and downstream governments. If the upstream government chooses not to protect the watershed ecology with this strategy, resulting in the deterioration of the watershed ecological environment and the decline in people’s living environment, it will bring about a negative social effect for the central government, which is T.

3.1.2. Benefits of Each Subject in Evolutionary Game

According to the assumed model parameters and game relationship, the income matrix of the three subjects of watershed ecological compensation under different strategy combinations is determined, as shown in Table 1.

3.2. Evolutionary Model Analysis

The upstream and downstream governments and the central government of the basin interact with and restrict each other. In order to obtain the maximum expected return, they constantly adjust their strategies. By establishing a dynamic equation of tripartite evolutionary game replication, the formation process of stability strategies of all parties is analyzed. Based on the stability theory of differential equations, the stability of the strategies of the upstream and downstream governments and the central government are analyzed. F(x), F(y), and F(z) represent the dynamic strategy adjustment mechanism of upstream government, downstream government, and central government, respectively, expressed as equations. According to the Lyapunov stability theory, if a strategy adopted by the three-party game subject is stable, the probability x, y, and z of the upstream government, downstream government, and central government of the basin choosing the strategy meet the following requirements:
F ( x ) = 0 , d ( F ( x ) ) d x < 0 ;   F ( y ) = 0 , d ( F ( y ) ) d y < 0 ; F ( z ) = 0 , d ( F ( z ) ) d z < 0 .

3.2.1. Three-Party Evolutionary Game Subject Replication Dynamic Equation

According to the three-party evolutionary game matrix in Table 1, the expected return U11 of the upstream government choosing to actively respond to the watershed ecological protection strategy, the expected return U12 of choosing to negatively respond to the watershed ecological protection strategy, and the average expected return U ¯ 1 are, respectively:
U 11 = y z [ M 1 C 0 C 1 C 2 + E 1 + A ] + y ( 1 z ) [ M 1 C 0 C 1 C 2 + E 1 ] + ( 1 y ) z [ M 1 C 0 C 1 C 2 + A ] + ( 1 y ) ( 1 z ) [ M 1 C 0 C 1 C 2 ] = y E 1 + z A + M 1 C 0 C 1 C 2  
U 12 = y z [ H 1 E 2 ] + y ( 1 z ) [ 0 ] + ( 1 y ) z [ H 1 ] + ( 1 y ) ( 1 z ) [ 0 ] = z H 1 y z E 2    
U ¯ 1 = x U 11 + ( 1 x ) U 12 = x y E 1 + x y z E 2 y z E 2 + x z A + x M 1 x C 0 x C 1 x C 2 z H 1 + x z H 1 .
Therefore, the replication dynamic equation of government strategy selection in the upper reaches of the basin can be obtained as follows:
F ( x ) = d x d t = x ( U 11 U ¯ 1 ) = x ( 1 x )   [ y E 1 y z E 2 + z A + M 1 C 0 C 1 C 2 + z H 1 ] .
The expected return U21 of the downstream government participating in the basin cogovernance and the expected return U22 not participating in the basin cogovernance, and the average expected return U ¯ 2 are, respectively:
U 21 = x z [ M 2 E 1 C 3 ] + x ( 1 z ) [ M 2 E 1 C 3 ] + ( 1 x ) z [ C 3 + E 2 ] + ( 1 x ) ( 1 z ) [ C 3 ] = x M 2 x E 1 C 3 + z E 2 x z E 2  
U 22 = x z [ M 2 H 2 ] + x ( 1 z ) [ M 2 ] + ( 1 x ) z [ H 2 ] + ( 1 x ) ( 1 z ) [ 0   ] = z H 2 + x M 2  
U ¯ 2 = y U 21 + ( 1 y ) U 22 = x M 2 z H 2 + y z H 2 x y E 1 y C 3 + y z E 2 x y z E 2 .
Therefore, the replication dynamic equation of government strategy selection in the lower reaches of the basin can be obtained as follows:
F ( y ) = d y d t = y ( U 21 U ¯ 2 ) = y ( 1 y )   [ x E 1 + z E 2 x z E 2 C 3 + z H 2 ] .
The expected return U31 under supervision of the central government, the expected return U32 without supervision, and the average return U ¯ 3 are, respectively:
U 31 = x y [ B A + V + M ] + x ( 1 y ) [ B + V + H 2 A + M ] + ( 1 x ) y [ B D + H 1 ] + ( 1 x ) ( 1 y ) [ B D + H 1 + H 2 ] = x V x A + x M B D + H 1 + H 2 + x D x H 1 y H 2  
U 32 = x y [ M ] + x ( 1 y ) [ M ] + ( 1 x ) y [ D T ] + ( 1 x ) ( 1 y ) [ D T ] = x M D T + x D + x T  
U ¯ 3 = z U 31 + ( 1 z ) U 32 = x z V x z A z B + z H 1 + z H 2 x z H 1 y z H 2 + x M D T + x D + x T + z T x z T .
Thus, the replication dynamic equation of the central government’s strategy selection can be obtained as follows:
F ( z ) = d z d t = z ( U 31 U ¯ 3 ) = z ( 1 z )   [ x A + x V B + H 1 + H 2 x H 1 y H 2 + T x T ] .

3.2.2. Stability Analysis of Equilibrium Point of Tripartite Evolutionary Game System

From F ( x ) = 0 , F ( y ) = 0 , F ( z ) = 0 , eight system equilibrium points can be obtained. The Jacobian matrix of the three-party evolutionary game system is as follows:
[ ( 1 2 x ) [ y E 1 y z E 2 + z A + M 1 C 0 C 1 C 2 + z H 1 ] ( x x 2 ) [ E 1 z E 2 ] ( x x 2 ) [ y E 2 + A + H 1 ] ( y y 2 ) [ E 1 z E 2 ] ( 1 2 y ) [ x E 1 + z E 2 x z E 2 C 3 + z H 2 ] ( y y 2 ) [ E 2 x E 2 + H 2 ] ( z z 2 ) [ A + V H 1 T ] ( z z 2 ) [ H 2 ] ( 1 2 z ) [ x A + x V B + H 1 + H 2 x H 1 y H 2 + T x T ] ]
The equilibrium points and eigenvalues (eigenvalue means that A is an n-order square matrix; if there is a number m and a non-zero n-dimensional column vector x, so that Ax = mx holds, then m is an eigenvalue of A) in the tripartite evolutionary game system are obtained, as shown in Table 2.
The Lyapunov system stability theory [61] judges the stability of the system through the positive and negative eigenvalues of the Jacobian matrix—that is, when all eigenvalues of the Jacobian matrix have negative real parts, the equilibrium point is at the asymptotic stability point; when the eigenvalues of Jacobian matrix are less than or equal to zero, and the eigenvalues equal to 0 have no multiple roots, the equilibrium point is in a critical stable state; and when any eigenvalue of Jacobian matrix has a positive real part or an eigenvalue equal to 0 has multiple roots, the equilibrium point is in an unstable state.
One of the eigenvalues of P3 (0,1,0) λ2 is C3, which is a positive value. λ1, one of the characteristic values of P5 (1,0,0), is also positive according to Hypothesis 3: “the ecological benefit stipulated in this paper is lower than the input cost.” One of the eigenvalues of P7 (1,1,0) λ2 is E1+C3 is also a positive value. According to the Lyapunov stability theorem [61], these three points are unstable equilibrium points, and the other five points can be judged by adding other constraint condition. This paper aims to study the ecological compensation scheme to promote the coordinated governance of river basins by governments at all levels. P7 (1,1,0) is an unstable equilibrium point, indicating that the upstream and downstream governments cannot consciously fulfill the obligations of river basin ecological protection, so only the conditions of P8 equilibrium point are considered. P8 (1,1,1) is the best case of watershed ecological compensation construction. It represents the upstream government to protect the watershed ecology, the downstream government to participate in CO governance, and the central government to supervise the watershed protection. In order to make the three-party subject strategy of evolutionary game stable at P8 (1,1,1) equilibrium point, all eigenvalues should be less than zero, so the constraint condition of { M 1 + C 0 + C 1 + C 2 E 1 + E 2 A H 1 < 0 E 1 + C 3 H 2 < 0 A V + B < 0   ( 1 ) must be satisfied. Under this constraint, P4 (0,1,1), P6 (1,0,1), and P2 (0,0,1) are in an unstable state, and P1 (0,0,0) may be in a stable state, indicating that the stable point is not unique under the assumption and the above constraint condition, which indicates that the initial intention of the three game players for collaborative watershed governance will have an impact on the final decisions of the three players.

4. Simulation Analysis

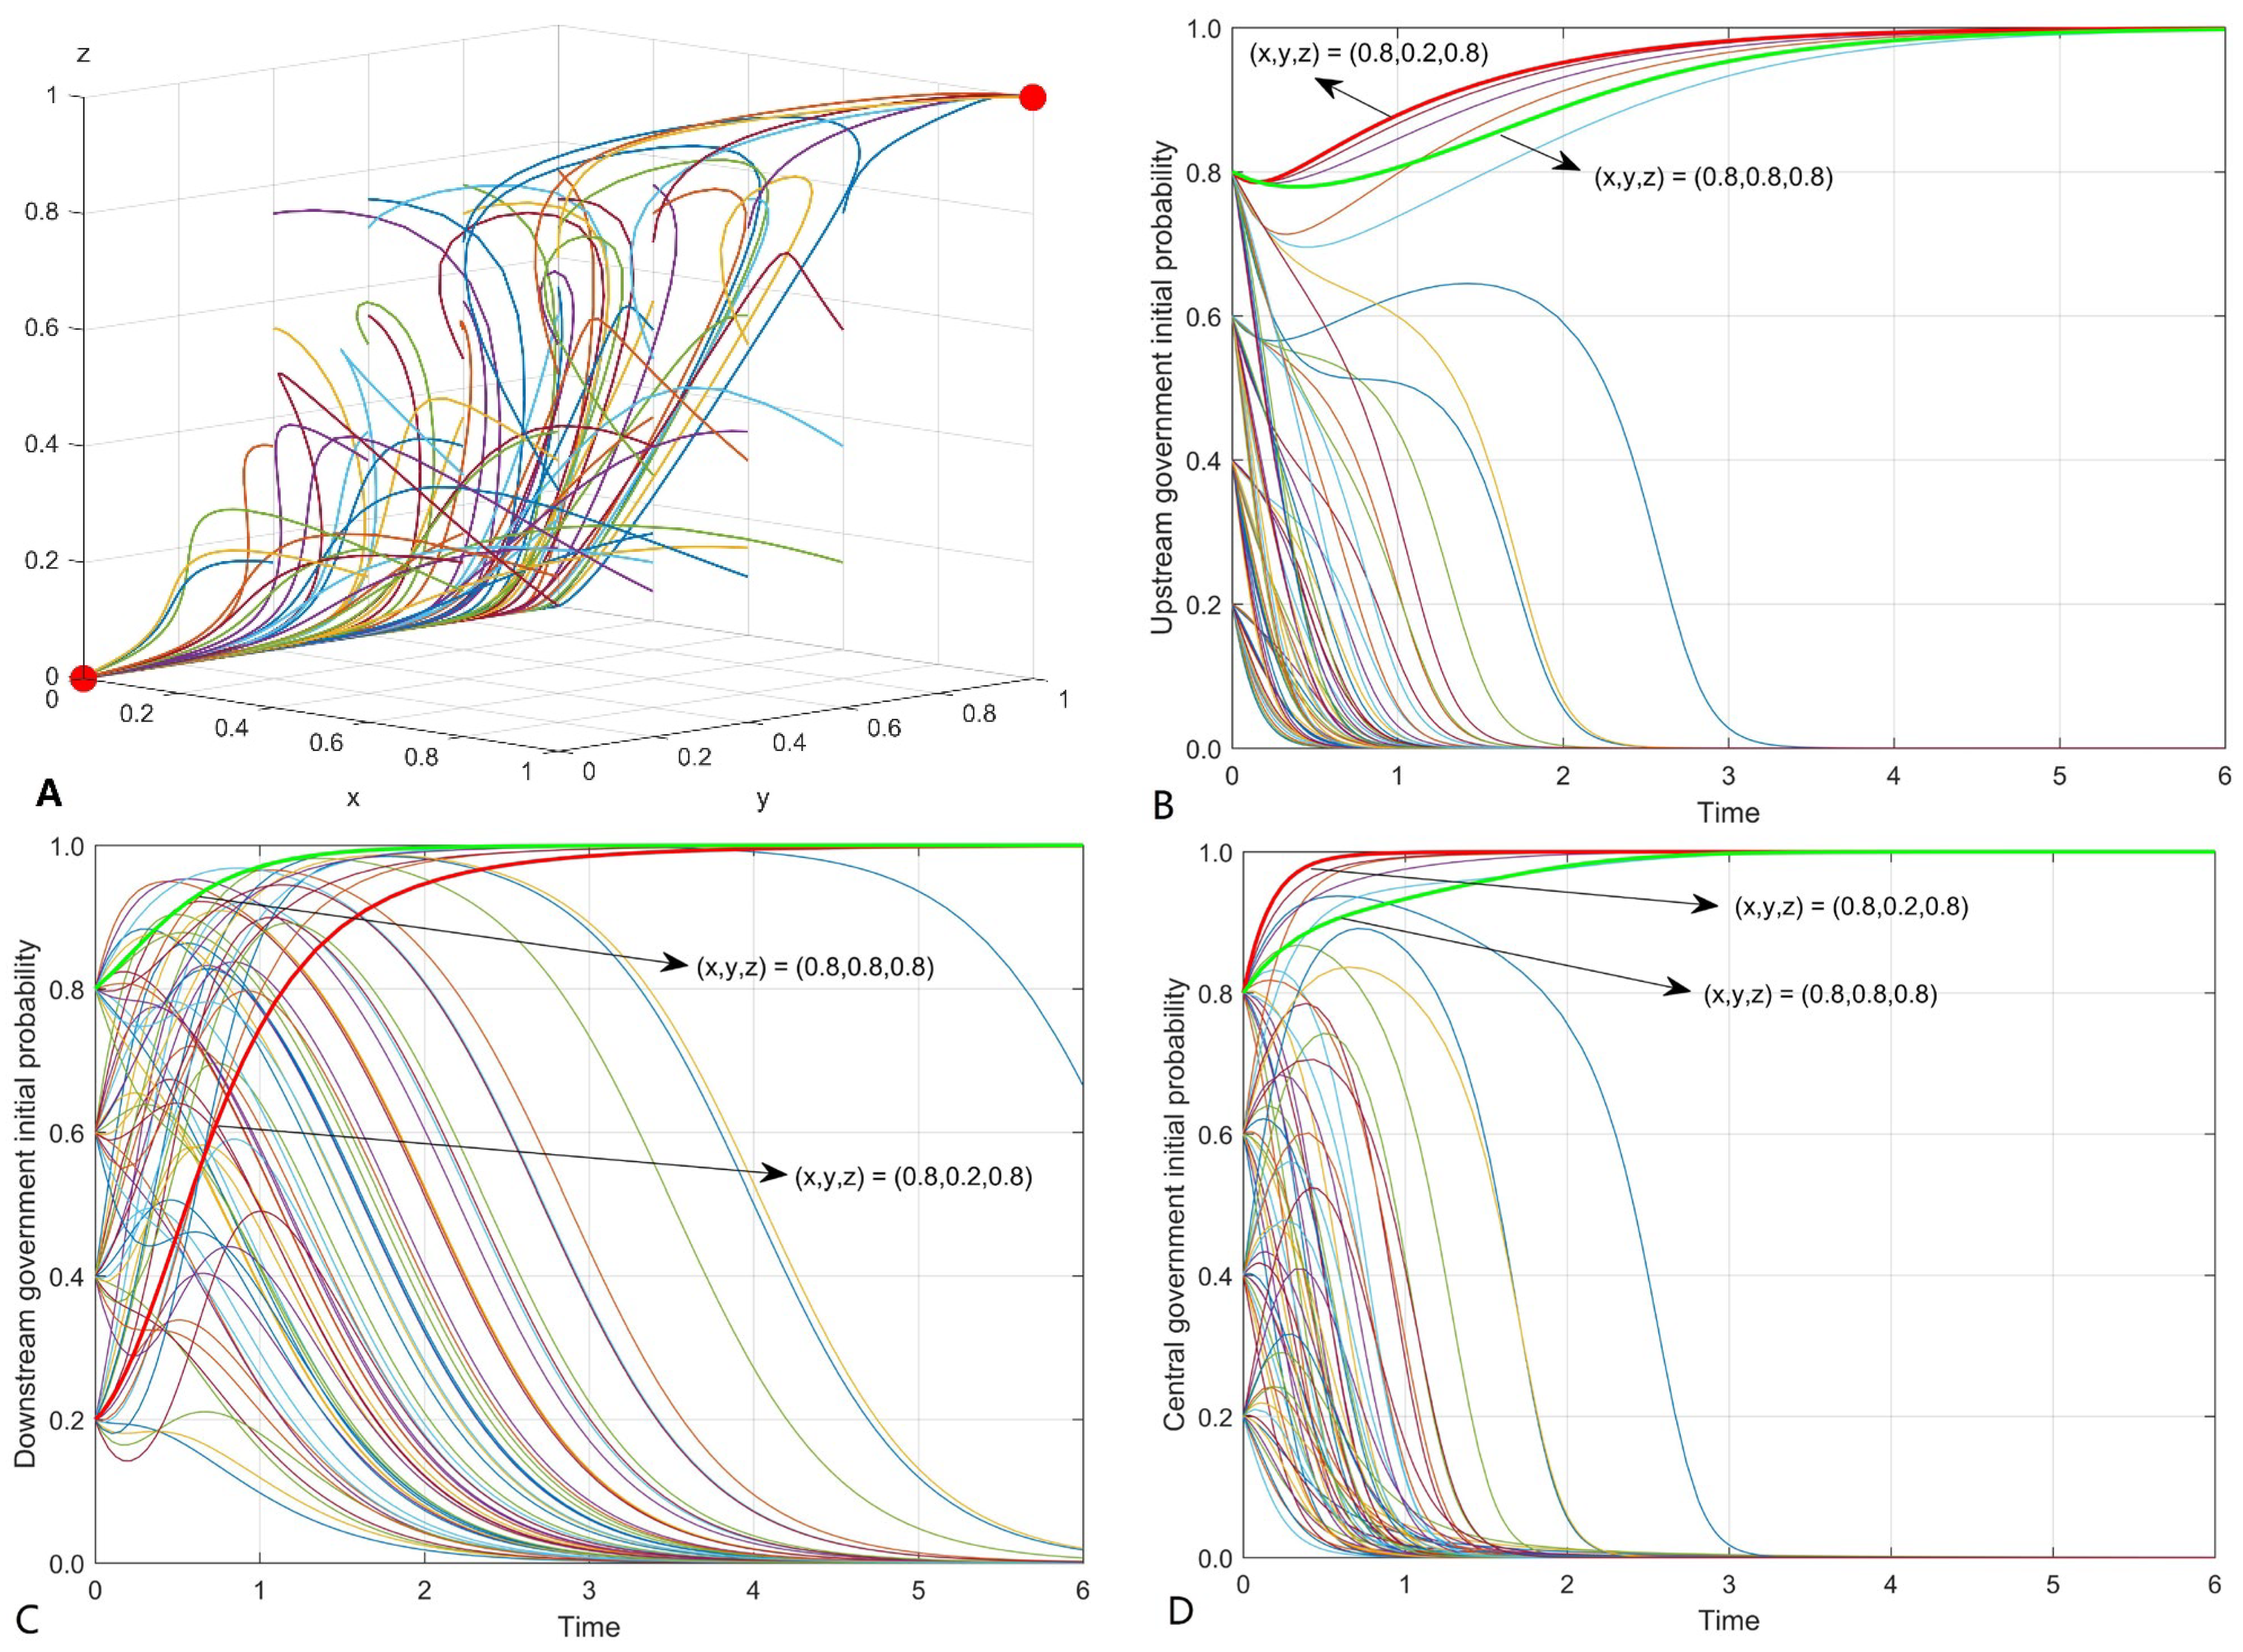
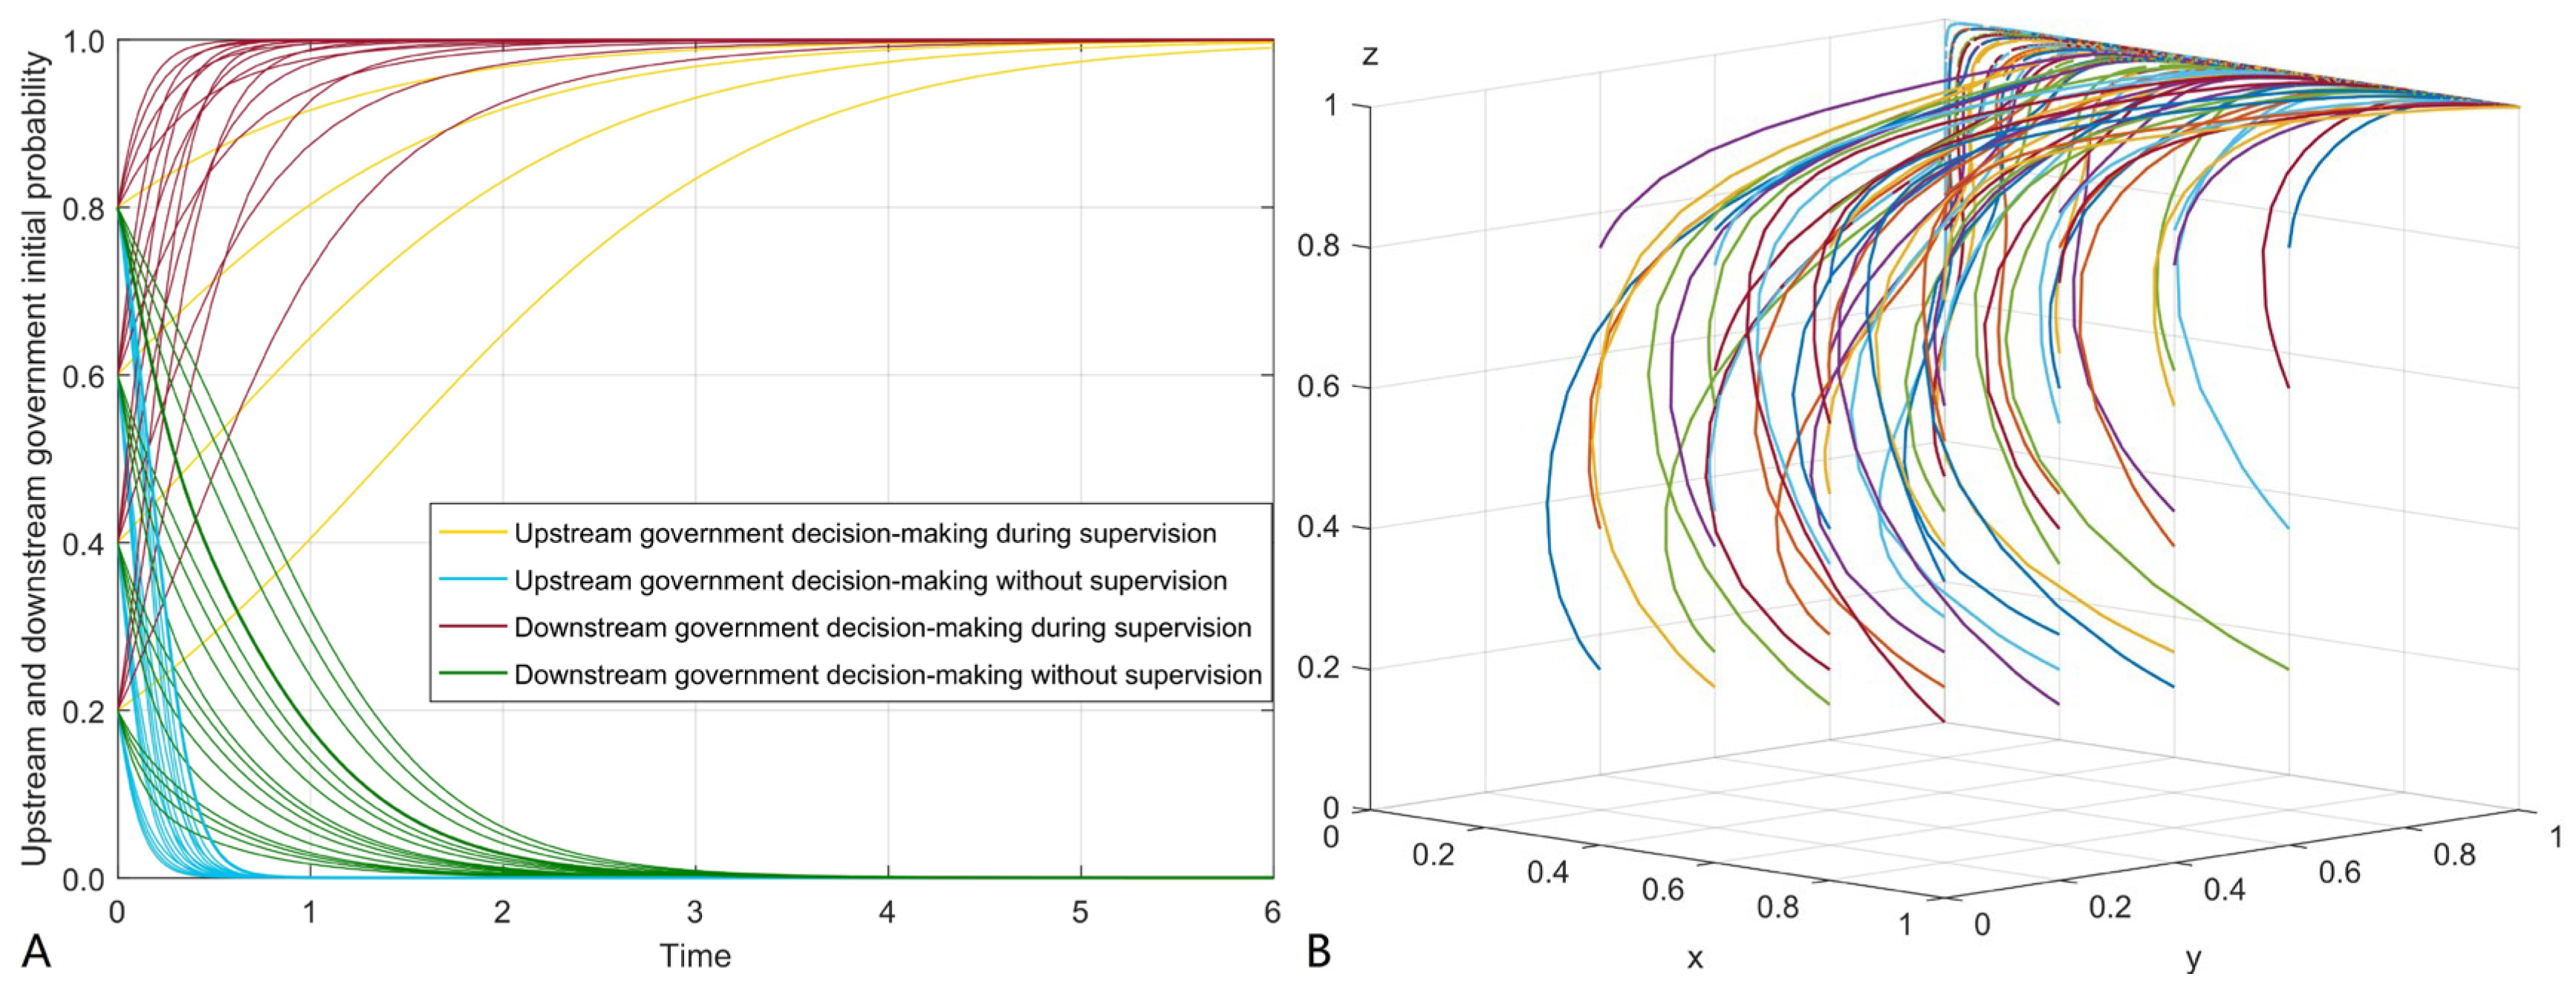
4.1. Influence of Initial Probability on Replication Dynamic System

By simulating the decision-making process of the upstream and downstream of the basin and the central government under different initial probabilities, this paper analyzes the impact of different initial probabilities of the three parties participating in the game on the final decision making and replication dynamic system of the three parties, and studies the influencing factors of eliminating the hybrid strategy. The proposed parameter set meeting the constraint condition (1) is shown in Table 3. The simulation sets with the upstream government strategy selection probability x, the downstream government strategy selection probability y, and the central government strategy selection probability z have four initial values, which are 0.2, 0.4, 0.6, and 0.8, respectively. The initial probability of this tripartite game player passes 4 × 4 × 4 permutation and combination, so a total of 64 initial probability combinations can be obtained. Firstly, the influence of different initial probabilities on the stability strategy of the system under constraint condition (1) is simulated and analyzed. Secondly, the influence of different initial probabilities of upstream government, downstream government, and central government on their respective decisions is simulated and analyzed. The results of simulation analysis are shown in Figure 3A–D.
It can be seen from Figure 3A that the stability strategy of the system under constraint condition includes two cases: three game subjects jointly participate in watershed ecological compensation (1,1,1) and none participate in watershed ecological compensation (0,0,0), which is consistent with the results of equilibrium point stability analysis above. Figure 3B,D shows that when the initial probability of upstream government and central government is high enough, some decision curves finally tend to 1; in Figure 3C, under different initial probabilities, some decision curves of downstream governments tend to 1. Therefore, it can be inferred that the initial probability of the upstream government and the central government has a great impact on their final decision, and the impact of the initial probability of the downstream government on their final decision can be ignored. It can be seen from the bold decision-making curve in Figure 3B–D that the decision-making curve of the central government and the upstream and downstream governments of the river basin finally tends to 1—that is, the upstream government and the central government tend to participate in the river basin ecological compensation only when their initial willingness to participate in the river basin ecological compensation is high. If the initial value of strategy selection probability representing the initial will of the upstream government or the central government is not large enough, the final decision will tend not to participate in the basin ecological compensation. Comparing the time when the decisions of the three game players reach the final stable state in Figure 3B–D, it can be seen that the time when the decisions of the central government reach the stable state is the shortest, followed by the upstream government, and the time when the decisions of the downstream government reach the stable state is the longest. The above inference shows that the initial probability will affect the final decision of the central government and the upstream government of the basin, and the final decision of the central government will affect the final decision of the upstream and downstream governments.
It can be seen from Figure 4A that when the central government selects the supervision strategy, the decision-making process curve of upstream and downstream governments with different initial willingness to cooperate will tend to 1—that is, participating in watershed ecological compensation; when the central government chooses the nonregulatory strategy, the decision-making process curve of upstream and downstream governments with different initial willingness to cooperate will tend to 0—that is, they will not participate in watershed ecological compensation. It can be inferred that under the parameter set satisfying the constraint condition (1), when the central government does not supervise the river basin ecological compensation, the upstream and downstream governments cannot consciously implement the river basin ecological compensation measures regardless of the initial willingness to engage in ecological compensation cooperation; however, when the central government supervises the basin ecological compensation, regardless of the initial willingness of the upstream and downstream governments to cooperate in ecological compensation, they will eventually choose to participate. From the above inference, it can be seen that if the central government under different initial probabilities can reach the stable state of supervision, the impact of different initial probabilities on system stability can be eliminated. What the central government can subjectively adjust in the ecological compensation scheme is the punishment and supervision costs for the upstream and downstream governments when they fail to perform their obligations. Combined with the eigenvalue of P1 equilibrium point and Lyapunov system stability theory, when the sum of the punishment benefits of the central government and the negative social value brought by the ecological deterioration of the river basin without supervision is greater than the supervision cost, the final stable state of the central government must tend to the supervision strategy. At this time, the constraint condition is { M 1 + C 0 + C 1 + C 2 E 1 + E 2 A H 1 < 0 E 1 + C 3 H 2 < 0 A V + B < 0 B + H 1 + H 2 + T > 0   ( 2 ) ; a simulation analysis of the impact of different initial probabilities on the stability of replication dynamic system under constraint (2), and the parameter set satisfying constraint (2), is shown in Table 4. Table 4 adjusts the punishment intensity and supervision cost of the central government compared with Table 3. The results of the simulation analysis are shown in Figure 4B. It can be seen from Figure 4B that under the parameter set in Table 4, P8 (1,1,1) is the only stable equilibrium point. The simulation analysis is consistent with the above inference, which is effective and has practical significance for the formulation of a watershed ecological compensation scheme.

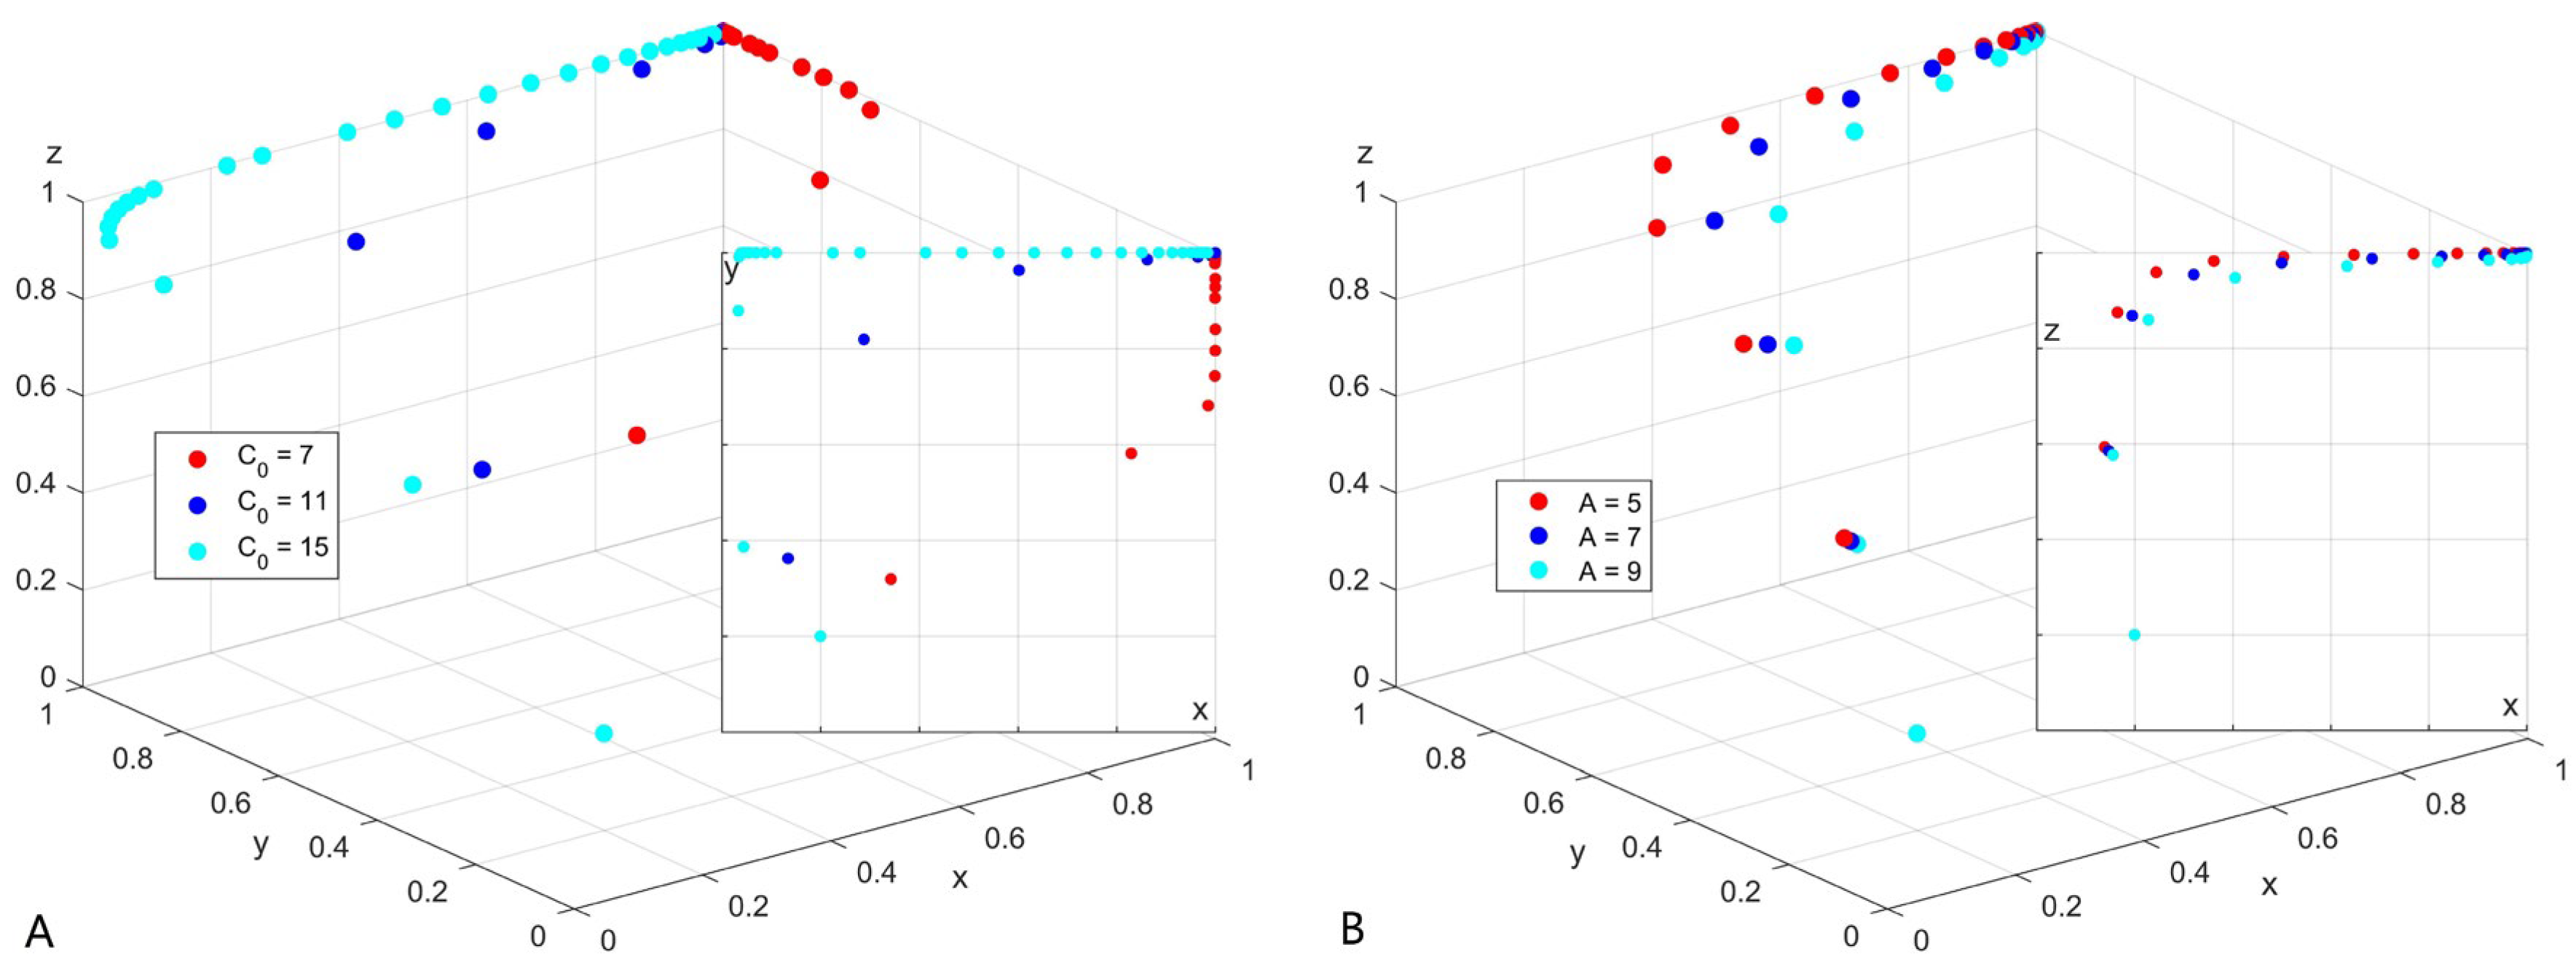
4.2. Sensitivity Analysis of Key Elements

In the replication dynamic system, each key element will have an impact on the evolutionary game process and evolutionary results of the central government and the upstream and downstream governments of the basin. The final system stability strategy (1,1,1) under constraint (2) conforms to the original intention of the formulation of the watershed ecological compensation scheme. Therefore, the parameter set meeting constraint (2) is selected for the sensitivity analysis of key elements, and the initial probability of each game subject is 0.2. In the practice of watershed ecological governance, the ecological benefit to the upstream government is usually directly proportional to the direct protection cost of the watershed ecology invested by the upstream government, but the development opportunity cost paid for watershed protection varies from place to place, and with the long-term progress of watershed protection, the development opportunity sacrificed is not invariable. The two-way ecological compensation standard of the upstream and downstream governments is the top priority in the formulation of an ecological compensation scheme, and is also an important factor affecting the decision making of the upstream and downstream governments. Section 4.1 analyzes the central government’s supervision in the watershed ecology, and the vertical financial transfer to the upstream region is an important consideration in the formulation of the watershed ecological compensation scheme. Therefore, the upstream development opportunity cost, the amount of ecological compensation, the punishment of the central government, and the vertical financial transfer are key elements in the simulation for the sensitivity analysis.

4.2.1. Sensitivity Analysis of Opportunity Cost of Development in the Upper Reaches of the Basin

In order to analyze the impact of the upstream government sacrificing development opportunity cost on the stability of the replication dynamic system, taking C0 as 7, 11, and 15, respectively, under the condition of meeting the constraint condition (2), it represents the three situations of low, medium, and high sacrificing development opportunity cost of the upstream government. The other influencing factors are shown in Table 4. The t of the replication dynamic system is set to 6 and the step size is 0.3 (that is, the time interval of each point in the figure is 0.3), and there are 20 points in each replication dynamic curve. (The steps in the later content of this article represent the time interval of each point on the curve in the figure.) The simulation results are shown in Figure 5A.
It can be seen from Figure 5A that under the three conditions of low, medium, and high development opportunity cost, the time t for the decision making of the upstream government to reach the stable state is 1.2, 2, and 10, respectively, and the change in the time for the central government and the downstream government to reach the stable state under these three conditions is very small and can be ignored.
It can be inferred that the greater the cost of upstream governments sacrificing development opportunities, the longer it takes to reach a stable state; comparing the decision-making curves of the three cases of low, medium, and high cost of sacrificing development opportunities, it can be seen that the willingness of the upstream government to protect the watershed ecology will continue to decrease with the increase in sacrificing development opportunity cost. When the sacrificing development opportunity cost is too large, resulting in the expenditure of the upstream for protecting the watershed ecology exceeding the sum of the benefits, compensation, and punishment of protecting the watershed ecology, the upstream government, under bounded rationality, tends to consider its own interests and will refuse to protect the watershed ecology.

4.2.2. Sensitivity Analysis of Vertical Fiscal Transfer of Central Government

Vertical fiscal transfer is the compensation given by the central government to the protectors whose development is limited by the governance of the watershed ecology. In order to analyze the impact of the central government’s vertical fiscal transfer on the stability of the replication dynamic system, A is set to 5, 7, and 9, respectively, to represent the three cases of low, medium, and high vertical fiscal transfer. The other influencing factors are shown in Table 4. T of the replication dynamic system is set to 6 and the step size is 0.1. The results of the simulation analysis are shown in Figure 5B.
As can be seen from Figure 5B, in the three cases of low, medium, and high vertical fiscal transfer, the time t for the upstream government decision to reach the stable state is 1.6, 1.3, and 1.0, respectively, and the time t for the downstream government decision to reach the stable state is about 0.9. This change is very small and can be ignored. The time t for the central government to reach the stable state is 0.8, 1.0, and 2.0, respectively.
It can be seen from the above data that the strategic choices of the upstream government and the central government are directly affected by the factors of vertical financial transfer, and the sensitivity of the upstream government to the changes of vertical financial transfer is relatively stable. When the amount of vertical financial transfer is too high, the sensitivity of the central government to this influencing factor will increase significantly.

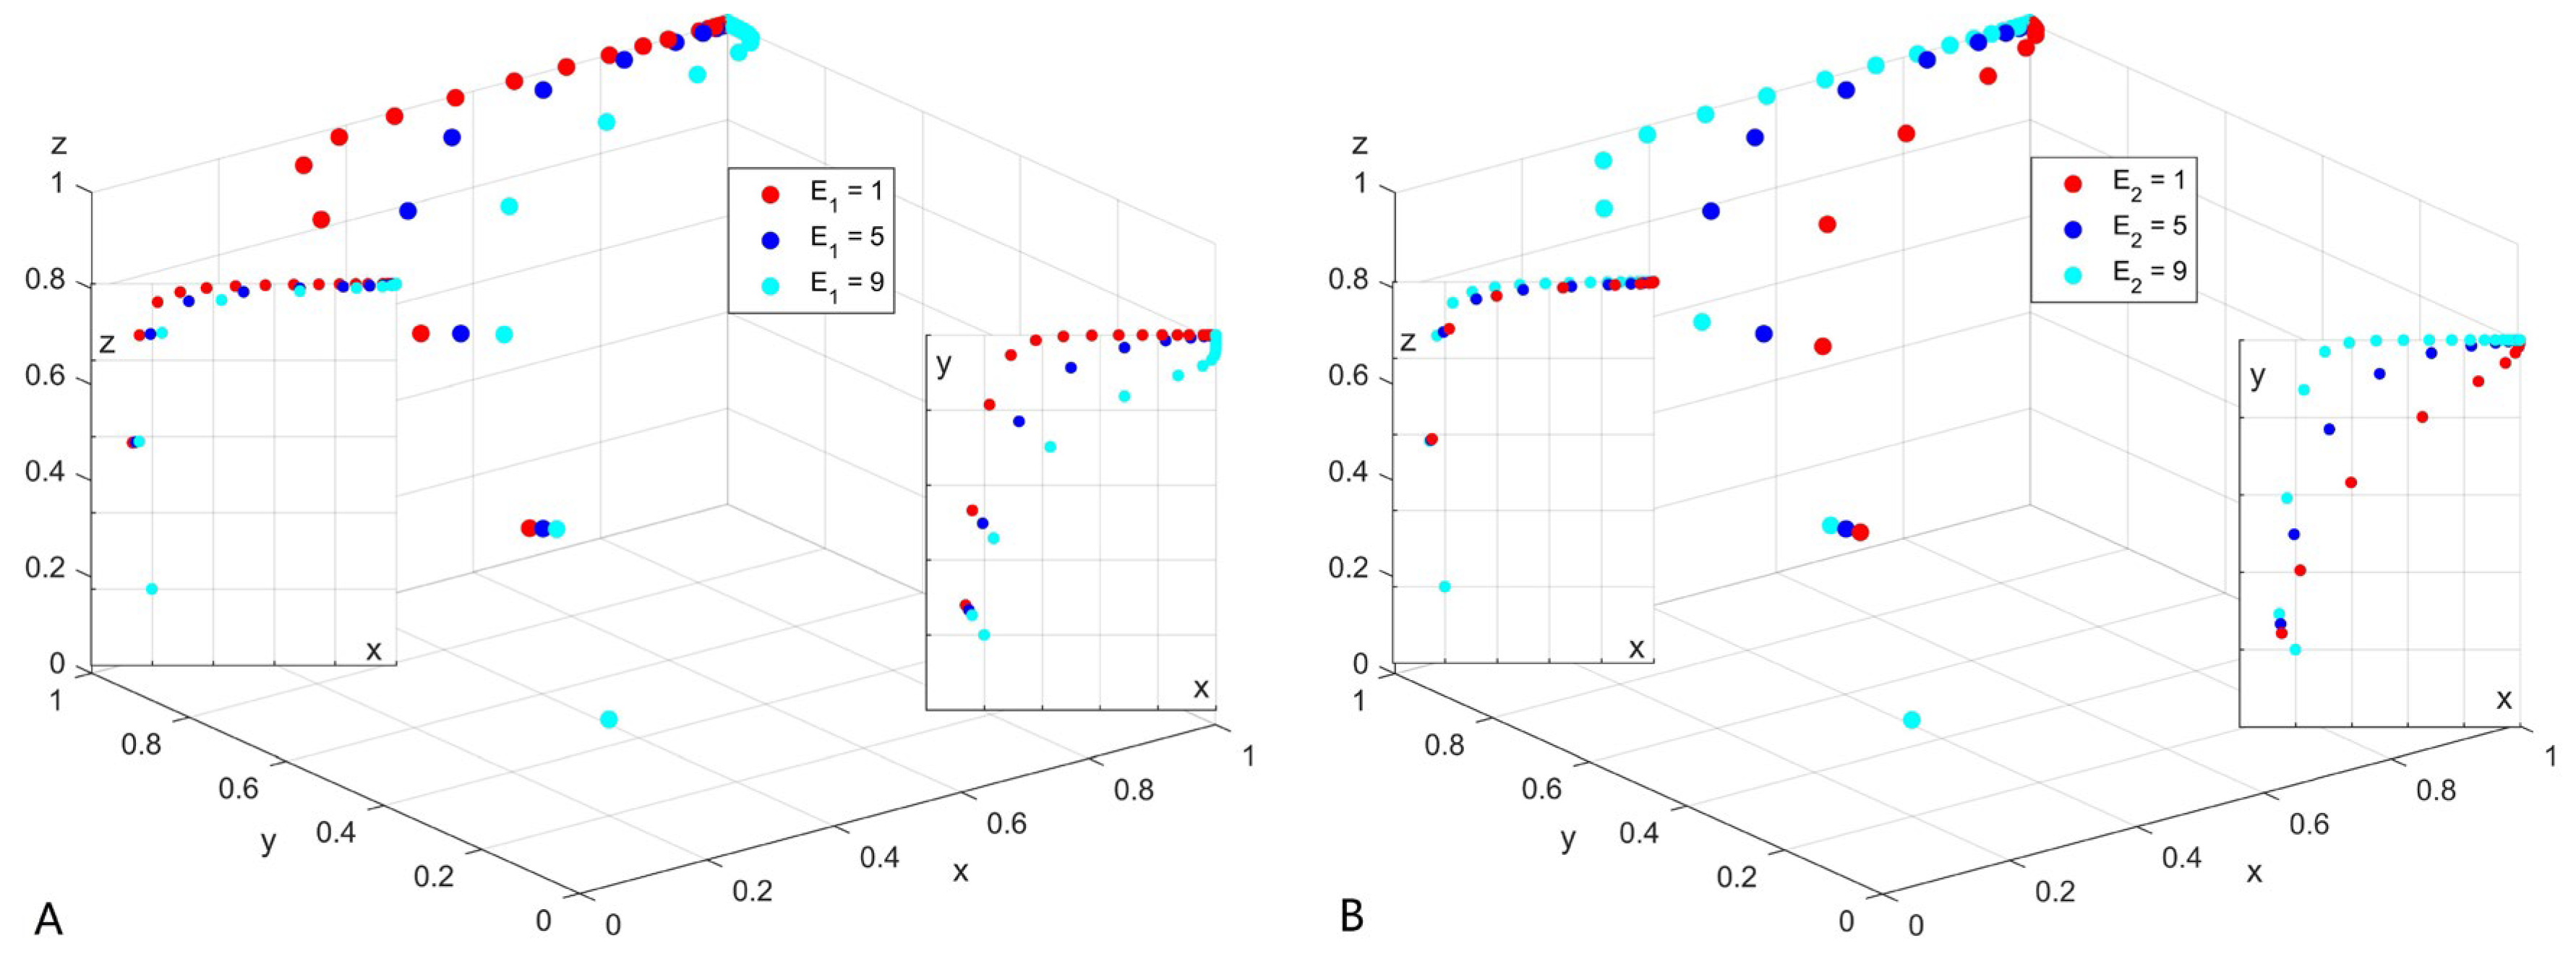
4.2.3. Sensitivity Analysis of Ecological Compensation

Ecological compensation is a way for the upstream and downstream governments of the basin to solve the positive and negative externalities of the basin’s ecological governance. In order to analyze the impact of the payment of ecological compensation by the downstream government to the upstream government on the stability of the replication dynamic system, E1 is set to 1, 5, and 9, respectively, to represent the low, medium, and high ecological compensation paid by the downstream government to the upstream government. The other influencing factors are shown in Table 4. The t of the replication dynamic system is set to 6 and the step size is 0.1. The results of the simulation analysis are shown in Figure 6A; in order to analyze the impact of the upstream government paying downstream government ecological compensation on the stability of replication dynamic system, E2 is set to 1, 5, and 9, respectively, to represent the three situations of low, medium and high ecological compensation paid by the upstream government to the downstream government. The other influencing factors are shown in Table 4; the t of the replication dynamic system is set to 6 and the step size is 0.1. The results of the simulation analysis are shown in Figure 6B.
It can be seen from Figure 6A that in the three cases of low, medium, and high ecological compensation paid by the downstream government to the upstream government, the time t for the upstream government’s decision to reach the stable state is 2.3, 1.2, and 0.9, respectively; the time t for the downstream government’s decision to reach the stable state is 0.7, 1.0, and 2.3, respectively, and the time for the central government to reach the stable state is about 0.9 in these three cases, so the change is negligible. It can be seen from Figure 6B that in the three cases where the upstream government pays the downstream government ecological compensation that is low, medium, and high, the time t for the upstream government’s decision to reach the stable state is 0.9, 1.3, and 2.2, respectively, and the time t for the downstream government’s decision to reach the stable state is 1.1, 0.9, and 0.7, respectively. In these three cases, the time for the central government to reach the stable state is about 1.0; the change is very small and can be ignored.
It can be inferred from the above data that both E1 and E2 of ecological compensation have a direct and non-negligible impact on the strategic choice of upstream and downstream governments. Comparing the sensitivity of upstream and downstream governments to the two kinds of ecological compensation, it can be seen that the sensitivity of upstream and downstream government decisions to E1 is very high and the difference is very small, but the sensitivity of upstream government decisions to E2 is higher than that of downstream governments to E2.

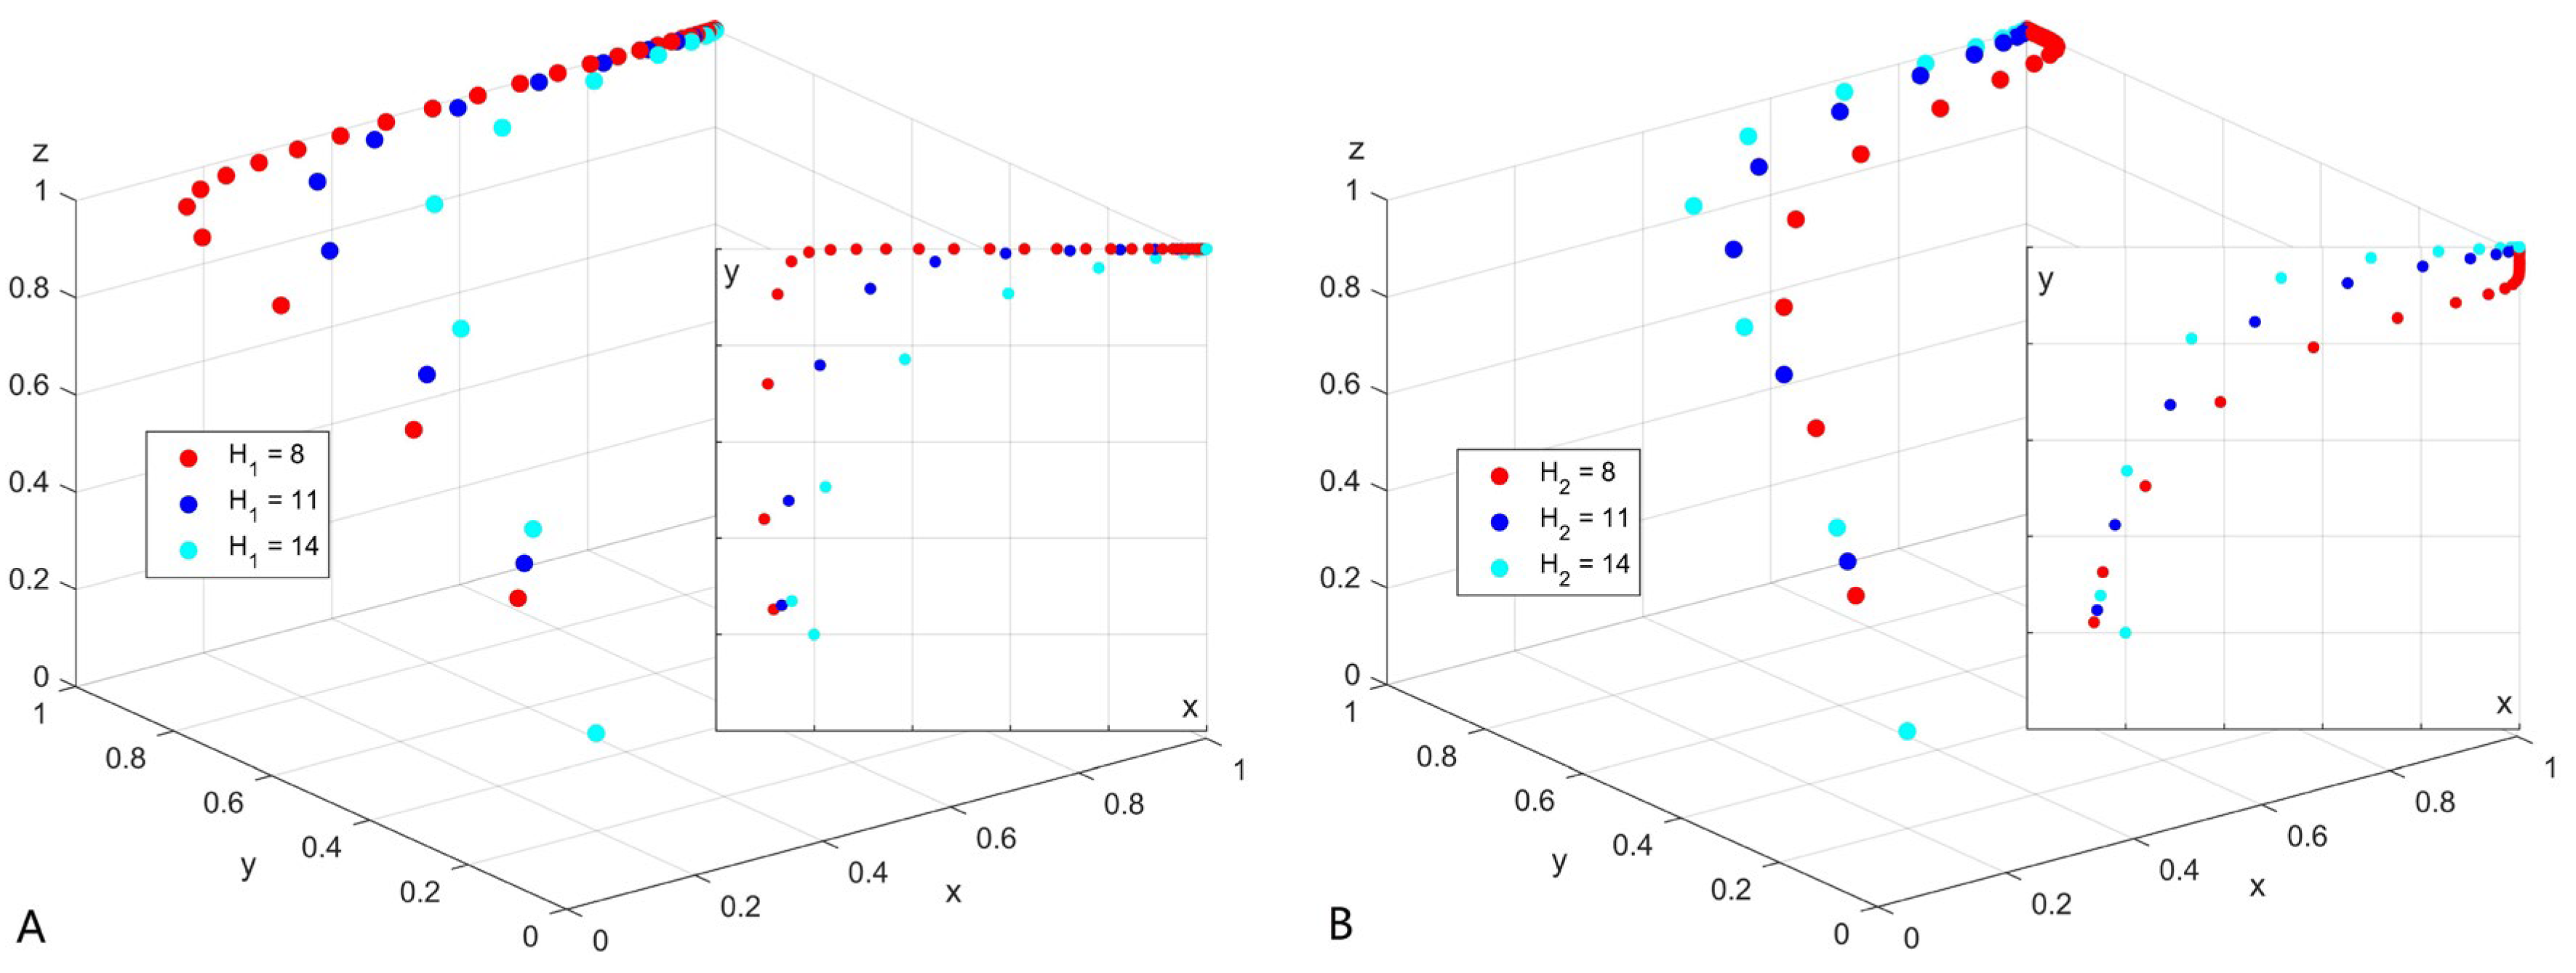
4.2.4. Sensitivity Analysis of Central Government Punishment Intensity

In this paper, the punitive measures of the central government in the evolutionary game system are divided into two parts: the punitive measures for the upstream government and the punitive measures for the downstream government. Therefore, the impact of the punishment of the central government on the upstream government on the stability of the system and the impact of the punishment of the central government on the downstream government on the stability of the system are analyzed separately. In order to analyze the impact of the punishment of the central government on the upstream government on the system stability, H1 is set to 8, 11, and 14, respectively, to represent the three situations of low, medium, and high punishment. The other influencing factors are shown in Table 4. T of the replication dynamic system is set to 6 and the step size is 0.1. The results of the simulation analysis are shown in Figure 7A. In order to compare the sensitivity of the downstream governments of the basin to the punishment of the central government, H2 is set to 8, 11, and 14, respectively, to represent the three situations of low, medium, and high punishment. T of the replication dynamic system is set to 6 and the step size is 0.1. The other influencing factors are shown in Table 4 and the results of the simulation analysis are shown in Figure 7B.
It can be seen from Figure 7A that under the three situations of low, medium, and high punishment imposed by the central government on the upstream government, the time t for the upstream government’s decision to reach the stable state is 3.2, 1.6, and 1.1, respectively, the time t for the downstream government’s decision to reach the stable state is 0.9, 0.8, and 0.7, respectively, and the time for the central government to reach the stable state is 1.4, 0.9, and 0.7, respectively. It can be inferred that when the central government punishes the upstream more, the upstream government, the central government, and the downstream government tend to be stable for a shorter time; the upstream government is the most sensitive to the change in H1, followed by the central government, and the downstream government is the weakest.
It can be seen from Figure 7B that under the three situations of low, medium, and high punishment by the central government to the downstream government, the time t for the upstream government’s decision to reach the stable state is concentrated at about 1.2, and the change is negligible. The time t for the downstream government’s decision to reach the stable state is 4.4, 1.3, and 0.8, respectively, and the time t for the central government to reach the stable state is concentrated at about 0.8; the change is negligible. It can be seen from this that the strategy of the downstream government is the most sensitive to H2, while H2 has little direct impact on the decisions of the central government and the upstream government.
Comparing Figure 7A,B, it can be seen that, compared with the sensitivity of the governments at the lower reaches of the basin to the change in H1, the governments at the upper reaches of the basin are less sensitive to the change in H2. Therefore, under the same punishment, H1 has a greater impact on the system stability than H2.

5. Discussion

Relying on a single vertical ecological compensation cannot break through the dilemma of local government protectionism; a single horizontal ecological compensation will lead to the tragedy of the commons as a public good. Therefore, the focus of watershed governance lies in the combination of intergovernmental horizontal ecological compensation and vertical ecological compensation, the establishment of an endogenous intergovernmental cooperation mechanism, the strengthening of the vertical management role of the government, and the combination of vertical embedding and horizontal coordination to improve the efficiency of watershed governance. This paper establishes a tripartite government evolutionary game to study vertical and horizontal mechanisms of river basin ecological compensation. In addition to seeking the conditions that can eliminate the impact of initial probability on the replication dynamic system, we also analyze the influencing factors such as upstream development opportunity cost, ecological compensation amount, punishment of the central government, and vertical financial transfer.
The simulation analysis of government decision making under different initial probabilities shows that, when the central government chooses the nonsupervision strategy, cooperation in watershed ecological compensation cannot be achieved regardless of the initial willingness of upstream and downstream governments. Therefore, at this stage, the supervision of the central government is an indispensable part of the construction of a river basin ecological compensation system, which is corroborated by the conclusion that “the lack of constraints and incentives of river basin local governments is a major obstacle to the construction of ecological compensation mechanism” in many horizontal river basin ecological compensation mechanisms in China [62]. The central government’s regulatory measures and regulatory costs should also be considered as important factors in the formulation of a watershed ecological compensation scheme. The new conditions in constraint (2) show that the government’s strategic choice of river basin ecological compensation is affected by various factors such as regulatory income, regulatory expenditure, and vertical financial transfer expenditure. When the regulatory income is higher than the sum of various expenditures, the central government tends to regulate; on the other hand, the central government will tend towards a nonregulatory strategy. However, in the practice of ecological compensation construction, because natural resources are considered public goods, the central government will not give up the supervision of river basin ecological compensation. Therefore, various supervision income, supervision expenditure, and vertical financial transfer expenditure can be regarded as factors affecting the public power of the central government. When the income is greater than the expenditure, the public power is strengthened; when the opposite is true, public power is weakened. Severe punishment is conducive to the strengthening of public power and makes the central government tend toward a stable state of supervision in a shorter time. However, in practice, it is unrealistic to increase government revenue by greatly improving supervision through the formulation of ecological compensation policy; therefore, in addition to improving regulatory benefits, reducing the regulatory cost of the central government is also a necessary means to strengthen public power.
According to the inference in Section 4.2.1, the compensation standard for sacrificing the opportunity cost of development in the upstream area in the watershed ecological compensation scheme needs to be formulated according to local conditions. Especially for the Yellow River Basin with a large span and different economic development levels along the way, if the ecological compensation scheme of one region is mechanically applied to other regions and the differences in economic development levels among the compensated individuals are ignored, it is very likely to lead to low participation enthusiasm on the part of some stakeholders, insufficient system implementation and implementation, and an insignificant compensation effect. In previous practical research on watershed ecological compensation, it is often mentioned that, with the continuous promotion of ecological compensation project, the enthusiasm of protectors will gradually decrease, which is consistent with the analysis results of the simulation [63]. This is because the development opportunity cost sacrificed by the upstream region of the basin is not invariable. With the steady economic development of the surrounding areas, the development opportunity cost sacrificed by the upstream region also increases. Therefore, when formulating the compensation standard for the development opportunity cost sacrificed by the upstream region, the fixed compensation standard of “one size fits all” cannot be adopted. The compensation to the upstream government should also increase with the economic development of the surrounding areas, so as to maintain the enthusiasm of the upstream region for the watershed ecological governance and ensure the sustainable promotion of the watershed ecological compensation.
According to Section 4.2.2, in the formulation of watershed ecological compensation schemes, the establishment of vertical financial transfer standards is not a case of the bigger, the better. Properly raising the standard of vertical financial transfer can help the three-party game players to reach a stable state as soon as possible, but when the standard is too high, the time for the replication dynamic system to reach final stability will be greatly prolonged. At the same time, the simulation analysis of vertical financial transfer factors also shows the necessity of establishing an interprovincial river basin horizontal ecological compensation scheme. Relying solely or excessively on the role of vertical financial transfer in river basin ecological compensation will increase the financial pressure of the central government, and then weaken the public power of the central government in the supervision of river basin ecological compensation. In the specific practice of river basin ecological compensation, the central government cannot have unlimited funds as in the simulation analysis. Therefore, in the formulation of vertical financial transfer payment standards, we should not only improve the standards on the premise of replicating the dynamic system to reach a stable state in a short time, but also consider the specific financial situation of the central government. In previous vertical ecological compensation research, the research conclusions often only explain that relying solely on the financial support of the central government is insufficient to meet the needs of long-term watershed ecological protection and construction; this paper demonstrates this view from the perspective of evolutionary game, and verifies the necessity of the combination of horizontal ecological compensation and vertical ecology.
According to Section 4.2.3, the two-way regulation of ecological compensation in river basin ecological compensation aims to reflect the characteristics of the combination of water quantity and quality and the combination of ecological protection behavior and effects in terms of the practical needs and inherent attributes of water resources, and to judge the specific payment according to the assessment requirements and assessment conditions of water quantity and water quality of river cross-provincial boundary sections. However, the formulation of a two-way compensation standard has an impact on the decisions of upstream and downstream governments. The ecological compensation E1 paid by the downstream government to the upstream government has a similar and significant impact on government decisions. The ecological compensation E2 paid by the upstream government to the downstream government has an impact on government decisions, but the impact on the upstream government is greater than that on the downstream government. Therefore, when formulating the watershed ecological compensation scheme, under the condition of meeting the constraint condition (2), we should fully consider the specific conditions of the upstream and downstream governments, and then formulate the standard of ecological compensation E1. Although an excessive or too small E1 within the constraint condition will not affect the final stable state of the system, it will greatly increase the time for the system to reach the stable state; the formulation of E2 standard gives priority to the impact on the upstream government, followed by the impact on the downstream government; moreover, considering the sensitivity of upstream and downstream governments to E1 and E2, the standard of E2 should not be higher than E1, otherwise the time for the system to reach the final stable state will be prolonged. At present, the research on the two-way adjustment of watershed ecological compensation mostly focuses on the calculation of a compensation standard; the simulation analysis conclusion provides a reference for the priority of two kinds of ecological compensation in the formulation of compensation scheme.
According to Section 4.2.4, in river basin ecological compensation plan formulation, the attention paid to the upstream government penalties should be greater than that paid to downstream penalties, and the punishment of the upstream and downstream governments should not be too small while meeting the constraint condition (2); otherwise, the time for the replication dynamic system to reach the stable state will be greatly prolonged. The above analysis also shows that, with the increasing punishment, the sensitivity of upstream and downstream governments to it is decreasing. Therefore, it is not advisable to formulate unrealistic, excessive punishments. In most studies involving the central government’s supervision of watershed protection, the central government’s punishment for upstream and downstream governments is not differentiated [55]. Through a simulation, this paper showed that the punishments meted out by the central government on the upstream and downstream governments should be different, and proved that the punishment priority of the downstream government in the formulation of an ecological compensation scheme should be higher than that of the upstream government.
The applicability of the research model in this paper is not very extensive. The model is suitable for local governments in the upper and lower reaches of the basin and their superior governments, but is not suitable for research on the ecological compensation mechanism between governments on the left and right banks of a basin. This is because, for governments on the left and right banks of a basin, it is impossible to clearly define the compensation subject and object. However, the model still plays a great role in the study of watershed ecological compensation. It can not only be used to study the interprovincial watershed ecological mechanism (such as in Shaanxi Province, Henan Province, and the central government in this paper), but can also be extended to the study of watershed ecological compensation mechanisms in the province. When the model is used to study the ecological compensation mechanism of river basins in the province, the provincial government replaces the original central government, and the municipal governments in the upper and lower reaches of the river basin replace the provincial governments in the upper and lower reaches of the river basin. The research conclusions of this paper can be applied to the ecological compensation construction between provincial governments in the upper and lower reaches of the Yellow River Basin, but re not applicable to the ecological compensation construction between provinces on the left and right banks of the Yellow River Basin.

6. Conclusions

Considering that the punishment measures of the central government and the vertical financial transfer to the upstream government have an impact on the strategies of upstream and downstream governments of the basin, this paper demonstrates the necessity of combining the vertical and horizontal ecological compensation of the basin by constructing a tripartite evolutionary game model between the upstream government (Shaanxi Province), the downstream government (Henan Province), and the central government. The stability of equilibrium strategy combination of game system and the influence relationship of various factors are analyzed. The effectiveness of the analysis was verified by a simulation analysis, and the necessary conditions were obtained to achieve the stable strategy combination of Shaanxi provincial government protecting the watershed ecology in the upper reaches, Henan Provincial government participating in the watershed cogovernance, and the central government supervising the watershed ecological governance. According to the sensitivity of the decision making to the influencing factors and the stable conditions, relevant countermeasures and suggestions were put forward to promote the ecological governance of the Yellow River Basin. The main conclusions are as follows:
(1) In a tripartite government evolutionary game, the initial willingness of the upstream government and the central government to participate in river basin ecological compensation plays a decisive role in whether the three governments can cooperate to participate in river basin ecological compensation, and the impact of the initial willingness of the downstream government to engage in tripartite decision-making can be ignored. The governments of Shaanxi and Henan provinces cannot consciously fulfill the obligation of watershed ecological compensation, and the implementation of watershed ecological compensation scheme can be guaranteed only under the supervision of the central government. The central government’s sufficient regulatory public power in river basin ecological compensation is the key to eliminating the impact of the initial willingness of all governments. We must ensure that all benefits under the central government’s regulatory strategy are higher than the regulatory expenditure and vertical financial transfer expenditure.
(2) The development opportunity cost and vertical fiscal transfer payment have the most obvious impact on the decision making of the upstream government, while the direct impact on the decision making of the downstream provincial government and the central government is weak. The two-way regulation of ecological compensation only has a direct impact on the decisions of upstream and downstream governments. The sensitivity of upstream and downstream governments’ decision making to the ecological compensation paid by the downstream government to the upstream government is higher than that paid by the upstream government to the downstream government. The upstream and downstream governments were more sensitive to their own penalties than the central government’s, and the three parties involved in watershed ecological compensation were more sensitive to the penalties imposed by the upstream governments than to the penalties imposed by the downstream governments.
(3) The compensation standard for sacrificing development opportunity cost should be a floating value that changes with the level of local economic development. In the formulation of a two-way ecological compensation standard, the compensation standard of Shaanxi Province to Henan Province should not be higher than that of Henan Province to Shaanxi Province. The standard of vertical fiscal transfer payment should not be set too high; otherwise, the time for the central government to make regulatory decisions will be greatly prolonged. It is difficult for the central government to effectively restrict the lower governments if the punishment is too low. With the increase in punishment, the lower governments become less sensitive to it. Therefore, it is not advisable to formulate too severe a punishment.
According to the analysis of this paper, some suggestions on the formulation of a watershed ecological compensation scheme in Shaanxi Province can be put forward: (1) according to the social and economic development of Shaanxi Province, we must formulate the accounting standard of sacrificing opportunity cost, and clarify the subject and object scope of watershed ecological compensation, so as to formulate a reasonable ecological compensation standard and vertical financial transfer amount. (2) We must improve water quality and quantity assessment index system, and scientifically establish cross-border water quality and quantity monitoring stations so as to ensure two-way regulation of watershed ecological compensation and the effective implementation of central government supervision measures. (3) We must improve the performance evaluation mechanism of ecological compensation in water source protection areas, so as to provide the vertical financial transfer of the central government and the formulation of the standard amount of ecological compensation in the lower reaches of the river basin. (4) In the formulation of the two-way ecological compensation standard and the central government punishment meted out to the upstream and downstream governments, priority should be given to the impact on the Shaanxi provincial government and the central government.

Author Contributions

Conceptualization, Q.W. and Y.X.; investigation, Q.W.; methodology, Q.W. and N.W.; resources, H.W.; software, Q.W.; supervision, N.W.; validation, Q.W.; visualization, H.W.; writing—original draft, Q.W.; writing—review and editing, Q.W., N.W., and Y.X. All authors have read and agreed to the published version of the manuscript.

Funding

This work was supported by the National Natural Science Foundation of China (Grant No. 51979221), by the Natural Science Basic Research Program of Shaanxi (Program No. 2021JLM-45), and by the Research Fund of the State Key Laboratory of Eco-hydraulics in Northwest Arid Region, Xi’an University of Technology (Grant No. 2019KJCXTD-5).

Conflicts of Interest

The authors declare no conflict of interest.

References

  1. Davies, J.-M.; Mazumder, A. Health and environmental policy issues in Canada: The role of watershed management in sustaining clean drinking water quality at surface sources. J. Environ. Manag. 2003, 68, 273–286. [Google Scholar] [CrossRef]
  2. Richter, B.D.; Mathews, R.; Harrison, D.L.; Wigington, R. Ecologically sustainable water management: Managing river flows for ecological integrity. Ecol. Appl. 2003, 13, 206–224. Available online: http://www.instreamflowcouncil.org (accessed on 14 February 2022). [CrossRef]
  3. Boulay, A.-M.; Drastig, K.; Amanullah; Chapagain, A.; Charlon, V.; Civit, B.; DeCamillis, C.; De Souza, M.; Hess, T.; Hoekstra, A.Y.; et al. Building consensus on water use assessment of livestock production systems and supply chains: Outcome and recommendations from the FAO LEAP Partnership. Ecol. Indic. 2021, 124, 107391. [Google Scholar] [CrossRef]
  4. Zhao, L.J.; Li, C.M.; Huang, R.B.; Si, S.; Xue, J.; Huang, W.; Hu, Y. Harmonizing model with transfer tax on water pollution across regional boundaries in a China’s lake basin. Eur. J. Oper. Res. 2013, 225, 377–382. [Google Scholar] [CrossRef]
  5. Swallow, B.M.; Garrity, D.P.; Van Noordwijk, M. The effects of scales, flows and filters on property rights and collective action in watershed management. Water Policy 2002, 3, 457–474. [Google Scholar] [CrossRef] [Green Version]
  6. Sulistyaningsih, T.; Nurmandi, A.; Salahudin, S.; Roziqin, A.; Kamil, M.; Sihidi, I.T.; Romadhan, A.; Loilatu, M.J. Public policy analysis on watershed governance in Indonesia. Sustainability 2021, 13, 6615. [Google Scholar] [CrossRef]
  7. German, L.; Taye, H. A framework for evaluating effectiveness and inclusiveness of collective action in watershed management. J. Int. Dev. J. Dev. Stud. Assoc. 2008, 20, 99–116. [Google Scholar] [CrossRef]
  8. Zhang, Z.; Cheng, L.; Shang, H.; Li, Y. Review and trend of eco-compensation mechanism on river basin. Acta Ecol. Sin. 2012, 32, 6543–6552. [Google Scholar] [CrossRef]
  9. Yang, Y.; Zhang, X.; Chang, L.; Cheng, Y.; Cao, S. A method of evaluating ecological compensation under different property rights and stages: A case study of the Xiaoqing River Basin, China. Sustainability 2018, 10, 615. [Google Scholar] [CrossRef] [Green Version]
  10. Shang, W.; Gong, Y.; Wang, Z.; Stewardson, M.J. Eco-compensation in China: Theory, practices and suggestions for the future. J. Environ. Manag. 2018, 210, 162–170. [Google Scholar] [CrossRef] [PubMed]
  11. Molle, F. Water, politics and river basin governance: Repoliticizing approaches to river basin management. Water Int. 2009, 34, 62–70. [Google Scholar] [CrossRef] [Green Version]
  12. Zhai, T.; Zhang, D.; Zhao, C. How to optimize ecological compensation to alleviate environmental injustice in different cities in the Yellow River Basin? A case of integrating ecosystem service supply, demand and flow. Sustain. Cities Soc. 2021, 75, 103341. [Google Scholar] [CrossRef]
  13. Engel, S.; Pagiola, S.; Wunder, S. Designing payments for environmental services in theory and practice: An overview of the issues. Ecol. Econ. 2008, 65, 663–674. [Google Scholar] [CrossRef]
  14. Yin, R.; Zhao, M. Ecological restoration programs and payments for ecosystem services as integrated biophysical and socioeconomic processes—China’s experience as an example. Ecol. Econ. 2012, 73, 56–65. [Google Scholar] [CrossRef]
  15. Ezzine-de-Blas, D.; Corbera, E.; Lapeyre, R. Payments for environmental services and motivation crowding: Towards a conceptual framework. Ecol. Econ. 2019, 156, 434–443. [Google Scholar] [CrossRef]
  16. Turpie, J.K.; Marais, C.; Blignaut, J.N. The working for water programme: Evolution of a payments for ecosystem services mechanism that addresses both poverty and ecosystem service delivery in South Africa. Ecol. Econ. 2008, 65, 788–798. [Google Scholar] [CrossRef] [Green Version]
  17. Salzman, J.; Bennett, G.; Carroll, N.; Goldstein, A.; Jenkins, M. The global status and trends of Payments for Ecosystem Services. Nat. Sustain. 2018, 1, 136–144. [Google Scholar] [CrossRef]
  18. Vihervaara, P.; Rönkä, M.; Walls, M. Trends in ecosystem service research: Early steps and current drivers. Ambio 2010, 39, 314–324. [Google Scholar] [CrossRef] [PubMed]
  19. Cotler, H.; Cuevas, M.L.; Landa, R.; Frausto, J.M. Environmental Governance in Urban Watersheds: The Role of Civil Society Organizations in Mexico. Sustainability 2022, 14, 988. [Google Scholar] [CrossRef]
  20. Platt, R.H.; Barten, P.K.; Pfeffer, M.J. A full, clean glass? Managing New York City’s watersheds. Environ. Sci. Policy Sustain. Dev. 2000, 42, 8–20. [Google Scholar] [CrossRef]
  21. Rosa, H.; Kandel, S. Compensation for Environmental Services and Rural Communities: Lessons from the Americas. Int. For. Rev. 2004, 6, 187–194. [Google Scholar] [CrossRef] [Green Version]
  22. Wei, S.; Zhu, Z.; Zhao, J.; Chadwick, D.R.; Dong, H. Policies and regulations for promoting manure management for sustainable livestock production in China: A review. Front. Agric. Sci. Eng. 2021, 8, 45–57. [Google Scholar] [CrossRef]
  23. Daniels, A.E.; Bagstad, K.; Esposito, V.; Moulaert, A.; Rodriguez, C.M. Understanding the impacts of Costa Rica’s PES: Are we asking the right questions? Ecol. Econ. 2010, 69, 2116–2126. [Google Scholar] [CrossRef]
  24. Pagiola, S. Payments for environmental services in Costa Rica. Ecol. Econ. 2008, 65, 712–724. [Google Scholar] [CrossRef] [Green Version]
  25. Rasch, S.; Wünscher, T.; Casasola, F.; Ibrahim, M.; Storm, H. Permanence of PES and the role of social context in the Regional Integrated Silvo-pastoral Ecosystem Management Project in Costa Rica. Ecol. Econ. 2021, 185, 107027. [Google Scholar] [CrossRef]
  26. Amann, M. Emission Inventories, Emission Control Options and Control Strategies: An Overview of Recent Developments. Water Air Soil Pollut. 2001, 130, 43–50. [Google Scholar] [CrossRef]
  27. Ellerman, A.D.; Joskow, P.L.; Harrison, D., Jr. Emissions Trading in the US. Pew Center on Global Climate Change; Center for Climate and Energy Solutions: Arlington, VA, USA, 2003. [Google Scholar]
  28. Wang, P.; Lin, C.-K.; Wang, Y.; Liu, D.; Song, D.; Wu, T. Location-specific co-benefits of carbon emissions reduction from coal-fired power plants in China. Nat. Commun. 2021, 12, 6948. [Google Scholar] [CrossRef] [PubMed]
  29. Krause, P.; Smith, A.; Veale, B.; Murray, M. Achievements of the Grand River Conservation Authority, Ontario, Canada. Water Sci. Technol. 2001, 43, 45–55. [Google Scholar] [CrossRef] [PubMed]
  30. Sonthiphand, P.; Cejudo, E.; Schiff, S.L.; Neufeld, J.D. Wastewater effluent impacts ammonia-oxidizing prokaryotes of the Grand River, Canada. Appl. Environ. Microbiol. 2013, 79, 7454–7465. [Google Scholar] [CrossRef] [PubMed] [Green Version]
  31. Liu, J.; Li, S.; Ouyang, Z.; Tam, C.; Chen, X. Ecological and socioeconomic effects of China’s policies for ecosystem services. Proc. Natl. Acad. Sci. USA 2008, 105, 9477–9482. [Google Scholar] [CrossRef] [Green Version]
  32. Shen, N.; Pang, A.; Li, C.; Liu, K. Study on ecological compensation mechanism of Xin’an spring water source protection zone in Shanxi Province, China. Procedia Environ. Sci. 2010, 2, 1063–1073. [Google Scholar] [CrossRef] [Green Version]
  33. Xiong, G.B.; Jiang, M. The research progress and enlightenment of ecological compensation mechanism based on ecosystem service value. Adv. Mater. Res. 2012, 518–523, 1710–1715. [Google Scholar] [CrossRef]
  34. Sheng, J.; Qiu, W.; Han, X. China’s PES-like horizontal eco-compensation program: Combining market-oriented mechanisms and government interventions. Ecosyst. Serv. 2020, 45, 101164. [Google Scholar] [CrossRef]
  35. Hertel, T.W.; Reimer, J.J. Predicting the poverty impacts of trade reform. J. Int. Trade Econ. Dev. 2005, 14, 377–405. [Google Scholar] [CrossRef]
  36. Ma, J.; Xue, Y.; Ma, C.; Wang, Z. A data fusion approach for soil erosion monitoring in the Upper Yangtze River Basin of China based on Universal Soil Loss Equation (USLE) model. Int. J. Remote Sens. 2003, 24, 4777–4789. [Google Scholar] [CrossRef]
  37. Capodaglio, A.G.; Callegari, A. Can payment for ecosystem services schemes be an alternative solution to achieve sustainable environmental development? A critical comparison of implementation between Europe and China. Resources 2018, 7, 40. [Google Scholar] [CrossRef] [Green Version]
  38. Wang, P.; Wolf, S.A. A targeted approach to payments for ecosystem services. Glob. Ecol. Conserv. 2019, 17, e00577. [Google Scholar] [CrossRef]
  39. Shen, J.; Wu, F.; Yu, Q.; Zhang, Z.; Zhang, L.; Zhu, M.; Fang, Z. Standardization of Exchanged Water with Different Properties in China’s Water Rights Trading. Int. J. Environ. Res. Public Health 2020, 17, 1730. [Google Scholar] [CrossRef] [PubMed] [Green Version]
  40. Speed, R. Transferring and trading water rights in the People’s Republic of China. Water Resour. Dev. 2009, 25, 269–281. [Google Scholar] [CrossRef]
  41. Li, G.; Wang, Q.; Liu, G.; Zhao, Y.; Wang, Y.; Peng, S.; Wei, Y.; Wang, J. A Successful Approach of the First Ecological Compensation Demonstration for Crossing Provinces of Downstream and Upstream in China. Sustainability 2020, 12, 6021. [Google Scholar] [CrossRef]
  42. Zhang, H.; Wu, S.; Yu, Y.; Lei, L. Effects of payments for watershed services policy on economic growth: A case study based on the synthetic control method. Environ. Dev. Sustain. 2021, 23, 2739–2761. [Google Scholar] [CrossRef]
  43. Ministry of Finance of the People’s Republic of China. Guiding Opinions on Accelerating the Establishment of Horizontal Ecological Protection Compensation Mechanism in the Upper and Lower Reaches of the River Basin. 2016. Available online: http://jjs.mof.gov.cn/tongzhigonggao/201612/t20161227_2505642.htm (accessed on 14 February 2022).
  44. Li, J.; Sun, W.; Li, M.; Meng, L. Coupling coordination degree of production, living and ecological spaces and its influencing factors in the Yellow River Basin. J. Clean. Prod. 2021, 298, 126803. [Google Scholar] [CrossRef]
  45. Baosheng, W.; Zhaoyin, W.; Changzhi, L. Yellow River Basin management and current issues. J. Geogr. Sci. 2004, 14, 29–37. [Google Scholar] [CrossRef]
  46. Zhu, Z.; Giordano, M.; Cai, X.; Molden, D. The Yellow River Basin: Water accounting, water accounts, and current issues. Water Int. 2004, 29, 2–10. [Google Scholar] [CrossRef]
  47. Xiu, Y.; Wang, N.; Xie, J.; Ke, X. Improvement of the Ecological Protection Compensation Policy for Adjustment of Planting Structure in an Area of Groundwater Overexploitation: A Tripartite Evolutionary Game Study. Pol. J. Environ. Stud. 2022, 31, 1399–1414. [Google Scholar] [CrossRef]
  48. Gao, X.; Shen, J.; He, W.; Sun, F.; Zhang, Z.; Guo, W.; Zhang, X.; Kong, Y. An evolutionary game analysis of governments’ decision-making behaviors and factors influencing watershed ecological compensation in China. J. Environ. Manag. 2019, 251, 109592. [Google Scholar] [CrossRef] [PubMed]
  49. Xiong, Z.; Shao, C. Research on eco-compensation system in China. J. Agric. Sci. 2011, 3, 255. [Google Scholar] [CrossRef] [Green Version]
  50. Wang, H.; Yang, G.; Ouyang, X.; Tand, Z.; Long, X.; Yue, Z. Horizontal ecological compensation mechanism and technological progress: Theory and empirical study of Xin’an River Ecological Compensation Gambling Agreement. J. Environ. Plan. Manag. 2021, 1–23. [Google Scholar] [CrossRef]
  51. Xu, J.; Xiao, Y.; Xie, G.; Jiang, Y. Ecosystem service flow insights into horizontal ecological compensation standards for water resource: A case study in Dongjiang Lake basin, China. Chin. Geogr. Sci. 2019, 29, 214–230. [Google Scholar] [CrossRef] [Green Version]
  52. Osborne, M.J.; Rubinstein, A. A Course in Game Theory; MIT Press: Cambridge, MA, USA, 1994. [Google Scholar]
  53. Sigmund, K. Introduction to Evolutionary Game Theory; American Mathematical Society: Providence, RI, USA, 2011; Volume 69, pp. 1–26. [Google Scholar]
  54. Kelly, A. Decision Making Using Game Theory: An Introduction for Managers; Cambridge University Press: Cambridge, UK, 2003. [Google Scholar]
  55. Sheng, J.; Webber, M. Incentive-compatible payments for watershed services along the Eastern Route of China’s South-North Water Transfer Project. Ecosyst. Serv. 2017, 25, 213–226. [Google Scholar] [CrossRef]
  56. Feng, Y. Discussion on the development and utilization of water resources in China. Light Ind. Des. 2011, 5, 241. [Google Scholar]
  57. Ministry of Ecological Environment of the People′s Republic of China. Bulletin on China’s Ecological Environment. 2019. Available online: https://www.mee.gov.cn/hjzl/sthjzk/ (accessed on 14 February 2022).
  58. Feng, Y.-Z.; Xie, X.-J.; Qin, X.-W.; Yang, G.-H.; Cao, Y.-C.; Yang, S.-Q. Features and treatment of non-point source pollution in the Ningxia Yellow River area. Afr. J. Agric. Res. 2011, 6, 5541–5550. [Google Scholar] [CrossRef]
  59. Gao, X.P.; Li, G.N.; Zhang, C. Modeling the effects of point and non-point source pollution on a diversion channel from Yellow River to an artificial lake in China. Water Sci. Technol. 2015, 71, 1806–1814. [Google Scholar] [CrossRef] [PubMed]
  60. Jiahao, F.; Guangju, Z.; Xingmin, M.; Peng, T.; Xiaojing, T. Runoff variation characteristics and attribution analysis of main and branch streams in the middle reaches of the Yellow River. J. Hydropower 2020, 39, 90–103. [Google Scholar] [CrossRef]
  61. Barnett, S.; Storey, C. Some applications of the Lyapunov matrix equation. IMA J. Appl. Math. 1968, 4, 33–42. [Google Scholar] [CrossRef]
  62. Shouwu, J.; Jie, Z. Trans-provincial basin horizontal ecological compensation and enterprise total factor productivity. J. Financ. Econ. 2021, 47, 139–152. [Google Scholar] [CrossRef]
  63. Lu, Z.; Gao, B. Study on ecological compensation system and land desertification control. Asian Agric. Res. 2009, 1, 33–36. [Google Scholar] [CrossRef]
Figure 1. Yellow River Basin map of Shaanxi Province.
Sustainability 14 03374 g001
Figure 2. Logical relationship diagram of watershed ecological compensation.
Sustainability 14 03374 g002
Figure 3. (A) The influence of different initial probabilities on system stability (Table 3 parameter set); (B) the influence of the initial probability of the upstream government on its decision; (C) the influence of the initial probability of the downstream government on its decision; (D) the influence of the central government’s initial probability on its decision.
Sustainability 14 03374 g003
Figure 4. (A) The influence of central government decisions on upstream and downstream governments under different initial probabilities; (B) the influence of different initial probabilities on system stability (Table 4 parameter set).
Sustainability 14 03374 g004
Figure 5. (A) The influence of development opportunity cost on the stability of the replication dynamic system; (B) the influence of vertical fiscal transfer on the stability of the replication dynamic system.
Sustainability 14 03374 g005
Figure 6. (A) The effects of the ecological compensation paid by the downstream government to the upstream government on the stability of replicative dynamic systems; (B) the effects of the ecological compensation paid by the upstream government to the downstream government on the stability of replicative dynamic systems.
Sustainability 14 03374 g006
Figure 7. (A) The influence of the punishment of the upstream government on the stability of the replication dynamic system; (B) the influence of the punishment of the downstream government on the stability of the replication dynamic system.
Sustainability 14 03374 g007
Table 1. Income matrix of tripartite evolutionary game system.
Downstream Government Central Government
Supervise ZUnregulated
1 – Z
Upstream governmentProtect watershed ecology
X
Participate in watershed ecological co governance
Y
Upstream
Downstream
Central
M1 − C0 − C1 − C2 + E1 + A
M2 − E1 − C3
−B − A + V + M
M1 − C0 − C1 − C2 + E1
M2 − E1 − C3
M
Do not participate in watershed ecological co governance
1 – Y−
Upstream
Downstream
Central
M1 − C0 − C1 − C2 + A
M2 − H2
−B − A + V + M + H2
M1 − C0 − C1 − C2
M2
M
No protection of watershed ecology
1 – X
Participate in watershed ecological co governance
Y
Upstream
Downstream
Central
−H1 − E2
−C3 + E2
−B − D + H1
0
−C3
−D − T
Do not participate in watershed ecological co governance
1 – Y
Upstream
Downstream
Central
−H1
−H2
−B − D + H1+ H2
0
0
−D − T
Notes: C0 represents the development opportunity cost to the upstream government; C1 represents the ecological protection cost to the upstream government; C2 represents the management transaction cost to the upstream government; C3 represents the management transaction cost to the downstream government; E1 represents the ecological compensation paid by the downstream government; E2 represents the ecological compensation paid by the upstream government; H1 represents the punishment of the upstream government; H2 represents the punishment of the downstream government; M1 represents the ecological benefits of the upstream government; M2 represents the ecological benefits of the downstream government; B represents the cost of central government regulation; A represents the fiscal transfer amount of the central government; V represents the positive social benefits to the central government; M represents the ecological benefits to the central government; D represents the amount of ecological restoration invested by the central government; T represents the negative social effects on the central government.
Table 2. Equilibrium points and eigenvalues of tripartite evolutionary game system.
Equilibrium PointCharacteristic Value
λ1λ2λ3
P 1 ( 0 , 0 , 0 ) M 1 C 0 C 1 C 2 C 3 B + H 1 + H 2 + T
P 2 ( 0 , 0 , 1 ) M 1 C 0 C 1 C 2 + H 1 + A E 2 C 3 + H 2 B H 1 H 2 T
P 3 ( 0 , 1 , 0 ) E 1 + M 1 C 0 C 1 C 2 C 3 B + H 1 + T
P 4 ( 0 , 1 , 1 ) E 1 E 2 + A + M 1 C 0 C 1 C 2 + H 1 E 2 + C 3 H 2 B H 1 T
P 5 ( 1 , 0 , 0 ) M 1 + C 0 + C 1 + C 2 E 1 C 3 A + V B + H 2
P 6 ( 1 , 0 , 1 ) M 1 + C 0 + C 1 + C 2 A H 1 E 1 C 3 + H 2 A V + B H 2
P 7 ( 1 , 1 , 0 ) M 1 + C 0 + C 1 + C 2 E 1 E 1 + C 3 A + V B
P 8 ( 1 , 1 , 1 ) M 1 + C 0 + C 1 + C 2 E 1 + E 2 A H 1 E 1 + C 3 H 2 A V + B
Notes: C0 represents the development opportunity cost to the upstream government; C1 represents the ecological protection cost to the upstream government; C2 represents the management transaction cost to the upstream government; C3 represents the management transaction cost to the downstream government; E1 represents the ecological compensation paid by the downstream government; E2 represents the ecological compensation paid by the upstream government; H1 represents the punishment of the upstream government; H2 represents the punishment of the downstream government; M1 represents the ecological benefits of the upstream government; B represents the cost of central government regulation; A represents the fiscal transfer amount of the central government; V represents the positive social benefits to the central government; T represents the negative social effects on the central government.
Table 3. Parameter set of simulation analysis satisfying constraint condition (1).
Influence factorC0C1C2C3E1E2M1AH1H2BVT
Numerical value151022551576820305
Notes: C0 represents the development opportunity cost to the upstream government; C1 represents the ecological protection cost to the upstream government; C2 represents the management transaction cost to the upstream government; C3 represents the management transaction cost to the downstream government; E1 represents the ecological compensation paid by the downstream government; E2 represents the ecological compensation paid by the upstream government; H1 represents the punishment of the upstream government; H2 represents the punishment of the downstream government; M1 represents the ecological benefits of the upstream government; B represents the cost of central government regulation; A represents the fiscal transfer amount of the central government; V represents the positive social benefits to the central government; T represents the negative social effects on the central government.
Table 4. Simulation analysis parameter set satisfying constraint condition (2).
Influence factorC0C1C2C3E1E2M1AH1H2BVT
Numerical value15102255157131310205
Publisher’s Note: MDPI stays neutral with regard to jurisdictional claims in published maps and institutional affiliations.

