1. Introduction
UN Secretary-General Antonio Guterres pointed out that tourism should provide economic opportunities while also protecting biodiversity and the ecosystems vital for human survival. The safe restart of tourism should change its relationship with people, nature, the climate, and the economy and promote the transformation towards a carbon-neutral and flexible tourism economy. Ecotourism is responsible for travel in natural areas, which conserves the environment and improves the welfare of local people (The International Ecotourism Society, TIES,
www.ecotourism.org, 12 February 2022). Ecotourism can create new investment and employment opportunities and reduce the adverse effects on the environment [
1], promote the coordination of human, nature, climate, and economic relations, and stimulate regional sustainable development [
2], which have become major goals of future developments in various countries [
3]. Systematically carrying out research on ecotourism and exploring high-quality development paths of ecotourism provide references for solving practical problems of sustainable development of regional ecotourism. They also offer directions in exploring sustainable development paths for regional economies and ecological protection and help realize carbon peak and carbon-neutral goals.
Ecotourism was developed from the concept of sustainable development and promotes regional sustainable development through resource conservation, cultural revival, economic development, etc. [
4]. Ecotourism has attracted the attention of scholars at home and abroad since the 1960s [
5]. The term “ecotourism” was only coined in the early 1980s by Ceballos-Lascuráin, who defined it as “tourism to relatively undisturbed or uncontaminated natural areas with specific research objectives” [
6].Extensive studies have been conducted exploring various topics, including the connotations of ecotourism [
7,
8], tourist market [
9,
10], community management [
11,
12], evaluation system [
13,
14], resource protection [
15,
16], activity impact [
17,
18], resource management [
19,
20], and development planning [
21]. With the deepening of research and the development of the times, ecotourism is increasingly seen as a potential tool that can bring sustainable development [
22].Research methods have also gradually shifted from mainly qualitative analyses [
23] to combined qualitative and quantitative evaluation techniques. The analytic hierarchy process [
24,
25], entropy weight method [
26], GIS spatial analysis method [
27], and other methods have become widely used. However, scholars’ research on ecotourism destinations mainly focuses on the spatial dimension and rarely involves the temporal dimension, and there are fewer comprehensive studies on time-space characteristics. The research content is also mainly based on the study of static spatial structure characteristics, and the research on dynamic space-time distribution has not yet formed a paradigm [
28]. In view of this, this paper introduces the time dimension and uses the GIS spatial analysis method and social network analysis method to carry out research, hoping to provide a multidimensional reference for the study of the dynamic space-time distribution of ecotourism and solutions for practical problems of sustainable development.
A key consideration in tourism is tourism flow, which is defined as the social and cultural phenomenon caused by the spatial movement of tourists and describes how the destination is connected with the sources of tourists [
28]. Contemporary studies on tourism flow have transcended the antiquated static paradigm in mobility to more geographically versatile notions, significantly expanding tourism research [
28]. The research has focused largely on the spatial and temporal distribution characteristics of tourism flows [
29,
30], dynamic mechanisms [
31], coupling factors [
32], and traffic accessibility [
33] and has been conducted at varying research scales. Overall, current research on destinations has been limited, and there are few studies exploring traffic accessibility and its relationship with tourism flow. The existing research has mainly focused on traffic accessibility or on the tourist flow network structure of a single perspective to explore the direction of tourism development. Very few complete and comprehensive systems have been developed analyzing transportation accessibility and its relationship with the structure of tourist flow spaces. More theoretical analysis and empirical research are needed to explore the development of tourism flow, spatio-temporal distribution, and spatial structure caused by transportation accessibility.
To address this current gap in research, this study uses a destination point of view in analyzing the spatial and temporal dimensions of ecotourism flow. The ecotourism flow and traffic accessibility spatial coupling model is introduced to explore the spatial relationship of traffic flow and ecotourism flow, traffic congestion, the coordinated development of ecotourism scenic spot coupling paths, and the development trends of ecotourism destinations. The results of this study can be used to better understand the relationship between traffic and the spatial distribution of scenic spots and promote sustainable development of tourism.
2. Materials and Methods
2.1. Overview of the Study Area
Located in the northwest of Hunan Province, Zhangjiajie is a key ecological function zone and an important ecological security barrier area in the Yangtze River Basin. The region contains 850 species of woody plants, and 146 species of vertebrates, including 56 species of state-level protected plants and 40 species of state-level protected animals. In 2020, its forest coverage rate was 64.61%, ranking first in Hunan Province.
Zhangjiajie has become a famous international tourist city, containing 26 state-level scenic spots and the popular Wulingyuan District. Its Yongding area was identified as a national-level demonstration zone for global tourism. The Long March (Zhangjiajie) was incorporated into the national cultural park planning, while the Zhangjiajie red tourism route has been included in China’s 30 red boutique tourism routes.
In 2020, the city received 49.492 million domestic and foreign tourists, taking in CNY 56.90 billion in tourism revenue and CNY 18.92 billion in added value for the tourism industry. Zhangjiajie has been speeding up construction to become a world-class tourist destination, highlighting its transition to ecotourism as a key component in its international branding. Building the core competitiveness and international influence of its tourism products and serviceability has become a major issue for its tourism industry. Analyzing Zhangjiajie’s ecotourism flow and development is crucial for the planning and development of its regional ecotourism, optimizing its regional ecotourism layout and the sustainable and healthy development of its tourism sector.
2.2. Data Source and Processing
2.2.1. Data Source and Processing of Ecotourism Scenic Spot and Road Network
To identify the ecotourism scenic spots in the city, we put “Zhangjiajie scenic spot” in the POI search tool of the planning cloud. Based on the definition for ecotourism demonstration area in the National EcoTourism Demonstration Area Construction and Operation Code as an area that relies on unique ecological resources, natural landscapes and the humane ecology that coexist with them, promoting tourists’ understanding and learning of nature and ecology as an important content, enhancing the sense of responsibility for the ecological environment and community development, and forming sustainable tourism area, a total of 17 ecotourism scenic spots were identified (
Table 1). The road network data of Zhangjiajie came from Overpass.
2.2.2. Sample Source and Handling
Many tourists often share their travel notes through online travel network platforms, which can be used in recreating the tourism flow as completely as possible [
34]. Travel notes were used in this study to determine tourist tracks. The popular travel website Ctrip was used as the data source, “Zhangjiajie” was the retrieval field, and the octopus information collector was employed to collect all online travel notes published up to 13 August 2021 (retrieval collection time was 14 August 2021). A total of 5000 travel notes were obtained, which were then preprocessed. The main preprocessing steps were as follows: 3174 valid travel notes were obtained from 2000 to 2021 after eliminating marketing, strategy, repetition, and travel notes that could not be extracted. From the travel notes, the tourist flow was extracted, the data were cleaned, and the names of scenic spots in the tourist flow were replaced by the names of scenic areas (for example, “Wulongzhai” is a scenic spot in Wulingyuan Scenic and Historic Interest Area (WSHIA), so “Wulongzhai” was replaced by “WSHIA”). Then, adjacent similar terms were merged (for example, two scenic spots in Wulingyuan appeared consecutively in some travel tracks, which were recorded as “WSHIA WSHIA” after processing, so they were replaced with “WSHIA”). Finally, based on the order of visits, the tourist flow was divided into directed nodes (e.g., Tianmenshan National Forest Park (TMNFP)→WSHIA→Grand Canyon Landscape Area (GCLA) divided into TMNFP→WSHIA, WSHIA→GCLA).
In order to facilitate subsequent time feature analysis, travel date and length of stay (LoS) were extracted from the samples. The travel date and LoS sample group were established with sample sizes of 1767 and 1505. After excluding those with missing travel date information, the samples were divided based on the travel date (i.e., first, second, third, and fourth quarters of the year). Additionally, after excluding those with missing LoS information, the samples were divided based on the LoS (i.e., one-day, two-day, and three-day, or more).
2.3. Research Methods
2.3.1. Standard Deviation Ellipse
The standard deviation ellipse is a common method used to analyze the spatial distribution pattern of point data. It is used to measure the direction and distribution of a group of data and can summarize the spatial distribution characteristics of point data (such as central trend, discrete trend, and directional trend) [
35]. It has been widely used in the analysis of spatial distributions of tourist destinations, achieving good results [
36,
37]. This method was used in this study to analyze the spatial distribution of each ecotourism scenic spot in Zhangjiajie, and the formula is as follows:
where
and
are the spatial position coordinates of each element;
and
are the arithmetic average centers;
and
are the calculated variance of the ellipse; and
and
are the difference between the average center and the x-coordinate and y-coordinate.
2.3.2. Social Network Analysis
Social network analysis originated from Western anthropology and sociology in the 1960s and has been widely used in research fields such as information, economy, and tourism [
27]. In tourism research, this method has been used to analyze the degree centrality, proximity centrality, and intermediate centrality of tourism flow network structure [
38]. To further study the network structure characteristics of ecotourism flow in Zhangjiajie, using the Ucinet 6.0, the relationship matrix of ecotourism flow in Zhangjiajie was constructed, and its network structure was analyzed. The flow information of tourists in each ecotourism spot was first transformed into a statistical matrix. Referring to related research [
27,
39], the travel note data were given specific codes: if there was a flow phenomenon from scenic spot i to scenic spot j in a certain online travel note, the path was coded as ‘1′; otherwise, the code was ‘0′. The relevant online travel data (sample data) of 17 ecotourism scenic spots in Zhangjiajie were transformed, resulting in a 17 × 17 multivalue directed relationship matrix with 17 nodes. Using the generated matrix, an in-depth analysis was conducted to explore the network structure characteristics of Zhangjiajie’s ecotourism flow.
2.3.3. Kernel Density Estimation
Kernel density is a nonparametric method used to estimate the probability density function of random data. With the help of ArcGIS, the kernel density estimation method can realize the processing of vector data to classify overlapping regions [
26] and measure the concentration of tourism flows [
40,
41]. This paper used this method to study the distribution of ecotourism flow in Zhangjiajie in different seasons and periods, and its calculation formula is as follows:
where
is the nuclear density value of Zhangjiajie ecotourism flow at the spatial location;
r is the search radius (km), also known as the bandwidth;
u is the number of point elements whose distance from the spatial location w is less than or equal to the radius
r;
k function represents the spatial weight function; and
d is the point distance between the current point feature and the spatial position
.
2.3.4. Spatial Coupling Model of Ecotourism Flow and Traffic Accessibility
The spatial coupling model of ArcGIS has been used to explore the two-way interaction between the different systems of important research methods [
42,
43,
44]. To reveal the coupling relationship between ecotourism flow and traffic accessibility in Zhangjiajie ecotourism scenic spot, this method was adopted for reference to build a spatial coupling model of ecotourism flow and traffic accessibility in Zhangjiajie. The process is as follows:
Geographic distance was used to more accurately reflect the actual traffic conditions among the various ecotourism scenic spots in Zhangjiajie. Traffic speed was set at 60 km/h for expressways and 30 km/h for other roads.
Using the multisystem capacity coupling model in physics, the degree of mutual influence between tourism flow and traffic accessibility was then calculated. The coupling coordination degree model was developed [
35,
36] and is given by the following expressions:
where
D is the coupling coordination degree; T is the coupling coordination index; and
C is the coupling degree. When
C = 1, the coupling degree reaches the maximum, and the resonance coupling between the two subsystems is good. When
C = 0, the coupling degree between the two systems is very small, and the system shifts to disordered development. Based on the
C value, the coupling degree is divided into four grades (
Table 2).
α and
β are undetermined coefficients, such that
α +
β = 1. Both tourism flow and transport accessibility are considered to be equally important, such that
α =
β = 0.5. Using the calculated
D values, the coupling coordination degree was then divided into five grades (
Table 3) [
36].
3. Results and Analysis
3.1. Time Distribution Characteristics of Ecotourism Flow
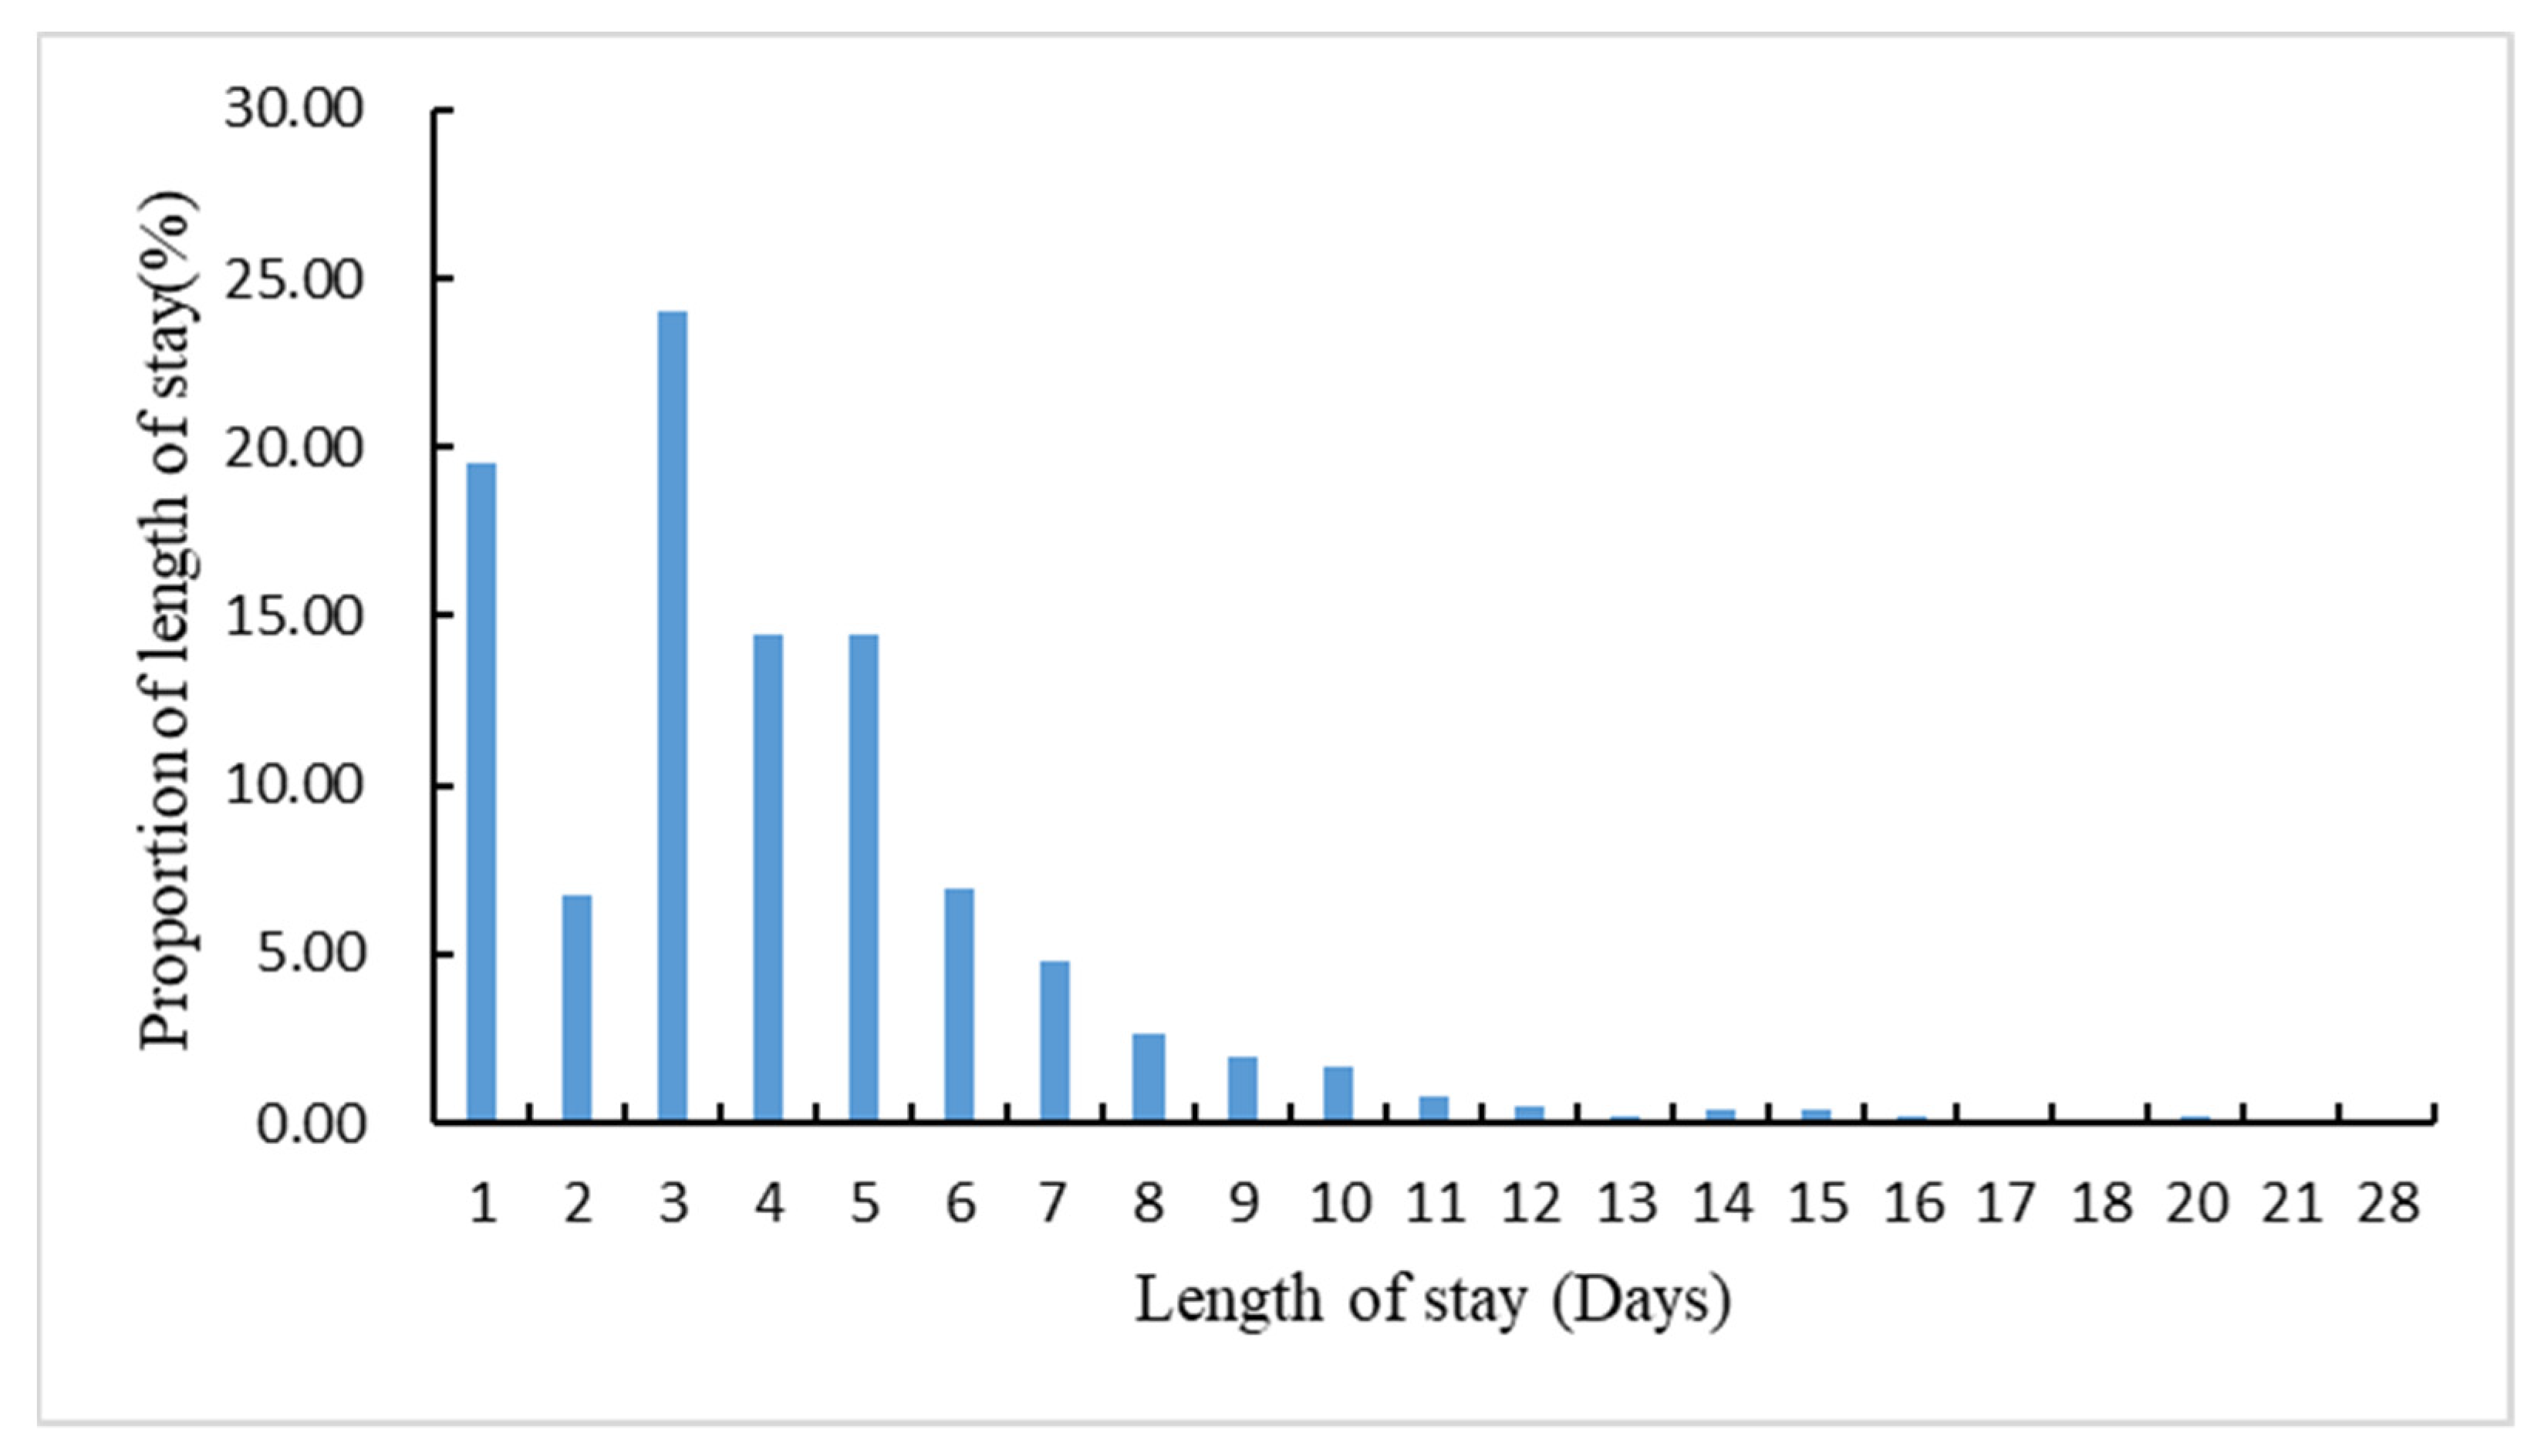
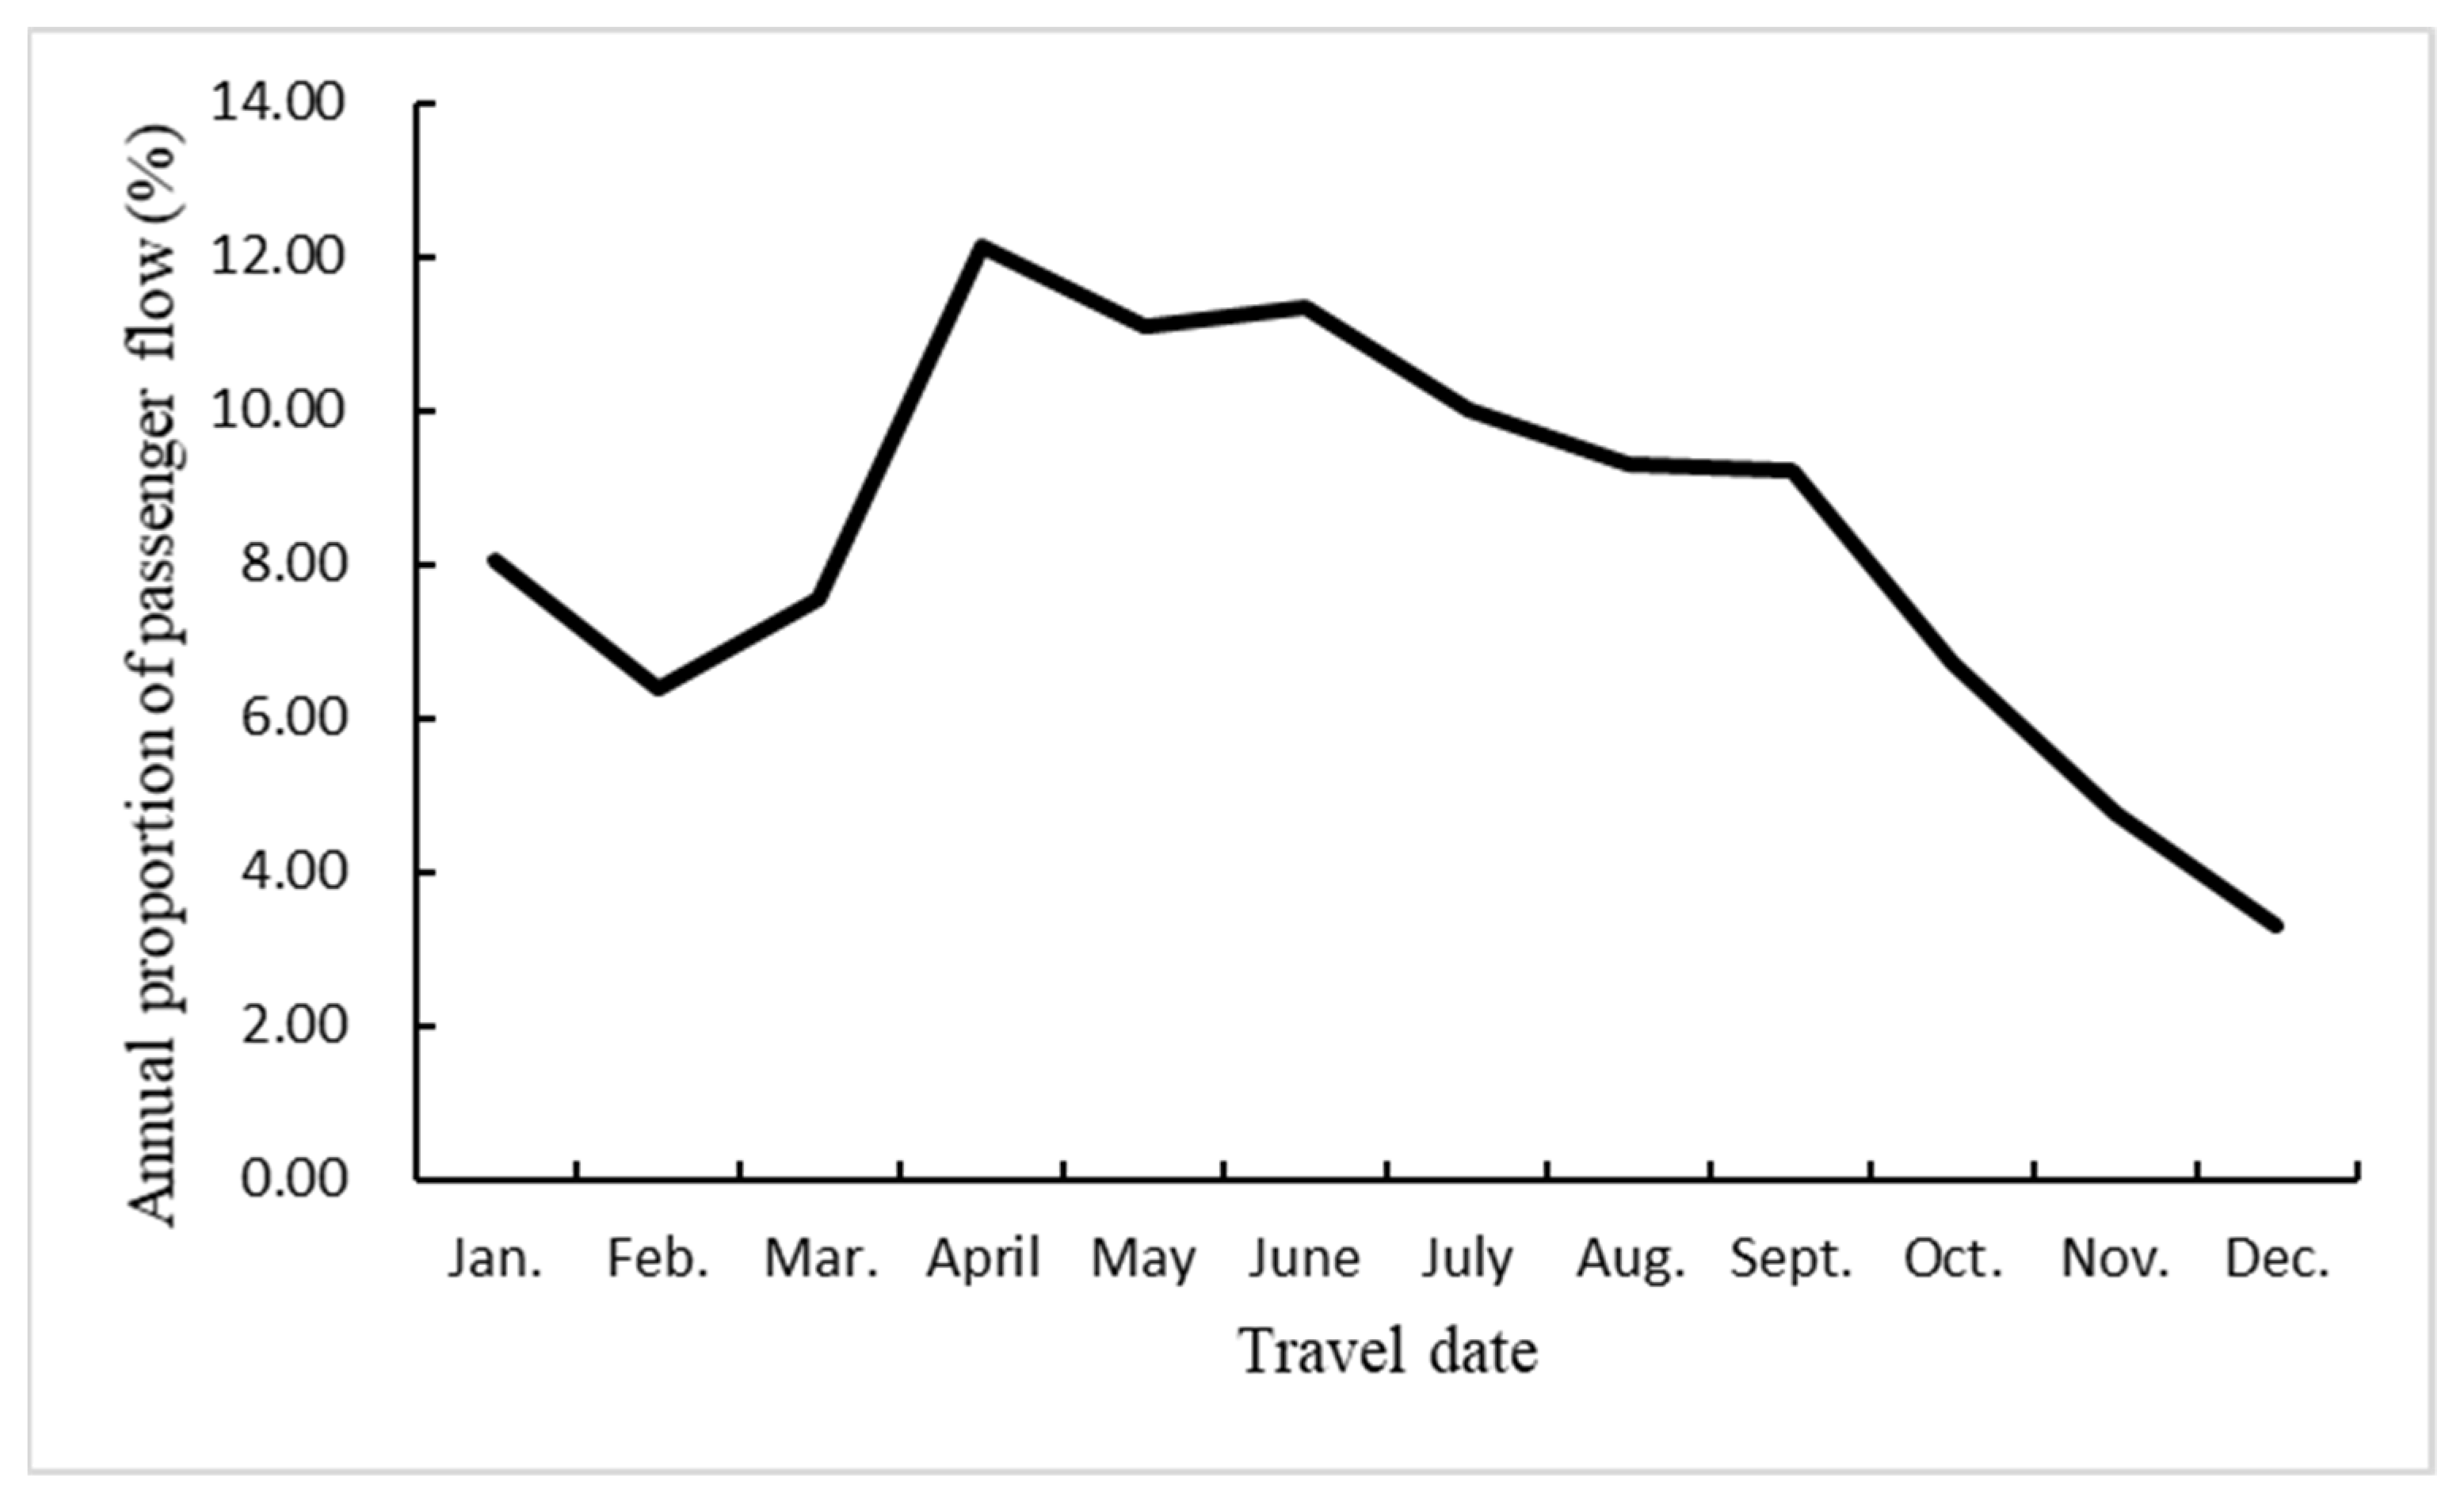
Based on sample groups, a clustered column chart for the ecotourism time and a time evolution map of the ecotourism flow were generated and are presented in
Figure 1 and
Figure 2. As shown in the figures, the temporal distribution of ecotourism flows in Zhangjiajie has the following characteristics:
In terms of LoS distribution, the ecotourism flows in Zhangjiajie are mainly characterized by short-term tourism (six days or less), accounting for 79.29%. Most Chinese holidays last seven consecutive days or less, such as Tomb-Sweeping Day (3 days), Labor Day (3 days), and Dragon Boat Festival (3 days), National Day (7 days), and Spring Festival (7 days). Breaking down the numbers further, 3-day trips had the highest proportion, accounting for 24.05%, followed by 1-day trips, which accounted for 19.52%. The 5-day and 4-day travel LoSs were also high, each accounting for more than 14%. The main reason is that Zhangjiajie’s tourism route products are mainly 1-day, 2-day, 3-day, and 5-day tours. The 3-day travel LoS ranked first, indicating the tourists’ general preference for 3-day trips. The one-day travel LoS ranked second, which is probably related to the tendency of local and surrounding tourists to travel on weekends.
In terms of seasonal distribution, the ecotourism flow in Zhangjiajie shows pronounced seasonal differences, with the peak season occurring from March to October. In March, Zhangjiajie’s weather gradually warms up and becomes more attractive to tourists. From April to June, ecotourism fluctuates considerably, mainly due to short holidays (i.e., Tomb-Sweeping Day and Labor Day) that provide domestic tourists with opportunities to take short breaks. In June, the ecotourism flow in Zhangjiajie decreases but remains at a high level. While willingness to travel among local tourists may decrease due to rising temperatures, the summer vacation increases the demand among students and families to travel. By September, the ecotourism flow in Zhangjiajie significantly decreases, reaching its minimum by the end of December, which becomes the tourism off-season. The main reason is that by September, as the summer vacation ends, the available leisure time for tourists and travel demands decreases, causing the ecotourism flow to decline. In late September to early October, the Mid-Autumn Festival and National Day holidays decelerate the decline in ecotourism flow to some extent. In addition, the start of the winter season causes the temperature to drop, further decreasing tourist enthusiasm for scenic spots in the mountains. In January, ecotourism flow picks up, mainly due to the winter break and the Spring Festival.
3.2. Structural Features of Ecotourism Flow Network
3.2.1. Spatial Structure of Ecotourism Flow Network
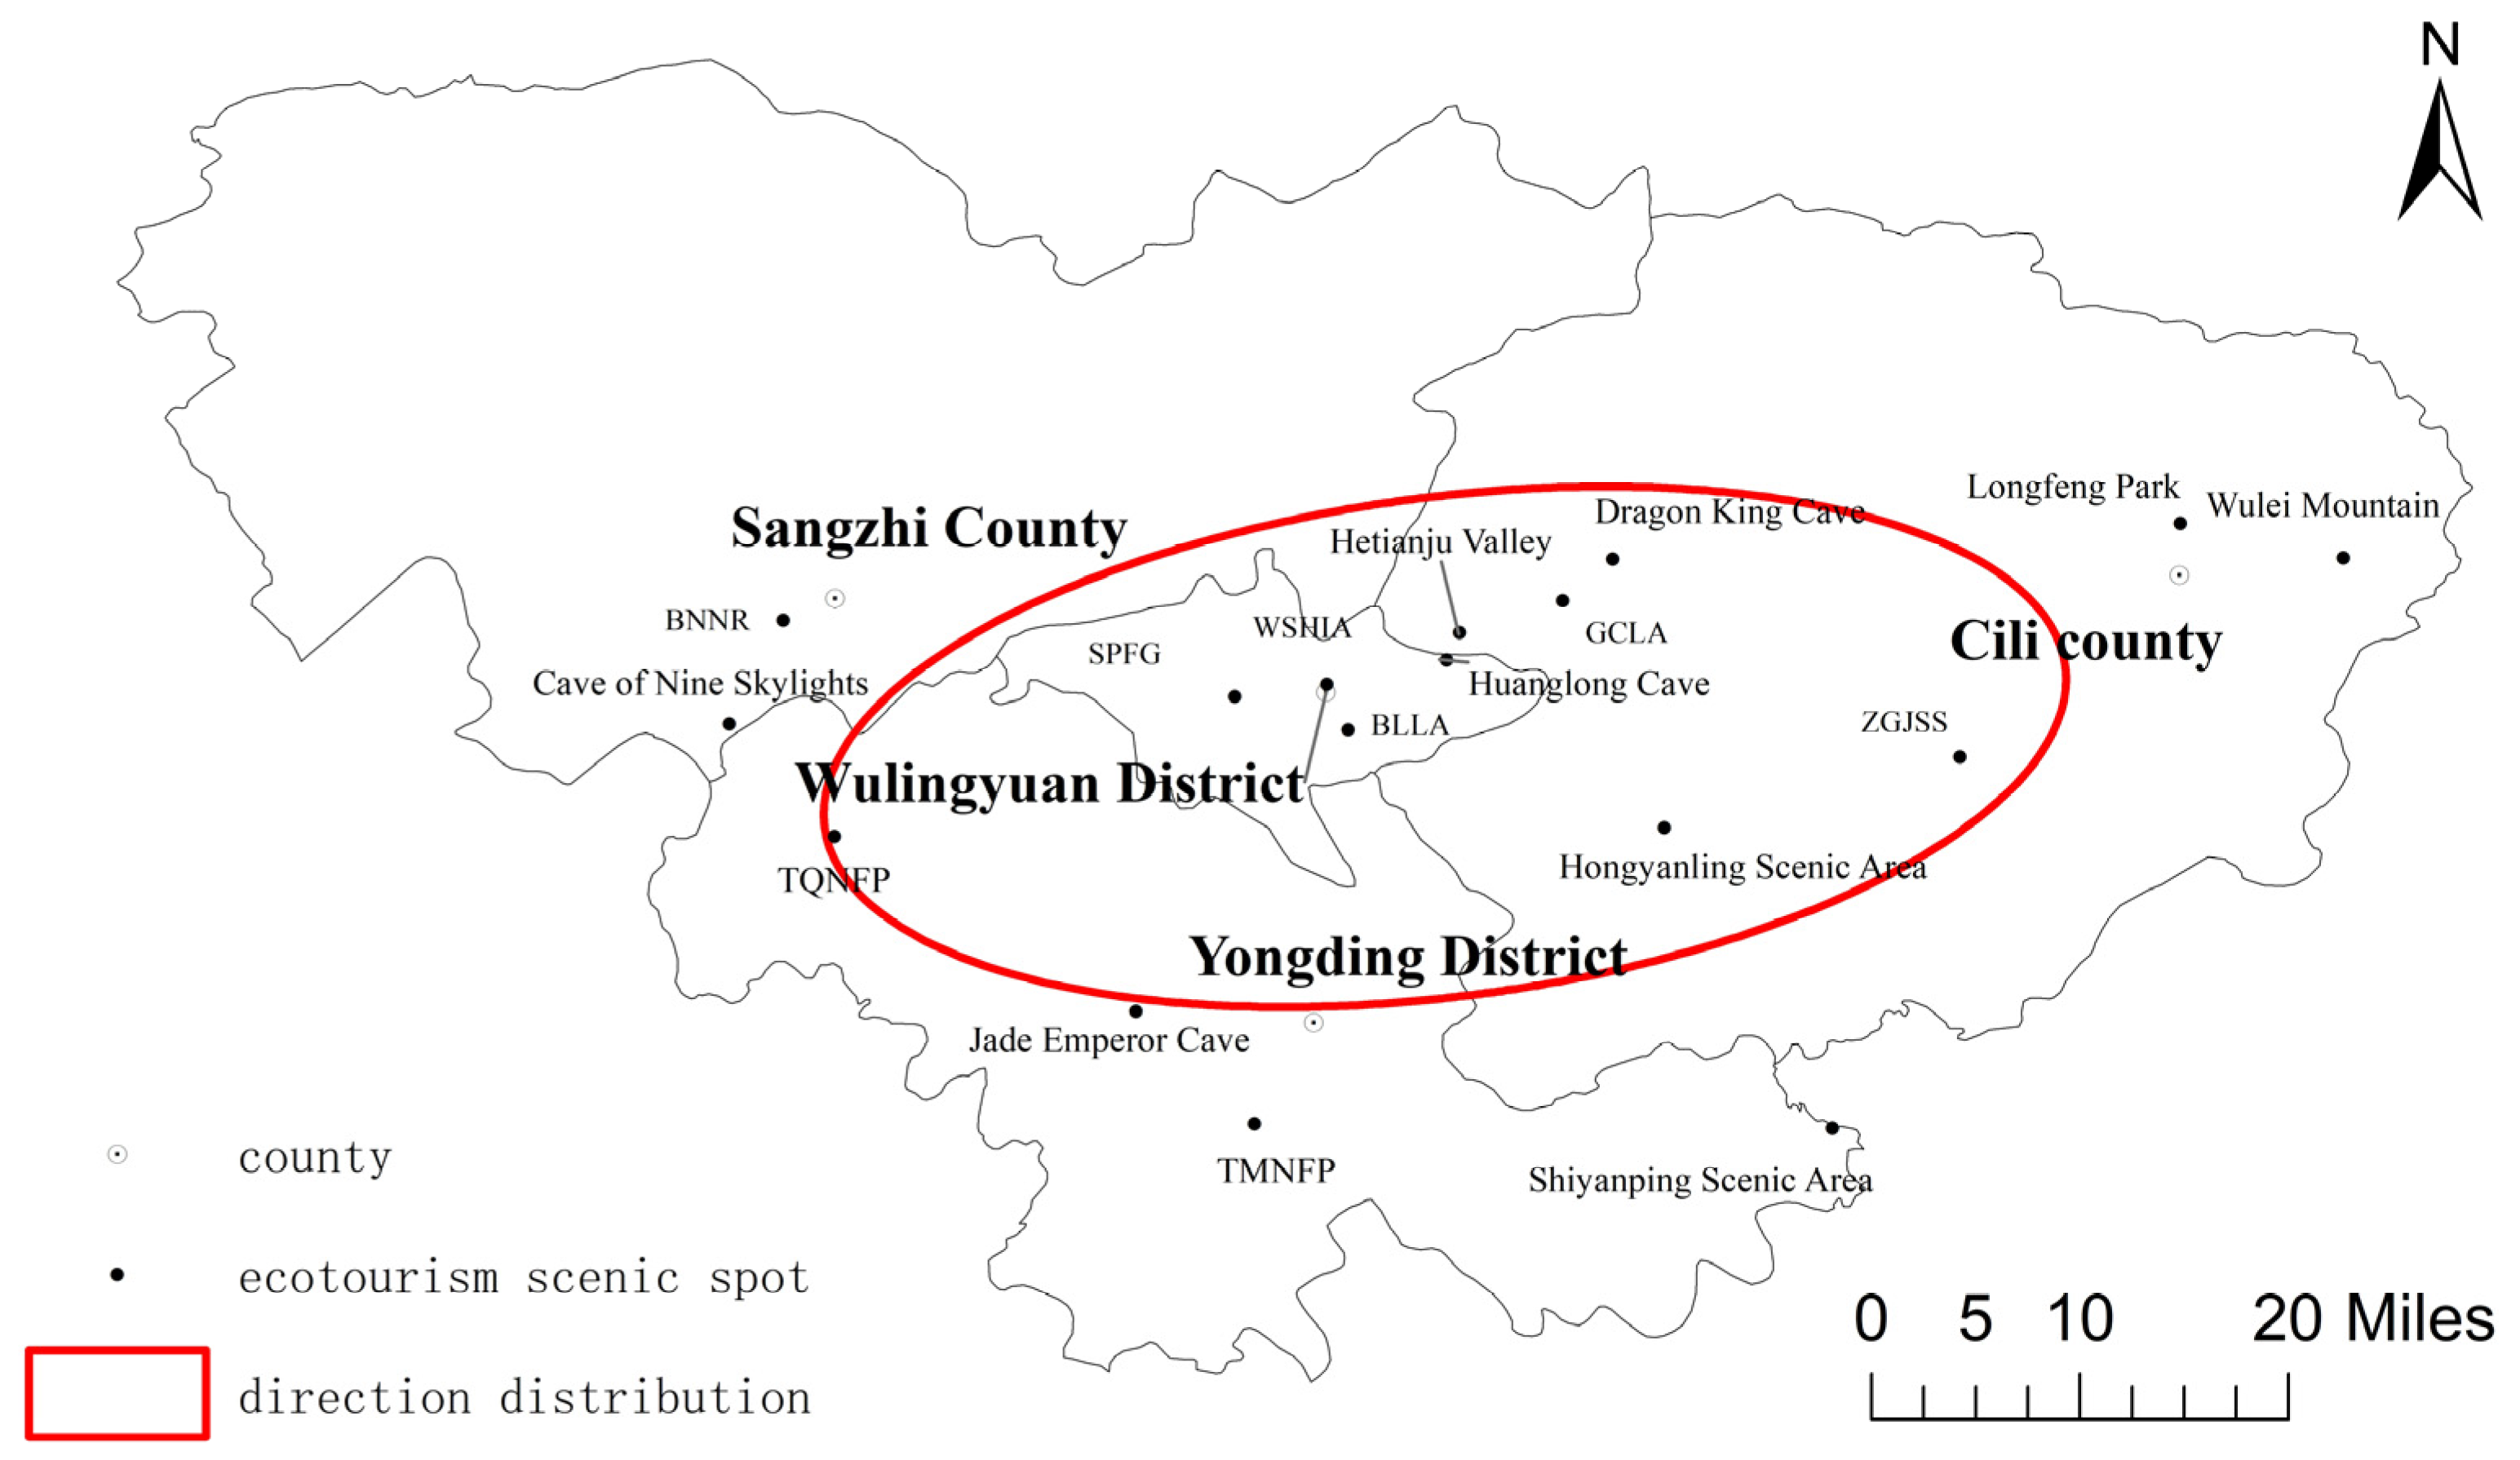
For the distribution of ecotourism sites, the ArcGIS 10.7 software was used to generate the spatial distribution map of Zhangjiajie ecotourism attractions (
Figure 3). In the figure, the rotation angle of the standard deviation ellipse is 82.68°, indicating that the current Zhangjiajie ecotourism scenic spot is geographically distributed from southwest to northeast. WSHIA, Huanglong Cave, and Baofeng Lake Landscape Area (BLLA) are located close to the center point of the standard deviation ellipse, which means that in terms of geographical distribution, these sites are located in the central region.
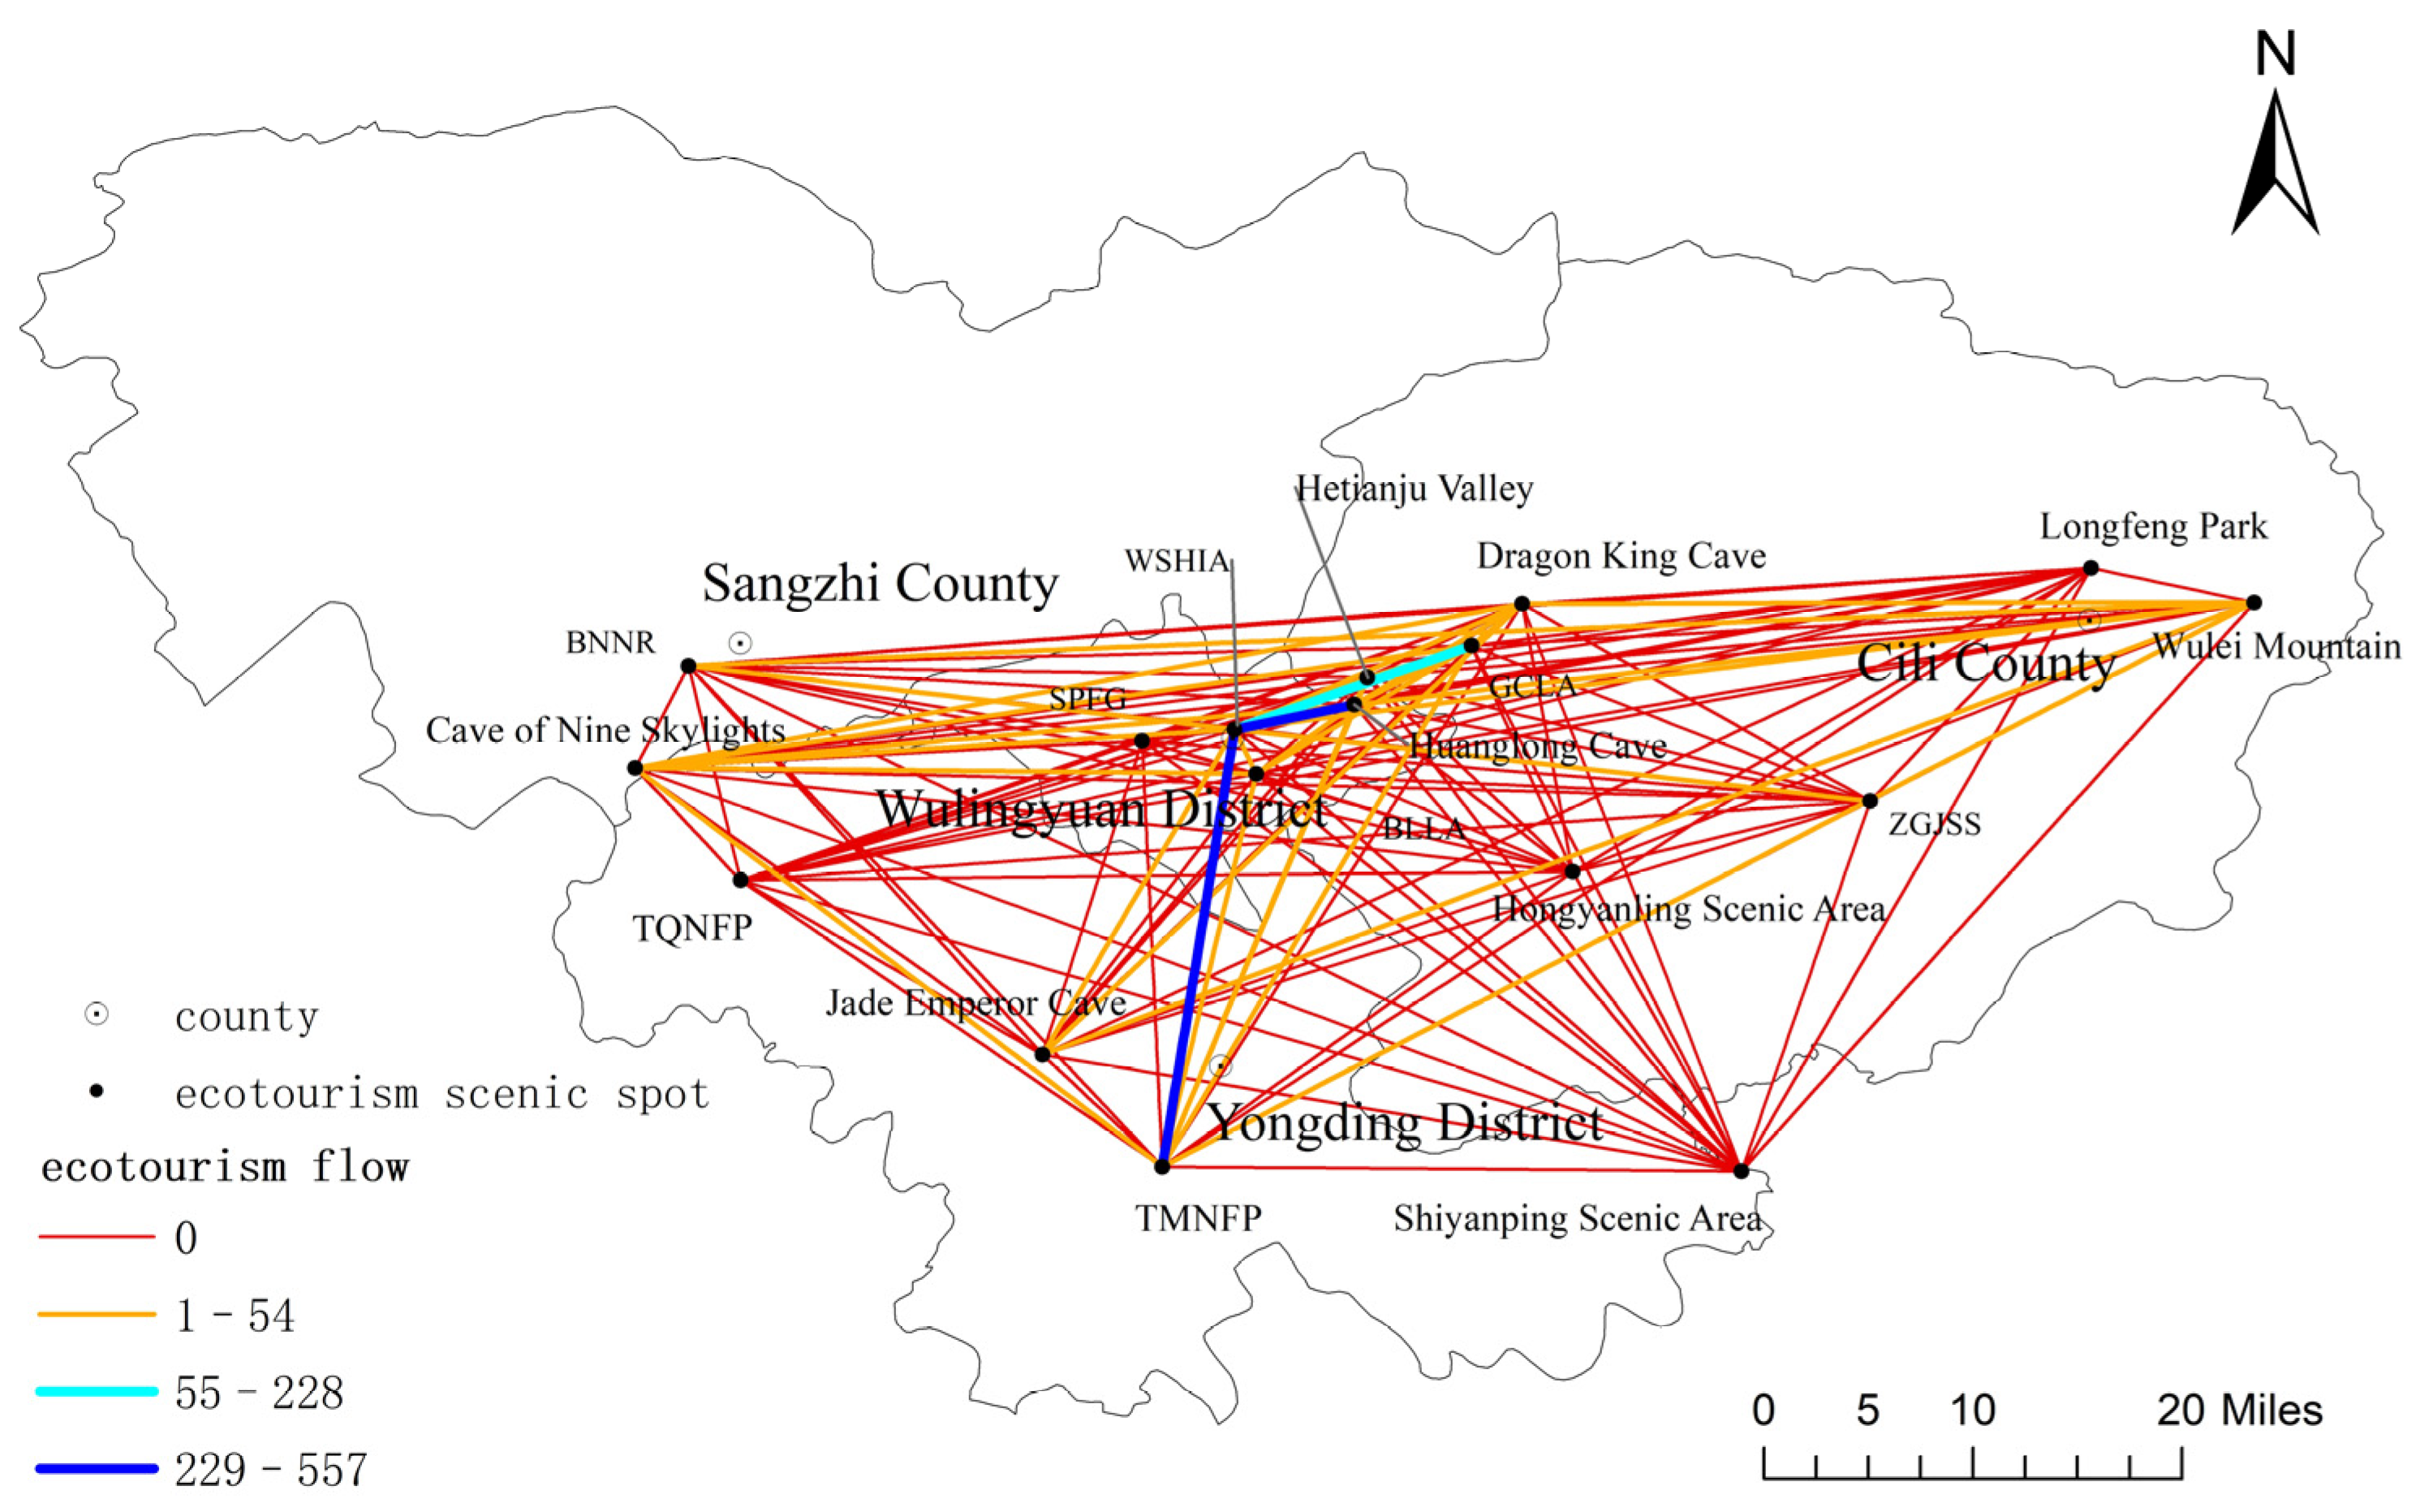
ArcGIS 10.7 was also used to draw the spatial structure map of Zhangjiajie’s ecotourism flow. As shown in
Figure 4, the ecotourism flow of Zhangjiajie is distributed at the “core-edge” polygonal level. The WSHIA, TMNFP, and Huanglong Cave have a large flow rate and high tourist distribution and form a triangular intensive distribution area with WSHIA–TMNFP–Huanglong Cave as the core. The flow connection between the triangular densely distributed area and the scenic spots is significantly stronger in Cili County than in Sangzhi County. This is mainly due to the geographical location of scenic spots in Sangzhi County, being far away from the densely distributed tourist flow areas and having a low level of development.
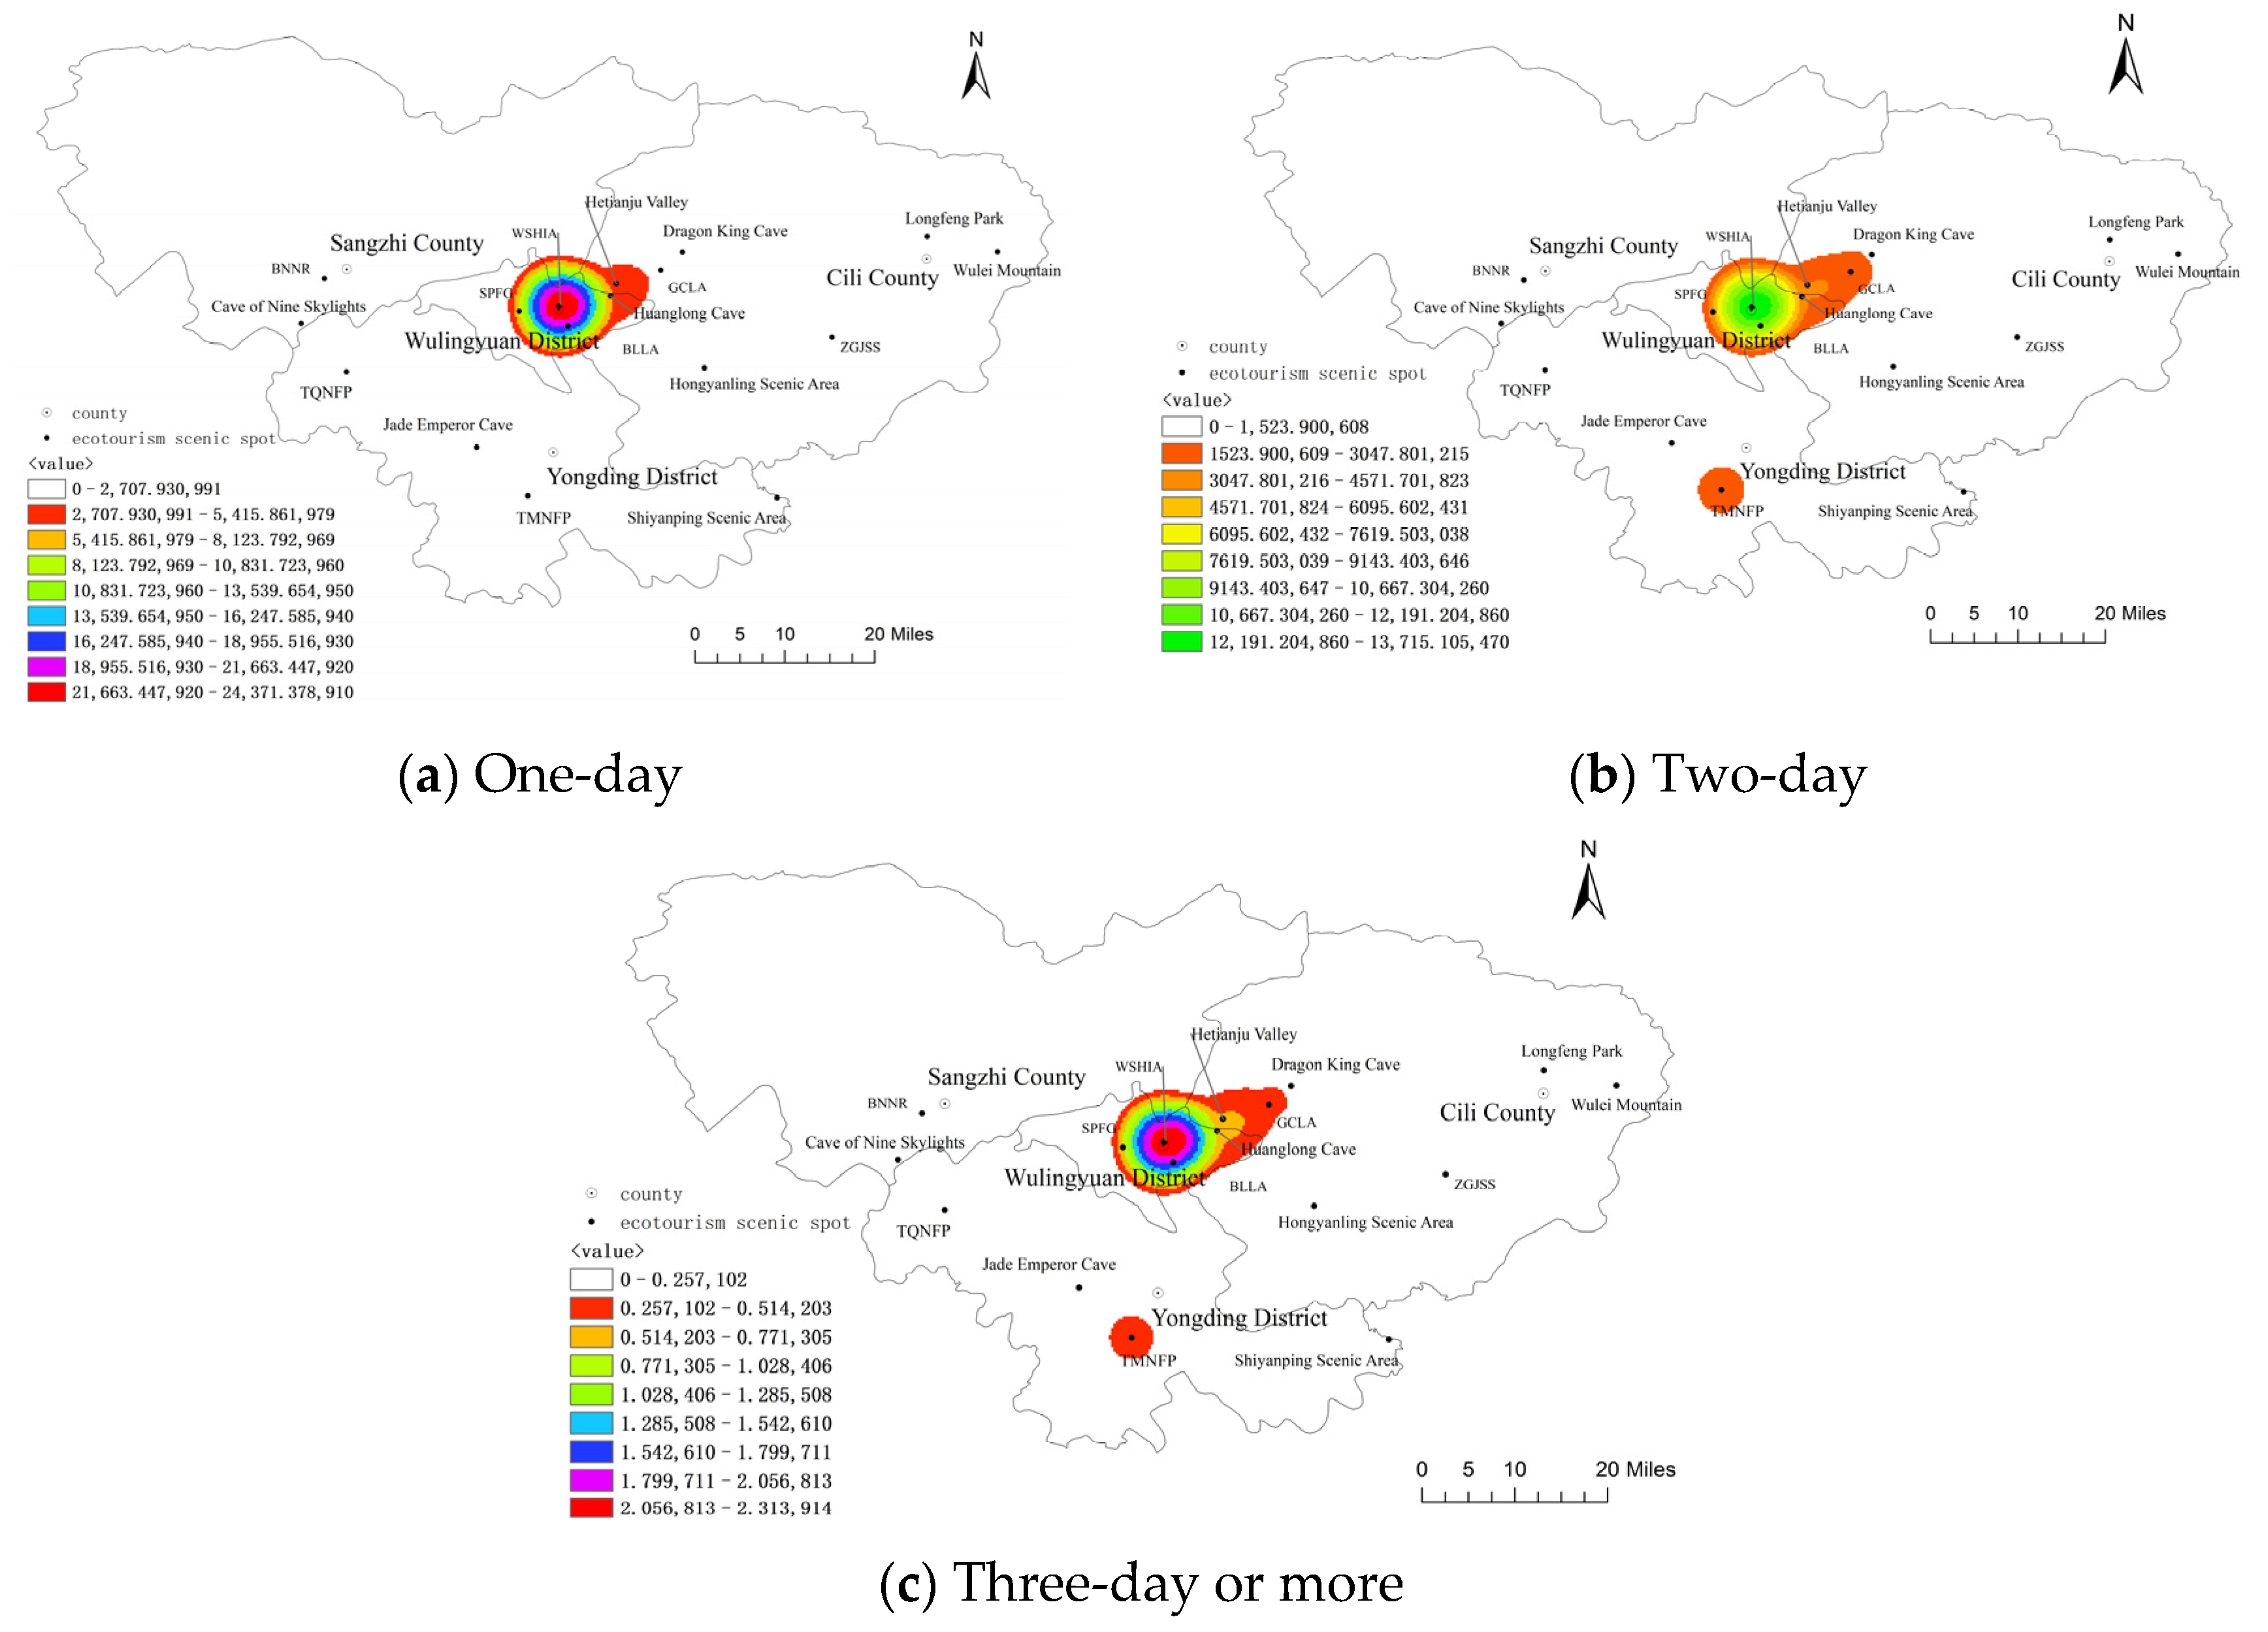
The spatial structure diagrams of ecotourism flow under different travel lengths of stay were then generated for Zhangjiajie (
Figure 5). As shown in the figure, the scope of Zhangjiajie’s ecotourism flow is affected significantly by the LoS. Trips lasting for three days or more have contributed to the formation of a densely distributed area, the WSHIA–TMNFP–Huanglong Cave ecotourism flow. Single-day and two-day tourists are mainly concentrated in the WSHIA, and its connections with other scenic spots are weak. In general, tourists are inclined to spend greater time visiting more appealing scenic spots, preferring well-known tourist locations. This is why the WSHIA–TMNFP–Huanglong Cave ecotourism flow has become a densely distributed area.
3.2.2. Spatial Hierarchical Structure of Ecotourism Flow
Table 4 summarizes the calculated values for the centrality of the ecological tourist attractions in Zhangjiajie. Using the computed values, the scenic spots were then divided into three levels. The first level comprises WSHIA, Huanglong Cave, TMNFP, and GCLA, with centrality far greater than 100. The four scenic spots are located in the center of the densely distributed ecotourism flow area and are characterized by convenient transportation systems and well-established tourism infrastructure. The second level consists of the center degree of BLLA and the Cave of Nine Skylights, with centrality between 10–100. BLLA is located between central scenic spots and has convenient transportation, excellent tourism resources, and particular tourist appeal. As for the Cave of Nine Skylights, although it is far from the central scenic area and has poor traffic conditions, it has more prominent tourism resources and a certain attraction. Level three includes the Jade Emperor Cave, Badagongshan National Nature Reserve (BNNR), the Zhangjiajie Ground Joint Scenic Spot (ZGJSS), Longfeng Park, the Hongyanling Scenic Area, Sandstone Peak Forest Geopark (SPFG), Tianquanshan National Forest Park (TQNFP), and the Shiyanping Scenic Area, with centrality values of less than 10. These scenic spots are far from central scenic spots and have weaker mobile connectivity. These sites are mostly dispersed in the periphery and are considered general scenic spots.
3.2.3. Network Flow Characteristics of Ecotourism Nodes
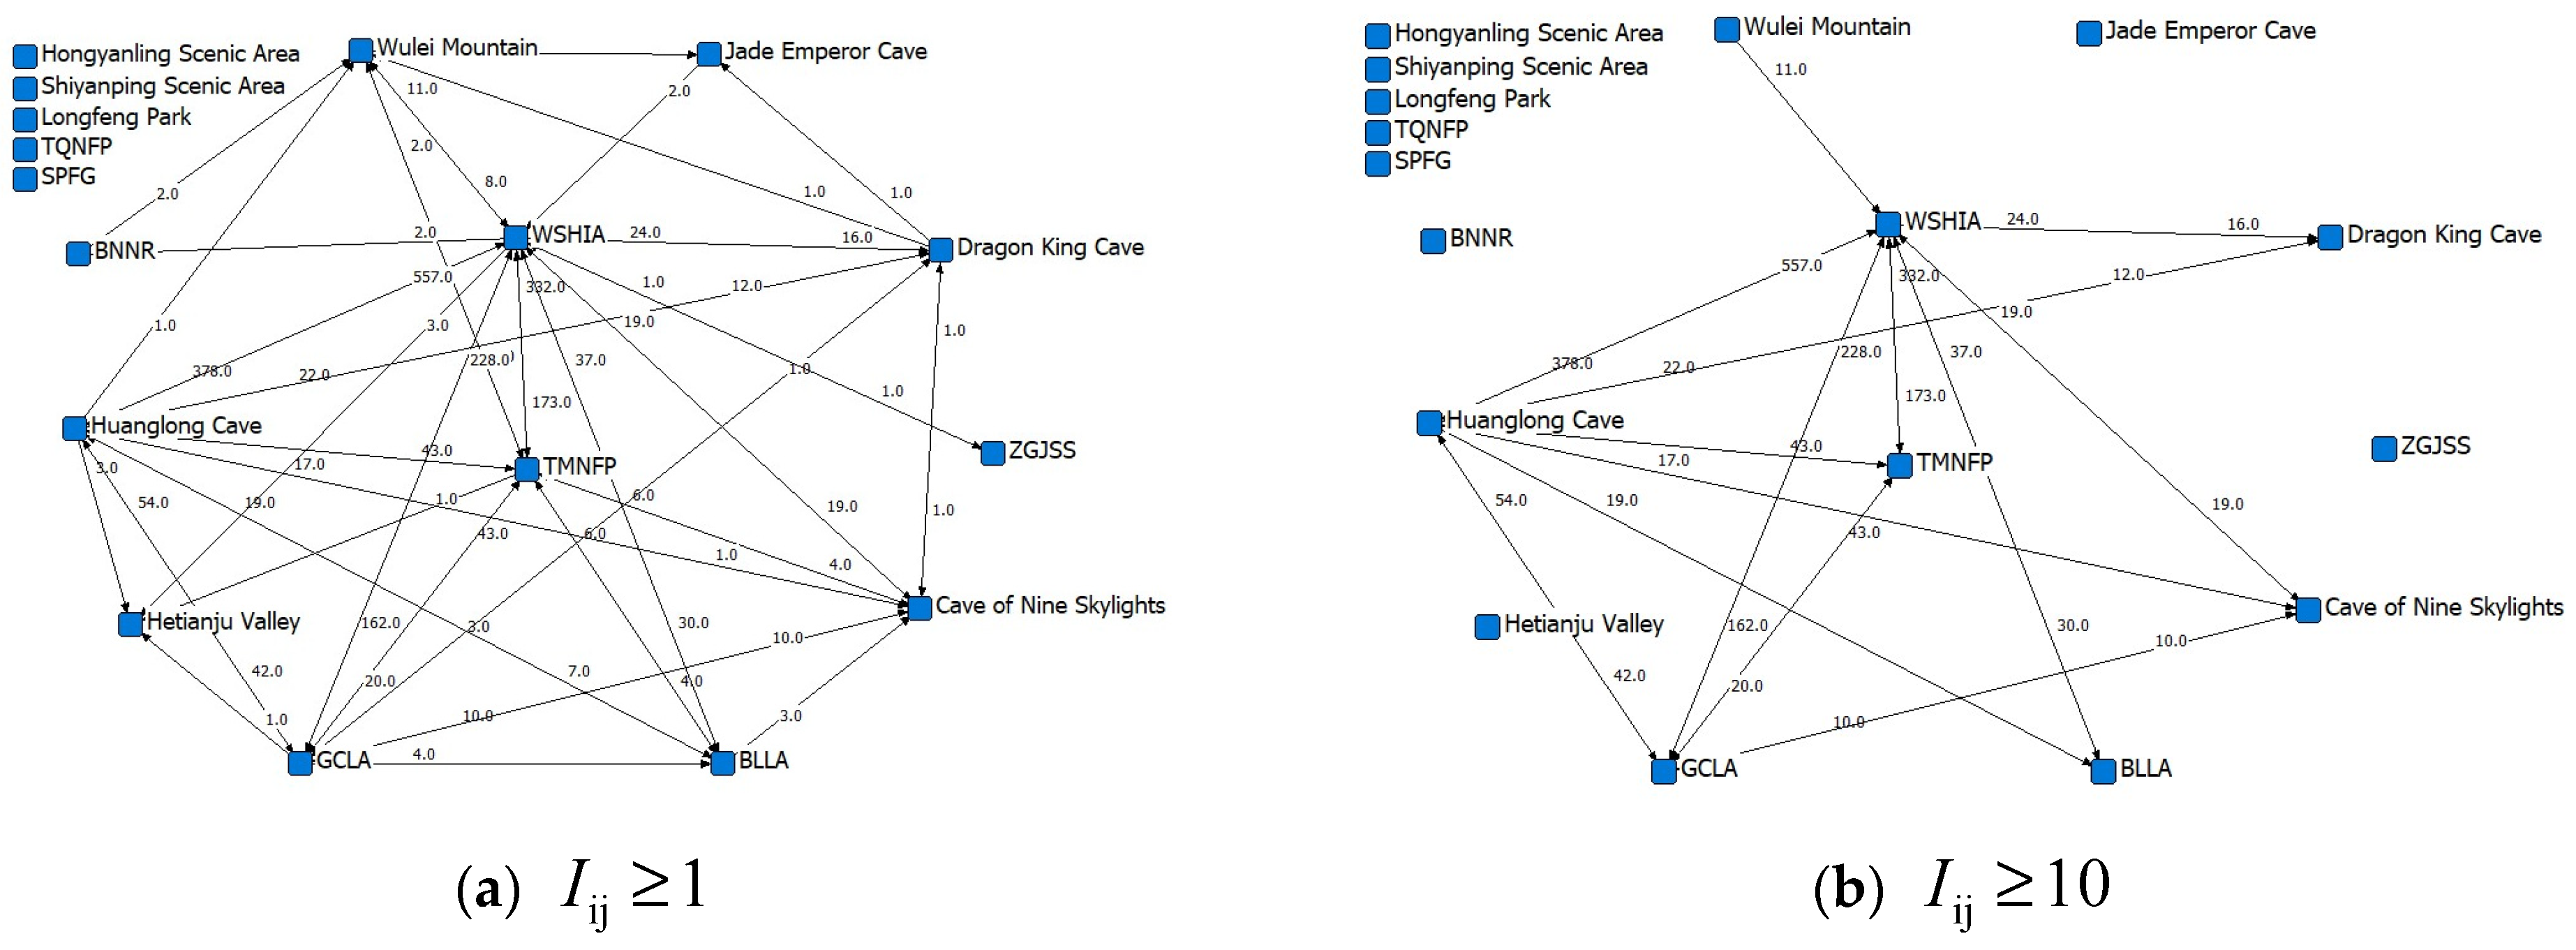
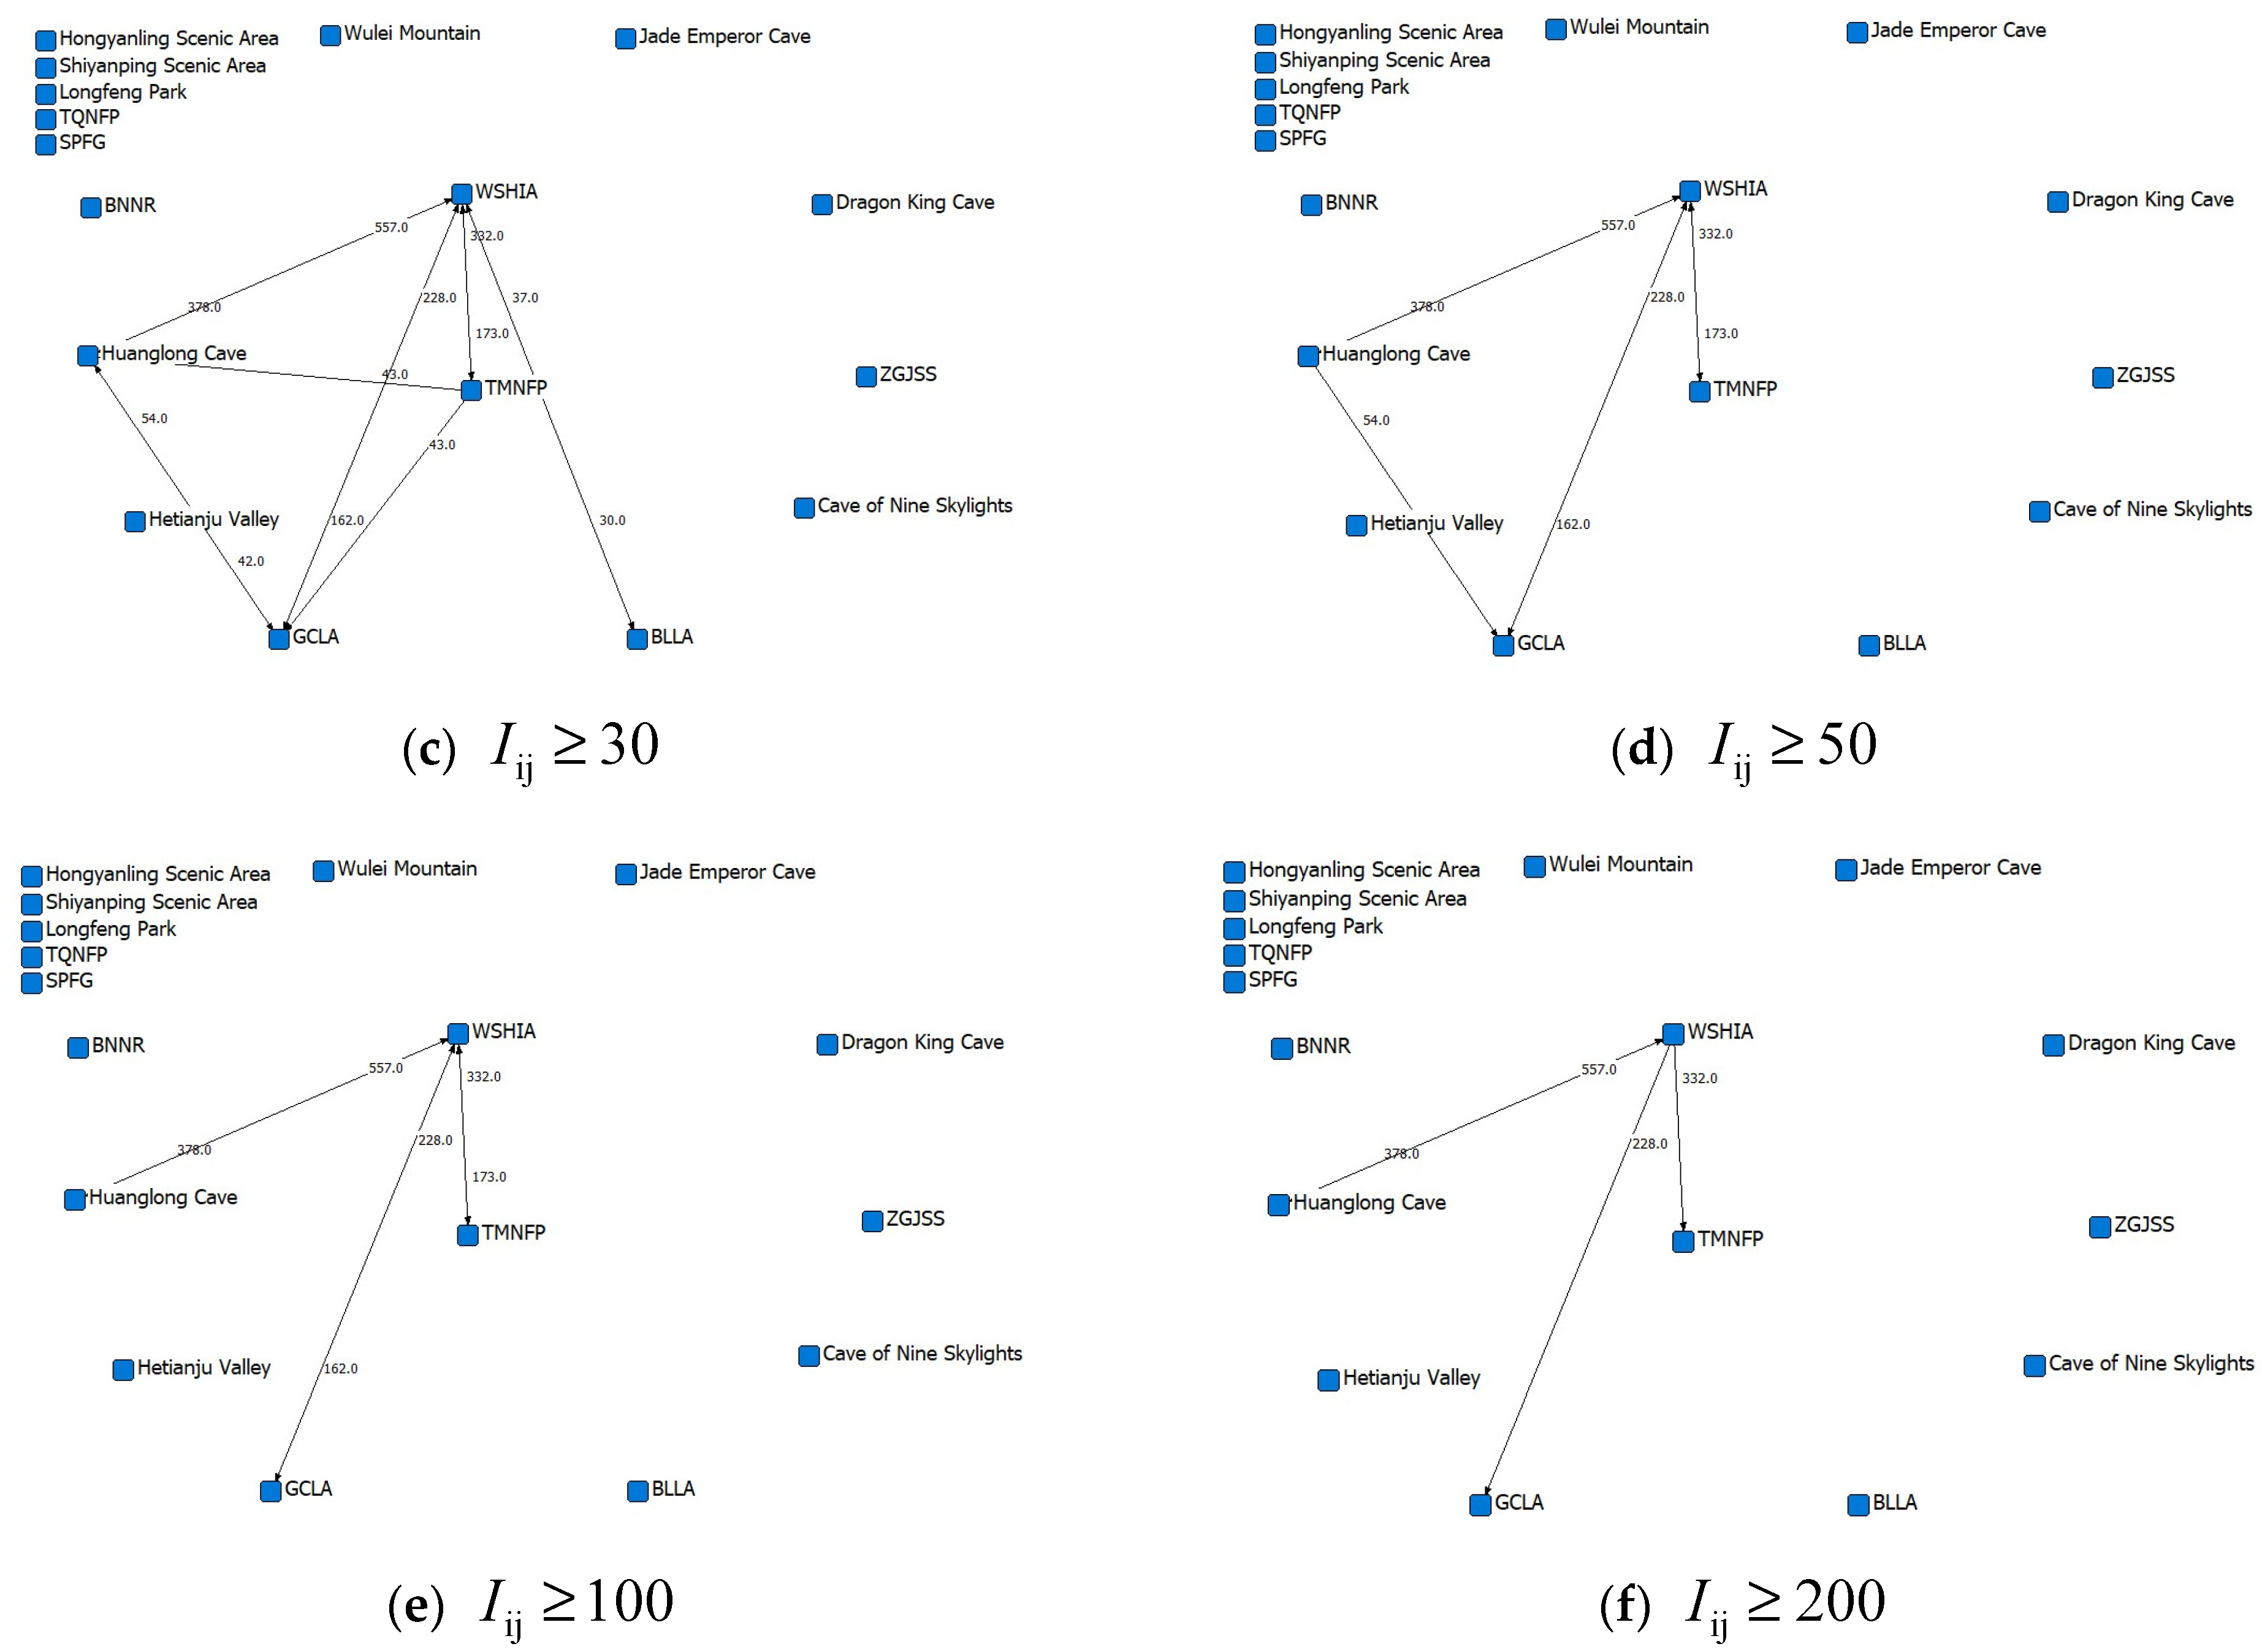
The paths between scenic spots were divided into six levels:
,
,
,
,
,
, and the flow network diagram was generated using the Netdraw software (
Figure 6). The square area in the figure represents the sum of the inflow and outflow of the nodes, while the connection between nodes represents the tourist flow. The thicker the line, the closer the connection. As shown in the figure, there is no flow connecting TQNFP, SPFG, the Shiyanping Scenic Spot, Longfeng Park, and the Hongyanling Scenic Area into other nodes, which means that there is no effective path. As the flow threshold increases, the number of effective nodes and paths constantly decreases. When the flow threshold reached 200, the number of paths was reduced to four, namely, WSHIA→GCLA, WSHIA→TMNFP, WSHIA→Huanglong Cave, Huanglong Cave→WSHIA. Three of the four paths flow out from WSHIA to other scenic spots, while the other flows into WSHIA. This suggests that the current ecotourism in Zhangjiajie is mainly based on WSHIA, which serves as the core, and radiates to other scenic spots.
3.3. Temporal and Spatial Distribution Characteristics of Ecotourism Flow
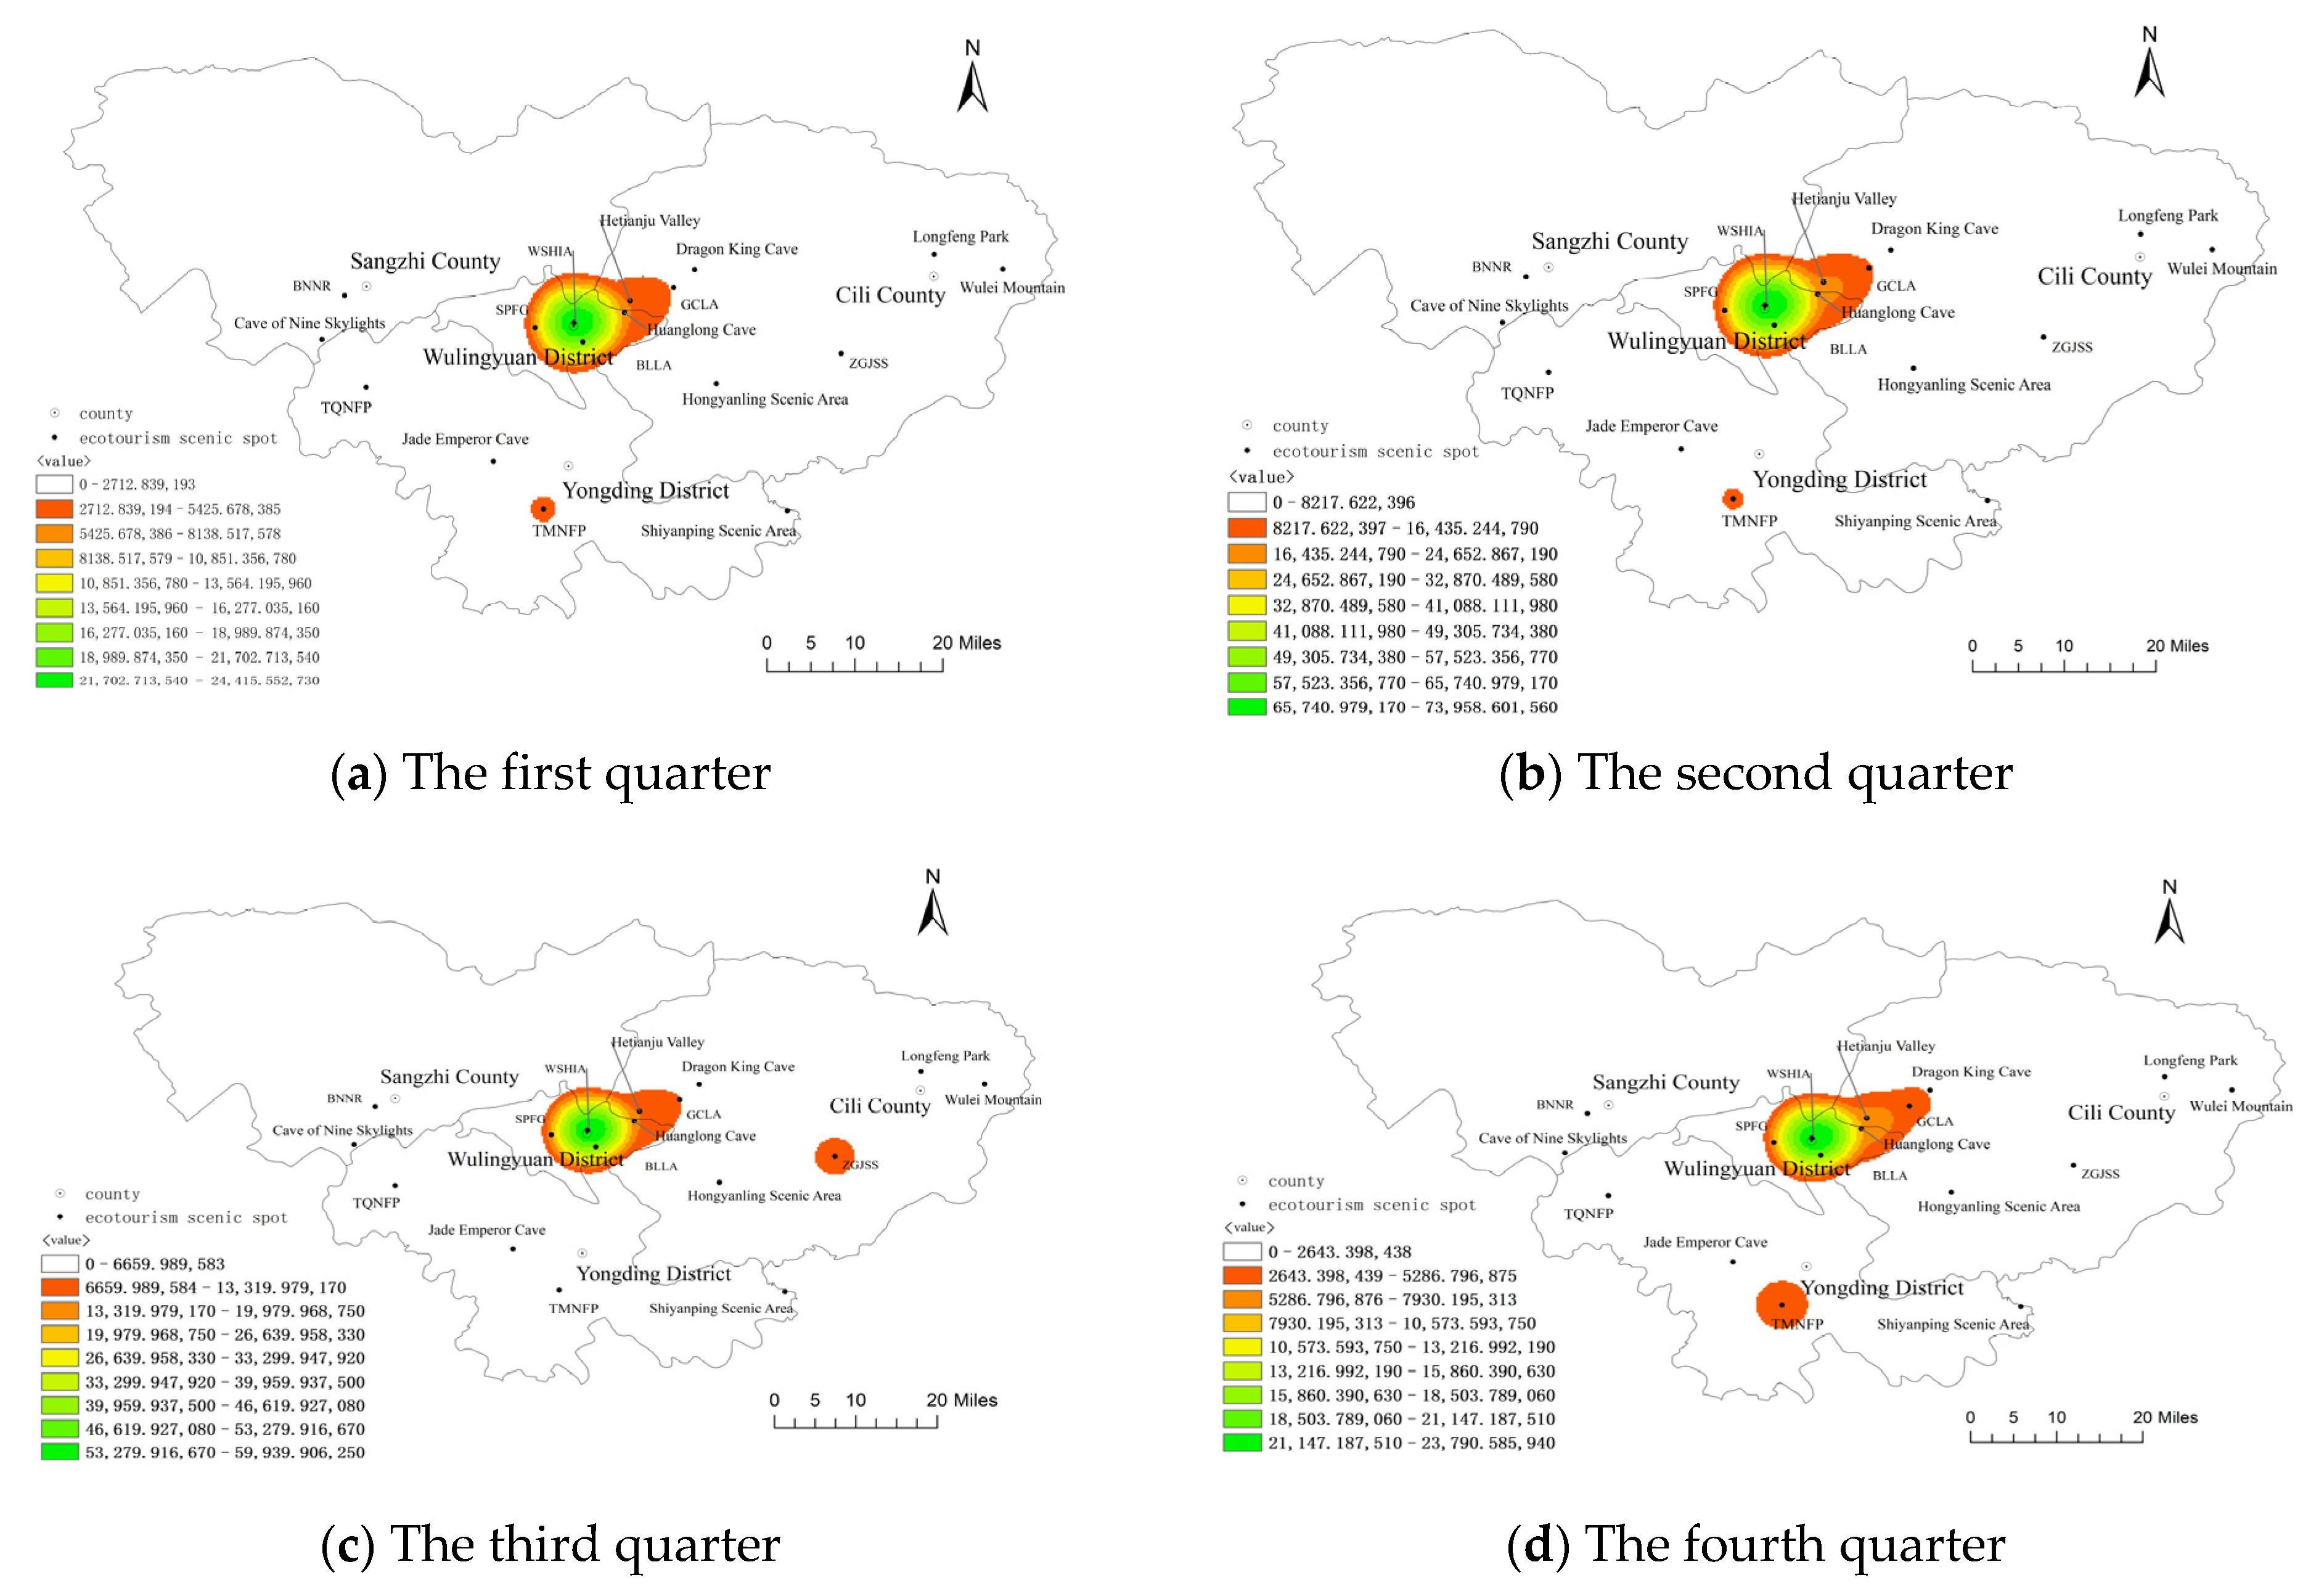
Using the kernel density analysis method implemented in ArcGIS 10.7, the tourist flow for the 17 scenic spots was divided into four groups (i.e., first quarter, second quarter, third quarter, and fourth quarter) based on date of travel. The classification was then used as value fields for Cluster 1, Cluster 2, Cluster 3, and Cluster 4. The tourist flow for each scenic spot was then divided into three groups (i.e., one-day, two-day, three-day and above) based on the LoS. The clustering results were used for the value fields of Population5, Population6, and Population7. Finally, the kernel density values at different search radii (i.e., 0.1 km, 0.2 km, 0.3 km, …, 1 km) were calculated. The results show that when the search radius was set to 0.1 km, the spatial difference in tourism flows was most significant, and the difference could be obtained. Thus, the ecotourism flow core density maps were generated for the different lengths of stay (
Figure 7) and different seasons (
Figure 8).
(1) Time-spatial distribution characteristics of tourism
As shown in
Figure 7, the increase in travel LoS causes the scale and scope of travel around WSHIA to expand. For one-day and two-day tours, WSHIA is the primary choice among tourists. Compared with one-day tourists, the activity range among two-day tourists expanded considerably. Scenic spots around WSHIA showed varying agglomeration levels, with BLLA and Huanglong Cave having the most significant changes. TMNFP also exhibited strong agglomeration characteristics. Compared with the two-day tourists, the activity scope among the three-day tourists did not change much; the WSHIA and its surrounding scenic spots and the TMNFP are still the major tourist destinations. The results indicate that WSHIA is the core area for ecotourism flow in Zhangjiajie and has significant radiating effects. As the LoS increases, the connection intensity between WSHIA and other scenic spots also increases. However, on the whole, the driving and radiation effect of WSHIA is still dominated by the surrounding scenic spots, and the effects on distant ecotourism scenic spots are limited.
(2) Seasonal–spatial distribution characteristics
As shown in
Figure 8, the spatial density distribution of ecotourism flows in Zhangjiajie has significant seasonality and imbalance. Temporally, there are significant differences in the spatial distribution of ecotourism flow at different times of the year. For the first and second quarters, the Wulingyuan scenic spot is highly concentrated, and the Tianmen Mountain National Forest Park is characterized by a higher concentration of “big and small” dual spaces. The tourist activities comprise mainly visits to the mountainous scenic spots in the Wulingyuan and Yongding districts. The ecotourism scenic spots in the Cili and Sangzhi counties are not very agglomerated.
In the third quarter, ZGJSS showed strong agglomeration, replacing TMNFP and forming a “big-small” dual-core spatial distribution structure with WSHIA. On the one hand, this change is related to the local climate. The third quarter coincides with Zhangjiajie’s sweltering summer season. ZGJSS, which has a significant summer shelter function, becomes more attractive to tourists. On the other hand, the third season includes the long summer vacation, when the number of tourists increases and the market demand expands.
The fourth quarter showed a “large-small” dual-core spatial distribution structure, with WSHIA and TMNFP as the core and the ecotourism flow trending further to Cili County (mainly GCLA). The fourth quarter climate is cold, and the city enters its tourism season, and travel to ecotourism scenic spots declines. However, with WSHIA’s and TMNFP’s unique winter rime landscape, their ecotourism flow remains considerable. The GCLA features the Glass Bridge as the major attraction and has introduced special winter policies to stimulate ecotourism, such as price reduction and separate tickets sales for the Glass Bridge.
The results also show a considerable imbalance between districts and counties. The ecotourism growths in the Wulingyuan and Yongding districts were highest, followed by Cili County, while Sangzhi County had the worst development trend. With unique attractions in TMNFP and WSHIA, the Yongding and Wulingyuan districts are extremely attractive for ecotourism, driving coordinated development in the surrounding ecotourism scenic spots. GCLA and Hetianju Valley in Cili County are near the WSHIA and have distinct resource characteristics, which increase ecotourism flows. However, Sangzhi County’s ecotourism destinations are far from the WSHIA, the tourism advantages of its resources are not as prominent, and its main characteristics are not well-defined, causing weaker demand for ecotourism. In addition, the development level of each ecotourism scenic spot within the district and county varies considerably. Taking Cili County as an example, as shown in
Figure 8, Hetianju Valley and GCLA have strong gathering capacities. In the third and fourth quarters, ZGJSS showed strong agglomeration ability, while Wulei Mountain, Longfeng Park, Dragon King Cave, and the Hongyanling Scenic Area have average gathering capacities. This shows that although Cili County has developed a number of ecotourism scenic spots, their development levels are far apart, and most of its scenic spots do not have enough tourist attractions.
3.4. Coupling Characteristics of Ecotourism Flow and Traffic Accessibility
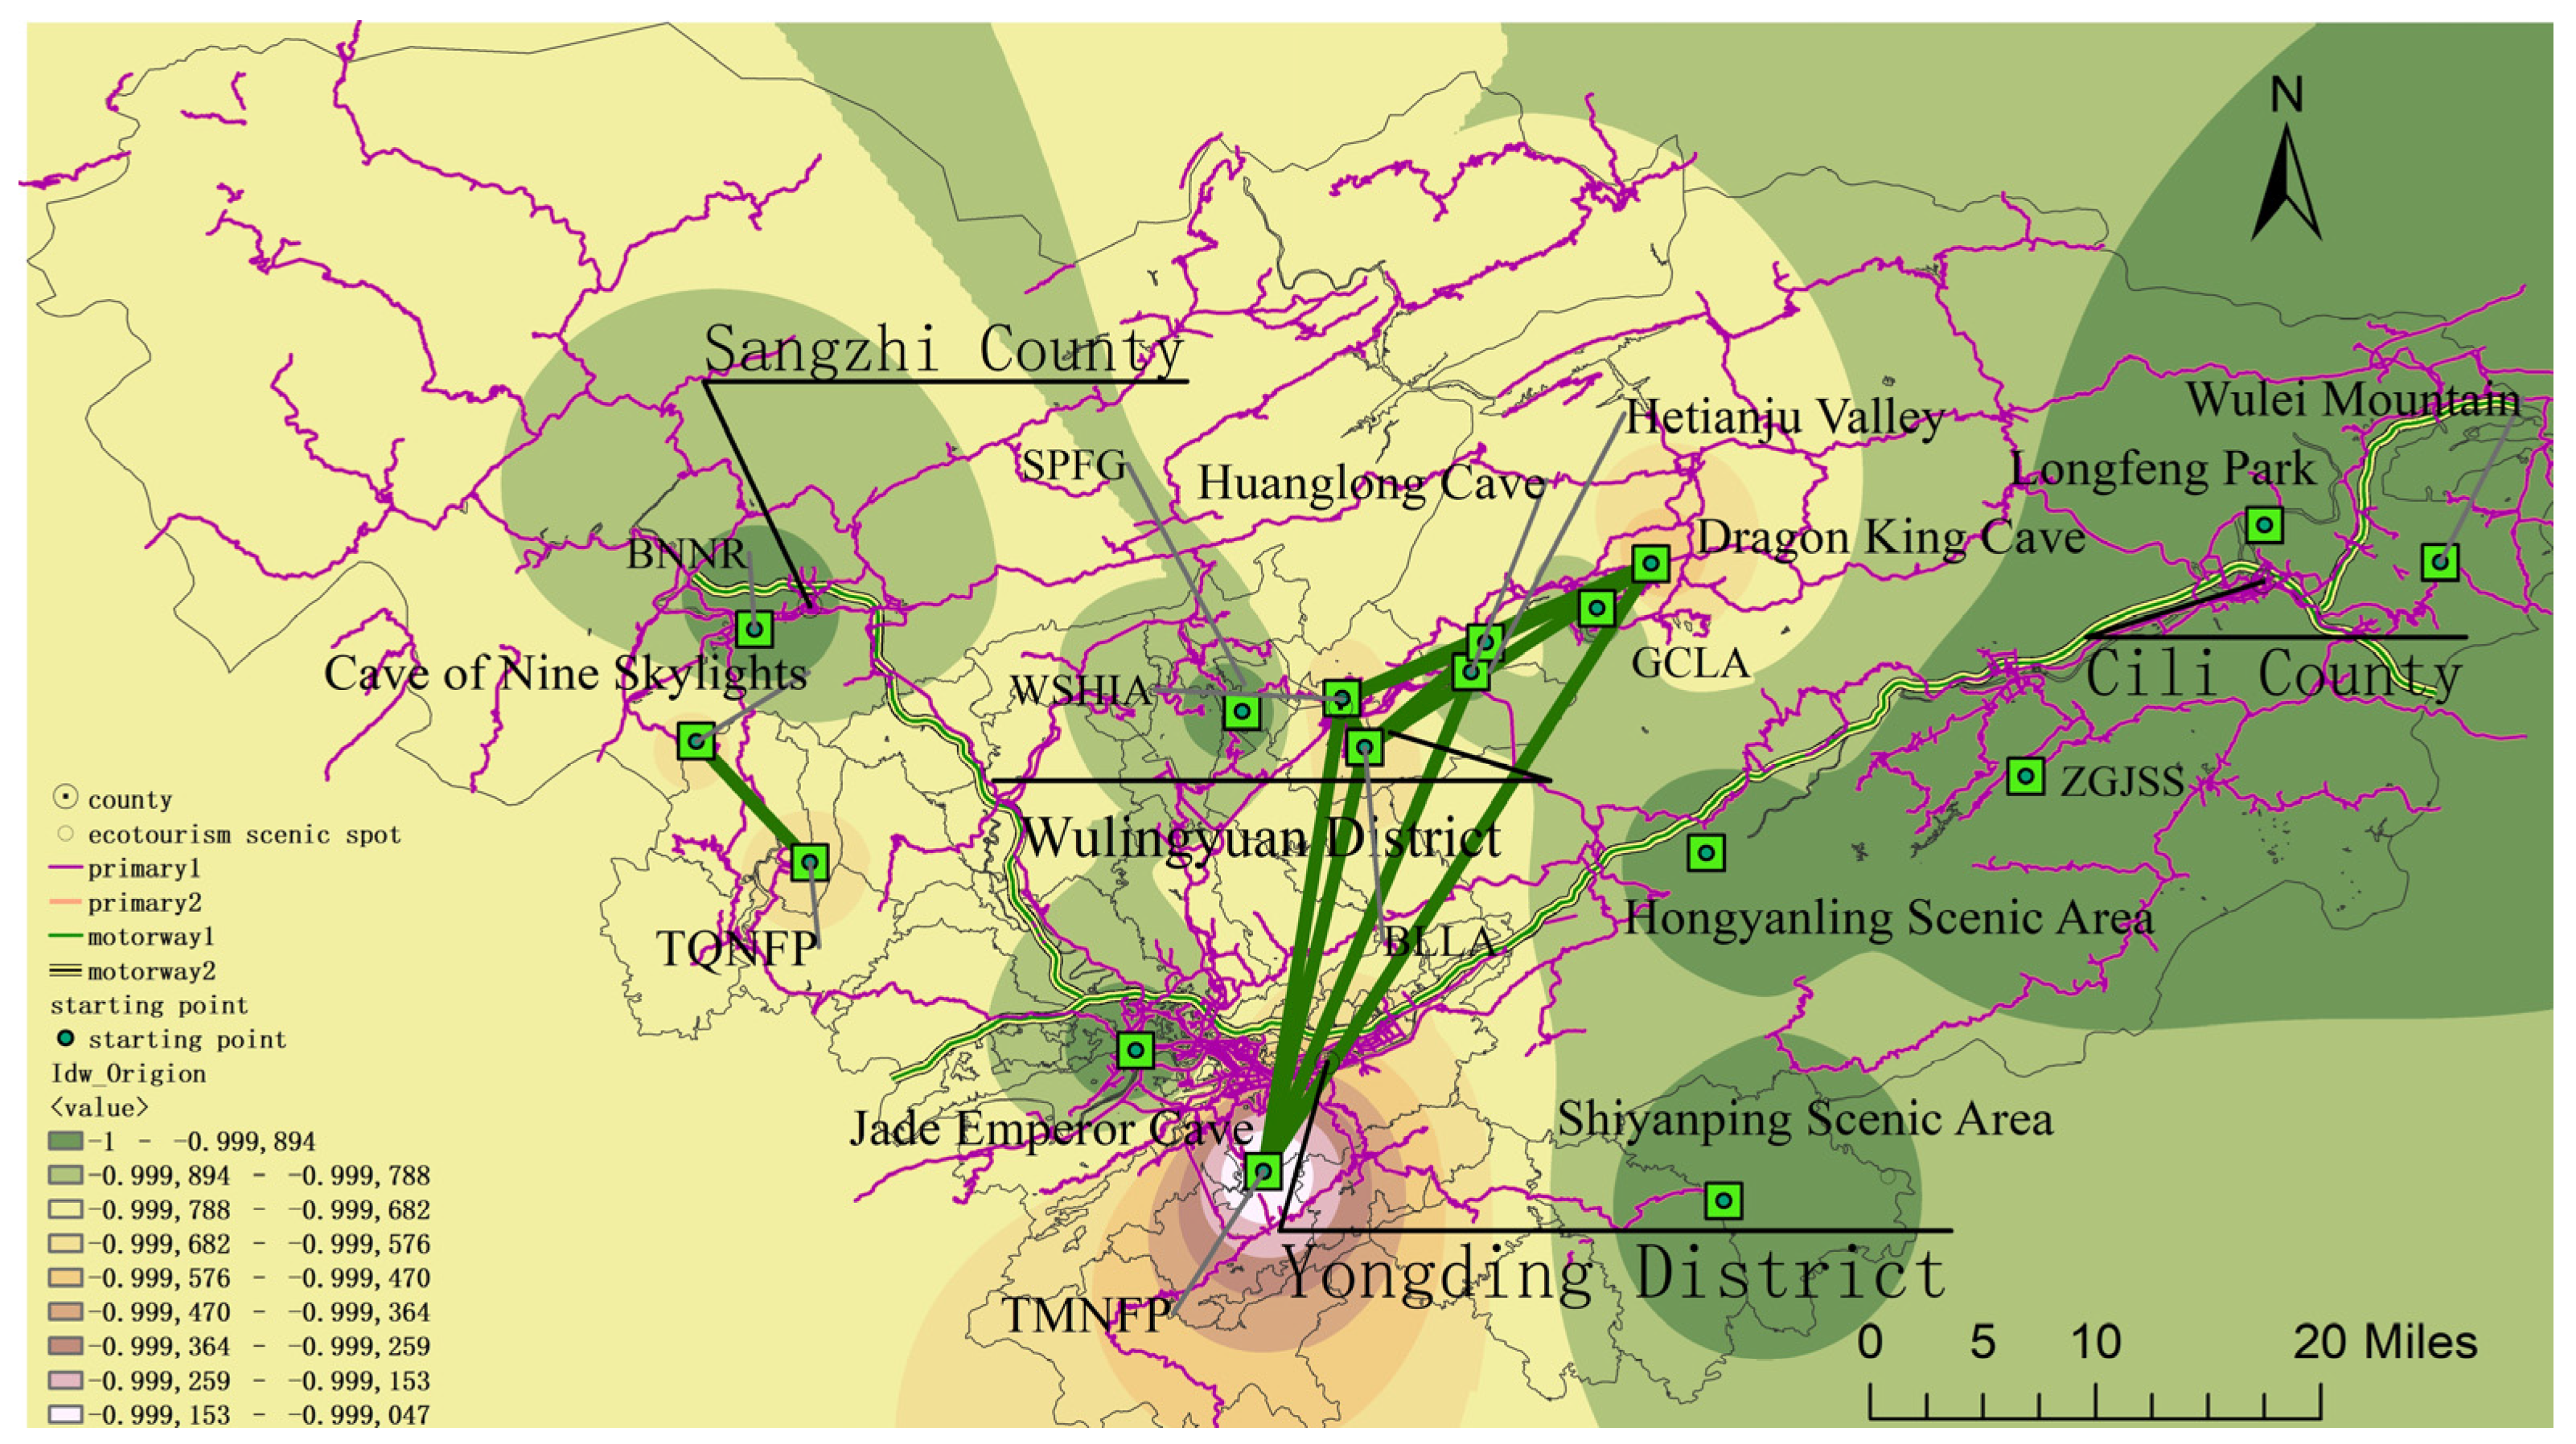
With the help of Arc GIS 10.7 software, the traffic road network of the 17 ecotourism scenic spots was analyzed, and the traffic accessibility and road network map for Zhangjiajie Ecotourism scenic spots was generated (
Figure 9). The coupling model was then used to calculate the coupling degree and coupling coordination degree of the ecotourism flow and traffic accessibility, and the summary of results is presented in
Table 5.
Eight ecotourism nodes were at high levels of coupling: TMNFP, Huanglong Cave, ZGJSS, Wulei Mountain, Longfeng Park, Hetianju Valley, the Hongyanling Scenic Area, and WSHIA, accounting for about 47.06%. Among them, Huanglong Cave and WSHIA were in a highly coordinated stage, where they meet the needs of ecotourism flow while achieving orderly development in transportation and promoting interaction and coordination. The TMNFP was in a moderate coordination stage, and its ecotourism flow and traffic accessibility promote each other. ZGJSS, Wulei Mountain, Longfeng Park, Hetianju Valley, and Hongyanling were in a serious imbalance stage. Among them, the traffic accessibility of Zhangjiajie’s ground fissure scenic spot and Wulei Mountain was poor, which seriously restricts ecotourism demand. Longfeng Park, Hetianju Valley, and the Hongyanling Scenic Area had low ecotourism flows, lagging considerably in traffic accessibility.
Three ecotourism nodes were found to be in the running-in stage, namely BLLA, Cave of Nine Skylights, and Dragon King Cave, accounting for 17.65%. The BLLA and Cave of Nine Skylights are in the basic and moderate stages of coordination. The two major scenic spots have started to focus on coordinating the relationship between ecotourism flow and traffic accessibility in their development. BLLA has increased the demand for ecotourism flow through a number of marketing measures, improving ecotourism flow to catch up with traffic accessibility. The Cave of Nine Skylights has been gradually advancing its infrastructure so that transportation accessibility could gradually address ecotourism demand. Dragon King Cave was found to be in a severe imbalance stage. While there is a strong balance and coordination relationship between ecotourism flow and traffic accessibility, their matching degree remains low, and traffic accessibility significantly affects ecotourism demand.
Three ecotourism nodes were found to be in the antagonism phase, namely TQNFP, Jade Emperor Cave, and the Shiyanping Scenic Area, accounting for about 17.65%. At the level of coupling and coordination, the three nodes are all in the moderate imbalance stage. While there is certain interaction between ecotourism flow and traffic accessibility, the degree of effect needs to be strengthened. Likewise, there a significant mismatch remains between the current ecotourism flow and transportation accessibility development in the three ecotourism nodes, and the mutual influence has been largely restricted.
There are three ecotourism nodes in the low-level stage: GCLA, SPFG, and BNNR, accounting for 17.65%. The level of coupling and coordination of the three is also in the stage of moderate imbalance, and its ecotourism flow and traffic accessibility are in an unrelated state and developing disorderly.
On the whole, Zhangjiajie’s ecotourism flow has a high degree of coupling with traffic accessibility, while the overall degree of coupling and coordination is low. There was a strong interaction between Zhangjiajie’s ecotourism flow and transportation accessibility, but there remains a serious mismatch between Zhangjiajie’s ecotourism demand and transportation accessibility, and the mutual influence is mainly restricted.
4. Discussion
The results show pronounced seasonal differences in ecotourism flow in Zhangjiajie. In the off-season, the ecotourism flow in Zhangjiajie decreases considerably. Previous studies have shown that prominent seasonal differences can bring adverse effects such as economic fluctuation, price increases, and ecological damage [
45]. To mitigate the imbalance between the ecotourism off-season and peak season and promote the sustainable development of its ecotourism, Zhangjiajie should invest in its natural ecological environment and rich folk culture resources. In addition, Zhangjiajie should actively develop other services and industries, including mountain vacations, food entertainment, homestay gathering, health and fitness, cultural experiences, red research, and conference leisure [
46]. More diversified themes and contents have to be developed to form systematic and standardized ecotourism products. The city needs to guide qualified scenic spots to optimize and upgrade its tourism products to become internationally competitive. It also needs to build an international complex tourism product system and comprehensively enhance the attraction of ecotourism to capitalize profits during its peak season and strengthen its off-season.
Our results also show that the development level of ecotourism in Zhangjiajie counties is unbalanced. The Wulingyuan and Yongding districts have the best development trends in ecotourism, followed by the Cili and Sangzhi counties, as is consistent with previous research conclusions [
47]. This imbalance can restrict the sustainable development of ecological tourism in Zhangjiajie. Therefore, the connection and mutual promotion should be further strengthened among various ecotourism scenic spots. The ability of WSHIA to divert interests to other scenic spots should be enhanced to promote the development of “one core, four poles and multiple points” as the tourism pattern for the coordinated development of the city’s ecotourism scenic spots. One core refers to the high-quality tourism development core of Wulingyuan’s core scenic spot. Four poles consist of the growth pole of the Tianmen Mountain International Tourism Culture Pilot Area, Zhangjiajie Grand Canyon International Tourism Economic Zone, Maoyan River International Health and Health Resort, and the Mulberry Plant Ecology and Red Tourism Area. Multipoint refers to the ecotourism nodes within the region.
In addition, given that ecotourism development in the Sangzhi and Cili counties has been lagging, they should intensify their utilization of ecotourism resources, promoting their complementary advantages with the core tourism resources of Yongding and Wulingyuan Districts. They should expand the market together and build an overall regional tourism development pattern of “Samsung arch on the moon” to realize balanced ecotourism development in the city. The “Samsung arch” refers to GCLA of Cili and other eastern routes, Sangzhi west line tourism, and the TMNFP of Yongding District and other southern lines, while “moon” is the core scenic spot of Wulingyuan.
Finally, we also found a serious mismatch between ecotourism flow demand and transportation accessibility in Zhangjiajie, and the mutual influence is restricted, especially in the Cili and Sangzhi counties. The problem of traffic conditions restricting the development has become more prominent. Therefore, Zhangjiajie should rationally plan tourism development and transportation construction based on comprehensive factors, such as factor correlation degree, the internal and external environment, and relevant policies, and properly handle the harmonious symbiotic relationship between the two systems [
48]. Efforts should be made to improve the traffic conditions between Cili County, Sangzhi County, and the Wulingyuan Scenic Area to provide highway access for every county and village [
49] and weaken the influence of geographical location and other factors on the ecological tourism flow in edge scenic areas. Various ecotourism scenic spots should also be upgraded so that the demand for ecotourism flow in each scenic spot gradually matches the accessibility of transportation and develops in a coordinated manner.
5. Conclusions
This study was based on typical online travel data and used ArcGIS spatial analysis and social network analysis to explore and analyze the Zhangjiajie ecological tourist flow space-time distribution, network structure, and traffic accessibility features. By evaluating the differences in the ecological tourism flow for different lengths and the tourist seasons, we found that Zhangjiajie’s ecological tourism is composed mainly of short-term travel and exhibits significant seasonal variations. In general, foreign tourists are more inclined to choose the 3-day tour products, while local and surrounding tourists prefer one-day tour packages. The peak tourism season lasts from March to October, and climate change and the holiday system are important factors affecting the time distribution of ecotourism flow in Zhangjiajie.
GIS spatial analysis was used to analyze the spatial structure characteristics and distribution of ecotourism flow in Zhangjiajie. The results show that in terms of spatial structure, Zhangjiajie’s ecotourism flow has a core-periphery polygonal distribution, forming a high-density ecotourism flow area in “WSHIA–TMNFP–Huanglong Cave”. The ecotourism flow in Zhangjiajie can be divided into three levels according to the center degree. The WSHIA, Huanglong Cave, TMNFP, and GCLA comprise the first level; BLLA and Cave of Nine Skylights make up the second level; and Jade Emperor Cave, BNNR, ZGJSS, Longfeng Park, the Hongyanling Scenic Area, SPFG, TQNFP, and the Shiyanping Scenic Area constitute the third level. In terms of flow threshold, the core of Zhangjiajie’s ecotourism flow consists of four paths: WSHIA→GCLA, WSHIA→TMNFP, WSHIA→Huanglong Cave, and Huanglong Cave→WSHIA. These paths are the main tourist trajectories. At present, ecotourism in Zhangjiajie is mainly centered on the WSHIA and radiates to other scenic spots.
We used the GIS spatial analysis method and social network analysis method to explore the characteristics of ecotourism flow in each ecotourism scenic spot in Zhangjiajie for different tourism durations and tourism seasons. Studies have shown that in terms of spatial and temporal distribution, the connection intensity between the core area of ecotourism flow in Zhangjiajie and other scenic spots increases with the increase in the tourism LoS. However, the radiation scope is largely limited to the surrounding areas of ecotourism scenic spots, and the driving radiation effect is weak on distant ecotourism destinations. In the first, second, and fourth quarters, the WSHIA has a high concentration, while TMNFP is mainly characterized by a “large-small” spatial distribution. In the third quarter, WSHIA showed a high concentration, and ZGJSS showed a high concentration of “large-small” dual-core spatial distribution characteristics. The ecotourism flow in Zhangjiajie also has a significant imbalance, which is manifested by significant geographical heterogeneity and significant differences in ecotourism scenic spots within districts and counties.
When studying the spatial and temporal distribution characteristics of ecotourism flow in Zhangjiajie, we built a spatial coupling model between ecotourism flow and traffic accessibility. The results show that the coupling degree of ecotourism flow and traffic accessibility in Zhangjiajie is relatively high, but the coupling coordination degree remains generally low. There is a serious mismatch between ecotourism flow demand and traffic accessibility, and the mutual influence is mainly restricted.
Finally, based on the spatial and temporal distribution and network structure characteristics of the ecotourism flow in Zhangjiajie, we analyzed the challenges hindering high-quality development in the region. We discussed the future development direction for ecotourism in Zhangjiajie and put forward countermeasures to promote sustainable development of ecotourism.
Our study combines the time dimension with the spatial aspect to explore the distribution characteristics of regional ecotourism flow. By exploring the network structure and traffic accessibility of ecotourism flow in Zhangjiajie, we were able to provide recommendations that would develop the ecological tourism market, optimize the regional tourism spatial structure, and improve the layout for ecological tourism scenic spots. However, this study also has some limitations. In this paper, data from travel sites were not combined with field investigation and interview data. Subsequent studies should consider combining various datasets and information to have a more comprehensive perspective on ecological tourism demand, flow points, and interest points. In addition, this paper used artificial selection in data processing, which has certain subjectivity. Future research should consider more objective processing methods when examining the characteristics of ecological tourism flow.
Author Contributions
Conceptualization, M.X.; methodology, X.L. and M.X.; software, X.L.; validation, M.X., H.Z., and X.L.; data curation, X.L. and H.Z.; writing—original draft preparation, X.L. and M.X.; writing—review and editing, X.L. and M.X.; visualization, X.L.; supervision, M.X.; project administration, M.X.; funding acquisition, M.X. All authors have read and agreed to the published version of the manuscript.
Funding
This research was funded by General Program of Humanities and Social Sciences Research of Ministry of Education (Grant number 21YJC850011).
Institutional Review Board Statement
Not applicable.
Informed Consent Statement
Not applicable.
Data Availability Statement
Data available upon request.
Conflicts of Interest
The authors declare no conflict of interest.
References
- Bhuiyan, M.; Hossain, A.; Siwar, C.; Ismail, S.M. Sustainability Measurement for Ecotourism Destination in Malaysia: A Study on Lake Kenyir, Terengganu. Soc. Indic. Res. 2016, 128, 1029–1045. [Google Scholar] [CrossRef]
- Rafa, N.; Nuzhat, S.; Uddin, S.M.N.; Gupta, M.; Rakshit, R. Ecotourism as a Forest Conservation Tool: An NDVI Analysis of the Sitakunda Botanical Garden and Ecopark in Chattogram, Bangladesh. Sustainability 2021, 13, 12190. [Google Scholar] [CrossRef]
- Shaheen, K.; Zaman, K.; Batool, R.; Khurshid, M.A.; Aamir, A.; Shoukry, A.M.; Sharkawy, M.A.; Aldeek, F.; Khader, J.; Gani, S. Dynamic Linkages between Tourism, Energy, Environment, and Economic Growth: Evidence from Top 10 Tourism-Induced Countries. Environ. Sci. Pollut. Res. 2019, 26, 31273–31283. [Google Scholar] [CrossRef] [PubMed]
- Ashok, S.; Tewari, H.R.; Behera, M.D.; Majumdar, A. Development of Ecotourism Sustainability Assessment Framework Employing Delphi, C&I and Participatory Methods: A Case Study of KBR, West Sikkim, India. Tour. Manag. Perspect. 2017, 21, 24–41. [Google Scholar] [CrossRef]
- Li, W.; Zhong, Y. A review of foreign ecotourism environmental education research. Tour. Trib. 2009, 24, 90–94. [Google Scholar]
- Açıksöz, S.; Cetinkaya, G.C.; Uzun, O.; Erduran, N.F.; Ilke, E.F. Linkages among Ecotourism, Landscape and Natural Resource Management, and Livelihood Diversification in the Region of Suğla Lake, Turkey. Int. J. Sustain. Dev. World Ecol. 2016, 23, 15–27. [Google Scholar] [CrossRef]
- Anup, K.C.; Rijal, K.; Sapkota, R.P. Role of Ecotourism in Environmental Conservation and Socioeconomic Development in Annapurna Conservation Area, Nepal. Int. J. Sustain. Dev. World Ecol. 2015, 22, 251–258. [Google Scholar] [CrossRef]
- Buckley, R.; Mossaz, A. Private Conservation Funding from Wildlife Tourism Enterprises in Sub-Saharan Africa: Conservation Marketing Beliefs and Practices. Biol. Conserv. 2018, 218, 57–63. [Google Scholar] [CrossRef] [Green Version]
- Buffa, F. Young Tourists and Sustainability. Profiles, Attitudes, and Implications for Destination Strategies. Sustainability 2015, 7, 14042–14062. [Google Scholar] [CrossRef] [Green Version]
- Kibria, A.S.; Behie, A.; Costanza, R.; Groves, C.; Farrell, T. Potentials of Community-Based-Ecotourism to Improve Human Wellbeing in Cambodia: An Application of Millennium Ecosystem Assessment Framework. Int. J. Sustain. Dev. World Ecol. 2021, 28, 461–472. [Google Scholar] [CrossRef]
- Everard, M.; Kataria, G.; Kumar, S.; Gupta, N. Assessing Livelihood-Ecosystem Interdependencies and Natural Resource Governance in a Tribally Controlled Region of India’s North-Eastern Middle Himalayas. Environ. Dev. Sustain. 2021, 23, 7772–7790. [Google Scholar] [CrossRef]
- Curveira-Santos, G.; Sutherland, C.; Santos-Reis, M.; Swanepoel, L.H. Responses of Carnivore Assemblages to Decentralized Conservation Approaches in a South African Landscape. J. Appl. Ecol. 2021, 58, 92–103. [Google Scholar] [CrossRef]
- Zen, I.S.; Saleh, M.N.; Afrizal, T.; Yaumidin, U.K.; Titisari, P.W.; Hendrayani, Y. Quo Vadis Development: Assessing the Livelihood of Indigenous People’s Communities in Malaysia and the Potential for Community-Based Conservation Effort. Environ. Dev. Sustain. 2021, 23, 6502–6523. [Google Scholar] [CrossRef]
- Penketh, L.; Schleimer, A.; Labaja, J.; Snow, S.; Ponzo, A.; Araujo, G. Scarring Patterns of Whale Sharks, RHINCODON TYPUS, at a Provisioning Site in the Philippines. Aquat. Conserv. Mar. Freshw. Ecosyst. 2021, 31, 99–111. [Google Scholar] [CrossRef]
- Zhang, X. Evaluation of Ecotourism Resources in Southern Shaanxi Based on Group AHP-Fuzzy Comprehensive Method. Jiangsu Agric. Sci. 2021, 49, 13–18. [Google Scholar]
- Papafitsoros, K.; Panagopoulou, A.; Schofield, G. Social Media Reveals Consistently Disproportionate Tourism Pressure on a Threatened Marine Vertebrate. Anim. Conserv. 2021, 24, 568–579. [Google Scholar] [CrossRef]
- Abdullah, S.I.N.W.; Samdin, Z.; Ho, J.A.; Ng, S.I. Sustainability of Marine Parks: Is Knowledge–Attitude–Behaviour Still Relevant? Environ. Dev. Sustain. 2020, 22, 7357–7384. [Google Scholar] [CrossRef]
- Chen, J.; He, X.; Tao, H.; Xu, M. Positioning, optimization and upgrading of cultural and ecological tourism scenic spots—Taking Meihu and Xianghu scenic spots in Nanchang as examples. Enterp. Econ. 2021, 40, 114–121. [Google Scholar]
- Ding, J. The status quo and countermeasures of the construction of national marine parks under the background of ecological civilization construction: Taking Qingdao National Marine Park as an example. Mar. Limnol. Bull. 2021, 43, 167–172. [Google Scholar]
- Zhen, M.; Dan, W.; Chao, Z.; Jinchao, F. Evaluation of Ecotourism Resources in Qin’an County, Tianshui, Gansu. J. Cent. Univ. Natl. 2021, 30, 45–52. [Google Scholar]
- Wang, J.; Zhu, D. The new direction of the utilization of coastal beach resources in Jiangsu-Ecotourism development ideas and prospects. Ocean Bull. 1999, 6, 56–62. Available online: https://kns.cnki.net/kcms/detail/detail.aspx?FileName=HUTB199906009&DbName=CJFQ1999 (accessed on 25 December 2021).
- Liu, Q.; Wang, Z. Study on the ecological tourism potential and spatial heterogeneity of Wuling Mountain area. J. Mt. Res. 2021, 39, 563–575. [Google Scholar]
- He, W.; Sang, S. Community-based analysis of barriers to participation in rural ecotourism: Taking Linzhi Gala Village and Tangdi Village as examples. J. Tibet Univ. 2021, 36, 200–205. [Google Scholar]
- Hu, G. Research on the Temporal and Spatial Differences of Ecotourism Environmental Carrying Capacity in Shanxi Province. For. Econ. 2019, 41, 110–115. [Google Scholar]
- Wei, Y.; Hu, H. Research on the Ecotourism Comfort Evaluation System Based on GIS. J. Shandong Agric. Univ. 2021, 52, 149–152. [Google Scholar]
- Nistor, M.-M.; Nicula, A.-S. Application of Gis Technology for Tourism Flow Modelling in The United Kingdom. Geogr. Tech. 2020, 16, 1–12. [Google Scholar] [CrossRef]
- Li, L.; Lin, L.U.; Chenglin, M.U.; Xiaolong, S.U.N. Spatial structure evolution of tourism flow in typical tourism cities in the era of high-speed rail network: A case study of Huangshan City. Econ. Geogr. 2019, 33, 207–216, 225. [Google Scholar] [CrossRef]
- Zhang, H.; Zhuang, M.; Xia, X.; Liu, S.; Liu, P. Research progress and prospects of Nanjing University tourism flow from the perspective of mobility. Mod. City Res. 2021, 5, 11–18. [Google Scholar]
- Gössling, S.; Hall, C.M. Uncertainties in Predicting Tourist Flows Under Scenarios of Climate Change. Clim. Chang. 2006, 79, 163–173. [Google Scholar] [CrossRef]
- Gang, B.; Yuxie, S.; Lu, G. Analysis of the Temporal and Spatial Changes of Guilin Tourism Flow Based on Weibo Data. J. Southwest Univ. 2021, 43, 71–80. [Google Scholar]
- Butler, R. Seasonality in Tourism: Issues and Implications. Tour. Rev. 1998, 53, 18–24. [Google Scholar] [CrossRef]
- Gil-Alana, L.A.; Mudida, R.; Pérez de Gracia, F. Persistence, Long Memory and Seasonality in Kenyan Tourism Series. Ann. Tour. Res. 2014, 46, 89–101. [Google Scholar] [CrossRef] [Green Version]
- Wang, L.; Cao, X.; Hu, L. Research on the influence of the accessibility of scenic spots on the flow of tourists at different travel times: Taking Xi’an as an example. Hum. Geogr. 2021, 36, 157–166. [Google Scholar]
- Li, Q.; Qu, L. The characteristics of urban tourism flow network structure and its influencing factors: Taking Shanghai as an example. World Geogr. Res. 2021, 30, 114–124. [Google Scholar]
- Li, S.; Kong, X.; Shi, C.; Sun, H. Research on the temporal and spatial distribution characteristics of tra-ditional villages in Shandong Province and the development strategy of cultural and tourism integration. J. Ludong Univ. 2021, 37, 358–365. [Google Scholar]
- Liu, M.; Hao, W.; Zhang, F. A-level scenic area in shanxi the space distribution and influencing factors of. J. Econ. Geogr. 2020, 40, 231–240. [Google Scholar]
- Wang, Q.-J.; Liu, Y.; Li, X.; Zhang, B.-R.; Zhang, C. The network of tourism elements in major cities in China pays attention to the spatial evolution characteristics. J. World Geogr. Res. 2017, 26, 45–55. [Google Scholar]
- Ma, L.; Xiao, Y. The characteristics of the domestic tourism flow network structure of typical urban residents. Econ. Geogr. 2018, 38, 197–205, 207. [Google Scholar]
- Xu, H.; Liu, S. Shanghai Red Tourism Flow Network Structure Characteristics and Influencing Factors Analysis [J/OL]. Resource Development and the Market. Available online: http://kns.cnki.net/kcms/detail/51.1448.N.20220121.1126.006.html (accessed on 12 February 2022).
- Wang, J.; Wang, G.; Liu, Y.; Lei, T.; Sun, J.; Wang, X. Spatial-temporal distribution and network structure characteristics of the red tourism flow in Jinggang Mountain. J. Nat. Resour. 2021, 36, 1777–1791. [Google Scholar]
- Li, C.; Zhao, Y.; Sun, X.; Su, X.; Zheng, S.; Dong, R.; Shi, L. Photography-Based Analysis of Tourists’ Temporal–Spatial Behaviour in the Old Town of Lijiang. Int. J. Sustain. Dev. World Ecol. 2011, 18, 523–529. [Google Scholar] [CrossRef]
- Weng, G.; Tang, Y.; Pan, Y.; Mao, Y. Spatio-temporal evolution and spatial difference of tourism, ecology and urbanization coupling coordination in The Beijing-Tianjin-Hebei Region. Econ. Geogr. 2021, 9, 196–204. [Google Scholar] [CrossRef]
- Wang, Z.; Li, T. Spatio-temporal coupling analysis of the dominance of inbound tourism flow and tourism economic efficiency in China. Hum. Geogr. 2021, 4, 157–166. [Google Scholar] [CrossRef]
- Wang, C.; Tang, N. The spatiotemporal characteristics and pattern evolution of the coupling and coordination of spatial function of rural three generations in Chongqing City. Geogr. Res. 2018, 37, 1100–1114. [Google Scholar]
- Sun, X.; Ni, R.; Feng, X. Research on the seasonal characteristics of inbound tourism and source market: A case study of Shanghai. Travel J. 2019, 34, 25–39. [Google Scholar]
- Yao, X.; Zeng, J.; Wu, D. Research on spatial structure characteristics of mountain ecotourism resources in western hunan. Chin. J. Agric. Resour. Reg. Plan. 2020, 41, 246–256. [Google Scholar]
- Tao, W.R. Structural evolution and spatial development model of county tourism economic network in Wuling Mountain region of Hunan Province. Econ. Geogr. 2020, 40, 211–220. [Google Scholar]
- Ye, M.; Wang, Z.; Tan, Y. Transportation and tourism development in xiangxi characteristics of coupling coordination and the effect. J. Econ. Geogr. 2020, 40, 138–144. [Google Scholar] [CrossRef]
- Wang, H.-R.; Yao, Y.-G.; Yin, H.G. Qiandongnan prefecture tourism space structure evaluation and optimization strategy study. J. Southwest Univ. 2021, 12, 105–114. [Google Scholar]
| Publisher’s Note: MDPI stays neutral with regard to jurisdictional claims in published maps and institutional affiliations. |
© 2022 by the authors. Licensee MDPI, Basel, Switzerland. This article is an open access article distributed under the terms and conditions of the Creative Commons Attribution (CC BY) license (https://creativecommons.org/licenses/by/4.0/).


