Article

Greenhouse Gas Fluxes from Selected Soil Fertility Management Practices in Humic Nitisols of Upper Eastern Kenya

1
Department of Water and Agricultural Resource Management, University of Embu, P.O. Box 6, Embu 60100, Kenya
2
Cortile Scientific Limited, P.O. Box 34991, Nairobi 00100, Kenya
3
Department of Geography, Kenyatta University, P.O. Box 43844, Nairobi 00100, Kenya
4
Department of Soil Sciences, Research Institute of Organic Agriculture (FIBL), Ackerstrasse 113, 5070 Frick, Switzerland
5
National Agriculture Research Laboratories, Kenya Agricultural and Livestock Research Organization, P.O. Box 14733, Nairobi 00800, Kenya
6
Department of Plant, Animal and Food Sciences (PAFS), Jaramogi Oginga Odinga University of Science and Technology (JOOUST), P.O. Box 210, Bondo 40601, Kenya
*
Author to whom correspondence should be addressed.
Sustainability 2022, 14(3), 1938; https://doi.org/10.3390/su14031938
Submission received: 21 December 2021 / Revised: 25 January 2022 / Accepted: 26 January 2022 / Published: 8 February 2022
(This article belongs to the Special Issue The Sustainability of Agricultural Soils)

Abstract

:
We quantified the soil carbon dioxide (CO2), methane (CH4), and nitrous oxide (N2O) fluxes of five soil fertility management practices (inorganic fertilizer (Mf), maize residue + inorganic fertilizer (RMf), maize residue + inorganic fertilizer + goat manure (RMfM), maize residue + tithonia diversifolia + goat manure (RTiM), and a control (CtC)) in Kenya’s central highlands using a static chamber method from March 2019 to March 2020. The cumulative annual soil CH4 uptake ranged from −1.07 to −0.64 kg CH4-C ha−1 yr−1, CO2 emissions from 4.59 to 9.01 Mg CO2-C ha−1 yr−1, and N2O fluxes from 104 to 279 g N2O-N ha−1 yr−1. The RTiM produced the highest CO2 emissions (9.01 Mg CO2-C ha−1 yr−1), carbon sequestration (3.99 Mg CO2-eq ha−1), yield-scaled N2O emissions (YSE) (0.043 g N2O-N kg−1 grain yield), the lowest net global warming potential (net GWP) (−14.7 Mg CO2-eq ha−1) and greenhouse gas intensities (GHGI) (−2.81 Kg CO2-eq kg−1 grain yield). We observed average maize grain yields of 7.98 Mg ha−1 yr−1 under RMfM treatment. Integrating inorganic fertilizer and maize residue retention resulted in low emissions, increased soil organic carbon sequestration, and high maize yields.

1. Introduction

Increased worldwide anthropogenic greenhouse gas concentrations have led to an elevated average global temperature and reduced agricultural productivity [1]. Agriculture accounts for approximately 14 to 17%, 26%, and 30% of the global, African, and Kenyan total GHG emissions, respectively [2,3]. Agricultural land acts as a source and sink of GHGs depending on the particular agricultural management practice [4,5]. Soil GHG fluxes result from complex biological and chemical processes [6]. Additionally, agricultural management practices, including the addition of soil inputs, both inorganic and organic, could impact soil GHG emissions.
Soil CO2 fluxes are a result of soil respiration, which is the summation of autotrophic (roots and the rhizosphere) and heterotrophic (from macro and microfauna in the soil) respiration [7]. Net CH4 fluxes result from two antagonistic processes: methane production by methanogens in anaerobic conditions and aerobic methane consumption by methanotrophic soil bacteria [8]. Microbial nitrification and denitrification are responsible for soil N2O fluxes [6]. Still, other processes such as nitrification from autotrophic and heterotrophic, chemical denitrification, nitrifier denitrification, coupled nitrification denitrification, and co-denitrification lead to soil N2O [9]. The complex biogeochemical processes are highly influenced by land manipulation, including soil fertilization systems for improved productivity, thus affecting the soil–atmosphere exchange [10]. Therefore, there is a need to quantify the soil GHG fluxes from different soil fertilization practices.
Few experiments on GHG emissions in soils have been carried out in smallholder farmers in Kenya and SSA at large, resulting in huge data gaps and uncertainties in the national GHG inventories [11,12]. Most of the developing countries tend to use the Intergovernmental Panel on Climate Change (IPCC) default emission factors (EFs), Tier I) as required by the UNFCCC agreement in Paris in 2015 [13]. Tier I EFs tend to overestimate GHG emissions in soils [14,15], resulting in inaccurate estimation of soil GHG emissions. Furthermore, there is scant information on tradeoffs between the fertilization strategies on crop performance and climate change mitigation, including greenhouse gas intensities (GHGI), yield-scaled emissions (YSE), net global warming potential (net GWP), and emission factors (EFs).
The decline in food production is a major issue affecting smallholder farming systems in Kenya’s central highlands [16]. Low food production results from continuous cropping and low and/or inappropriate soil nutrient replenishment, leading to low fertility [17]. The addition of various organic inputs, singly and/or with chemical fertilizer, has been tested and found to improve the soil fertility, yields, and the general health of the soil in Kenya’s central highlands [17,18]. However, little attempt has been made to quantify GHG emissions under various fertilization regimes in maize production.
Maize production in Kenya is important because it feeds about 85% of the population as the main staple food [19]. However, in recent years, maize grain yields in Kenya have remained low to an average of less than 1 t ha−1 out of the possible 6t ha−1 [20]. This results from inadequate agricultural water management practices, low soil quality, and unpredictable weather patterns [21]. There is a huge data gap in Kenya’s central highlands on the quantification of GHG emissions under maize cropping. Musafiri et al. [10] underscored the importance of animal manure and inorganic fertilizer integration in the increasing maize productivity and greenhouse gas emission mitigations. However, there is limited scientific evidence on the impact of integrating different organic inputs such as crop residues, Tithonian diversifolia and animal manure with and without inorganic fertilizers on the maize production and soil greenhouse gas fluxes. Therefore, there is a need to qualify soil GHG emissions in maize production under different organic inputs (animal manure and Tithonia diversifolia) and inorganic fertilizer. Hence, the objectives of this study were to quantify GHG fluxes and assess their drivers in agricultural soil under different soil fertilization practices in the maize cropping system.

2. Materials and Methods
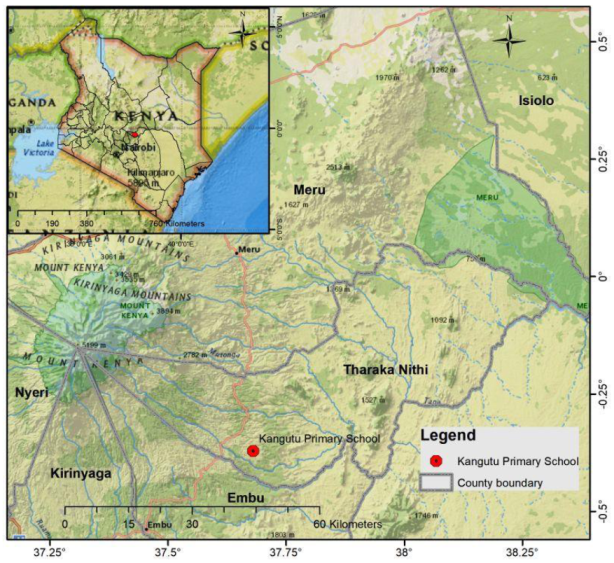
2.1. Study Area

We conducted the soil GHG quantification experiment at Kangutu Primary School (1468 m, 00°98′ S, 37°08′ E) farm in Tharaka-Nithi County, Kenya (Figure 1). Kangutu Primary is in the Upper Midland two, agro-ecological zone [22]. The county has two rainy seasons, March to May (long rains) and October to December (short rains), with a minimum of 1200 mm and a maximum of 1400 mm annually. The annual temperature of the site ranges from 19.2 to 20.6 °C, having a mean of 20 °C annually. The soils are humic Nitisols, which are well-drained, extremely deep, dusky red to friable clay, with humic A horizon [22]. A recent study by [17] has reported that these soils have low organic carbon (<2.0%), nitrogen (<20 ppm) and are moderately acidic (pH 4.8), therefore requiring amendments to improve and sustain their fertility.

2.2. Experimental Setup

We superimposed our soil GHG quantification study on an ongoing long-term experiment initiated in 2015 [23]. Concisely, the long-term trial was organized in a split-plot under a complete block design with 14 treatments randomized with different organic and inorganic inputs under reduced and farmers practice tillage practices and a no-input control. For the soil GHG study, we selected five treatments (Table 1) based on their use by the farmers in Kenya’s central highlands [24].
The plots measured 600 by 450 cm. Maize variety H516 was planted with a spacing of 75 cm inter-row and 50 cm intra-row. Land preparation encompassing incorporation of Tithonia diversifolia and goat manure was carried out on the 9th of March 2019 and the 25th of September 2019 during LR19 and SR19 seasons, respectively, using a hand hoe. Tithonia diversifolia and animal manure had N content of 3.8%N and 2.1%N, respectively [17].
We applied 3490 kg ha−1 year −1 goat manure and 6316 kg ha−1 year −1 Tithonia diversifolia to provide each an equivalence of 120 kg N ha−1year−1, the recommended amounts of N for the maize crop. We planted maize seeds, three per hill, on 23rd of April 2019 and on the 9th of October 2019 during LR19 and SR19 seasons. One seedling was thinned to attain the recommended 53,333 plants in a hectare [25]. We surface applied maize residues (10 Mg ha−1 year1) on the 13th of May 2019 during LR19 and the 31st of October 2019 during the SR19 season. We applied NPK to supply 120 kg N ha−1 yr−1 for the sole inorganic fertilizer treatment and 60 Kg N ha−1 yr−1 for inorganic fertilizer combination following the Fertilizer Use Recommendation Project [26]. We applied triple super phosphate (TSP) in treatments with sole inorganic fertilizer and inorganic fertilizer combination at 180 ha−1 yr−1 to supply N and P during planting. Weeds were controlled by hand pulling in all the treatments except for control, where a hand hoe was used.

2.3. Soil GHG Fluxes Measurement

The static chamber method quantified the soil carbon dioxide CO2, methane (CH4), and nitrous oxide N2O following Rosenstock et al. [27]. The chambers had a lid (0.27 × 0.372 × 0.125 m) and a base (0.27 × 0.372 × 0.1 m). Three bases in each sampling plot were placed, two intra-row and one inter-row to a depth of 7 cm on the 7th of March 2019, and stationed throughout the study period. However, the chambers were only removed during the preparation of land and incorporation of goat manure and Tithonia diversifolia on the 9th of March 2019 and the 25th of September 2019 during the LR19 and SR19 seasons, respectively. A thermometer was placed in the lid to record the chamber’s temperature, while the sampling area had a silicon-based septum for gas sampling. A small fan was also fitted in the lid connected to a battery pack with power to run the fan to allow consistent mixing of the air in the chamber. A guaranteed sealing was made using a closed-cell foam lining on the lid, and a vent was added to allow for a balance between the atmosphere and the chamber pressure. Metal binder clips were used to hold the lid tightly to the base during sampling.
Soil GHG fluxes were sampled weekly at the start and biweekly near season’s end, during the dry period of the cropping season and during key activities including episodes of rain, inorganic fertilizer, Tithonia Diversifolia, and goat manure application and maize residue addition, making a total of 45 sampling campaigns in a year. Sampling was performed between 0830 and 1200 h, a time in the day taken to have a representative daily temperature, thus accounting for diurnal variability of the fluxes [28]. A gas sample was pooled from each of the three chambers [29]. An initial 20 mL cleared a 20 mL vial with a rubber-based septum, and the residual 40 mL filled the vial. The excess 20 mL pressurized the vial to minimize contamination with the atmospheric air. We sampled a 60 mL ambient air sample at an individual sampling event to check for chamber sample quality.
The glass vials were then transported to the laboratory. Gas chromatography (GC) was used for GHG concentration analysis within two weeks of sampling. The GC was calibrated after every fifth sample with calibration vials of identified gas amounts, determined the amounts of the headspace samples using the relation between peak areas of the calibration gas [12]. Carbon dioxide and methane concentrations were calculated by linear regression during chamber closure for the flame ionization detector (FID) channel. In contrast, the electron capture detector (ECD) channel adopted a power function for N2O concentration calculations [30].

2.4. Greenhouse Gases Concentration Calculations

Soil GHG emissions were computed by changing concentrations to mass per volume using the chamber volume, chamber temperature, and air pressure following the general gas equation described by Pelster et al. [12] (Equation (1)).
F = b × M w × V C h × 60 × 10 6 A C h × V m × 10 9
The F indicates the emission rate (µg m−2 h−1) for N2O and (mg m−2 h−1) for CH4 and CO2; b indicates the slope of concentration increase or decrease (ppb/min−1); Mw represents the CH4, CO2, and N2O molecular weight (g mol−1); VCh indicates the volume of the chamber (m3); ACh represents the area of the chamber (m2); Vm is the gas molar volume (m3 mol−1). The emissions were computed in µg m−2 h−1 for N2O and in mg m−2 h−1 for CH4, CO2. The emissions were changed to kg CH4-C ha−1yr−1, kg CO2-C ha−1yr−1 for CH4 and CO2, and g N2O-N ha−1yr−1 forN2O, respectively.
The calculation of greenhouse gas concentrations in this study used both linear and nonlinear models. Whenever there was a strong correlation while determining the GHG concentration (R2 ≥ 95%) using non-linear models, a second-order polynomial was used; otherwise, we used linear models. We portioned CO2 amounts at intervals of 0, 10, 20, and 30 min after closing the chamber. To validate the reliability of the data from each sampling time, if measurements from the plot showed less than 90% of CO2 concentration, the three flux measurements were dismissed on the premise that a leak had occurred or it was contaminated. However, if the decrease happened in the last chamber reading, then the emission rate was calculated using the first three-chamber readings. For this study, minimum detection limits were 0.02 mg CH4-C m−2 h−1, 1.66 mg CO2-C m−2 h−1, and 2.71 µg N2O-N m−2 h−1 for the linear model and 0.08 mg CH4-C m−2 h−1, 5.46 mg CO2-C m−2 h−1, and 9.34 µg N2O-N m−2 h−1 for nonlinear models, correspondingly [31]. We considered the negative fluxes for N2O and CH4 as uptakes. The linear interpolation calculated the cumulative soil GHG fluxes between sampling days for each plot following Barton et al. [32].

2.5. Soil Measurements

At each treatment plot, we sampled five soil samples at the beginning (the 6th of March 2019) and after the experiment (the 7th of March 2020), 0–20 cm depth with a Gouge auger (Eijkelkamp) composited to one sample per plot and transported to the laboratory. We measured the total soil C and N content by taking a 20 g of fresh sample, drying it in the oven for three days at 40 °C, passed through a 2 mm sieve, and ground using a ball mill. The C and N amounts of the ground samples were determined by a C:N analyzer. The soil pH was analyzed using a pH meter by mixing a sample in a 1:2 ratio with water. The bulk density was determined by collecting standard core rings at a depth of 5 cm and dried in the oven for one day at 105 °C, weighed, and bulk-density computed [33]. We measured the soil’s moisture gravimetrically and computed the water-filled pores space (WFPS), following Equation (2).
W F P S % = g S W C 1 B D P D × 100
The % WFPS is the percentage of water-filled porosity, PD is the particle density of 2.65 g cm−3, BD is the bulk density (g cm−3), and gSWC is the soil water content.
We measured the daily precipitation at 3.5 m above ground (S-THB-M002 sensor) (Onset Computer Corporation, Bourne, MA, USA). We averaged the data over 15 min and stored on a HOBO U30 NRC station data logger (Onset Computer Corporation, Bourne, MA, USA). During every sampling incidence, the soil temperature measurements were taken at a 5 cm depth adjacent to each of the chambers using a Procheck (ProCheck GS3 Sensor, Decagon Devices Inc. Pullman, Washington, DC, USA).
We collected five soil samples at a 0–20 cm depth in every plot using an Eijkelkamp gouge auger to determine the ammonium and nitrate amounts at each GHG sampling event. We mixed the five samples per plot to form a composite sample, packed in a well-labeled zip-lock bag packed in an ice cooler box, moved to the laboratory, and kept in a refrigerator at 4 °C. The samples were extracted using 2M KCl using 1:5 soil:solution weight:volume ratio. An orbital shaker was used to shake the extracts at 100 shakes per minute for one hour. A centrifuge was used at 3000 revolutions per minute for 10 min, and the subsequent sample was filtered and frozen for further analysis.
Ammonium and nitrate were determined by a photometric analyzer using light absorbance measurement and the green indophenol method (660 nm), respectively [12]. We used linear interpolation to calculate the sum of daily concentration between sample dates throughout the experimentation period and used this to compute ammonium, nitrate, and inorganic N concentrations [34]. A sample of residual inorganic nitrogen was dried in the oven at 105 °C for 24 h to analyze the sample’s moisture. The computed soil moisture and dry mass were used to convert the inorganic nitrogen (IN). The daily precipitation was measured using an automatic data-logging rain gauge. Soil temperature measurements were taken at a 5 cm depth adjacent to each chamber during every sampling incidence using a Procheck.

2.6. Maize Biomass Measurement

Maize biomass was determined by sampling eight plants (1 m by 1.5 m) on each plot for biomass determination on the 27th of August 2019 (LR19) and the 20th of February 2020 (SR19). Plant roots (below-ground biomass) were determined by digging the soil around them to below the root zone, rinsed with water, and passed through a 2 mm sieve. We separated the leaves and stems from the eight plants and harvested grain yields from a 400 by 525 cm net plot for aboveground biomass. We sampled grains, leaves, stems, and roots, air dried them for twenty-one days, and recorded the dry weight. We used a moisture meter to determine the grain moisture content and grain weight modified to 12.5% moisture content of the grain [17]. The leaf area index (LAI) was calculated by measuring the direct incident photosynthetically active radiation (PAR; 400–700 nm) above and below the plant canopy in the treatment plots using a ceptometer following Facchi et al. [35]. The LAI measurements were taken weekly from when the maize plant was at the 6th leaf canopy on the 20th of May 2019 up to the 10th leaf canopy on the 8th of June 2019 during LR19 season and at the 6th leaf canopy on the 8th of November 2019 up to the 10th leaf canopy on the 29th of November 2019 during SR19 season.

2.7. Greenhouse Gases Yield-Scaled Emissions (YSE) and Emission Factors (EFs)

The yield-scaled N2O emissions (YSE) (g N2O-N kg−1 grain yield) was computed by annual accumulative N2O emissions divided by annual grain yields following Macharia et al. [14], following Equation (3).
Y S E = N 2 O e m i s s i o n s g r a i n y i e l d
YSE is the yield-scaled N2O emissions, N2O emissions are the cumulative annual N2O fluxes from each sampling plot (g N2O-N ha−1 yr−1), and the grain yield is the annual grain yield in every sampling plot (kg ha−1 yr−1).
The N2O emission factors (EFs) were estimated following Pelster et al. [12] and Musafiri et al. [10], following Equation (4).
E F ( % ) = ( N 2 O i n t r e a t m e n t ) ( N 2 O i n c o n t r o l ) A n n u a l N f e r t i l i s e r a p p l i e d × 100
where EF (%) is the emission factor, N2O in treatment and N2O in control is the treatment and control cumulative N2O emissions in kg N2O-N ha−1 yr−1, respectively; the annual nitrogen fertilizer applied is the amount of N fertilizer used (60 kg ha−1 season −1).

2.8. The Net-Global Warming Potential (GWP) and Greenhouse Gas Intensity (GHGI)

The net-global warming potential (GWP) was computed by converting the total cumulated GHG emissions into CO2 equivalents (CO2 eq) based on a 100 years’ time horizon by taking per molecule GWP of CH4 and N2O comparative to CO2 as 28 and 265, respectively [36]. The GWP was calculated as illustrated by Equation (5).
n e t G W P = 28 × C H 4 + 265 × N 2 O 44 12 Δ SOC
where the net GWP is the net global warming potential expressed in kg CO2-eq·ha−1, ΔSOC is the change in soil organic carbon stock expressed in kg CO2-eq ha−1 calculated by multiplying the change in soil organic carbon (g kg−1 soil), depth (m), bulk density (g cm−3), and 10,000 (m2), CH4 and N2O fluxes are expressed as kg ha−1 yr−1.
The greenhouse gas intensity (GHGI) was estimated following Mosier et al. [37] and Shang et al. [38] using Equation (6).
G H G I = n e t G W P Y i e l d
where GHGI is expressed in kg CO2-eq·kg−1 grain yield, net-GWP in kg CO2-eq·ha−1, and yield in Kg ha−1

2.9. Data Analysis

The normality of the GHG emissions was evaluated using the Shapiro–Wilk test [39]. Since the N2O emissions were not typically spread, we used a logarithmic function to transform the data, similar to Musafiri et al. [10]. To determine the soil fertility management practice effects, and blocks and seasons on maize yields (grains, stem, leaves, and roots), N2O YSE, N2O EFs, GWP, GHGI, cumulative CH4, CO2, and N2O fluxes, we used a linear mixed model in SAS 9.4 software. The fixed factors were the treatments, and the random factors were the blocks and seasons. We examined the difference between treatment averages by Tukey’s Honestly Significant Difference Test at p ≤ 0.05. Using by Pearson’s correlation, we tested the relationship between the soil CO2, CH4, N2O fluxes and bulk density, pH, SOC, nitrogen, C:N ratio, root yields, soil moisture, LAI, nitrate, ammonium, and inorganic N intensities.

3. Results

3.1. Soil and Site Meteorological Measurements

We recorded an annual rainfall of 2067.1 mm and a seasonal aggregate rainfall of 678.6 mm and 1388.5 mm, which is 33% and 67% of the annual rainfall during long rains and short rains of the 2019 seasons, respectively (Figure 2f). The cumulative seasonal precipitation was 11% lower during the long rains of 2019 and 178% higher during the short rains of 2019 than long-term means [22]. The soil temperature was between 19 and 41 °C, with RTiM and Mf treatments registering the highest average temperature (31.4 °C) and RMf treatments with the lowest (30.1 °C, Figure 2d). The water-filled pore space (WFPS) was 10 to 56% throughout the study period (Figure 2e).
The baseline bulk density, pH, and SOC significantly varied across treatments (p < 0.05) (Table 2). The bulk density was between 0.95 g cm−3 for RMf treatment and 1.05 g cm−3 for Mf treatment. We observed the highest pH (5.26) from RTiM and the lowest (4.57) from Mf treatment. The RTiM treatment had the highest soil organic carbon (1.83%) and CtC treatment the lowest (1.57%). The initial total nitrogen and carbon:nitrogen ratio ranged from 0.16% to 0.17% and 10.03 to 10.76, respectively.
At the endline, the pH, nitrogen, and SOC significantly differed across treatments (p < 0.05) (Table 2). RTiM treatment had the highest soil pH (5.17), and Mf treatment had the lowest (4.25). The total nitrogen ranged between 0.13% and 0.16%. We observed the highest soil organic carbon from RTiM treatment (2.03%) and the lowest from CtC treatment (1.52%). The soil bulk density and C/N ratio ranged from 0.8 g cm−3 to 1 g cm−3 and 11.11 to 13.05, respectively.

3.2. Soil Greenhouse Gases Emissions

Soil CH4 emissions remained below zero in most treatments throughout the year. The soil CH4 uptakes ranged between −0.09 and −70 µg CH4-C m−2 h−1 across treatments. However, few CH4-positive feedbacks existed across the soil fertility treatments ranging between 0.2 and 50 µg CH4-C m−2 h−1 (Figure 2a). Diurnal emissions of soil CO2 were between 20 to 592 mg CO2-C m−2 h−1 in treatments in the year (Figure 2b). Carbon dioxide emissions remained low through the offseason. Soil CO2 emissions increased at the inception of rains, reaching peaks of 238 CO2-C m−2 h−1 under RTiM on the 23rd of April 2019 during the LR19 season and 592 CO2-C m−2 h−1 under Mf on the 21st of January 2020 during the SR19 season (Figure 2b). Across the treatments, soil N2O emissions were mostly positive, from 0.02 to 7.65 µg N2O-N m−2 h−1 (Figure 2c). However, occasional negative soil N2O fluxes were observed between −0.02 and−6.6 µg N2O-N m−2 h−1 throughout the study period. Peaks of N2O emissions were observed following rainfall events with peaks of 4.35 µg N2O-N m−2 h−1 on the 23rd of April 2019 and 3.6 µg N2O-N m−2 h−1 on the 10th of October 2019 under RTiM treatment for LR19 and SR19 seasons, respectively (Figure 2c).
The annual aggregate CH4 emissions differed (p < 0.0001) in treatments, with the greatest uptake under RMfM treatment (−1.07 kg CH4-C ha−1 yr−1) and least under Mf treatment (−0.64 kg CH4-C ha−1 yr−1) (Table 3). The accumulative yearly CO2 fluxes differed (p < 0.0001) in treatments, maximum of 9.01 Mg CO2-C ha−1 yr−1 under RTiM treatment, minimum under CtC treatment (4.59 Mg CO2-C ha−1 yr−1, Table 3). The yearly aggregate N2O emissions differed (p < 0.0001) in treatments, uppermost recorded under RMfM treatment (279 g N2O-N ha−1 yr−1), lowermost under CtC treatment (104 g N2O-N ha−1 yr−1, Table 3). There were substantial seasonal variances for CH4, CO2, and N2O at p < 0.0001, and a treatment and/or season interface for CH4 emissions (p = 0.0099) and N2O fluxes (p < 0.0001), Table 3).

3.3. Soil Inorganic Nitrogen

We observed peak ammonium of 17,600 g N ha−1 on 23rd of April 2019 under RTiM treatment and 16,732 g N ha−1 on 10th of October 2019 under Mf, following inputs application and rainfall events. During the study period, the soil ammonium ranged between 546 to 17,600 g N ha−1 (Figure 3a). The soil nitrate ranged between 3822 for under CtC treatment and 46560 g N ha−1 for RTiM treatment during the experimental period (Figure 3b). In addition, we observed occasional peaks in inorganic nitrogen during the study period, such as 51,200 g N ha−1 on 23rd of April 2019 and 50,960 g N ha −1 on 27th of October 2019 following precipitation events (Figure 3c). The inorganic nitrogen was 29% ammonium and 71% nitrate.

3.4. Maize Biomass Measurements

Maize production (total biomass, root, leaf, stem, and grain) differed across treatments throughout the experimentation period (Table 4). During the LR19 season, maize yields differed in the treatments, with RMfM recording the maximum (0.30 Mg ha−1) and CtC treatment recording the minimum (0.001 Mg ha−1). During the LR19 season, the maize yields differed significantly across the treatments, with Mf recording the highest (8.02 Mg ha−1) and CtC recording the lowest (3.79 Mg ha−1) in the SR19 season (Table 4). We observed considerable seasonal differences for grain (p < 0.0001), leaf (p < 0.0001), stem (p < 0.0001), and root (p < 0.0001), and a treatment and/or season interaction for grain (p = 0.0002), leaf (p = 0.003), and root (p = 0.014), Table 4).
At the sixth leaf stage, the leaf area index (LAI) differed (p = 0.01) across treatments in the 2019 short rains season (Table 5). We observed the highest LAI under Mf treatment (2.52) and the lowest under RMf treatment (1.56). During the 2019 long rains season, we observed the highest LAI from the RMF treatment (0.94) and the lowest from the CtC treatment (0.22), Table 5). The LAI significantly (p = 0.02) varied across treatments. We observed significant seasonal differences for LAI at the 6th leaf stage (p < 0.0001) and at the 10th leaf stage (p < 0.0001) and a treatment/season interaction at the 6th leaf stage (p = 0.01) (Table 5).

3.5. Greenhouse Gases Yield-Scaled Emissions (YSE) and Emission Factors (EFs)

The YSE differed (p < 0.0001) in treatments that ranged from 0.020 (RMf) to 0.043 (RTiM) to 0.020 (RMf) g N2O-N kg−1 grain yield, Table 6). The N2O emission factors (%) differed (p < 0.0001) in treatments in the study period (Table 5). RMfM treatment had the highest N2O EF (0.14%) while RMf had the lowest (0.02%), Table 6).

3.6. Soil Organic Carbon Stocks Change, Net-Global Warming Potential (Net-GWP) and Greenhouse Gas Intensity (GHGI)

The soil organic carbon stock (ΔSOC) change varied (p < 0.0001) across treatments (Table 6). The annual carbon sequestration rate ranged between −4616 kg (Mf) and 3999 (RTiM) kg CO2-eq ha−1. The annual net global warming (net-GWP) potential significantly (p < 0.0001) differed across treatments (Table 6). The net GWP ranged from −14,663 kg CO2-eq ha−1 (RTiM) to 16,923 kg CO2-eq ha−1 (Mf). The greenhouse gas intensities (GHGI) varied (p = 0.0002) across treatments ranging from −2.81 (RTiM) to 2.15 (Mf) Kg CO2-eq kg−1 grain yield (Table 6).

3.7. Annual Soil GHG Fluxes and Environmental Factors Correlation

Cumulative annual CH4 fluxes were negatively correlated with nitrate (NO−3-N), p = 0.006, Table 7). Soil CO2 fluxes positively correlated with the pH (p = 0.007), roots biomass (p = 0.009), and moisture (p = 0.002), and negatively correlated with bulk density (p = 0.009, Table 7). N2O fluxes correlated with root biomass (p = 0.003), soil moisture (p < 0.0001), LAI (p = 0.016), and negatively with bulk density (p = 0.024, Table 7).

4. Discussion

4.1. Soil Greenhouse Gases Emissions

The low CH4 uptake across treatments was comparable to other experimentations piloted in Kenya’s central highlands showing that highland soils are atmospheric CH4 sinks [10,12]. The low soil CH4 intake in Mf treatment was due to CH4 oxidation activity inhibition due to the reduced methanotrophic bacteria activities brought about by the addition of inorganic fertilizer [40]. This could also be explained by the negative correlation between CH4 fluxes and soil nitrates (NO3-N), Table 7. The high CH4 uptake under RMfM treatment may have resulted from the N available in the soil. The inputs (maize residues, inorganic fertilizer, and goat manure) provided an N source that potentially inhibited CH4 emissions [41].
Furthermore, the RMfM treatment had low bulk density, and this could have increased the gas diffusivity of CH4 and O2 to the soil from the atmosphere, thereby increasing the CH4 uptake in the soil [42]. The observed seasonal difference and treatment/seasonal interaction on methane uptakes could be attributed to increased rainfall by 51% in the short rains season of 2019. The diminished uptakes through the short rains seasons of 2019 may be credited to increased water content that favored substrate availability and the number of methanotrophic bacteria in CH4 production instead of consumption [43].
The observed CO2 emissions concurred with studies by Pelster et al. [12] and Macharia et al. [14] in East Africa that ranged between 1900 and 16,000 kg ha−1 yr−1. The high CO2 emissions in RTiM plots were attributed to the addition of organic inputs that could have increased substrates for microbes, induced microbial enzymatic activity, and stimulated SOM decomposition in the process, increasing CO2 emissions [44]. The increased CO2 emissions from organic amendments could have resulted from carbon addition to the native soils due to the priming effect [45]. There was a pulse in CO2 following the first rain event, which may be due to greater microbial activities resulting from an increased substrate: the Birch effect [46].
Carbon dioxide emissions treatment/seasonal interactions (Table 4) could be attributed to the 51% low precipitation during the long rains of 2019 equated to the short rains of 2019. During the short rains of 2019, the high rainfall led to the pulse in microbial activities as soil mineralization increased due to increased soil moisture [11]. This is shown by a greater correlation of CO2 emissions with soil moisture leading to higher CO2 emissions across all treatments in the short rains of the 2019 season compared to the long rains of the 2019 season [10,47]. Conversely, low CO2 amounts were reported in dry months of the study period and were attributed to low microbial activity and minimal root respiration due to low or no plant growth. The low soil bulk density for the RTiM results from the addition of organics improved soil organic matter [48]. Furthermore, increasing the soil water content, organic matter decomposition, and carbon dioxide emissions [49]. The low CO2 emissions under CtC treatment may be credited to the little soil organic carbon content and root biomass. Increased root respiration due to increased root biomass might have partly enhanced cumulative CO2 emissions as reflected by a greater proportion of correlation between total root production and CO2 emissions (Table 7). It is good to observe that the current study CO2 fluxes emanated from respiration from the roots and organic matter decay only. For a full account of CO2 emissions, aboveground vegetation respiration and photosynthesis should also be considered [14].
The soil N2O amounts observed in this study were low and in line with those observed in earlier studies across SSA that ranged between 0.10 to 1.8 kg N2O-N ha−1 yr−1 [11,14]. However, the current observed soil N2O fluxes were lower than those reported by other studies globally that ranged from 0.89 to 22.9 [50,51,52]. This results from low inherent fertility and inadequate replenishment of nutrients in the experimentation area [18]. The highest N2O fluxes under RMfM treatment may be due to increased nitrogen availability, microbial activity, and reduced O2 levels, conditions favorable for N2O fluxes [52,53,54]. Generally, soil fertility treatments had greater soil N2O fluxes than control treatments, as indicated by other studies [11,12,55]. The results highlight the importance of soil fertility treatments in increasing the potent N2O fluxes. However, the evaluation of yield-scaled emission is essential in showing the relation between N2O emission and production.
The soil N2O fluxes increase following fertilizer application, and precipitation events were consistent with a study by Musafiri et al. [10]. This could be endorsed to higher moisture, stimulating microbial metabolism and C and N mineralization, leading to increased N2O fluxes [56]. A greater correlation among nitrous oxide emissions and soil moisture, root biomass, and LAI (Table 7) underscored the importance of the soil parameters and crop performance on N2O fluxes. The significant treatment/season interaction of N2O emissions may be ascribed to the influence of added soil inputs in different treatments. Maize residue was used as a mulch integrated with manure, Tithonia diversifolia, and mineral fertilizer and led to increased N2O fluxes and maize production compared with the control treatment. The integration of crop residue retention, organic inputs, and mineral fertilizer could improve crop production and soil health [17]. However, crop residue retention is not typically practiced in Kenya’s central highlands due to crop–livestock conflict and is mainly used as fuel and animal feeds [14].

4.2. Biomass Production

Maize grains yields during the study period were comparable to studies carried out in Kenya’s central highlands that ranged between crop failure (0 Mg ha−1) and 7.13 Mg ha−1 [14,57]. The application of organic and inorganic inputs, either singly or blended, has implications in improving agroecosystems production and soil health [10]. The high grain yields from integrating sole organics inputs or inorganic fertilizer (RMf, RTiM, and RMfM) may be due to synchronized nutrient reliance and enhanced bulk density, soil moisture, and cation exchange capacity [58]. Furthermore, the improved maize production from organically treated soil could be attributed to carbon build-up. For example, previous studies show that adding organic inputs such as crop residue and manure increased soil organic carbon [59,60]. Mineral fertilizer treatment had higher grain yields, which is attributed to increased efficiency in nutrient release and agreed with Musafiri et al.’s [10] study in Kenya’s Central Highlands. Generally, all soil fertility treatments had greater grain yields than control, especially in the 2019 short rains season. This could be attributed to increased water availability and the low grain yields from no inputs treatment due to poor fertility and limited nitrogen supply in the soil. Previous studies in Kenya’s central highlands have documented worse maize yields under no-input treatments than soil fertility treatments [10,17]. The significant season and seasonal and treatment interface may increase rainfall during the short rains of 2019. The 51% increase in rainfall during the short rains of 2019 than the long rains of 2019 could have increased the water-filled pore space and moisture availability, thus increasing crop yields. Macharia et al. [14] documented comparable results, who found that an increase in rainfall by 48% significantly influenced maize production between the cropping seasons.

4.3. Greenhouse Gases Yield-Scaled Emissions (YSE) and Emission Factors (EFs)

The observed yield-scaled emissions (YSE) ranging from 0.020 to 0.043 g N2O-N kg−1 N were similar to those reported under different soil fertilization systems, from 0.024 to 2.2 g N2O-N kg−1 grain yields [10,61]. Reporting N2O fluxes as yield-scaled N2O emissions provides additional information on the balance between crop productivity and climate change mitigation. Our findings indicate that Mf and RMf could reduce N2O emissions by 28% and 31%, while RMfM and RTiM could increase the emissions by 21% and 48% compared to CtC.
The N2O emission factors (EFs) for the RMf treatment were 2.5-, 5.5-, and 7-fold lower than Mf, RTiM, and RMfM, respectively. The observed EFs were less than the IPCC Tier 1 default EFs of 1%. Some studies have shown N2O EFs smaller than the IPCC Tier 1 default [10,12,62]. Therefore, the default Tier 1IPCC EFs could not accurately estimate N2O emissions for SSA. Thus, additional studies on GHG emissions in the SSA are prudent as data generated would help rectify N2O emission factors to counter doubts in estimations of soil GHG emissions.

4.4. Soil Organic Carbon Stocks Change, Net Global Warming Potential (Net-GWP), and Greenhouse Gas Intensities (GHGI)

Carbon dioxide soil–atmospheric exchange from a cropping system is the equilibrium between C inputs and C outputs of soil organic resources [37]. However, direct measurement of CO2 emissions using the static chamber method cannot distinguish net CO2 emission to the atmosphere, and ΔSOC could be used to account for net-CO2 fluxes [63,64]. Organic inputs such as animal manure and maize residue increase carbon sequestration in cropping systems [65]. We found that all plots treated with organic inputs (RMf, RMfM, and RTiM) sequestered carbon while control treatment and mineral fertilizer treatment lost carbon (Table 6). In agreement with Kiboi et al. [66], our findings indicated that SOC increased in organic and mineral and organic fertilizer combination treatments and decreased under no input treatment in Kenya’s central highlands. Our soil organic carbon stock −14,663 to 16,923 Kg CO2-eq ha−1, consistent with those reported in previous studies ranging from −17,410 to 22,481 Kg CO2-eq ha−1 [67,68].
The negative net-GWP across organic fertilization systems showed that the soil was a GHG sink (Table 6). The negative net-GWP could be attributed to carbon sequestration (Table 6) that outweighs the positive N2O fluxes. Similar findings were reported by Pilecco et al. [68], who showed negative net-GWP under organic and mineral fertilized cropping systems in Brazil. The net-GWP was increased by five times under Mf treatment but reduced by three-, four-, and fourfold for RMfM, RMf, and RTiM, respectively. The lower net-GWP under organic fertilized treatments could be attributed to increased carbon sequestration. Thelen et al. [69] found that manure application in cropping systems enhanced net-GWP mitigation and increased carbon sequestration. Furthermore, Yang et al. [70] found that combining manure and half-rate fertilizer mitigated net-GWP.
The GHGI were equally negative across organically fertilized treatments, a sign of agricultural sustainability when net-GWP and grain yields were considered. The negative GHGI across organic fertilization systems indicates that agroecosystem productivity was enhanced while sinking the soil–atmosphere exchange. The application of RMfM, RMf, and RTiM reduced net-GWP by one-, two-, and threefold while Mf increased it by twofold compared with CtC. The lower GHGI under organic fertilization systems was due to increased carbon accumulation Zhang et al. [71], which overwhelmed the N2O fluxes. Therefore, carbon sequestration plays a greater role in expressing net GWP and GHGI and should be considered when reporting GHG balance. However, organic inputs’ long-term application could lead to C saturation, thus increasing carbon emissions [72]. Furthermore, the tradeoffs between grain yields and net GWP (the GHGI) ought to be used to concurrently attain greater yields and lessen GHG emissions across modern maize crop farming.

5. Conclusions

We assessed the influence of soil fertilization systems on maize production and GHG flux balance in Kenya’s central highlands. Maize residue, goat manure, and inorganic fertilizer emitted the most N2O because of the addition of C and N from organic and inorganic sources. Maize residue, goat manure, and Tithonia diversifolia emitted the most CO2 because of improved carbon and nitrogen inputs. The microbial activity and uptake of CH4 were low in mineral fertilizer due to low oxidation activity. Furthermore, soil moisture influenced the CH4 and CO2 emissions, and soil inputs controlled the N2O emissions. Our findings indicated that integrating organic inputs, either sole or mineral fertilizer, significantly increased grain yields, CO2 emissions, and N2O fluxes while lowering net GWP and GHGI compared with the control. In addition, we found that organic fertilized treatments acted as net GHG sinks while the control and mineral fertilizer treatments acted as GHG sources. Integrating maize residue with mineral fertilizer consistently showed sustainable performance across the observed results, including maize yields, N2O emission factor, carbon sequestration, net GWP, and GHGI. Therefore, judicious integration of maize residue and mineral fertilizer can serve as a climate change mitigation strategy in maize cropping systems. The fertilization system is practically plausible since it involves applying recommended mineral fertilizer and retaining maize residue as mulch. However, further studies are required for other proposed organic integration practices: RTiM and RMfM. They increased crop yields while decreasing net GWP and GHGI to mineral fertilizer, despite their high N2O emission factors.

Author Contributions

Conceptualization, M.W.G.; Data curation, C.M.M., J.M.M. and F.K.N.; Formal analysis, M.W.G. and C.M.M.; Funding acquisition, A.F. and F.K.N.; Investigation, M.W.G. and F.K.N.; Methodology, J.M.M. and F.K.N.; Project administration, M.N.K.; Resources, A.M.; Supervision, M.N.K., A.F. and F.K.N.; Writing—original draft, M.W.G.; Writing—review & editing, C.M.M., M.N.K., A.F., A.M. and F.K.N. All authors have read and agreed to the published version of the manuscript.

Funding

This research was funded by Swiss Agency for Development and Cooperation (SDC) and Swiss National Science Foundation (SNSF) in the Swiss Programme for Research on Global Issues for Development (r4d programme), Grant No. 400540-152224. The APC was partially funded by Swiss National Science Foundation (SNSF) after we received 50% discount.

Institutional Review Board Statement

Not applicable.

Informed Consent Statement

Not applicable.

Data Availability Statement

Data is contained within the article.

Acknowledgments

We would like to thank the Swiss National Science Foundation (SNSF) and the Swiss Agency for Development and Cooperation (SDC) in the Swiss Programme for Research on Global Issues for Development (r4d programme), the Research Institute of Organic Agriculture (FiBL), for the funding through farmer-driven organic resource management to build soil fertility (ORM4Soil). We are grateful to Mazingira Centre, International Livestock Research Institute (ILRI)—Nairobi, for the laboratory work. We thank Kangutu Primary School from Tharaka-Nithi County for providing the experimental site. Thanks to the anonymous reviewers for their insightful contribution that helped shape this paper.

Conflicts of Interest

The authors declare no conflict of interest.

References

  1. Wang, Y.Y.; Hu, C.S.; Ming, H.; Zhang, Y.M.; Li, X.X.; Dong, W.X.; Oenema, O. Concentration profiles of CH4, CO2 and N2O in soils of a wheat-maize rotation ecosystem in North China plain, measured weekly over a whole year. Agric. Ecosyst. Environ. 2013, 164, 260–272. [Google Scholar] [CrossRef]
  2. Tubiello, F.N.; Salvatore, M.; Ferrara, A.F.; House, J.; Federici, S.; Rossi, S.; Prosperi, P. The contribution of agriculture, forestry and other land use activities to global warming, 1990–2012. Glob. Chang. Biol. 2015, 21, 2655–2660. [Google Scholar] [CrossRef] [Green Version]
  3. Paul, B.; Frelat, R.; Birnholz, C.; Ebong, C.; Gahigi, A.; Groot, J.C.J.; Herrero, M.; Kagabo, D.M.; Notenbaert, A.; Vanlauwe, B.; et al. Agricultural intensification scenarios, household food availability and greenhouse gas emissions in Rwanda: Ex-ante impacts and tradeoffs. Agric. Syst. 2017, 163, 16–26. [Google Scholar] [CrossRef]
  4. Tuomisto, H.L.; Hodge, I.D.; Riordan, P.; Macdonald, D.W. Does organic farming reduce environmental impacts? A meta-analysis of European research. J. Environ. Manag. 2012, 112, 309–320. [Google Scholar] [CrossRef] [PubMed]
  5. Mangalassery, S.; Sjögersten, S.; Sparkes, D.L.; Sturrock, C.J.; Craigon, J.; Mooney, S.J. To what extent can tillage lead to a reduction in greenhouse gas emissions from temperate soils? Sci. Rep. 2014, 4, 4586. [Google Scholar] [CrossRef] [PubMed] [Green Version]
  6. Butterbach-Bahl, K.; Dannenmann, M. Denitrification and associated soil N2O emissions due to agricultural activities in a changing climate. Curr. Opin. Environ. Sustain. 2011, 3, 389–395. [Google Scholar] [CrossRef]
  7. Vargas, V.P.; Cantarella, H.; Martins, A.A.; Soares, J.R.; Carmo, J.B.; Andrade, C.A. Sugarcane crop residue increases N2O and CO2 emissions under high soil moisture conditions. Sugar Tech. 2014, 16, 174–179. [Google Scholar] [CrossRef]
  8. Serrano-Silva, N.; Sarria-Guzmán, Y.; Dendooven, L.; Luna-Guido, M. Methanogenesis and methanotrophy in soil: A review. Pedosphere 2014, 24, 291–307. [Google Scholar] [CrossRef]
  9. Butterbach-Bahl, K.; Baggs, E.M.; Dannenmann, M.; Kiese, R.; Zechmeister-Boltenstern, S. Nitrous oxide emissions from soils: How well do we understand the processes and their controls? Philos. Trans. R. Soc. B Biol. Sci. 2013, 368, 20130122. [Google Scholar] [CrossRef]
  10. Musafiri, C.M.; Macharia, J.M.; Kiboi, M.N.; Ng’etich, O.K.; Shisanya, C.A.; Okeyo, J.M.; Mugendi, D.N.; Okwuosa, E.A.; Ng’etich, F.K. Soil greenhouse gas fluxes from maize cropping system under different soil fertility management technologies in Kenya. Agric. Ecosyst. Environ. 2020, 301, 107064. [Google Scholar] [CrossRef]
  11. Ortiz-Gonzalo, D.; de Neergaard, A.; Vaast, P.; Suárez-Villanueva, V.; Oelofse, M.; Rosenstock, T.S. Multi-scale measurements show limited soil greenhouse gas emissions in Kenyan smallholder coffee-dairy systems. Sci. Total Environ. 2018, 626, 328–339. [Google Scholar] [CrossRef]
  12. Pelster, D.; Rufino, M.C.; Rosenstock, T.; Mango, J.; Saiz, G.; Diaz Pines, E.; Baldi, G.; Butterbach-Bahl, K. Smallholder farms in eastern African tropical highlands have low soil greenhouse gas fluxes. Biogeosciences 2017, 14, 187–202. [Google Scholar] [CrossRef] [Green Version]
  13. UNFCCC. Aggregate Effect of the Intended Nationally Determined Contributions. 2015. In Transforming our World: The 2030 Agenda for Sustainable Development; United Nations General Assembly: New York, NY, USA, 2016. [Google Scholar]
  14. Macharia, M.J.; Pelster, E.D.; Ngetich, K.F.; Shisanya, A.C.; Mucheru-Muna, M.; Mugendi, N.D. Soil greenhouse gas fluxes from maize production under different soil fertility management practices in East Africa. J. Geophys. Res. Biogeosci. 2020, 125, e2019JG005427. [Google Scholar] [CrossRef]
  15. Musafiri, C.M.; Macharia, J.M.; Kiboi, M.N.; Ng’etich, O.K.; Shisanya, C.A.; Okeyo, J.M.; Mugendi, D.N.; Okwuosa, E.A.; Ng’etich, F.K. Comparison between observed and DeNitrification-DeComposition model-based nitrous oxide fluxes and maize yields under selected soil fertility management technologies in Kenya. Plant Soil 2021, 460, 395–413. [Google Scholar] [CrossRef]
  16. Mucheru-Muna, M.; Pypers, P.; Mugendi, D.; Kung, J.; Mugwe, J.; Merckx, R.; Vanlauwe, B. A staggered maize–legume intercrop arrangement robustly increases crop yields and economic returns in the highlands of Central Kenya. Field Crop Res. 2010, 115, 132–139. [Google Scholar] [CrossRef]
  17. Kiboi, M.N.; Ngetich, K.F.; Fliessbach, A.; Muriuki, A.; Mugendi, D.N. Soil fertility inputs and tillage influence on maize crop performance and soil water content in the Central Highlands of Kenya. Agric. Water Manag. 2019, 217, 316–331. [Google Scholar] [CrossRef]
  18. Mucheru-Muna, M.; Mugendi, D.; Pypers, P.; Mugwe, J.; Kung’u, J.; Vanlauwe, B.; Merckx, R. Enhancing maize productivity and profitability using organic inputs and mineral fertilizer in Central Kenya small-hold farms. Exp. Agric. 2014, 50, 250–269. [Google Scholar] [CrossRef] [Green Version]
  19. Onono, P.A.; Wawire, N.W.H.; Ombuki, C. The response of maize production in Kenya to economic incentives. Int. J. Sustain. Dev. 2013, 2, 530–543. [Google Scholar]
  20. Ngome, A.F.; Becker, M.; Mtei, K.M.; Mussgnug, F. Fertility management for maize cultivation in some soils of Western Kenya. Soil Tillage Res. 2011, 117, 69–75. [Google Scholar] [CrossRef]
  21. Okeyo, I.A.; Mucheru-Muna, M.; Mugwe, J.; Ngetich, K.F.; Mugendi, D.N.; Diels, J.; Shisanya, C.A. Effects of selected soil and water conservation technologies on nutrient losses and maize yields in the central highlands of Kenya. Agric. Water Manag. 2014, 137, 52–58. [Google Scholar] [CrossRef]
  22. Jaetzold, R.; Schmidt, H.; Hornet, Z.B.; Shisanya, C.A. Natural Conditions and Farm Information. Eastern Province. In Farm Management Handbook of Kenya, 2nd ed.; Ministry of Agriculture/GTZ: Nairobi, Kenya, 2007; Volume 11. [Google Scholar]
  23. Kiboi, M.N.; Ngetich, K.F.; Mugendi, D.N.; Muriuki, A.; Adamtey, N.; Fliessbach, A. Microbial biomass and acid phosphomonoesterase activity in soils of the Central Highlands of Kenya. Geoderma Reg. 2018, 15, e00193. [Google Scholar] [CrossRef]
  24. Macharia, J.; Mugwe, J.; Mucheru-Muna, M.; Mugendi, D. Socioeconomic Factors Influencing Levels of Knowledge in Soil Fertility Management in the Central Highlands of Kenya. J. Agric. Sci. Technol. 2014, 4, 701–711. [Google Scholar] [CrossRef]
  25. Mucheru-Muna, M.; Mugendi, D.; Kung’u, J.; Mugwe, J.; Bationo, A. Effects of organic and mineral fertilizer inputs on maize yield and soil chemical properties in a maize cropping system in Meru South District, Kenya. Agrofor. Syst. 2007, 69, 189–197. [Google Scholar] [CrossRef]
  26. Fertilizer Use Recommendation Project (FURP). Description of First Priority Trial Site in the Various Districts; Embu District, Kenya National Agricultural Research Laboratories: Nairobi, Kenya, 1987; Volume 24. [Google Scholar]
  27. Rosenstock, T.S.; Mpanda, M.; Pelster, D.E.; Butterbach-Bahl, K.; Rufino, M.C.; Thiong’o, M.; Mutuo, P.; Abwanda, S.; Rioux, J.; Kimaro, A.A.; et al. Greenhouse gas fluxes from agricultural soils of Kenya and Tanzania. J. Geophys. Res. Biogeosci. 2016, 121, 1568–1580. [Google Scholar] [CrossRef] [Green Version]
  28. Chadwick, D.R.; Cardenas, L.; Misselbrook, T.H.; Smith, K.A.; Rees, R.M.; Watson, C.J.; McGeough, K.L.; Williams, J.R.; Cloy, J.M.; Thorman, R.E.; et al. Optimizing chamber methods for measuring nitrous oxide emissions from plot-based agricultural experiments. Eur. J. Soil. Sci. 2014, 65, 295–307. [Google Scholar] [CrossRef]
  29. Arias-Navarro, C.; Díaz-Pinés, E.; Kiese, R.; Rosenstock, T.S.; Rufino, M.C.; Stern, D.; Neufeldt, H.; Verchot, L.V.; Butterbach-Bahl, K. Gas pooling: A sampling technique to overcome spatial heterogeneity of soil carbon dioxide and nitrous oxide fluxes. Soil Biol. Biochem. 2013, 67, 20–23. [Google Scholar] [CrossRef]
  30. Pavelka, M.; Acosta, M.; Kiese, R.; Altimir, N.; Brümmer, C.; Crill, P.; Darenova, E.; Fuß, R.; Gielen, B.; Graf, A.; et al. Standardisation of chamber technique for CO2, N2O and CH4 fluxes measurements from terrestrial ecosystems. Int. Agrophys. 2018, 32, 569–587. [Google Scholar] [CrossRef]
  31. Parkin, T.B.; Venterea, R.T.; Hargreaves, S.K. Calculating the detection limits of chamber-based soil greenhouse gas flux measurements. J. Environ. Qual. 2012, 41, 705–715. [Google Scholar] [CrossRef] [Green Version]
  32. Barton, L.; Wolf, B.; Rowlings, D.; Scheer, C.; Kiese, R.; Grace, P.; Stefanova, K.; Butterbach-Bahl, K. Sampling frequency affects estimates of annual nitrous oxide fluxes. Sci. Rep. 2015, 5, 15912. [Google Scholar] [CrossRef] [Green Version]
  33. Okalebo, J.R.; Gathua, K.W.; Woomer, P.L. Laboratory Methods of Soil and Plant Analysis: A Working Manual, 2nd ed.; Nairobi Office: Nairobi, Kenya, 2002; p. 21. [Google Scholar]
  34. Burton, D.; Zebarth, B.; Gillam, K.; MacLeod, J. Effect of split application of fertilizer nitrogen on N2O emissions from potatoes. Can. J. Soil. Sci. 2008, 88, 189–195. [Google Scholar] [CrossRef] [Green Version]
  35. Facchi, A.; Baroni, G.; Boschetti, M.; Gandolfi, C. Comparing optical and direct methods for leaf area index determination in a maize crop. J. Agric. Eng. 2010, 1, 33–40. [Google Scholar] [CrossRef]
  36. IPCC. Climate Change (2014): Synthesis Report; Contribution of Working Groups I, II and III to the Fifth Assessment Report of the Intergovernmental Panel on Climate Change; Pachauri, R.K., Meyer, L.A., Eds.; IPCC: Geneva, Switzerland, 2014. [Google Scholar]
  37. Mosier, A.R.; Halvorson, A.D.; Reule, C.A.; Liu, X.J. Net global warming potential and greenhouse gas intensity in irrigated cropping systems in northeastern Colorado. J. Environ. Qual. 2006, 35, 1584–1598. [Google Scholar] [CrossRef] [PubMed] [Green Version]
  38. Shang, Q.Y.; Yang, X.X.; Gao, C.; Wu, P.P.; Liu, J.J.; Xu, Y.; Shen, Q.R.; Zou, J.W.; Guo, S.W. Net annual global warming potential and greenhouse gas intensity in Chinese double rice-cropping systems: A 3-year field measurement in long-term fertilizer experiments. Glob. Chang. Biol. 2011, 17, 2196–2210. [Google Scholar] [CrossRef]
  39. Shapiro, S.S.; Wilk, M.B. An Analysis of Variance Test for Normality (Complete Samples). Biometrika 1965, 52, 591–611. [Google Scholar] [CrossRef]
  40. Mishra, V.K.; Shukla, R.; Shukla, P.N. Inhibition of soil methane oxidation by fertilizer application: An intriguing but persistent paradigm. Environ. Pollut. Protect. 2018, 3, 57–69. [Google Scholar] [CrossRef]
  41. Banger, K.; Tian, H.; Lu, C. Do nitrogen fertilizers stimulate or inhibit methane emissions from rice fields? Glob. Chang. Biol. 2012, 18, 3259–3267. [Google Scholar] [CrossRef]
  42. Chi, J.; Waldo, S.; Pressley, S.; O’Keeffe, P.; Huggins, D.; Stöckle, C.; Pan, W.L.; Brooks, E.; Lamb, B. Assessing carbon and water dynamics of no-till and conventional tillage cropping systems in the inland Pacific Northwest US using the eddy covariance method. Agric. For. Meteorol. 2016, 218–219, 37–49. [Google Scholar] [CrossRef] [Green Version]
  43. Manucharova, N.A.; Yaroslavtsev, A.M.; Kornyushenko, E.G.; Stepanov, A.L.; Smagin, A.V.; Zvyagintsev, D.G.; Sudnitsyn, I.I. Methane production and growth of microorganisms under different moisture conditions in soils with added chitin and without it. Eurasian Soil Sci. 2007, 40, 860–865. [Google Scholar] [CrossRef]
  44. Tenesaca, C.G.; Al-Kaisi, M.M. In-field management of corn cob and residue mix: Effect on soil greenhouse gas emissions. Appl. Soil Ecol. 2015, 89, 59–68. [Google Scholar] [CrossRef]
  45. Kuzyakov, Y. Sources of CO2 efflux from soil and review of partitioning methods. Soil Biol. Biochem. 2006, 38, 425–448. [Google Scholar] [CrossRef]
  46. Birch, H.F. The effect of soil drying on humus decomposition and nitrogen availability. Plant. Soil. 1958, 10, 9–31. [Google Scholar] [CrossRef]
  47. Gelfand, I.; Cui, M.D.; Tang, J.W.; Robertson, G.P. Short-term drought response of N2O and CO2 emissions from mesic agricultural soils in the US Midwest. Agric. Ecosyst. Environ. 2015, 212, 127–133. [Google Scholar] [CrossRef] [Green Version]
  48. Athira, M.; Jagadeeswaran, R.; Kumaraperumal, R. Influence of soil organic matter on bulk density in Coimbatore soils. Int. J. Chem. Stud. 2019, 7, 3520–3523. [Google Scholar]
  49. Korenková, L.K.; Urik, M. Soil moisture and its effect on bulk density and porosity of intact aggregates of three Mollic soils. Indian J. Agric. Sci. 2012, 82, 172–178. [Google Scholar]
  50. Skinner, C.; Gattinger, A.; Krauss, M.; Krause, H.M.; Mayer, J.; Van Der Heijden, M.G.; Mäder, P. The impact of long-term organic farming on soil-derived greenhouse gas emissions. Sci. Rep. 2019, 9, 1702. [Google Scholar] [CrossRef]
  51. Skinner, C.; Gattinger, A.; Muller, A.; Mäder, P.; Fließbach, A.; Stolze, M.; Ruser, R.; Niggli, U. Greenhouse gas fluxes from agricultural soils under organic and non-organic management—A global meta-analysis. Sci. Total Environ. 2014, 468, 553–563. [Google Scholar] [CrossRef]
  52. Mukumbuta, I.; Shimizu, M.; Jin, T.; Nagatake, A.; Hata, H.; Kondo, S.; Kawai, M.; Hatano, R. Nitrous and nitric oxide emissions from a cornfield and managed grassland: 11 years of continuous measurement with manure and fertilizer applications, and land-use change. Soil Sci. Plant Nutr. 2017, 63, 185–199. [Google Scholar] [CrossRef]
  53. Collins, H.P.; Alva, A.K.; Streubel, J.D.; Fransen, S.F.; Frear, C.; Chen, S.; Kruger, C.; Granatstein, D. Greenhouse gas emissions from an irrigated silt loam soil amended with anaerobically digested dairy manure. Soil Sci. Soc. Am. J. 2011, 75, 2206–2216. [Google Scholar] [CrossRef]
  54. Zhang, W.; Yu, Y.; Li, T.; Sun, W.; Huang, Y. Net greenhouse gas balance in China’s croplands over the last three decades and its mitigation potential. Environ. Sci. Technol. 2014, 48, 2589–2597. [Google Scholar] [CrossRef]
  55. Mukumbuta, I.; Shimizu, M.; Hatano, R. Mitigating global warming potential and greenhouse gas intensities by applying composted manure in cornfield: A 3-year field study in an andosol soil. Agriculture 2017, 7, 13. [Google Scholar] [CrossRef] [Green Version]
  56. Liang, L.L.; Grantz, D.A.; Jenerette, G.D. Multivariate regulation of soil CO2 and N2O pulse emissions from agricultural soils. Glob. Chang. Biol. 2016, 22, 1286–1298. [Google Scholar] [CrossRef]
  57. Ngetich, K.F.; Diels, J.; Shisanya, C.A.; Mugwe, J.N.; Mucheru-Muna, M.; Mugendi, D.N. Effects of selected soil and water conservation techniques on runoff, sediment yield and maize productivity under sub-humid and semi-arid conditions in Kenya. Catena 2014, 121, 288–296. [Google Scholar] [CrossRef]
  58. Partey, S.T.; Thevathasan, N.V.; Zougmoré, R.B.; Preziosi, R.F. Improving maize production through nitrogen supply from ten rarely-used organic resources in Ghana. Agrofor. Syst. 2018, 92, 375–387. [Google Scholar] [CrossRef]
  59. Kumari, R.; Singh, R.; Kumar, N. Effect of crop residue management on soil organic carbon, soil organic matter and crop yield: An overview. J. Appl. Nat. Sci. 2019, 11, 712–717. [Google Scholar] [CrossRef]
  60. Stella, T.; Mouratiadou, I.; Gaiser, T.; Berg-Mohnicke, M.; Wallor, E.; Ewert, F.; Nendel, C. Estimating the contribution of crop residues to soil organic carbon conservation. Environ. Res. Lett. 2019, 14, 094008. [Google Scholar] [CrossRef]
  61. Venterea, R.T.; Maharjan, B.; Dolan, M.S. Fertilizer source and tillage effects on yield-scaled nitrous oxide emissions in a corn cropping system. J. Environ. Qual. 2011, 40, 1521–1531. [Google Scholar] [CrossRef] [Green Version]
  62. Tully, K.L.; Abwanda, S.; Thiong’o, M.; Mutuo, P.M.; Rosenstock, T.S. Nitrous oxide and methane fluxes from urine and dung deposited on Kenyan pastures. J. Environ. Qual. 2017, 46, 921. [Google Scholar] [CrossRef]
  63. Chen, Z.; Chen, F.; Zhang, H.; Liu, S. Effects of nitrogen application rates on net annual global warming potential and greenhouse gas intensity in double-rice cropping systems of the Southern China. Environ. Sci. Pollut. Res. 2016, 23, 24781–24795. [Google Scholar] [CrossRef]
  64. Guardia, G.; Tellez-Rio, A.; García-Marco, S.; Martin-Lammerding, D.; Tenorio, J.L.; Ibáñez, M.Á.; Vallejo, A. Effect of tillage and crop (cereal versus legume) on greenhouse gas emissions and Global Warming Potential in a non-irrigated Mediterranean field. Agric. Ecosyst. Environ. 2016, 221, 187–197. [Google Scholar] [CrossRef]
  65. Farooqi, Z.U.R.; Sabir, M.; Zeeshan, N.; Naveed, K.; Hussain, M.M. Enhancing carbon sequestration using organic amendments and agricultural practices. In Carbon Capture, Utilization and Sequestration; Ramesh, K., Agarwal, R.K., Eds.; InTech Open: London, UK, 2018; pp. 17–35. [Google Scholar] [CrossRef] [Green Version]
  66. Kiboi, M.N.; Ngetich, F.K.; Muriuki, A.; Adamtey, N.; Mugendi, D. The response of soil physicochemical properties to tillage and soil fertility resources in Central Highlands of Kenya. Ital. J. Agron. 2020, 15, 71–87. [Google Scholar] [CrossRef]
  67. Pratibha, G.; Srinivas, I.; Rao, K.V.; Shanker, A.K.; Raju, B.M.K.; Choudhary, D.K.; Rao, K.S.; Srinivasarao, C.; Maheswari, M. Net global warming potential and greenhouse gas intensity of conventional and conservation agriculture system in rainfed semi-arid tropics of India. Atmos. Environ. 2016, 145, 239–250. [Google Scholar] [CrossRef]
  68. Pilecco, G.E.; Chantigny, M.H.; Weiler, D.A.; Aita, C.; Thivierge, M.N.; Schmatz, R.; Chaves, B.; Giacomini, S.J. Greenhouse gas emissions and global warming potential from biofuel cropping systems fertilized with mineral and organic nitrogen sources. Sci. Total Environ. 2020, 729, 138767. [Google Scholar] [CrossRef] [PubMed]
  69. Thelen, K.D.; Fronning, B.E.; Kravchenko, A.; Min, D.H.; Robertson, G.P. Integrating livestock manure with a corn–soybean bioenergy cropping system improves short-term carbon sequestration rates and net global warming potential. Biomass Bioenergy 2010, 34, 960–966. [Google Scholar] [CrossRef]
  70. Yang, B.; Xiong, Z.; Wang, J.; Xu, X.; Huang, Q.; Shen, Q. Mitigating net global warming potential and greenhouse gas intensities by substituting chemical nitrogen fertilizers with organic fertilization strategies in rice-wheat annual rotation systems in China: A 3-year field experiment. Ecol. Eng. 2015, 81, 289–297. [Google Scholar] [CrossRef]
  71. Zhang, M.; Li, B.; Xiong, Z.Q. Effects of organic fertilizer on net global warming potential under an intensively managed vegetable field in southeastern China: A three-year field study. Atmos. Environ. 2016, 145, 92–103. [Google Scholar] [CrossRef]
  72. Deng, Q.; Hui, D.; Wang, J.; Yu, C.L.; Li, C.; Reddy, K.C.; Dennis, S. Assessing the impacts of tillage and fertilization management on nitrous oxide emissions in a cornfield using the DNDC model. J. Geophys. Res. Biogeosci. 2016, 121, 337–349. [Google Scholar] [CrossRef] [Green Version]
Figure 1. Study area map.
Sustainability 14 01938 g001
Figure 2. Soil (a) methane (CH4-C mg m−2 h−1), (b) carbon dioxide (CO2-C mg m−2 h−1), and (c) nitrous oxide (N2O-N µg m−2 h−1) fluxes. (d) Soil temperature (°C). (e) Soil moisture (water-filled pore space (WFPS) (%). (f) Precipitation (mm). Treatments: CtC: control (no external input), Mf: sole mineral fertilizer (120 kg N ha−1 yr−1), RMf: maize residue (10 t ha−1 yr−1) + mineral fertilizer (120 kg N ha−1 yr−1), RMfM: maize residue (10 t ha−1 yr−1) + mineral fertilizer (60 kg N ha−1 yr−1) + goat manure (60 kg N ha−1 yr−1) and RTiM: maize residue(10 t ha−1 yr−1) + Tithonia diversifolia (60 kg N ha−1 yr−1) + goat manure (60 kg N ha−1 yr−1). The perpendicular lines are the preparation of land and addition of manure (continuous), planting (medium-dash dotted line), maize residue addition (long-dashed line) and harvesting (short-dash dotted line).
Sustainability 14 01938 g002
Figure 3. (a) Soil inorganic ammonia (NH4+-N g N ha−1), (b) soil nitrate (NO3-N g N ha−1), and (c) soil inorganic nitrogen (NH4−1-N + NO3-N) g N ha −1 across soil fertility management practices from March 2019 to March 2020. Treatments: CtC: control (no external input), Mf: sole mineral fertilizer (120 kg N ha−1 yr−1), RMf: maize residue (10 t ha−1 yr−1) + mineral fertilizer (120 kg N ha−1 yr−1), RMfM: maize residue (10 t ha−1 yr−1) + mineral fertilizer (60 kg N ha−1 yr−1) + goat manure (60 kg N ha−1 yr−1) and RTiM: maize residue (10 t ha−1 yr−1) + Tithonia diversifolia (60 kg N ha−1 yr−1) + goat manure (60 kg N ha−1 yr−1). Manure and Tithonia diversifolia were incorporated using a hand hoe in the planting holes only during land preparation. The perpendicular lines are the preparation of land and addition of manure (continuous), planting (medium-dash dotted line), maize residue addition (long-dash line), and harvesting (short-dash dotted line).
Sustainability 14 01938 g003
Table 1. Treatments used for this study at Kangutu site.
Soil Fertility InputsAbbreviations
No input—controlCtC
Inorganic fertilizer Mf
Maize residue + inorganic fertilizerRMf
Maize residue + inorganic fertilizer + goat manureRMfM
Maize residue + Tithonia diversifolia + goat manureRTiM
Table 2. Initial and final soil properties under selected soil fertilization treatments at Kangutu site. Treatment means (n = 3) followed by an identical superscript letter within the same column do not differ at p ≤ 0.05.
PeriodTreatment 1Bulk Density
(g cm−3)
pHNitrogen
(%)
Soil Organic Carbon (%)C/N Ratio
InitialCtC0.99 b4.87 b0.161.57 b10.0
Mf1.05 a4.57 b0.171.75 a10.1
RMf0.95 c4.61 b0.161.68 ab10.1
RMfM0.97 bc4.88 b0.171.69 ab10.3
RTiM0.97 bc5.26 a0.171.83 a10.8
p value<0.00010.0050.870.0030.74
FinalCtC0.914.57 b0.13 b1.52 e11.4
Mf0.894.25 c0.14 b1.53 d11.2
RMf0.854.44 bc0.16 a1.86 b11.1
RMfM1.005.0 a0.16 a1.84 c11.3
RTiM0.805.17 a0.16 a2.03 a13.1
pvalue0.07<0.00010.005<0.00010.06
1Treatments: CtC: control (no external input), Mf: sole inorganic fertilizer (120 kg N ha−1 yr−1), RMf: maize residue (10 t ha−1 yr−1) + inorganic fertilizer (120 kg N ha−1 yr−1), RMfM: maize residue (10 t ha−1 yr−1) + mineral fertilizer (60 kg N ha−1 yr−1) + goat manure (60 kg N ha−1 yr−1) and RTiM: maize residue (10 t ha−1 yr−1) + Tithonia diversifolia (60 kg N ha−1 yr−1) + goat manure (60 kg N ha−1 yr−1).
Table 3. GHG fluxes between March 2019 and March 2020 under selected soil fertilization treatments at the Kangutu site. Treatment means (n = 3) of cumulative seasonal and annual soil GHG fluxes followed by an identical superscript letter within the same column do not differ at p ≤ 0.05.
Season1Treatment 2CH4
(kg CH4-C ha−1)
CO2
(Mg CO2-C ha−1)
N2O
(g N2O-N ha−1)
LR 19CtC−0.59 ab1.45 c33.7 c
Mf−0.42 a1.48 c21.8 d
RMf−0.65 ab1.58 c24.5 d
RMfM−0.73 b2.64 b72.0 a
RTiM−0.52 ab3.19 a52.2 b
p value0.0965<0.0001<0.0001
SR 19CtC−0.41 d3.14 c70.3 e
Mf−0.21 b4.10 bc 148 c
RMf−0.11 a 3.16 c113 d
RMfM−0.34 c 4.75 b207 a
RTiM−0.33 c 5.83 a 192 b
p value<0.00010.0001<0.0001
AnnualCtC−1.00 b 4.59 c 104 e
Mf−0.64 a 5.58 c 170 c
RMf−0.76 a 4.75 c 137 d
RMfM−1.07 b 7.40 b 279 a
RTiM−0.86 ab9.01 a244 b
p value0.008<0.0001<0.0001
Seasonal p value 3<0.0001<0.0001<0.0001
Interaction 40.00990.1311<0.0001
1 LR 19 = long rains 2019 season, SR 19 = short rains 2019 season. 2 Treatments: CtC: control (no input), Mf: sole mineral fertilizer (120 kg N ha−1 yr−1), RMf: maize residue (10 t ha−1 yr−1) + mineral fertilizer (120 kg N ha−1 yr−1), RMfM: maize residue (10 t ha−1 yr−1) + mineral fertilizer (60 kg N ha−1 yr−1) + goat manure (60 kg N ha−1 yr−1) and RTiM: maize residue (10 t ha−1 yr−1) + Tithonia diversifolia (60 kg N ha−1 yr−1) + goat manure (60 kg N ha−1 yr−1). 3 Seasonal p-value is the GHG emissions statistical variation between SR19 and LR19 seasons. 4 Interaction between treatments (fixed factor) and season (random factor) on GHG emissions.
Table 4. Maize, grain yields, stem, root, leaf, and total biomass in Mg ha−1 in selected soil fertilization treatments at Kangutu site. Treatment means (n = 3) of grain, leaf, stem, root, and total biomass followed by an identical superscript letter within the same column do not differ at p ≤ 0.05.
Season 1Treatment 2Biomass (Mg ha−1)Total Biomass
GrainLeafStemRoot
LR19CtC0.001 b0.46 b0.25 b0.11 b0.83 b
Mf0.07 ab0.88 b0.29 b0.14 b1.38 b
RMf0.12 ab2.09 a1.05 a0.32 a3.58 a
RMfM0.30 a1.75 a0.82 a0.27 a3.14 a
RTiM0.20 ab1.87 a1.30 a0.30 a3.38 a
p value0.090.00090.00040.010.0005
SR19CtC3.79 c2.47 b1.87 d0.44 d8.57 d
Mf8.02 a3.75 a2.98 b0.51 c15.3 ab
RMf6.45 ab3.43 a2.83 b0.83 a13.6 bc
RMfM7.69 a3.72 a3.59 a0.79 ab15.8 a
RTiM5.38 bc3.40 a2.15 c0.75 b11.7 c
p value0.00140.0002<0.0001<0.0001<0.0001
Seasonal
p value 3
<0.0001<0.0001<0.0001<0.0001<0.0001
Interaction 40.00020.003<0.00010.014<0.0001
1LR19 = long rain 2019 season, SR19 = short rain 2019 season. 2 Treatments: CtC: control (no input), Mf: sole mineral fertilizer (120 kg N ha−1 yr−1), RMf: maize residue (10 t ha−1 yr−1) + mineral fertilizer (120 kg N ha−1 yr−1), RMfM: maize residue (10 t ha−1 yr−1) + mineral fertilizer (60 kg N ha−1 yr−1) + goat manure (60 kg N ha−1 yr−1) and RTiM: maize residue (10 t ha−1 yr−1) + Tithonia diversifolia (60 kg N ha−1 yr−1) + goat manure (60 kg N ha−1 yr−1). 3 Seasonal p-value is the maize crop yields, leaf, stem, root biomass, and total biomass variation between SR19 and LR19 seasons. 4 Interaction between treatments (fixed factor) and season (random factors) on grain, leaf, stem, root, and total biomass.
Table 5. Leaf Area Index (LAI) selected soil fertilization treatments at the Kangutu site. Treatment means (n = 3) of LAI followed by an identical letter within the same column do not differ at p ≤ 0.05.
Season 1Treatment 26th Leaf Stage10th Leaf Stage
LR 19CtC0.100.22 b
Mf0.220.69 ab
RMf0.340.94 a
RMfM0.300.38 ab
RTiM0.250.49 ab
p-value0.670.02
SR 19CtC1.60 b 2.87
Mf2.52 a 3.19
RMf1.56 b 2.14
RMfM2.67 a 3.24
RTiM1.71 b 3.08
p-value0.0010.58
Seasonal p value 3 <0.0001<0.0001
Interaction 4 0.010.47
1 SR 19 = short rains 2019 season, LR 19 = long rains 2019 season. 2 Soil inputs treatments: CtC: control (no input), Mf: sole mineral fertilizer (120 kg N ha−1 yr−1), RMf: maize residue (10 t ha−1 yr−1) + mineral fertilizer (120 kg N ha−1 yr−1), RMfM: maize residue (10 t ha−1 yr−1) + mineral fertilizer (60 kg N ha−1 yr−1) + goat manure (60 kg N ha−1 yr−1) and RTiM: maize residue (10 t ha−1 yr−1) + Tithonia diversifolia (60 kg N ha−1 yr−1) + goat manure (60 kg N ha−1 yr−1). 3 Seasonal p-value is the LAI variation between SR 19 and LR 19 seasons. 4 Interaction between treatments (fixed factor) and season (random factor) on LAI with the season as a random factor.
Table 6. Yield-scaled N2O emission (YSE), N2O emission factors (EFs), net global warming potential (netGWP), annual grain yields, and greenhouse gas intensities (GHGI) under selected soil fertilization treatments at Kangutu site. Treatments means (n = 3) followed by an identical letter within the same column do not differ p ≤ 0.05.
Treatment 1N2O YSE 2
[g N2O-N kg−1 Grain Yield]
N2O EF 3
[%]
ΔSOC 4
(Mg CO2-eq ha−1)
Net-GWP 5
(Mg CO2-eq ha−1)
Grain Yield 6
(Mg ha−1)
GHGI 7
(Kg CO2-eq kg−1 Grain Yield)
CtC0.029 c −0.93 b3.39 b 3.79 c 0.90 ab
Mf0.021 d0.05 c−0.46 c16.9 a8.09 a 2.15 a
RMf0.020 d0.02 d3.43 a −12.6 c6.57 ab−1.89 c
RMfM 0.035 b0.14 a 2.82 a −10.4 c7.98 a −1.33 b
RTiM 0.043 a0.11 b3.99 a −14.7 c5.58 b−2.81 c
p value<0.0001<0.0001<0.0001<0.00010.00110.0002
1 Soil inputs treatments: CtC: control (no inputs), Mf: sole mineral fertilizer (120 kg N ha−1yr−1), RMf: maize residue (10 t ha−1 yr−1) + mineral fertilizer (120 kg N ha−1 yr−1), RMfM: maize residue (10 t ha−1 yr−1) + mineral fertilizer (60 kg N ha−1 yr−1) + goat manure (60 kg N ha−1 yr−1) and RTiM: maize residue (10 t ha−1 yr−1) + Tithonia diversifolia (60 kg N ha−1 yr−1) + goat manure (60 kg N ha−1 yr−1). 2 N2O yield scaled emission (YSE) is maize grain yield divided by cumulative annual N2O emission. 3 N2O emission factor (EF) isN2O emissions in N applied treatments minus N2O emissions control treatment and then divided by total nitrogen applied per year (120 kg N ha−1 yr−1). 4 ΔSOC is soil organic carbon stock change (kg CO2-eq ha−1) calculated by multiplying the change in soil organic carbon (g kg−1 Soil), depth (m), bulk density (g cm−3), 10,000(m2). 5 net-Global warming potential (net-GWP) is multiplying CH4 and N2O emissions by their respective radiative forcing potential of 28 and 265, respectively. 6 Grain yield is annual grain yields calculated by summation of the grain yields of long rains and short rains of 2019. 7 Greenhouse gas intensity (GHGI) is the GWP divided by annual grain yields.
Table 7. Annual soil GHG fluxes and soil environmental factors correlation in Kangutu site.
ParameterCH4CO2N2O
(kg CH4-C ha−1)(kgCO2-C ha−1)(kg N2O-N ha−1)
Bulk density(g cm−3)0.07 1−0.65 **−0.58 *
pH−0.430.66 **0.45
Carbon (%)0.130.380.27
Nitrogen (%)0.10.340.19
C/N ratio0.140.330.33
Root Biomass(Mg/ha)0.290.65 **0.72 **
Soil moisture (WFPS %)0.10.72 **0.87 **
Ammonium NH4+-N (mg N kg−1) 0.050.440.2
Nitrate NO−3-N (mg N kg−1)−0.67 **0.240.29
Inorganic Nitrogen IN (mg N kg−1)−0.350.420.29
LAI (Leaf Area Index)0.370.440.61 *
* = p < 0.05, ** = p < 0.01, 1 = Rho values.
Publisher’s Note: MDPI stays neutral with regard to jurisdictional claims in published maps and institutional affiliations.

