
A Comparison of Different Renewable-Based DC Microgrid Energy Management Strategies for Commercial Buildings Applications
 ,
,  ,
,
Abstract
:1. Introduction
- Design-updated EMSs based on the pre-mentioned conventional EMS: FLC, SMC, ECMS, and EEMS for stationary applications such as commercial building power systems.
- Evaluate the performance of each one of the proposed EMS.
- Realization of comparative study in terms of the power-saving, system efficiency, and power quality specifications.
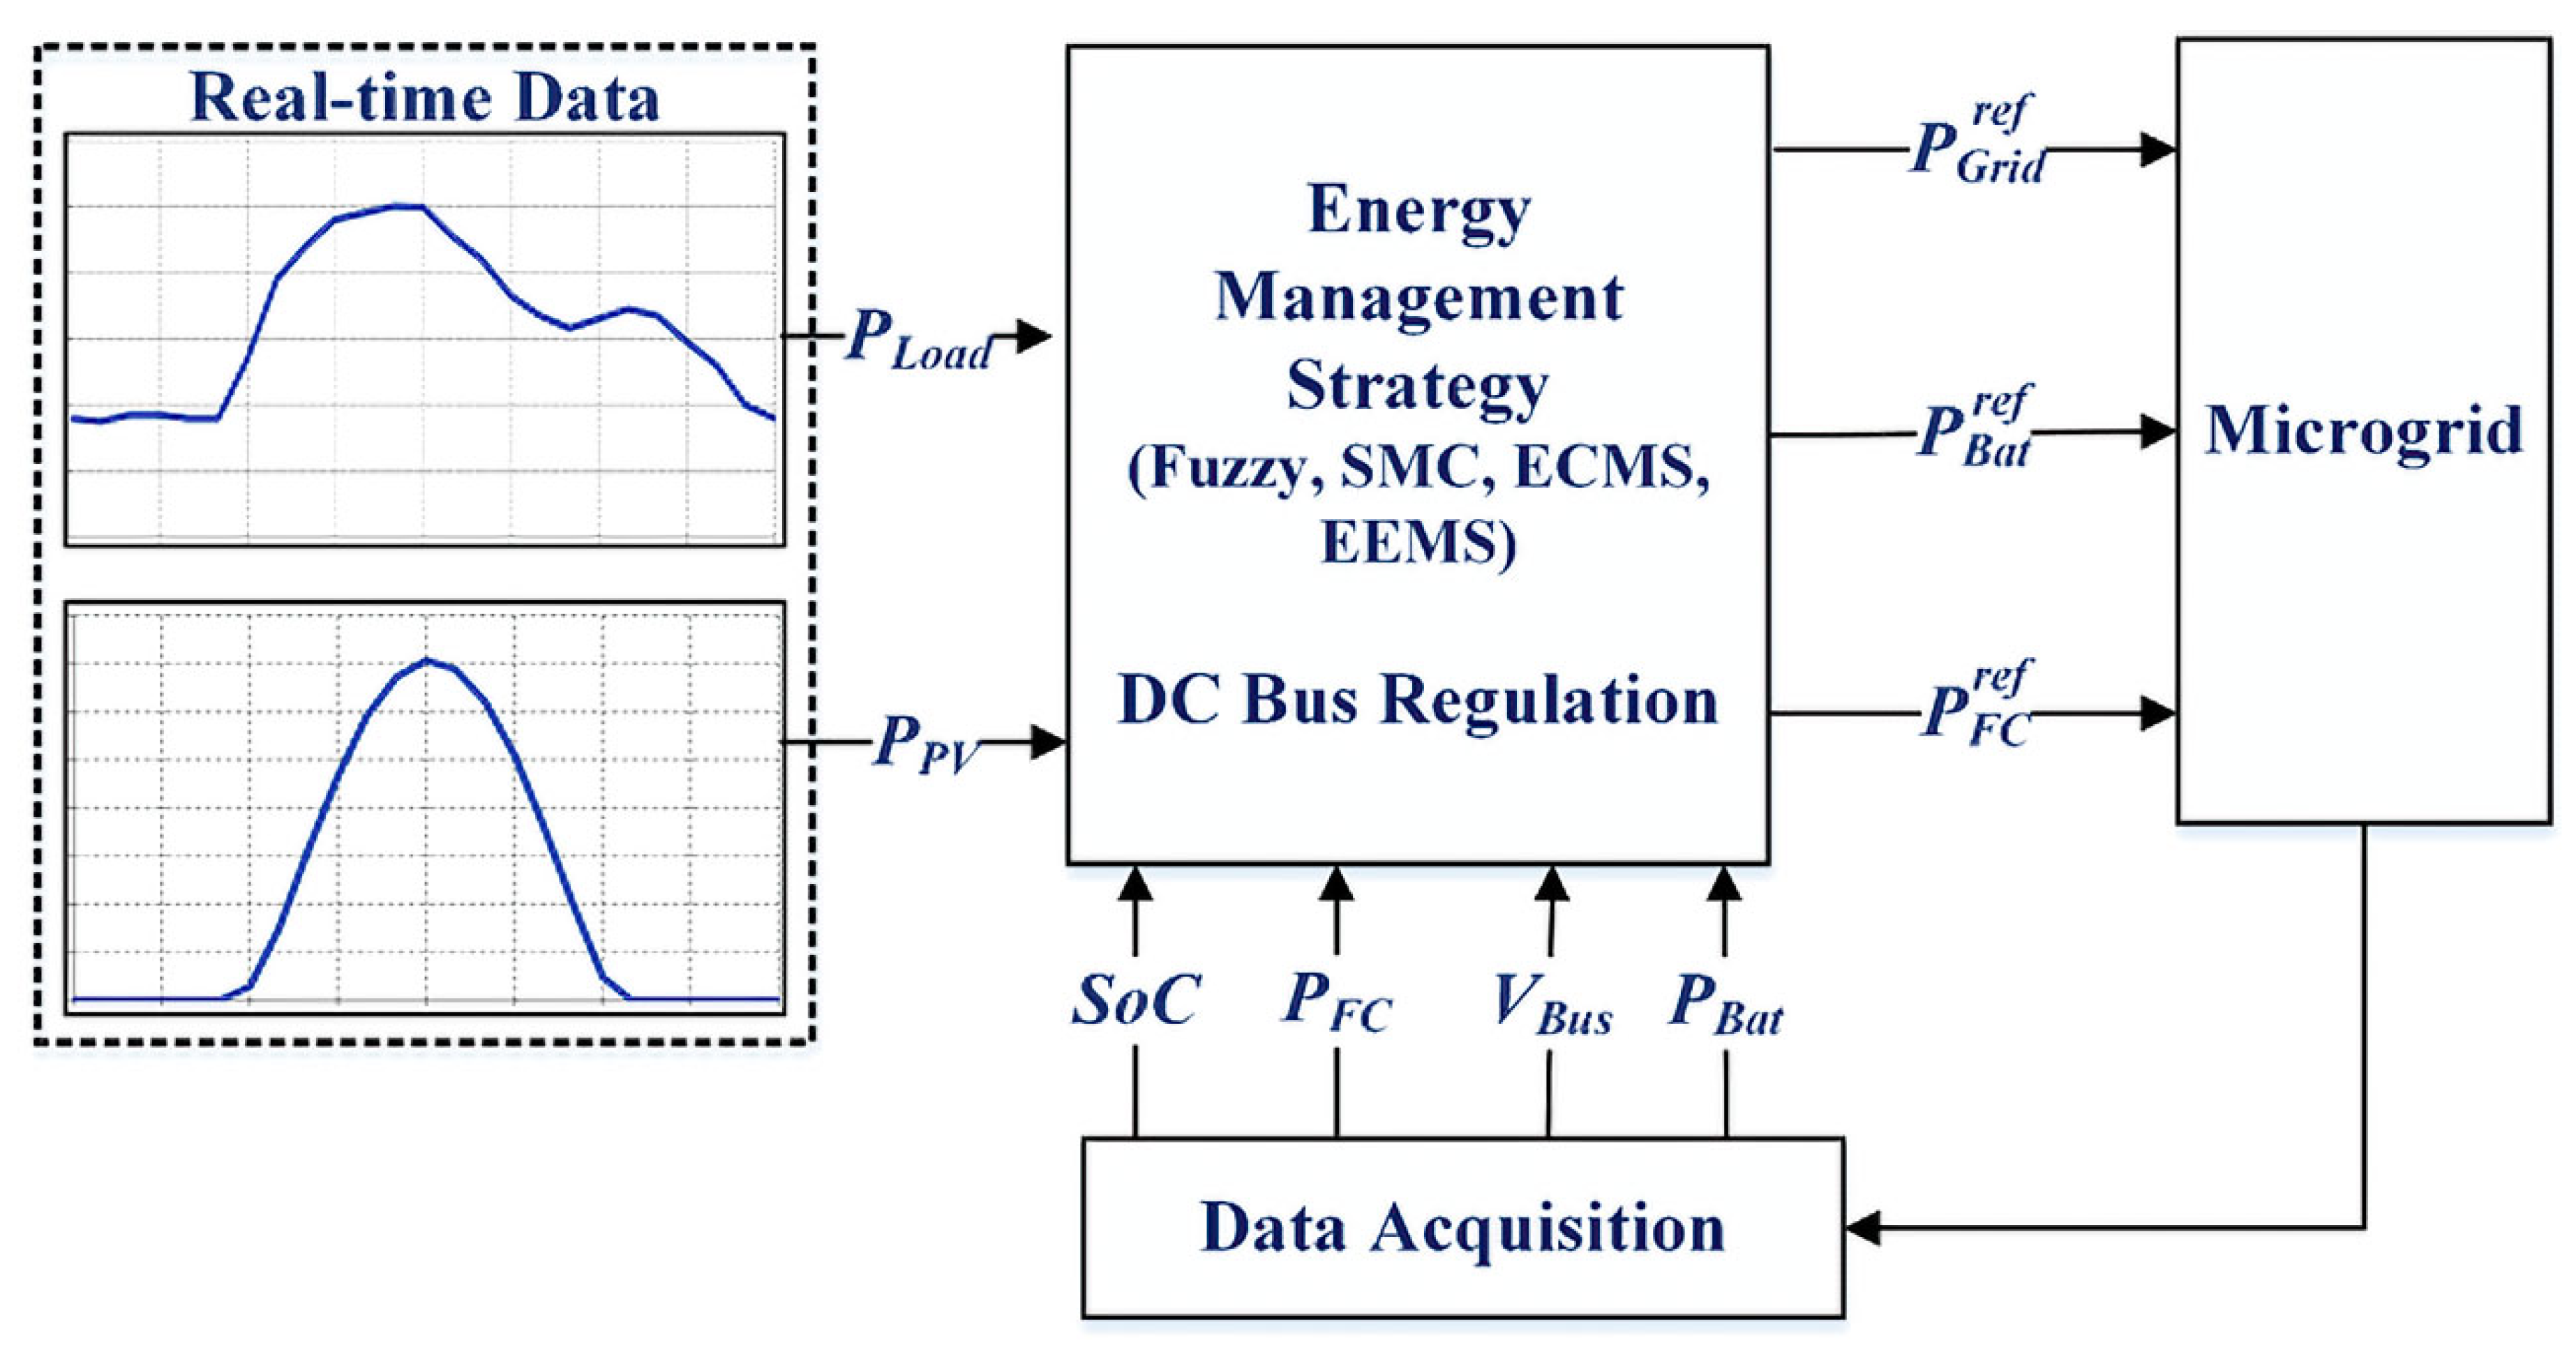
2. Building Power System Modeling
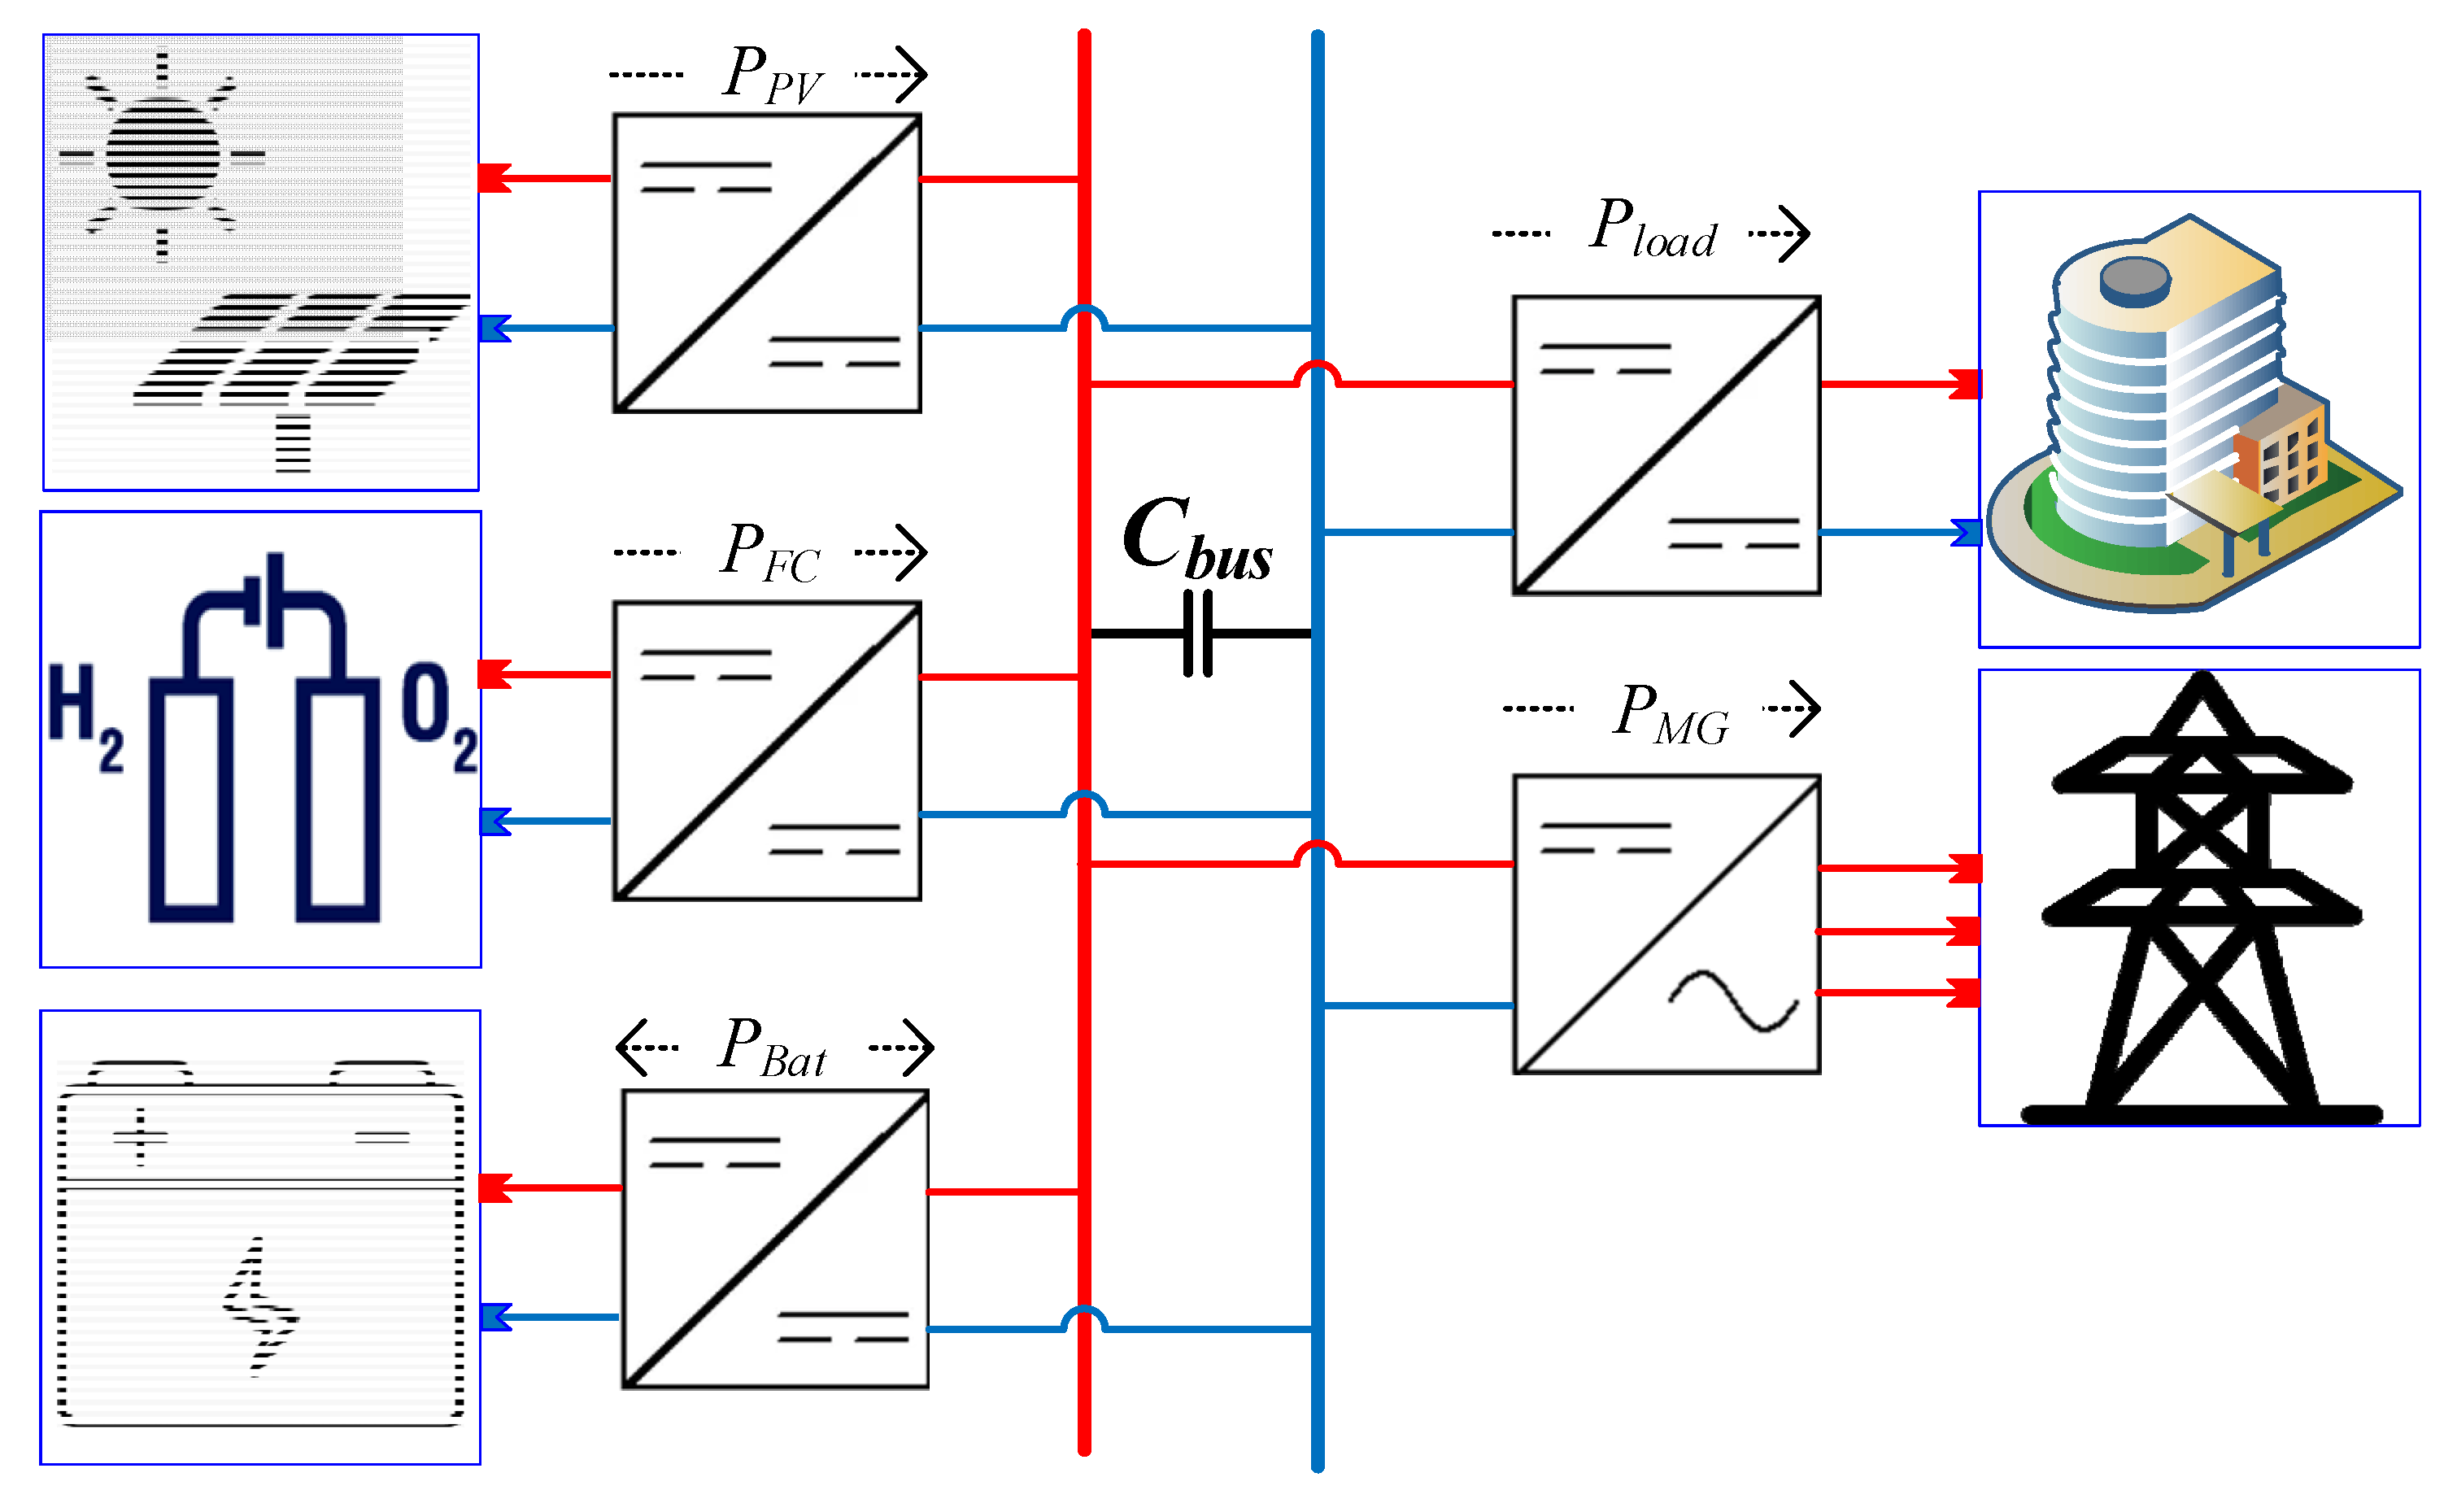
2.1. Power System Description
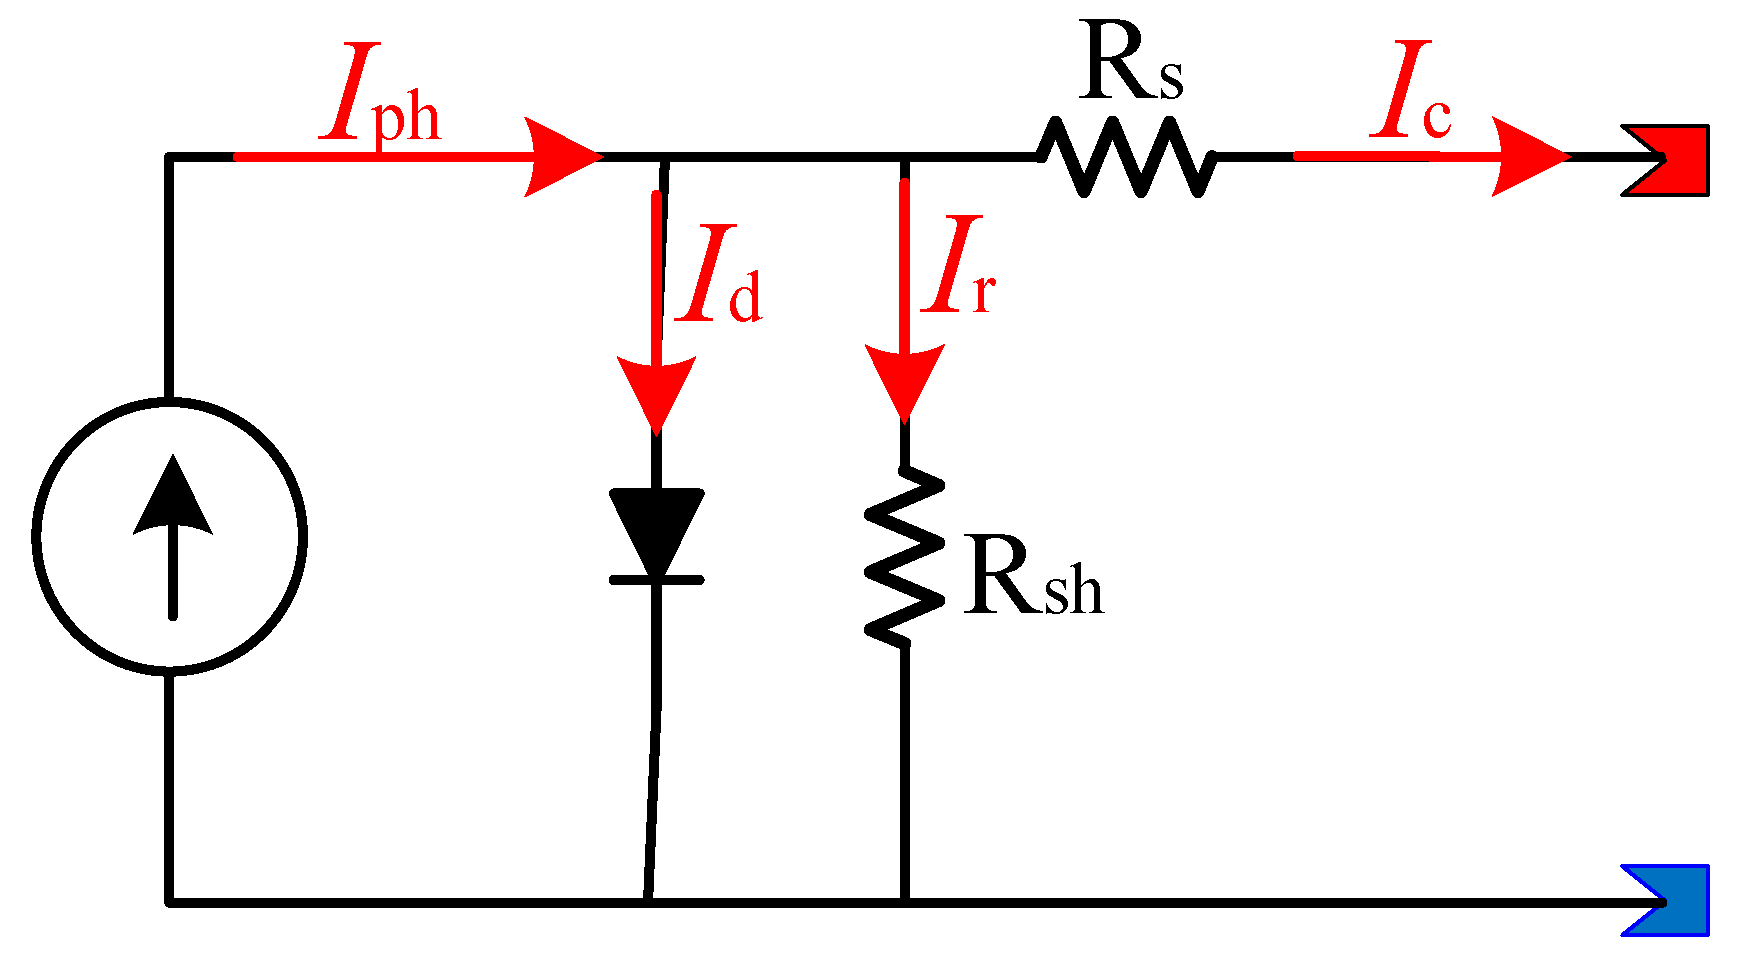
2.2. Modeling of PV Array
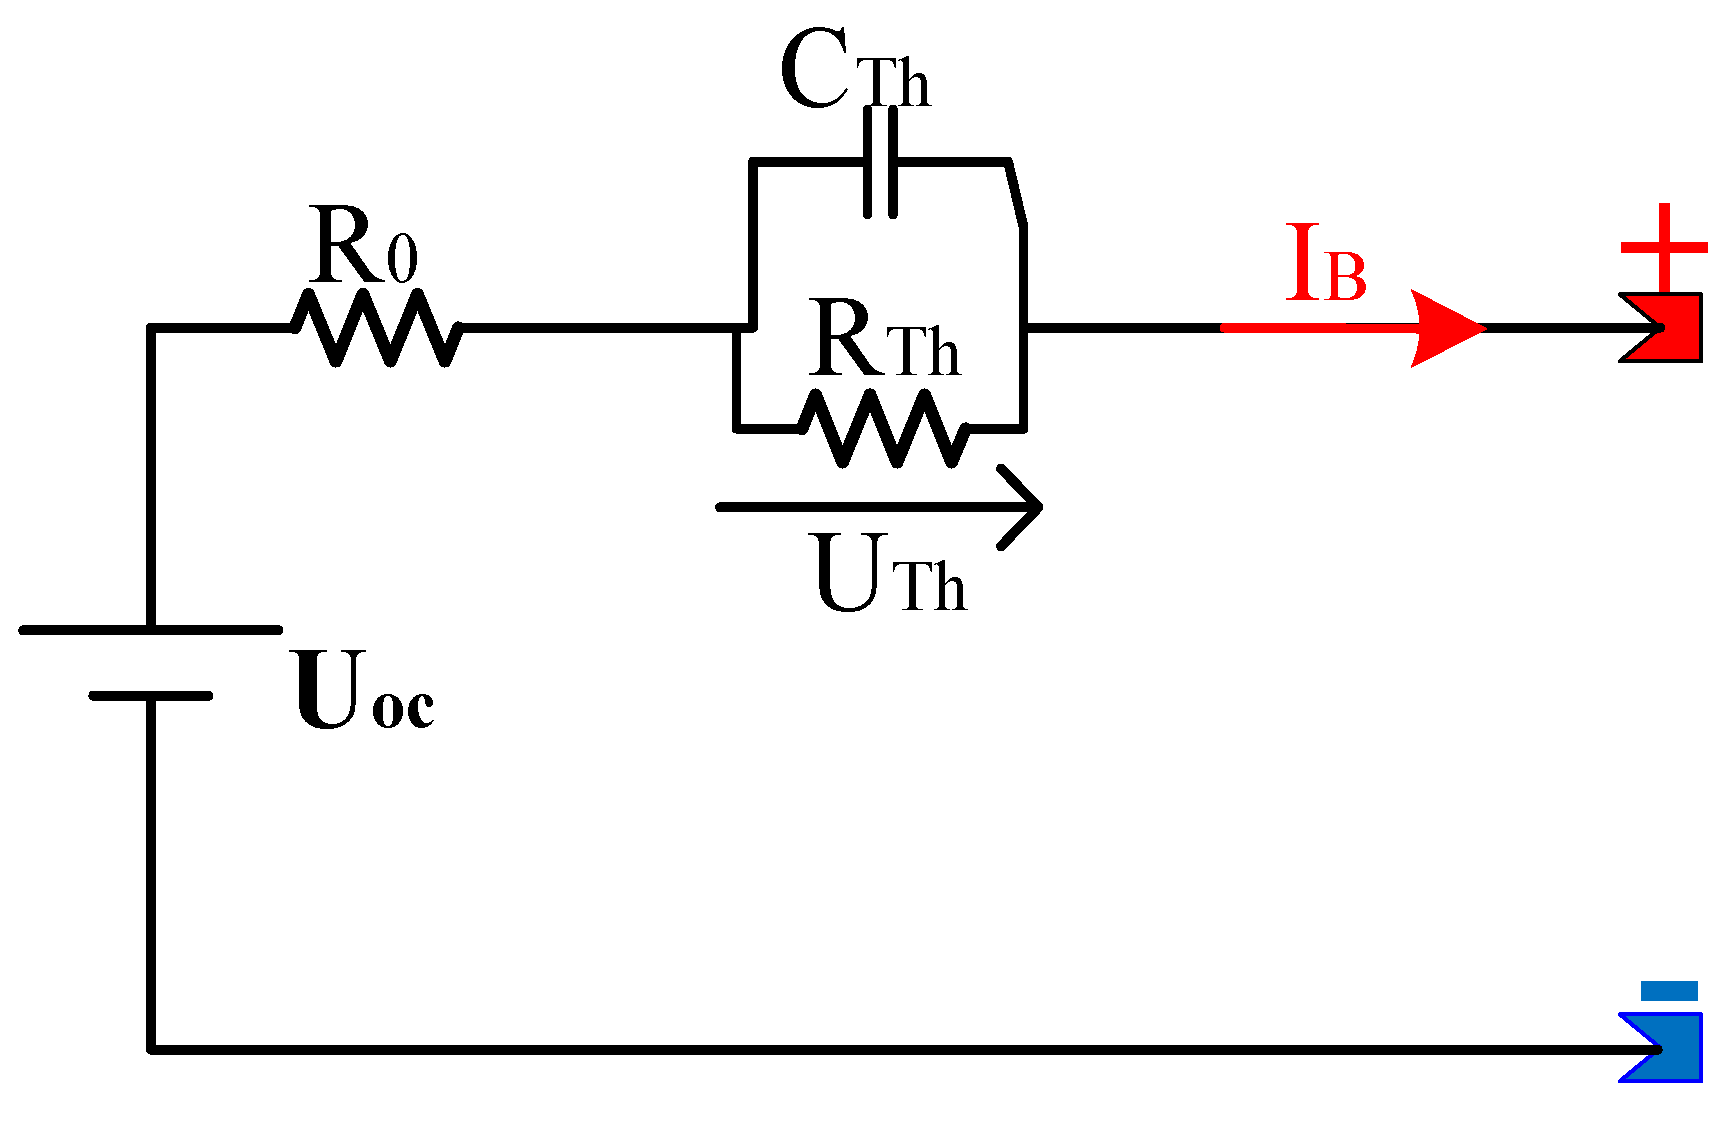
2.3. Battery Description and Modeling
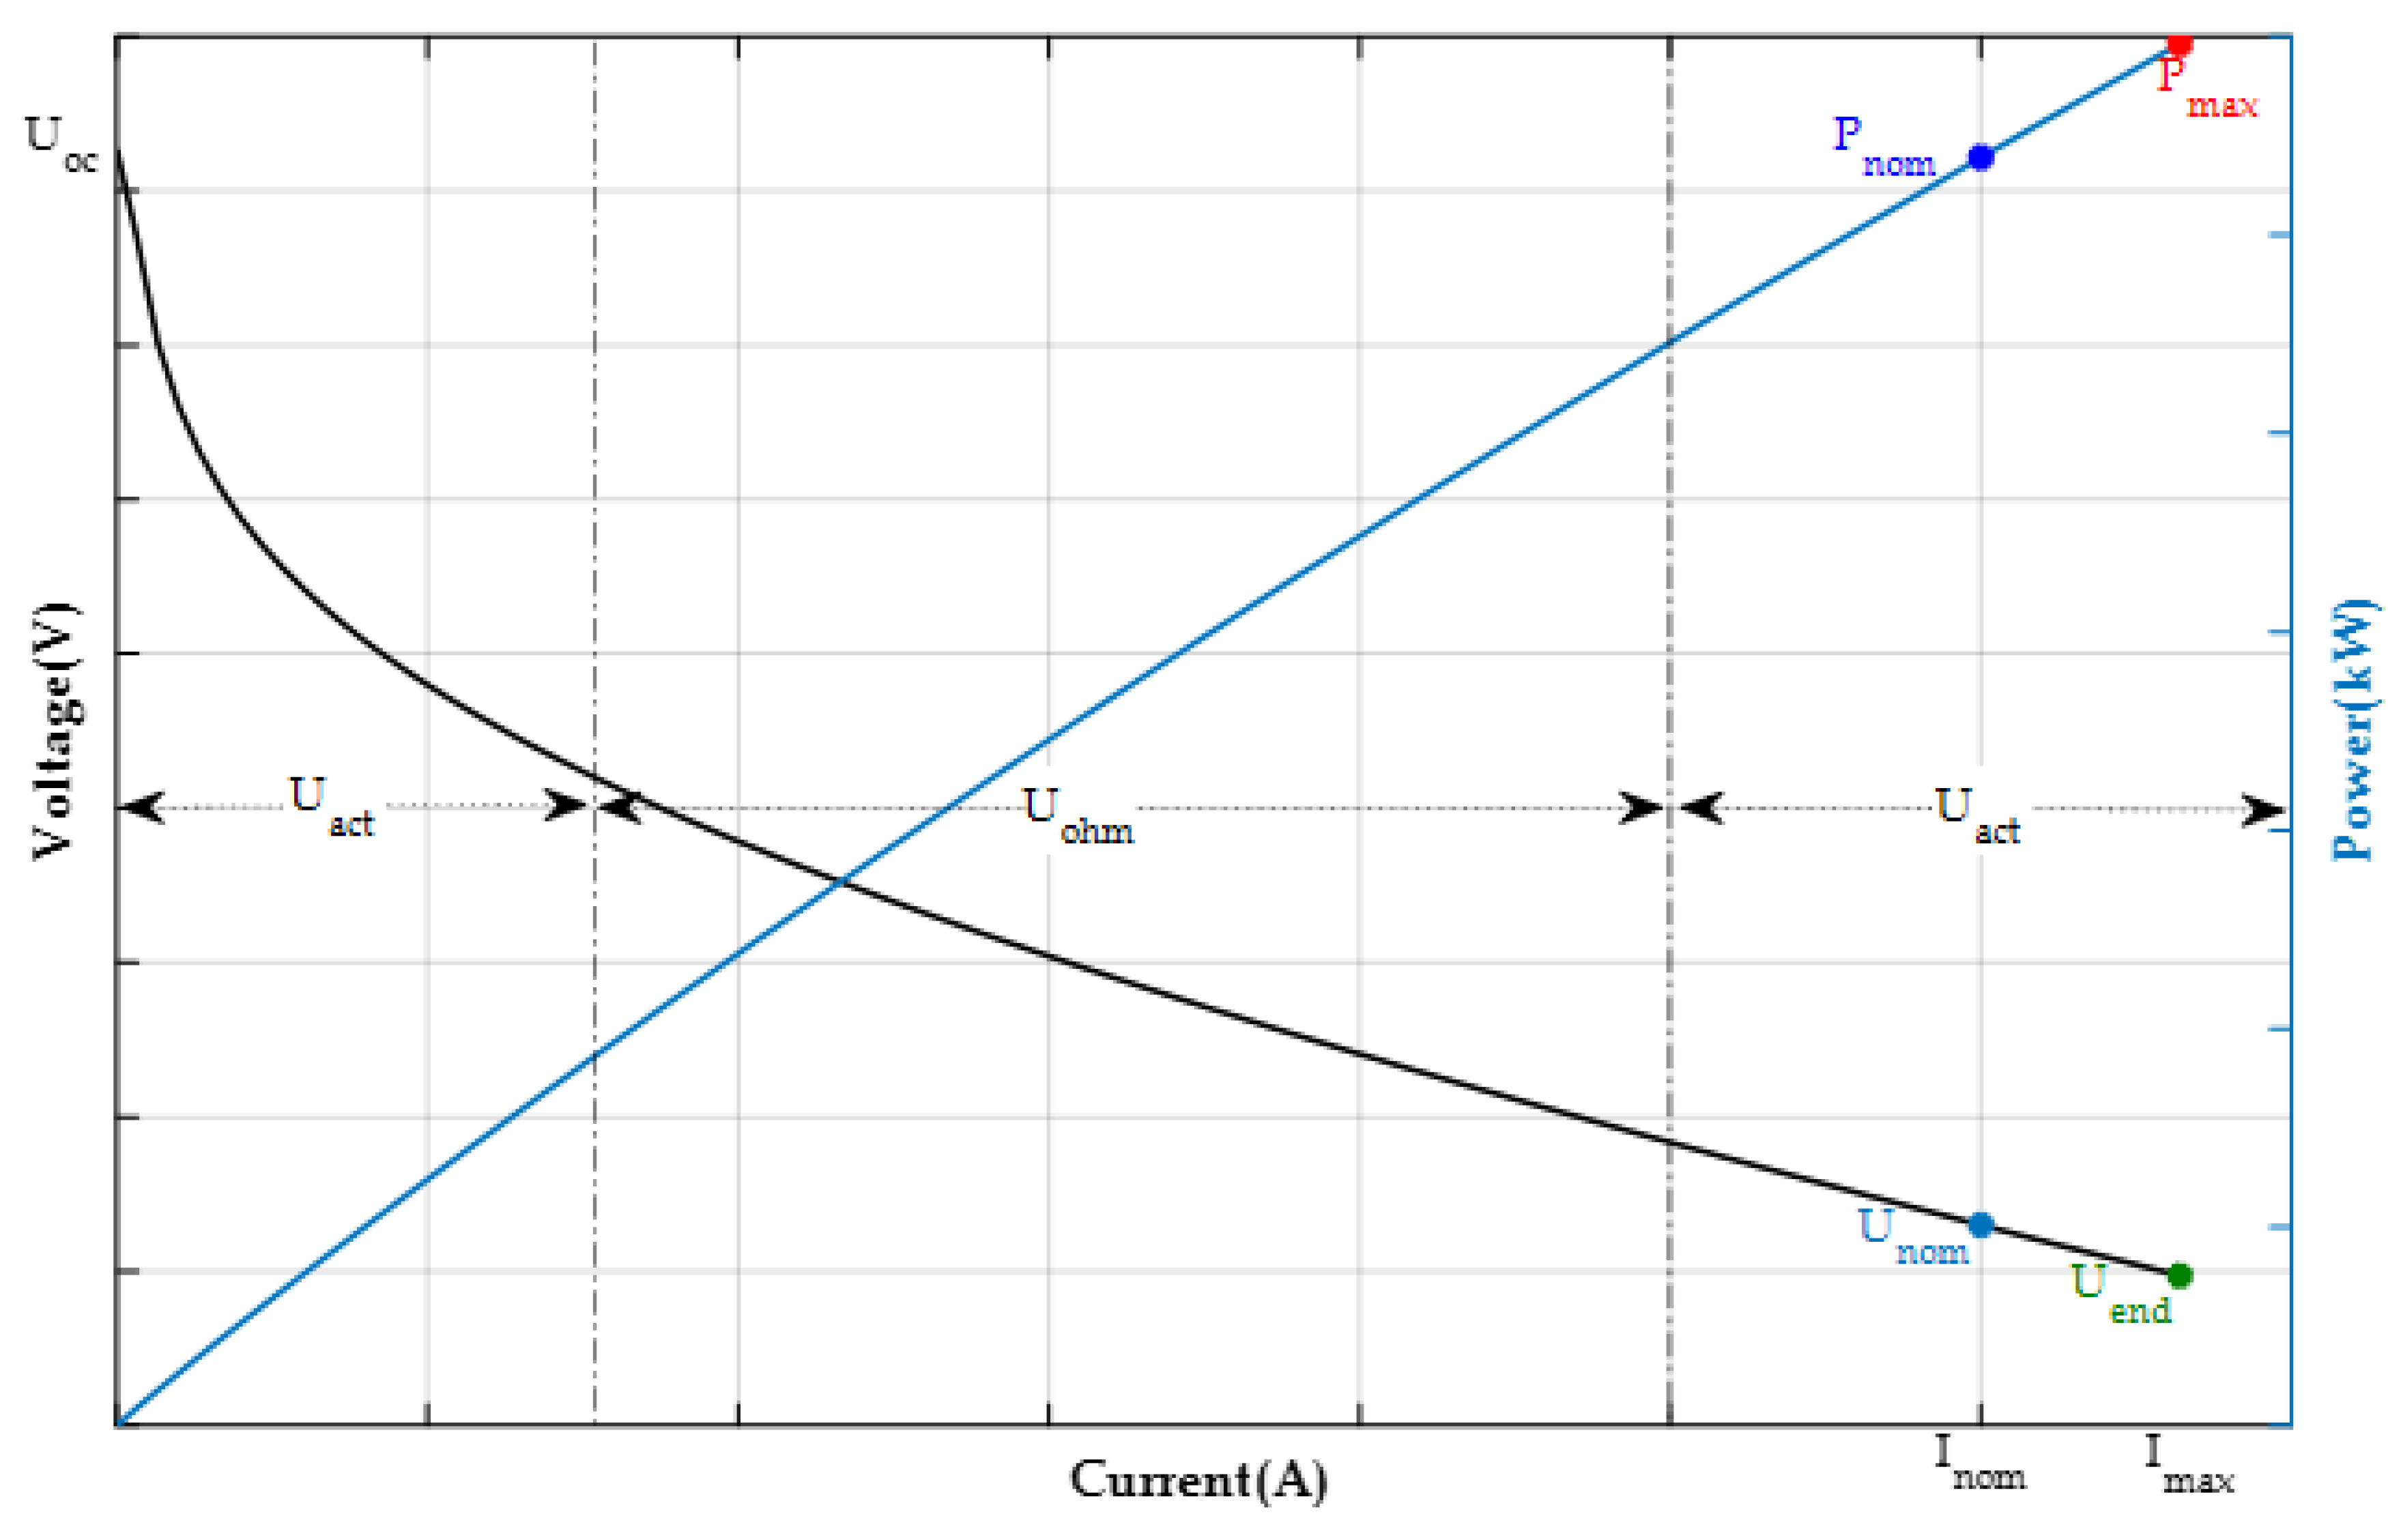
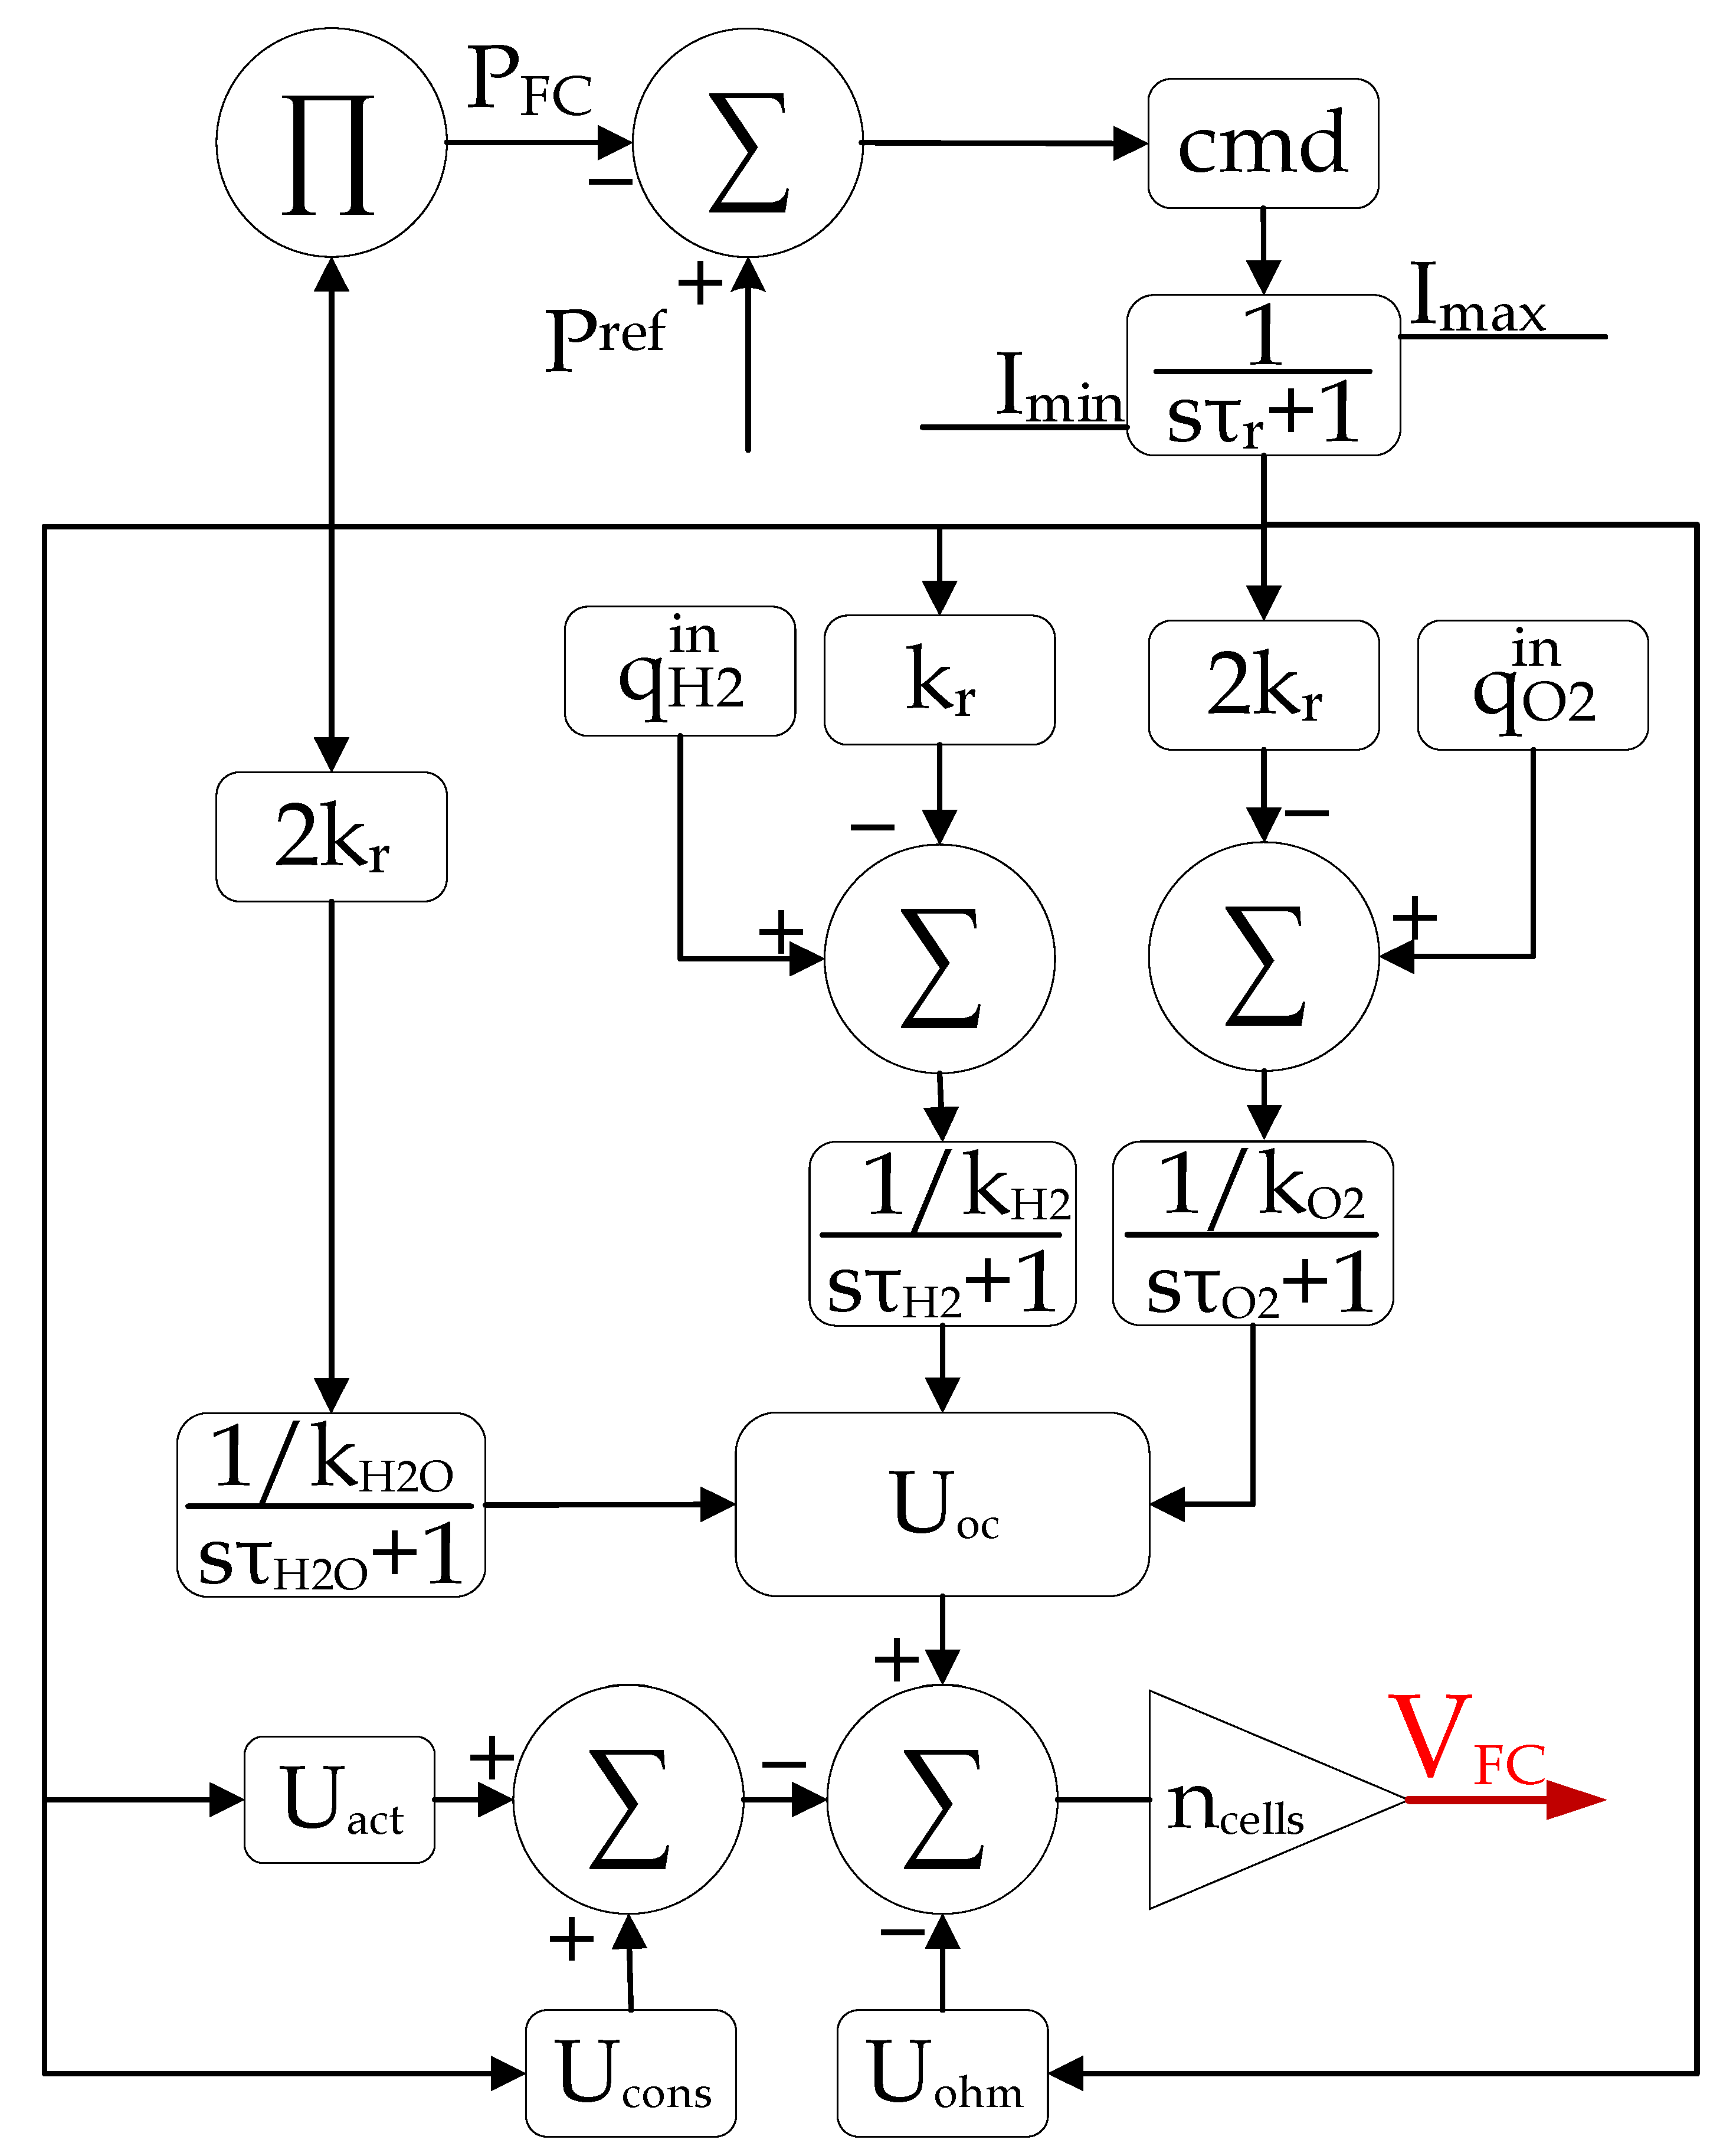
2.4. SOFC Description and Modeling
3. Energy Management Strategy
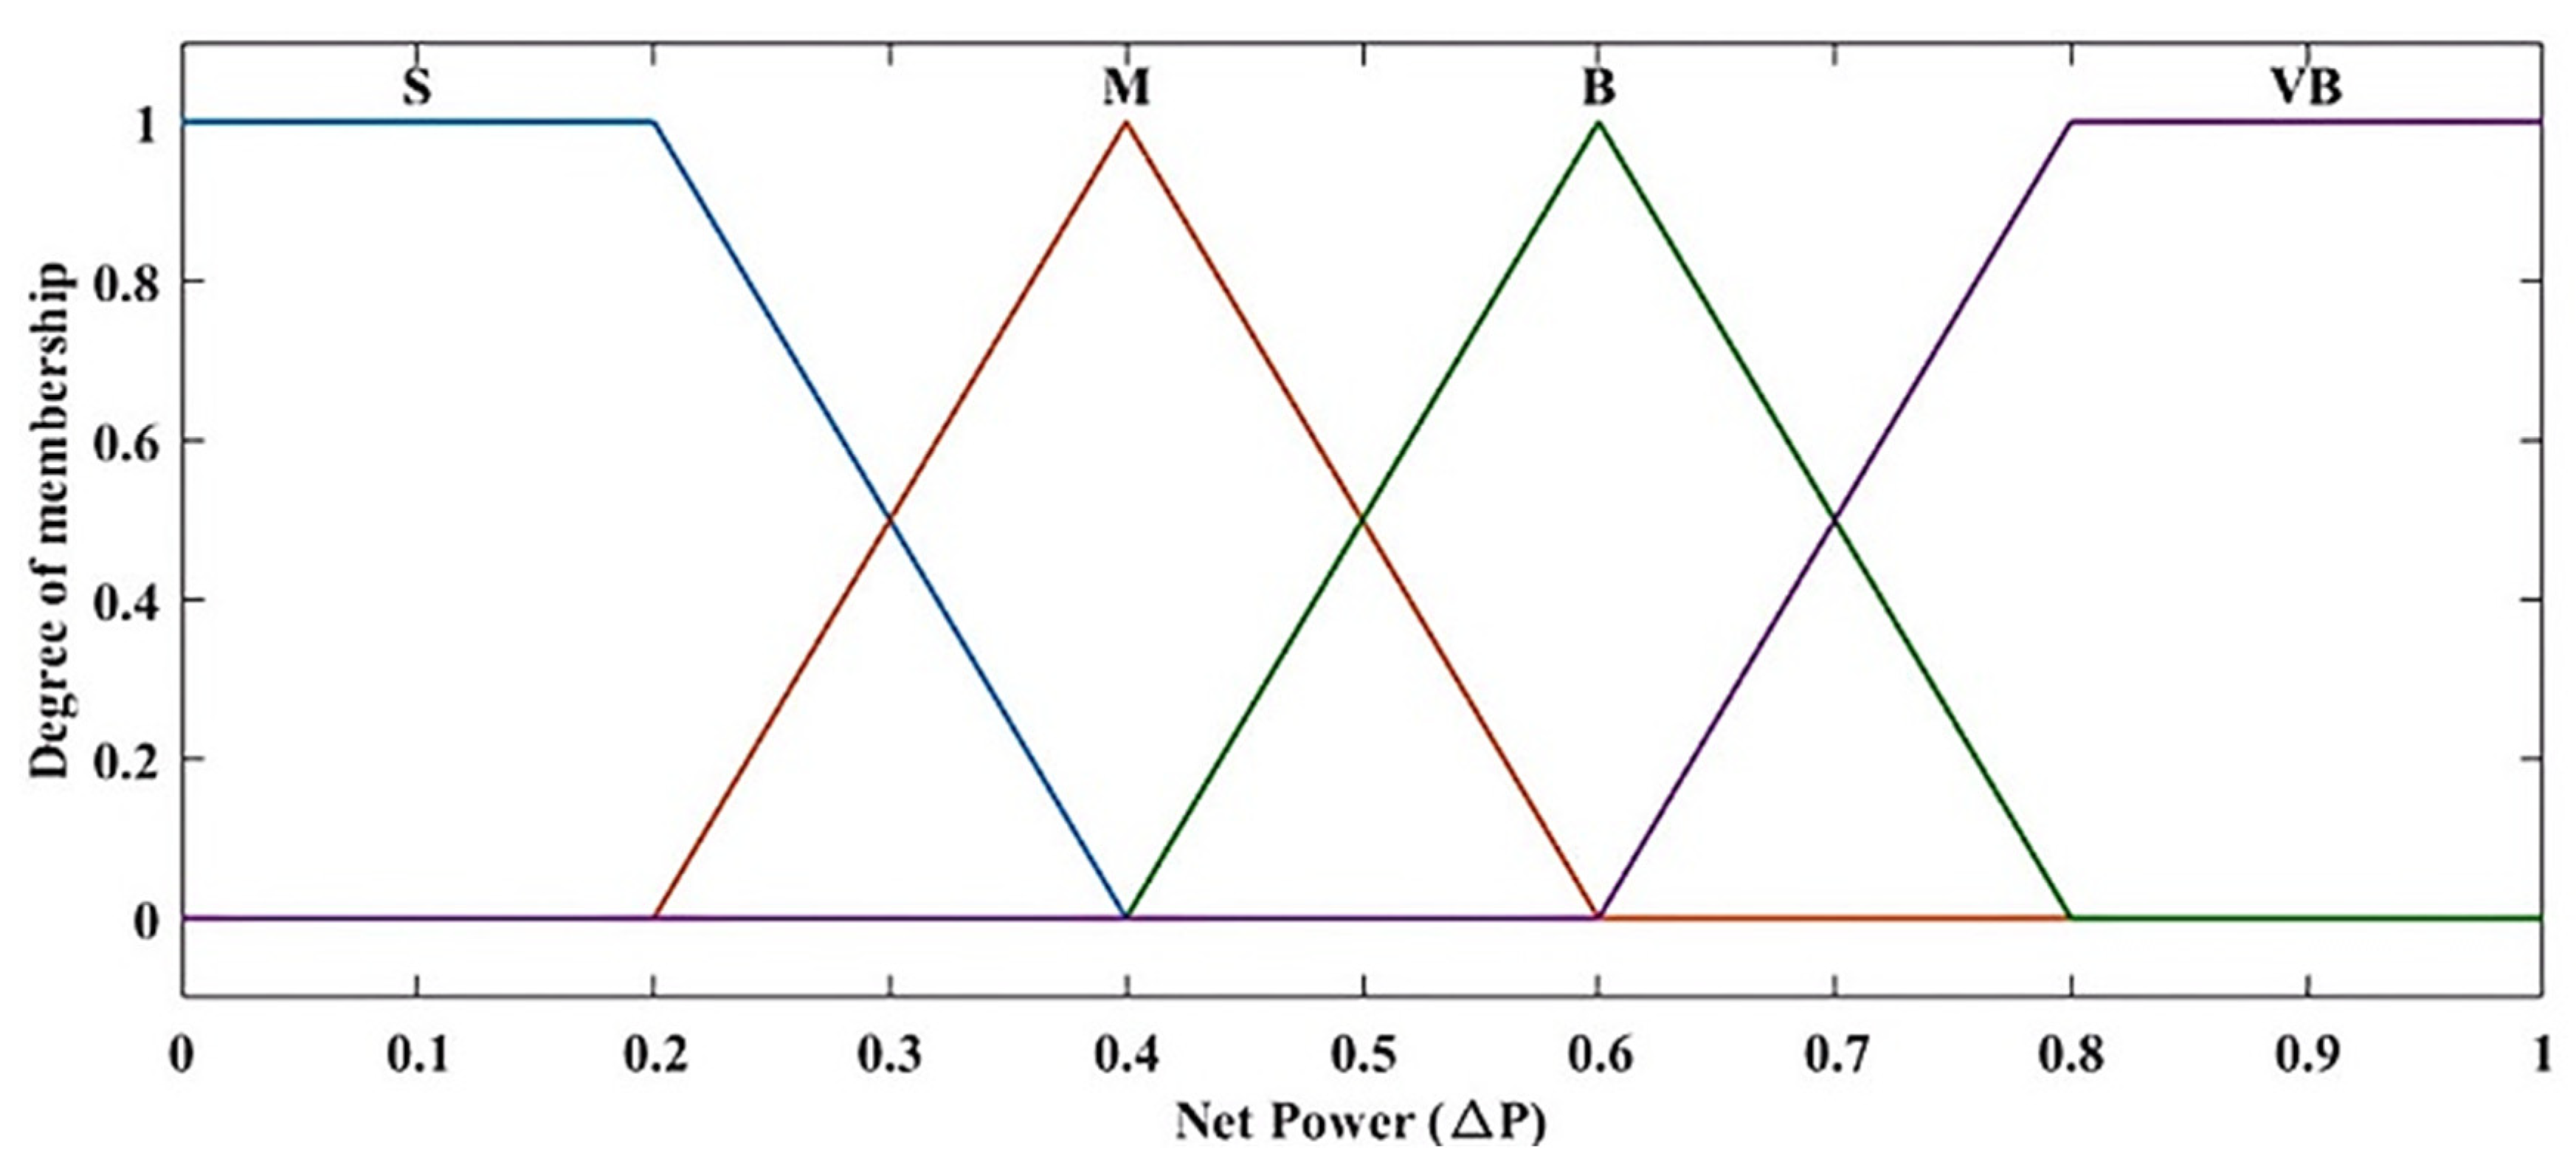
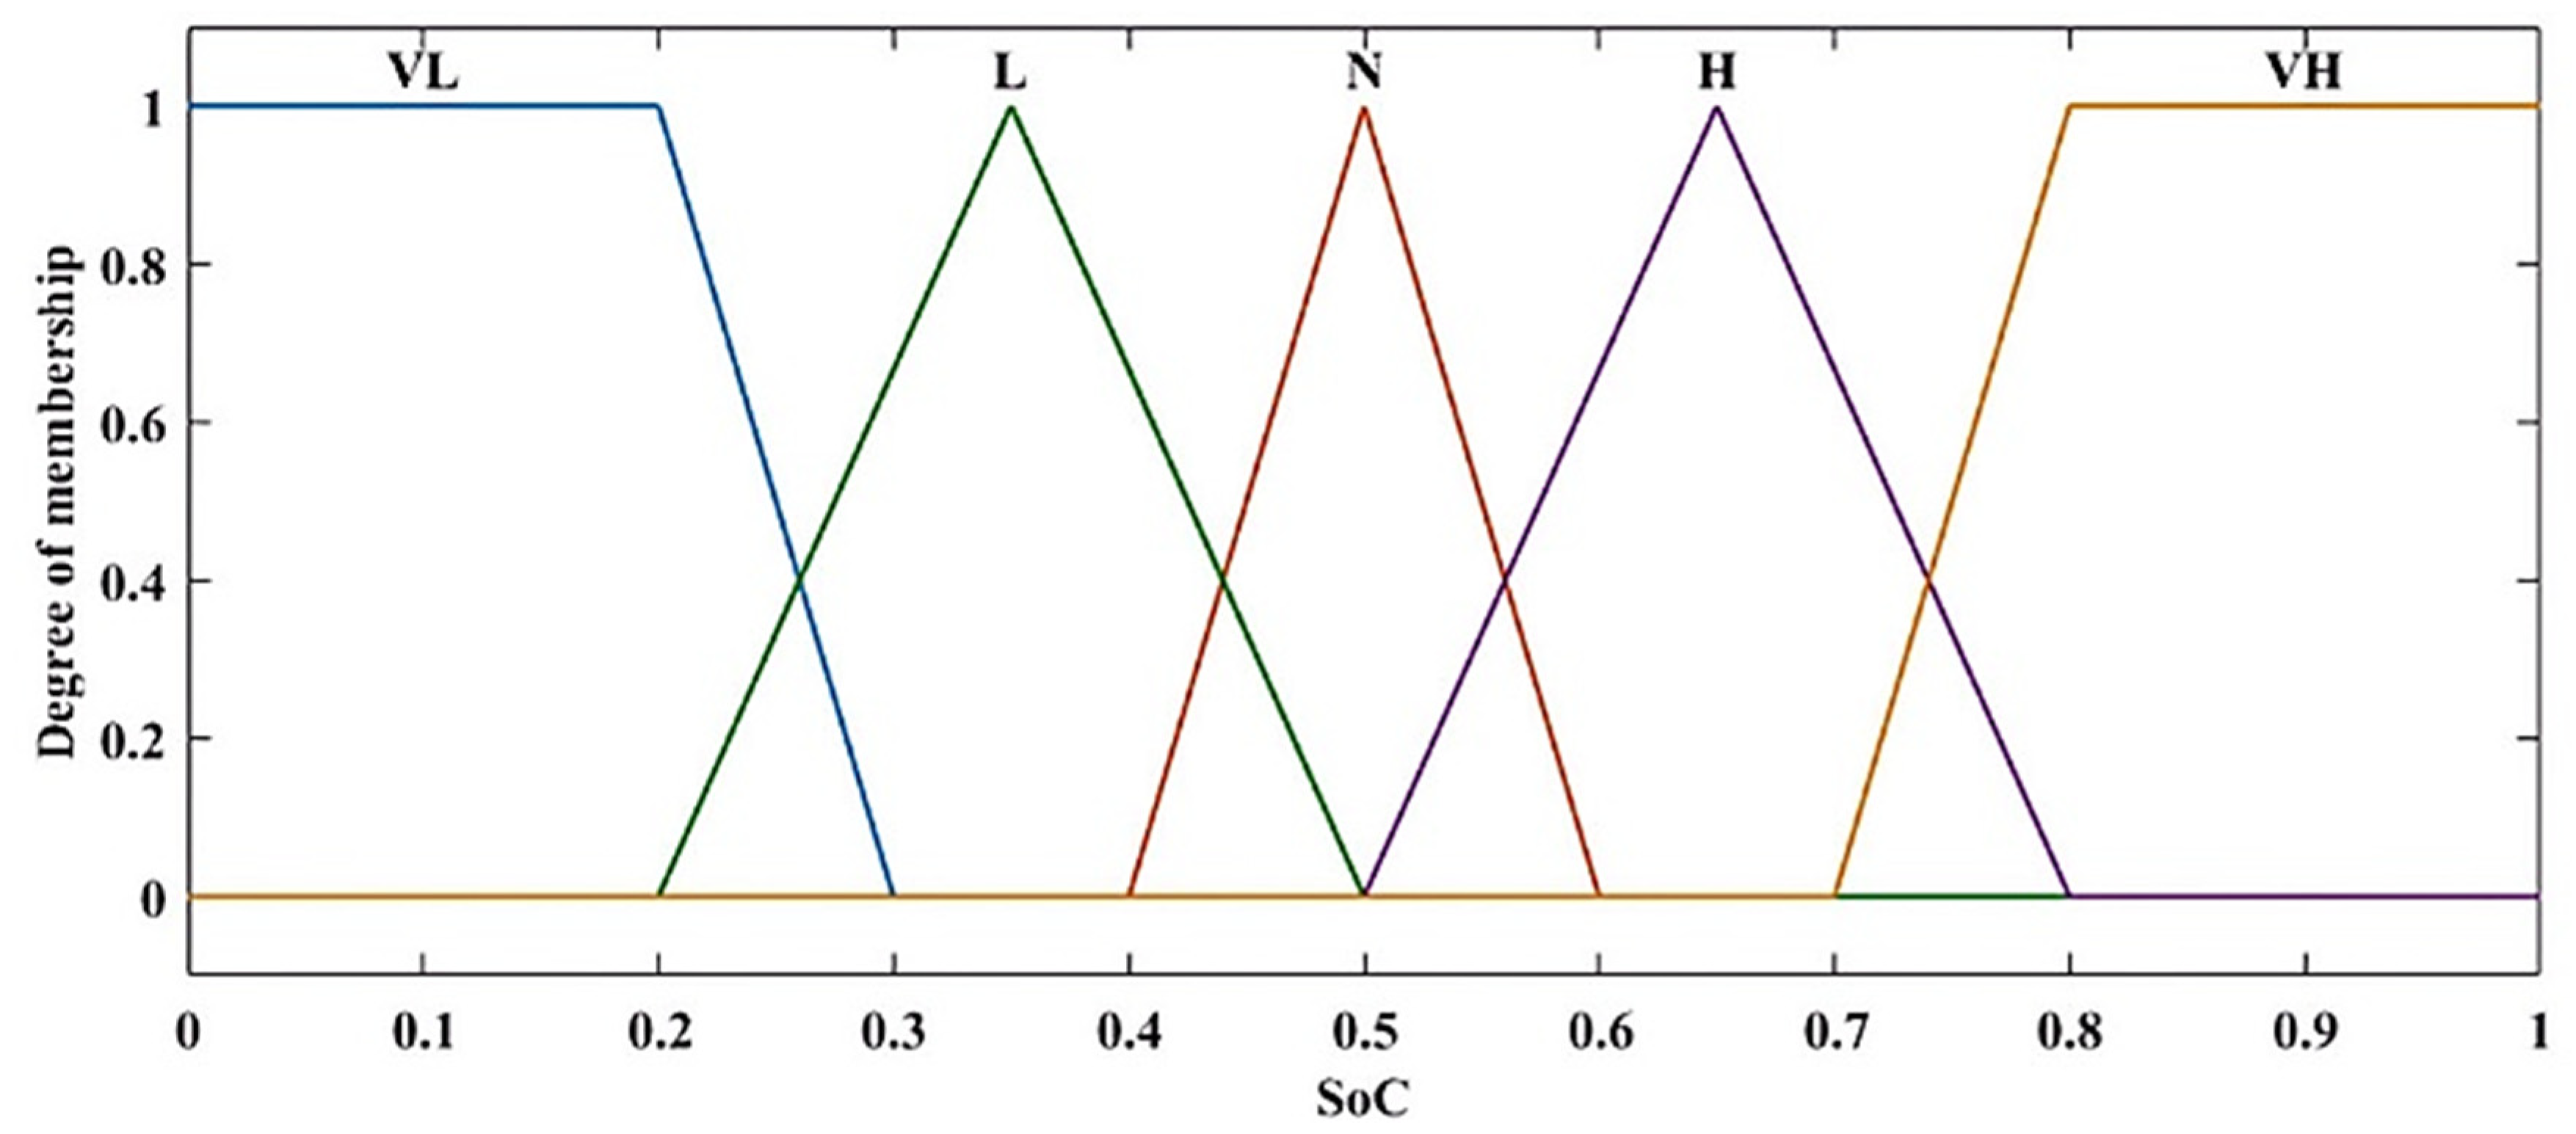
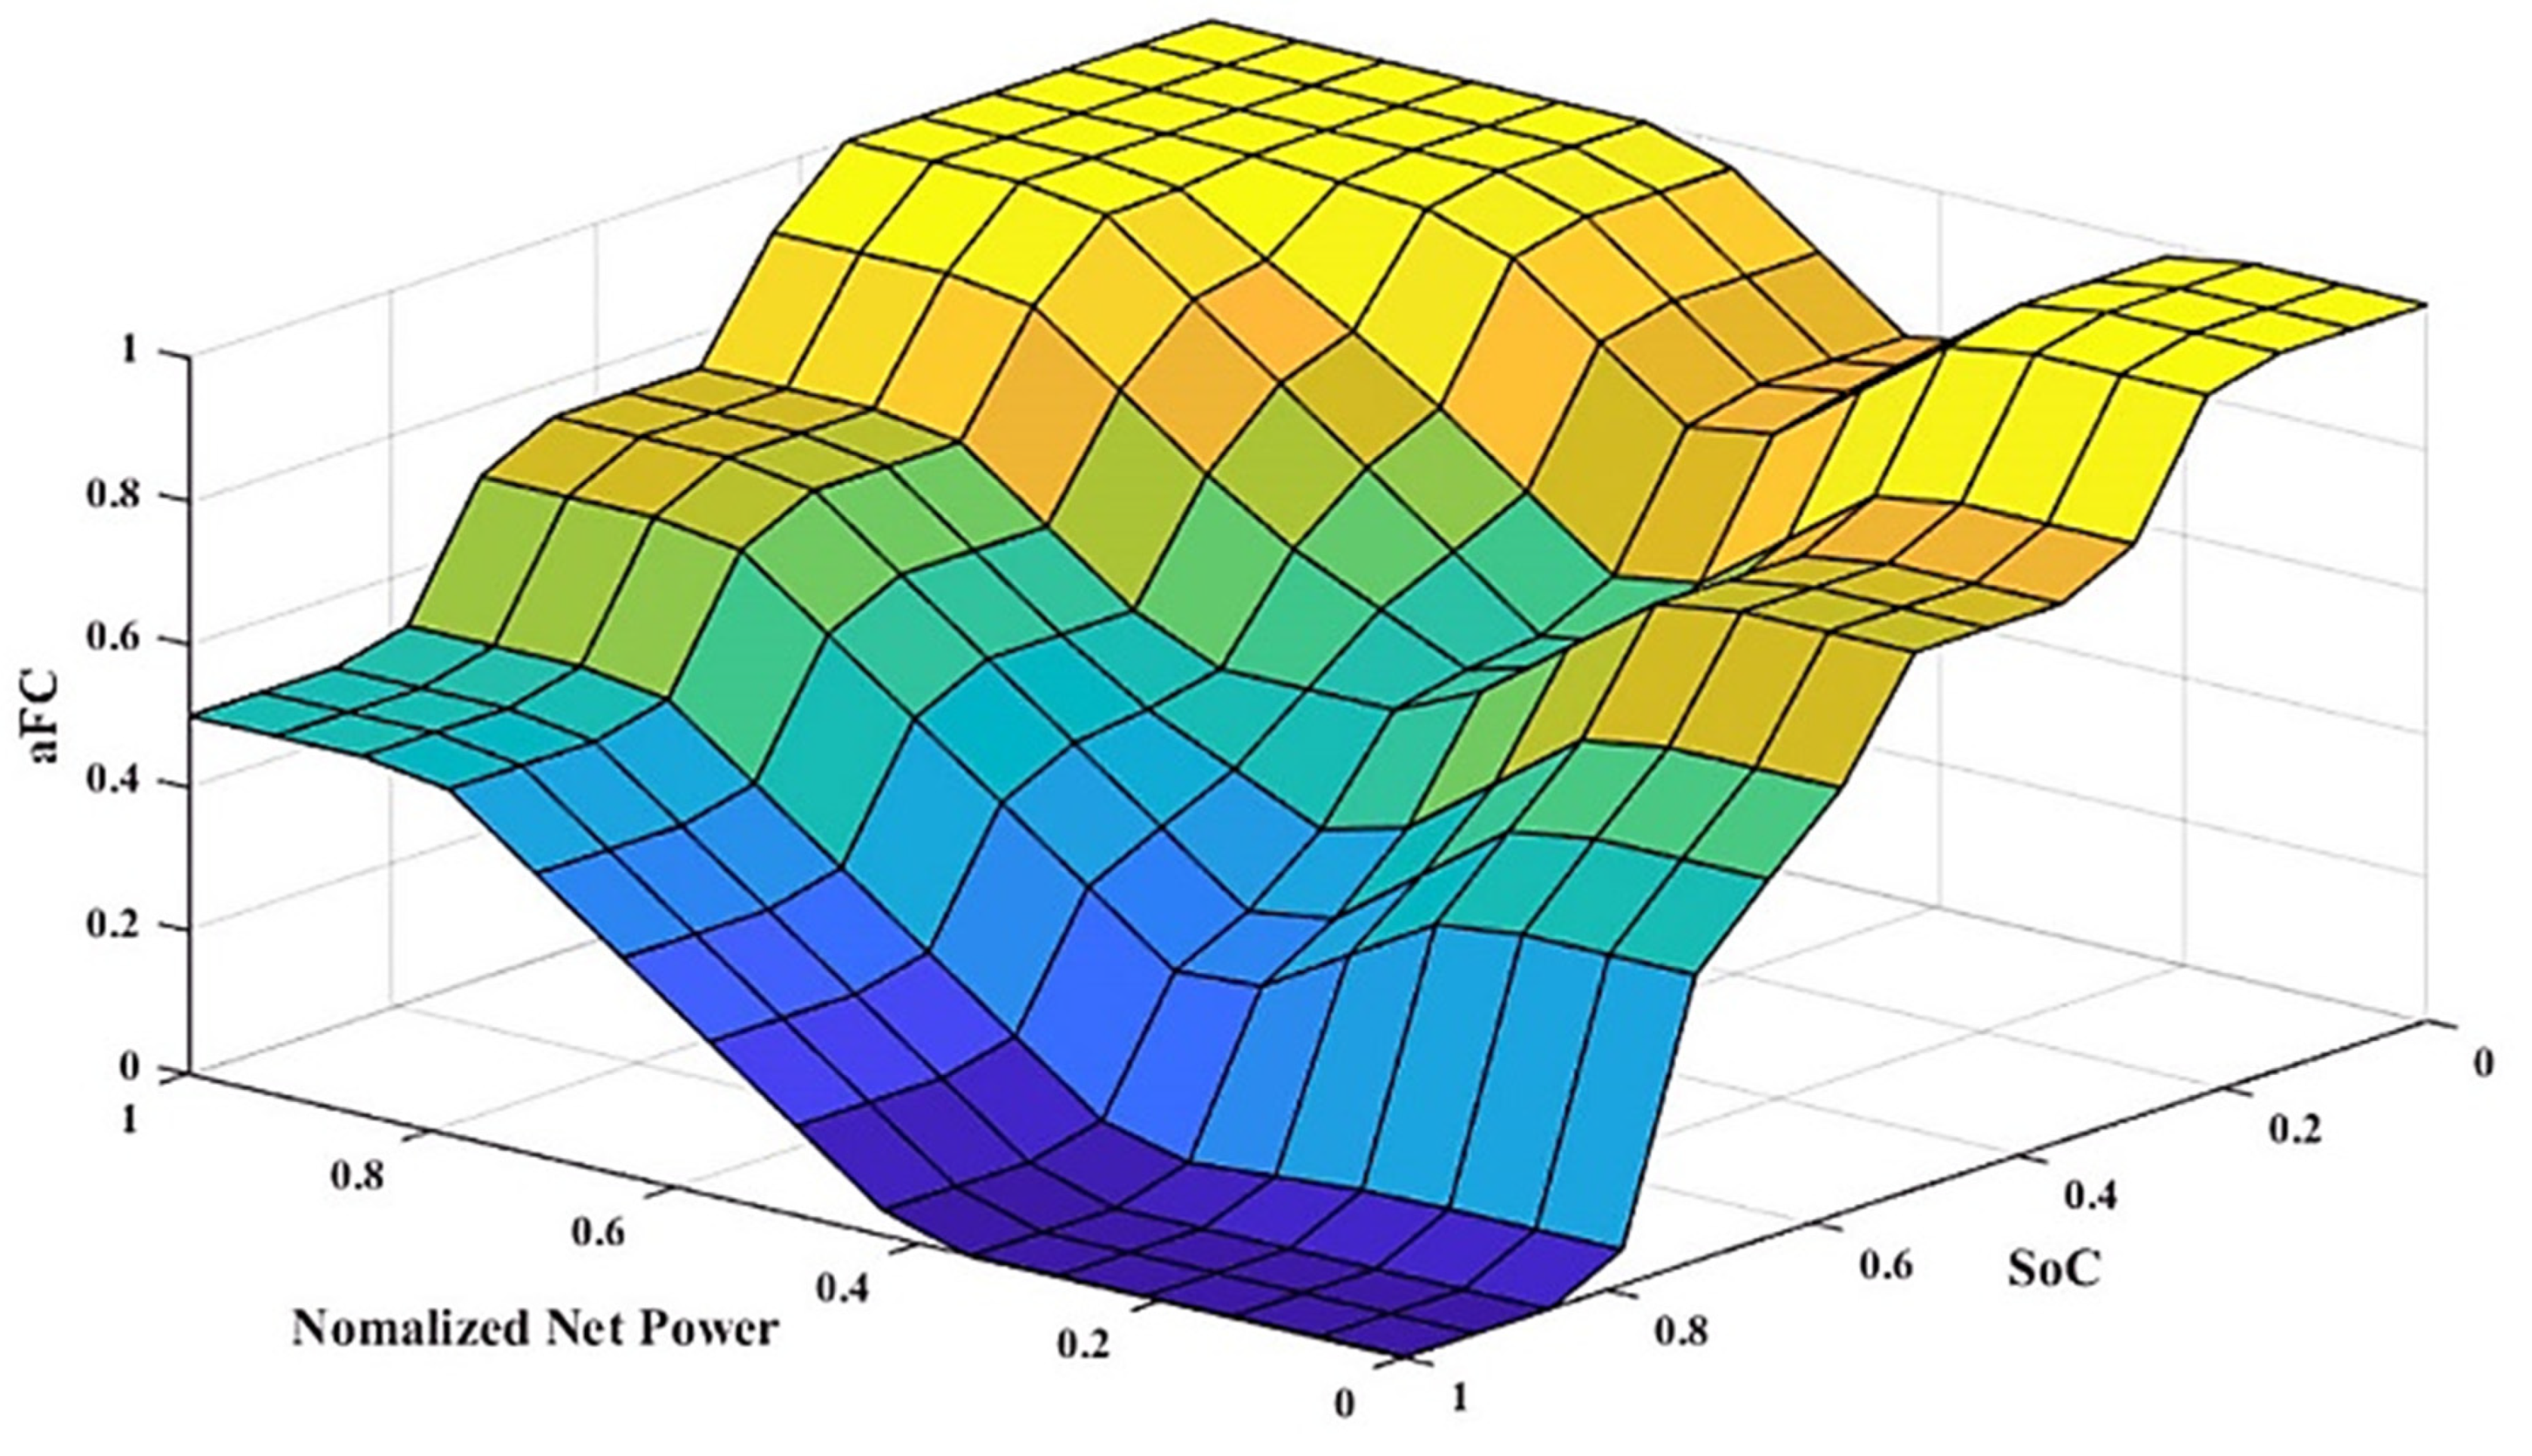
3.1. Fuzzy-Based EMS
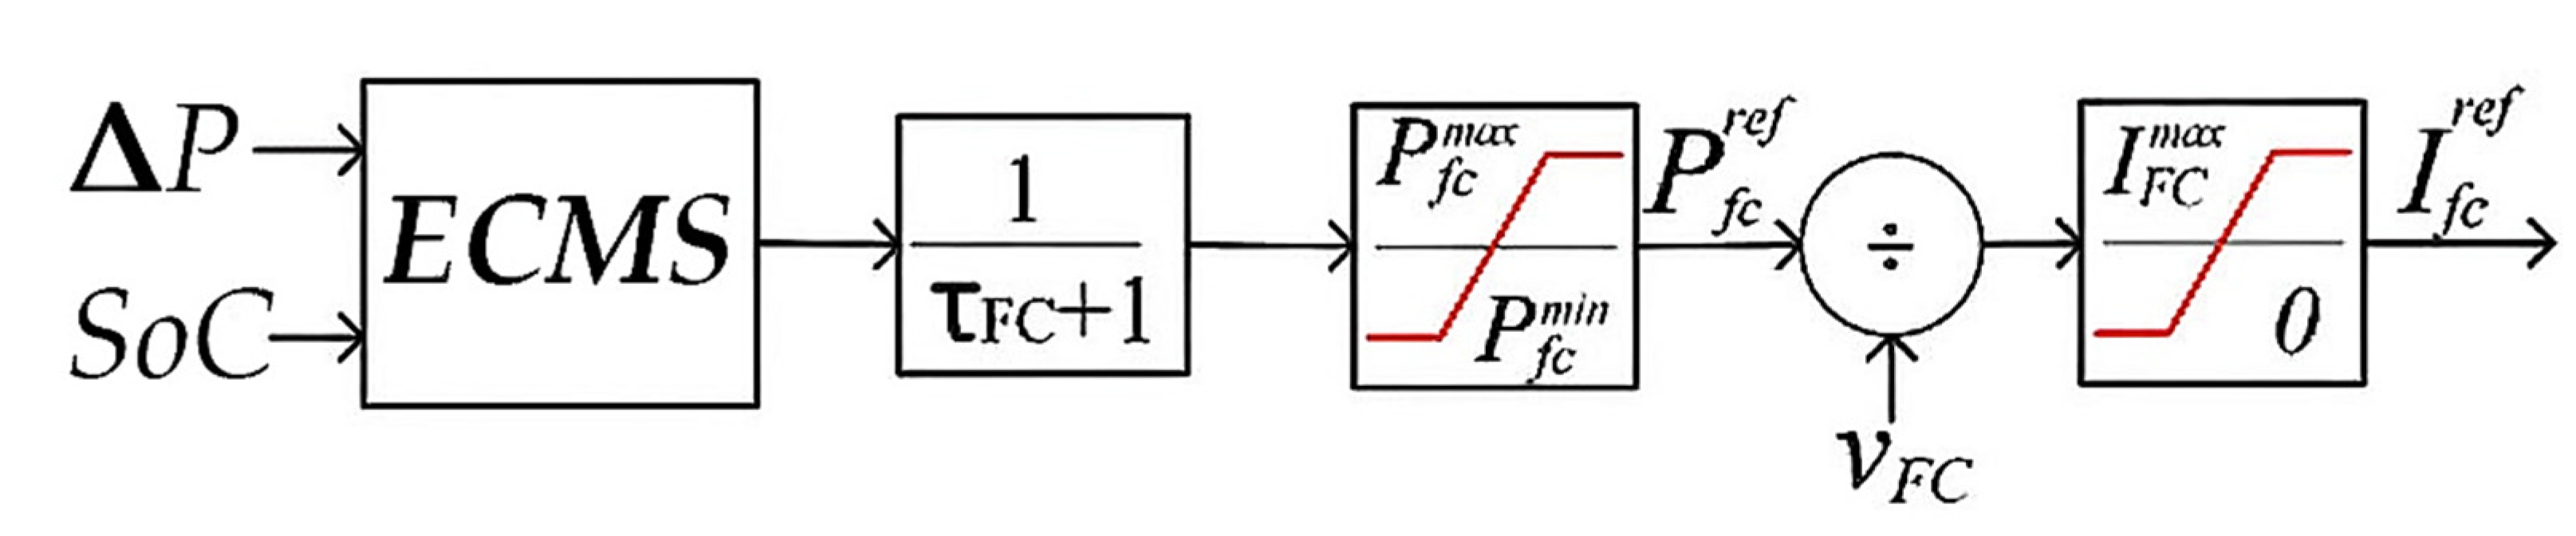
3.2. Equivalent Consumption Minimization Strategy
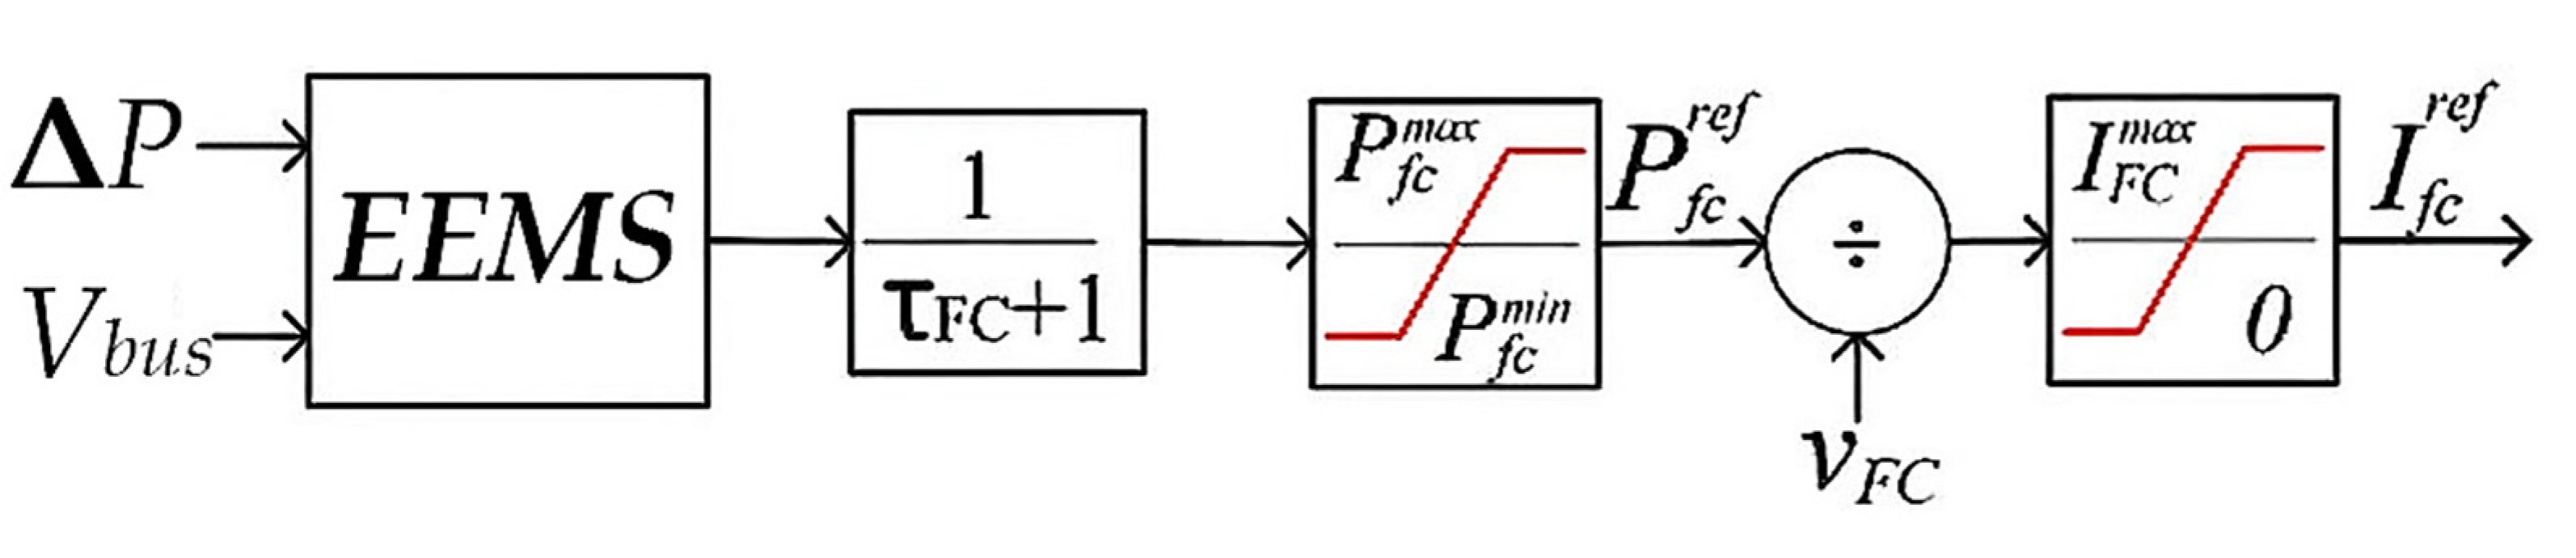
3.3. External Energy Maximization Strategy
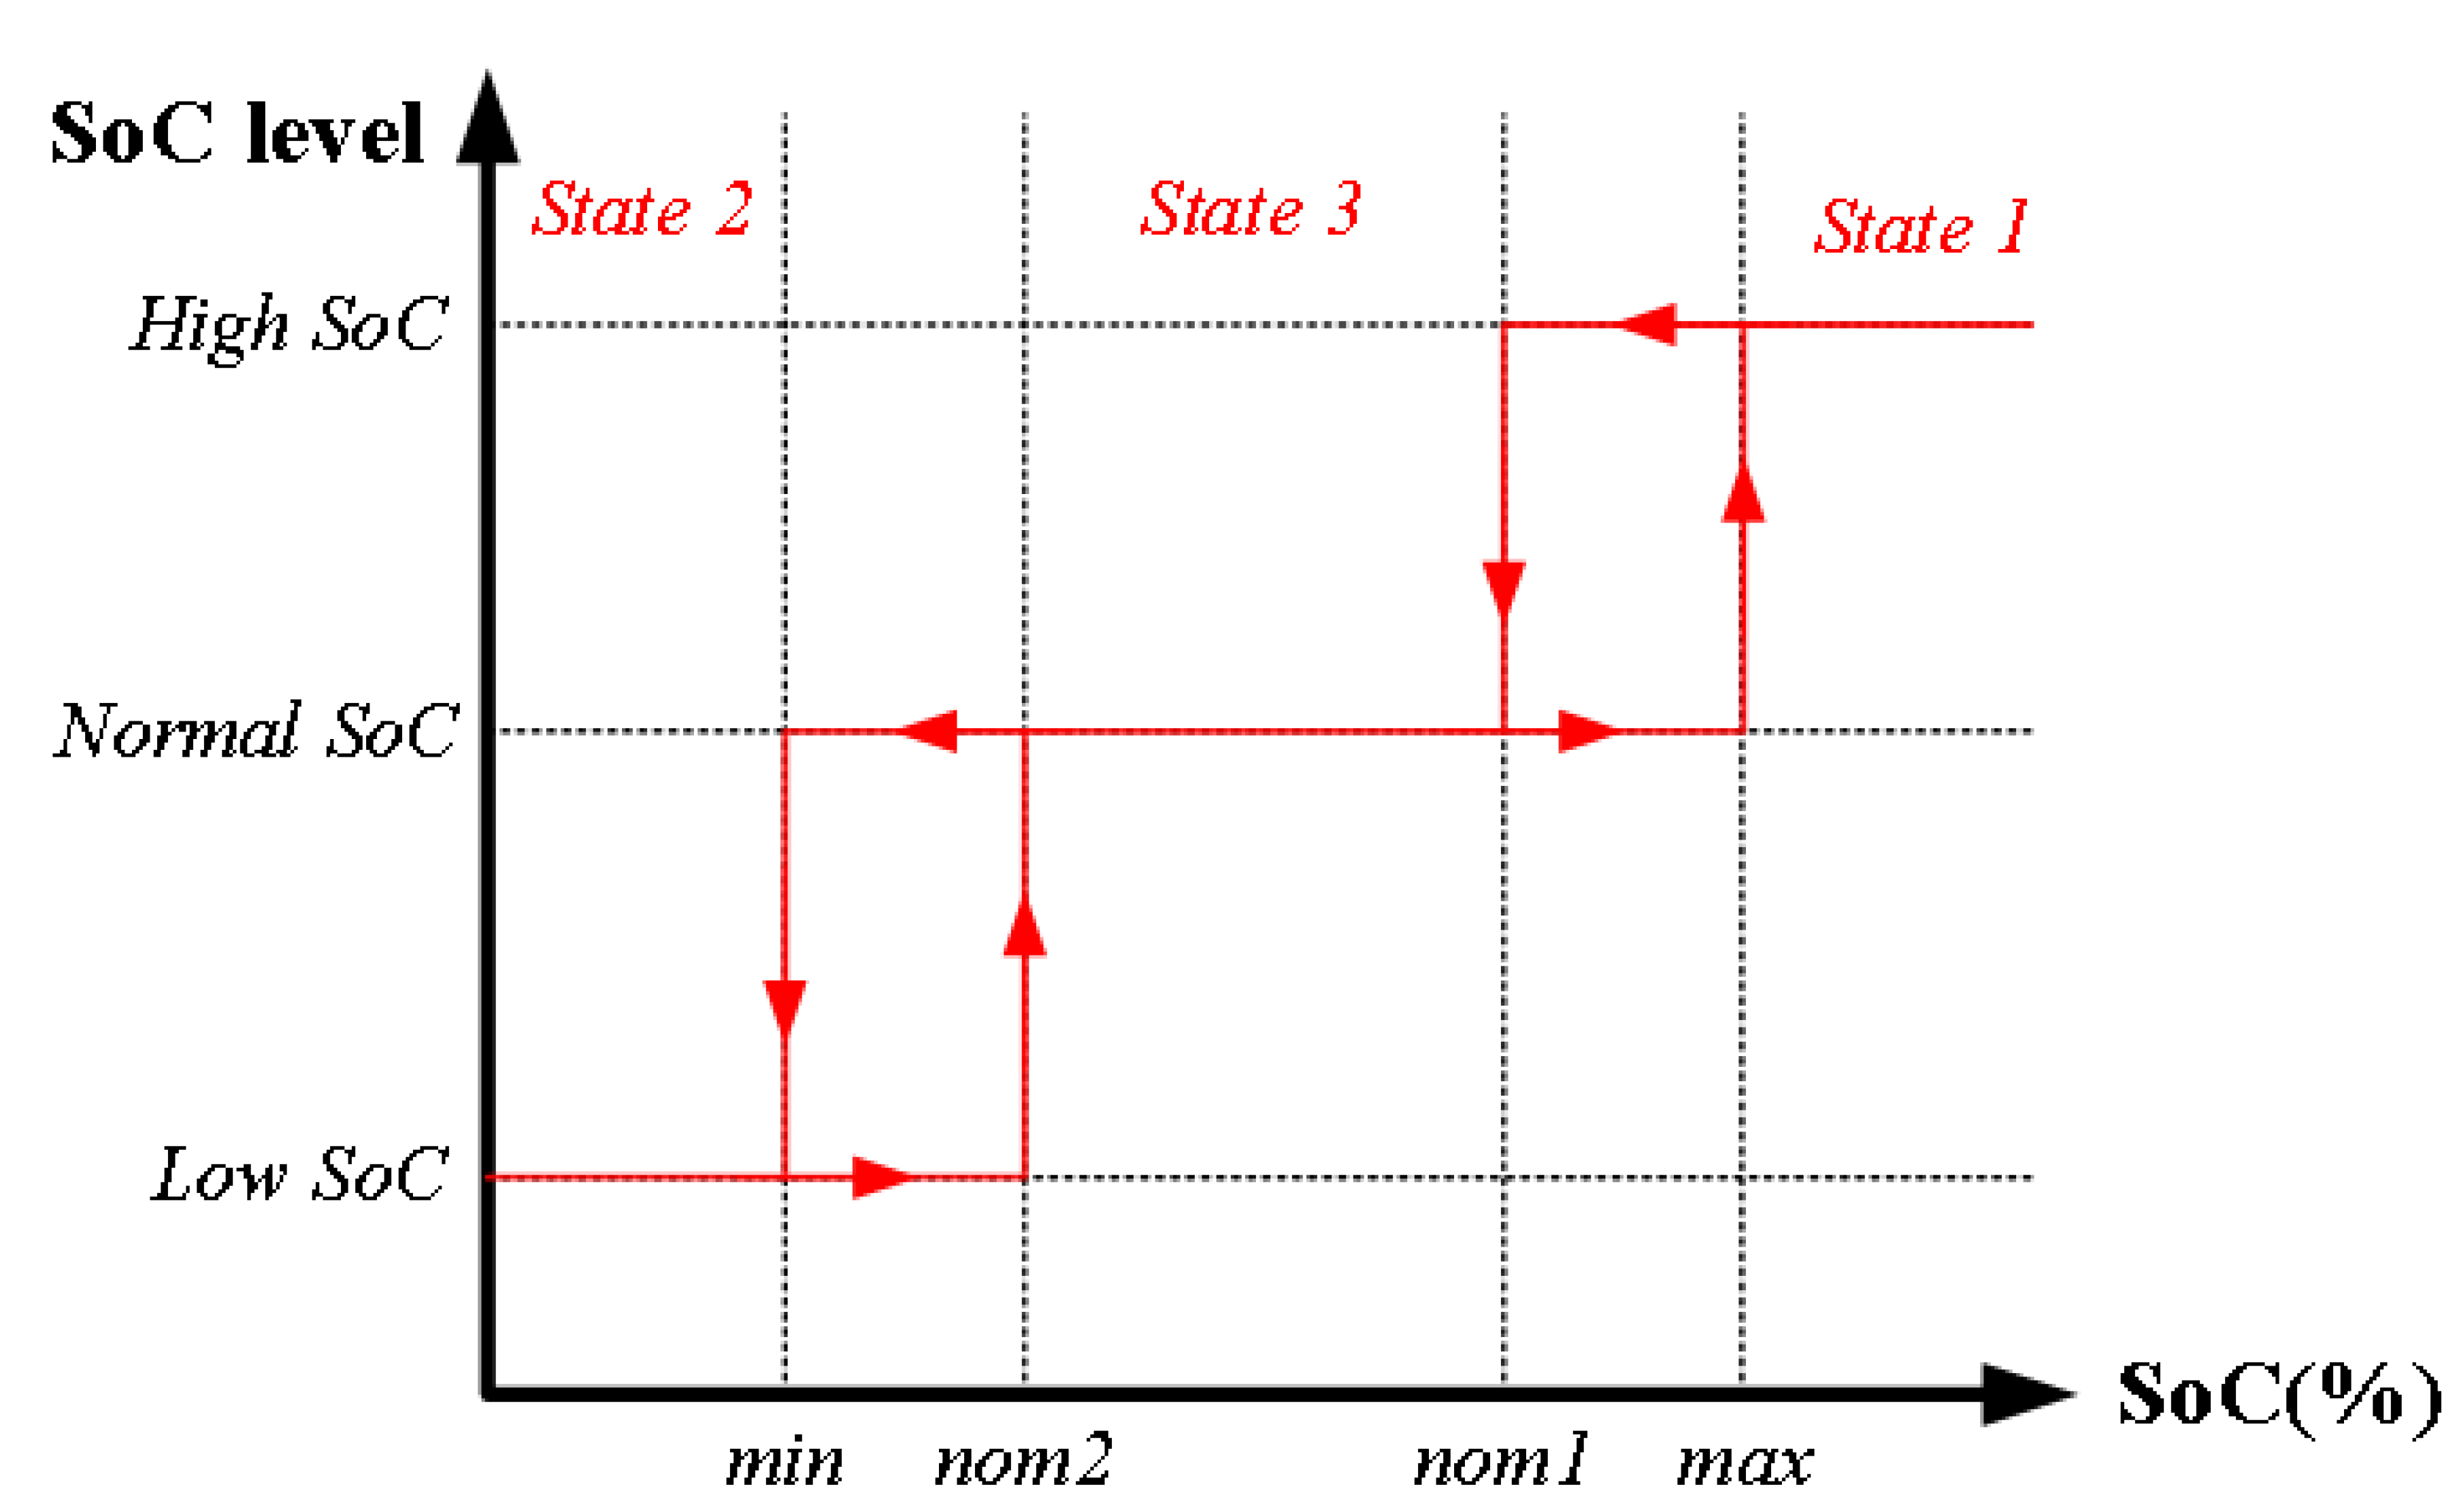
3.4. State Machine Control
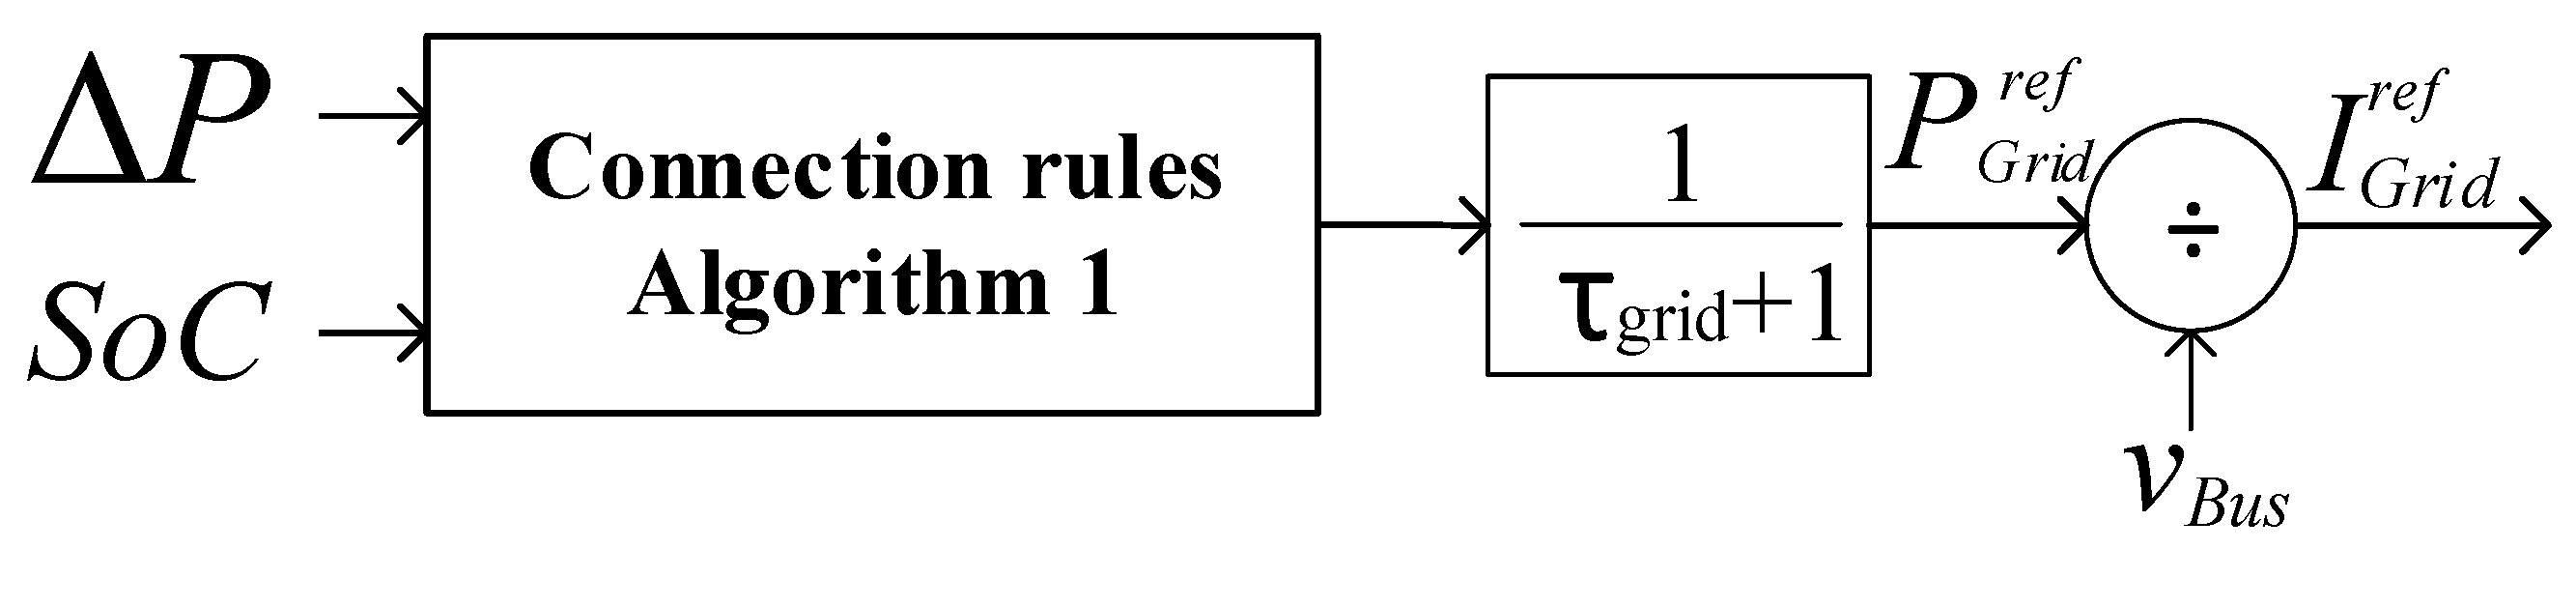
3.5. Grid Power Reference Generation
| Algorithm 1 Utility grid connection roles | |
| 1 | if SoC < SoCmin do |
| 2 | if do |
| 3 | |
| 4 | else |
| 5 | |
| 6 | end |
| 7 | elseif SoC > SoCmax and ΔP < 0 do |
| 8 | |
| 9 | elseif SoC < SoCmax and SoC > SoCmin do |
| 10 | |
| 11 | end |
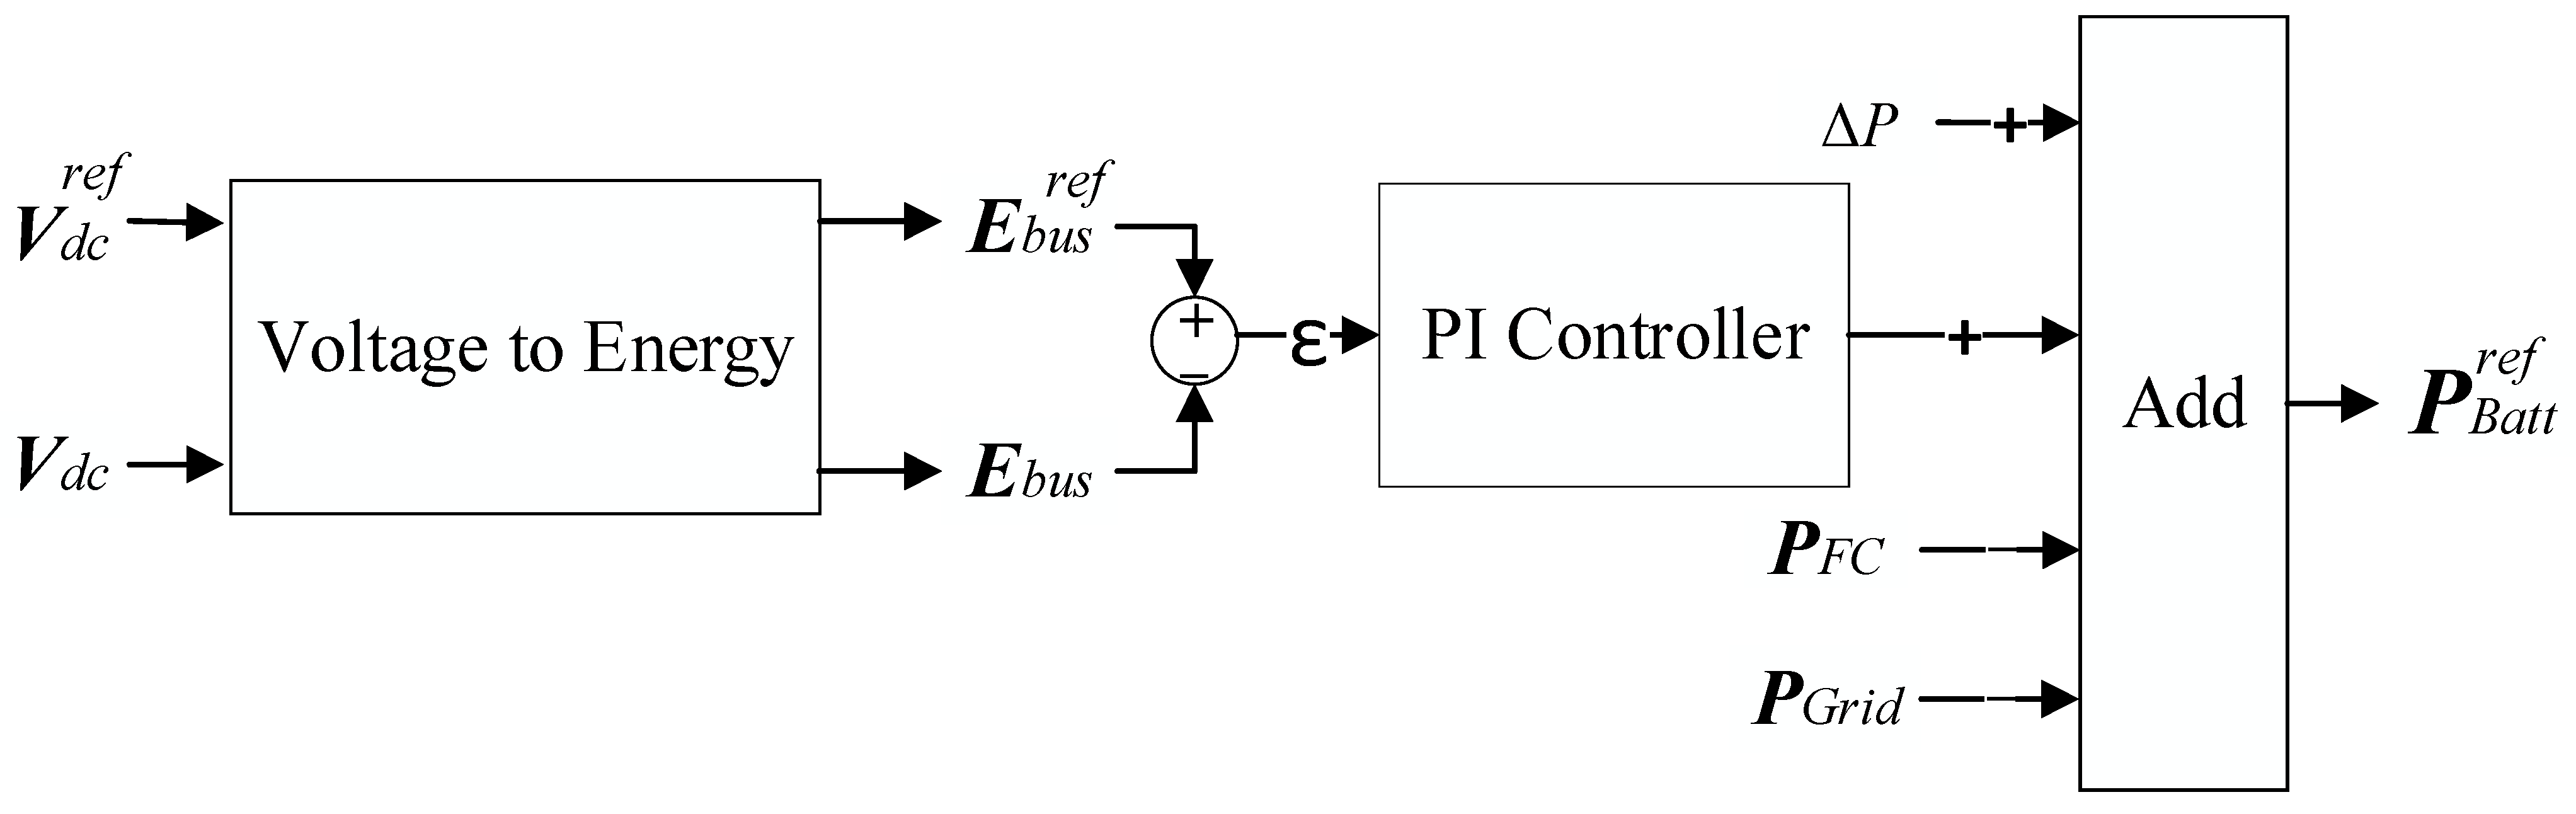
3.6. DC Bus Stabilization
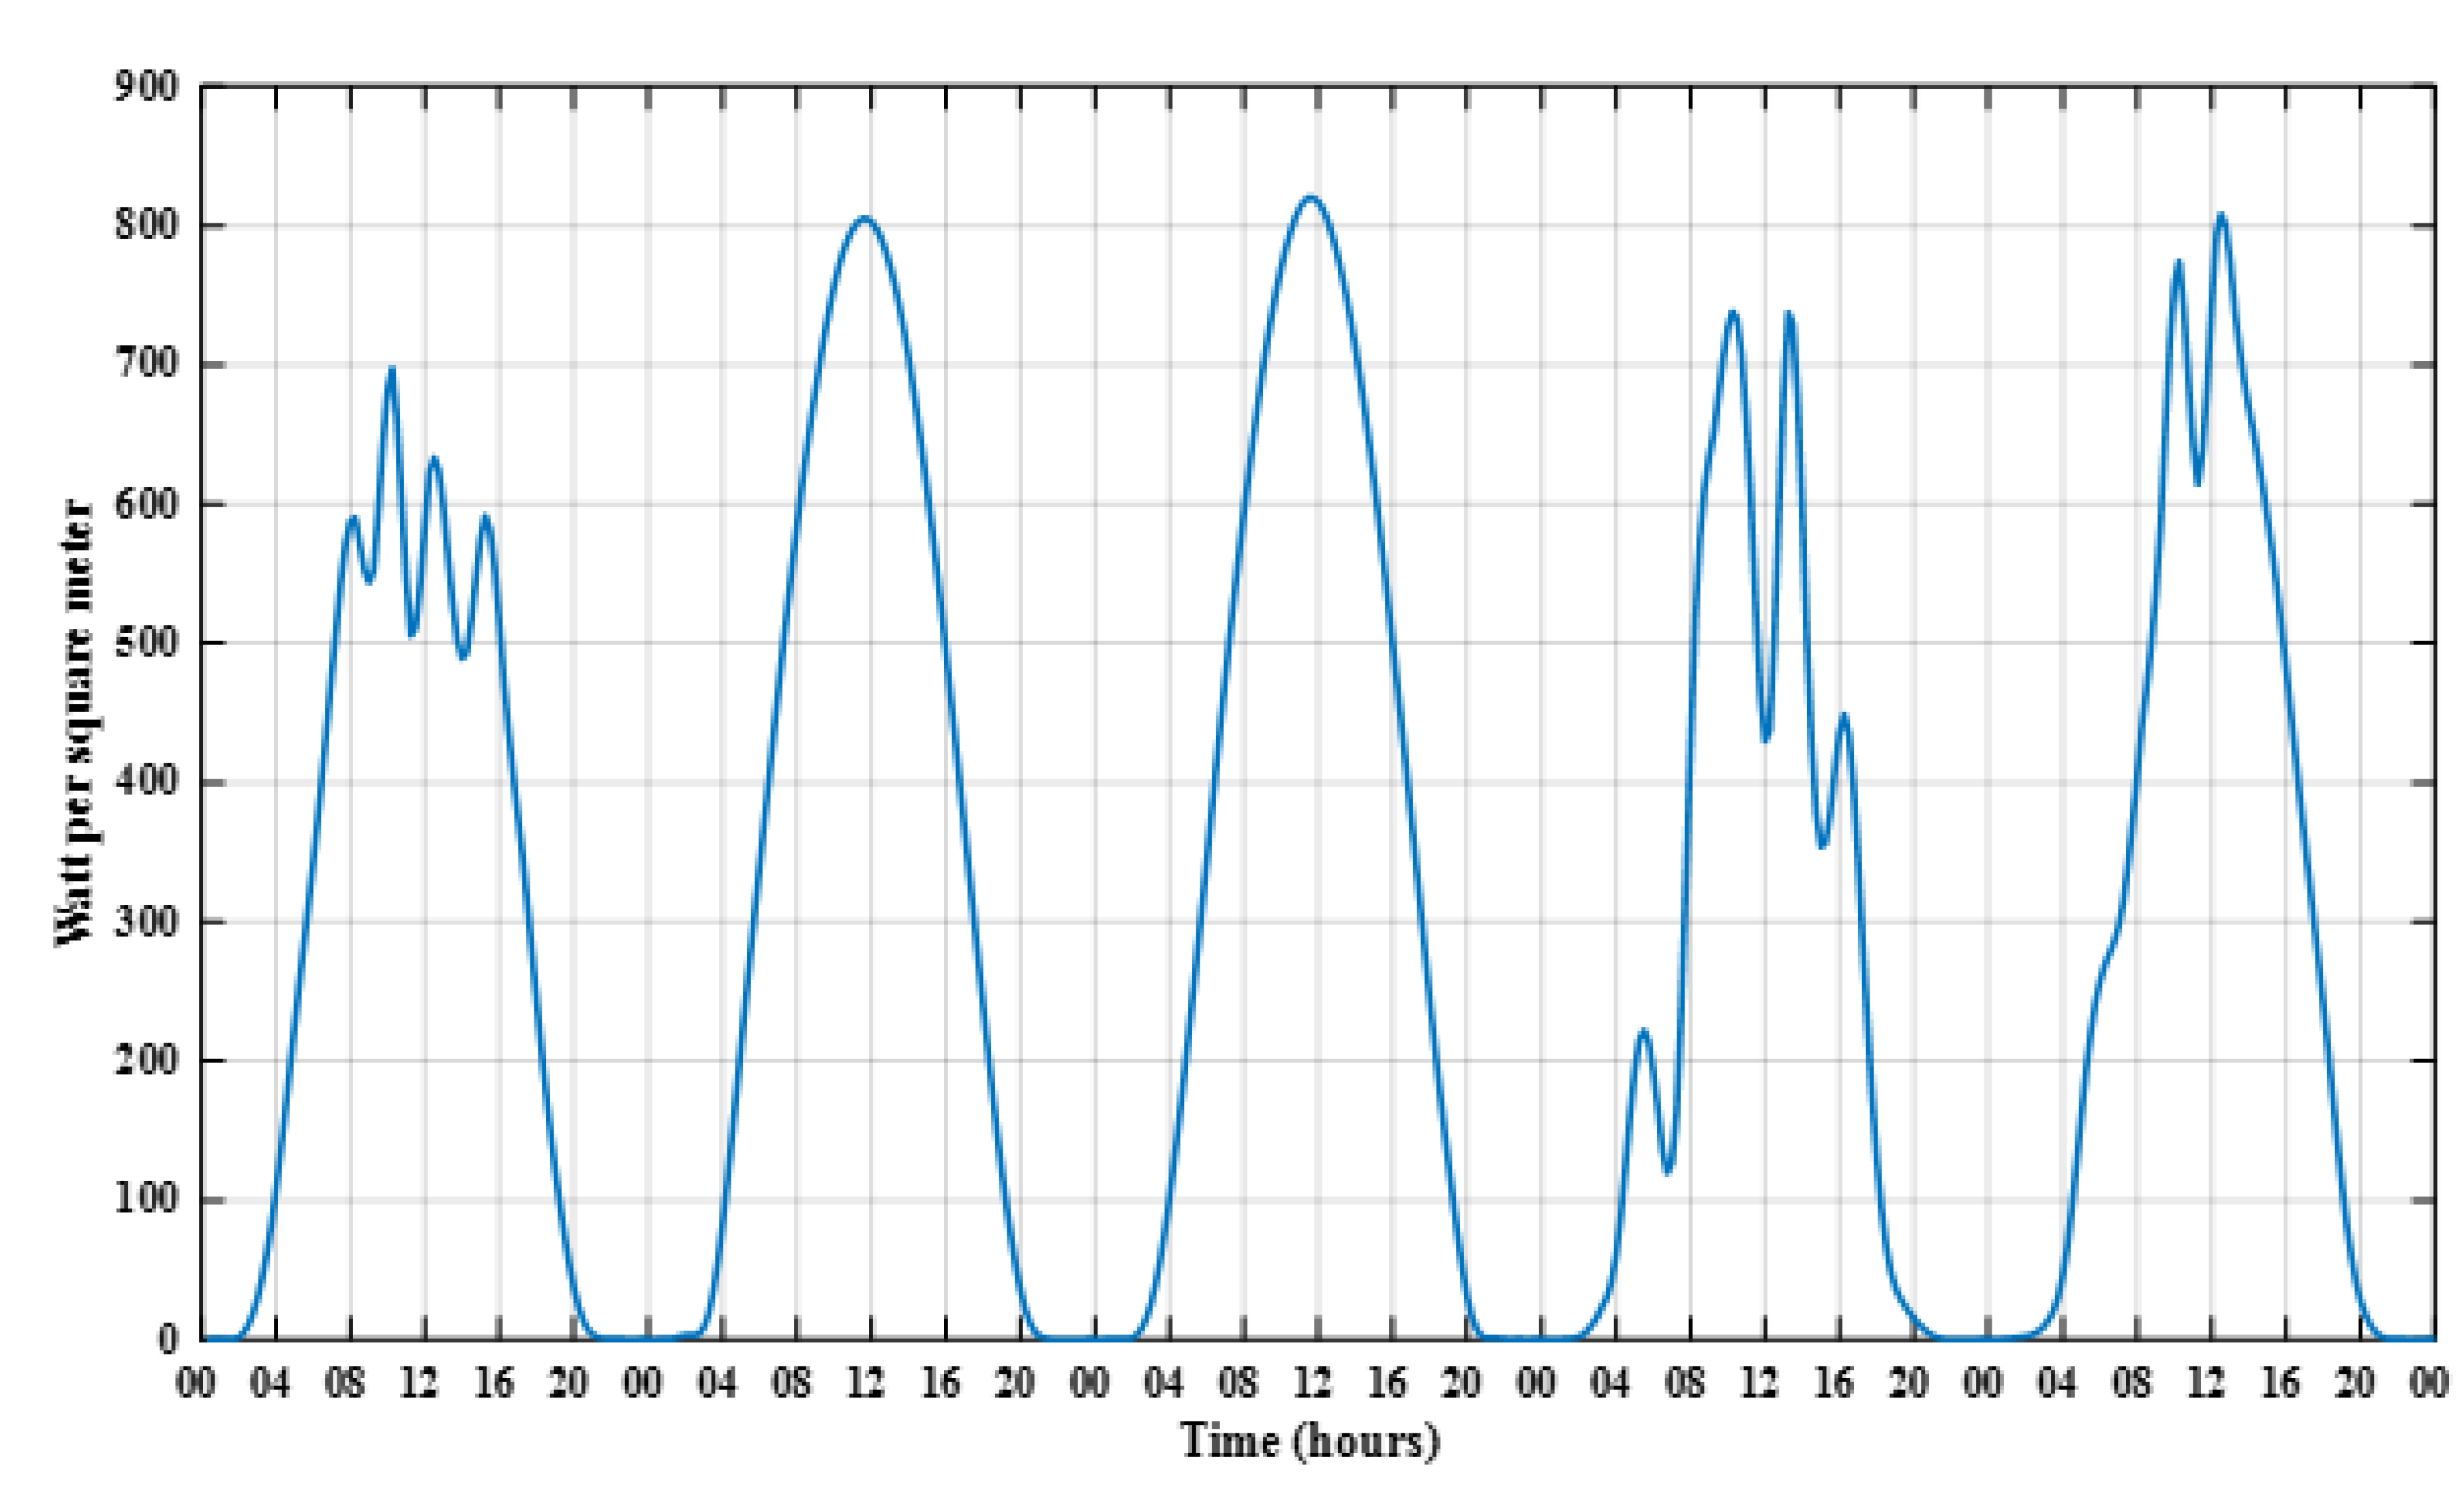
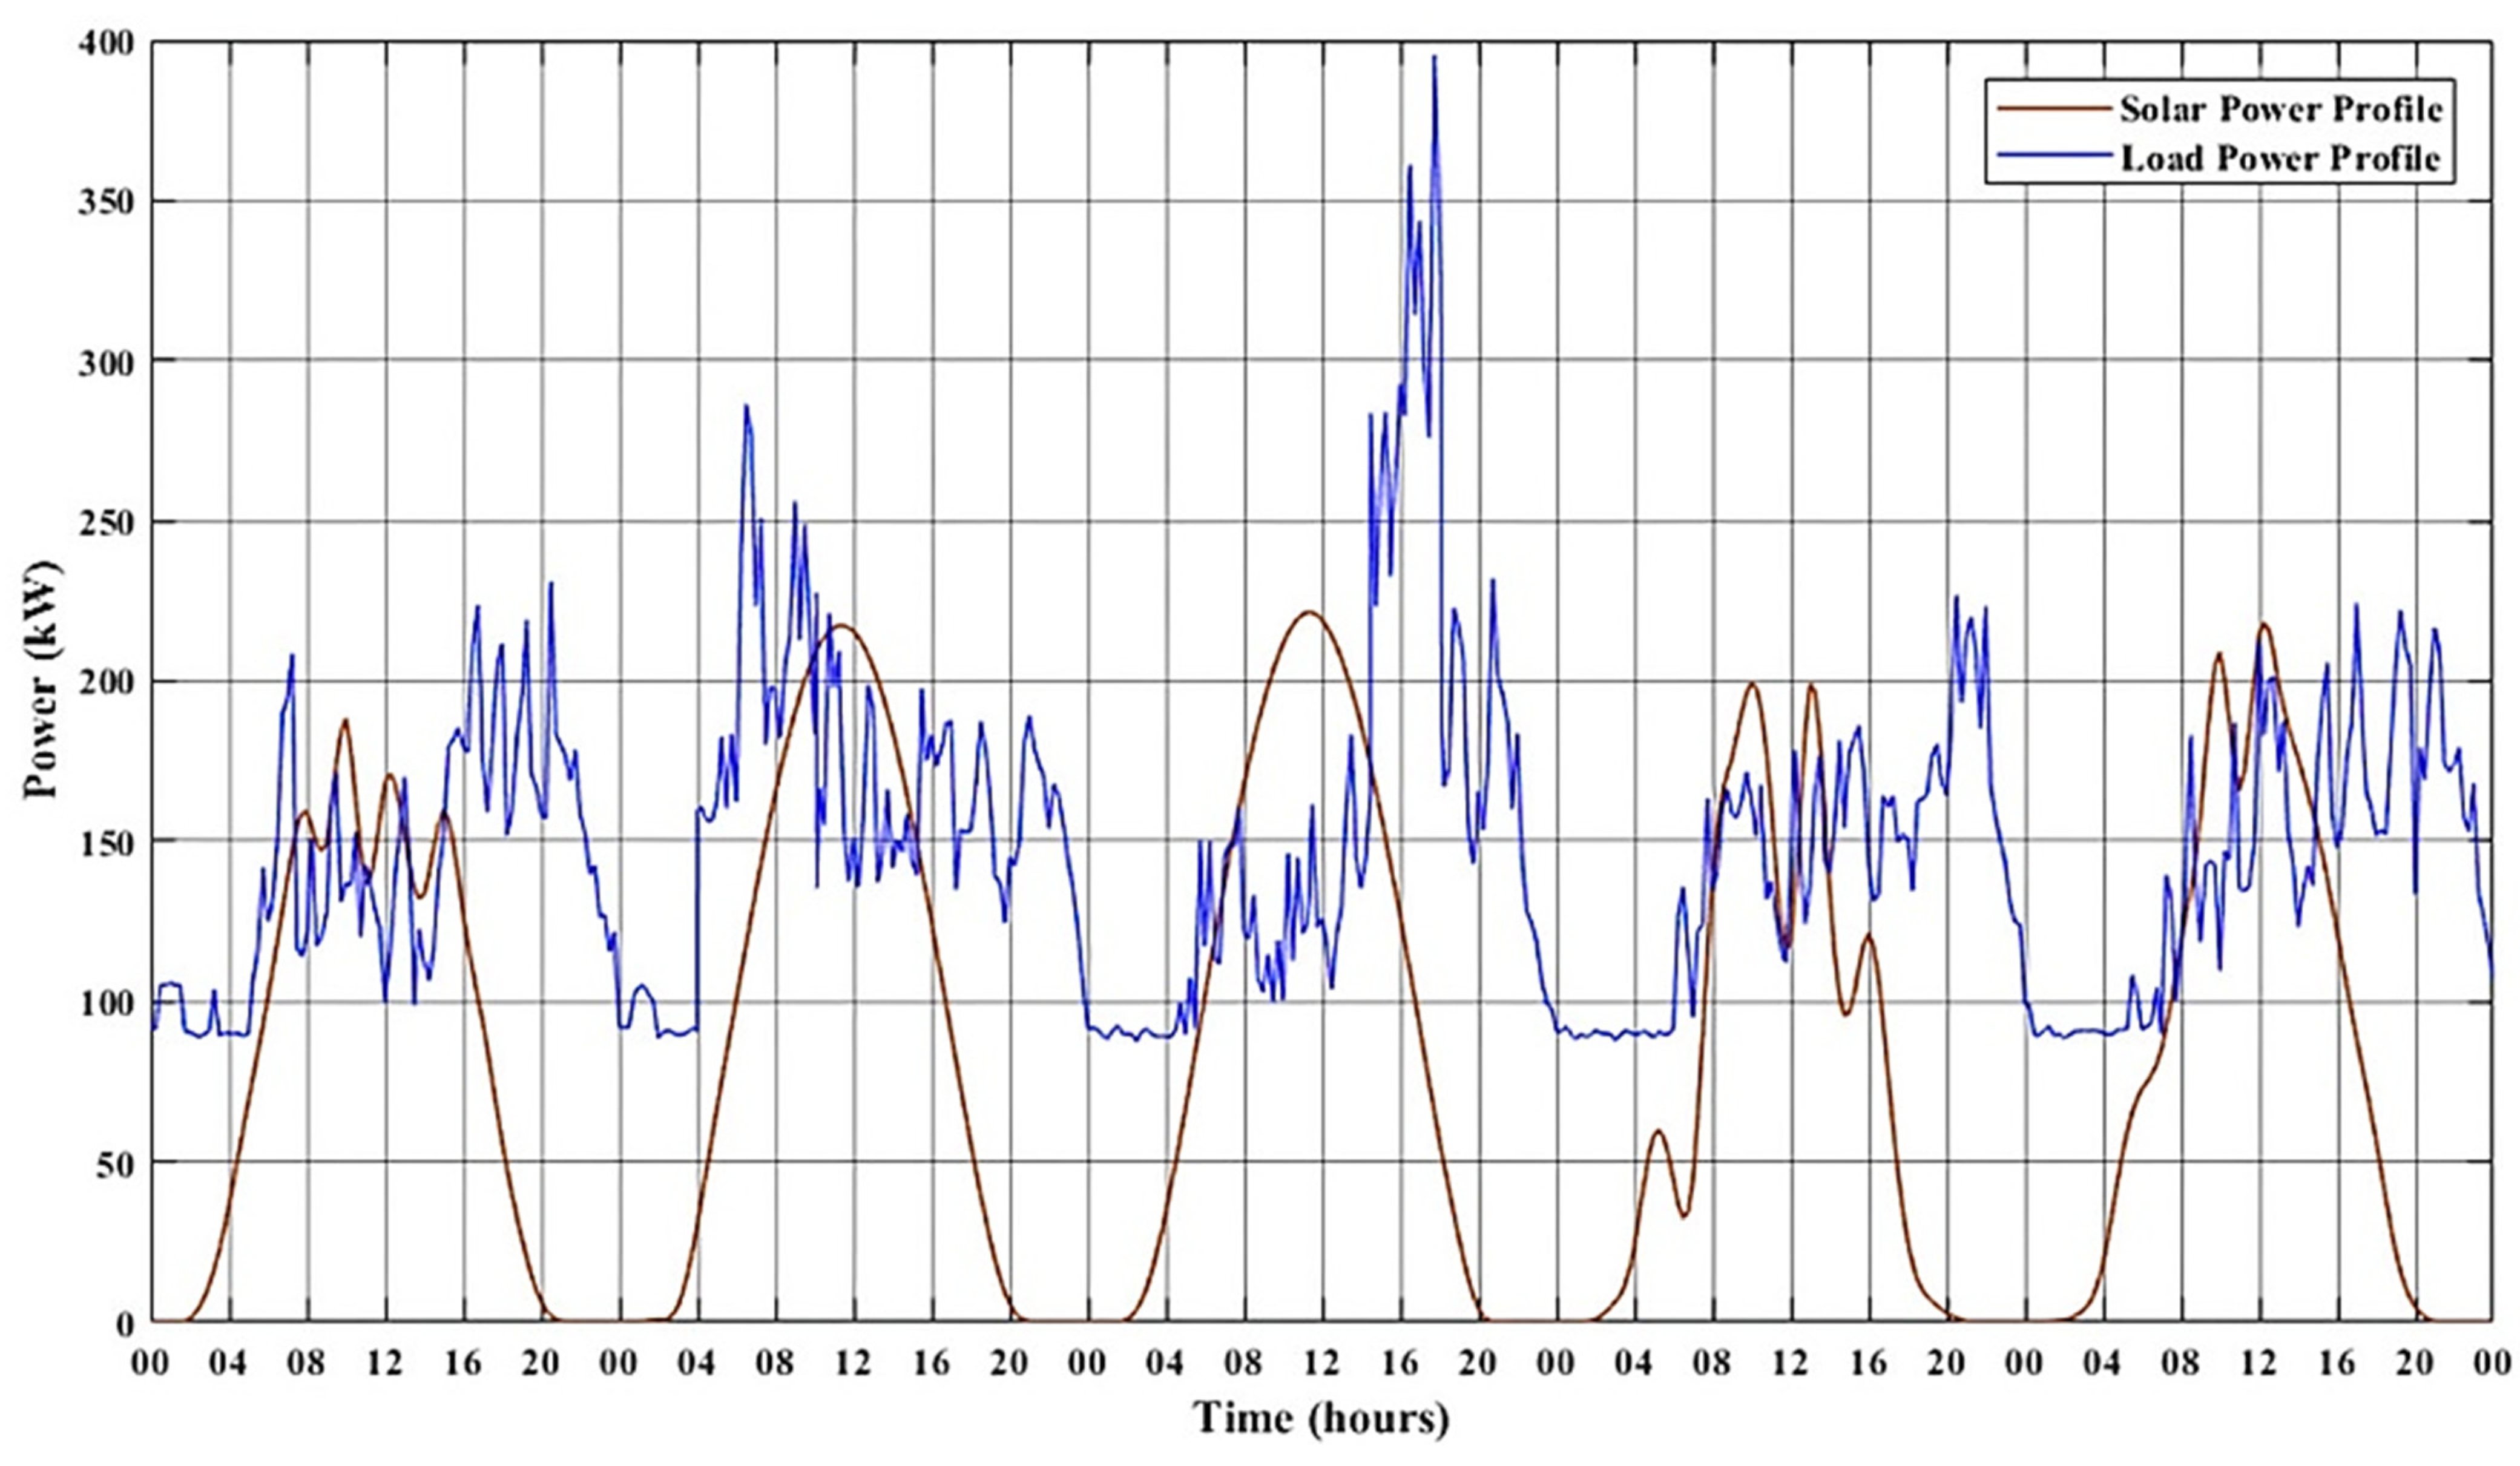
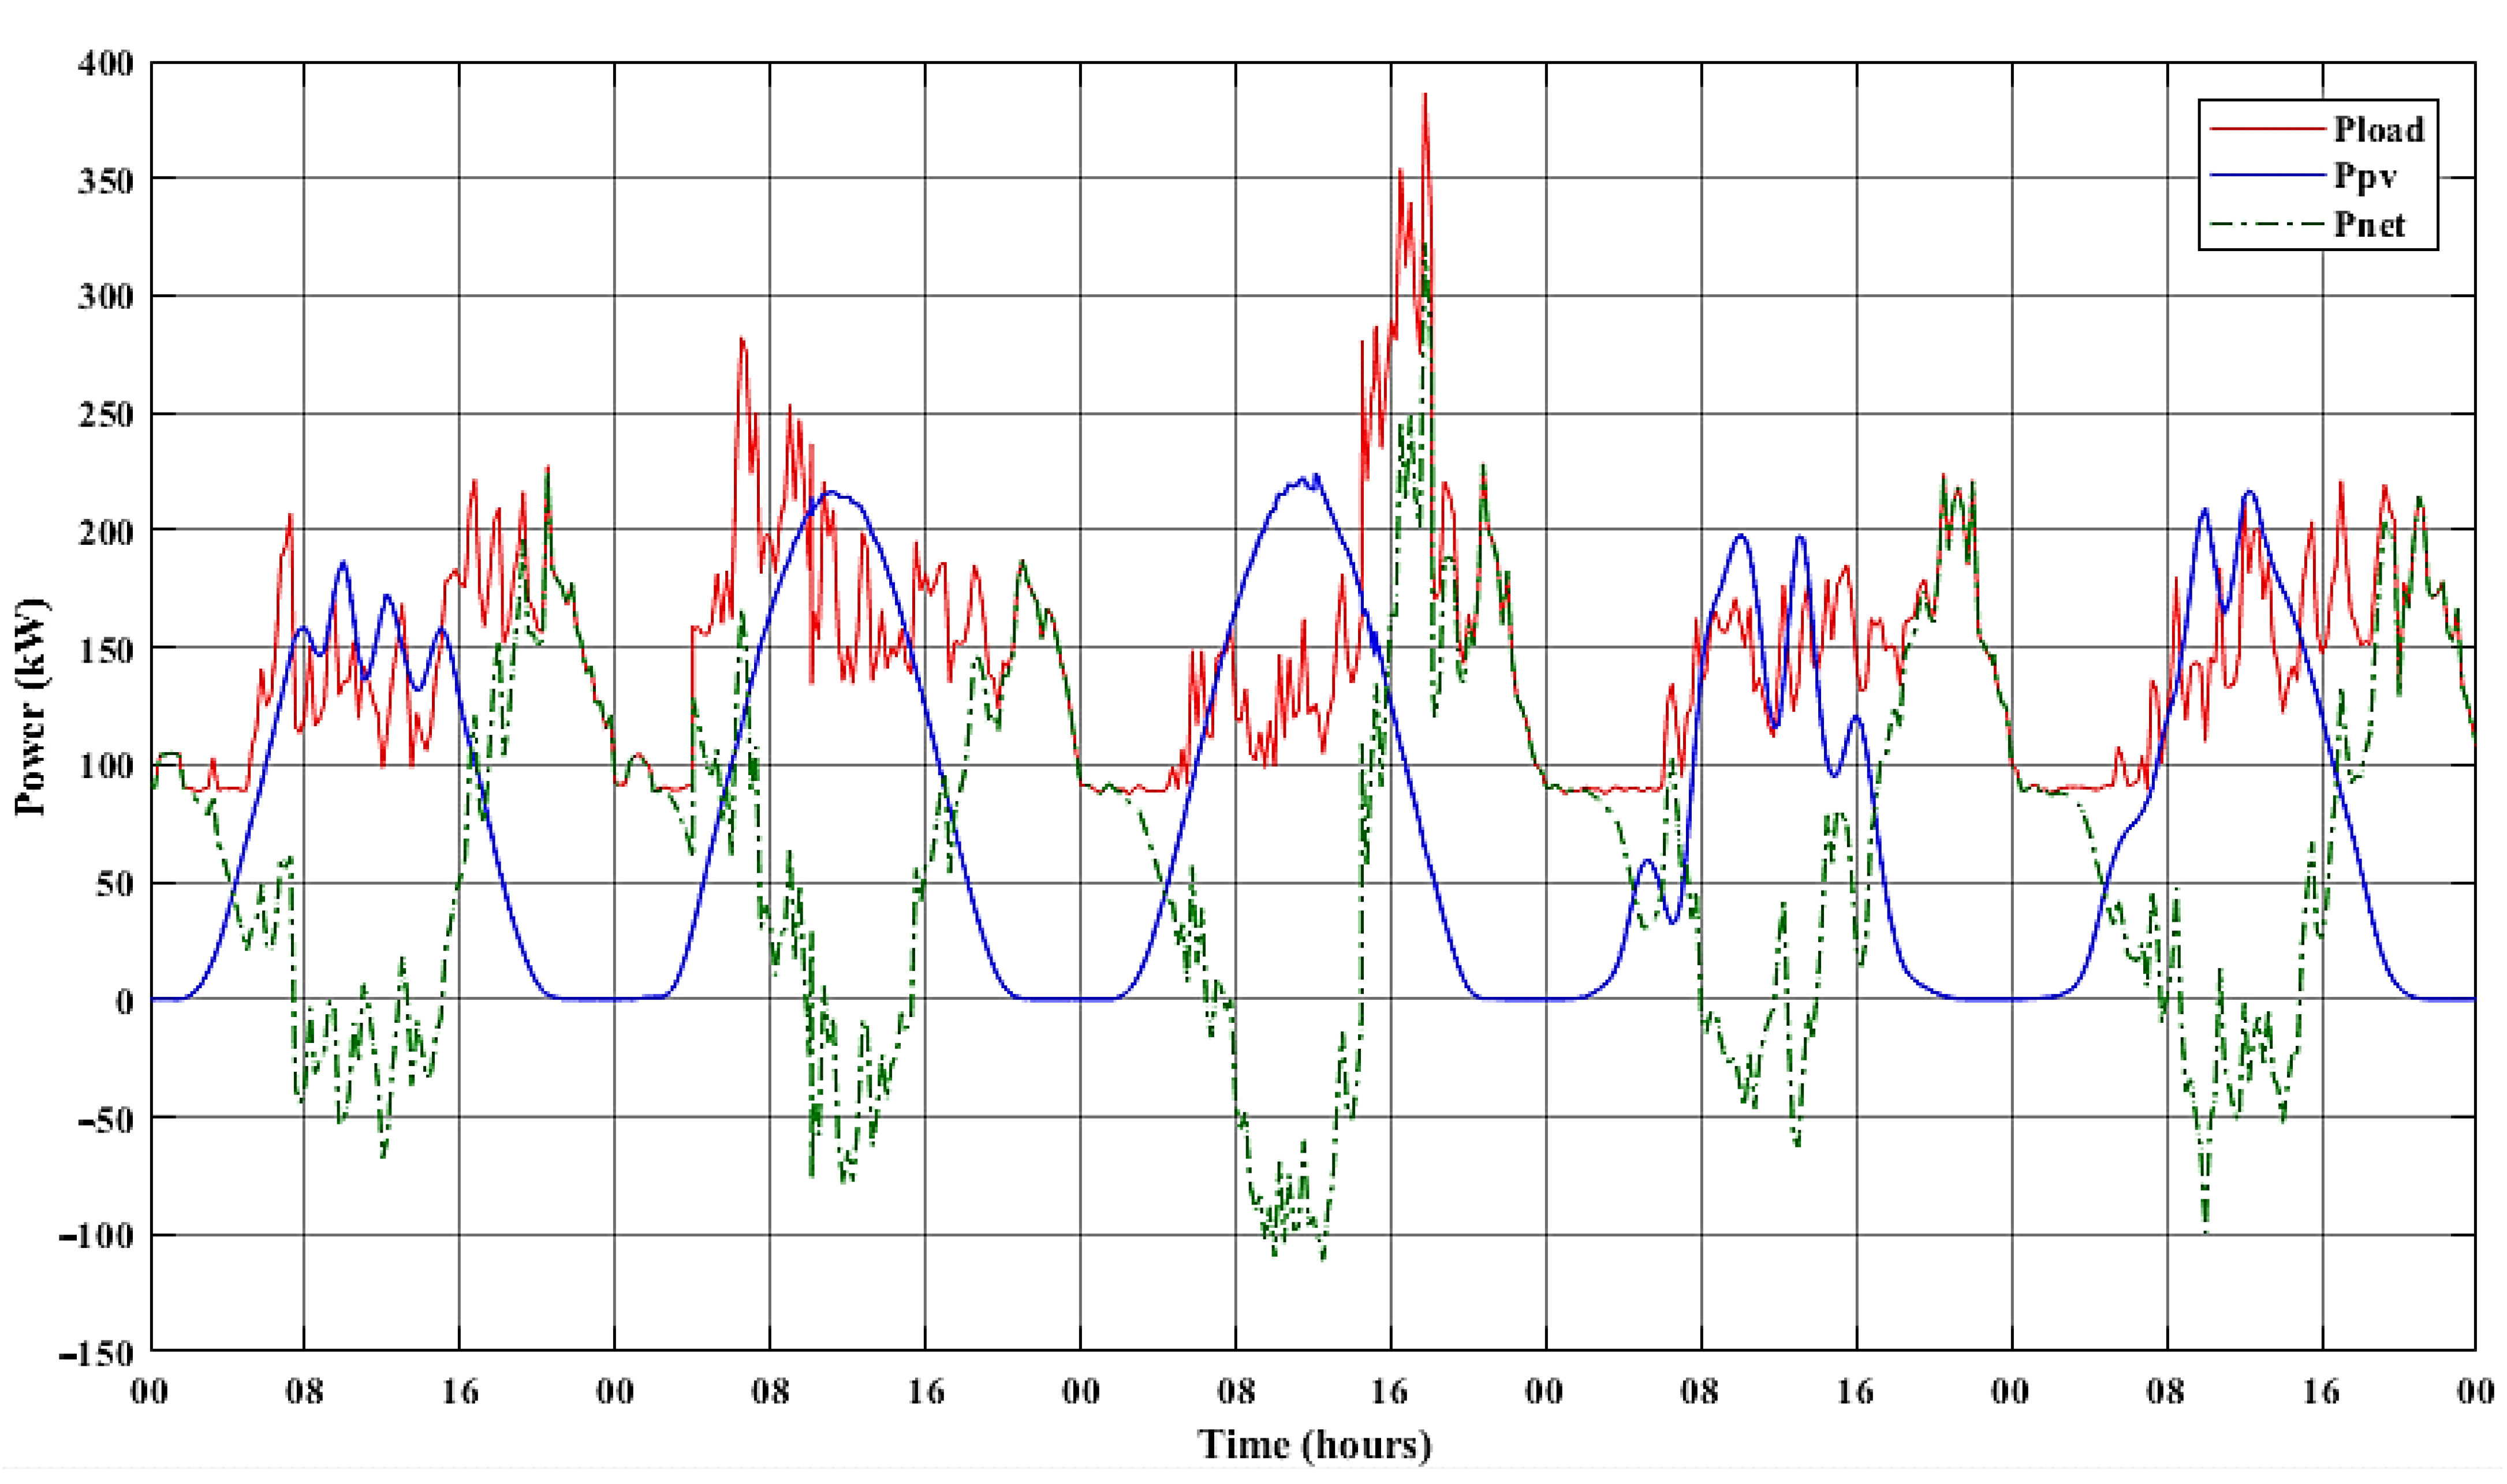
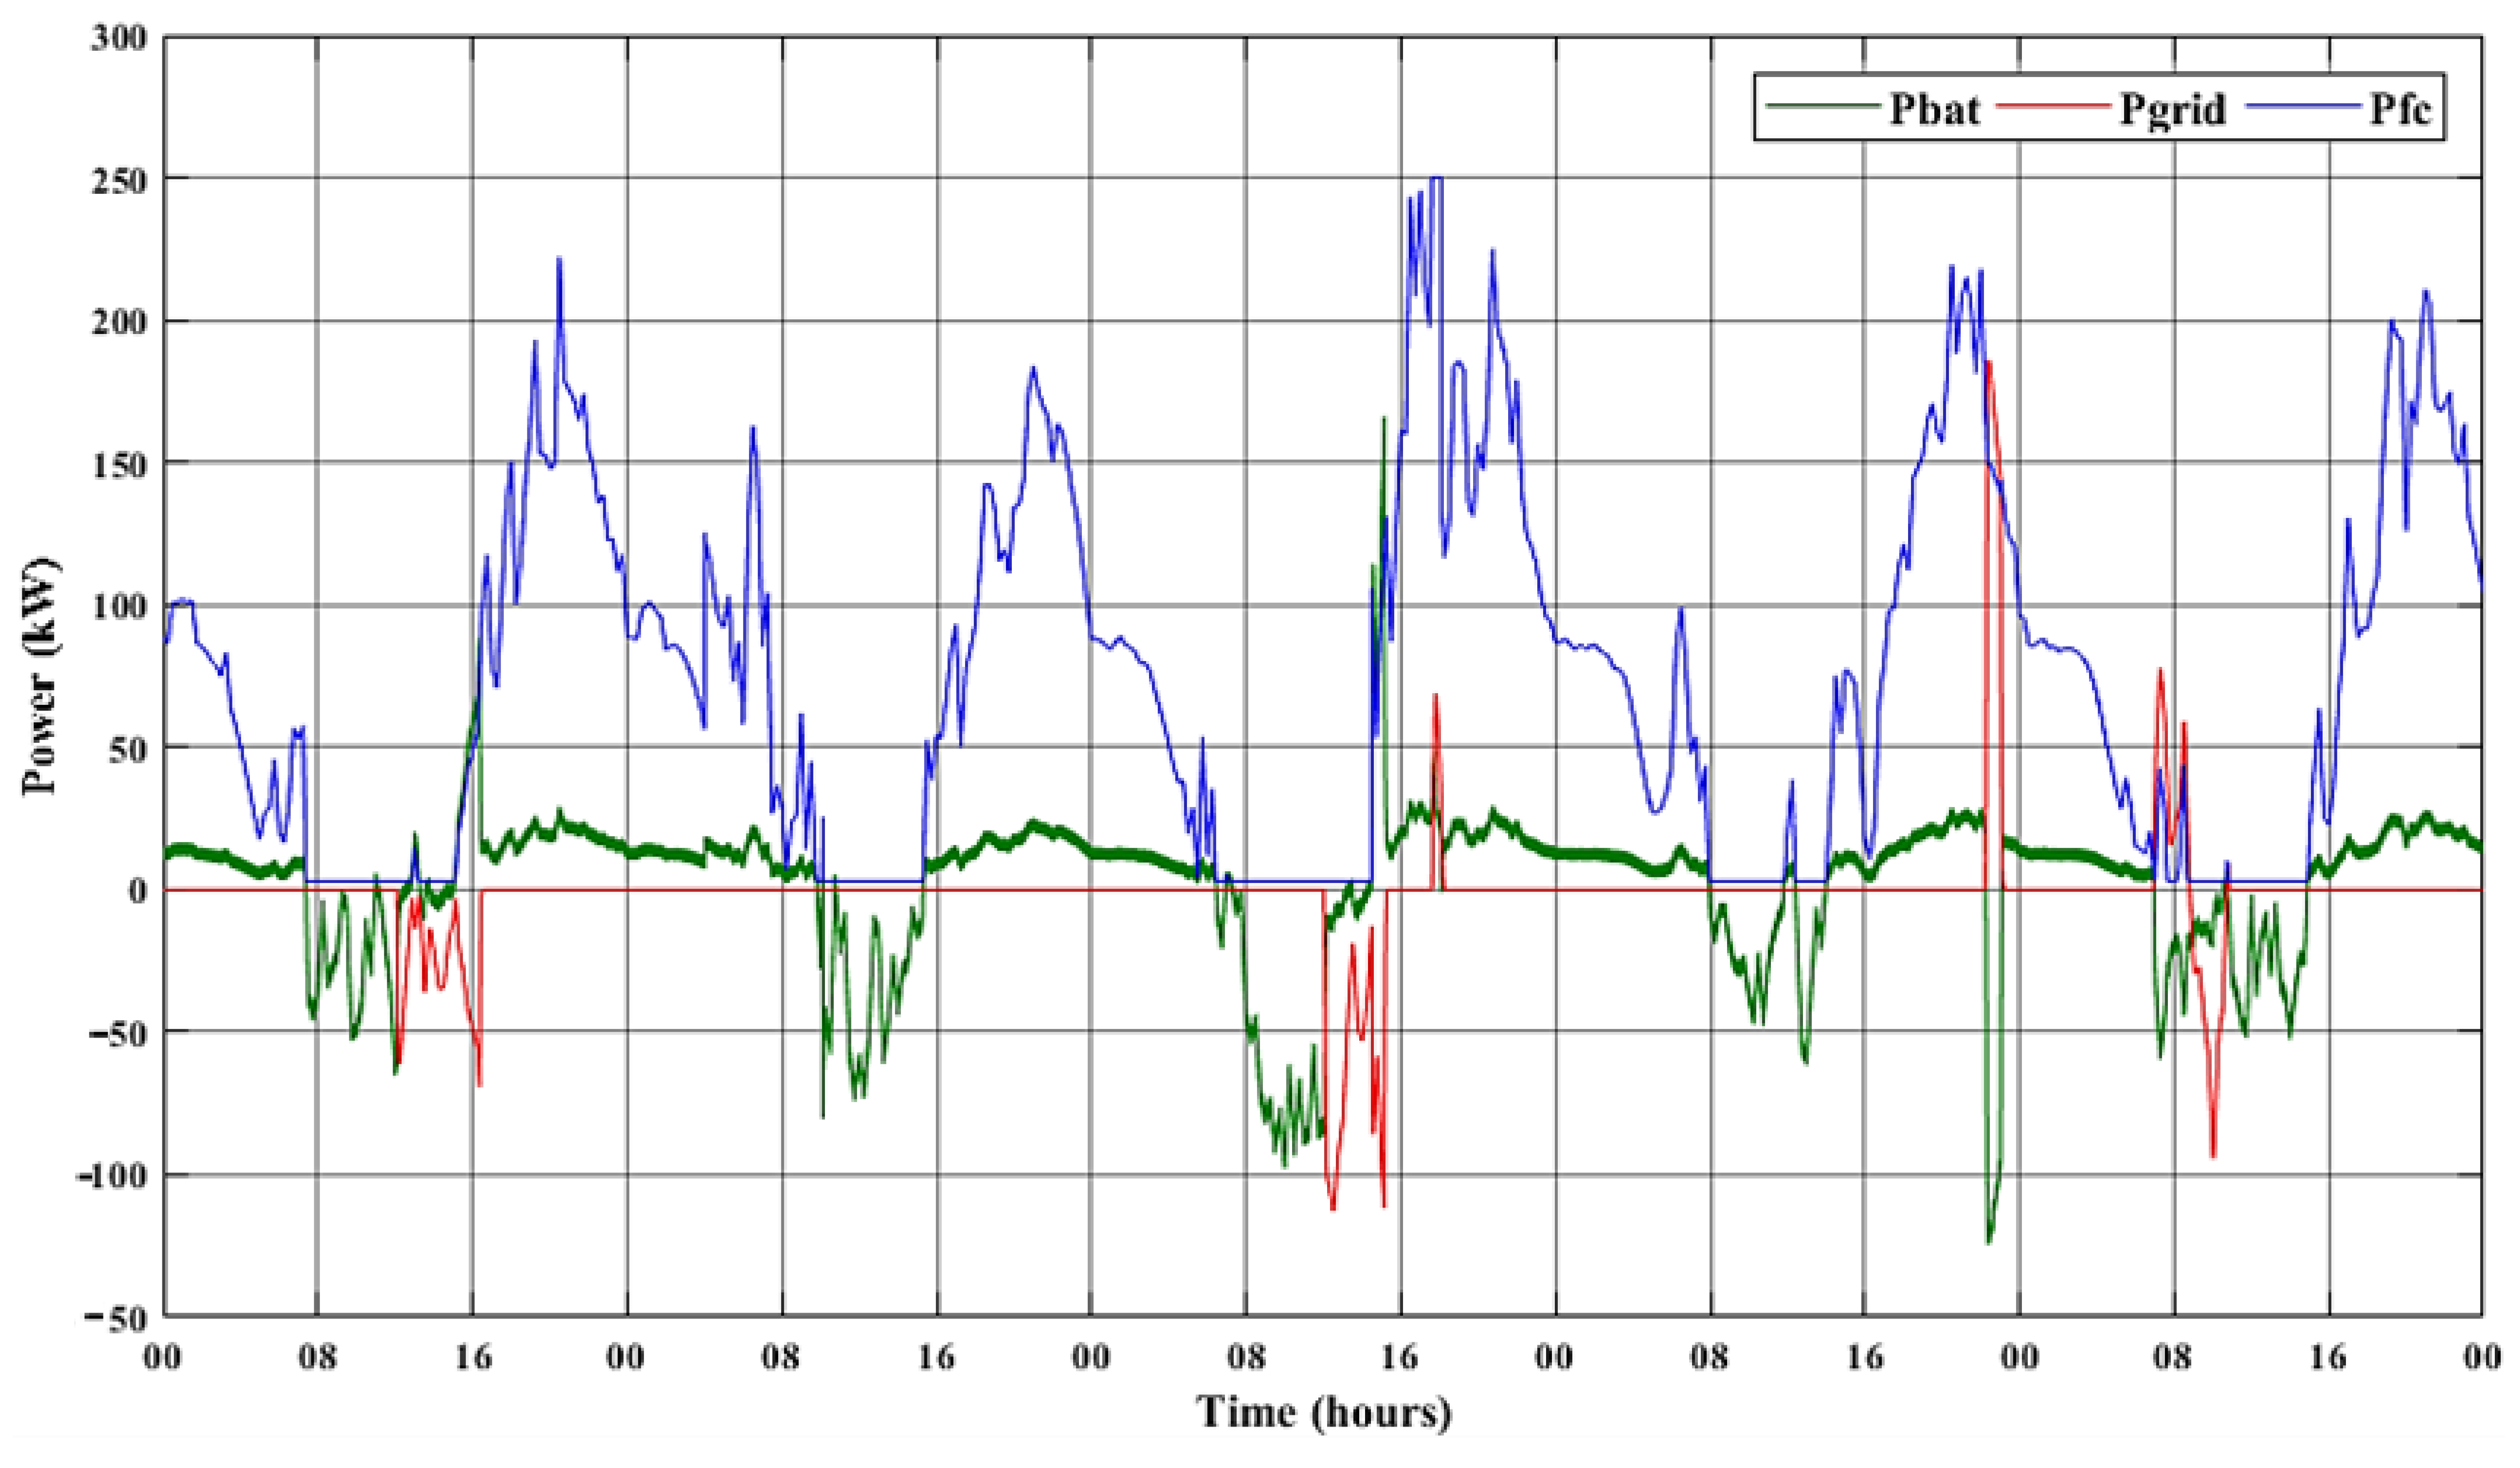
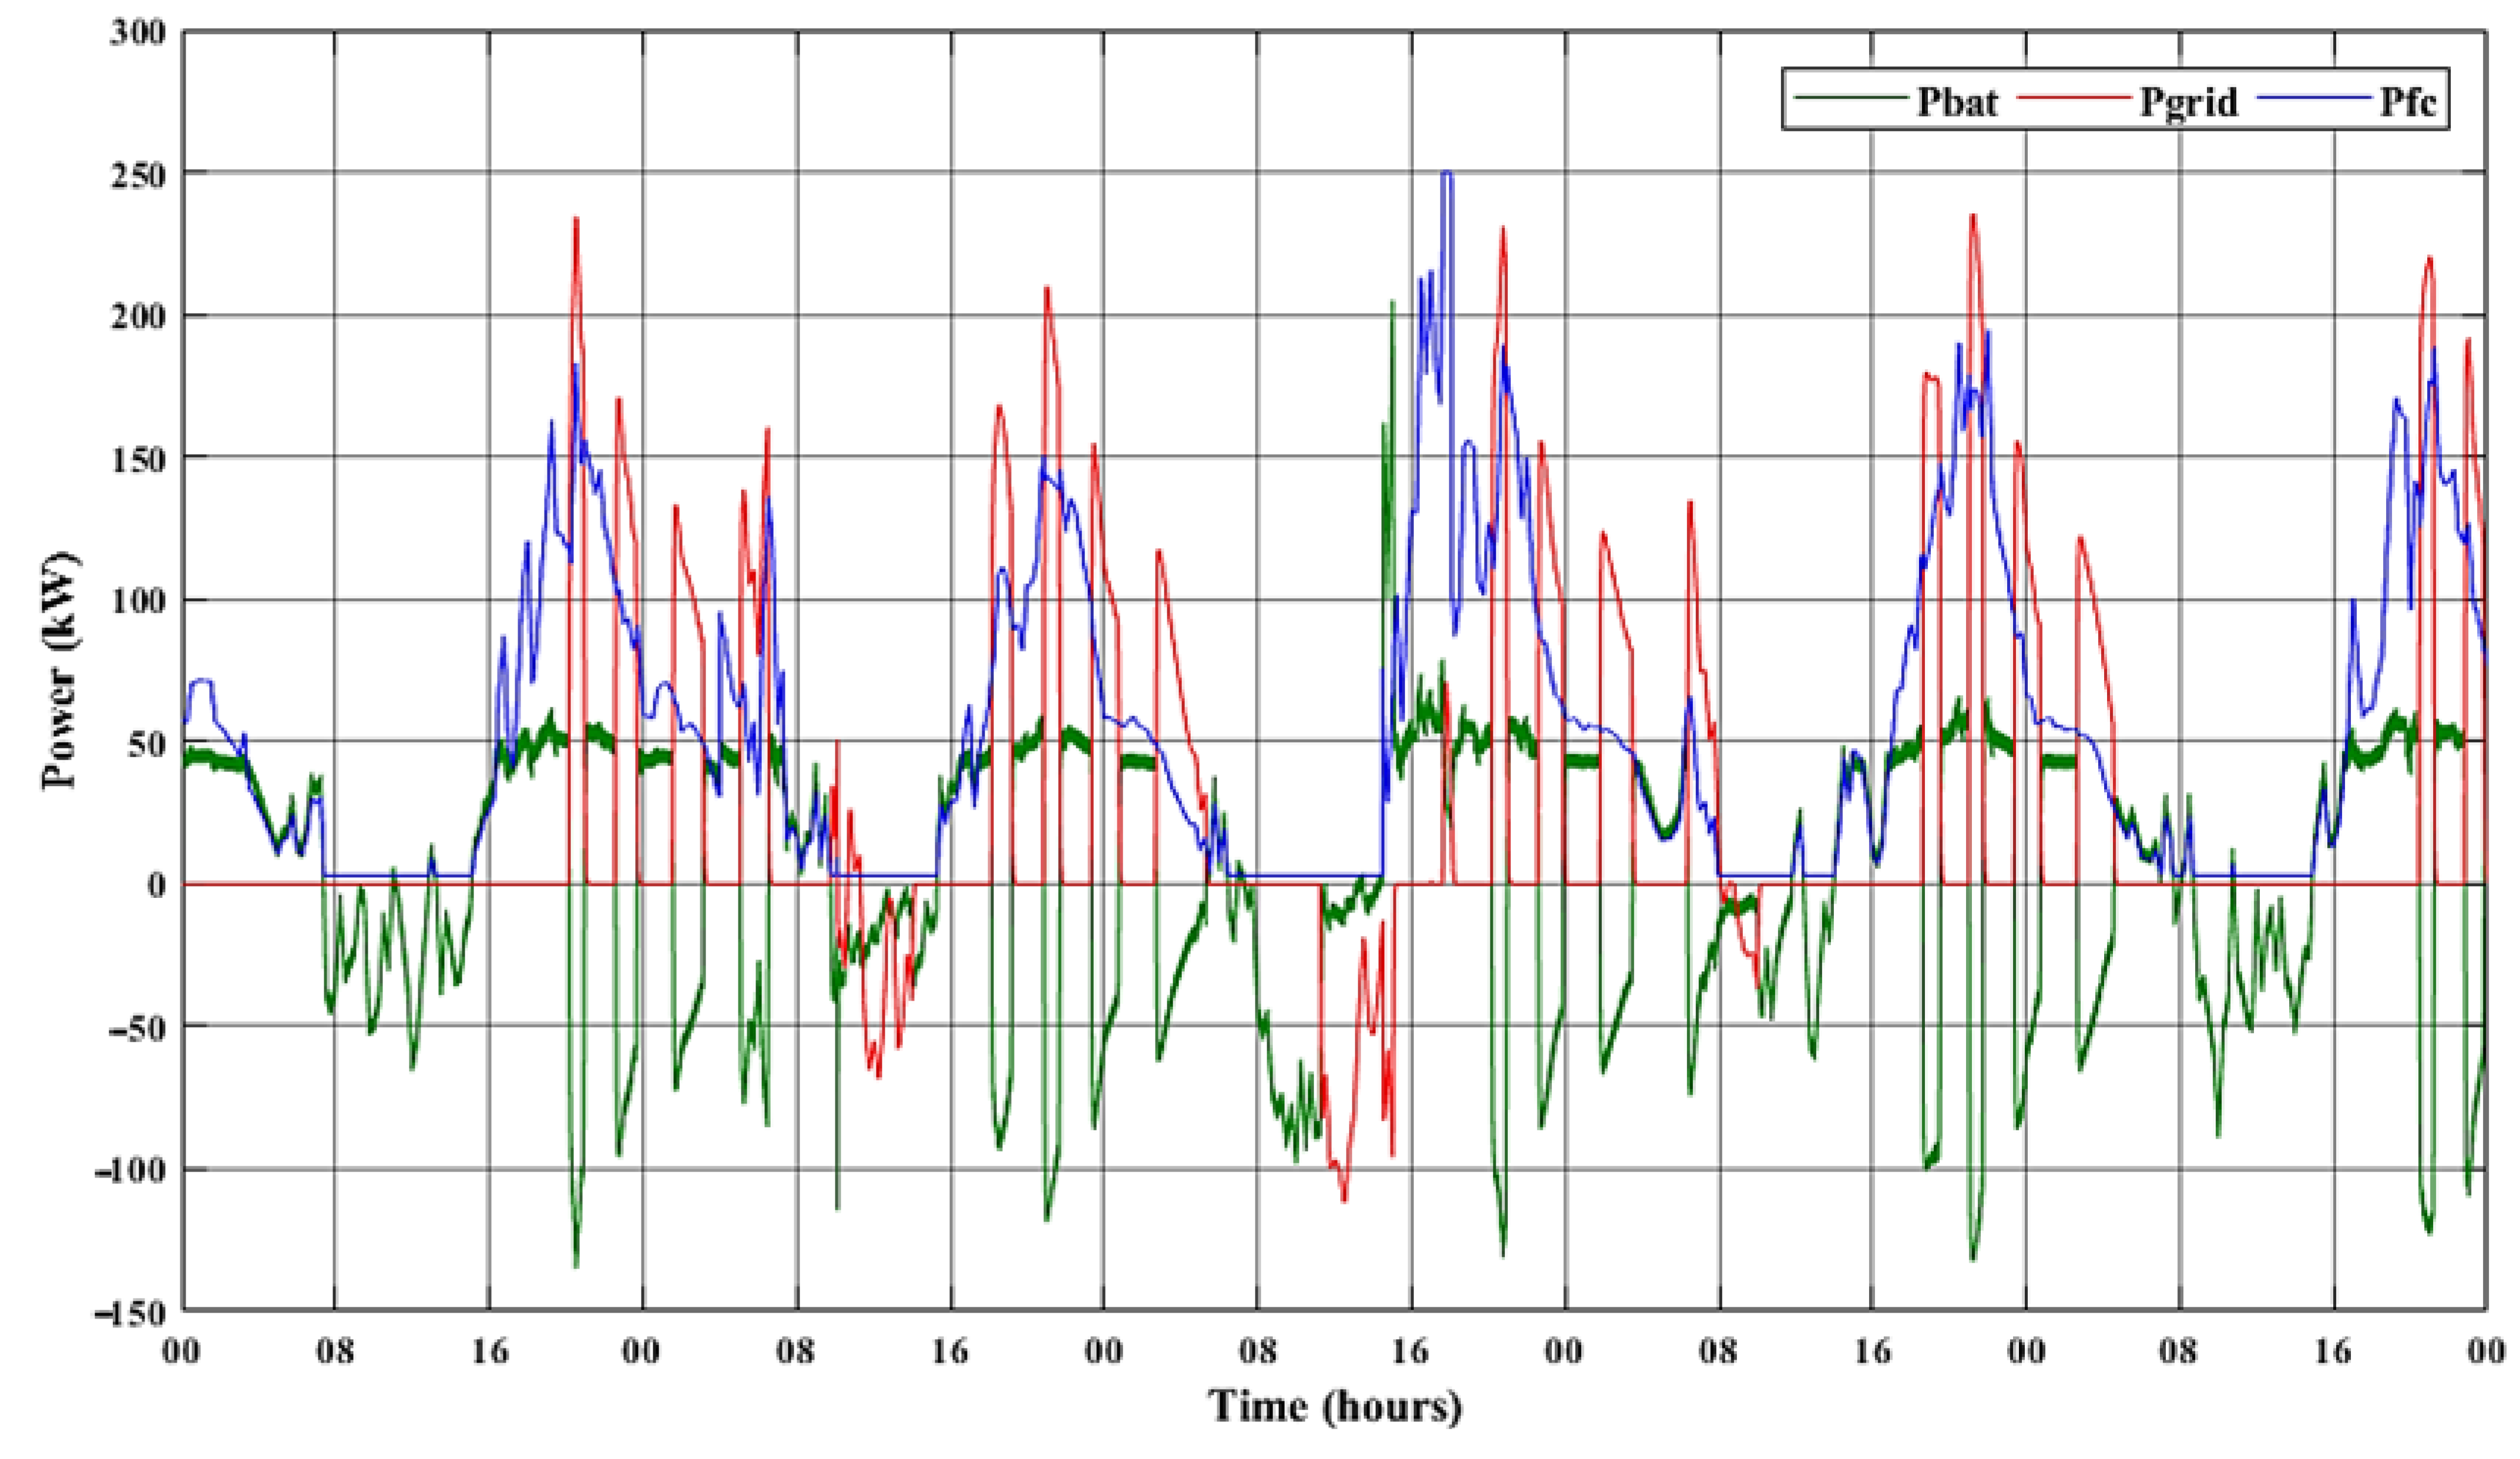
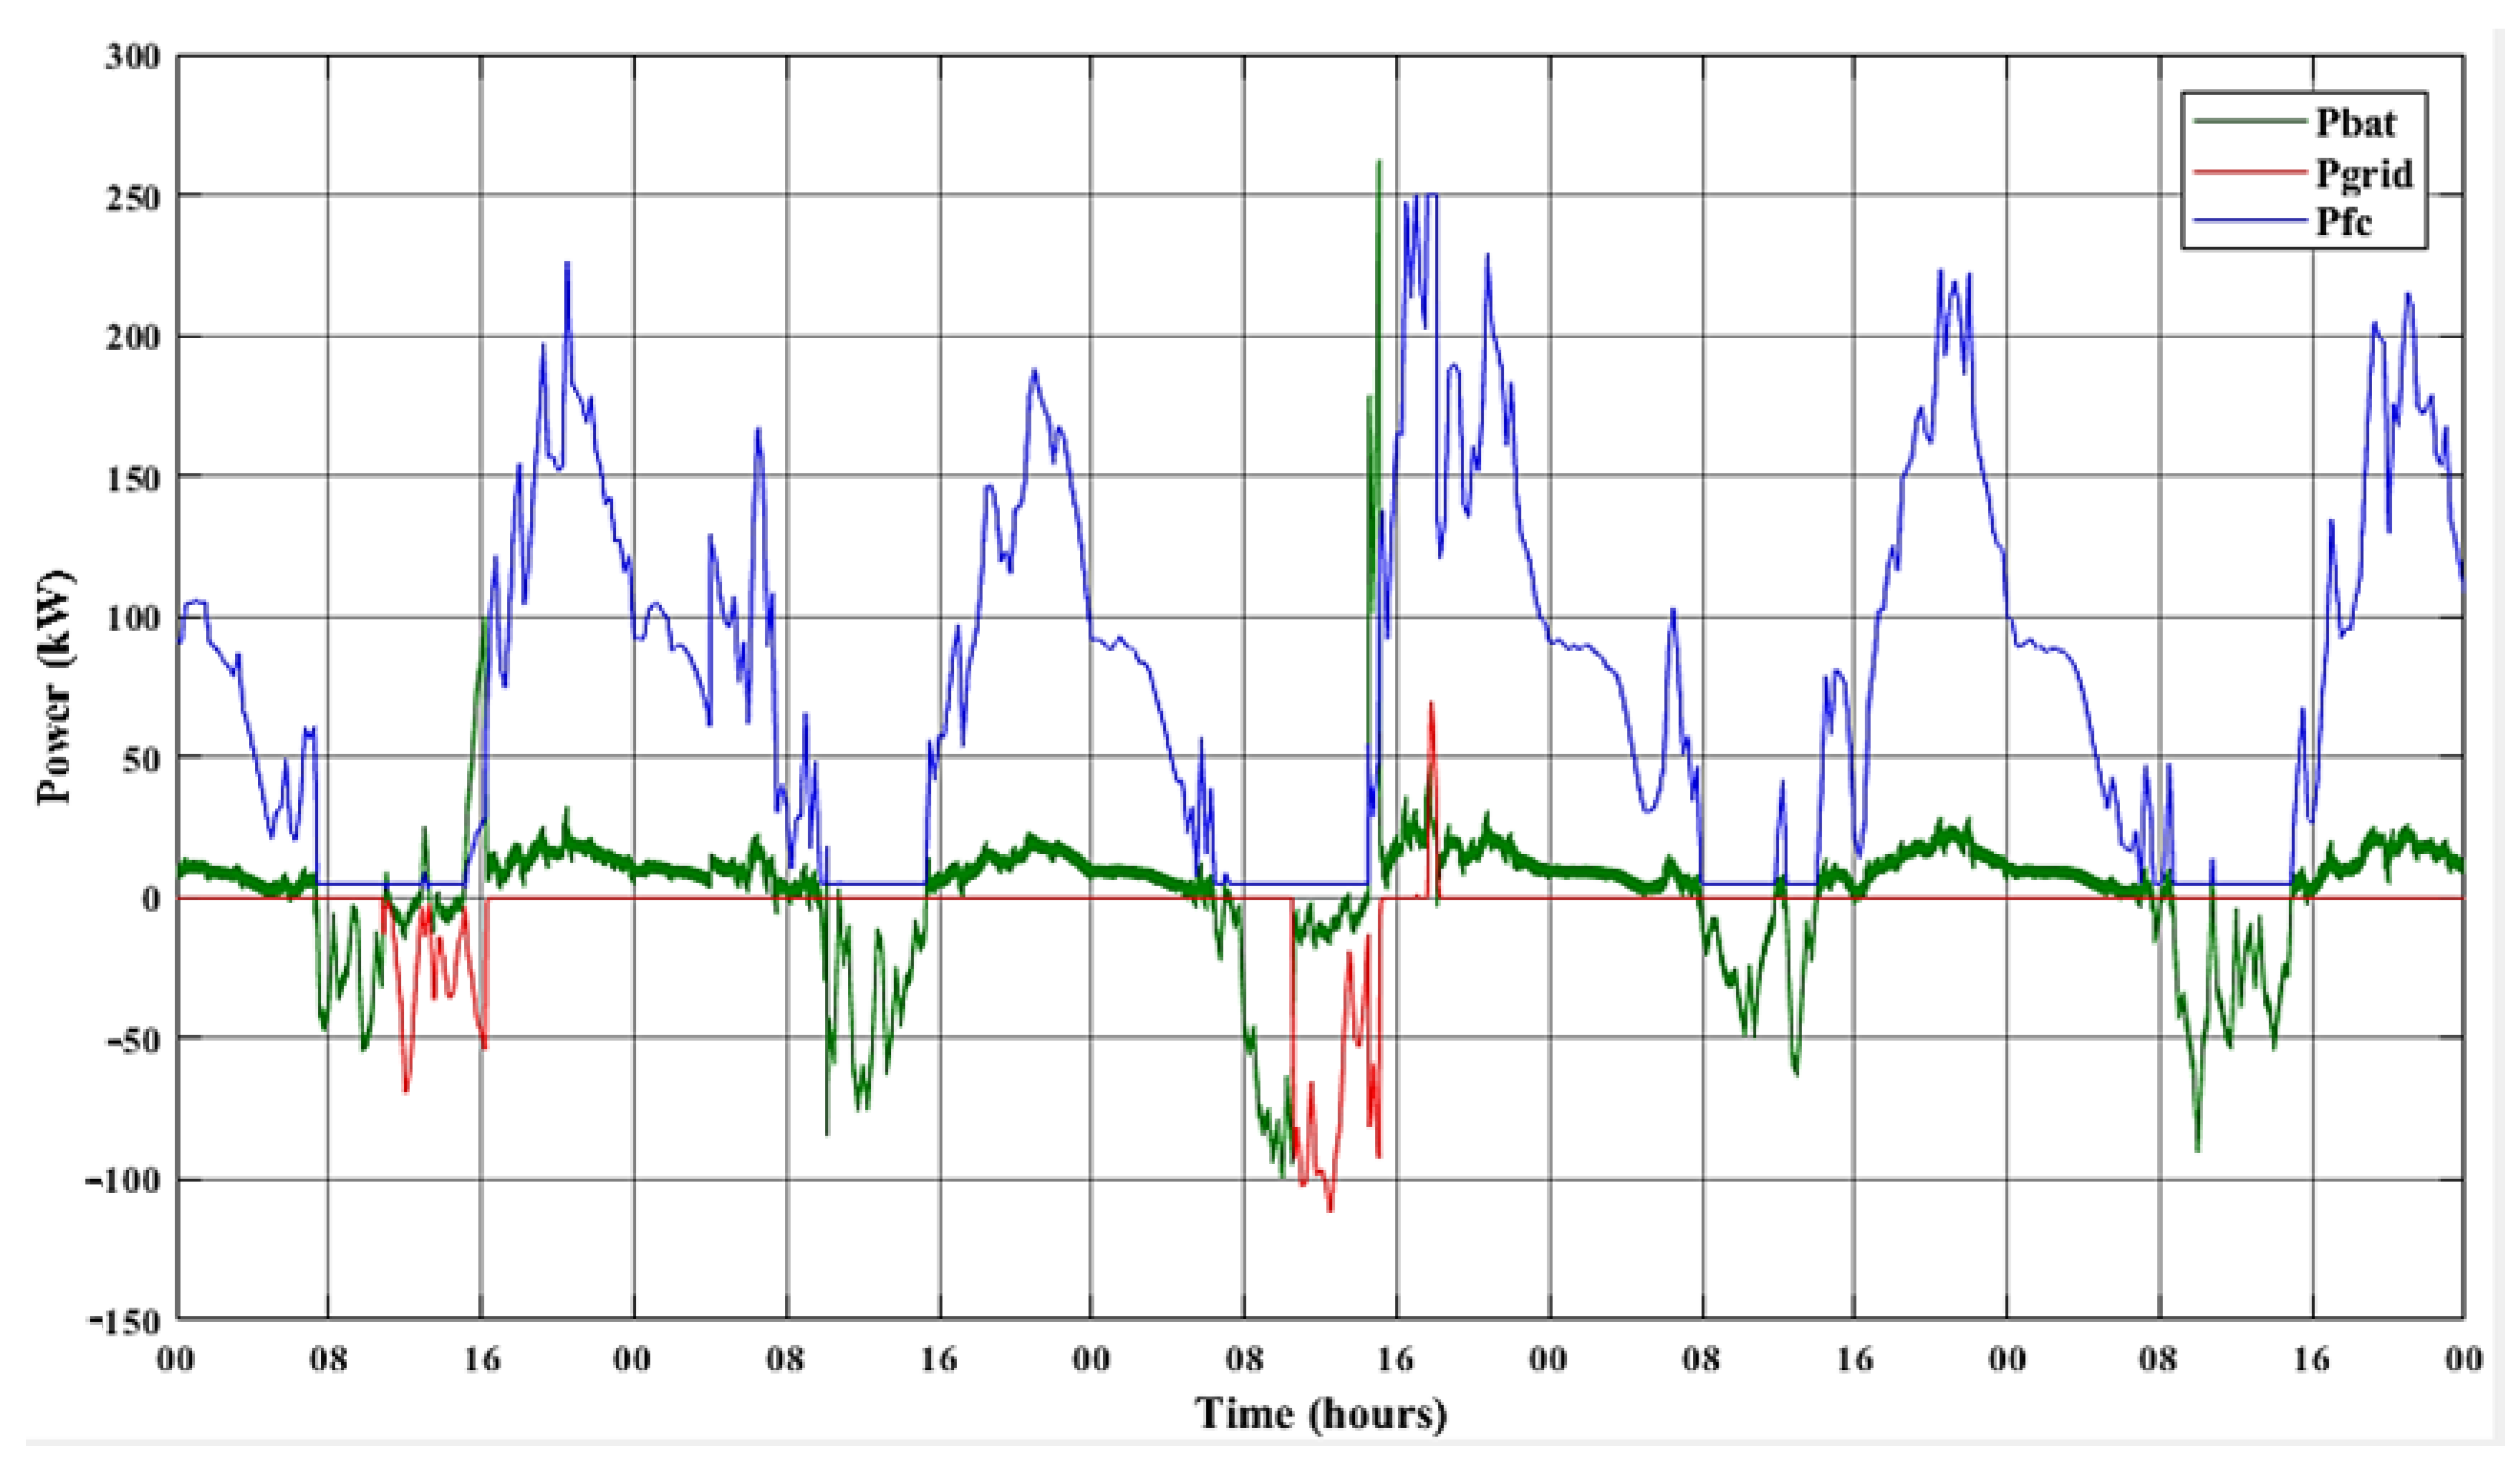
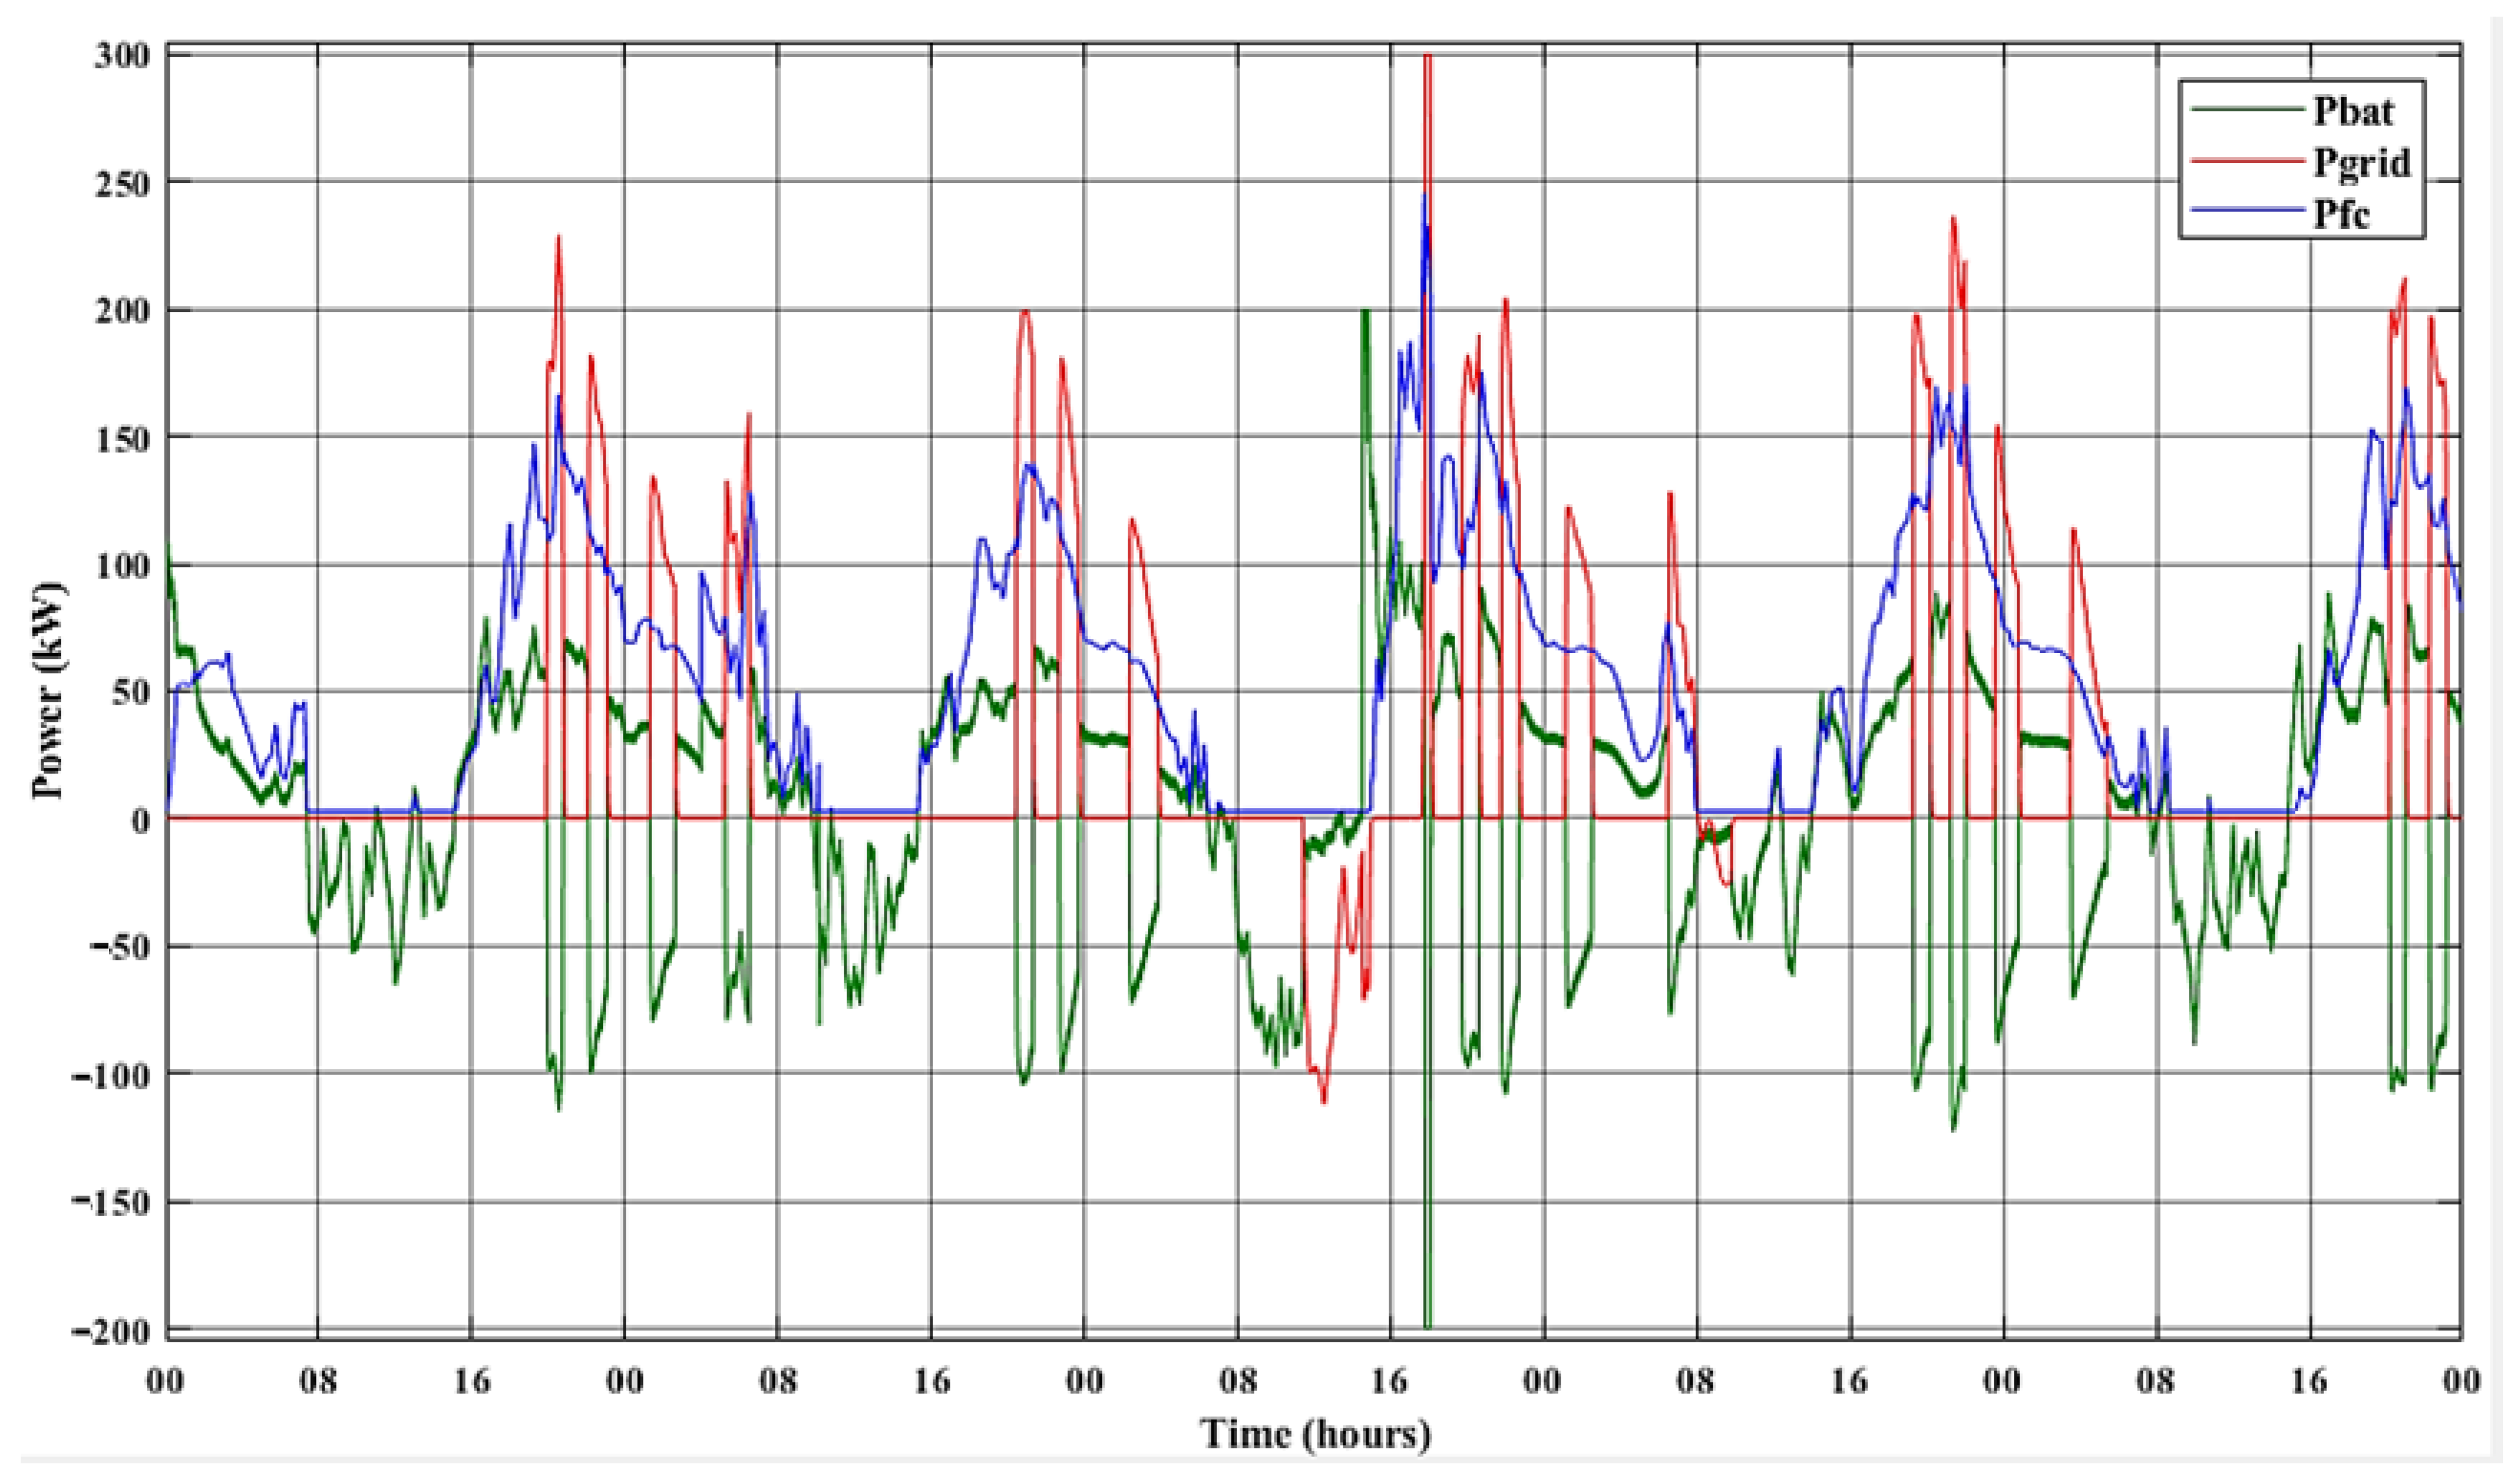
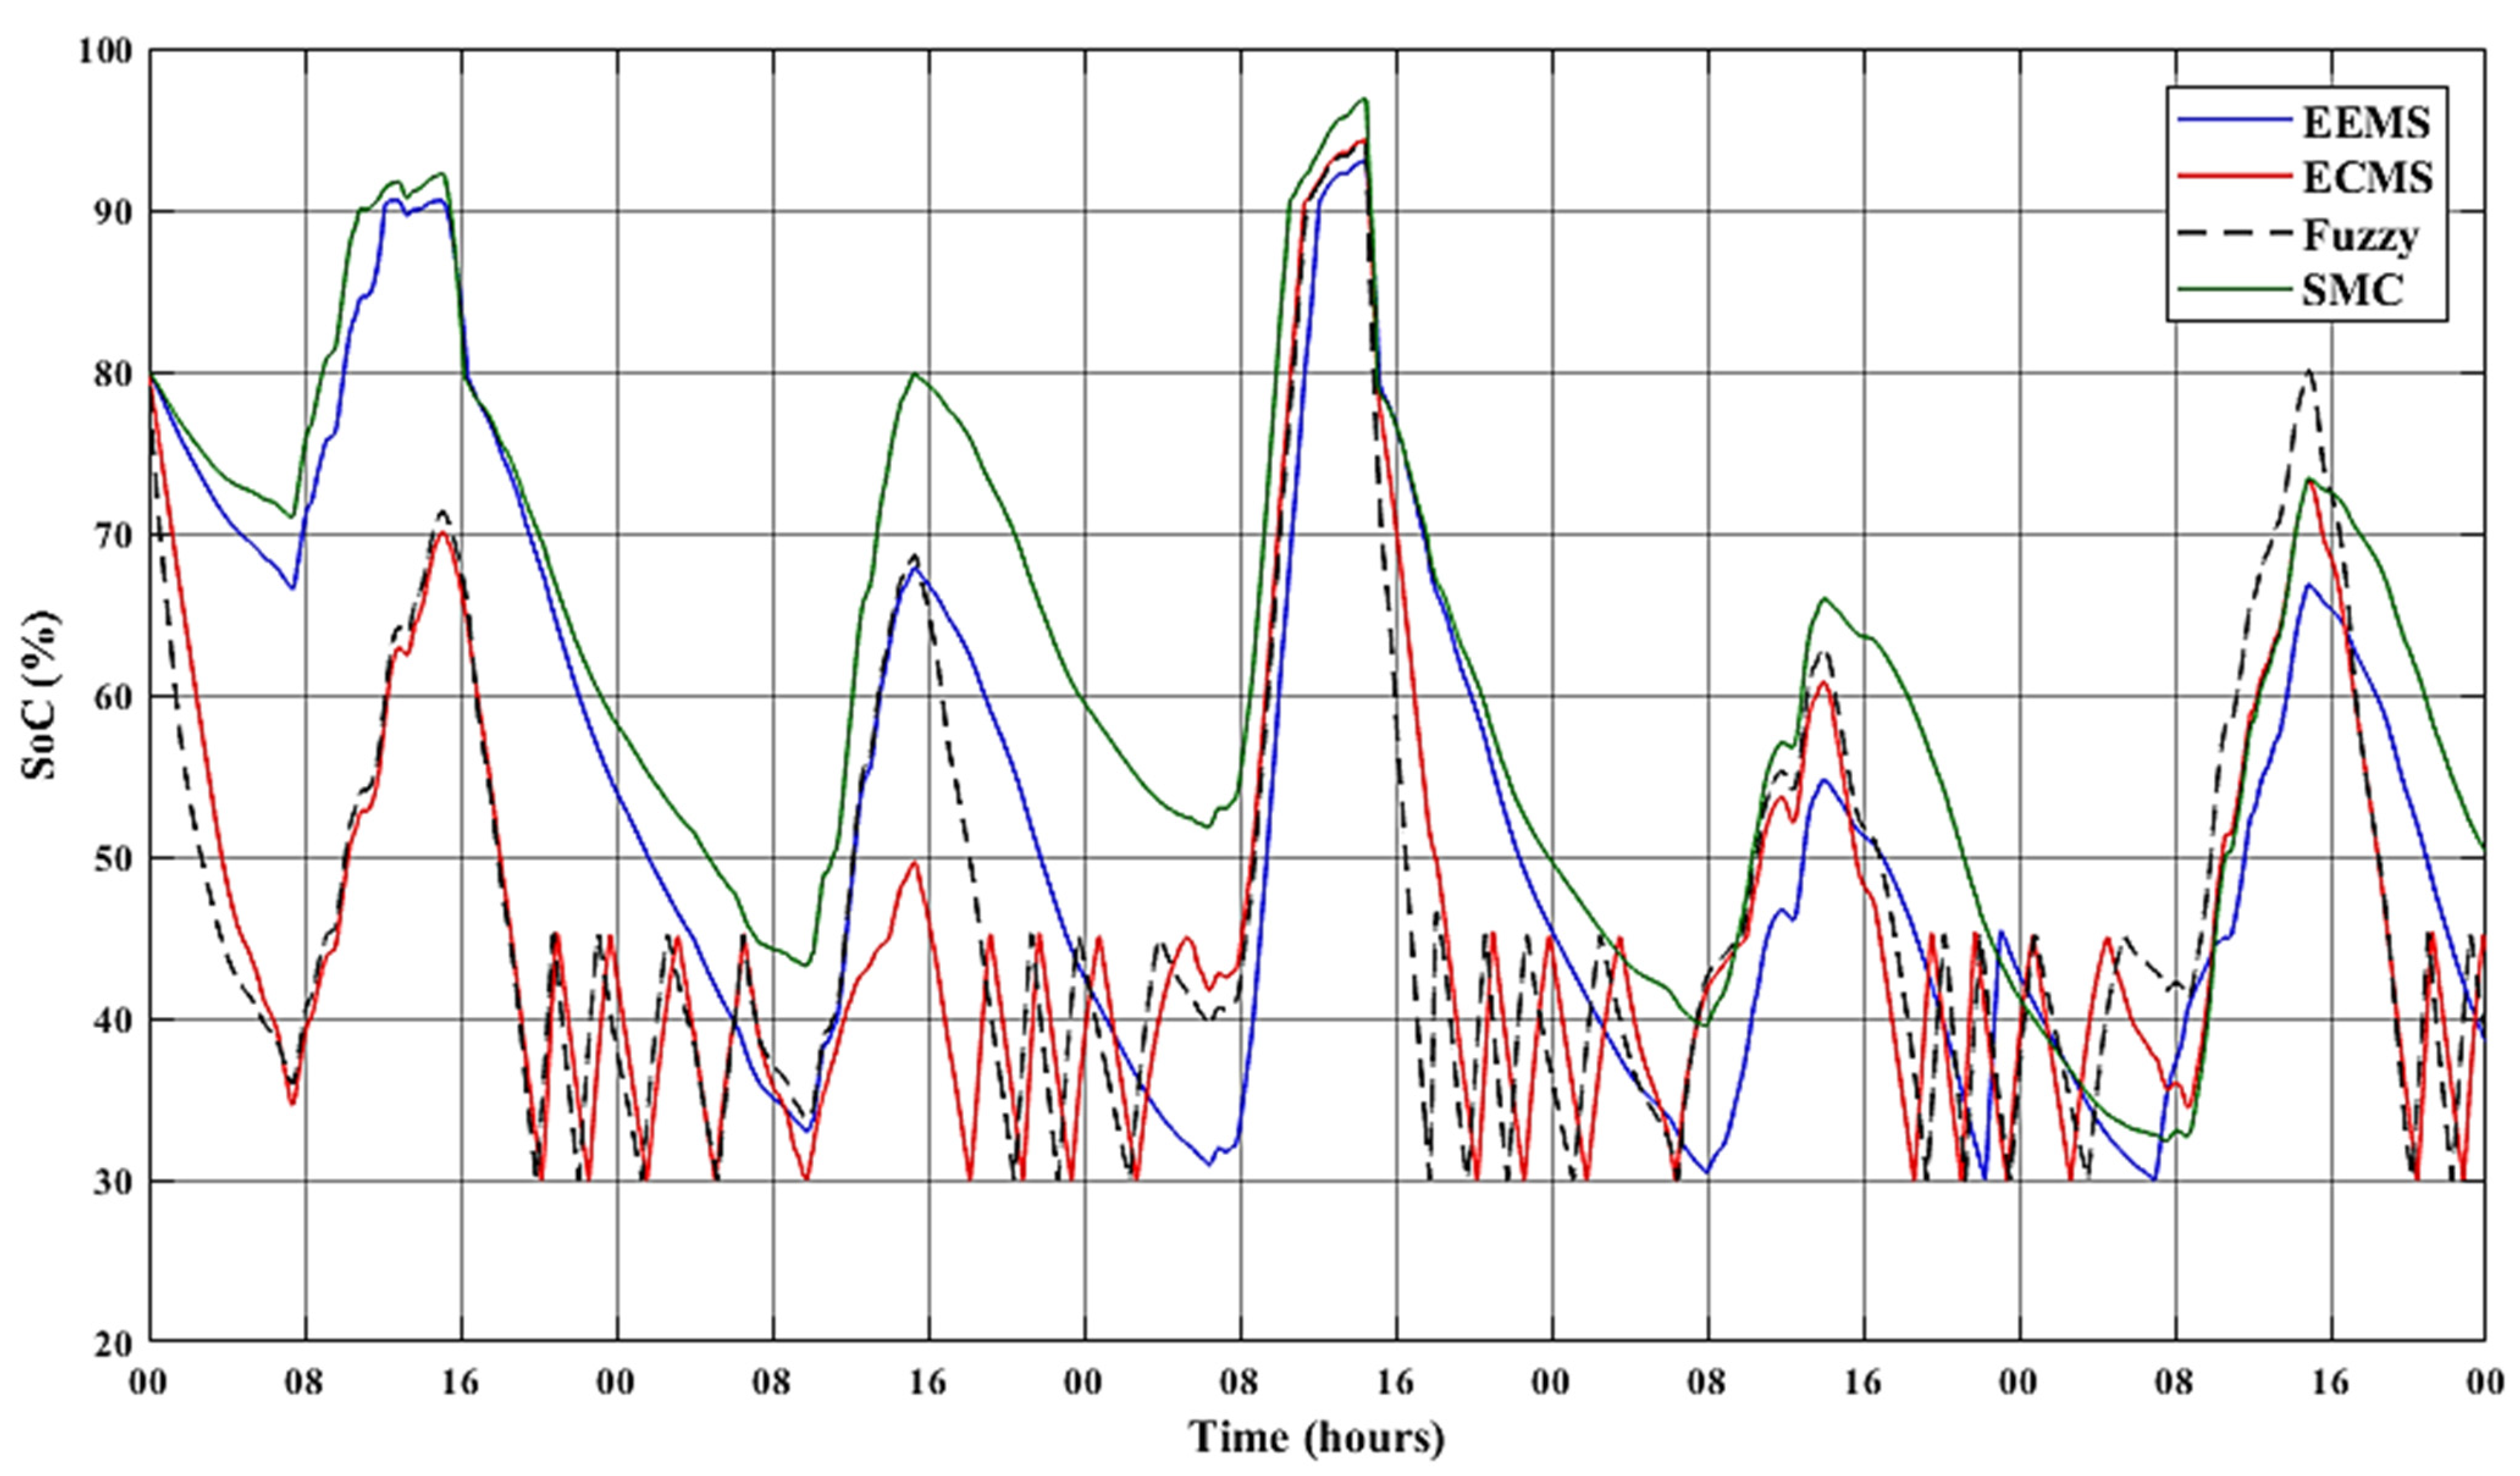
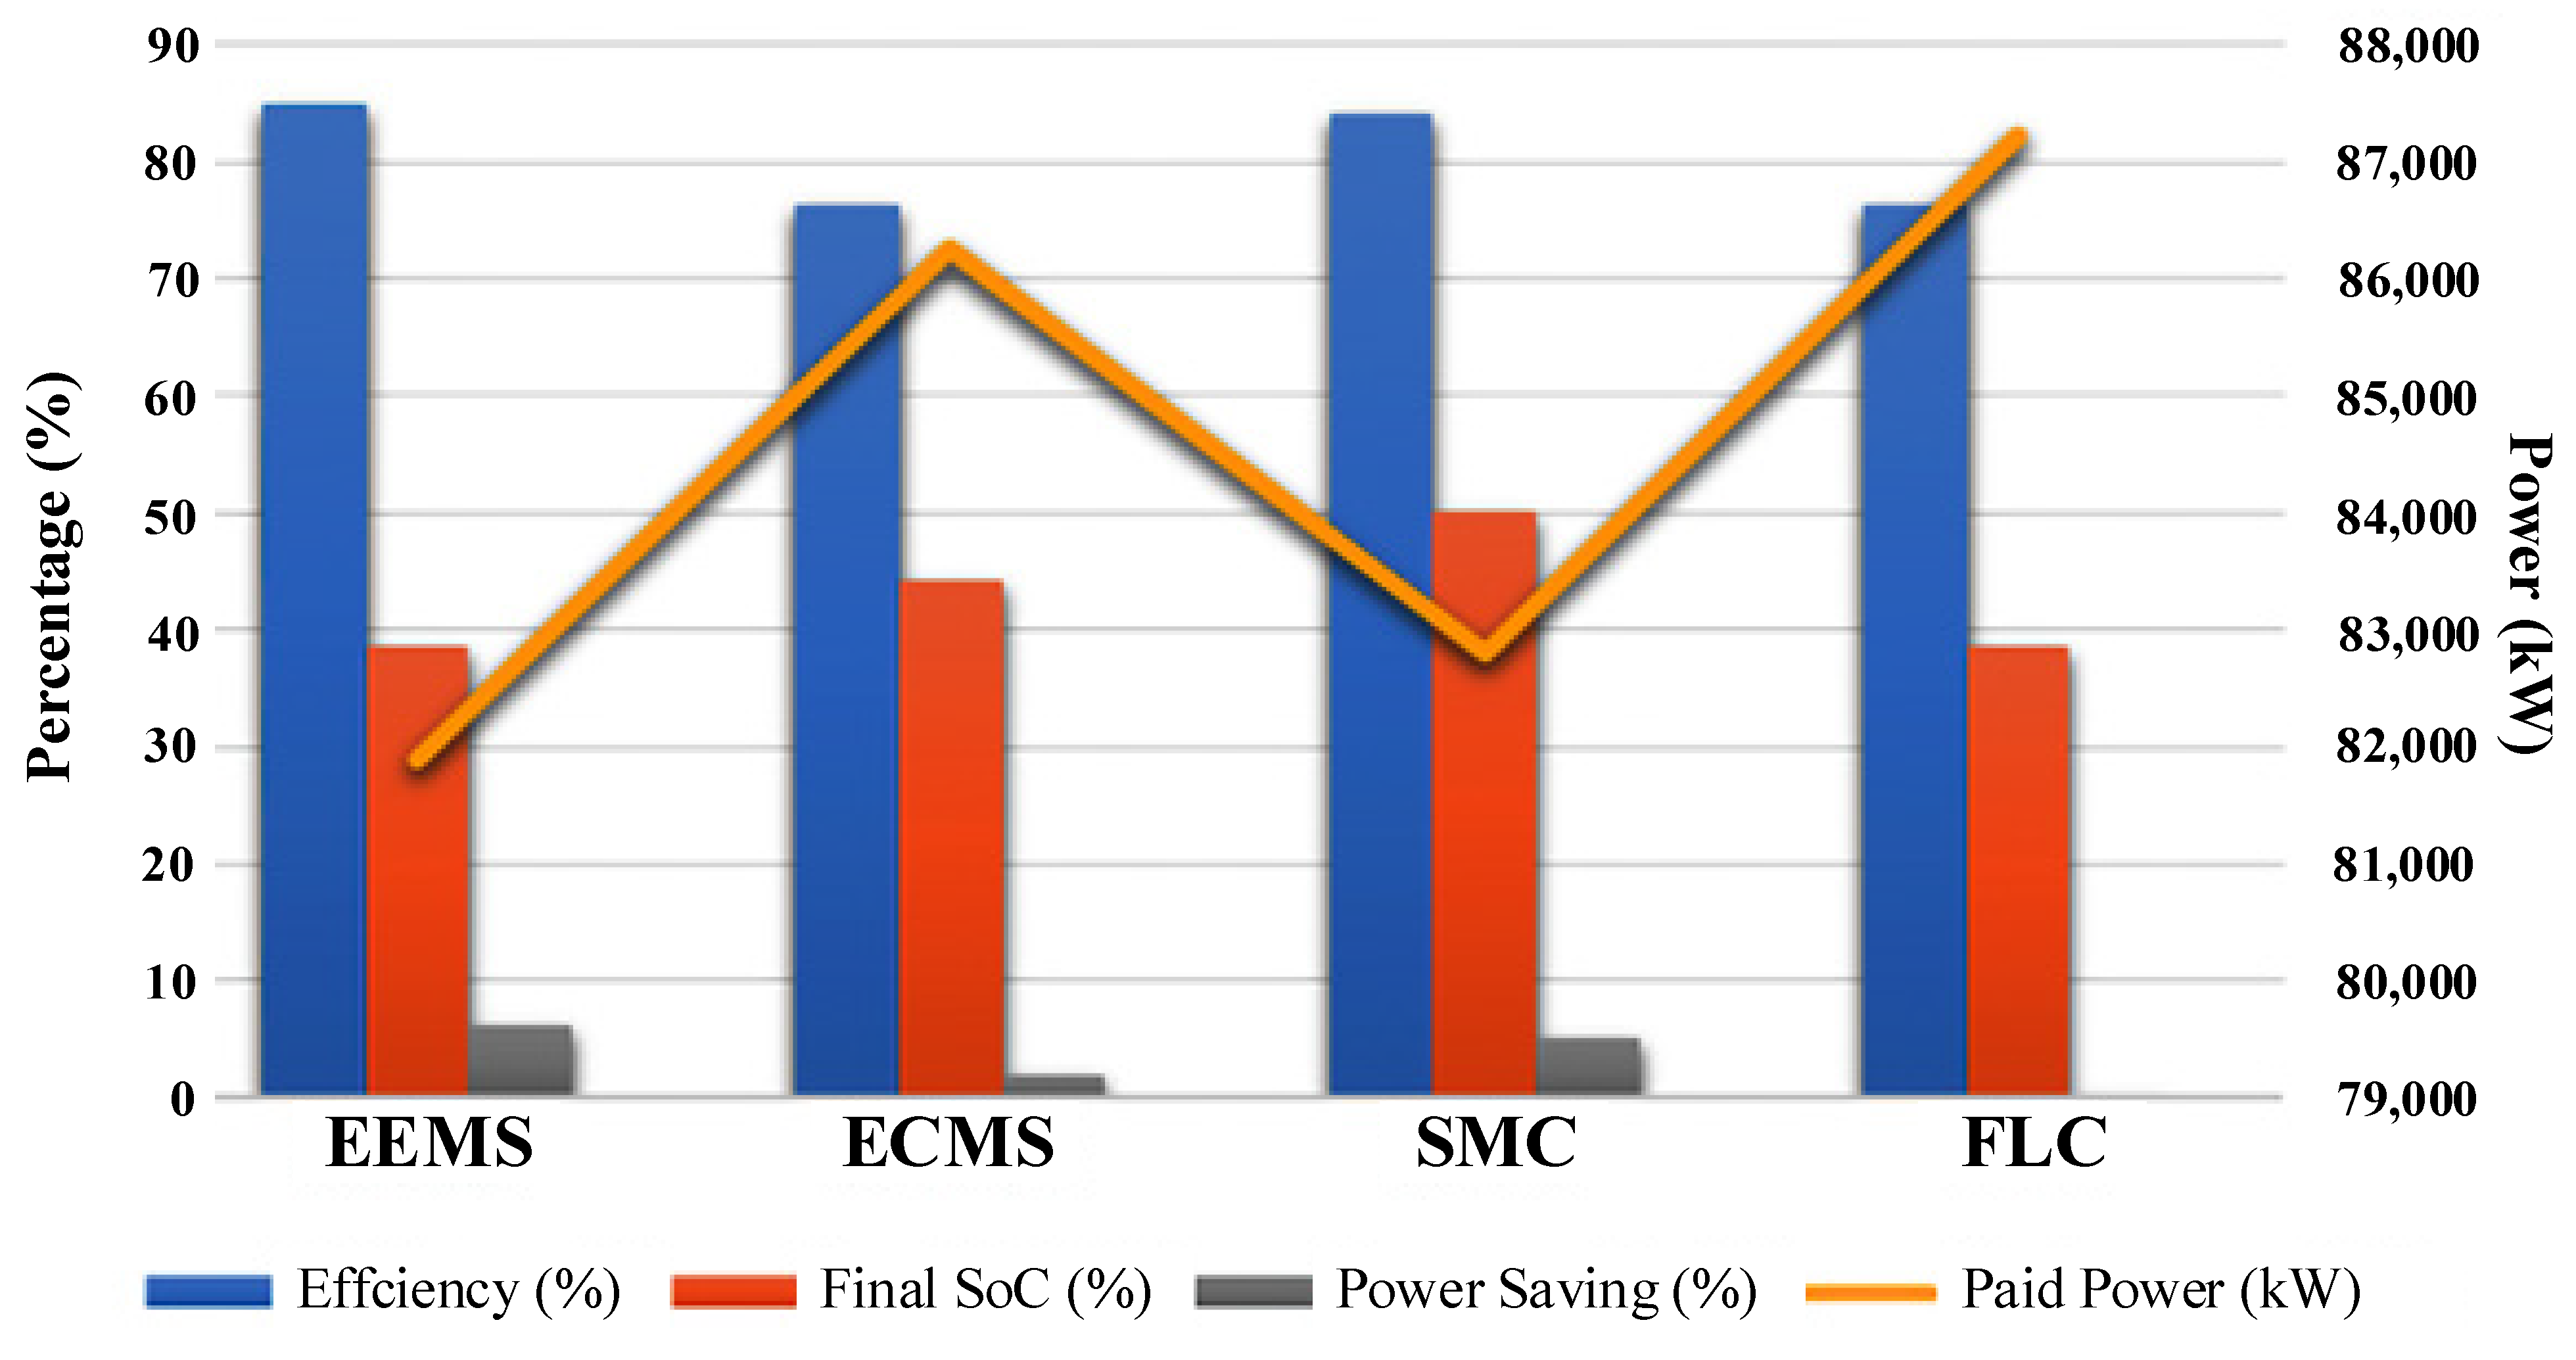
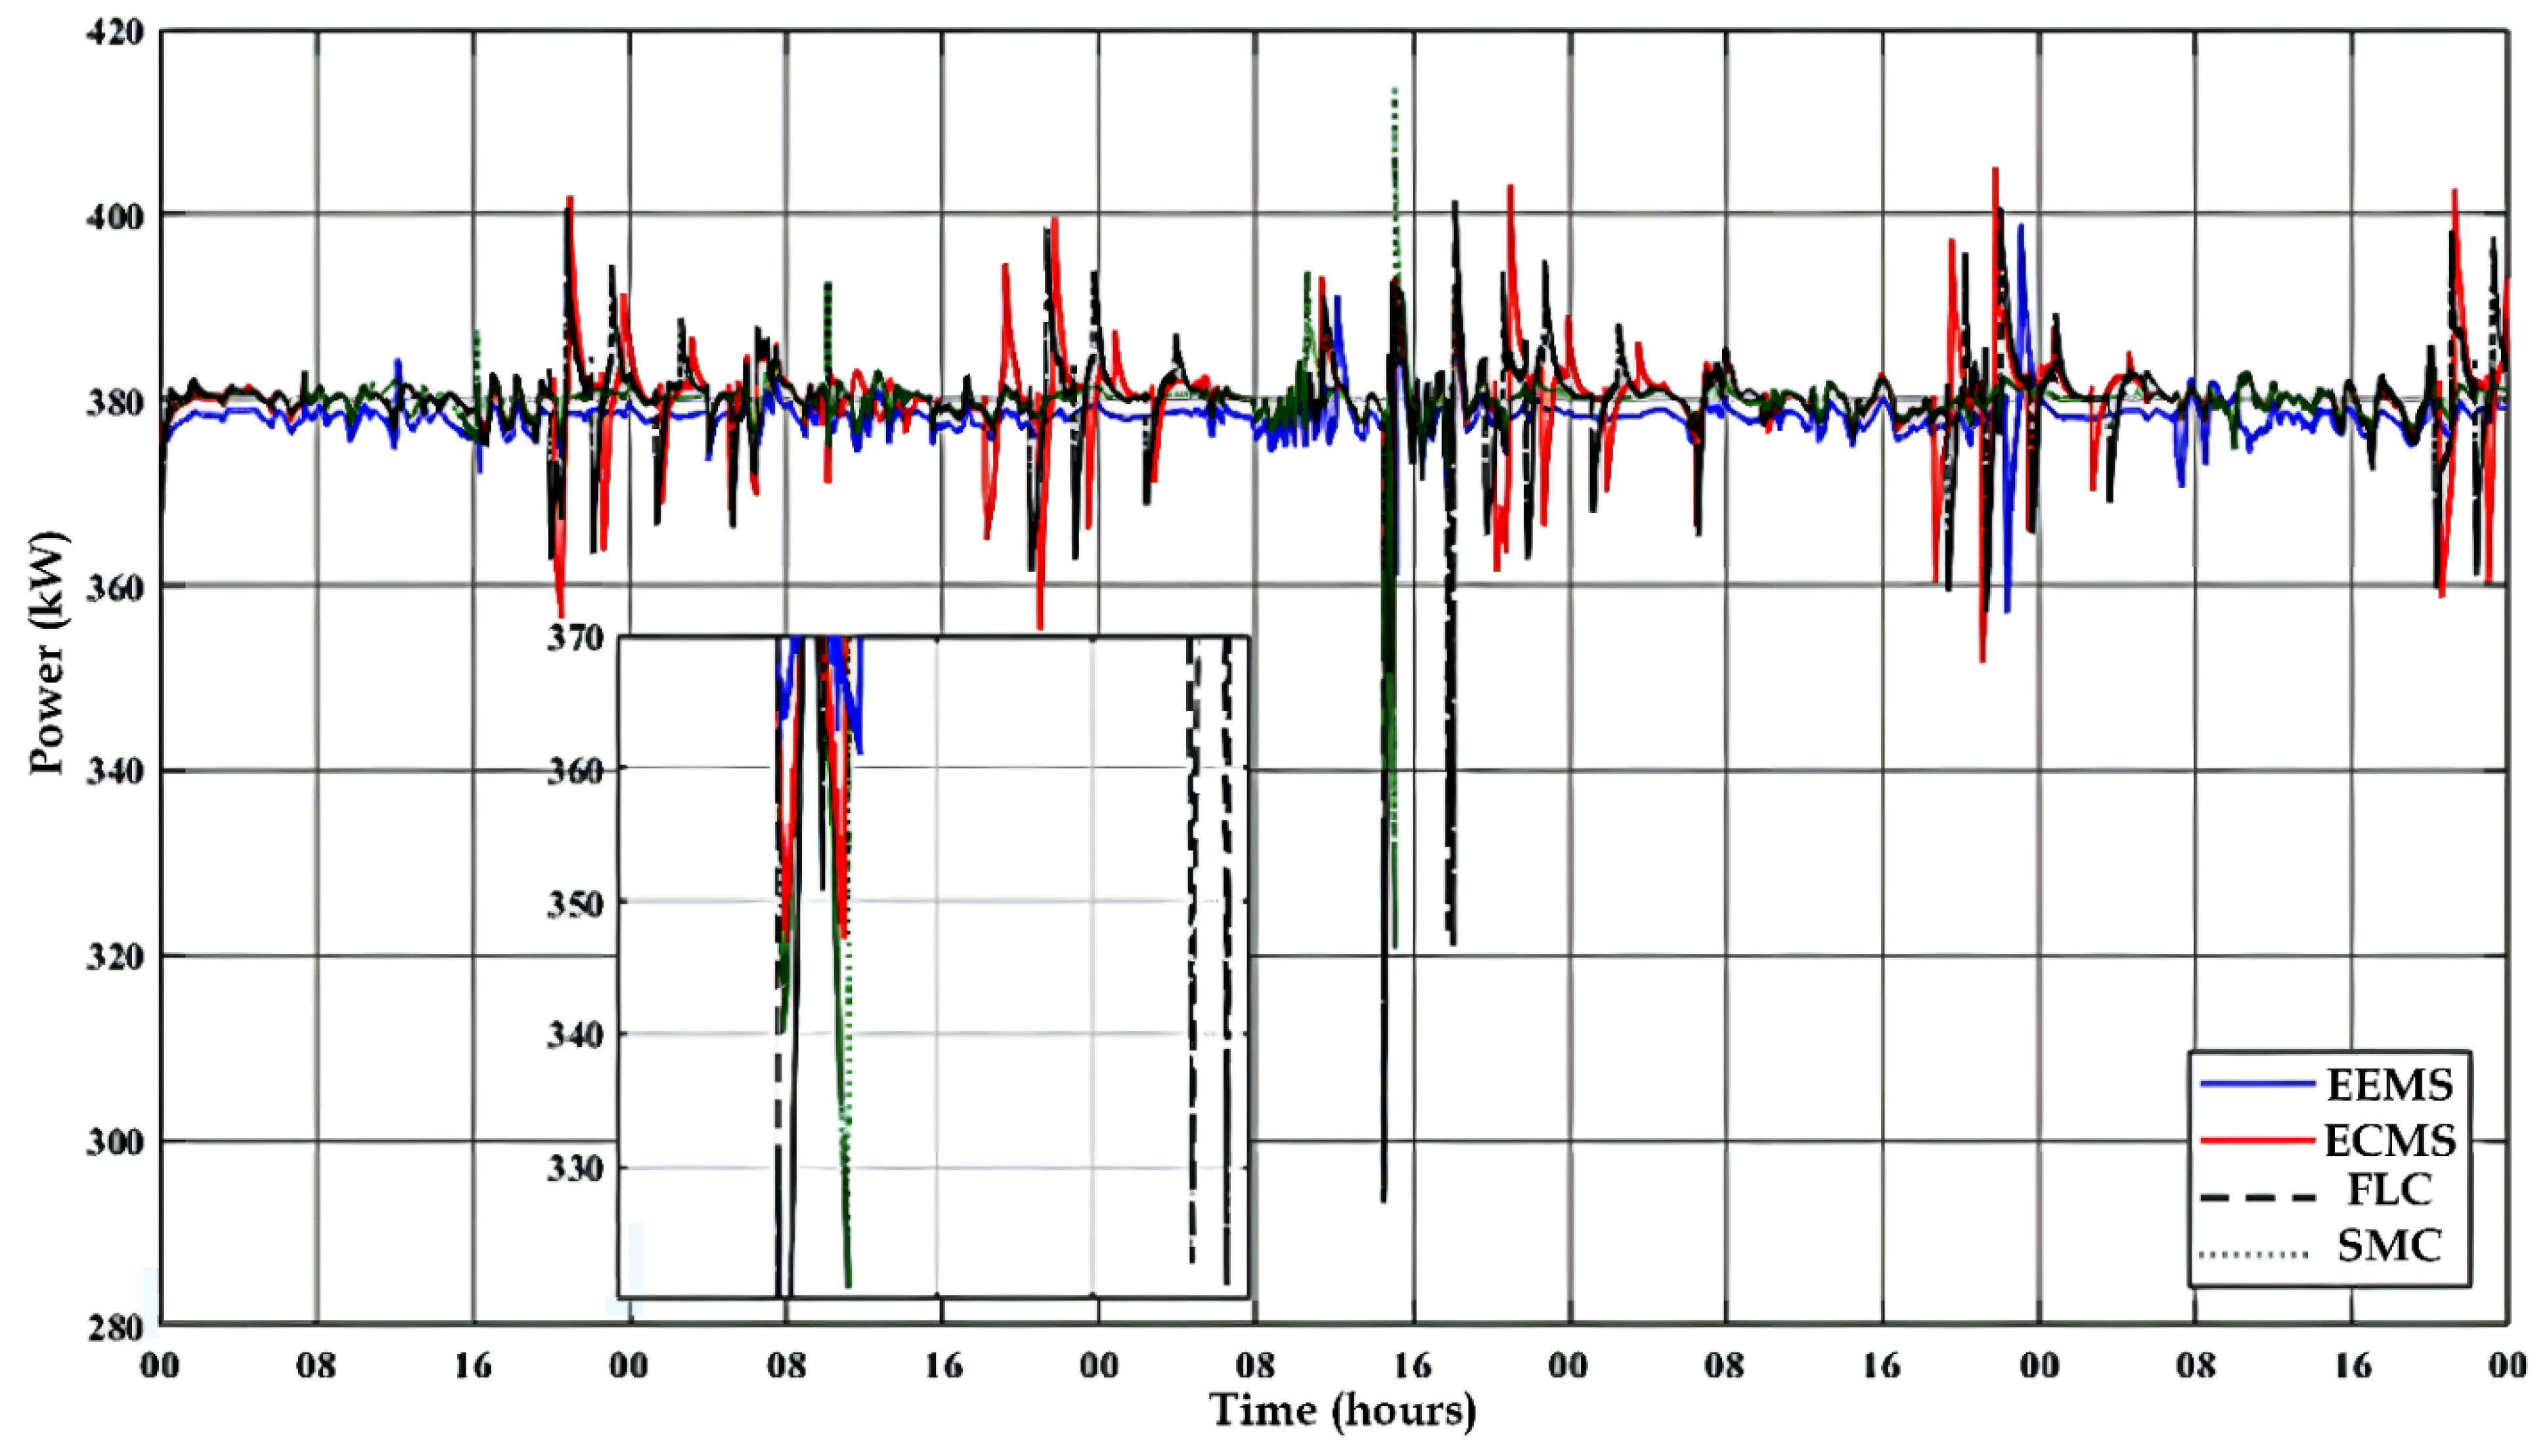
4. Results and Discussion
5. Conclusions
Author Contributions
Funding
Institutional Review Board Statement
Informed Consent Statement
Data Availability Statement
Conflicts of Interest
References
- Wang, F.; Xie, J.; Wu, S.; Li, J.; Barbieri, D.M.; Zhang, L. Life cycle energy consumption by roads and associated interpretative analysis of sustainable policies. Renew. Sustain. Energy Rev. 2021, 141, 110823. [Google Scholar] [CrossRef]
- Gui, E.M.; Diesendorf, M.; MacGill, I. Distributed energy infrastructure paradigm: Community microgrids in a new institutional economics context. Renew. Sustain. Energy Rev. 2017, 72, 1355–1365. [Google Scholar] [CrossRef]
- Mohabat Doost, D.; Buffa, A.; Brunetta, G.; Salata, S.; Mutani, G. Mainstreaming Energetic Resilience by Morphological Assessment in Ordinary Land Use Planning. The Case Study of Moncalieri, Turin (Italy). Sustainability 2020, 12, 4443. [Google Scholar] [CrossRef]
- Ehigiamusoe, K.U.; Dogan, E. The role of interaction effect between renewable energy consumption and real income in carbon emissions: Evidence from low-income countries. Renew. Sustain. Energy Rev. 2022, 154, 111883. [Google Scholar] [CrossRef]
- Srivastava, C.; Tripathy, M. DC microgrid protection issues and schemes: A critical review. Renew. Sustain. Energy Rev. 2021, 151, 111546. [Google Scholar] [CrossRef]
- Mirsaeidi, S.; Dong, X.; Said, D.M. Towards hybrid AC/DC microgrids: Critical analysis and classification of protection strategies. Renew. Sustain. Energy Rev. 2018, 90, 97–103. [Google Scholar] [CrossRef]
- Majeed Butt, O.; Zulqarnain, M.; Majeed Butt, T. Recent advancement in smart grid technology: Future prospects in the electrical power network. Ain. Shams. Eng. J. 2021, 12, 687–695. [Google Scholar] [CrossRef]
- Dagar, A.; Gupta, P.; Niranjan, V. Microgrid protection: A comprehensive review. Renew. Sustain. Energy Rev. 2021, 149, 111401. [Google Scholar] [CrossRef]
- Sandelic, M.; Peyghami, S.; Sangwongwanich, A.; Blaabjerg, F. Reliability aspects in microgrid design and planning: Status and power electronics-induced challenges. Renew. Sustain. Energy Rev. 2022, 159, 112127. [Google Scholar] [CrossRef]
- Ferahtia, S.; Djeroui, A.; Rezk, H.; Houari, A.; Zeghlache, S.; Machmoum, M. Optimal control and implementation of energy management strategy for a DC microgrid. Energy 2022, 238, 121777. [Google Scholar] [CrossRef]
- Ferahtia, S.; Rezk, H.; Abdelkareem, M.A.; Olabi, A.G. Optimal techno-economic energy management strategy for building’s microgrids based bald eagle search optimization algorithm. Appl. Energy 2022, 306, 118069. [Google Scholar] [CrossRef]
- Fathy, A.; Ferahtia, S.; Rezk, H.; Yousri, D.; Abdelkareem, M.A.; Olabi, A.G. Optimal adaptive fuzzy management strategy for fuel cell-based DC microgrid. Energy 2022, 247, 123447. [Google Scholar] [CrossRef]
- Vossos, V.; Gerber, D.; Bennani, Y.; Brown, R.; Marnay, C. Techno-economic analysis of DC power distribution in commercial buildings. Appl. Energy 2018, 230, 663–678. [Google Scholar] [CrossRef] [Green Version]
- AlLee, G.; Tschudi, W. Edison Redux: 380 Vdc Brings Reliability and Efficiency to Sustainable Data Centers. IEEE Power Energy Mag. 2012, 10, 50–59. [Google Scholar] [CrossRef]
- Huang, J.; Fan, J.; Furbo, S.; Chen, D.; Dai, Y.; Kong, W. Economic analysis and optimization of household solar heating technologies and systems. Sustain. Energy Technol Assess. 2019, 36, 100532. [Google Scholar] [CrossRef]
- Hidalgo León, R.; Almeida Pazmiño, G.; Jácome Ruiz, P.; Soriano Idrovo, G.; Urquizo Guevara, J. A Survey on Technologies to Implement Battery Emulators based on DC/DC Power Converters. In Proceedings of the 14th Latin American and Caribbean Conference for Engineering and Technology, San Jose, Costa Rica, 20–22 July 2016. [Google Scholar] [CrossRef] [Green Version]
- He, H.; Xiong, R.; Fan, J. Evaluation of Lithium-Ion Battery Equivalent Circuit Models for State of Charge Estimation by an Experimental Approach. Energies 2011, 4, 582–598. [Google Scholar] [CrossRef]
- US Department of Energy. Comparison of Fuel Cell Technologies; Energy Efficiency & Renewable Energy: Washington, DC, USA, 2016.
- Wang, C.; Nehrir, M.H.H. A Physically Based Dynamic Model for Solid Oxide Fuel Cells. IEEE Trans. Energy Convers. 2007, 22, 887–897. [Google Scholar] [CrossRef]
- Belila, A.; Amirat, Y.; Benbouzid, M.; Berkouk, E.M.; Yao, G. Virtual synchronous generators for voltage synchronization of a hybrid PV-diesel power system. Int. J. Electr. Power Energy Syst. 2020, 117, 105677. [Google Scholar] [CrossRef]
- Wang, N.; Wang, D.; Xing, Y.; Shao, L.; Afzal, S. Application of co-evolution RNA genetic algorithm for obtaining optimal parameters of SOFC model. Renew. Energy 2020, 150, 221–233. [Google Scholar] [CrossRef]
- Chakraborty, U. Reversible and Irreversible Potentials and an Inaccuracy in Popular Models in the Fuel Cell Literature. Energies 2018, 11, 1851. [Google Scholar] [CrossRef] [Green Version]
- Chakraborty, S.; Simões, M.G.; Kramer, W.E. (Eds.) Power Electronics for Renewable and Distributed Energy Systems; Springer: London, UK, 2013. [Google Scholar] [CrossRef]
- Jiang, Q.; Xue, M.; Geng, G. Energy management of microgrid in grid-connected and stand-alone modes. IEEE Trans. Power Syst. 2013, 28, 3380–3389. [Google Scholar] [CrossRef]
- Vásquez, L.O.P.; Ramírez, V.M.; Thanapalan, K. A Comparison of Energy Management System for a DC Microgrid. Appl. Sci. 2020, 10, 1071. [Google Scholar] [CrossRef] [Green Version]
- Motapon, S.N.; Dessaint, L.-A.; Al-Haddad, K. A Robust H2-Consumption-Minimization-Based Energy Management Strategy for a Fuel Cell Hybrid Emergency Power System of More Electric Aircraft. IEEE Trans. Ind. Electron. 2014, 61, 6148–6156. [Google Scholar] [CrossRef]
- Ahmadi, S.; Bathaee, S.M.T.; Hosseinpour, A.H. Improving fuel economy and performance of a fuel-cell hybrid electric vehicle (fuel-cell, battery, and ultra-capacitor) using optimized energy management strategy. Energy Convers. Manag. 2018, 160, 74–84. [Google Scholar] [CrossRef]
- Han, Y.; Yang, H.; Li, Q.; Chen, W.; Zare, F.; Guerrero, J.M. Mode-triggered droop method for the decentralized energy management of an islanded hybrid PV/hydrogen/battery DC microgrid. Energy 2020, 199, 117441. [Google Scholar] [CrossRef]
- Ferahtia, S.; Djerioui, A.; Zeghlache, S.; Houari, A. A hybrid power system based on fuel cell, photovoltaic source and supercapacitor. SN Appl. Sci. 2020, 2, 940. [Google Scholar] [CrossRef] [Green Version]
- Liu, N.; Chen, Q.; Liu, J.; Lu, X.; Li, P.; Lei, J.; Zhang, J. A Heuristic Operation Strategy for Commercial Building Microgrids Containing EVs and PV System. IEEE Trans. Ind. Electron. 2015, 62, 2560–2570. [Google Scholar] [CrossRef]
- Al-Sakkaf, S.; Kassas, M.; Khalid, M.; Abido, M.A. An energy management system for residential autonomous DC microgrid using optimized fuzzy logic controller considering economic dispatch. Energies 2019, 12, 1457. [Google Scholar] [CrossRef]
- Sandels, C.; Widén, J.; Nordström, L. Forecasting household consumer electricity load profiles with a combined physical and behavioral approach. Appl. Energy 2014, 131, 267–278. [Google Scholar] [CrossRef]


| Unit | Lead-Acid | Nickel-Metal | Nickel-Cadmium | Lithium-Ion | |
|---|---|---|---|---|---|
| Cell voltage | V | 2 | 1.25 | 1.25 | 3.6 |
| Energy density | Wh/Kg | 30–50 | 60–120 | 45–80 | 110–160 |
| Power density | W/Kg | 180 | 250–1000 | 150 | 1800 |
| Overcharge/deep-discharge tolerance | Not tolerant | Good | Moderate | Excellent | |
| Self-discharge rate | Low | High | Moderate | Neglected | |
| Number of cycles | 200–300 | 300–500 | 1500 | 500–1000 |
| SoC | |||||||
| ΔP | Very low (VL) | Low (L) | Nature (N) | High (H) | Very high (VH) | Off = 0 | |
| Small (V) | Max | High | Medium | Low | Off | Low = 0.25 | |
| Medium (M) | Max | High | Medium | Low | Off | Medium = 0.5 | |
| Big (B) | Max | High | Medium | Medium | Low | High = 0.75 | |
| Very big (VB) | Max | Max | High | High | Medium | Max = 1 | |
| Parameters | Value | Unit |
|---|---|---|
| Bus voltage reference | 380 | V |
| Battery capacity | 1500 | Ah |
| Battery voltage | 220 | V |
| SoC max | 90 | % |
| SoC min | 30 | % |
| FC max output power | 250 | kW |
| Efficiency (%) | Final SoC (%) | FC Energy (KWh) | Grid Energy (KWh) | Paid Energy (KWh) | Power Saving (%) | |
|---|---|---|---|---|---|---|
| EEMS | 84.91 | 38.46 | 83,712 | −1826 | 81,886 | 6.11 |
| ECMS | 76.27 | 44.15 | 62,070 | 24,199 | 86,270 | 1.83 |
| SMC | 80.18 | 50.20 | 87,175 | −4380 | 82,794 | 5.07 |
| Fuzzy | 76.30 | 38.55 | 62,865 | 24,349 | 87,215 | NA |
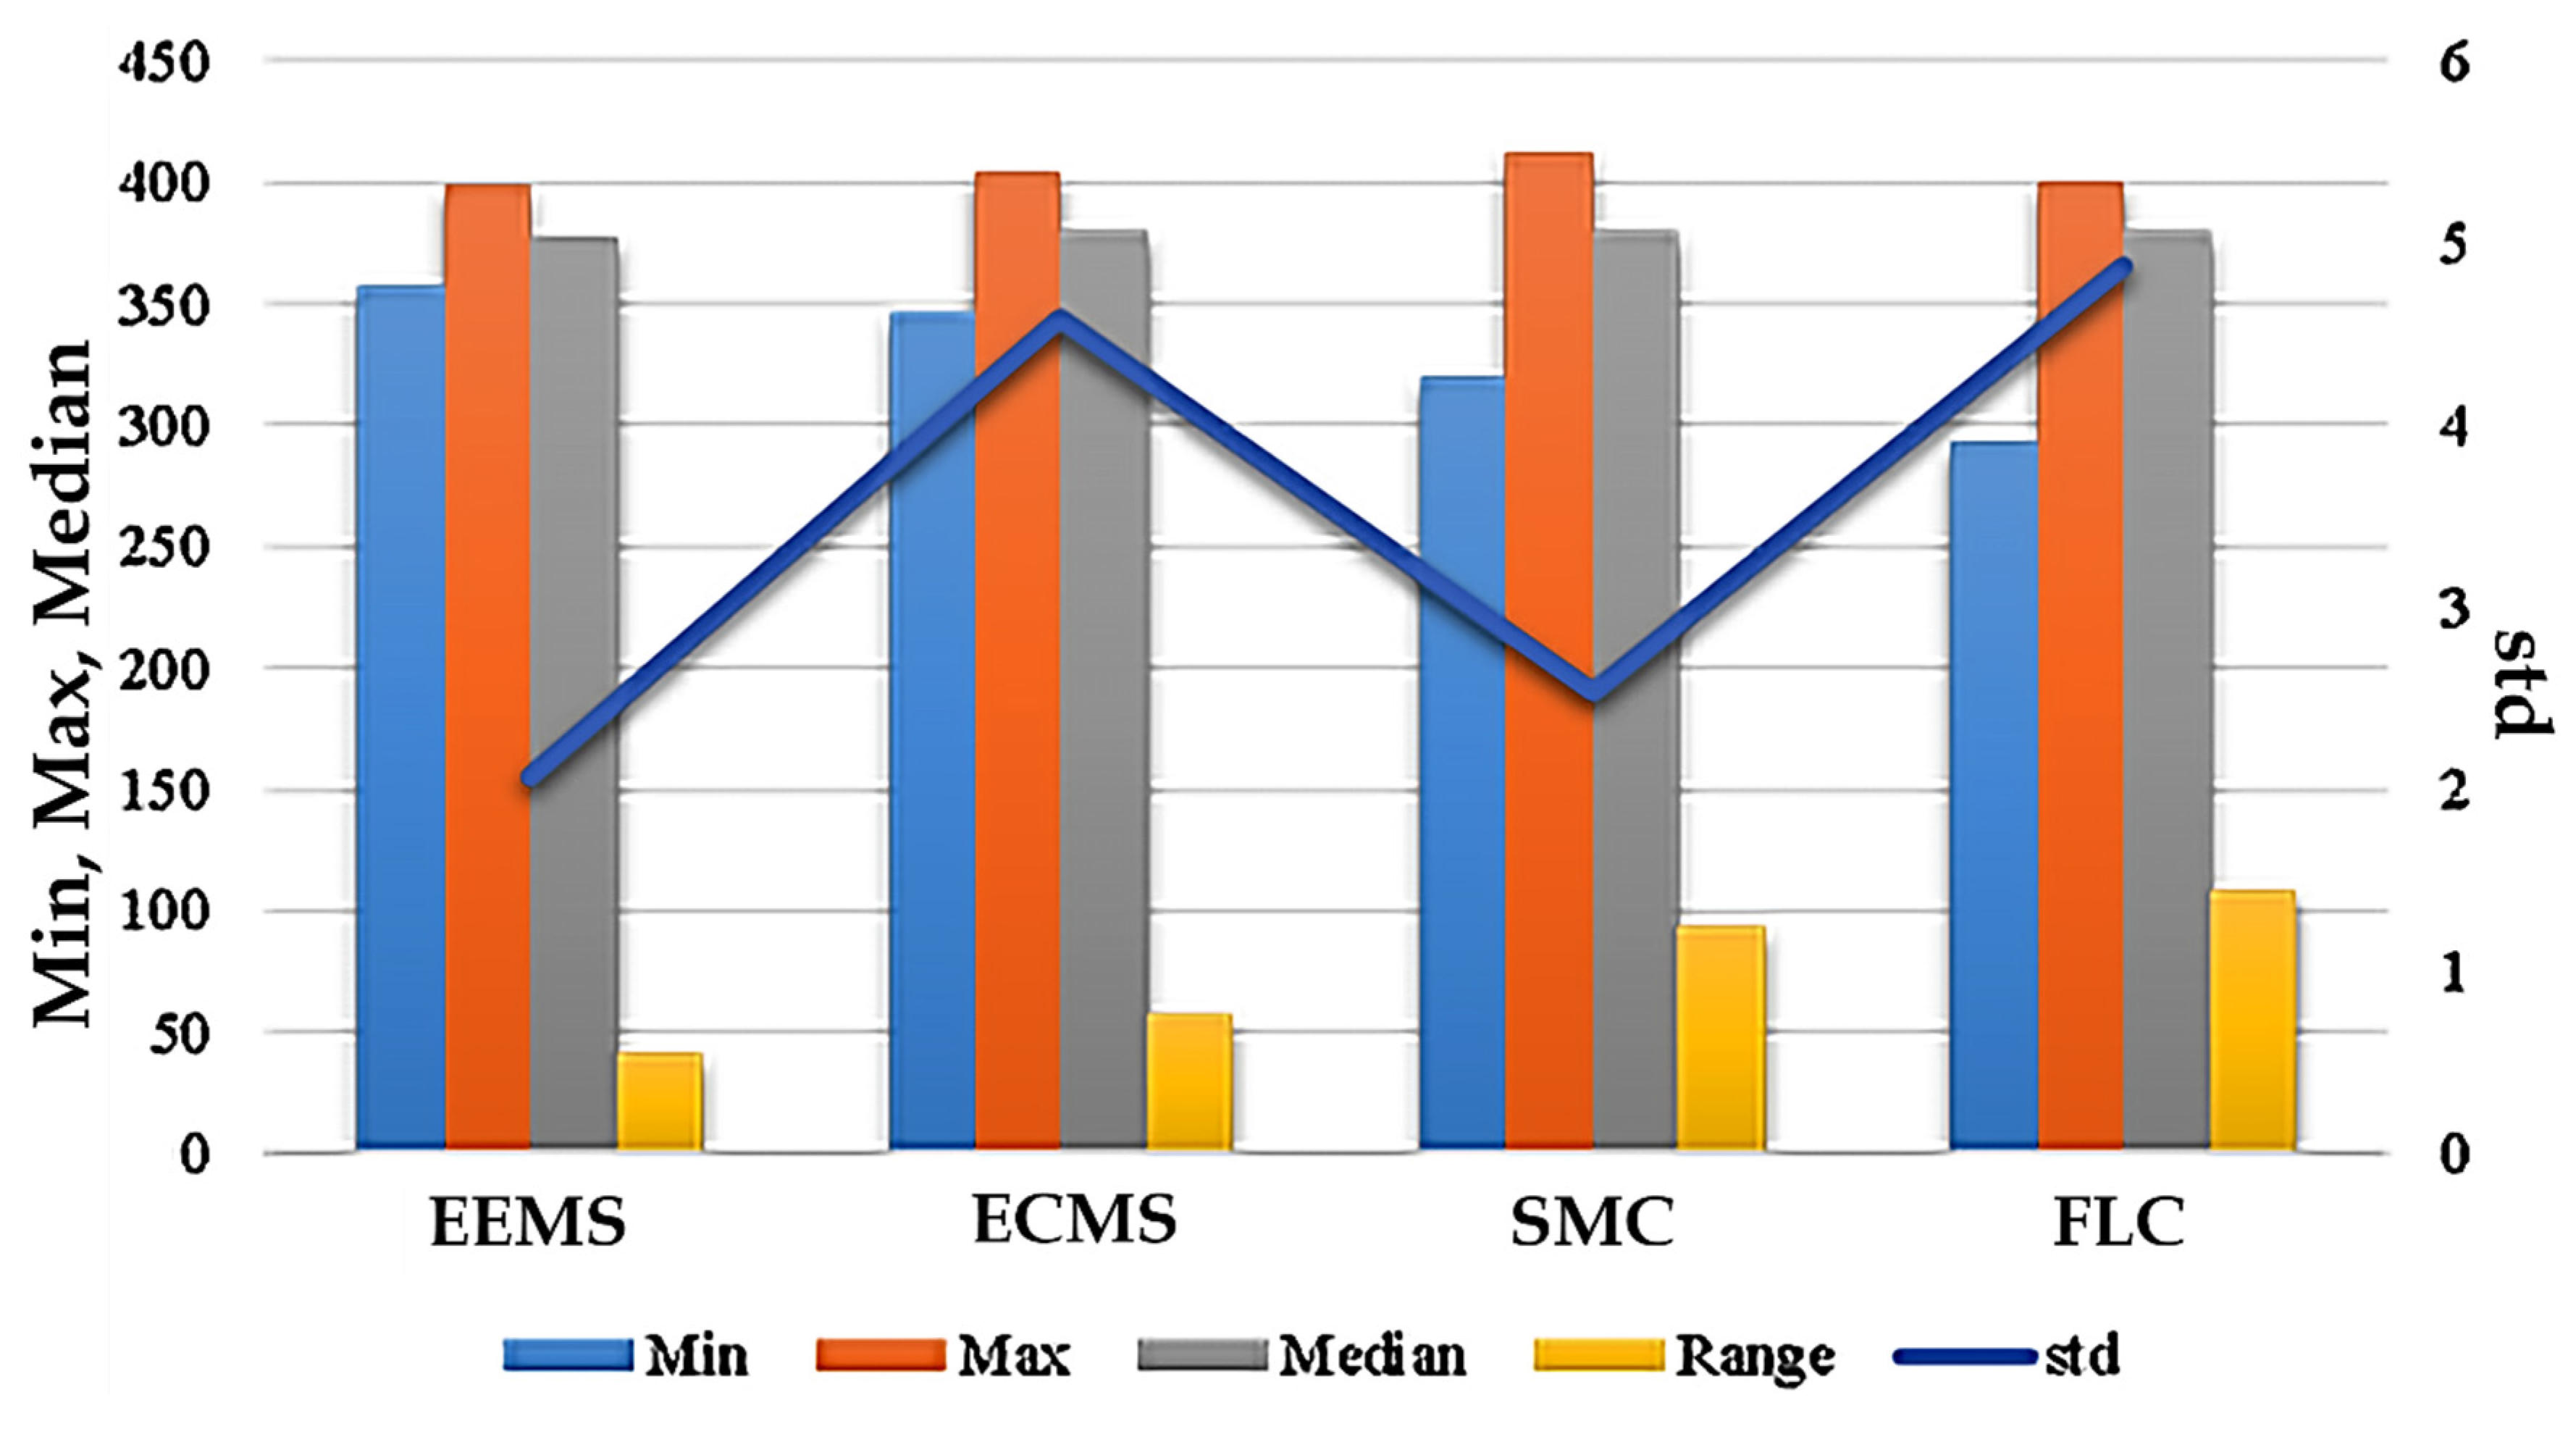
| Min | Max | Mean | Median | Range | StD | |
|---|---|---|---|---|---|---|
| EEMS | 357 | 398.9 | 378 | 378.2 | 41.95 | 2.07 |
| ECMS | 346.9 | 405 | 380 | 380.3 | 58.12 | 4.59 |
| SMC | 320 | 413 | 380 | 380.2 | 93.16 | 2.54 |
| Fuzzy | 293.3 | 401 | 380 | 380.3 | 108.1 | 4.88 |
Publisher’s Note: MDPI stays neutral with regard to jurisdictional claims in published maps and institutional affiliations. |
© 2022 by the authors. Licensee MDPI, Basel, Switzerland. This article is an open access article distributed under the terms and conditions of the Creative Commons Attribution (CC BY) license (https://creativecommons.org/licenses/by/4.0/).
Share and Cite
Rezk, H.; Ghoniem, R.M.; Ferahtia, S.; Fathy, A.; Ghoniem, M.M.; Alkanhel, R. A Comparison of Different Renewable-Based DC Microgrid Energy Management Strategies for Commercial Buildings Applications. Sustainability 2022, 14, 16656. https://doi.org/10.3390/su142416656
Rezk H, Ghoniem RM, Ferahtia S, Fathy A, Ghoniem MM, Alkanhel R. A Comparison of Different Renewable-Based DC Microgrid Energy Management Strategies for Commercial Buildings Applications. Sustainability. 2022; 14(24):16656. https://doi.org/10.3390/su142416656
Chicago/Turabian StyleRezk, Hegazy, Rania M. Ghoniem, Seydali Ferahtia, Ahmed Fathy, Mohamed M. Ghoniem, and Reem Alkanhel. 2022. "A Comparison of Different Renewable-Based DC Microgrid Energy Management Strategies for Commercial Buildings Applications" Sustainability 14, no. 24: 16656. https://doi.org/10.3390/su142416656