
Location Selection for Regional Logistics Center Based on Particle Swarm Optimization

1
School of Business, Ningbo Tech University, Ningbo 315104, China
2
School of Business, Quanzhou Normal University, Quanzhou 362046, China
3
School of Logistics Management & Engineering, Nanning Normal University, Nanning 530011, China
4
School of Economics & Management, Quanzhou University of Information Engineering, Quanzhou 362046, China
*
Author to whom correspondence should be addressed.
Sustainability 2022, 14(24), 16409; https://doi.org/10.3390/su142416409
Submission received: 3 November 2022
/
Revised: 6 December 2022
/
Accepted: 6 December 2022
/
Published: 8 December 2022
(This article belongs to the Special Issue Multiple Criteria Decision-Making Techniques in Sustainable Supply Chains and Logistics Management)
Abstract
:The location of a logistics center is very important in a logistics system, as the success of the location determines the whole logistics system’s structure, shape, and mode, and not only affects the logistics center’s own operating costs, performance, and future development, but also affects the operation of the entire logistics system. Therefore, the selection of the location for a logistics center has great significance for improving the efficiency of regional logistics and optimizing the structure of a logistics system. This study constructed a multi-factor constrained P-median site-selection model to optimize the locations of logistics centers to improve the efficiency of logistics and optimize the structure of the logistics system in a region. The results show that the optimal distribution of logistics center sites and the coverage of freight capacity demand derived from the particle swarm algorithm are more balanced than those derived by the other algorithm. Following the comparison of the results for the utility of the optimized layout points solved by the particle swarm algorithm and the immune genetic algorithm, it is concluded that the optimal fitness value obtained by the particle swarm algorithm is lower than the other. It is proven that the particle swarm algorithm of the P-median site-selection model under this multi-factor constraint has some reference value for the selection of the sites of multi-logistics centers.
1. Introduction
The location of a logistics center, the key node of a logistics system, determines the structural layout of the entire logistics system, which affects the efficiency and cost of logistics. Researchers around the world conducted studies on the location of logistics service facilities and put forward a series of optimization models and algorithms with theoretical and applied value. Ouyang [1] presents a novel method for finding representative regional center points, referred to as “concave interior centers”, to approximate inter-regional distances for solving optimal facility location problems. Pakravan [2] presents a stochastic programming model to deal with the opposition typically encountered in constructing an undesirable facility. Fernández [3] highlights a non-linear, constrained, discrete, competitive facility location problem with minimal market share constraints, which is solved using heuristic algorithms. Other optimization models include a hierarchical model for selecting the location of an emergency shelter [4], selecting the location of an energy power plant based on a multi-criteria decision [5], and a location selection problem for a military airport [6].
There is also much research addressing algorithms. Heine [7] presents an approximation algorithm with proven worst-case guarantees—in terms of both the running time and solution quality—to research location routing, in which strategic location decisions are based on the placement of facilities (depots, distribution centers, warehouses, etc.). Li [8] proposes a differential CS extension with balanced learning—the Cuckoo search algorithm with balanced learning (O-BLM-CS)—for determining the best location of a logistics distribution center. Zhang [9] used a genetic-algorithm-based multi-objective optimization (MOO) approach to optimize the locations of new healthcare facilities in Hong Kong. Additionally, a distributionally robust optimization (DRO) method was developed for locating emergency rescue stations in a high-speed railway network [10]. Other examples include an artificial fish swarm algorithm for selecting the center location strategy [11], a cuckoo search–differential evolution (CSDE) approach to solving the problem of the location of a logistics distribution center [12], an improved and optimized ant colony algorithm for selecting the location of a logistics center [13], and a supervised-learning-driven (SLD) heuristic to determine the best capacitated facility location [14]. In conclusion, we find that most studies focus on single-facility-location problems, particularly Weber’s classic single facility location problem [15]; for example, the authors of [16] studied a robust fixed-charge location problem under uncertain demand and facility disruptions. The authors of [17] developed a location-allocation model for healthcare facilities that incorporates a choice model to represent care consumers’ preferences and choice decisions on the care facilities. A partial study of the capacity-constrained facility location problem from a mechanism design perspective was published [18,19]. There are also some studies relating to modeling and solving a bi-objective stochastic facility location problem [20]. Additionally, Liu et al. [21] provide a combined framework for the locations of emergency facilities in transportation networks. They all have multiple objectives and requirements. Ge et al. [22] examine the facility location problem for the U.S. fresh produce supply chain, and build a model that incorporates an empirical scenario into a facility location problem. The results suggest that the reliability of facility locations can be improved without significantly increasing the operating costs. Blanco et al. [23] introduce a general modeling framework for a multi-type maximal covering location problem. They propose a natural non-linear model and derive an integer linear programming reformulation. Wang et al. [24] built a bi-objective function model to consider minimizing the total cost and the carbon emission for the location optimization of fresh agricultural cold chain logistics. Some scholars focus on a medium-term distribution plan for a pharmaceutical network, considering distribution center (DC) location and transportation decisions. They propose a multi-product, multi-period, and multi-modal mathematical model integrating network design and distribution planning decisions [25].
In summary, more and more location selection research uses meta heuristic algorithms. Combined with the uncertainty and complexity of the real world, the location problem usually considers that some or all of the input parameters, such as the service station’s operating time, construction cost, demand point location, and demand quantity, are uncertain. PSO is a type of probabilistic global optimization algorithm, namely, an uncertain algorithm. Its advantage is that the algorithm can have more opportunities to solve the global optimal solution.
Therefore, in this study, a P-median model with multi-factor constraints was constructed to optimize the overall efficiency of the regional logistics network and maximize customer satisfaction based on the regional logistics center location problem, compared with the results calculated by particle swarm optimization (PSO) and the immune genetic algorithm (IGA). The structure comprises four parts; the first part is the introduction, the second presents analysis of the problem and model construction, the third presents arithmetic examples and the results of the analysis, and the fourth presents the research conclusions.
2. Problem Modeling
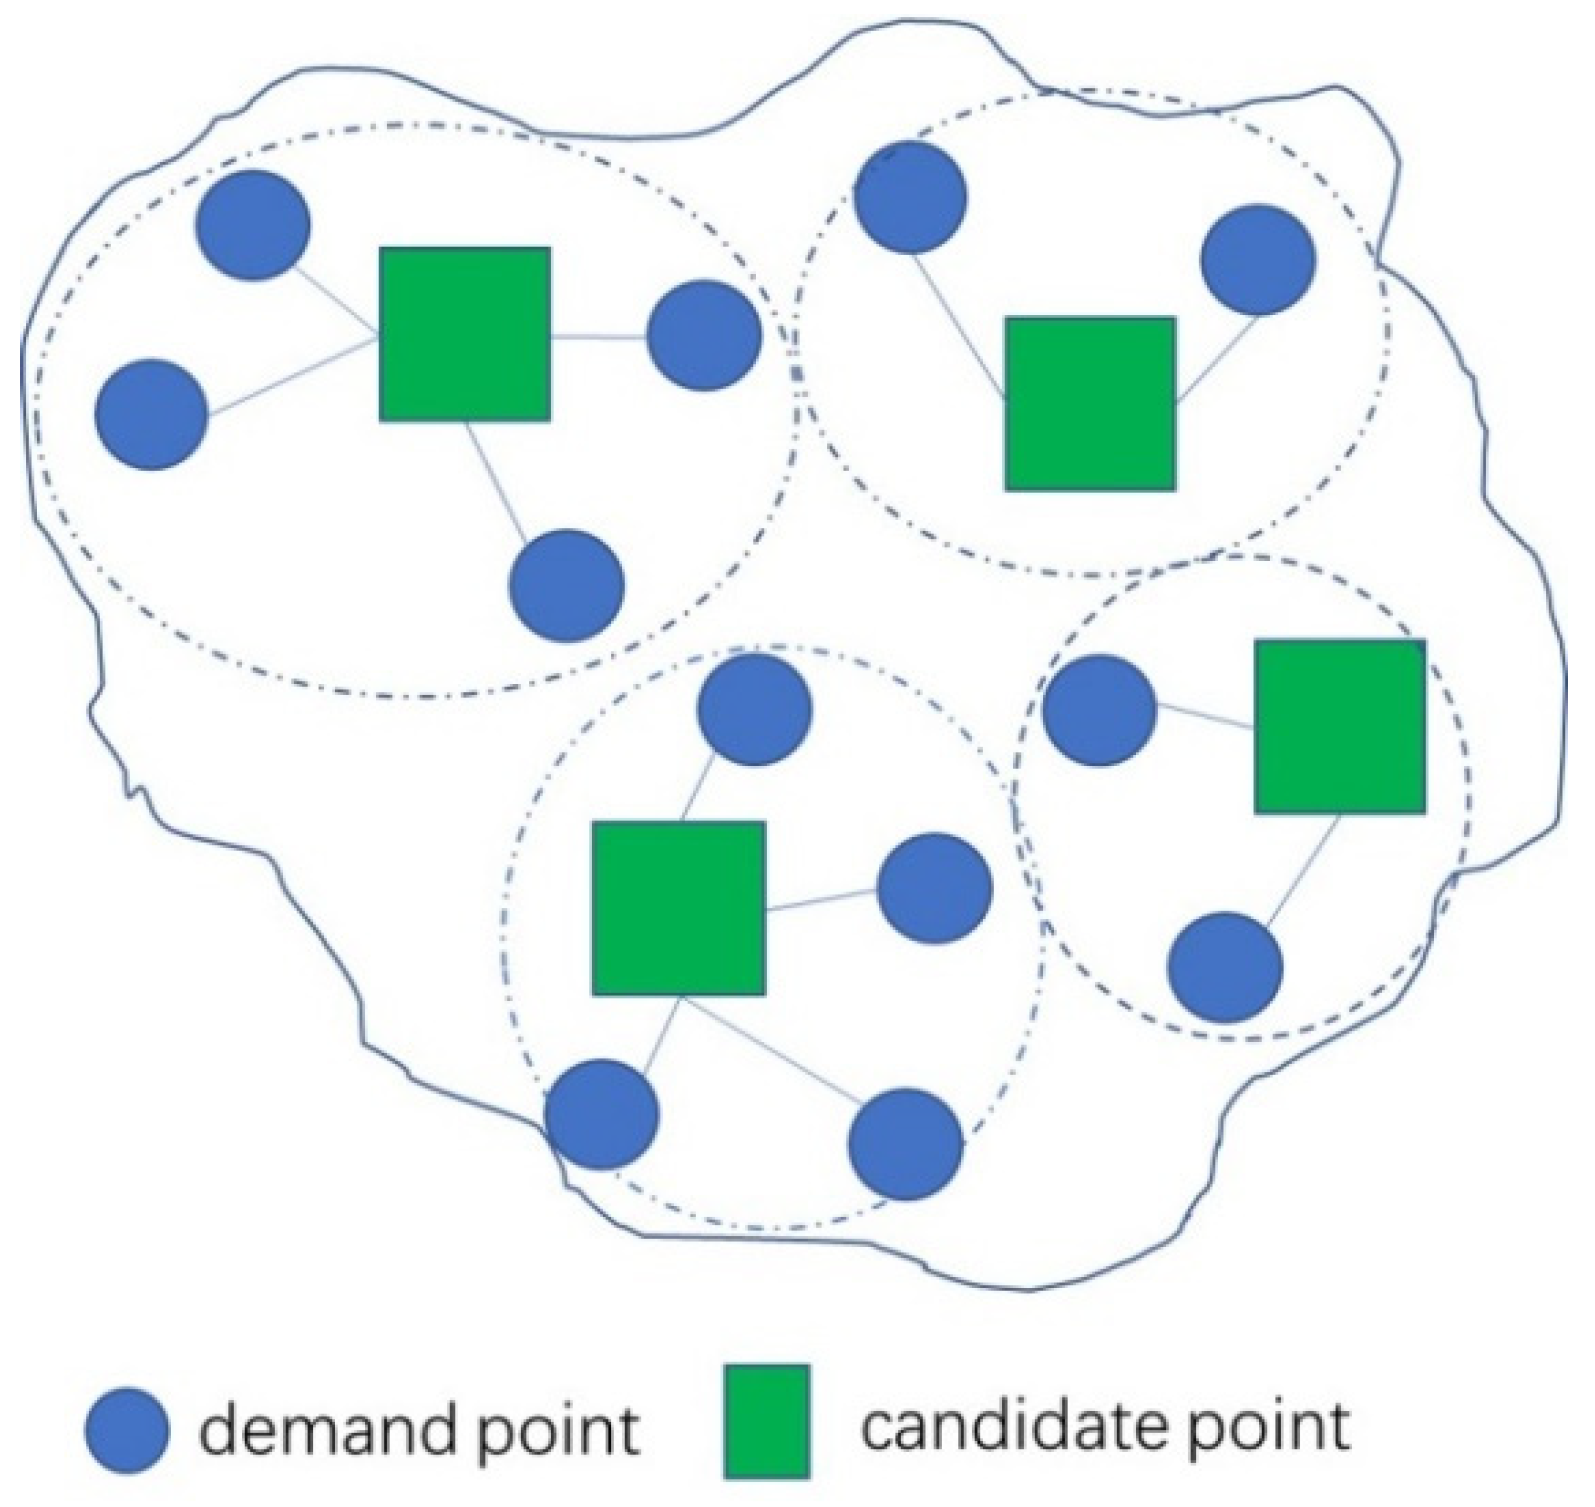
A P-median location model is a set of locations of candidate logistics centers that are selected to correlate to each subset of a set of locations of a given number of demand points. That is, it matches each demand point to its nearest logistics center point separately to ensure the lowest overall global transportation cost. As shown in Figure 1, we find the least square points from the known alternative points so that all the demand points have the minimum–maximum distance from the adjacent facility points, which is a type of minimax problem. The objective of this problem is to maximize the number of demand points covered or the total amount of demand.
It is necessary to consider certain factors, such as the shipment volume, delivery distance, and warehousing cost, in the construction of the logistics center location model, in order to ensure the model’s feasibility. Additionally, the cost of the logistics center mainly depends on the user’s freight throughput, transportation-out costs, and infrastructure equipment costs. Therefore, the site-selection model in this paper mainly considers two factors, i.e., the distance and freight storage capacity, with the lowest comprehensive cost as the optimization goal for site selection. The following hypotheses are proposed:
(1) The vehicle is transported at a uniform speed;
(2) Cargo delivery can be accomplished in a single trip;
(3) The fixed and operating costs of all the logistics centers remain the same;
(4) The transportation rates for the same types of goods are the same.
Above all, the objective function is constructed.
Subject:
where:
- is the number of demand points;
- is the number of candidate locations for the logistics center;
- is the number of logistics centers planned to be built;
- is the annual demand of the jth demand point;
- x is the volume of goods transported from logistics center i to demand point j;
- is the rate of transportation from the ith logistics center to the jth demand point;
- is the annual fixed cost of the logistics center at the ith candidate location;
- is the unit storage cost rate at the ith logistics center;
- is the volume of goods storage;
- .
3. Case Analysis
In this work, the research objects—the number of selected logistics centers and demand points—were set to 7 and 40, respectively. The coordinates of 40 demand points in this region were obtained from the open platform of the API of AutoNavi Map, as shown in Table 1, which also includes the demand quantity and fixed cost of each demand point.
It is a widely held view that logistics center site selection is an NP-hard problem. Out of the heuristic algorithm and exact algorithm, the former is more prominent in solving the NP-hard problem on a large scale, and the particle swarm algorithm (PSO) is selected for solving the problem in this study. Considering that the PSO algorithm is prone to falling into the local optimum, we introduced a penalty function into the original objective function. That is, the constrained fitness function was converted into an unconstrained fitness function by the outlier penalty function method so that the optimal fitness value of the global optimal position distribution decreased rapidly and reduced the influence of the positive feedback of the next search of the particle swarm. Thus, the algorithm can jump out of the local optimum; the objective function was converted to the following function:
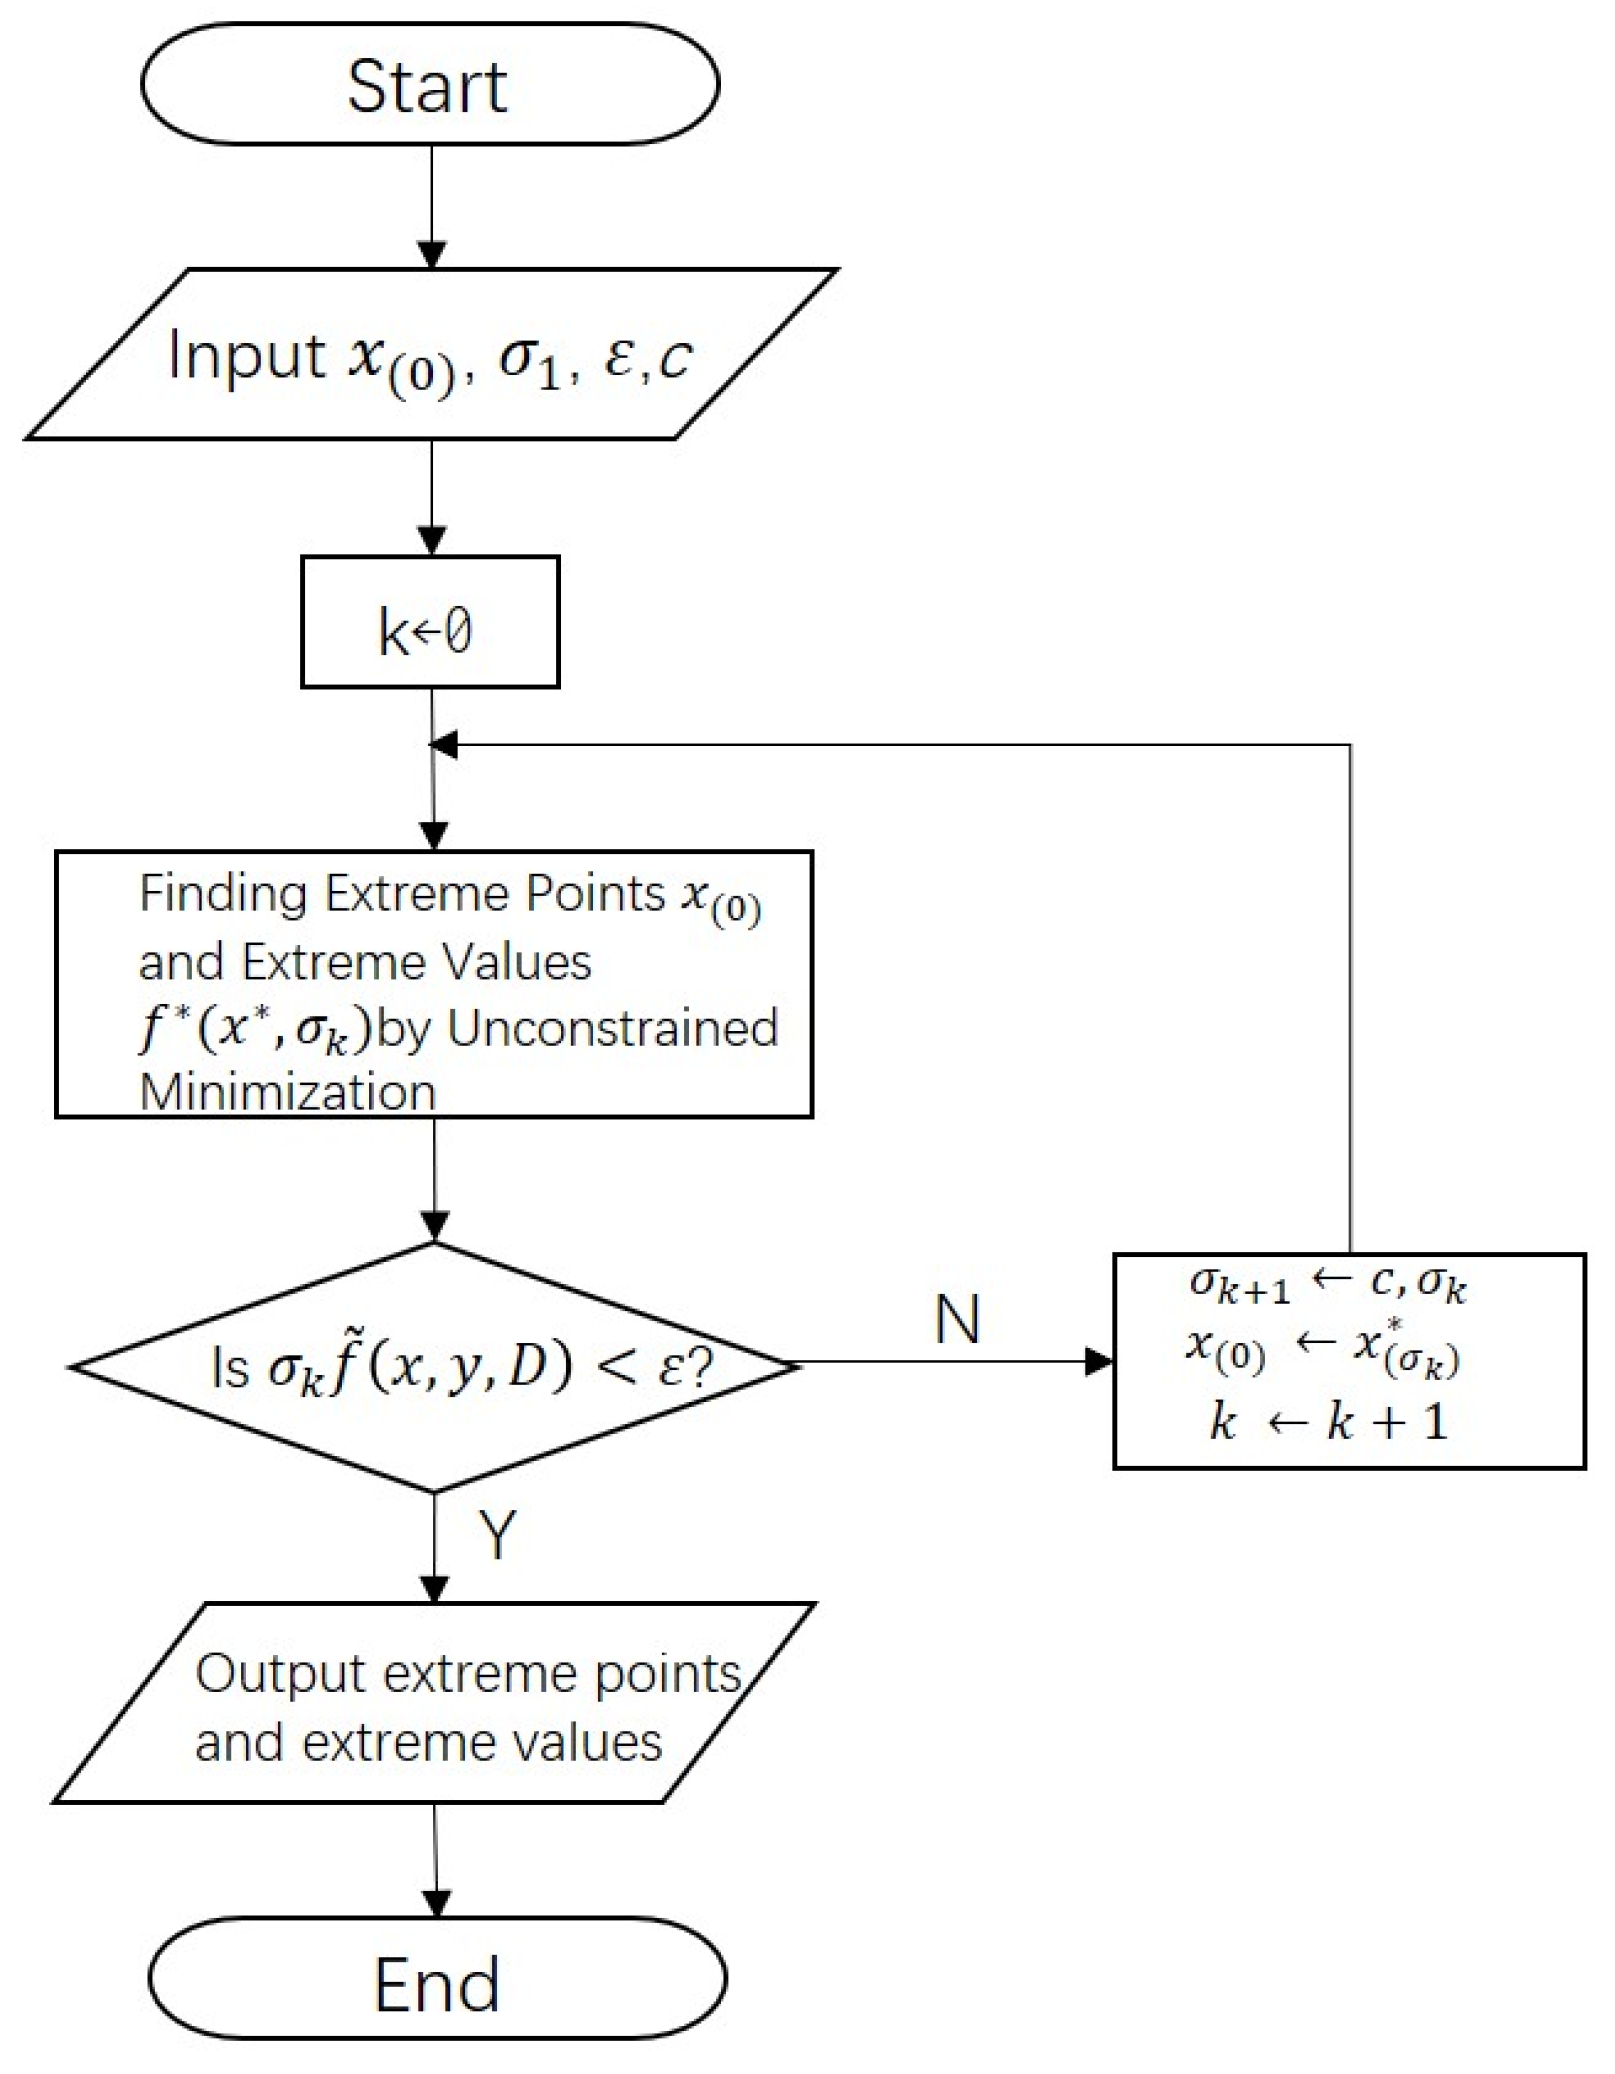
is the penalty factor of the external penalty function, which is generally taken as a fixed value. Figure 2 shows a flow chart of the outlier penalty function. The specific steps are as follows:
Step 1: Given the initial point X(0) and the initial penalty factor , the control error , and the amplification factor of the penalty factor c = 10;
Step 2: Find the unconstrained extremum problem of the objective function as the initial point;
Step 3: If < , take as the approximate optimal solution and stop. Otherwise, let , k = k + 1; turn to Step 2.
4. Result Analysis
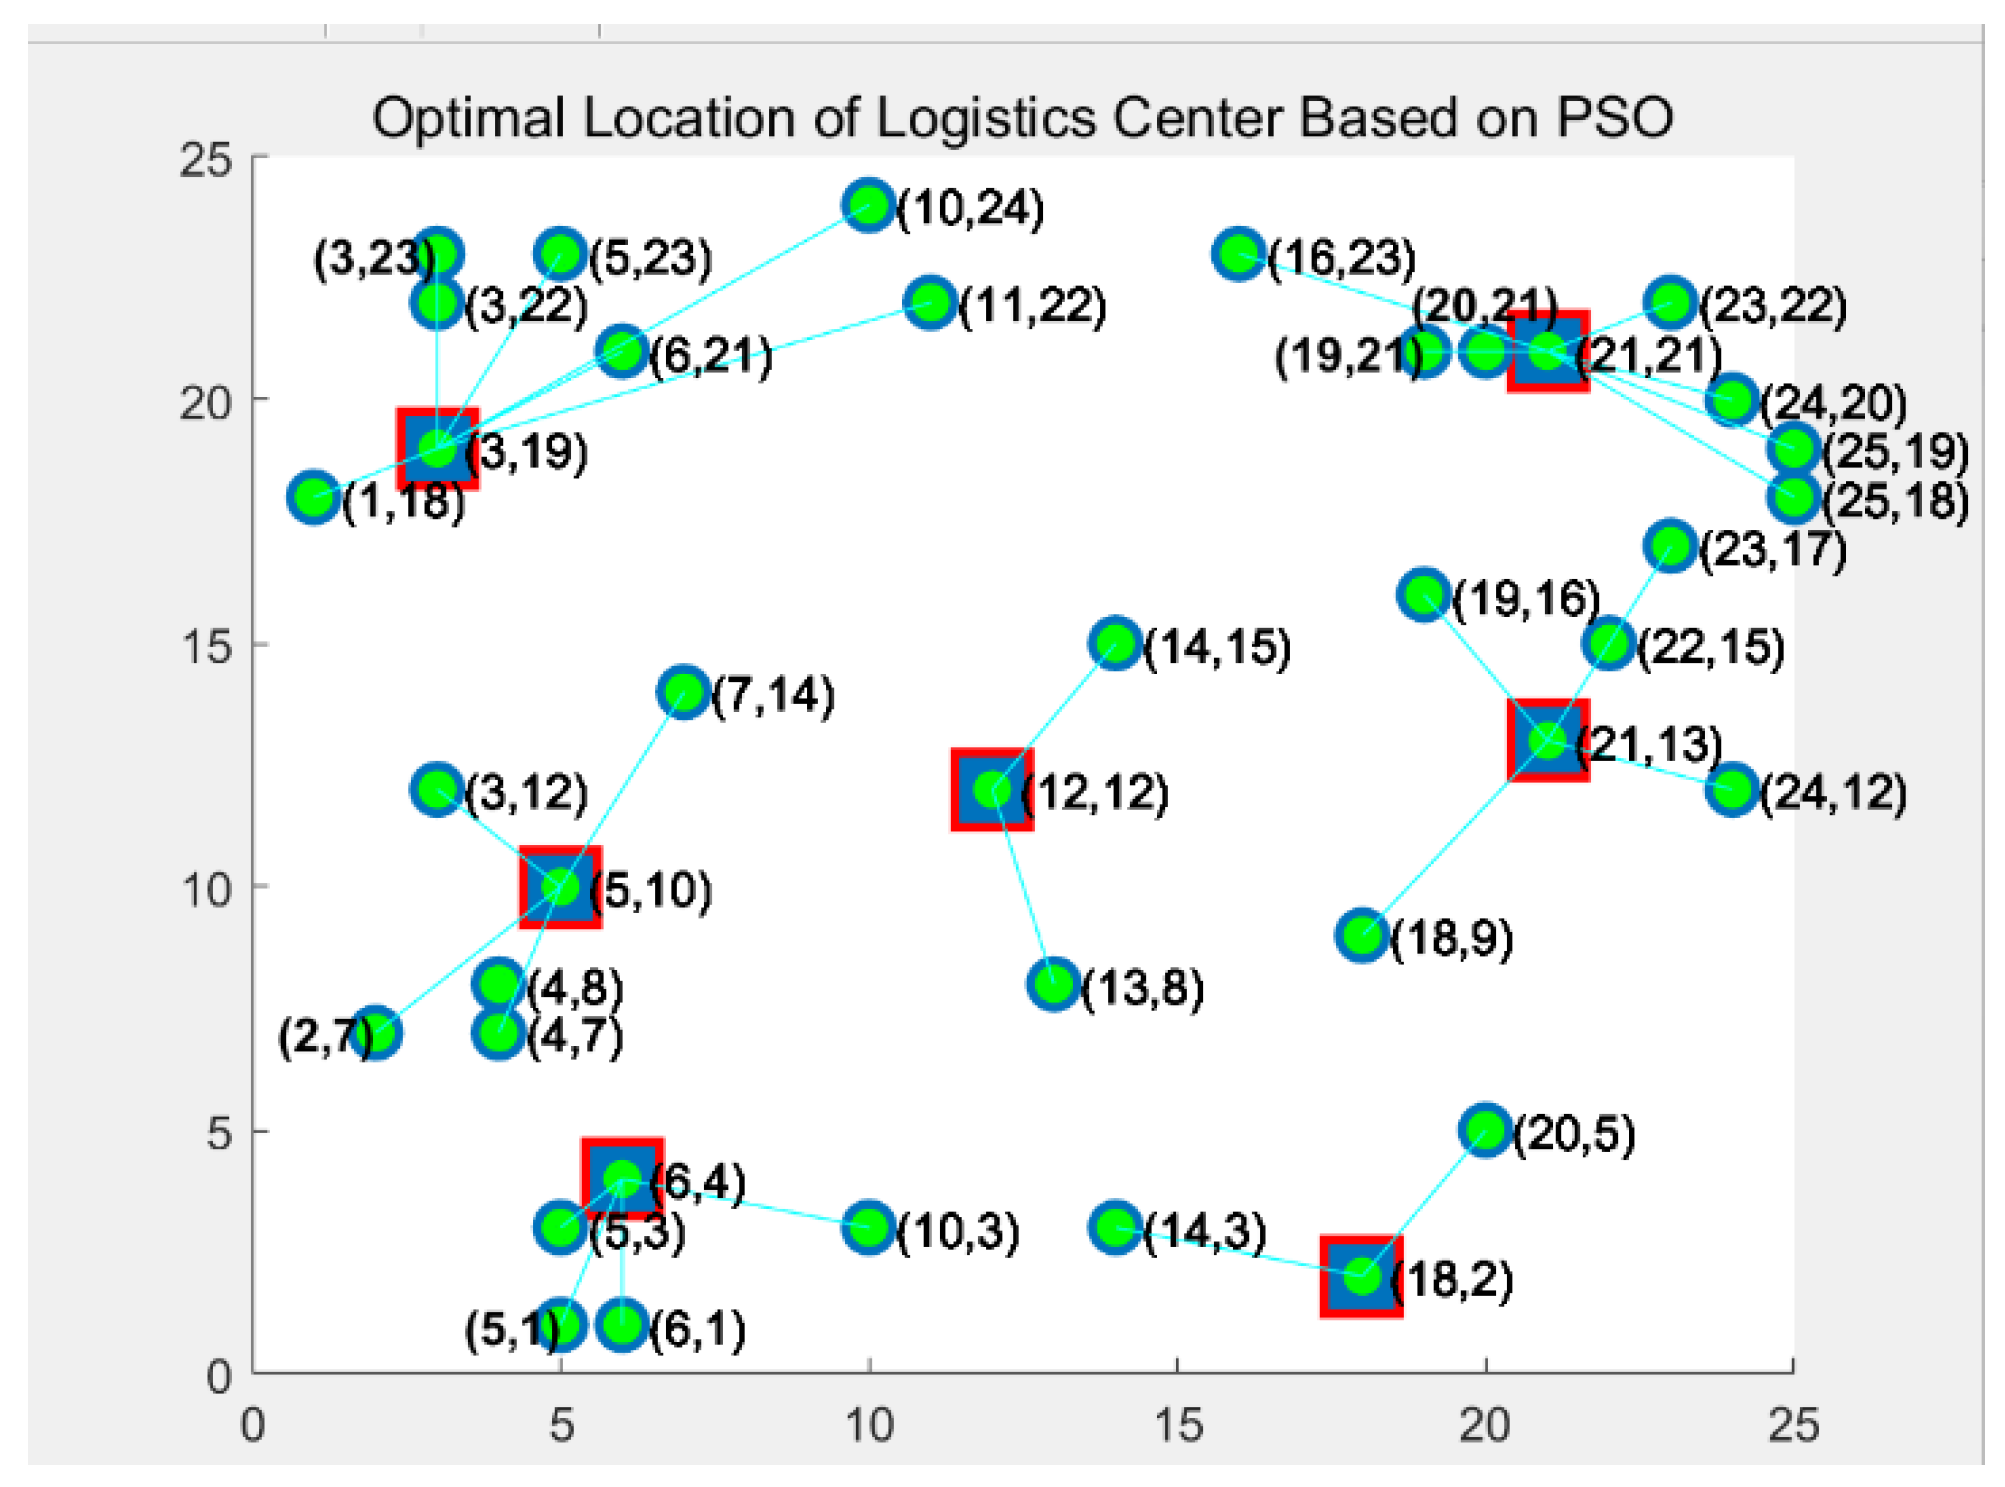
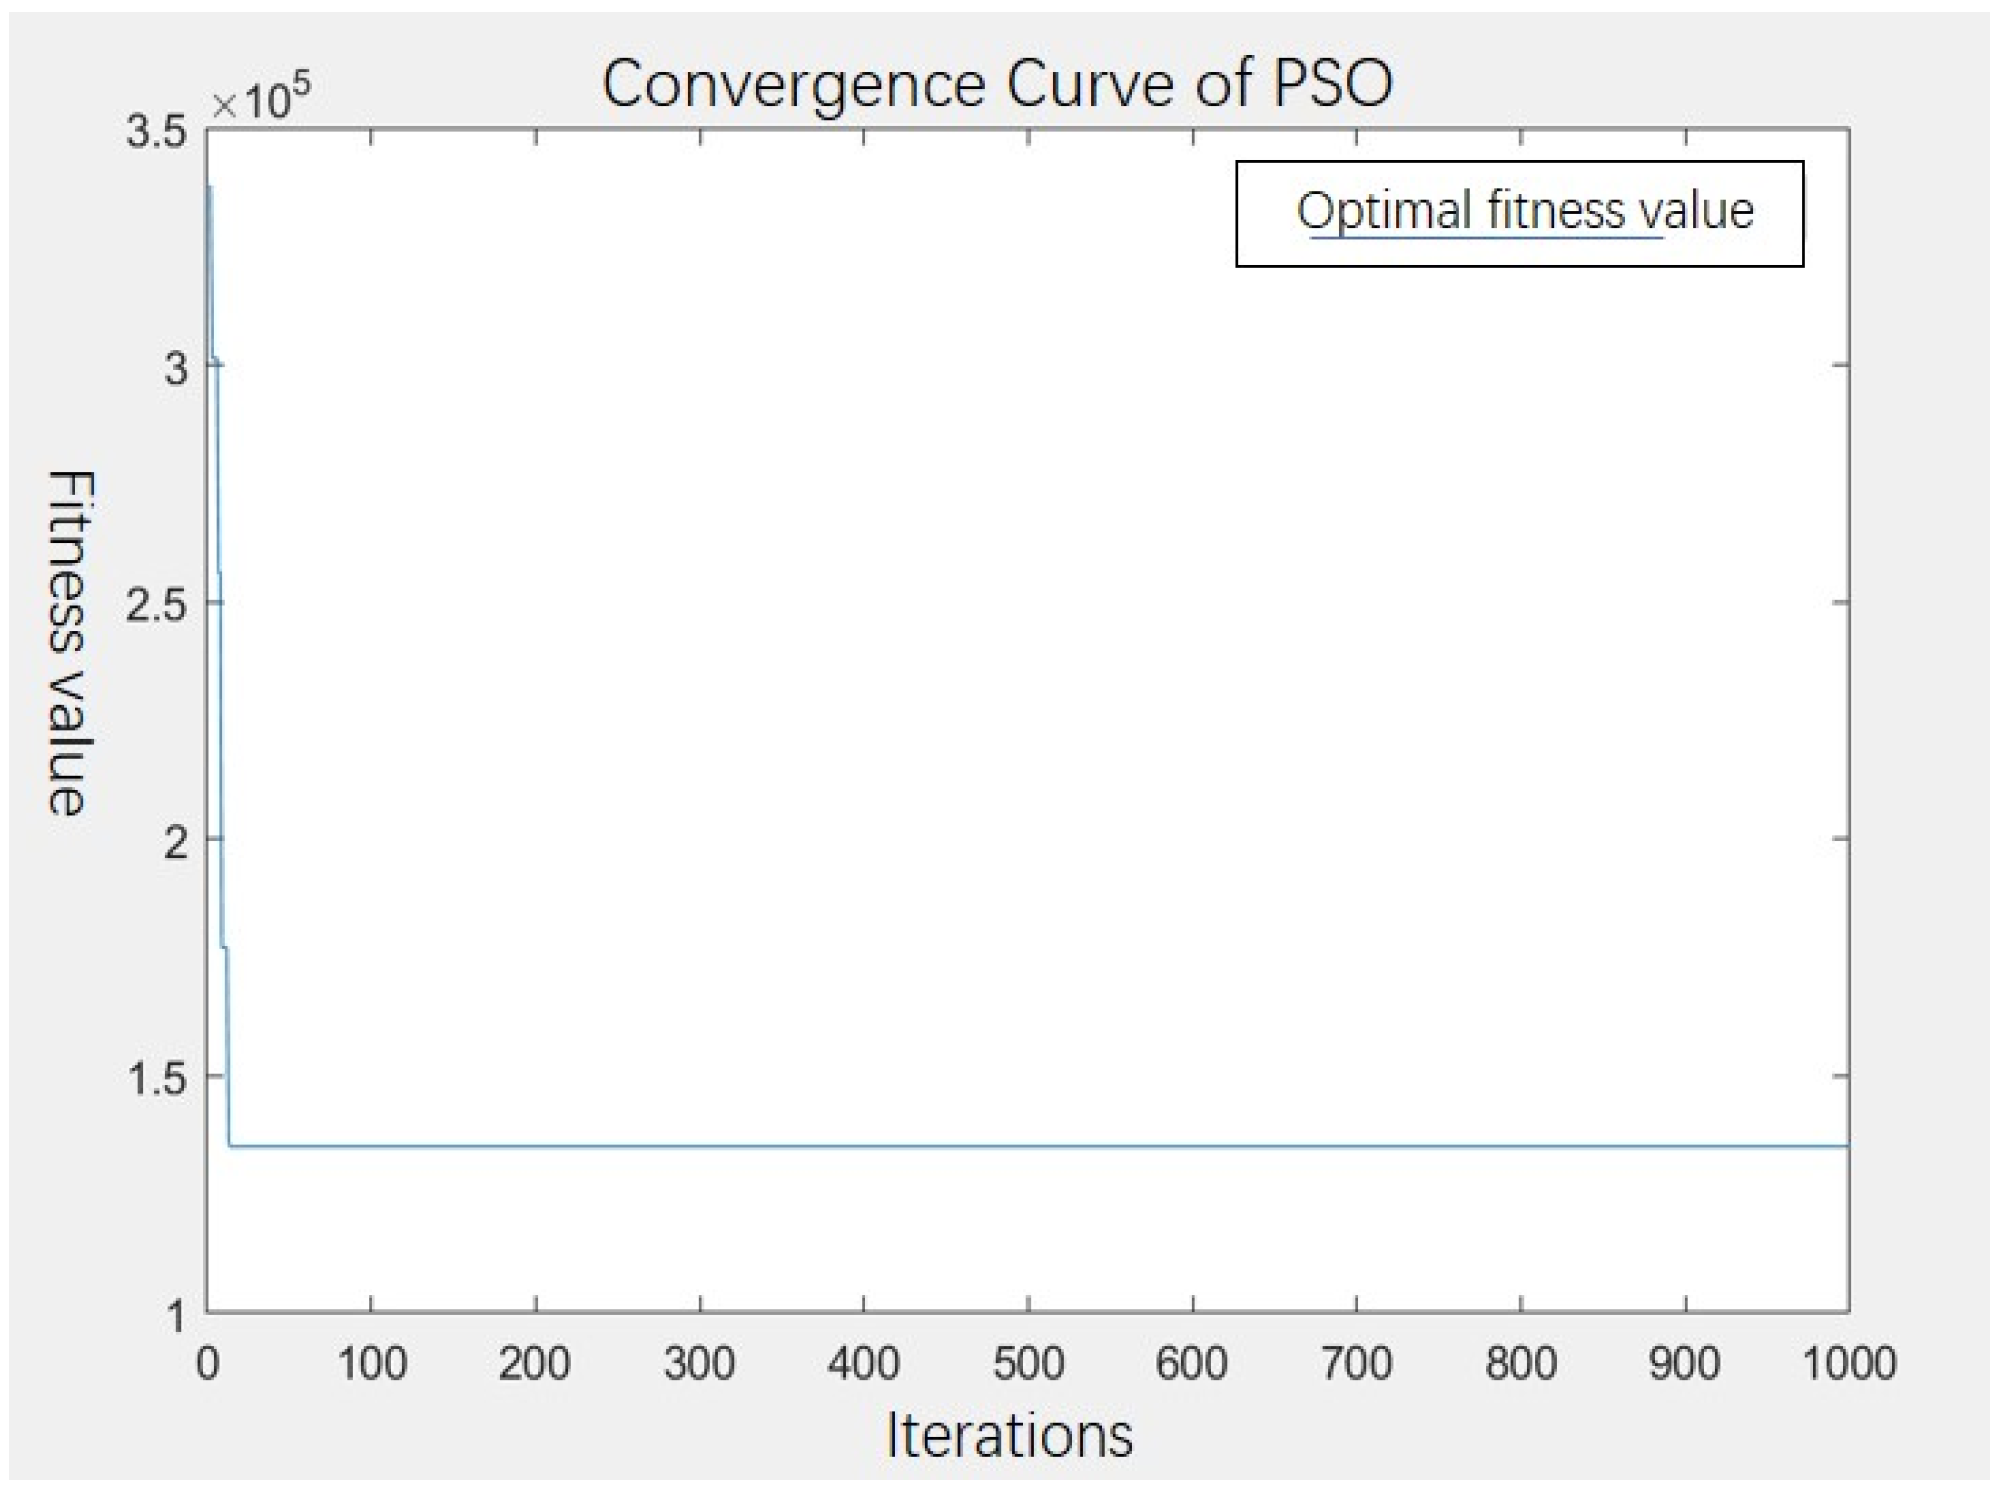
In this study, we solved this problem using MATLAB 2017b and set the size of the particle swarm to 100, the inertia weight to 0.729, the social part acceleration coefficient to 2, the cognitive part acceleration coefficient to 2, and the penalty coefficient to 10,000. The final fitness value of 135,102.3553 million was obtained by 1000 iterations in 81 s, and the optimum distribution positions were obtained as A32 (3, 19), A36 (12, 12), A34 (18, 2), A06 (5, 10), A16 (21, 13), A09 (6, 4), and A03 (21, 21). Figure 3 and Figure 4 represent the convergence of the specific optimal location distribution algorithm.
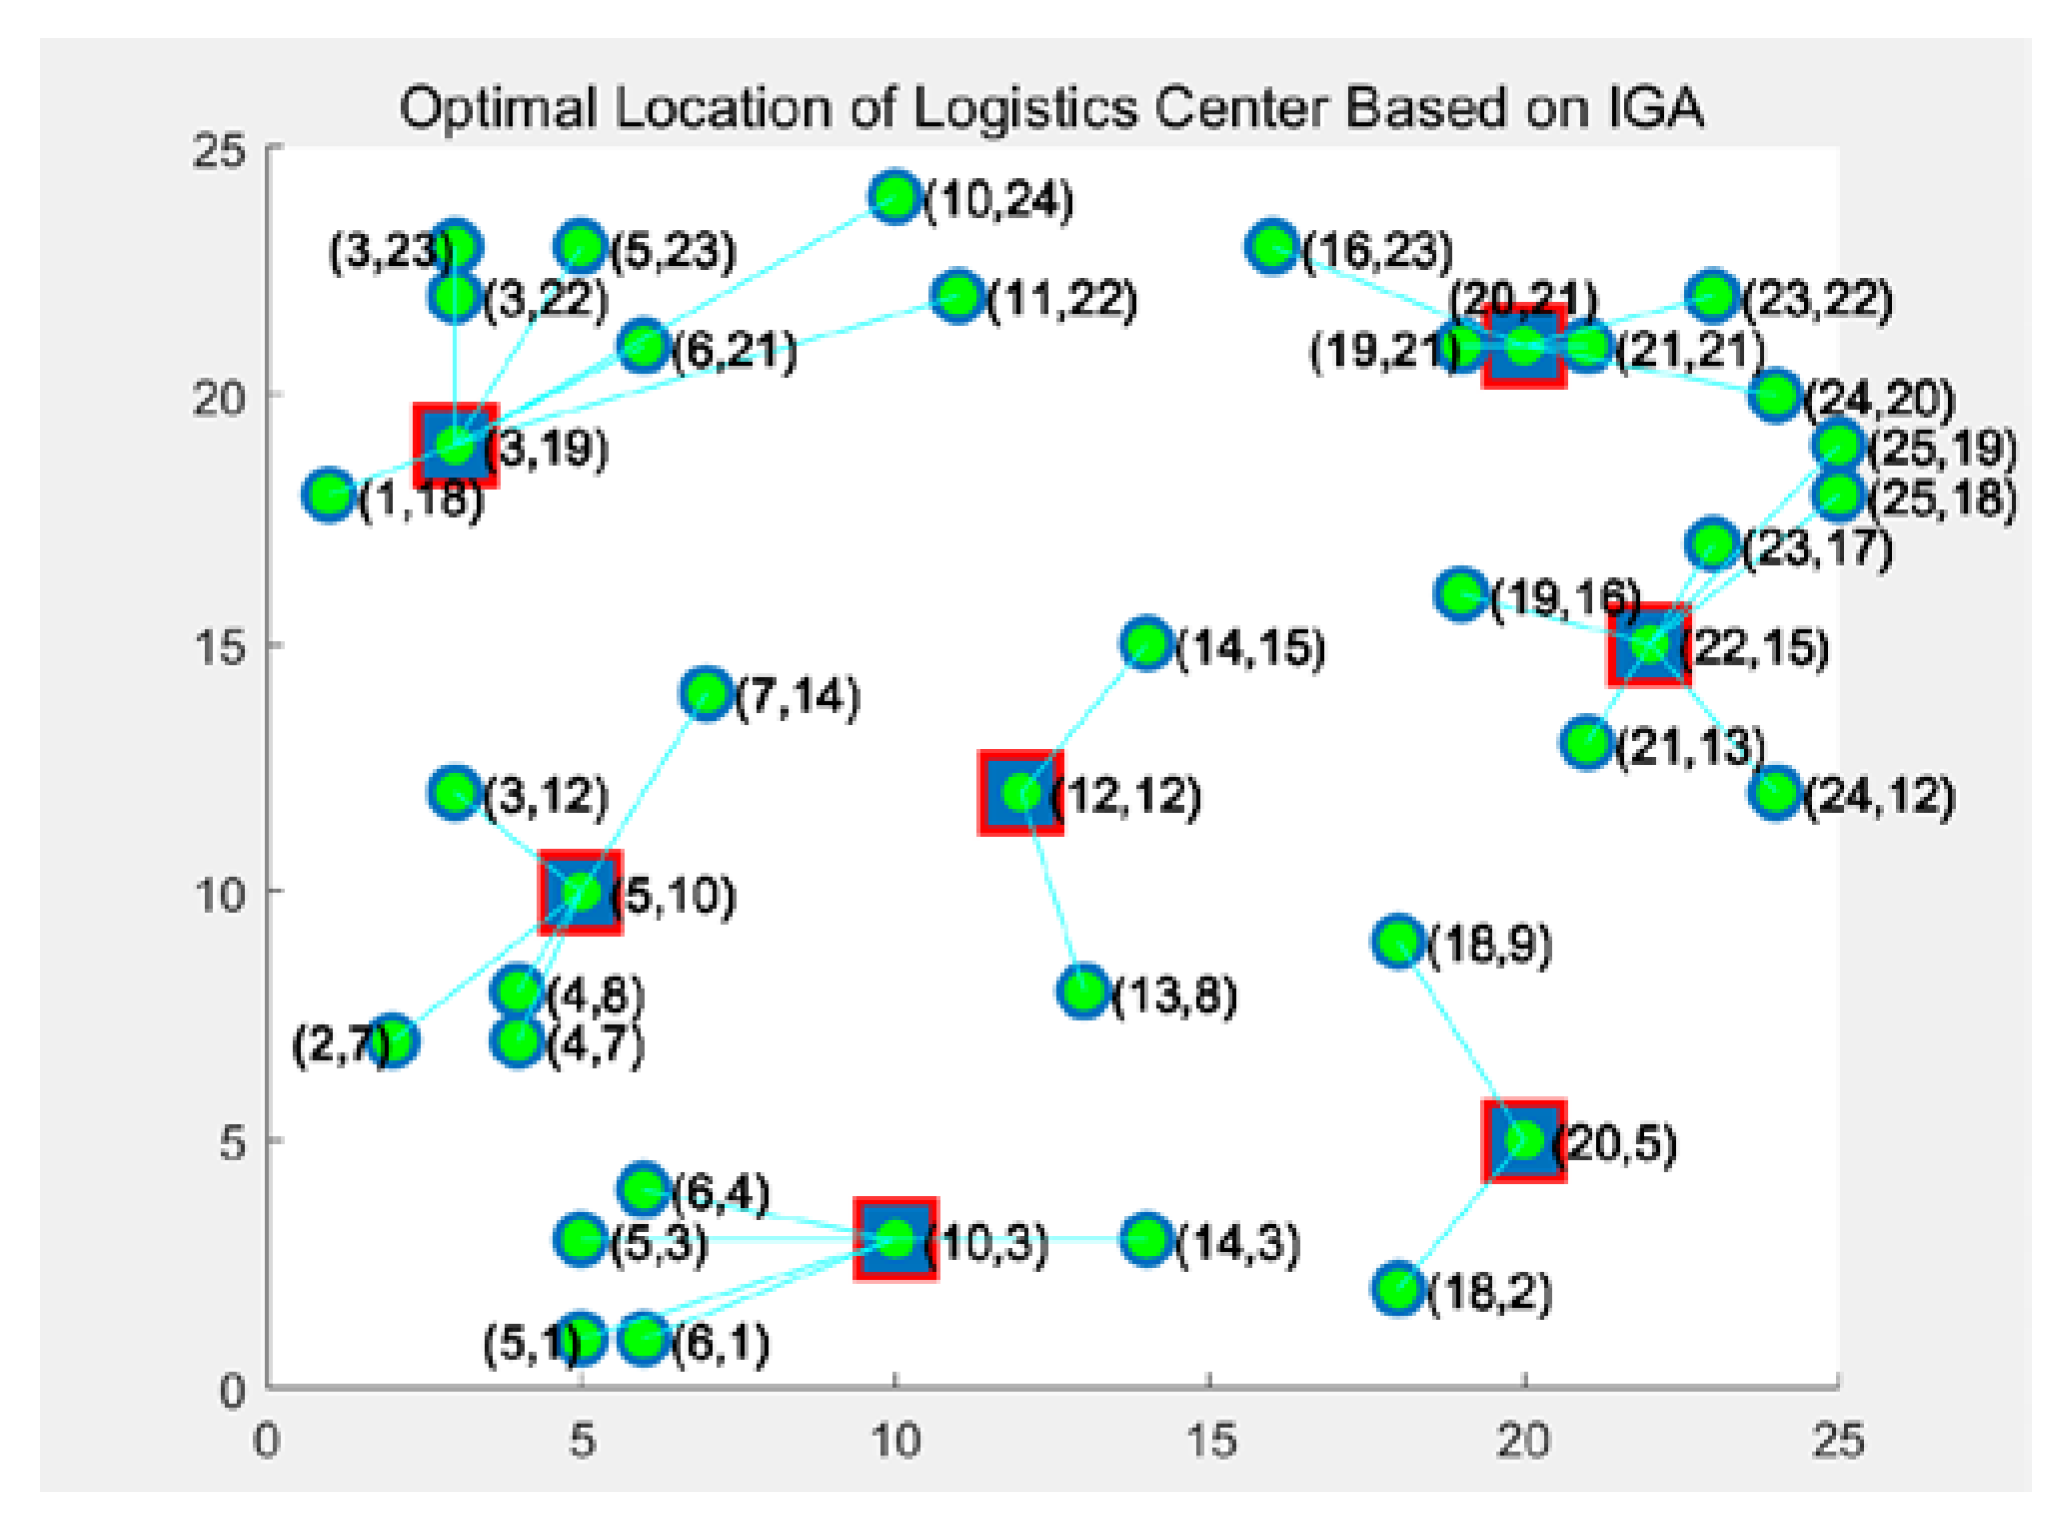
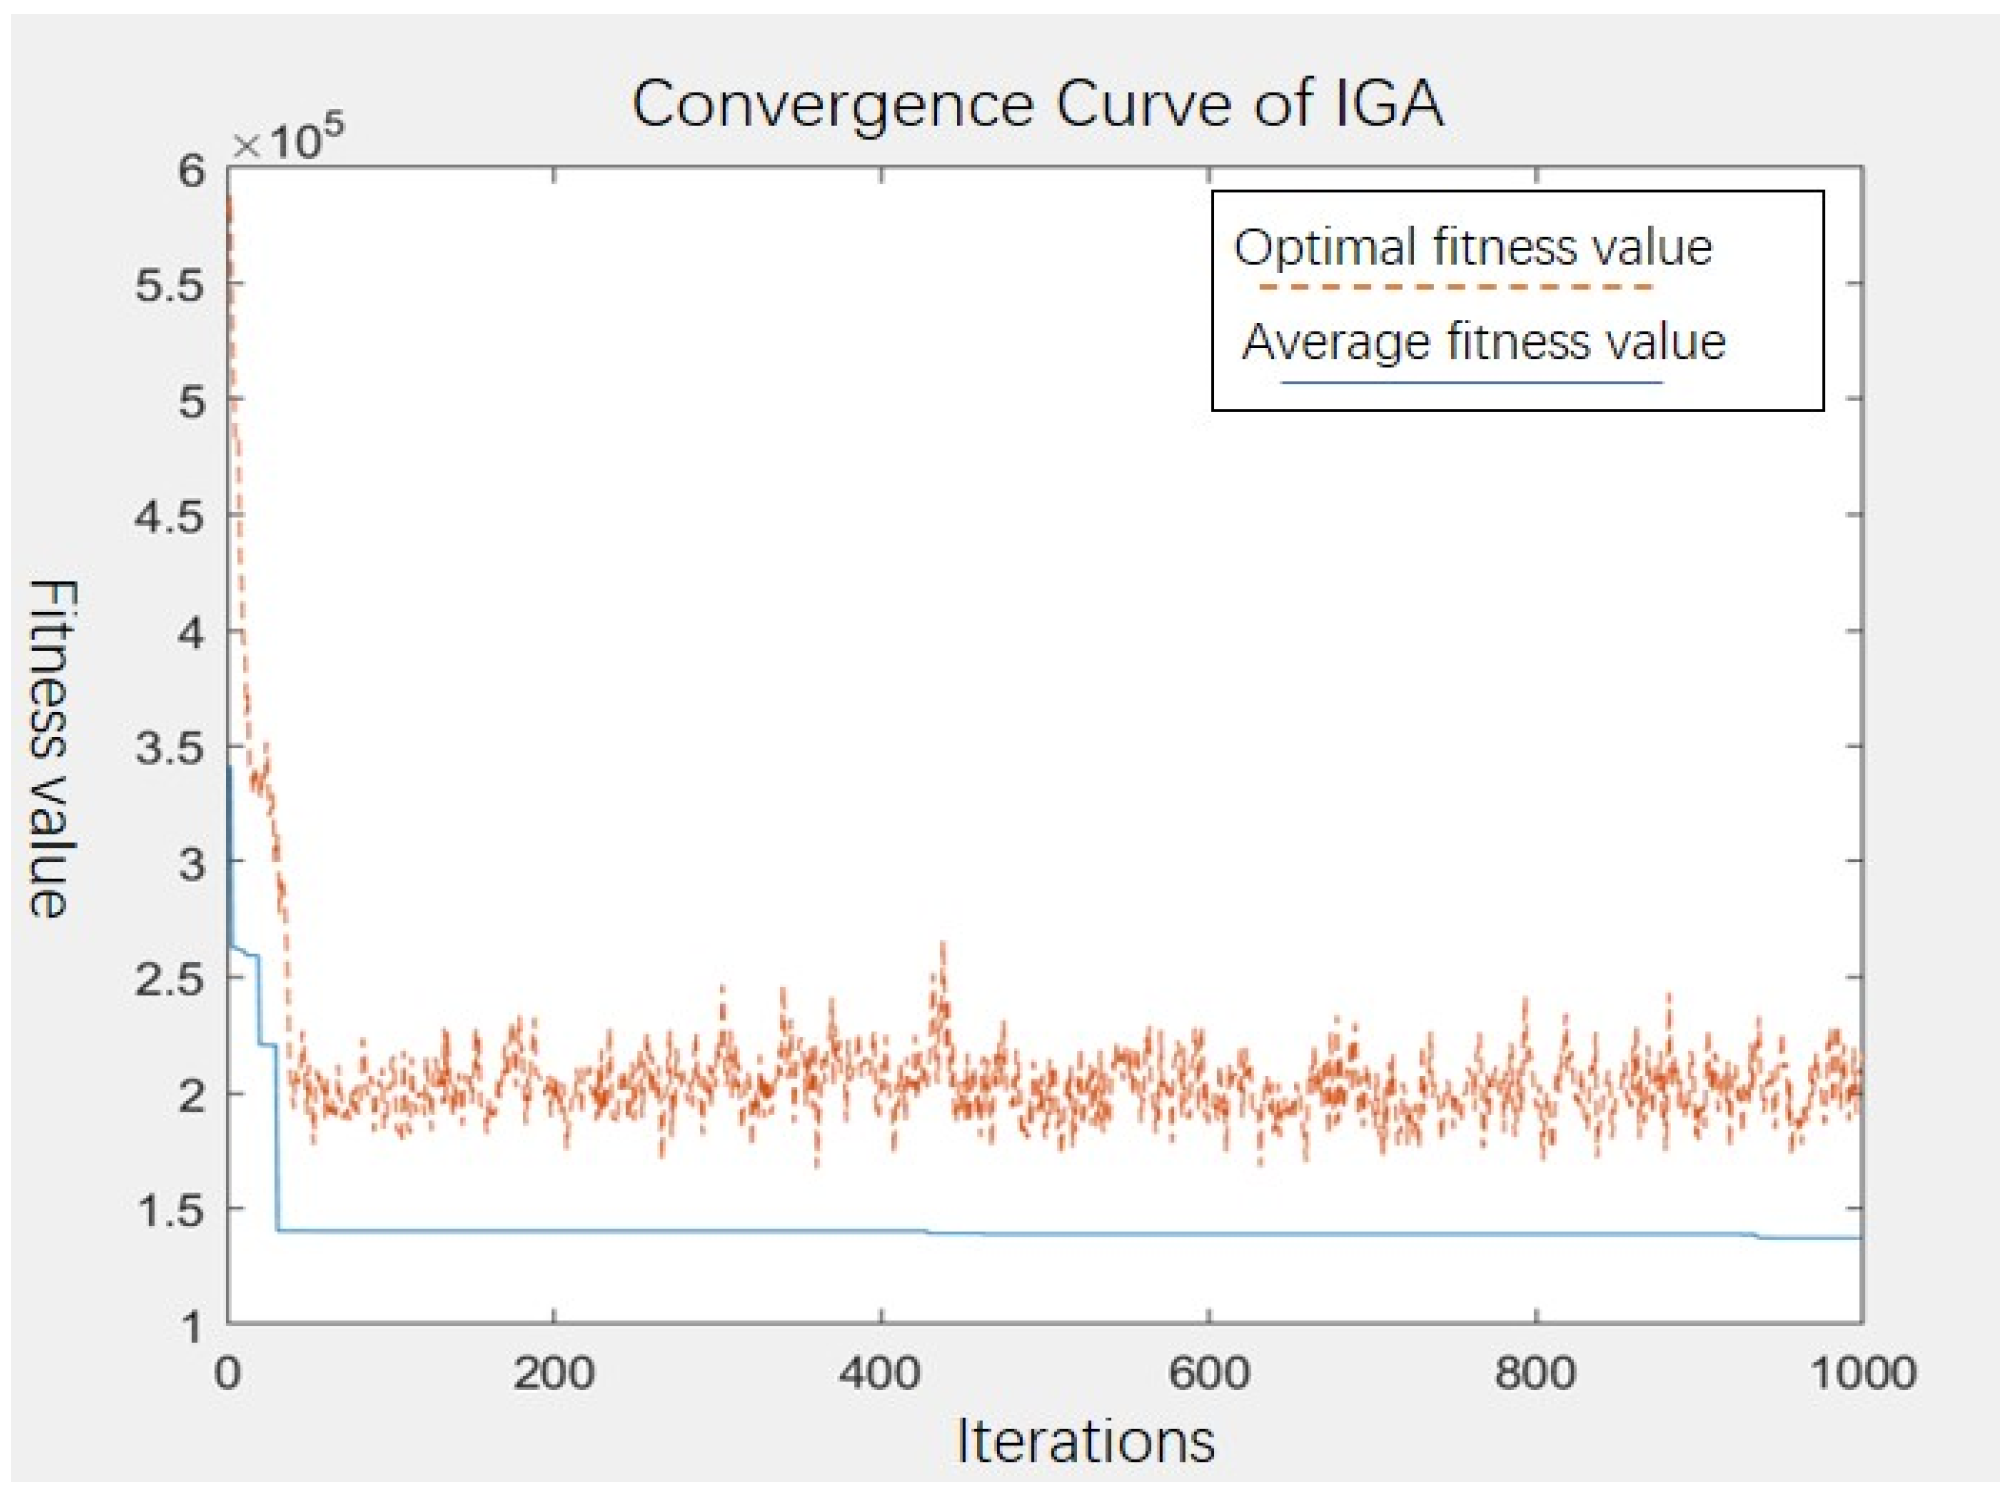
The immunogenetic algorithm was chosen to perform a scenario comparison to show the superiority of the particle swarm algorithm. The immune algorithm has many advantages, such as adaptivity, stochasticity, parallelism, global convergence, and population diversity. The total population was set at 50 in the immunogenetic algorithm, the memory bank capacity was 10, the crossover factor was set to 0.5, and the diversity evaluation factor was 0.95. The same iterations were evaluated 1000 times, and the results for optimal site selection were calculated as A36(12, 12), A39(3, 19), A14(10, 3), A06(5, 10), A17(22, 15), A08 (20, 5), and A07 (20, 21). The optimal fitness value was CNY 137, 307.1613 million, and the run time was 185 s. The optimal distribution location and convergence of the algorithm are shown in Figure 5 and Figure 6, respectively.
A detailed list of the warehouse freight distribution derived from the two algorithms is presented in Table 2, where each column represents one layout scheme. In the comparison of the optimal location distributions derived by the two algorithms, A06 (5, 10), A20 (3, 19), and A36 (12, 12) were chosen as logistics center points, and each point covered the same subset. Among them, A06 (5, 10) corresponds to five demand points, A19, A21, A24, A28, and A31; A20 (3, 19) corresponds to eight demand points, A01, A10, A11, A12, A18, A32, A35, and A38; and A36 (12, 12) corresponds to two demand points, A25 and A27. The allocation of freight for these three points is 18, 151, and 57 tons, respectively. That is, these points yield the same freight allocation in the two different algorithms.
However, some similar points were selected by both algorithms with different demand points covered. The immune genetic algorithm A07 (20, 21) covered five demand points, A02, A03, A05, A23, and A33, while A17 covered six demand points, A15, A16, A22, A26, A30, and A40, and the sums of their demands were 125 and 81 tons, respectively. The logistics center point A03 derived with the particle swarm algorithm covered six demand points, A02, A05, A07, A15, A33, and A40, while A16 (21, 13) covered four demand points, A17, A22, A26, and A30, which correspond to the sums of their demand of 162 and 52 tons, respectively.
By contrast, the logistics center points A07 (20, 21) and A17 (22, 15) selected with the immune genetic algorithm were not the same as the A03 (21, 21) and A16 (21, 13) selected with the particle swarm algorithm. In detail, with the immune genetic algorithm, A07 (20, 21) covered five demand points, A02, A03, A05, A23, and A33, with the sum of the corresponding demands being 125 tons, and A17 covered six demand points, A15, A16, A22, A26, A30, and A40, with the total of the corresponding demands being 81 tons. The logistics center point A03, derived from the particle swarm algorithm, covered six demand points, A02, A05, A07, A15, A33, and A40, and the sum of the corresponding demand was 162 tons, while A16 (21, 13) covered four demand points, A17, A22, A26, and A30, and the sum of the corresponding demand was 52 tons.
In summary, the fitness values obtained by the particle swarm algorithm are lower than those obtained by the immune genetic algorithm, and the solution is reached more quickly. Both algorithms produce largely similar distributions of logistics centers. However, it is found that the optimal distribution of logistics center sites and the coverage of freight capacity demand derived from the particle swarm algorithm are more balanced than those derived from the other algorithm. Based on real factors such as sustainable development planning, the natural conditions, and relevant laws and regulations, we believe that the site selection scheme for logistics centers derived from the particle swarm algorithm is more reasonable. Therefore, it can be concluded that the algorithm and model proposed in this paper can effectively optimize the location of regional logistics center, reduce the transportation cost of enterprises, and expand the income of enterprises. This plays a vital role in the sustainable development of express delivery enterprises.
5. Conclusions
Location selection is a systematic project constrained by multiple geographic, social, and economic factors, and site selection for regional logistics centers is even more complicated. The key step in site selection is to reduce the uncertainty and inaccuracy of evaluation models. To address this problem, the paper proposes a multi-factor constrained P-median model for optimizing the layout of logistics centers based on the improvement of the existing one-dimensional objective constrained site selection model, and the optimal siting location was determined by using the particle swarm algorithm and immune genetic algorithm to derive a more optimal location layout. The main conclusions are as follows: (1) based on the mutual constraint relationship among the factors, we controlled the storage capacity of each logistics center to match the sum of the most suitable demand point freight volume while ensuring the shortest economic distance, which effectively overcomes the problem of the uneven distribution of storage material resource capacity in the traditional location-allocation model. (2) According to the analysis of the case, the optimal location and layout allocation according to the particle swarm algorithm are better than those according to the immune genetic algorithm, which indicates that the particle swarm algorithm for the P-median site selection model under the multi-factor constraint has a certain reference value for multi-logistics center site-selection planning.
Results show that the particle swarm optimization algorithm has a fast convergence speed and high precision in the selection of logistic system node. It has a good performance when solving multivariable feasibility solution. Meanwhile, it could effectively improve the solution efficiency of node location in large-scale underground complex environments. The above research outcomes can provide reference for relevant managers to optimize the logistics system.
Author Contributions
Y.H. developed the idea of the study, participated in its design and coordination, and helped to draft the manuscript. X.W. contributed to the acquisition and interpretation of the data. H.C. provided a critical review and substantially revised the manuscript. All authors have read and agreed to the published version of the manuscript.
Funding
This research was supported by the Social Science Planning Project of Fujian Province (China) under Grant FJ2022B064, the Natural Science Foundation of Fujian Province (China) under Grant 2021J01326, and the Science and Technology Planning Project of Quanzhou city (China) under Grant 2019C096R.
Data Availability Statement
The datasets supporting the results of this study are included within the article and its additional files.
Conflicts of Interest
The author(s) declare no potential conflicts of interest with respect to the research, authorship, and/or publication of this article.
References
- Ouyang, R.; Beacher, M.R.; Ma, D.; Alam, N.E. Navigating concave regions in continuous facility location problems. Comput. Ind. Eng. 2020, 143, 106385. [Google Scholar] [CrossRef]
- Pakravan, P.; Behnamian, J. Undesirable facility location under uncertainty: Modeling and algorithm. Prod. Oper. Manag. 2019, 10, 1–23. [Google Scholar] [CrossRef]
- Fernández, P.; Lančinskas, A.; Pelegrín, B.; Žilinskas, J. A discrete competitive facility location model with minimal market share constraints and equity-based ties breaking rule. Informatica 2020, 31, 205–224. [Google Scholar] [CrossRef]
- Lee, Y.-H.; Keum, H.-J.; Han, K.-Y.; Hong, W.-H. A hierarchical flood shelter location model for walking evacuation planning. Environ. Hazards 2021, 20, 432–455. [Google Scholar] [CrossRef]
- Rehman, A.U.; Abidi, M.H.; Umer, U.; Usmani, Y.S. Multi-criteria decision-making approach for selecting wind energy power plant locations. Sustainability 2019, 11, 6112. [Google Scholar] [CrossRef] [Green Version]
- Sennaroglu, B.; Varlik Celebi, G. A military airport location selection by AHP integrated PROMETHEE and VIKOR methods. Transp. Res. Part D Transp. Environ. 2018, 59, 160–173. [Google Scholar] [CrossRef]
- Carrasco Heine, O.F.; Demleitner, A.; Matuschke, J. Bifactor approximation for location routing with vehicle and facility capacities. Eur. J. Oper. Res. 2023, 304, 429–442. [Google Scholar] [CrossRef]
- Li, J.; Yang, Y.-H.; Lei, H.; Wang, G.-G. Solving logistics distribution center location with improved cuckoo search algorithm. Int. J. Comput. Intell. Syst. 2020, 14, 676. [Google Scholar] [CrossRef]
- Zhang, W.; Cao, K.; Liu, S.; Huang, B. A multi-objective optimization approach for health-care facility location-allocation problems in highly developed cities such as Hong Kong. Comput. Environ. Urban Syst. 2016, 59, 220–230. [Google Scholar] [CrossRef]
- Wang, W.; Yang, K.; Yang, L.; Gao, Z. Tractable Approximations for the distributionally robust conditional vertex p-center problem: Application to the location of high-speed railway emergency rescue stations. J. Oper. Res. Soc. 2022, 73, 525–539. [Google Scholar] [CrossRef]
- Fei, T.; Zhang, L.; Zhang, X.; Chen, Q.; Liang, J. Location Selection strategy of distribution centers based on artificial fish swarm algorithm improved by bacterial colony chemotaxis. J. Internet Technol. 2021, 22, 685–695. [Google Scholar]
- Chi, R.; Su, Y.; Qu, Z.; Chi, X. A Hybridization of cuckoo search and differential evolution for the logistics distribution center location problem. Math. Probl. Eng. 2019, 2019, e7051248. [Google Scholar] [CrossRef]
- Wang, F. Research on location selecting for logistics distribution center based on ant colony algorithm. J. Converg. Inf. Technol. 2012, 7, 255–262. [Google Scholar] [CrossRef]
- Wu, T.; Huang, L.; Liang, Z.; Zhang, X.; Zhang, C. A Supervised learning-driven heuristic for solving the facility location and production planning problem. Eur. J. Oper. Res. 2022, 301, 785–796. [Google Scholar] [CrossRef]
- Murray, A.T.; Church, R.L.; Feng, X. Single facility siting involving allocation decisions. Eur. J. Oper. Res. 2020, 284, 834–846. [Google Scholar] [CrossRef]
- Cheng, C.; Adulyasak, Y.; Rousseau, L.-M. Robust facility location under demand uncertainty and facility disruptions. Omega 2021, 103, 102429. [Google Scholar] [CrossRef]
- Hwang, K.; Asif, T.B.; Lee, T. Choice-driven location-allocation model for healthcare facility location problem. Flex. Serv. Manuf. J. 2022, 1, 1–26. [Google Scholar] [CrossRef]
- Aziz, H.; Chan, H.; Lee, B.E.; Parkes, D.C. The capacity constrained facility location problem. Games Econ. Behav. 2020, 124, 478–490. [Google Scholar] [CrossRef]
- Corberán, Á.; Landete, M.; Peiró, J.; Saldanha-da-Gama, F. The facility location problem with capacity transfers. Transp. Res. Part E Logist. Transp. Rev. 2020, 138, 101943. [Google Scholar] [CrossRef]
- Parragh, S.N.; Tricoire, F.; Gutjahr, W.J. A branch-and-benders-cut algorithm for a bi-objective stochastic facility location problem. OR Spectr. 2022, 44, 419–459. [Google Scholar] [CrossRef]
- Liu, Y.; Yuan, Y.; Shen, J.; Gao, W. Emergency response facility location in transportation networks: A literature review. J. Traffic Transp. Eng. 2021, 8, 153–169. [Google Scholar] [CrossRef]
- Ge, H.; Goetz, S.J.; Cleary, R.; Yi, J.; Gómez, M.I. Facility locations in the fresh produce supply chain: An integration of optimization and empirical methods. Int. J. Prod. Econ. 2022, 249, 108534. [Google Scholar] [CrossRef]
- Blanco, V.; Gázquez, R.; Saldanha-da-Gama, F. Multi-type maximal covering location problems: Hybridizing discrete and continuous problems. Eur. J. Oper. Res. 2022; in press. [Google Scholar] [CrossRef]
- Wang, H.; Ran, H.; Dang, X. Location optimization of fresh agricultural products cold chain distribution center under carbon emission constraints. Sustainability 2022, 14, 6726. [Google Scholar] [CrossRef]
- Jalal, A.M.; Toso, E.A.V.; Tautenhain, C.P.S.; Nascimento, M.C.V. An integrated location—Transportation problem under value-added tax issues in pharmaceutical distribution planning. Expert Syst. Appl. 2022, 206, 117780. [Google Scholar] [CrossRef]
Figure 1.
Median model.

Figure 2.
Penalty function flow chart.

Figure 3.
Optimal distribution position of the logistics center obtained by PSO.

Figure 4.
Convergence curve of PSO.

Figure 5.
Optimal location of logistics center based on IGA.

Figure 6.
Convergence curve of IGA.


Table 1.
Two-dimensional coordinates and corresponding demand and fixed costs.
| Number | Site (Km) | Demand (tons) | Fixed Costs (CNY Million) | Number | Site (Km) | Demand (tons) | Fixed Costs (CNY Million) |
|---|---|---|---|---|---|---|---|
| A01 | (01, 18) | 23 | 14 | A21 | (04, 07) | 5 | 18 |
| A02 | (24, 20) | 23 | 19 | A22 | (19, 16) | 19 | 20 |
| A03 | (21, 21) | 22 | 20 | A23 | (19, 21) | 23 | 11 |
| A04 | (14, 03) | 23 | 12 | A24 | (04, 08) | 12 | 11 |
| A05 | (16, 23) | 19 | 19 | A25 | (13, 08) | 23 | 20 |
| A06 | (05, 10) | 10 | 12 | A26 | (24, 12) | 3 | 15 |
| A07 | (20, 21) | 15 | 10 | A27 | (14, 15) | 15 | 11 |
| A08 | (20, 05) | 16 | 14 | A28 | (02, 07) | 25 | 12 |
| A09 | (06, 04) | 2 | 13 | A29 | (05, 01) | 4 | 12 |
| A10 | (05, 23) | 25 | 12 | A30 | (23, 17) | 3 | 14 |
| A11 | (11, 22) | 14 | 14 | A31 | (03, 12) | 25 | 17 |
| A12 | (10, 24) | 4 | 10 | A32 | (03, 18) | 24 | 15 |
| A13 | (05, 03) | 5 | 20 | A33 | (23, 22) | 23 | 17 |
| A14 | (10, 03) | 15 | 18 | A34 | (18, 02) | 6 | 13 |
| A15 | (25, 19) | 13 | 14 | A35 | (06, 21) | 24 | 20 |
| A16 | (21, 13) | 16 | 12 | A36 | (12, 12) | 19 | 13 |
| A17 | (22, 15) | 3 | 14 | A37 | (18, 09) | 8 | 19 |
| A18 | (03, 22) | 14 | 18 | A38 | (03, 23) | 15 | 11 |
| A19 | (07, 14) | 4 | 17 | A39 | (06, 01) | 12 | 20 |
| A20 | (03, 19) | 8 | 19 | A40 | (25, 18) | 24 | 14 |
Table 2.
Distribution of warehousing freight volume.
| Users | Optimum Points by IGA | Users | Optimum Points by PSO | ||||||||||||
|---|---|---|---|---|---|---|---|---|---|---|---|---|---|---|---|
| A06 | A07 | A08 | A14 | A17 | A20 | A36 | A06 | A03 | A20 | A09 | A36 | A34 | A16 | ||
| A01 | 23 | A01 | 23 | ||||||||||||
| A02 | 23 | A02 | 23 | ||||||||||||
| A03 | 22 | A04 | 23 | ||||||||||||
| A04 | 23 | A05 | 19 | ||||||||||||
| A05 | 19 | A07 | 15 | ||||||||||||
| A09 | 2 | A08 | 16 | ||||||||||||
| A10 | 25 | A10 | 25 | ||||||||||||
| A11 | 14 | A11 | 14 | ||||||||||||
| A12 | 4 | A12 | 4 | ||||||||||||
| A13 | 5 | A13 | 5 | ||||||||||||
| A15 | 13 | A14 | 15 | ||||||||||||
| A16 | 16 | A15 | 13 | ||||||||||||
| A18 | 14 | A17 | 3 | ||||||||||||
| A19 | 4 | A18 | 14 | ||||||||||||
| A21 | 5 | A19 | 4 | ||||||||||||
| A22 | 19 | A21 | 5 | ||||||||||||
| A23 | 23 | A22 | 19 | ||||||||||||
| A24 | 12 | A23 | 23 | ||||||||||||
| A25 | 23 | A24 | 12 | ||||||||||||
| A26 | 3 | A25 | 23 | ||||||||||||
| A27 | 15 | A26 | 3 | ||||||||||||
| A28 | 25 | A27 | 15 | ||||||||||||
| A29 | 4 | A28 | 25 | ||||||||||||
| A30 | 3 | A29 | 4 | ||||||||||||
| A31 | 25 | A30 | 3 | ||||||||||||
| A32 | 24 | A31 | 25 | ||||||||||||
| A33 | 23 | A32 | 24 | ||||||||||||
| A34 | 6 | A33 | 23 | ||||||||||||
| A35 | 24 | A35 | 24 | ||||||||||||
| A37 | 8 | A37 | 8 | ||||||||||||
| A38 | 15 | A38 | 15 | ||||||||||||
| A39 | 12 | A39 | 12 | ||||||||||||
| A40 | 24 | A40 | 24 | ||||||||||||
| Total | 81 | 125 | 30 | 61 | 81 | 151 | 57 | Total | 81 | 162 | 151 | 38 | 57 | 45 | 52 |
Unit: ton.
Publisher’s Note: MDPI stays neutral with regard to jurisdictional claims in published maps and institutional affiliations. |
© 2022 by the authors. Licensee MDPI, Basel, Switzerland. This article is an open access article distributed under the terms and conditions of the Creative Commons Attribution (CC BY) license (https://creativecommons.org/licenses/by/4.0/).
Share and Cite
MDPI and ACS Style
Huang, Y.; Wang, X.; Chen, H. Location Selection for Regional Logistics Center Based on Particle Swarm Optimization. Sustainability 2022, 14, 16409. https://doi.org/10.3390/su142416409
AMA Style
Huang Y, Wang X, Chen H. Location Selection for Regional Logistics Center Based on Particle Swarm Optimization. Sustainability. 2022; 14(24):16409. https://doi.org/10.3390/su142416409
Chicago/Turabian StyleHuang, Yingyi, Xinyu Wang, and Hongyan Chen. 2022. "Location Selection for Regional Logistics Center Based on Particle Swarm Optimization" Sustainability 14, no. 24: 16409. https://doi.org/10.3390/su142416409
Note that from the first issue of 2016, this journal uses article numbers instead of page numbers. See further details here.