
A Competitive Advantage Model for Indonesia’s Sustainable Tourism Destinations from Supply and Demand Side Perspectives

Abstract
:1. Introduction
2. Literature Review
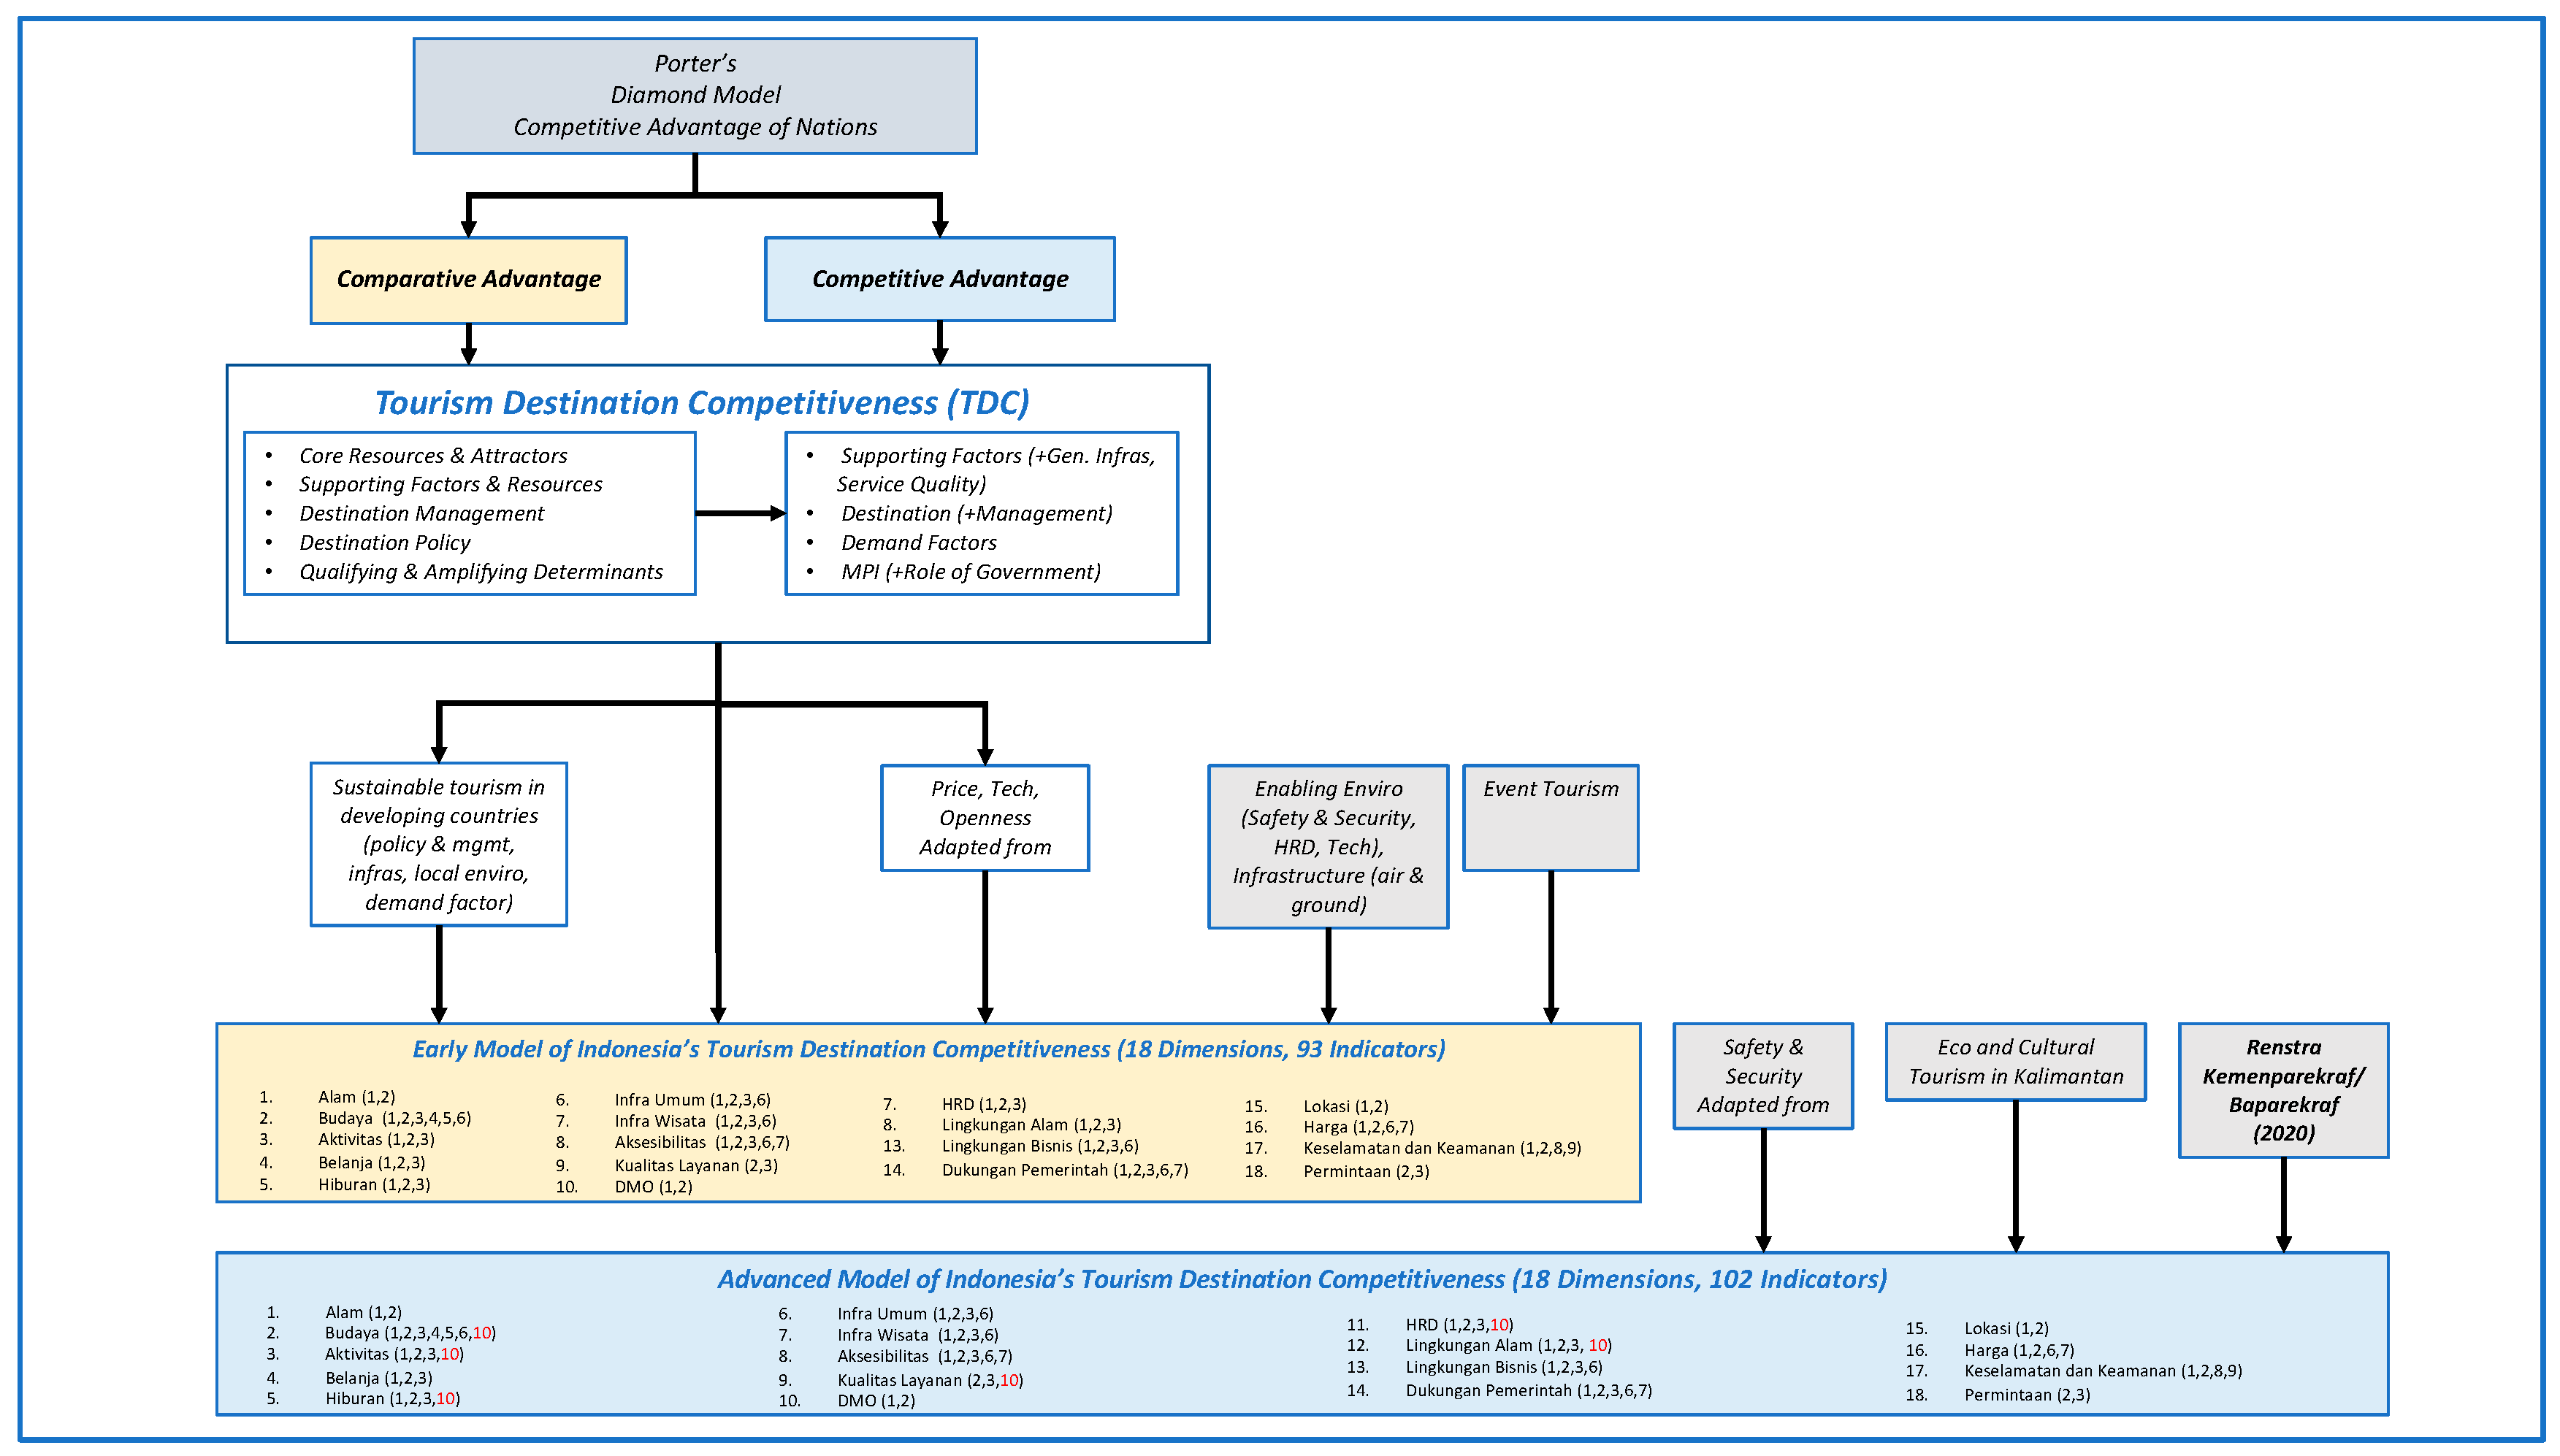
2.1. Theoretical Background
2.2. Sustainable Tourism
2.3. The Supply and Demand Perspectives of a Destination’s Competitiveness
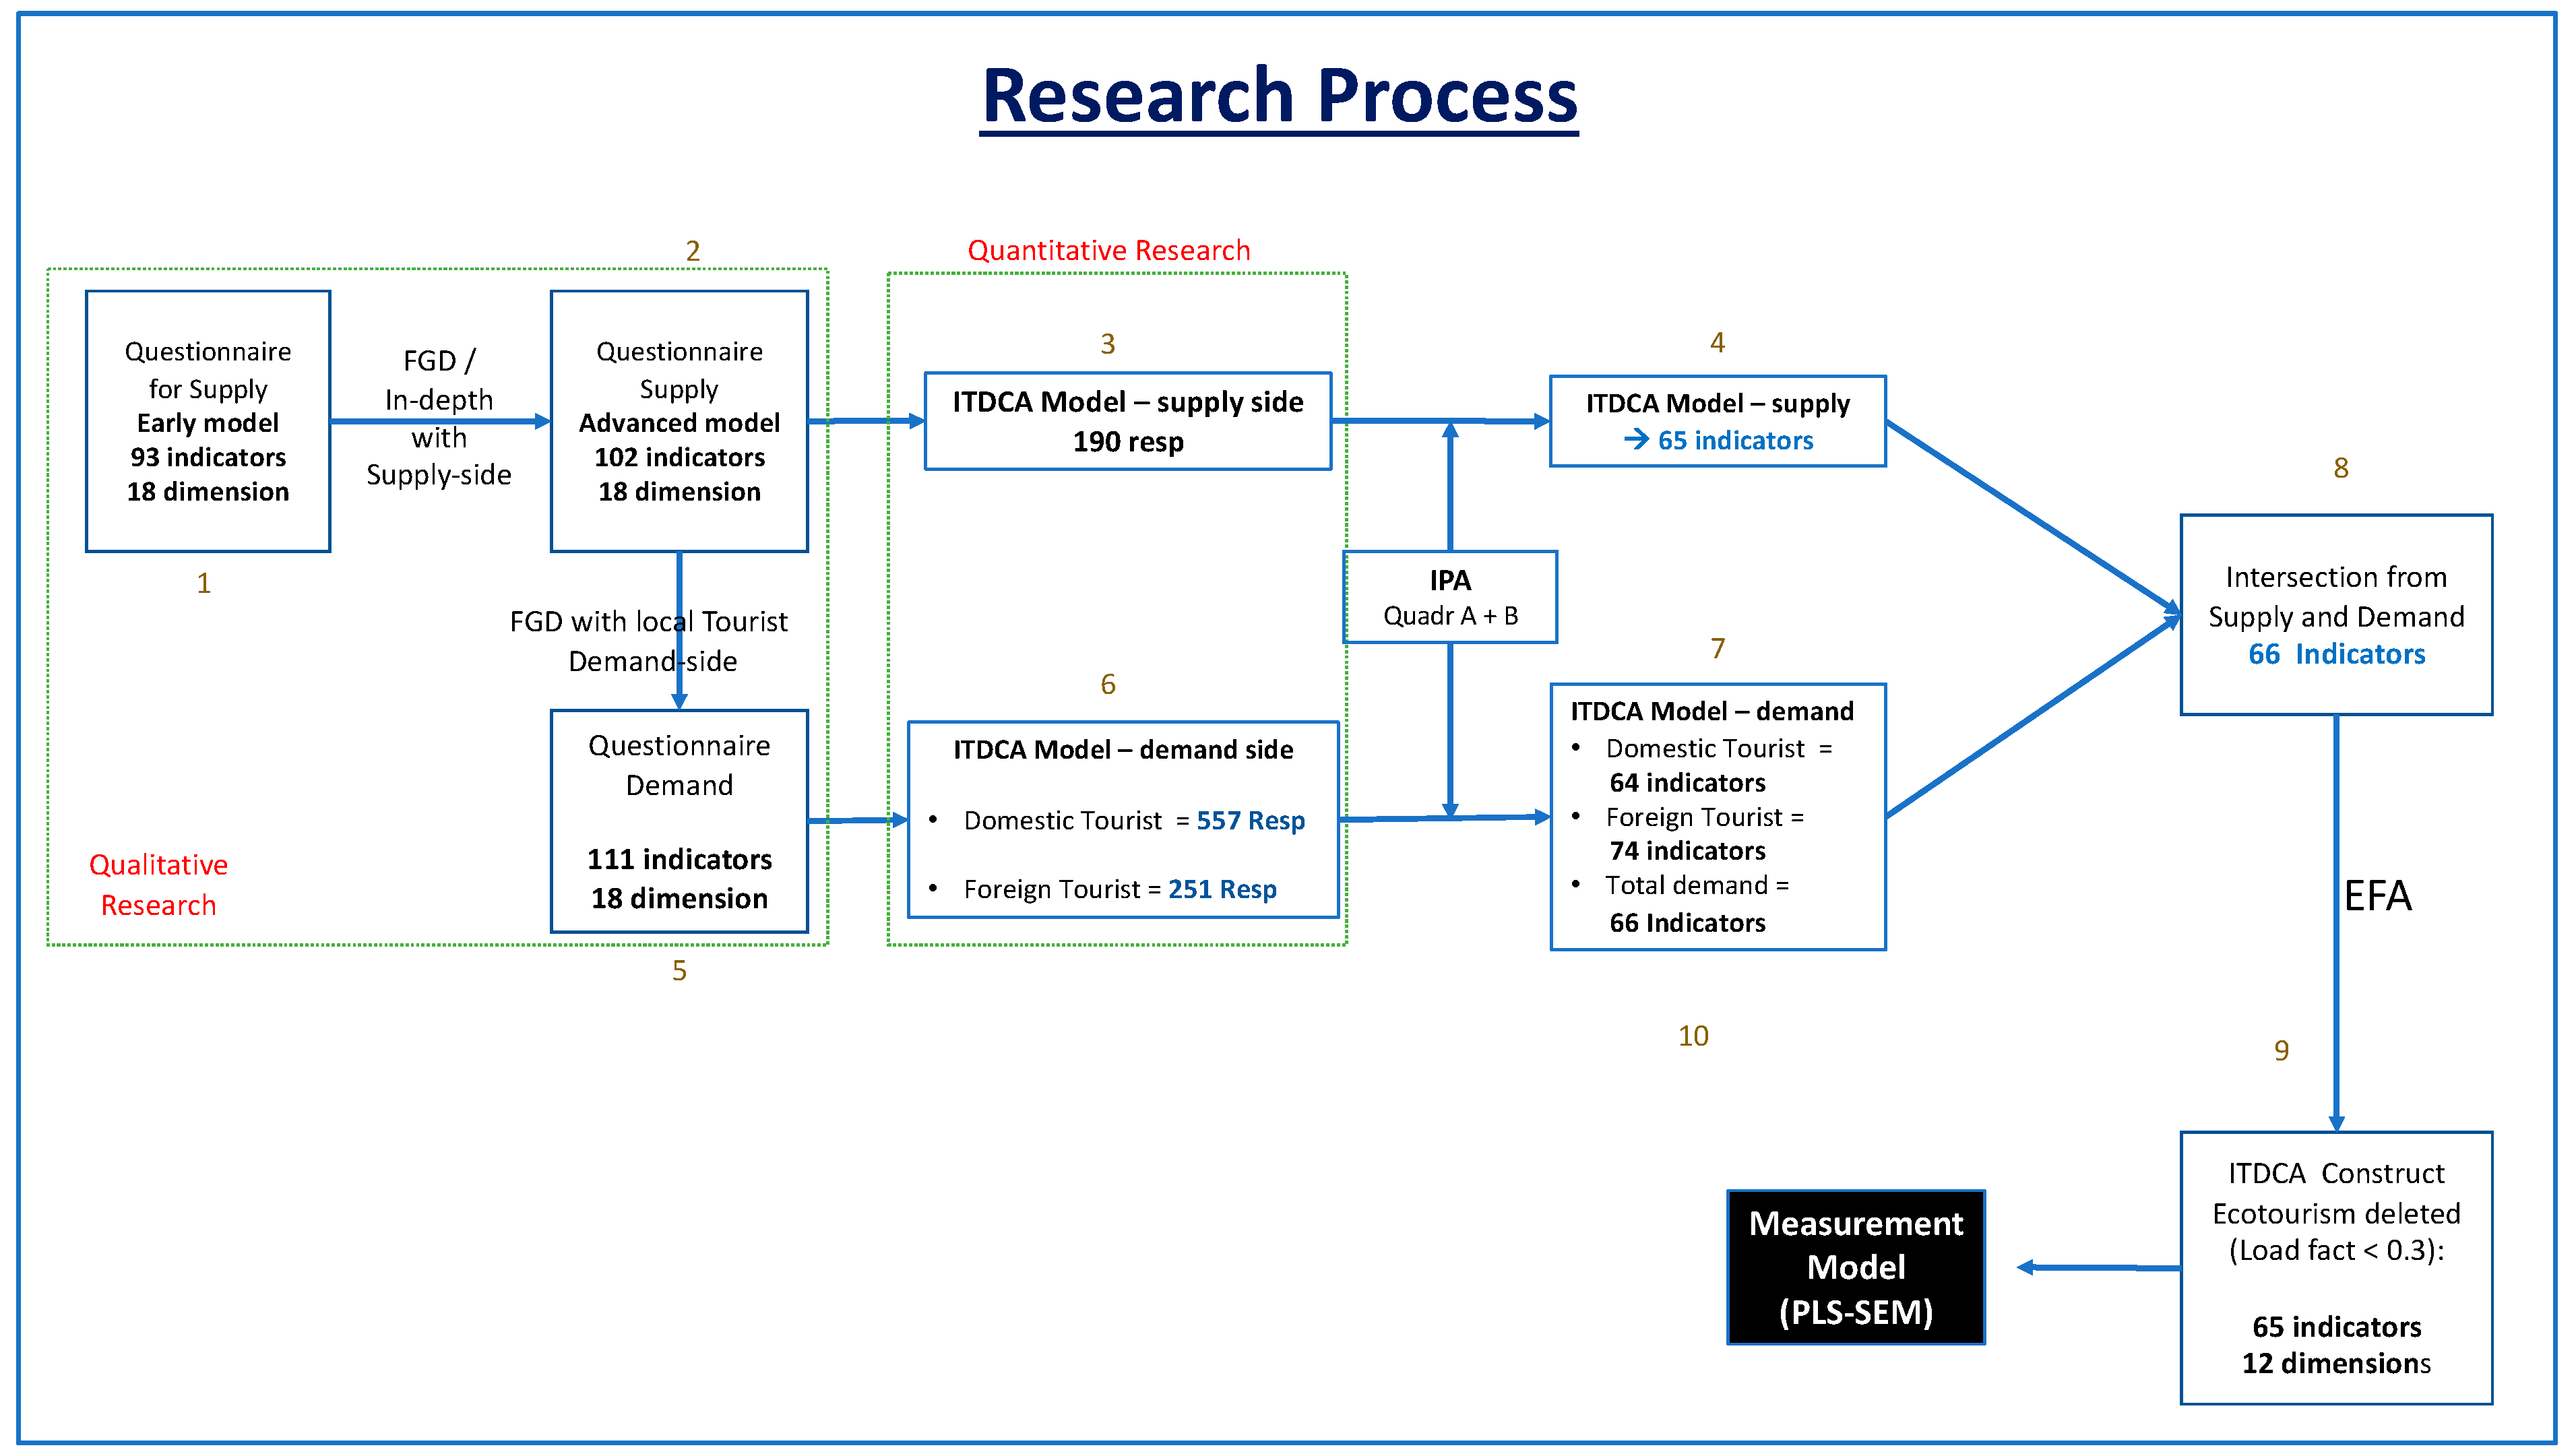
3. Research Methods
- Develop a competitive advantage model for Indonesian tourist destinations;
- Develop a competitive advantage model from the supply side;
- Explore the dimensions/indicators from the literature (early model);
- Conduct FGD/in-depth interviews with credible stakeholders (advanced model).
- Develop a competitive advantage model from the demand side.
- Conduct FGD with seven experienced domestic travelers to convert the supply side questionnaire into the demand side questionnaire (domestic tourists);
- Translate the domestic tourist questionnaire into the English language and validate it by conducting a pretest on five foreign tourists to obtain a questionnaire for foreign tourists.
- Perform analysis by determining the intersection of indicators from the supply side and the demand side, using the IPA method;
- Further analyze the results of the intersection of the indicators using EFA (Exploratory Factor Analysis) to classify the indicators that were relevant to their respective dimensions;
- Test the results obtained from the EFA analysis with a measurement model using SmartPLS 3, as shown in Figure 2.
3.1. ITDCA Model from the Supply Side
3.2. ITDCA Model from the Demand Side
3.2.1. Domestic Tourist Respondents
3.2.2. Foreign Tourist Respondents
3.3. The Intersection Analysis of the Supply Side and the Demand Side
- Both the supply side and demand side assessed these indicators as important with good performance;
- Both the supply side and demand side assessed these indicators as important, but only the demand side rated the performance as good. In contrast, the supply side rated the performance as not satisfactory;
- Both the supply side and demand side assessed these indicators as important, but only the supply side rated the performance as good. In contrast, the demand side rated the performance as not satisfactory;
- Both the supply side and demand side assessed these indicators as important, but both agreed that the performance was not satisfactory;
- The demand side rated these indicators as important and considered the performance to be good, but the supply side considered these indicators to be less important;
- The demand side rated these indicators as important and considered the performance unsatisfactory, but the supply side considered these indicators to be less important;
- The supply side assessed these indicators as important, but they were less important for the demand side;
- The supply side considered these indicators to be important with good performance, but they were less important for the demand side;
- Both the supply side and demand side assessed these indicators as less important.
3.4. EFA Analysis of the Intersection of the Supply Side and the Demand Side
3.5. Measurement Model
4. Results and Discussion
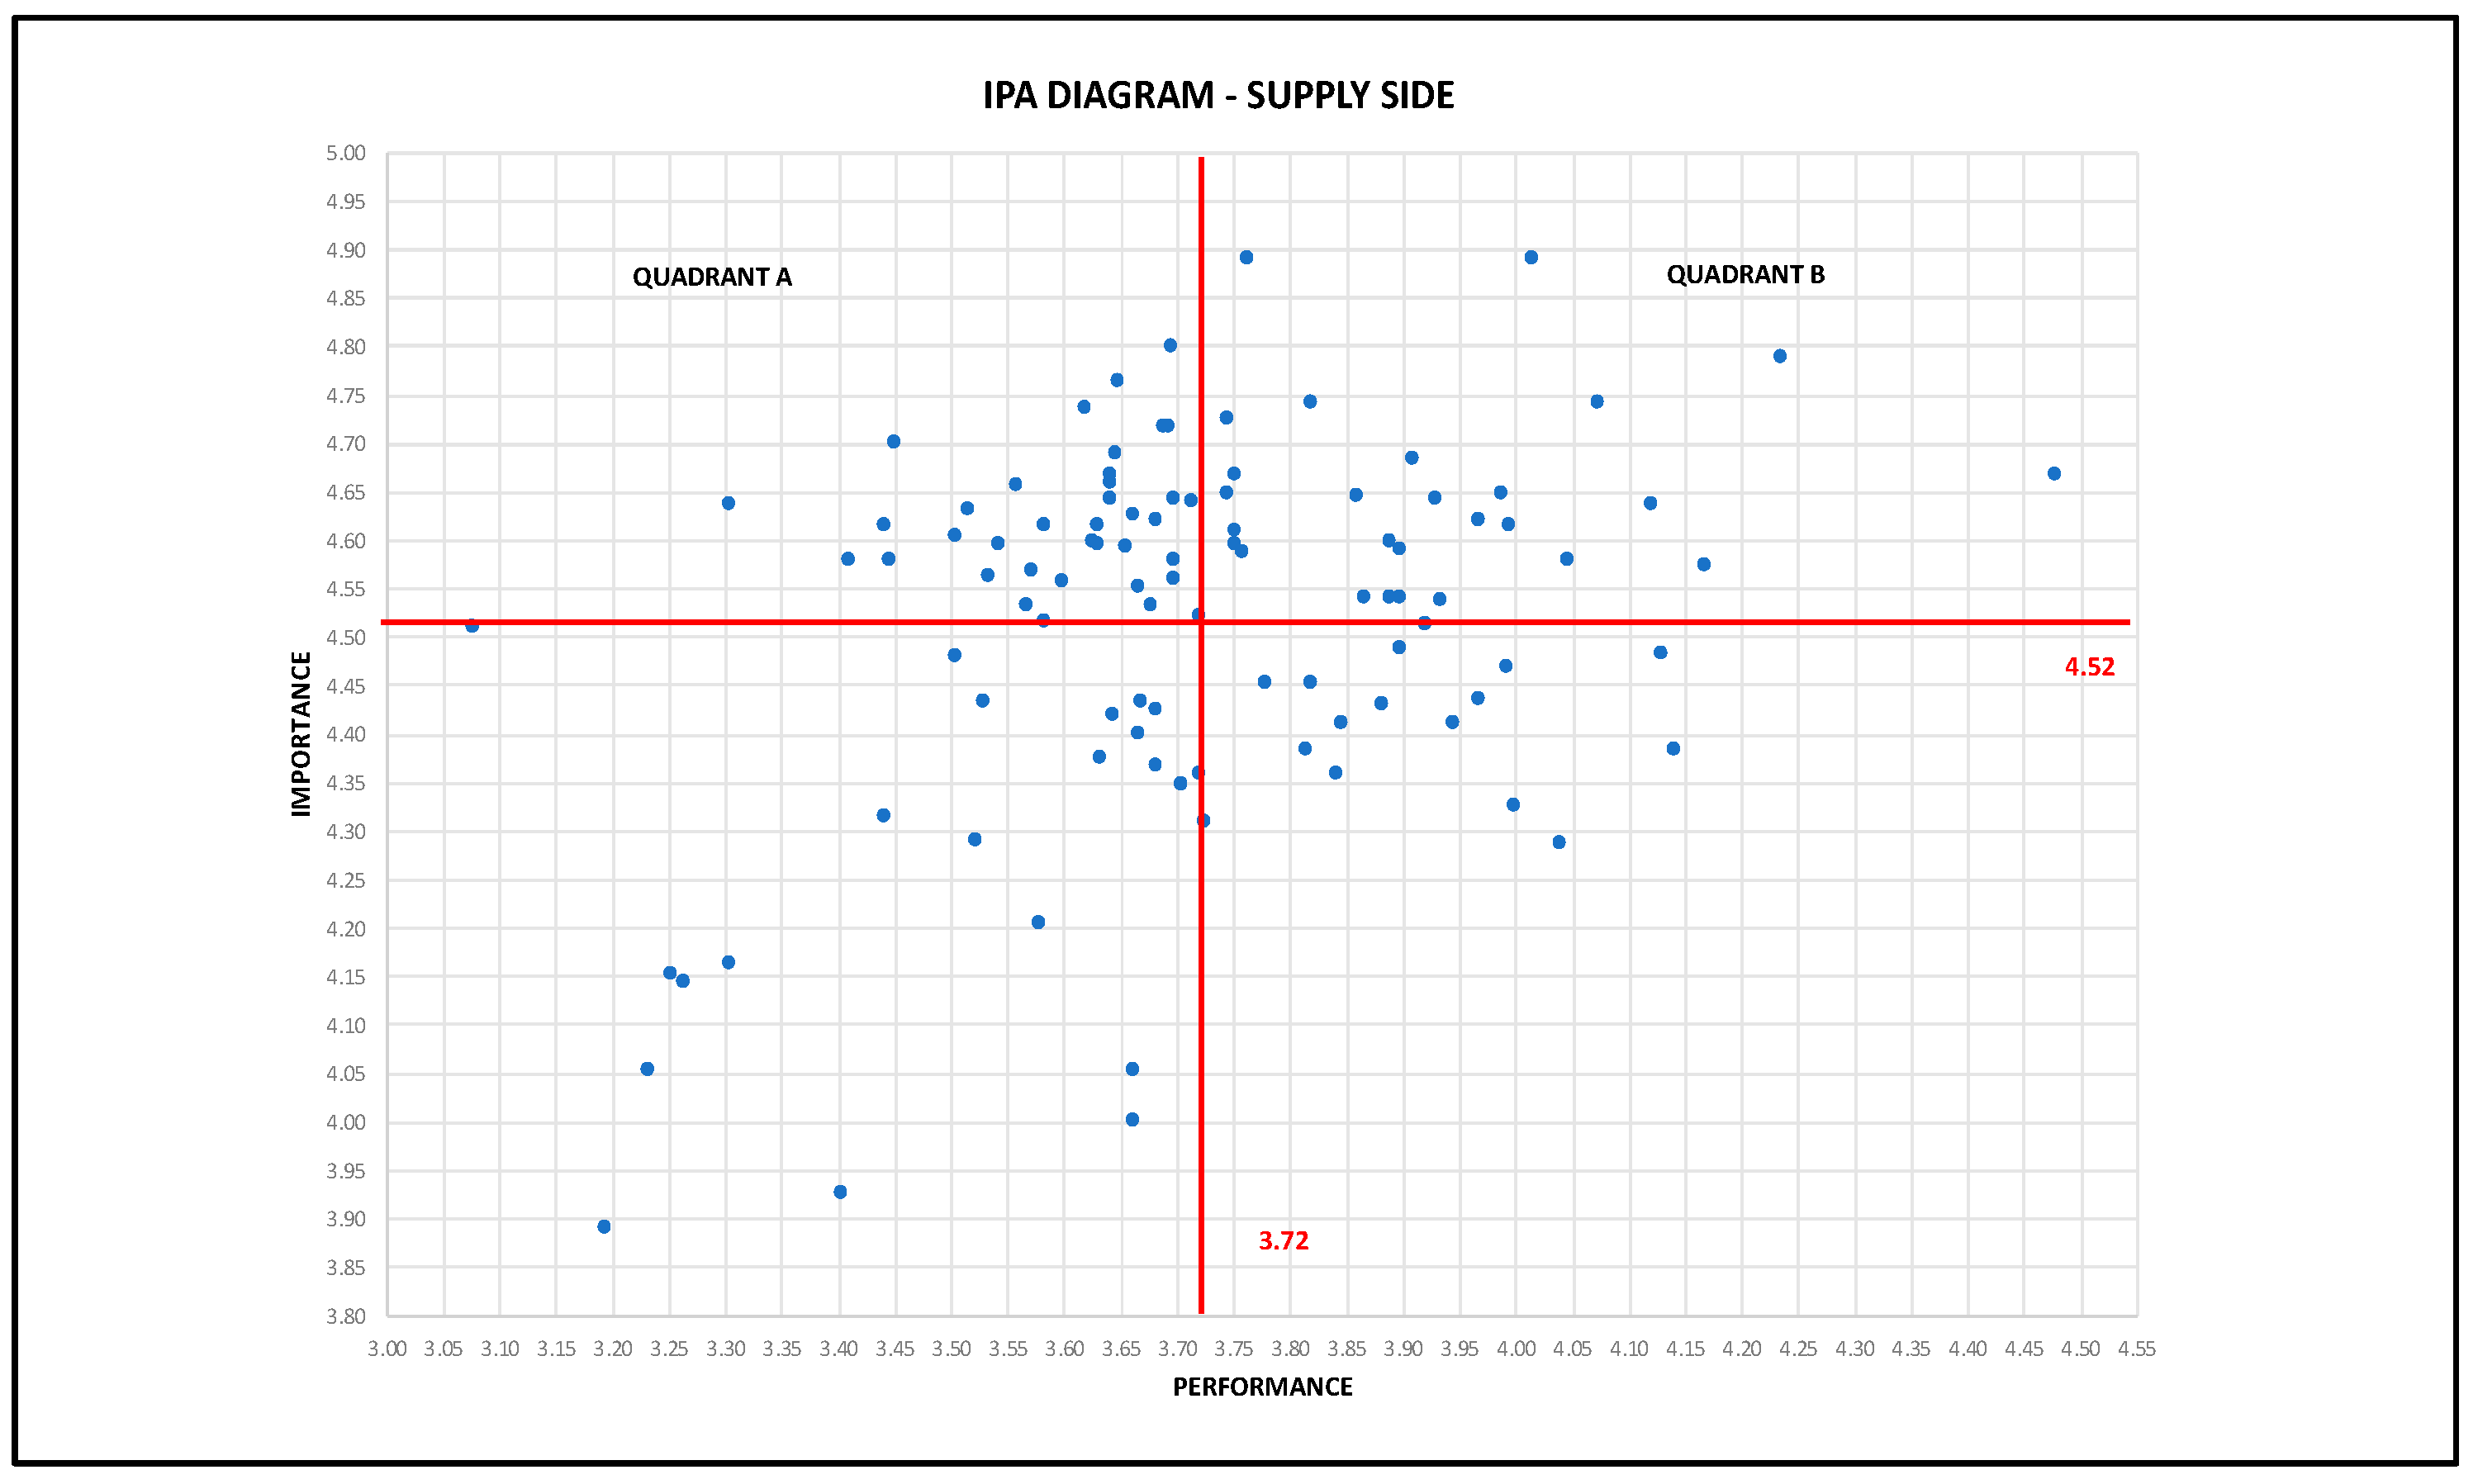
4.1. Results and Discussion from the Supply Side Perspective
| No | # of Respondents | Quadrant B | Quadrant A | Mean Performance | Mean Importance |
| 1 | 62 | 29 | 32 | 3.68 | 4.60 |
| 2 | 190 | 30 | 35 | 3.72 | 4.52 |
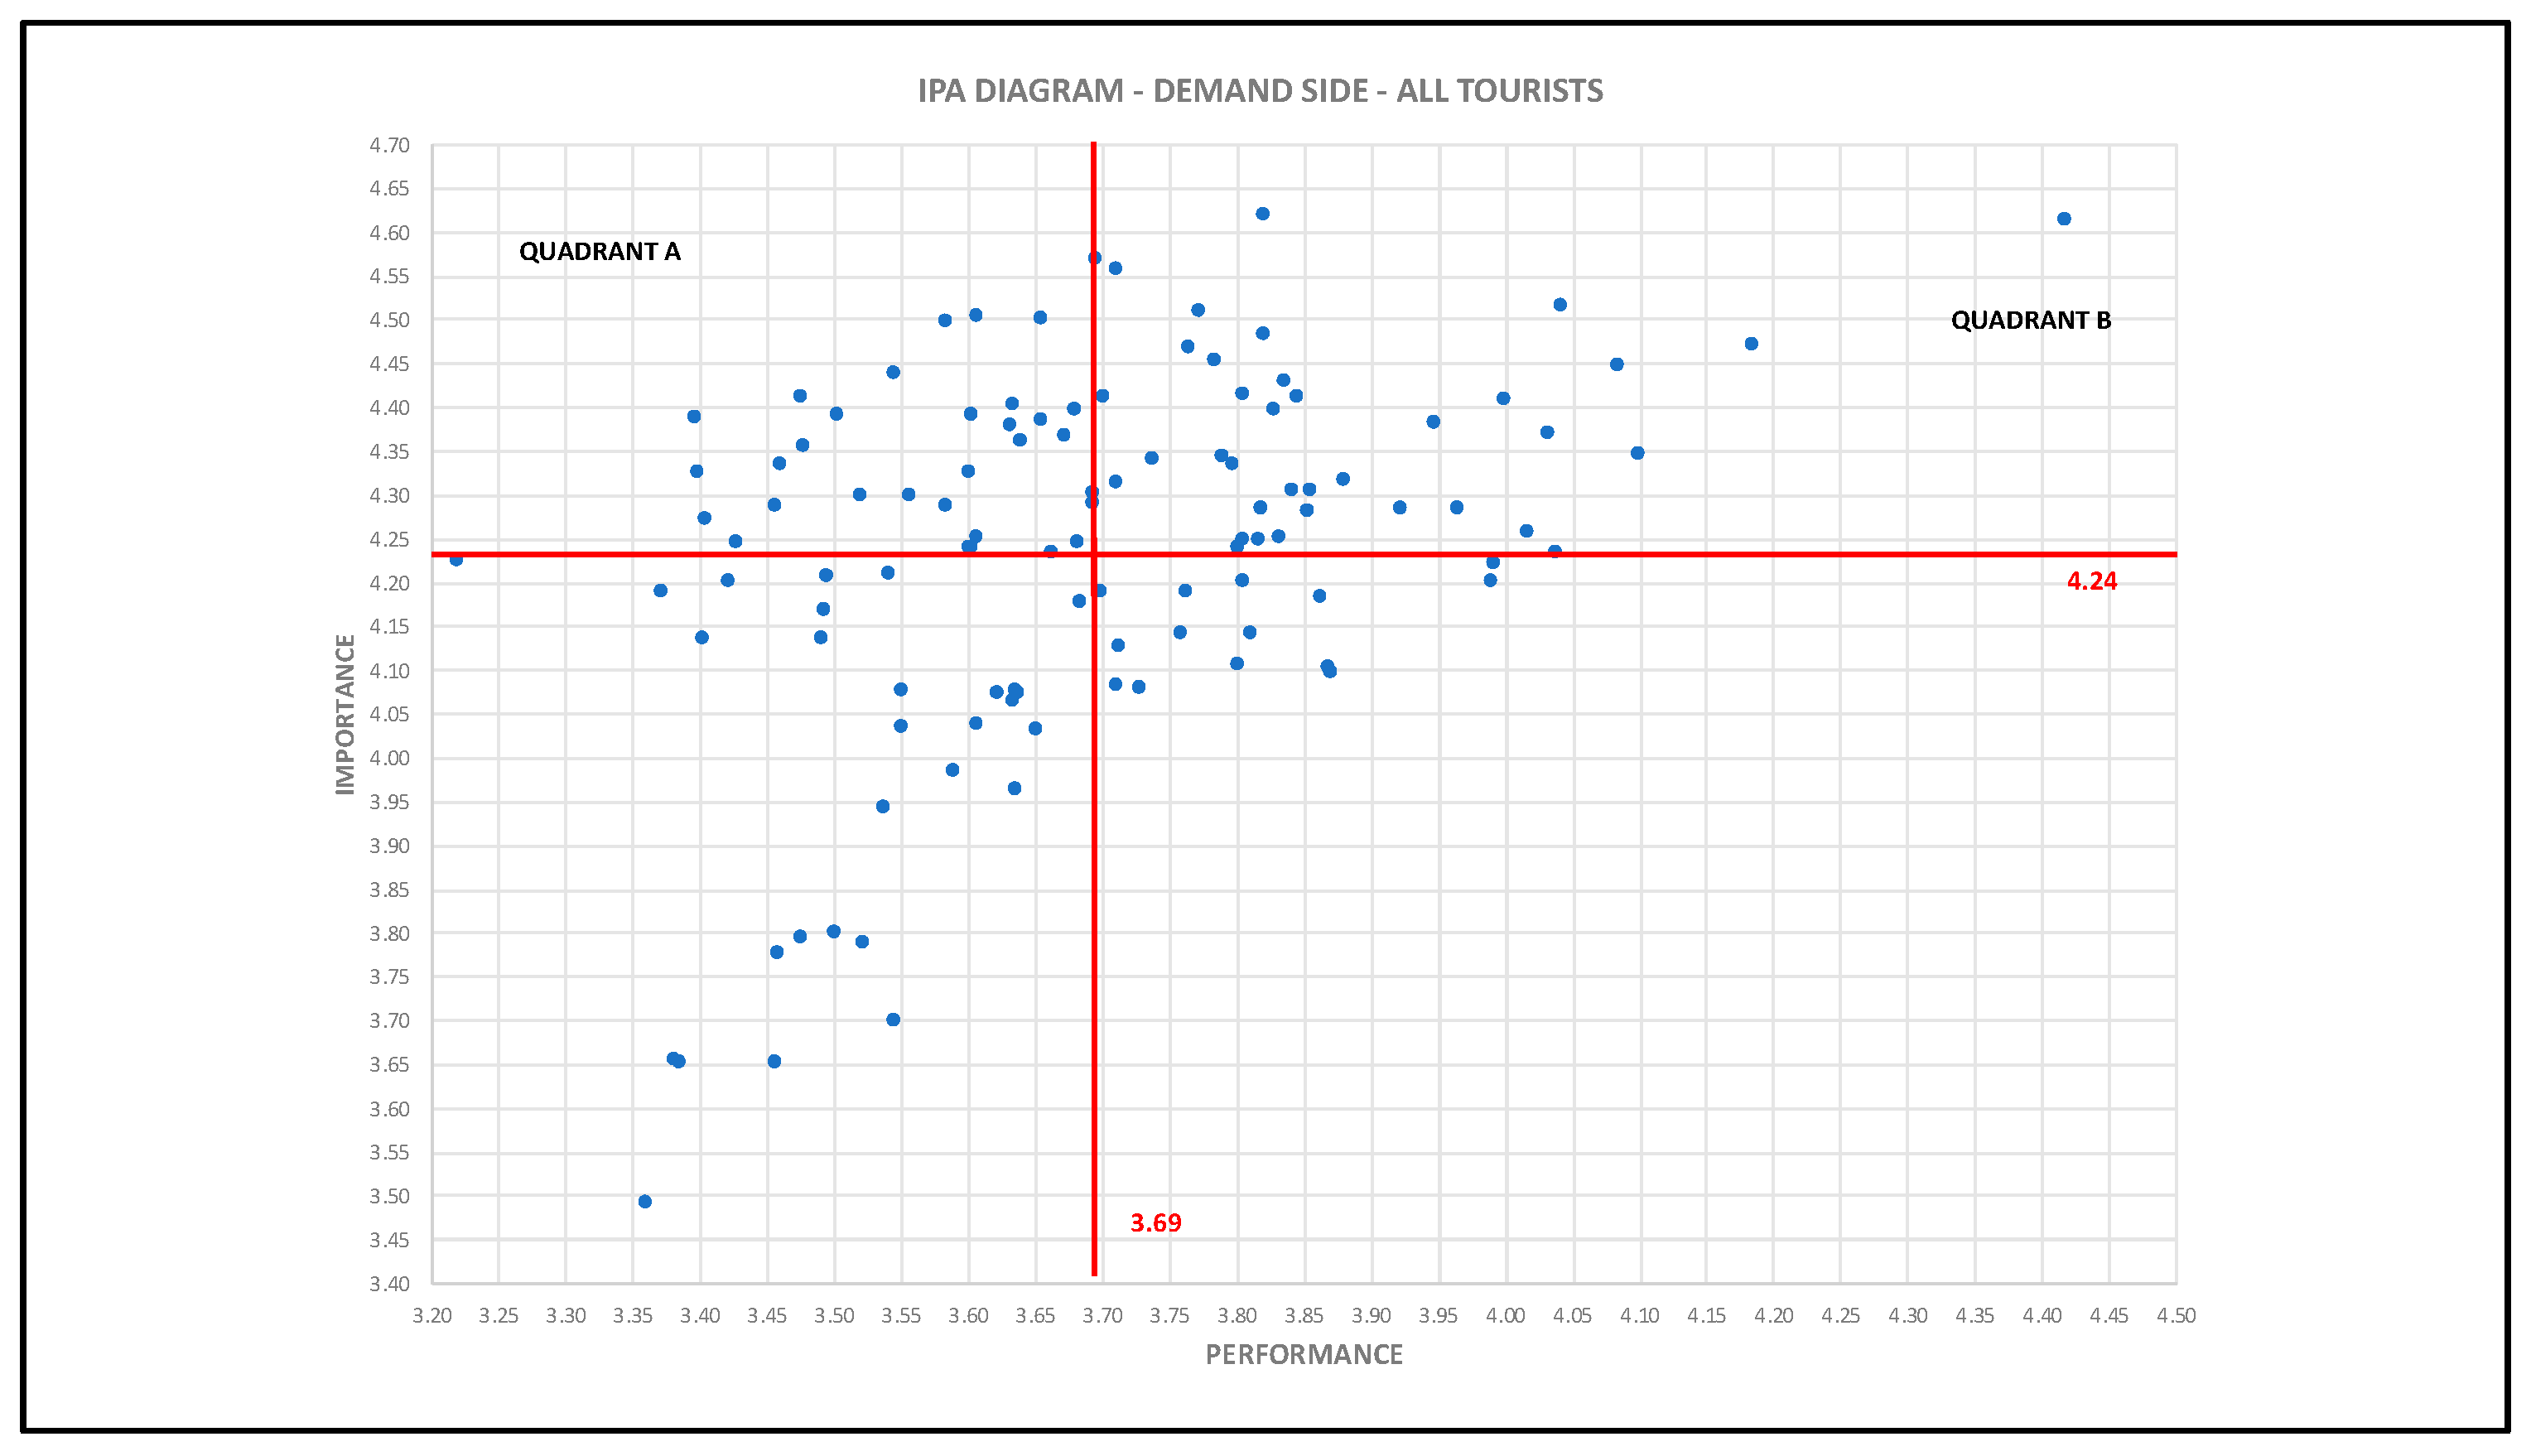
4.2. Result and Discussion from the Demand Side Perspective
- Shopping Dimension: addition of two (2) indicators due to the separation between the quality and variety of shopping items;
- General Infrastructure Dimension: omission of one (1) indicator: the quality of the local transportation system;
- Tourism infrastructure dimension: addition of five (5) indicators due to the separation between the quality and variety of accommodation, the efficiency and quality of airports, ports, and land transportation, as well as the quality and capacity of conference venues;
- DMO Dimension: addition of seven (7) indicators, due to the development of the indicators:
- The role of the tourism agency in planning, developing, coordinating, and implementing strategy was broken down into:
- Well-advertised and promoted destination;
- Existence of a visitor information center/call center/interpretation center and an officer at the destination;
- Existence of universal pricing allowing rotating access by day, week, origin of visitor, or unit pricing (activity-based price);
- Pre-visitation reservation system;
- Destination provides an enjoyable and memorable experience.
- The effectiveness of the tourism agency in the promotion and continuous evaluation of developing the tourism industry was broken down into:
- The physical and ecological integrity of the natural environment;
- The physical and ecological integrity of the built environment;
- The physical and ecological integrity of the cultural and social environment.
- The existence of a long-term vision for the development of the tourism industry was broken down into:
- Existence of facilities that reflect the destination (icon/landmark);
- Existence of attractive events that reflect the destination.
- HR Dimension: omission of one (1) indicator due to the merging of the quality and quantity of certified HR;
- The Government Support for Tourism dimension: elimination of four (4) indicators regarding:
- Government policies on tourism development/political commitment to tourism;
- Ease of investment in tourism development;
- Access to venture capital;
- Support for transport infrastructure.
- 7.
- Price (competition) dimension: omission of one (1) indicator: labor cost;
- 8.
- Safety/Security dimension: addition of two (2) indicators:
4.3. Result from the Intersection Analysis between the Supply Side and the Demand Side
4.4. Results from the EFA Analysis
4.5. Results and Discussion of the Measurement Model
- -
- Ecotourism;
- -
- Comfortable climate for tourism;
- -
- Flora and fauna;
- -
- Unspoiled nature/green areas;
- -
- National parks/nature reserves;
- -
- Water-based activities;
- -
- Cultural-based activities.
5. Conclusions
5.1. Implication
5.2. Limitations and Further Research
Author Contributions
Funding
Conflicts of Interest
References
- Sugiyarto, G.; Blake, A.; Sinclair, M.T. Tourism and globalization: Economic Impact in Indonesia. Ann. Tour. Res. 2003, 30, 683–701. [Google Scholar] [CrossRef]
- Bank Indonesia. Indonesian Economic Report 2019; Bank Indonesia: Jakarta, Indonesia, 2020. [Google Scholar] [CrossRef]
- Kemenparekraf dan Baparekraf. Rencana Strategis Kementerian Pariwisata dan Ekonomi Kreatif/Badan Pariwisata dan Ekonomi Kreatif 2020–2024; Ministry of Tourism and Creative Economy: Jakarta, Indonesia, 2020.
- Kemenparekraf dan Baparekraf. Rencana Strategis Kemenparekraf/Baparekraf 2020–2024; Ministry of Tourism and Creative Economy: Jakarta, Indonesia, 2020; pp. 1–149.
- WEF. The Travel & Tourism Competitiveness Report 2019; World Economic Forum: Geneva, Switzerland, 2019. [Google Scholar]
- Hanafiah, M.H.; Hemdi, M.A.; Ahmad, I. Does tourism destination competitiveness lead to performance? A case of ASEAN region. Tourism 2016, 64, 251–260. [Google Scholar]
- Croes, R.; Semrad, K.J. Destination competitiveness. Sage Handb. Tour. Manag. Sage 2018, 77–90. [Google Scholar] [CrossRef]
- Croes, R.; Kubickova, M. From potential to ability to compete: Towards a performance-based tourism competitiveness index. J. Destin. Mark. Manag. 2013, 2, 146–154. [Google Scholar] [CrossRef]
- Pulido-Fernández, J.I.; Rodríguez-Díaz, B. Reinterpreting the World Economic Forum’s global tourism competitiveness index. Tour. Manag. Perspect. 2016, 20, 131–140. [Google Scholar] [CrossRef]
- Aguiar-Barbosa, A.D.; Chim-Miki, A.F.; Kozak, M. Two decades of evolution in tourism competitiveness: A co-word analysis. Int. J. Tour. Cities 2021, 7, 435–462. [Google Scholar] [CrossRef]
- Dwyer, L.; Kim, C. Destination Competitiveness: A Model and Determinants. Curr. Issues Tour. 2003, 6, 369–414. [Google Scholar] [CrossRef]
- Dwyer, L.; Kim, C. Destination competitiveness: Determinants and indicators. Curr. Issues Tour. 2003, 6, 369–414. [Google Scholar] [CrossRef]
- Gooroochurn, N.; Sugiyarto, G. Competitiveness indicators in the travel and tourism industry. Tour. Econ. 2005, 11, 25–43. [Google Scholar] [CrossRef]
- Crouch, G.I.; Ritchie, J.R.B. The Competitive Destination: A Sustainable Tourism Perspective; Centre for Agriculture and Bioscience International: Wallingford, UK, 2003. [Google Scholar]
- Crouch, G.I.; Ritchie, J.R.B. Tourism, competitiveness, and societal prosperity. J. Bus. Res. 1999, 44, 137–152. [Google Scholar] [CrossRef]
- Goffi, G.; Masiero, L.; Cucculelli, M. Fostering tourism destination competitiveness in developing countries: The role of sustainability. J. Clean. Prod. 2019, 209, 101–115. [Google Scholar] [CrossRef]
- Porter, M.E. Competitive Advantage Creating and Sustaining Superior Performance; The Free Press: Cambridge, UK, 1985. [Google Scholar]
- Porter, M.E. New global strategies for competitive advantage. Plan. Rev. 1990, 18, 4–14. [Google Scholar] [CrossRef] [Green Version]
- Porter, M.E. The Competitive Advantage of Nations; Free Press: New York, NY, USA, 1990. [Google Scholar]
- Fernando, I.N.; Long, W. New Conceptual Model on Cluster Competitiveness: A New Paradigm for Tourism? Int. J. Bus. Manag. 2012, 7, 75. [Google Scholar] [CrossRef]
- Hanafiah, M.H.; Hemdi, M.A.; Ahmad, I. Reflections on tourism destination competitiveness (TDC) determinants. Adv. Sci. Lett. 2015, 21, 1571–1574. [Google Scholar] [CrossRef]
- Hanafiah, M.H.M.; Zulkifly, M.I. The Evolution of Tourism Destination Competitiveness (TDC) Models. In Positioning and Branding Tourism Destinations for Global Competitiveness; IGI Global: Hershey, PA, USA, 2019; pp. 23–48. [Google Scholar]
- Cronjé, D.F.; Plessis, E.D. A review on tourism destination competitiveness. J. Hosp. Tour. Manag. 2020, 45, 256–265. [Google Scholar] [CrossRef]
- Buhalis, D. Marketing the competitive destination of the future. Tour. Manag. Spec. Issue Compet. Destin. 2000, 21, 97–116. [Google Scholar] [CrossRef] [Green Version]
- Hassan, S.S. Determinants of market competitiveness in an environmentally sustainable tourism industry. J. Travel Res. 2000, 38, 239–245. [Google Scholar] [CrossRef]
- Vengesayi, S. A conceptual model of tourism destination competitiveness and attractiveness. In Proceedings of the ANZMAC 2003 Conference Proceedings, Adelaide, Australia, 1–3 December 2003; pp. 637–647. [Google Scholar]
- Heath, E. Towards a model to enhance destination competitiveness: A Southern African perspective. J. Hosp. Tour. Manag. 2003, 10, 124–141. [Google Scholar]
- Enright, M.J.; Newton, J. Determinants of tourism destination competitiveness in Asia Pacific: Comprehensiveness and universality. J. Travel Res. 2005, 43, 339–350. [Google Scholar] [CrossRef]
- Cucculelli, M.; Goffi, G. Does Sustainability Enhance Tourism Destination Competitiveness? Evidence from Italian Destinations of Excellence; Elsevier Ltd: Amsterdam, The Netherlands, 2016; Volume 111. [Google Scholar]
- Getz, D. Event tourism: Definition, evolution, and research. Tour. Manag. 2008, 29, 403–428. [Google Scholar] [CrossRef]
- Fitch Solutions. Indonesia Tourism Report Q4—2019; Fitch Solution Group Limited: London, UK, 2019; Available online: https://www.fitchsolutions.com/topic/indonesia (accessed on 24 April 2020).
- Bong, S.; Sugiarto; Lemmy, D.M.; Nursiana, A.; Arianti, S.P. Manajemen Risiko, Krisis, & Bencana untuk Industri Pariwisata Yang Berkelanjutan; Kompas Gramedia: Jakarta, Indonesia, 2014. [Google Scholar]
- Lubis, M.S.; Handayani, N.; Muazir, S. Eco and cultural tourism development in Danau Sentarum national park. In Proceedings of the 13th World Lake Conference, Wuhan, China, 1–5 November 2009; pp. 2–7. [Google Scholar]
- Mazanec, J.A.; Wöber, K.; Zins, A.H. Tourism destination competitiveness: From definition to explanation? J. Travel Res. 2007, 46, 86–95. [Google Scholar] [CrossRef]
- Pansiri, J. Tourist Motives and Destination Competitiveness: A Gap Analysis Perspective. Int. J. Hosp. Tour. Adm. 2014, 15, 217–247. [Google Scholar] [CrossRef]
- Novais, M.A.; Ruhanen, L.; Arcodia, C. Comparing supply and demand perspectives of destination competitiveness. In Proceedings of the TTRA International Conference, Victoria, BC, Canada, 16–18 June 2020; Volume 66. [Google Scholar]
- Swarbrooke, J. Sustainable Tourism Management; CABI Publishing: Wallingford, UK, 1999; pp. 1–371. [Google Scholar]
- White, V.; McCrum, G.; Blackstock, K.; Scott, A. Indicators and Sustainable Tourism; Macaulay Institute: Aberdeen, UK, 2006; Volume 15, p. 21. [Google Scholar]
- Mihalič, T. Performance of Environmental Resources of a Tourist Destination: Concept and Application. J. Travel Res. 2013, 52, 614–630. [Google Scholar] [CrossRef] [PubMed]
- Luo, W. Evaluating tourist destination performance: Expanding the sustainability concept. Sustainability 2018, 10, 516. [Google Scholar] [CrossRef] [Green Version]
- Supriatna, J. Pengelolaan Lingkungan Berkelanjutan; Yayasan Pustaka Obor: Jakarta, Indonesia, 2021. [Google Scholar]
- Nadalipour, Z.; Khoshkhoo, M.H.I.; Eftekhari, A.R. An integrated model of destination sustainable competitiveness. Compet. Rev. 2019, 29, 314–335. [Google Scholar] [CrossRef]
- Dwyer, L.; Edwards, D.; Mistilis, N.; Roman, C. Innovations for Sustainable Tourism Destination and Enterprise Management for a Tourism Future. Tour. Manag. 2009, 30, 63–74. [Google Scholar] [CrossRef] [Green Version]
- Postma, A.; Cavagnaro, E.; Spruyt, E. Sustainable tourism 2040. J. Tour. Futures 2017, 3, 13–22. [Google Scholar] [CrossRef]
- Qian, J.; Shen, H.; Law, R. Research in sustainable tourism: A longitudinal study of articles between 2008 and 2017. Sustainability 2018, 10, 590. [Google Scholar] [CrossRef] [Green Version]
- Streimikiene, D.; Svagzdiene, B.; Jasinskas, E.; Simanavicius, A. Sustainable tourism development and competitiveness: The systematic literature review. Sustain. Dev. 2021, 29, 259–271. [Google Scholar] [CrossRef]
- Liu, Z. Sustainable Tourism Development: A Critique. J. Sustain. Tour. 2003, 11, 459–475. [Google Scholar] [CrossRef] [Green Version]
- Amaya-Molinar, C.M.; Sosa-Ferreira, A.P.; Ochoa-Llamas, I.; Moncada-Jiménez, P. The perception of destination competitiveness by tourists. Rev. Investig. Turísticas 2017, 14, 1–20. [Google Scholar] [CrossRef]
- Kemenparekraf dan Baparekraf. Permen-Parekraf No 9; Ministry of Tourism and Creative Economy: Jakarta, Indonesia, 2021.
- Kozak, M.; Rimmington, M. Measuring tourist destination competitiveness: Conceptual considerations and empirical findings. Int. J. Hosp. Manag. 1999, 18, 273–283. [Google Scholar] [CrossRef]
- Omerzel, D.G. The local business sector’s perception of the competitiveness of Slovenia as a tourist destination. Tourism 2011, 59, 25–46. [Google Scholar]
- Paulina, L.; Sugiarto, S. Strategic Planning in SMEs: A Case Study in Indonesia. J. Asian Financ. Econ. Bus. 2021, 8, 1157–1168. [Google Scholar] [CrossRef]
- Awang, Z.; Afthanorhan, A.; Mohamad, M.; Asri, M.A.M. An evaluation of measurement model for medical tourism research: The confirmatory factor analysis approach. Int. J. Tour. Policy 2015, 6, 29–45. [Google Scholar] [CrossRef]
- Marcoulides, G.A.; Saunders, C. Editor’ s Comments: PLS—A Silver Bullet? MIS Q. 2006, 30, 3–9. [Google Scholar] [CrossRef]
- Myers, N.D.; Ahn, S.; Jin, Y. Sample size and power estimates for a confirmatory factor analytic model in exercise and sport: A monte carlo approach. Res. Q. Exerc. Sport 2011, 82, 412–423. [Google Scholar] [CrossRef] [PubMed]
- Hair, J.F.; Black, W.C.; Babin, B.J.; Anderson, R.E. Multivariate Data Analysis, 7th ed.; Pearson New International: London, UK, 2014. [Google Scholar]
- Martilla, J.A.; James, J.C. Importance-Performance Analysis. J. Mark. 1977, 41, 77–79. [Google Scholar] [CrossRef]
- Chin, W.W. Handbook of Partial Least Squares; Springer: Berlin/Heidelberg, Germany, 2010. [Google Scholar]
- Rigdon, E.E.; Sarstedt, M.; Ringle, C.M. On Comparing Results from CB-SEM and PLS-SEM: Five Perspectives and Five Recommendations. Mark. ZFP 2017, 39, 4–16. [Google Scholar] [CrossRef]
- Hair, J.F.; Matthews, L.M.; Matthews, R.L.; Sarstedt, M. PLS-SEM or CB-SEM: Updated guidelines on which method to use. Int. J. Multivar. Data Anal. 2017, 1, 107–123. [Google Scholar] [CrossRef]
- Hair, J.F.; Hult, G.T.M.; Ringle, C.M.; Sarstedt, M. A Primer on Partial Least Squares Structural Equation Modelling (PLS-SEM), 2nd ed.; SAGE Publications Inc.: Thousand Oaks, CA, USA, 2017. [Google Scholar]
- Sarstedt, M.; Hair, J.F.; Cheah, J.H.; Becker, J.M.; Ringle, C.M. How to specify, estimate, and validate higher-order constructs in PLS-SEM. Australas. Mark. J. 2019, 27, 197–211. [Google Scholar] [CrossRef]
- Hair, J.F., Jr.; Hult, G.T.M.; Ringle, C.M.; Sarstedt, M.; Danks, N.P.; Ray, S. Partial Least Squares Structural Equation Modeling (PLS-SEM) Using R: A Workbook; Springer: Cham, Switzerland, 2021. [Google Scholar]
- Hair, J.F.; Risher, J.J.; Sarstedt, M.; Ringle, C.M. When to use and how to report the results of PLS-SEM. Eur. Bus. Rev. 2019, 31, 2–24. [Google Scholar] [CrossRef]
- Hair, J.F.; Ringle, C.M.; Sarstedt, M. PLS-SEM: Indeed a silver bullet. J. Mark. Theory Pract. 2011, 19, 139–152. [Google Scholar] [CrossRef]
- Lesmana, H.; Sugiarto, S. Formulating A Competitive Advantage Model for Tourism Destinations in Indonesia. J. Asian Financ. Econ. Bus. 2021, 8, 237–250. [Google Scholar] [CrossRef]
- Díaz, M.R.; Espino-Rodríguez, T.F. Determining the sustainability factors and performance of a tourism destination from the stakeholders’ perspective. Sustainability 2016, 8, 951. [Google Scholar] [CrossRef] [Green Version]
- Crouch, G.I. Destination competitiveness: An analysis of determinant attributes. J. Travel Res. 2011, 50, 27–45. [Google Scholar] [CrossRef]
- Paunović, I.; Dressler, M.; Nikolić, T.M.; Pantić, S.P. Developing a competitive and sustainable destination of the future: Clusters and predictors of successful national-level destination governance across destination life-cycle. Sustainability 2020, 12, 4066. [Google Scholar] [CrossRef]


| No | Destination | Sample Collected | Sample Validated | ||||||||
|---|---|---|---|---|---|---|---|---|---|---|---|
| Supply-1 | Supply-2 | Domestic Tourist | Foreign Tourists | TOTAL | Supply-1 | Supply-2 | Domestic Tourists | Foreign Tourists | TOTAL | ||
| 1 | Lake Toba | 11 | 23 | 102 | 55 | 264 | 11 | 23 | 94 | 48 | 246 |
| 2 | Borobudur-Prambanan-Mendut | 11 | 22 | 135 | 49 | 278 | 11 | 20 | 127 | 49 | 268 |
| 3 | Bali | 11 | 27 | 119 | 85 | 349 | 10 | 25 | 112 | 56 | 292 |
| 4 | Lombok | 8 | 23 | 90 | 40 | 228 | 8 | 21 | 89 | 22 | 201 |
| 5 | Labuan Bajo | 11 | 20 | 71 | 48 | 218 | 11 | 20 | 68 | 47 | 213 |
| 6 | Manado-Likupang-Bitung | 13 | 20 | 70 | 40 | 207 | 11 | 19 | 67 | 29 | 186 |
| 65 | 135 | 587 | 317 | 1104 | 62 | 128 | 557 | 251 | 998 | ||
| No | Respondent Type | Bali | Borobudur | Danau Toba | Labuan Bajo | Lombok | Manado | Grand Total |
|---|---|---|---|---|---|---|---|---|
| 1 | Tour Leader | 1 | 6 | 4 | 6 | 4 | 13 | 34 |
| 2 | Travel agent | 7 | 7 | 3 | 6 | 9 | 2 | 34 |
| 3 | Hotel and Resort | 9 | 8 | 5 | 2 | 5 | 3 | 32 |
| 4 | Restaurant | 1 | 4 | 5 | 1 | 7 | 2 | 20 |
| 5 | Transportation | 1 | 3 | 5 | 1 | 2 | 3 | 15 |
| 6 | Others | 1 | 4 | 3 | 8 | |||
| 7 | Artist | 1 | 2 | 1 | 1 | 5 | ||
| 8 | Boat operator | 4 | 4 | |||||
| 9 | Theme park | 1 | 1 | 2 | 4 | |||
| 10 | SME Entrepreneur | 3 | 3 | |||||
| 11 | Dive operator | 3 | 3 | |||||
| 12 | Academician | 2 | 1 | 3 | ||||
| 13 | Tourism development corporation | 1 | 2 | 3 | ||||
| 14 | MICE | 3 | 3 | |||||
| 15 | Manager, BPODT | 3 | 3 | |||||
| 16 | Hospitality | 1 | 1 | 2 | ||||
| 17 | Chairman, IHGMA | 1 | 1 | |||||
| 18 | Managing Director, BPODT | 1 | 1 | |||||
| 19 | BPPD | 1 | 1 | |||||
| 20 | Sales and Marketing | 1 | 1 | |||||
| 21 | Managing Director, ITDC | 1 | 1 | |||||
| 22 | Chairman, Tourism Village Association | 1 | 1 | |||||
| 23 | Chairman, ASITA | 1 | 1 | |||||
| 24 | Supermarket | 1 | 1 | |||||
| 25 | Secretary of Tourism Office (Government) | 1 | 1 | |||||
| 26 | Bali Tourism Board | 1 | 1 | |||||
| 27 | Media/Journalist | 1 | 1 | |||||
| 28 | VP SIPCO | 1 | 1 | |||||
| 29 | Food and Beverage | 1 | 1 | |||||
| 30 | Secretary HPI | 1 | 1 | |||||
| Grand Total | 35 | 31 | 34 | 31 | 29 | 30 | 190 |
| Code | Indicator In Supply Side | Performance | Importance | Quadr B | Quadr A |
|---|---|---|---|---|---|
| KAL1 | Comfortable climate for tourism | 4.14 | 4.38 | ||
| KAL2 | Cleanliness/sanitation | 3.70 | 4.80 | v | |
| KAL3 | Natural wonders/scenery | 4.48 | 4.67 | v | |
| KAL4 | Flora and fauna | 4.04 | 4.29 | ||
| KAL5 | Unspoiled nature/green areas | 3.84 | 4.36 | ||
| KAL6 | National park/natural reserves | 3.82 | 4.45 | ||
| KAL7 | Ecotourism | 3.76 | 4.59 | v | |
| KBUD1 | Historic/heritage sites and museums | 3.78 | 4.45 | ||
| KBUD2 | Artistic/architectural features | 3.85 | 4.41 | ||
| KBUD3 | Traditional arts | 4.05 | 4.58 | v | |
| KBUD4 | Traditional cuisine | 3.88 | 4.43 | ||
| KBUD5 | Cultural precincts and folk villages | 3.87 | 4.54 | v | |
| KBUD6 | Local wisdom | 3.99 | 4.65 | v | |
| KAK1 | Water-based activities | 3.95 | 4.41 | ||
| KAK2 | Nature-based activities | 4.17 | 4.57 | v | |
| KAK3 | Adventure-based activities | 3.97 | 4.44 | ||
| KAK4 | Recreation facilities | 3.63 | 4.59 | v | |
| KAK5 | Sports facilities | 3.25 | 4.15 | ||
| KAK6 | Culturally-based activities | 3.70 | 4.58 | v | |
| KBEL1 | Variety of shopping items | 3.73 | 4.31 | ||
| KBEL2 | Value for money of shopping items | 3.63 | 4.38 | ||
| KBEL3 | Quality of shopping items | 3.72 | 4.36 | ||
| KBEL4 | Quality/variety of local handicrafts | 3.90 | 4.54 | v | |
| KHIB1 | Entertainment quality/variety/leisure activities | 3.68 | 4.37 | ||
| KHIB2 | Amusement/theme park | 3.23 | 4.05 | ||
| KHIB3 | Nightlife | 3.41 | 3.93 | ||
| KHIB4 | Festival | 3.44 | 4.32 | ||
| KHIB5 | Carnival | 3.31 | 4.16 | ||
| KHIB6 | Hallmark event | 3.27 | 4.14 | ||
| KHIB7 | Concert | 3.19 | 3.89 | ||
| KHIB8 | MICE | 3.58 | 4.21 | ||
| KHIB9 | Culinary | 3.90 | 4.59 | v | |
| KHIB10 | Cultural events | 3.92 | 4.51 | v | |
| KIU1 | Adequacy of infrastructure to meet visitor needs | 3.56 | 4.66 | v | |
| KIU2 | Health/medical facilities to serve tourists | 3.31 | 4.64 | v | |
| KIU3 | Financial institution and currency exchange facilities | 3.57 | 4.53 | v | |
| KIU4 | Telecommunication system for tourists | 3.75 | 4.61 | v | |
| KIU5 | Quality of local transport system | 3.60 | 4.56 | v | |
| KIU6 | Quality of payment system services | 3.67 | 4.55 | v | |
| KIW1 | Accommodation quality/variety | 3.94 | 4.54 | v | |
| KIW2 | Airport efficiency/quality | 3.86 | 4.64 | v | |
| KIW3 | Number of operating airlines | 3.54 | 4.60 | v | |
| KIW4 | Sea transport efficiency/quality | 3.53 | 4.43 | ||
| KIW5 | Local transport efficiency/quality | 3.75 | 4.60 | v | |
| KIW6 | Tourist guidance/information | 3.65 | 4.76 | v | |
| KIW7 | Convention/exhibition facilities (capacity/quality) | 3.67 | 4.43 | ||
| KAKS1 | Ease/cost of obtaining visa | 3.65 | 4.42 | ||
| KAKS2 | Ease of combining travel to destination with other destinations | 3.72 | 4.52 | v | |
| KAKS3 | Frequency/capacity of access transport to destination | 3.58 | 4.52 | v | |
| KAKS4 | Accessibility of facilities for people with disabilities | 3.08 | 4.51 | ||
| KLY1 | Level of professional skill in tourism | 3.82 | 4.74 | v | |
| KLY2 | Attitudes of custom/immigration officials | 3.54 | 4.56 | v | |
| KLY3 | Tourist-oriented services | 3.72 | 4.64 | v | |
| KLY4 | Friendliness of residents toward tourists | 4.24 | 4.79 | v | |
| KLY5 | Over-tourism in destination | 3.66 | 4.59 | v | |
| KDMO1 | Role of NTO/DMO in planning, developing, coordinating, and implementing strategy in tourism | 3.64 | 4.66 | v | |
| KDMO2 | NTO/DMO strategic monitoring and evaluation of the nature and type of tourism development | 3.75 | 4.65 | v | |
| KDMO3 | Existence of a formal long-term vision for tourism industry development | 3.75 | 4.67 | v | |
| KSDM1 | Public sector commitment to tourism/hospitality education and training | 3.65 | 4.69 | v | |
| KSDM2 | Private sector commitment to tourism/hospitality education and training | 3.66 | 4.63 | v | |
| KSDM3 | Quality of certified human resources in tourist industry | 3.70 | 4.64 | v | |
| KSDM4 | Quantity of certified human resources in tourist industry | 3.58 | 4.62 | v | |
| KLI1 | Public sector recognition of importance of sustainable tourism development | 3.64 | 4.67 | v | |
| KLI2 | Private sector recognition of importance of sustainable tourism development | 3.68 | 4.62 | v | |
| KLI3 | Existence of laws and regulations protecting the environment and heritage | 3.64 | 4.64 | v | |
| KLI4 | Research and monitoring of environmental impacts of tourism | 3.51 | 4.61 | v | |
| KBI1 | Management capabilities of tourism firms | 3.69 | 4.72 | v | |
| KBI2 | Firms use of computer technology/commerce to achieve competitive advantage | 3.57 | 4.57 | v | |
| KPEM1 | Political stability | 3.68 | 4.43 | ||
| KPEM2 | Legal/regulatory environment | 3.70 | 4.56 | v | |
| KPEM3 | Government policies for tourism development | 3.63 | 4.62 | v | |
| KPEM4 | Sociocultural environment | 3.93 | 4.64 | v | |
| KPEM5 | Investment environment for tourism development | 3.63 | 4.60 | v | |
| KPEM6 | Support for IT infrastructure for tourism development | 3.44 | 4.62 | v | |
| KPEM7 | Integrated approach to tourism planning | 3.41 | 4.58 | v | |
| KPEM8 | Investment in tourist industry from domestic sources | 3.51 | 4.48 | ||
| KPEM9 | Foreign direct investment in tourism industry | 3.52 | 4.29 | ||
| KPEM10 | Access to venture capital | 3.45 | 4.58 | v | |
| KPEM11 | Support for transport infrastructure | 3.45 | 4.70 | v | |
| KPEM12 | Implementation of the tourism policy for the benefit of the community | 3.52 | 4.63 | v | |
| KLO1 | Perceived exoticness of location | 4.13 | 4.48 | ||
| KLO2 | Proximity to other destinations | 4.00 | 4.33 | ||
| KLO3 | Distance from major origin markets | 3.66 | 4.00 | ||
| KLO4 | Travel time from major origin markets | 3.66 | 4.05 | ||
| KHA1 | Value for money in destination tourism | 3.90 | 4.49 | ||
| KHA2 | Exchange rate | 3.67 | 4.40 | ||
| KHA3 | Air ticket prices from major origin markets | 3.71 | 4.35 | ||
| KHA4 | Accommodation prices | 3.99 | 4.47 | ||
| KHA5 | Destination package tour prices | 3.89 | 4.54 | v | |
| KHA6 | Price of destination visits relative to competitor destinations | 3.82 | 4.38 | ||
| KHA7 | Labor costs | 3.68 | 4.53 | v | |
| KSEL1 | Level of visitor safety in destination | 4.02 | 4.89 | v | |
| KSEL2 | Reliability of police services | 3.62 | 4.74 | v | |
| KSEL3 | Safety standard of land, sea, and air transport | 3.76 | 4.89 | v | |
| KSEL4 | Mitigation measures for natural disasters | 3.75 | 4.73 | v | |
| KSEL5 | Mitigation measures for terrorist attacks | 3.69 | 4.72 | v | |
| KDEM1 | Destination awareness of tourists | 3.89 | 4.60 | v | |
| KDEM2 | Destination perception of tourists | 3.97 | 4.62 | v | |
| KDEM3 | Destination preference of tourists | 4.00 | 4.61 | v | |
| KDEM4 | Tourists’ respect for local traditions and values | 4.12 | 4.64 | v | |
| KDEM5 | Tourists’ environmental awareness | 4.07 | 4.74 | v | |
| KDEM6 | Level of repeat visitors | 3.91 | 4.68 | v | |
| Mean 190 respondents | 3.72 | 4.52 | 30 | 35 |
| Sample | % | Sample | % |
|---|---|---|---|
| Sex | Marital status | ||
| Male | 49.0 | Single | 49.2 |
| Female | 51.0 | Married | 49.4 |
| Divorced | 1.4 | ||
| Age | |||
| 15–24 | 18.5 | Occupation | |
| 25–34 | 53.0 | Employed | 68.9 |
| 35–44 | 20.8 | Unemployed | 6.8 |
| 45–54 | 5.7 | Student | 16.0 |
| 55–64 | 2.0 | Retired | 0.7 |
| Other | 7.5 | ||
| Education | |||
| High School | 25.0 | Average travel per year | |
| Diploma | 14.5 | 1× | 30.3 |
| Bachelor’s | 54.9 | 2× | 34.5 |
| Master’s | 5.2 | 3× | 14.7 |
| Doctorate | 0.4 | >3× | 20.5 |
| Average spending per travel event (IDR) | Number of visits to each destination | ||
| <5 | 47.0 | 1× | 56.4 |
| 5.01–10 | 40.2 | 1–3× | 29.4 |
| 10.01–15 | 7.7 | >3× | 14.2 |
| 15.01–20 | 3.1 | ||
| 20.01–25 | 1.1 | ||
| >25.01 | 0.9 |
| Sample | % | Sample | % |
|---|---|---|---|
| Sex | Marital status | ||
| Male | 53.8 | Single | 48.6 |
| Female | 46.2 | Married | 41.8 |
| Divorced | 5.6 | ||
| Other | 4.0 | ||
| Age | Occupation | ||
| 15–24 | 7.6 | Employed | 55.7 |
| 25–34 | 47.0 | Unemployed | 7.2 |
| 35–44 | 21.9 | Student | 6.0 |
| 45–54 | 12.7 | Retired | 3.2 |
| 55–64 | 10.0 | Other | 27.9 |
| NA | 0.8 | ||
| Education | Average travel per year | ||
| High School | 9.2 | 1× | 17.9 |
| Diploma | 17.1 | 2× | 39.8 |
| Bachelor’s | 38.2 | 3× | 19.1 |
| Master’s | 27.5 | >3× | 23.1 |
| Doctorate | 5.6 | ||
| NA | 2.4 | ||
| Average spending per travel (USD) | Number of visits to each destination | ||
| <1000 | 21.1 | 1× | 65.3 |
| 1000.01–2000 | 26.3 | 1–3× | 25.9 |
| 2000.01–3000 | 15.1 | >3× | 8.0 |
| 3000.01–4000 | 5.2 | NA | 0.8 |
| 4000.01–5000 | 6.8 | ||
| 5000.01–6000 | 4.4 | ||
| 6000.01–7000 | 2.4 | ||
| >7000 | 13.5 | ||
| NA | 5.2 |
| Code | Indicators From Demand Side | Performance | Importance | Quadr B | Quadr A |
|---|---|---|---|---|---|
| Kal1 | Comfortable Climate For Tourism | 3.99 | 4.22 | ||
| Kal2 | Cleanliness/Sanitation | 3.71 | 4.56 | V | |
| Kal3 | Natural Wonders/Scenery | 4.42 | 4.61 | V | |
| Kal4 | Flora And Fauna | 3.87 | 4.10 | ||
| Kal5 | Unspoiled Nature/Green Areas | 3.81 | 4.20 | ||
| Kal6 | National Park/Natural Reserves | 3.81 | 4.14 | ||
| Kal7 | Ecotourism | 3.82 | 4.25 | V | |
| Kbud1 | Historic/Heritage Sites And Museums | 3.80 | 4.10 | ||
| Kbud2 | Artistic/Architectural Features | 3.87 | 4.10 | ||
| Kbud3 | Traditional Arts | 3.99 | 4.20 | ||
| Kbud4 | Traditional Cuisine | 4.03 | 4.37 | V | |
| Kbud5 | Cultural Precincts And Folk Villages | 3.86 | 4.18 | ||
| Kbud6 | Local Wisdom | 3.97 | 4.28 | V | |
| Kak1 | Water-Based Activities | 4.04 | 4.23 | ||
| Kak2 | Nature-Based Activities | 4.18 | 4.47 | V | |
| Kak3 | Adventure-Based Activities | 4.02 | 4.26 | V | |
| Kak4 | Recreation Facilities | 3.83 | 4.25 | V | |
| Kak5 | Sports Facilities | 3.39 | 3.65 | ||
| Kak6 | Culturally-Based Activities | 3.76 | 4.14 | ||
| Kbel1 | Quality Of Shopping Items | 3.65 | 4.03 | ||
| Kbel2 | Variety Of Shopping Items | 3.64 | 3.96 | ||
| Kbel3 | Value For Money Of Shopping Items | 3.64 | 4.08 | ||
| Kbel4 | Quality Of Shopping Facilities | 3.59 | 3.98 | ||
| Kbel5 | Quality Of Local Handicrafts | 3.76 | 4.19 | ||
| Kbel6 | Variety Of Local Handicrafts | 3.73 | 4.08 | ||
| Khib1 | Entertainment Quality/Variety/Leisure Activities | 3.71 | 4.13 | ||
| Khib2 | Amusement/Theme Park | 3.48 | 3.79 | ||
| Khib3 | Nightlife | 3.55 | 3.70 | ||
| Khib4 | Festival | 3.50 | 3.80 | ||
| Khib5 | Carnival | 3.38 | 3.65 | ||
| Khib6 | Hallmark Event | 3.52 | 3.79 | ||
| Khib7 | Concert | 3.36 | 3.49 | ||
| Khib8 | Mice | 3.46 | 3.65 | ||
| Khib9 | Culinary | 3.92 | 4.28 | V | |
| Khib10 | Cultural Events | 3.71 | 4.08 | ||
| Kiu1 | Adequacy Of Infrastructure To Meet Visitor Needs | 3.67 | 4.37 | V | |
| Kiu2 | Health/Medical Facilities To Serve Tourists | 3.50 | 4.39 | V | |
| Kiu3 | Financial Institution And Currency Exchange Facilities | 3.58 | 4.29 | V | |
| Kiu4 | Telecommunication System For Tourists | 3.63 | 4.38 | V | |
| Kiu5 | Quality Of Payment System Services | 3.68 | 4.40 | V | |
| Kiw1 | Accommodation Quality | 3.84 | 4.43 | V | |
| Kiw2 | Accommodation Variety | 3.74 | 4.34 | V | |
| Kiw3 | Airport Efficiency | 3.78 | 4.45 | V | |
| Kiw4 | Airport Quality | 3.85 | 4.41 | V | |
| Kiw5 | Number Of Operating Airlines | 3.69 | 4.29 | V | |
| Kiw6 | Sea Transport Efficiency | 3.60 | 4.24 | V | |
| Kiw7 | Sea Transport Quality | 3.61 | 4.25 | V | |
| Kiw8 | Local Transport Efficiency | 3.64 | 4.36 | V | |
| Kiw9 | Local Transport Quality | 3.60 | 4.39 | V | |
| Kiw10 | Tourist Guidance/Information | 3.70 | 4.41 | V | |
| Kiw11 | Convention/Exhibition Quality | 3.55 | 4.08 | ||
| Kiw12 | Convention/Exhibition Capacity | 3.55 | 4.04 | ||
| Kaks1 | Ease/Cost Of Obtaining Visa | 3.76 | 4.47 | V | |
| Kaks2 | Ease Of Combining Travel To Destination With Other Destinations | 3.65 | 4.38 | V | |
| Kaks3 | Frequency/Capacity Of Access Transport To Destination | 3.60 | 4.32 | V | |
| Kaks4 | Accessibility Of Facilities For People With Disabilities | 3.22 | 4.23 | ||
| Kly1 | Level Of Professional Skill In Tourism | 3.82 | 4.48 | V | |
| Kly2 | Attitudes Of Custom/Immigration Officials | 3.77 | 4.51 | V | |
| Kly3 | Tourist-Oriented Services | 3.80 | 4.41 | V | |
| Kly4 | Friendliness Of Residents Towards Tourists | 4.04 | 4.52 | V | |
| Kly5 | Over-Tourism In Destination | 3.63 | 4.40 | V | |
| Kdmo1 | Well-Advertised And Promoted Destination | 3.80 | 4.25 | V | |
| Kdmo2 | Existence Of Visitor Information Center/Call Center/Interpretation Center And An Officer At The Destination | 3.60 | 4.24 | V | |
| Kdmo3 | Existence Of Universal Pricing Allowing Rotating Access By Day, Week, Origin Of Visitor, Or Unit Pricing (Per Activity) | 3.54 | 3.94 | ||
| Kdmo4 | Pre-Visitation Reservation System | 3.64 | 4.07 | ||
| Kdmo5 | Destination Provides An Enjoyable And Memorable Experience | 4.08 | 4.45 | V | |
| Kdmo6 | The Physical And Ecological Integrity Of The Natural Environment | 3.83 | 4.40 | V | |
| Kdmo7 | The Physical And Ecological Integrity Of The Built Environment | 3.68 | 4.25 | V | |
| Kdmo8 | The Physical And Ecological Integrity Of The Cultural And Social Environment | 3.84 | 4.30 | V | |
| Kdmo9 | Existence Of Facilities That Reflect The Destination | 3.88 | 4.32 | V | |
| Kdmo10 | Existence Of Attractive Events That Reflect The Destination | 3.80 | 4.24 | V | |
| Ksdm1 | Public Sector Commitment To Tourism/Hospitality Education And Training | 3.46 | 4.29 | V | |
| Ksdm2 | Private Sector Commitment To Tourism/Hospitality Education And Training | 3.54 | 4.21 | ||
| Ksdm3 | The Importance Of Certification Of Professionalism In Tourism | 3.40 | 4.13 | ||
| Kli1 | Public Sector Recognition Of Importance Of Sustainable Tourism Development | 3.48 | 4.41 | V | |
| Kli2 | Private Sector Recognition Of Importance Of Sustainable Tourism Development | 3.52 | 4.30 | V | |
| Kli3 | Existence Of Laws And Regulations Protecting The Environment And Heritage | 3.40 | 4.39 | V | |
| Kli4 | Research And Monitoring Of Environmental Impacts Of Tourism | 3.40 | 4.32 | V | |
| Kbi1 | Management Capabilities Of Tourism Firms | 3.49 | 4.17 | ||
| Kbi2 | Firms Use Of Computer Technology/Commerce To Achieve Competitive Advantage | 3.37 | 4.19 | ||
| Kpem1 | Political Stability | 3.49 | 4.13 | ||
| Kpem2 | Legal/Regulatory Environment | 3.43 | 4.24 | V | |
| Kpem3 | Sociocultural Environment | 3.69 | 4.30 | V | |
| Kpem4 | Support For It Infrastructure For Tourism Development | 3.41 | 4.27 | V | |
| Kpem5 | Integrated Approach To Tourism Planning | 3.42 | 4.20 | ||
| Kpem6 | Investment In Tourist Industry From Domestic Firms/Sources | 3.50 | 4.21 | ||
| Kpem7 | Foreign Direct Investment In Tourist Industry | 3.46 | 3.78 | ||
| Kpem8 | Quality Of Life Of The Communities Around Tourist Destination | 3.46 | 4.33 | V | |
| Klo1 | Perceived Exoticness Of Location | 4.00 | 4.41 | V | |
| Klo2 | Proximity To Other Destinations | 3.70 | 4.19 | ||
| Klo3 | Distance From Major Origin Markets | 3.62 | 4.07 | ||
| Klo4 | Travel Time From Major Origin Markets | 3.63 | 4.06 | ||
| Kha1 | Value For Money In Destination Tourism | 3.79 | 4.34 | V | |
| Kha2 | Exchange Rate | 3.61 | 4.04 | ||
| Kha3 | Air Ticket Prices From Major Origin Markets | 3.56 | 4.30 | V | |
| Kha4 | Accommodation Prices | 3.71 | 4.31 | V | |
| Kha5 | Destination Package Tour Prices | 3.68 | 4.18 | ||
| Kha6 | Price Of Destination Visit Relative To Competitor Destinations | 3.66 | 4.23 | ||
| Ksel1 | Level Of Visitor Safety In Destination | 3.82 | 4.62 | V | |
| Ksel2 | Reliability Of Police Services | 3.58 | 4.50 | V | |
| Ksel3 | Safety Standard Of Land, Sea, And Air Transport | 3.70 | 4.57 | V | |
| Ksel4 | Mitigation Measures For Natural Disasters | 3.65 | 4.50 | V | |
| Ksel5 | Mitigation Measures For Terrorist Attacks | 3.61 | 4.50 | V | |
| Ksel6 | Mitigation Measures For Wild Animals | 3.55 | 4.44 | V | |
| Ksel7 | Mitigation Measures For Poisonous Plants | 3.48 | 4.36 | V | |
| Kdem1 | Destination Awareness Of Tourists | 3.82 | 4.28 | V | |
| Kdem2 | Destination Perception Of Tourists | 3.85 | 4.28 | V | |
| Kdem3 | Destination Preference Of Tourists | 3.85 | 4.30 | V | |
| Kdem4 | Tourists’ Respect For Local Traditions And Values | 3.95 | 4.38 | V | |
| Kdem5 | Tourist’ Environmental Awareness | 3.80 | 4.33 | V | |
| Kdem6 | Level Of Your Return/Revisit | 4.10 | 4.35 | V | |
| Mean 808 Respondents | 3.69 | 4.24 | 35 | 28 |
| No | Respondent Type | ∑ Respondent | Mean Importance | Mean Performance | ∑ Indicator in Quadrant B | ∑ Indicator in Quadrant A | ∑ Indicator in Quadrant B + A |
|---|---|---|---|---|---|---|---|
| 1 | Supply side | 190 | 4.52 | 3.72 | 30 | 35 | 65 |
| 2 | Demand side (Total) | 808 | 4.24 | 3.69 | 38 | 28 | 66 |
| KMO and Bartlett’s Test | ||
|---|---|---|
| Kaiser–Meyer–Olkin Measure of Sampling Adequacy. | 0.965 | |
| Bartlett’s Test of Sphericity | Approx. Chi-Square | 40,128.725 |
| df | 2145 | |
| Sig. | 0.000 | |
| Goodness-of-Fit Test | ||
| Chi-Square | df | Sig. |
| 4489.373 | 1419 | 0.000 |
| NO | DIMENSION | NO | CODE | INDICATOR |
|---|---|---|---|---|
| 1 | Core Attractors (Natural, Cultural, and Activities) | 1 | KCA1 | Nature-based activities ** |
| 2 | KCA2 | Adventure-based activities ** | ||
| 3 | KCA3 | Recreation facilities ** | ||
| 4 | KCA4 | Natural wonders/scenery ** | ||
| 5 | KCA5 | Traditional cuisine ** | ||
| 2 | Basic Tourism Infrastructure | 1 | KBTI1 | Quality of payment system services * |
| 2 | KBTI2 | Financial institution and currency exchange facilities * | ||
| 3 | KBTI3 | Health/medical facilities to serve tourists * | ||
| 4 | KBTI4 | Telecommunication system for tourists * | ||
| 5 | KBTI5 | Adequacy of infrastructure to meet visitor needs * | ||
| 3 | Accessibility | 1 | KAE1 | Ease of combining travel to destinations * |
| 2 | KAE2 | Frequency/capacity of access to transport to destinations * | ||
| 3 | KAE3 | Ease/cost of obtaining visa ** | ||
| 4 | KAE4 | Tourist guidance/information ** | ||
| 4 | Quality of Airport | 1 | KQA1 | Airport quality ** |
| 2 | KQA2 | Number of operating airlines ** | ||
| 3 | KQA3 | Airport efficiency ** | ||
| 5 | Quality of Land and Sea Transportation System | 1 | KQLST1 | Land transport quality * |
| 2 | KQLST2 | Land transport efficiency * | ||
| 3 | KQLST3 | Sea transport quality * | ||
| 4 | KQLST4 | Sea transport efficiency * | ||
| 6 | Quality of Accommodation | 1 | KQAcc1 | Accommodation quality ** |
| 2 | KQAcc2 | Accommodation variety ** | ||
| 7 | Quality of Service | 1 | KQS1 | Attitudes of customs/immigration officials ** |
| 2 | KQS2 | Level of professional skills in tourism ** | ||
| 3 | KQS3 | Tourist-oriented services ** | ||
| 4 | KQS4 | Friendliness of residents towards tourists/hospitality of residents ** | ||
| 5 | KQS5 | Over-tourism in destination (crowded, queuing, etc.) * | ||
| 8 | Price Competitiveness | 1 | KPC1 | Accommodation prices |
| 2 | KPC2 | Air ticket prices from major origin markets * | ||
| 3 | KPC3 | Value for money in tourism destination ** | ||
| 9 | DMO’s Role and Activities | 1 | KDMO1 | Existence of facilities that reflect the destination ** |
| 2 | KDMO2 | The physical and ecological integrity of the cultural and social environment ** | ||
| 3 | KDMO3 | Existence of attractive events that reflect the destination *** | ||
| 4 | KDMO4 | The physical and ecological integrity of the built environment * | ||
| 5 | KDMO5 | The physical and ecological integrity of the natural environment ** | ||
| 6 | KDMO6 | Destination provides an enjoyable and memorable experience ** | ||
| 7 | KDMO7 | Well-advertised and promoted destination ** | ||
| 8 | KDMO8 | Existence of visitor information center/call center/interpretation center and an officer at the destination * | ||
| 9 | KDMO9 | Local wisdom (spiritual, individual, communal, global ethics) ** | ||
| 10 | KDMO10 | Culinary facilities *** | ||
| 10 | Tourism Policy and Government Support | 1 | KEMCS1 | Public sector recognition of importance of sustainable tourism development * |
| 2 | KEMCS2 | Private sector recognition of importance of sustainable tourism development * | ||
| 3 | KEMCS3 | Existence of laws and regulation protecting the environment and heritage * | ||
| 4 | KEMCS4 | Research and monitoring of environmental impacts of tourism * | ||
| 5 | KEMCS5 | Public sector commitment to tourism/hospitality education and training * | ||
| 6 | KEMCS6 | Legal/regulatory environment * | ||
| 7 | KEMCS7 | Support for IT infrastructure for tourism development * | ||
| 8 | KEMCS8 | Quality of life of the communities around the tourism destination (implementation of tourism policy) * | ||
| 9 | KEMCS9 | Cleanliness/sanitation ** | ||
| 10 | KEMCS10 | Sociocultural environment ** | ||
| 11 | Safety and Security | 1 | KSS1 | Mitigation measures for wild animals * |
| 2 | KSS2 | Mitigation measures for poisonous plants * | ||
| 3 | KSS3 | Mitigation measures for terrorist attacks * | ||
| 4 | KSS4 | Mitigation measures for natural disasters * | ||
| 5 | KSS5 | Reliability of police services * | ||
| 6 | KSS6 | Level of visitor safety in destination ** | ||
| 7 | KSS7 | Safety standard of land, sea, and air transport ** | ||
| 12 | Demand Factors | 1 | KDEM1 | Destination perception of tourists ** |
| 2 | KDEM2 | Destination preference of tourists ** | ||
| 3 | KDEM3 | Destination awareness of tourists ** | ||
| 4 | KDEM4 | Tourists’ respect for local traditions ** | ||
| 5 | KDEM5 | Tourists’ environmental awareness ** | ||
| 6 | KDEM6 | Level of tourist return/revisit ** | ||
| 7 | KDEM7 | Perceived exoticness of location ** |
| No | Loading Factor | Code—Loading Factor | Description of Indicator |
|---|---|---|---|
| 1 | <0.50 | KDMO-3 = 0.478 | The existence of attractive events that reflect the destination |
| 2 | <0.55 | KDMO-10 = 0.522 | Culinary |
| 3 | <0.60 | KCA-4 = 0.575 | Natural wonders/scenery |
| KDMO-6 = 0.563 | Destination provides an enjoyable and memorable experience | ||
| KQS-4 = 0.560 | Friendliness of residents towards tourists/hospitality of residents | ||
| 4 | <0.65 | KDEM-4 = 0.632 | Tourists’ respect for local traditions and values |
| KDMO-9 = 0.634 | Local wisdom (spiritual, personal, communal, global ethics) | ||
| 5 | <0.70 | KEMCS-10 = 0.659 | Sociocultural environment |
| KQS-5 = 0.666 | Over-tourism in destination | ||
| KDMO-7 = 0.674 | Well-advertised and promoted destination | ||
| KDEM-5 = 0.677 | Tourists’ environmental awareness | ||
| KSS-6 = 0.686 | Level of visitor safety in destination |
| Dimension | Indicator | Loading Factor | Cronbach’s Alpha | rho Alpha | CR | AVE |
|---|---|---|---|---|---|---|
| Access | KAE1 | 0.835 | 0.819 | 0.822 | 0.881 | 0.649 |
| KAE2 | 0.843 | |||||
| KAE3 | 0.773 | |||||
| KAE4 | 0.767 | |||||
| Basinfra | KBTI1 | 0.745 | 0.829 | 0.832 | 0.880 | 0.594 |
| KBTI2 | 0.771 | |||||
| KBTI3 | 0.744 | |||||
| KBTI4 | 0.806 | |||||
| KBTI5 | 0.787 | |||||
| CoreAtt | KCA1 | 0.762 | 0.773 | 0.791 | 0.845 | 0.524 |
| KCA2 | 0.787 | |||||
| KCA3 | 0.747 | |||||
| KCA4 | 0.575 | |||||
| KCA5 | 0.727 | |||||
| Demand | KDEM1 | 0.798 | 0.859 | 0.866 | 0.892 | 0.544 |
| KDEM2 | 0.817 | |||||
| KDEM3 | 0.801 | |||||
| KDEM4 | 0.632 | |||||
| KDEM5 | 0.677 | |||||
| KDEM6 | 0.710 | |||||
| KDEM7 | 0.708 | |||||
| DMO’s Role and Activities | KDMO1 | 0.748 | 0.859 | 0.868 | 0.891 | 0.507 |
| KDMO2 | 0.770 | |||||
| KDMO4 | 0.766 | |||||
| KDMO5 | 0.776 | |||||
| KDMO6 | 0.559 | |||||
| KDMO7 | 0.679 | |||||
| KDMO8 | 0.733 | |||||
| KDMO9 | 0.636 | |||||
| Tourism Policy and Government Support | KEMCS1 | 0.808 | 0.926 | 0.927 | 0.938 | 0.602 |
| KEMCS10 | 0.659 | |||||
| KEMCS2 | 0.768 | |||||
| KEMCS3 | 0.789 | |||||
| KEMCS4 | 0.812 | |||||
| KEMCS5 | 0.780 | |||||
| KEMCS6 | 0.796 | |||||
| KEMCS7 | 0.792 | |||||
| KEMCS8 | 0.785 | |||||
| KEMCS9 | 0.757 | |||||
| PriceComp | KPC1 | 0.804 | 0.746 | 0.757 | 0.854 | 0.662 |
| KPC2 | 0.838 | |||||
| KPC3 | 0.798 | |||||
| QualAirport | KQA1 | 0.866 | 0.856 | 0.856 | 0.912 | 0.776 |
| KQA2 | 0.890 | |||||
| KQA3 | 0.887 | |||||
| QualAccom | KQAcc1 | 0.894 | 0.744 | 0.744 | 0.887 | 0.796 |
| KQAcc2 | 0.890 | |||||
| QualSea-LandTrans | KQLST1 | 0.848 | 0.859 | 0.860 | 0.905 | 0.703 |
| KQLST2 | 0.808 | |||||
| KQLST3 | 0.867 | |||||
| KQLST4 | 0.831 | |||||
| QualServ | KQS1 | 0.764 | 0.780 | 0.800 | 0.850 | 0.535 |
| KQS2 | 0.816 | |||||
| KQS3 | 0.818 | |||||
| KQS4 | 0.560 | |||||
| KQS5 | 0.666 | |||||
| SafeSec | KSS1 | 0.794 | 0.878 | 0.880 | 0.906 | 0.579 |
| KSS2 | 0.783 | |||||
| KSS3 | 0.797 | |||||
| KSS4 | 0.804 | |||||
| KSS5 | 0.735 | |||||
| KSS6 | 0.686 | |||||
| KSS7 | 0.718 |
| Access | Basinfra | CoreAtt | DMO’s Role and Acti | Demand | Touri Policy and Gove Sup | Price-Comp | Qual-Accom | Qual-Airport | QualSea-LandTrans | Qual-Serv | SafeSec | |
|---|---|---|---|---|---|---|---|---|---|---|---|---|
| Access | 0.805 | |||||||||||
| Basinfra | 0.655 | 0.771 | ||||||||||
| CoreAtt | 0.505 | 0.498 | 0.724 | |||||||||
| DMO’s Role and Acti | 0.618 | 0.680 | 0.500 | 0.712 | ||||||||
| Demand | 0.638 | 0.606 | 0.521 | 0.656 | 0.738 | |||||||
| Tour Policy and Gove Sup | 0.552 | 0.693 | 0.456 | 0.766 | 0.652 | 0.776 | ||||||
| Price-Comp | 0.529 | 0.438 | 0.362 | 0.491 | 0.529 | 0.416 | 0.814 | |||||
| QualAccom | 0.510 | 0.478 | 0.428 | 0.514 | 0.517 | 0.411 | 0.469 | 0.892 | ||||
| Qual-Airport | 0.515 | 0.547 | 0.399 | 0.471 | 0.447 | 0.487 | 0.372 | 0.327 | 0.881 | |||
| QualSea-LandTrans | 0.639 | 0.673 | 0.464 | 0.647 | 0.606 | 0.668 | 0.447 | 0.459 | 0.500 | 0.839 | ||
| Qual-Serv | 0.626 | 0.530 | 0.469 | 0.598 | 0.552 | 0.504 | 0.545 | 0.571 | 0.487 | 0.489 | 0.732 | |
| SafeSec | 0.595 | 0.619 | 0.455 | 0.611 | 0.679 | 0.699 | 0.494 | 0.430 | 0.451 | 0.592 | 0.458 | 0.761 |
| Access | Basinfra | CoreAtt | DMO’s Role and Act | Demand | Touri Policy and Gove Sup | Price-Comp | Qual-Accom | Qual-Airport | QualSea-LandTrans | Qual-Serv | SafeSec | |
|---|---|---|---|---|---|---|---|---|---|---|---|---|
| Access | ||||||||||||
| Basinfra | 0.787 | |||||||||||
| CoreAtt | 0.621 | 0.596 | ||||||||||
| DMO’s Role and Acti | 0.730 | 0.791 | 0.584 | |||||||||
| Demand | 0.755 | 0.711 | 0.616 | 0.756 | ||||||||
| Touri Policy and Gove Sup | 0.634 | 0.786 | 0.511 | 0.846 | 0.732 | |||||||
| Price-Comp | 0.672 | 0.547 | 0.462 | 0.611 | 0.661 | 0.485 | ||||||
| Qual-Accom | 0.650 | 0.606 | 0.541 | 0.648 | 0.642 | 0.495 | 0.635 | |||||
| Qual-Airport | 0.615 | 0.646 | 0.477 | 0.548 | 0.518 | 0.548 | 0.458 | 0.411 | ||||
| QualSea-LandTrans | 0.759 | 0.793 | 0.549 | 0.746 | 0.703 | 0.749 | 0.549 | 0.574 | 0.583 | |||
| QualServ | 0.775 | 0.632 | 0.593 | 0.711 | 0.663 | 0.558 | 0.719 | 0.750 | 0.584 | 0.582 | ||
| SafeSec | 0.702 | 0.721 | 0.532 | 0.692 | 0.787 | 0.773 | 0.600 | 0.532 | 0.519 | 0.679 | 0.537 |
Publisher’s Note: MDPI stays neutral with regard to jurisdictional claims in published maps and institutional affiliations. |
© 2022 by the authors. Licensee MDPI, Basel, Switzerland. This article is an open access article distributed under the terms and conditions of the Creative Commons Attribution (CC BY) license (https://creativecommons.org/licenses/by/4.0/).
Share and Cite
Lesmana, H.; Sugiarto, S.; Yosevina, C.; Widjojo, H. A Competitive Advantage Model for Indonesia’s Sustainable Tourism Destinations from Supply and Demand Side Perspectives. Sustainability 2022, 14, 16398. https://doi.org/10.3390/su142416398
Lesmana H, Sugiarto S, Yosevina C, Widjojo H. A Competitive Advantage Model for Indonesia’s Sustainable Tourism Destinations from Supply and Demand Side Perspectives. Sustainability. 2022; 14(24):16398. https://doi.org/10.3390/su142416398
Chicago/Turabian StyleLesmana, Henky, Sugiarto Sugiarto, Christiana Yosevina, and Handyanto Widjojo. 2022. "A Competitive Advantage Model for Indonesia’s Sustainable Tourism Destinations from Supply and Demand Side Perspectives" Sustainability 14, no. 24: 16398. https://doi.org/10.3390/su142416398