Article

Study on Influencing Factors and Spatial Effects of Carbon Emissions Based on Logarithmic Mean Divisia Index Model: A Case Study of Hunan Province

1
School of Resources and Safety Engineering, Central South University, Changsha 410083, China
2
Hunan Iron and Steel Group Co., Ltd., Changsha 410004, China
3
Graduate School, Central South University, Changsha 410083, China
*
Author to whom correspondence should be addressed.
Sustainability 2022, 14(23), 15868; https://doi.org/10.3390/su142315868
Submission received: 17 October 2022 / Revised: 18 November 2022 / Accepted: 24 November 2022 / Published: 29 November 2022
(This article belongs to the Topic Green Low-Carbon Technology for Metalliferous Minerals)

Abstract

:
China has committed to peaking carbon dioxide emissions by 2030 and has set a goal of working towards carbon neutrality by 2060. Hunan province is a vital undertaking place for national industrial transfer. It is of great significance for promoting energy conservation and emission reduction to investigate the influencing factors and spatial effects of carbon emissions in Hunan province. Firstly, based on the energy consumption data of Hunan province from 2005 to 2017, this paper uses the method recommended by the Intergovernmental Panel on Climate Change (IPCC) to measure the carbon emissions of Hunan province and its economic zones. Secondly, the five-factor Logarithmic Mean Divisia Index (LMDI) model is constructed to analyze the influence degree of population size, economic development, industrial structure, energy intensity, and energy structure on carbon emissions. Finally, the spatial differences of the influencing factors in the four economic zones of Hunan province are analyzed. The research shows that: (1) An overall carbon emission reduction has been achieved in Hunan province since 2011. (2) Changsha–Zhuzhou–Xiangtan Economic Zone is the key area to achieve carbon emission reduction, while there is still the phenomenon of emission increase in the other three economic zones. (3) For all economic zones, economic development contributes the most to the increase in carbon emissions, while energy intensity shows the strongest inhibitory effect. Other factors have various effects on the four economic zones.

1. Introduction

Carbon dioxide is the major gas causing the greenhouse effect [1]. Modern society now depends heavily on energy sources such as crude oil and coal [2]. Over the past two centuries, consistent economic expansion and the fast urbanization of the world’s population have increased the need for energy [3]. Human beings have consumed a large number of fossil fuels and emitted large amounts of carbon dioxide into the atmosphere, which causes the continuous rise of global temperature. In order to curb global warming, countries around the world are striving to find solutions to reduce carbon emissions. As the world’s largest carbon dioxide country, China plays an important role in global emissions reduction. In the 14th Five-Year Plan (2021–2025), the Chinese government has planned to reduce energy consumption per unit of GDP by 13.5% by 2025 compared with 2020 [4]. Hunan province is in a period of rapid development of industrialization and urbanization, but its economic development is characterized by high carbon emissions. Most of the industries in Hunan are heavy industries based on fossil energy, which have inevitably increased the difficulty of transforming from high energy consumption, high pollution, and high emission to a green and low-carbon economic development model. Therefore, scientific measurement and analysis of carbon emissions, influencing factors, and their spatial distribution in Hunan province are important for objective assessment of the effectiveness of building its two-oriented society and contribution to the double carbon vision of Hunan power. At the same time, it can provide a reference for the green and low-carbon development paths of other high-carbon provinces.
Carbon emission is the most direct and effective indicator to measure low-carbon development. However, there are many factors influencing carbon emissions. To reduce carbon emissions and achieve sustainable development, we need to analyze different influencing factors and take effective measures comprehensively. An increasing number of scholars have begun to study the influencing factors and spatial and temporal characteristics of carbon emissions. The main methods include decomposition analysis, econometric analysis, and gray correlation analysis. (1) Decomposition analysis includes Structural Decomposition Analysis (SDA) and Index Decomposition Analysis (IDA). Compared with the SDA, the IDA has been used in a wider range of research areas, with fewer data and better data availability [5]. The IDA was proposed by Laspeyres in 1871 to solve the economic problems of enterprises [6] and was gradually applied in the field of energy. The number of studies using this method reached more than 50 in 1995 [7] and more than 120 in 2000 [8]. The Logarithmic Mean Divisia Index (LMDI) model proposed by Ang and Choi [9] is an extension of IDA, which uses the logarithmic mean instead of the arithmetic mean. Ang pointed out that the LMDI method has a good theoretical basis [10], strong adaptability [11], simple operation [12], no residual after decomposition [13], and the results of the method are easily comprehensible [14]. Since the early 1990s, the LMDI method has been widely used in the study of regional environmental influencing factors in various countries and regions, including Latin America (Sheinbaum et al. [15], González and Martínez [16,17]), Ireland (Mahony [18], Tadhg et al. [19]), United Kingdom (Hammonda and Normanb [20]) and Turkey (Ipek et al. [21]), South Korea (Oh et al. [22], Jung et al. [23]) and China (Lee and Oh [24], Li [25], Wang et al. [26], Liu et al. [27]). (2) Principal component analysis, general regression analysis, and IPAT model analysis are commonly used in econometric models, and some of them are combined for analysis. In the Stochastic Impacts by Regression on Population, Affluence, and Technology (STIRPAT) model, an index is introduced to the IPAT equation to study the proportional impact of each influencing factor on carbon emissions. By using the STIRPAT model and a geographically weighted average model, Videras [28] analyzed country-level data for the United States to investigate the association of population, affluence, and technology factors with total carbon emissions and the degree of influence. The results showed that there is strong spatial heterogeneity in the estimated elasticity coefficients. Chen et al. [29] studied the effects of influencing factors on direct household carbon emissions and indirect carbon emissions of urban and rural households in Fujian province by using LMDI and SDA models. (3) In China, gray correlation analysis is frequently used to investigate the correlation degree between the influencing factors of carbon emissions and carbon emissions. At the provincial level, Guo [30], Qiang Ouyang et al. [31], Yue Yuan et al. [32], Fang Song and Jun Ma [33], Changshun Li et al. [34], and Yanhui Yang [35] respectively investigated the correlation between different factors and industrial carbon emissions in five northwestern provinces, Hunan province, Tianjin city, Inner Mongolia Autonomous Region, Nanjing city, and Tangshan city, respectively. At the industry level, Changkai Wang et al. [36] used gray correlation dynamic analysis to study six key factors affecting carbon emissions in manufacturing industries in China from 1995 to 2010. Shouhong Xie et al. [37] measured the carbon emissions of various industrial industries in Wuxi City from 1993 to 2010 and calculated the degree of correlation between carbon emissions and industrial economic growth in each industry.
In summary, previous literature has researched the influencing factors of carbon emissions at the national and provincial levels and discussed its macrospatial characteristics. However, from the provincial scale, the existing studies have rarely analyzed the influencing factors and spatial characteristics of carbon emissions in different regions within a province. Therefore, it is of great significance to deeply explore the impact of various factors on the carbon emissions of different economic zones in Hunan province and their temporal and spatial characteristics. At the same time, this paper puts forward practical policy recommendations to promote carbon emission reduction and sustainable development of the environment.
This study takes Hunan as the study area to explore the degree and trend of the influencing factors and regional spatial differences of carbon emissions. In support of previous studies, this paper provides the following contributions. Firstly, this paper enriches the study of provincial carbon emissions, chooses a scientific method to accurately measure carbon emissions, and comprehensively analyzes the effect of provincial carbon emissions. Secondly, the scientific and reasonable decomposition model (LMDI) selected in this paper helps to clarify the main carbon emission influencing factors, explores their differences in different economic regions, and provides references for other studies. Finally, this paper provides suggestions for energy conservation, emission reduction and economic development in Hunan province, which can help provide some practical references for government departments to formulate differentiated policies and plans.

2. Methodology

2.1. Carbon Emission Calculation

According to the calculation method proposed by the IPCC Guidelines for National Greenhouse Gas Emissions Inventory [38], the carbon emissions from energy consumption are decomposed into the product of different factors, and then the carbon emissions based on the total energy consumption and its proportion are estimated. Based on previous studies [39,40], the carbon emissions of Hunan province and its municipalities were estimated by using the consumption of nine major carbon-based energy sources (raw coal, crude oil, coke, kerosene, gasoline, diesel, fuel oil, natural gas, and liquefied petroleum gas). The calculation equation can be expressed as follows:
C =   e i × F i =   e i × V i × f i × 44 12
where C is the total carbon emission; i is the type of energy; ei is the consumption of the i-th energy; Fi is the carbon emission factor of the i-th energy; Vi is the average low-level calorific value of the i-th energy; fi is the carbon emission factor of the i-th energy, that is, the product of the carbon content per unit calorific value of the i-th energy and the carbon oxidation rate; and 12 and 44 are the molecular weights of C and CO2, respectively.

2.2. LMDI Decomposition Method

According to the analysis of Guoquan Xu et al. [41], the basic equation for constructing carbon emissions is shown in Equation (2):
C = i = 1 9 C i = i = 1 9 P × GDP P × GC GDP × E GC × E i E × C i E i
where C is the total carbon emissions; i is the type of energy source; Ci is carbon emissions generated by the i-th energy source; GC is the total industrial output; Ei is the consumption of the i-th energy source; E is the total energy consumption; and P is the population size.
As:
EG = GDP P
JG = GC GDP
EI = E GC
ES = E i E
CE = C i E i
where EG is the level of economic development (expressed in GDP per capita); JG is the industrial structure (expressed in the industrial share); EI is the energy intensity; ES is the energy structure (expressed in the share of raw coal consumption); and CE is the carbon emission intensity.
Equations (3)–(7) are taken into Equation (2), then the simplified formula for carbon emissions in Hunan province can be obtained as follows:
C = i = 1 9 C i = i = 1 9 P × EG × JG × EI × ES × CE
Then, the change in carbon emissions in Hunan province in period t relative to the base period can be expressed by:
Δ C = C t C 0 = i = 1 9 P t EG t JG t EI t ES t i = 1 9 P 0 EG 0 JG 0 EI 0 ES t = Δ Cp + Δ Ceg + Δ Cjg + Δ Cei + Δ Ces + Δ rsd
Since CE is the carbon emission factor of energy, it is a constant, and the carbon emission factor effect ΔCce is constant to 0. In addition, in this equation, ΔCp, ΔCeg, ΔCjg, ΔCei, and ΔCes are the contribution values of changes in population size factor, economic development factor, industrial structure factor, energy intensity factor, and energy structure factor to the changes in carbon emissions in Hunan province, respectively. Δrsd is the decomposition residual.
The LMDI decomposition method proposed by Ang et al. [13] is used to decompose Equation (9). Let:
  W i = C i t     C i 0 ( C i t / C i 0 )
The decomposition results for each factor can be obtained as follows:
Δ Cp = i = 1 9 W i ln P i t P 0 T = i = 1 9 C i t     C i 0 ln ( C i t / C i 0 ) ln P i t P 0 T
Δ Ceg = i = 1 9 W i ln EG i t EG 0 T = i = 1 9 C i t     C i 0 ln ( C i t / C i 0 ) ln EG i t EG 0 T
Δ Cjg = i = 1 9 W i ln JG i t JG 0 T = i = 1 9 C i t     C i 0 ln ( C i t / C i 0 ) ln JG i t JG 0 T
Δ Cei = i = 1 9 W i ln EI i t EI 0 T = i = 1 9 C i t     C i 0 ln ( C i t / C i 0 ) ln EI i t EI 0 T
Δ Ces = i = 1 9 W i ln ES i t ES 0 T = i = 1 9 C i t     C i 0 ln ( C i t / C i 0 ) ln ES i t ES 0 T
The cumulative effect of carbon emissions can be calculated by:
Δ C ( 0 , T ) = Δ C ( 0 , t ) + Δ C ( 0 , t + 1 ) + + Δ C ( T 1 , T )
The carbon decomposition residual is calculated as:
Δ rsd = Δ C     ( Δ Cp + Δ Ceg + Δ Cjg + Δ Cei + Δ Ces ) = C t     C 0     i = 1 9 W i ( ln P i t P 0 T + ln EG i t EG 0 T + ln JG i t JG 0 T + ln EI i t EI 0 T + ln ES i t ES 0 T ) = C t     C 0     i = 1 9 W i ( ln P i t EG i t JG i t EI i t ES i t P 0 T EG 0 T JG 0 T EI 0 T ES 0 T )   =   C t     C 0     i = 1 9 W i ( ln C i t C 0 t )   =   C t     C 0     i = 1 9 C i t     C i 0 ln ( C i t / C 0 t ) ( ln C i t C 0 t )   =   C t     C 0     i = 1 9 ( C i t     C i 0 ) = 0

2.3. Data Source

The energy consumption data of all kinds of industrial energy consumption in Hunan province and various cities were obtained from the physical consumption of energy terminals in the Hunan Statistical Yearbook [42] and the Hunan Energy Statistical Yearbook [43] in previous years. The average low-level calorific value is from the China Energy Statistics Yearbook [44], and the IPCC Guidelines for National Greenhouse Gas Emissions Inventory [38] provides the carbon content per unit of calorific value and carbon oxidation rate. The energy consumption in the carbon emission calculation must be converted into the equivalent amount of standard coal. The carbon emission coefficient is calculated by multiplying the total amount of standard coal by the coal emission coefficient. The discount factor of standard coal is obtained from the China Energy Statistical Yearbook [44].

3. Results

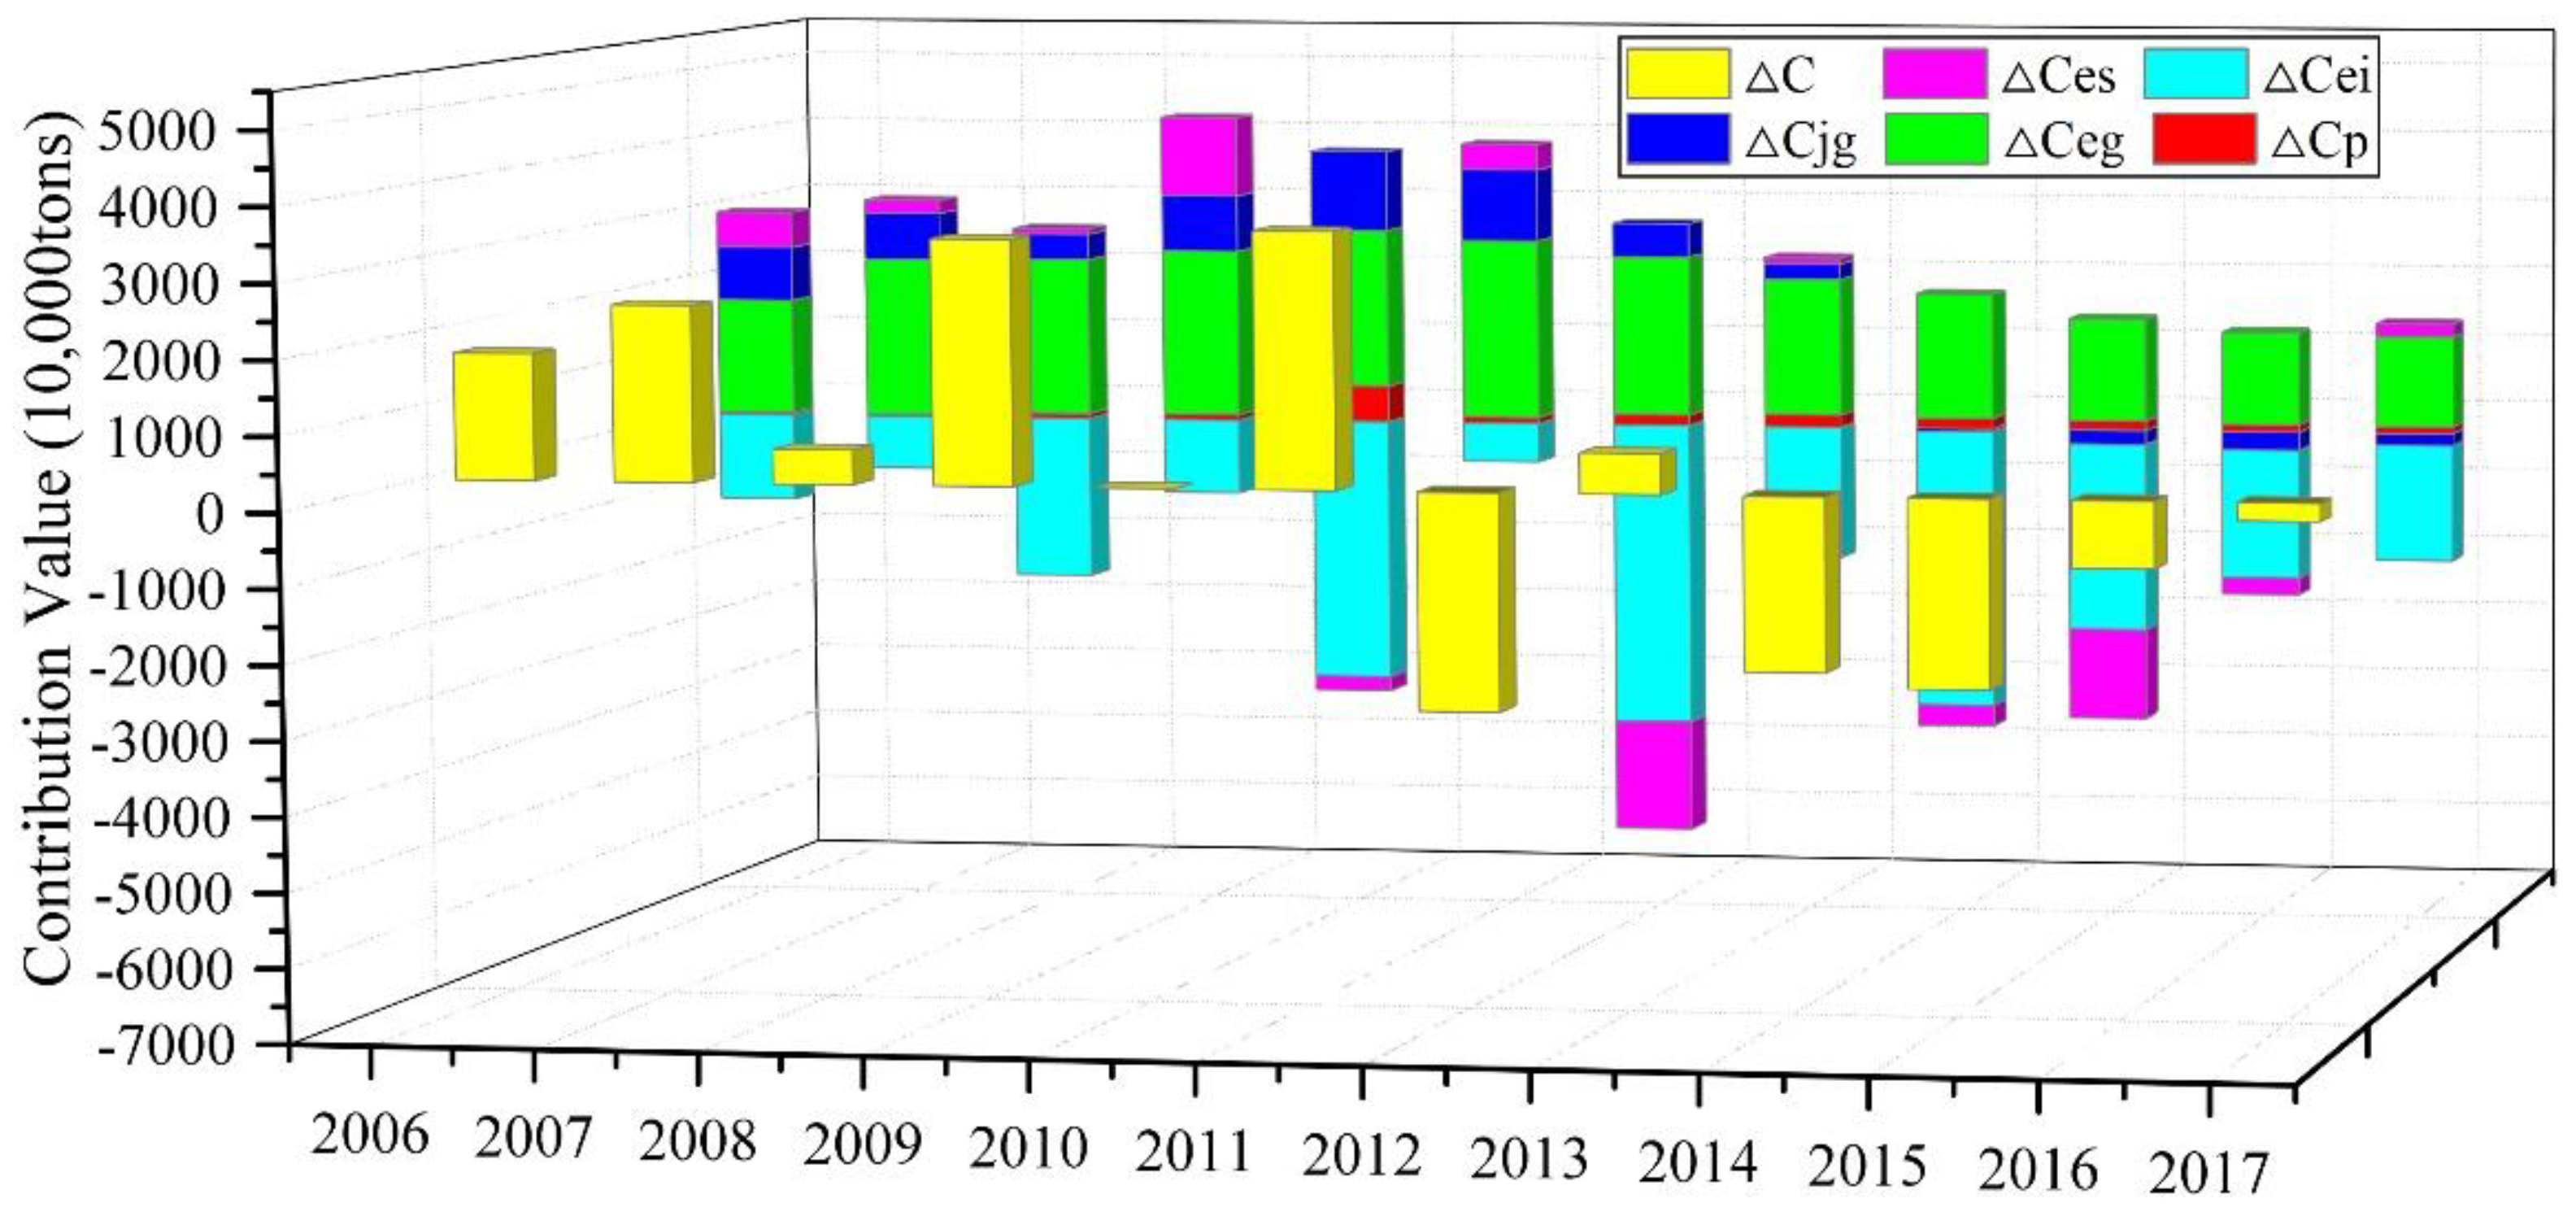
3.1. Analysis of the Overall Effect

The decomposition results obtained by using LMDI decomposition method are shown in Figure 1. It can be seen that the decomposition trend of the effect of carbon emission influencing factors in Hunan province has fluctuated over the years. Except for 2010 and 2013 due to the economic crisis and the influence of policies, the total effect contribution developed from 17.254 million tons in 2006 to 34.75 million tons in 2011. Since 2012, the total effect has turned to an overall reduction effect, which resulted in −244.33 million tons in 2017. Thus, the reduction in carbon emissions in Hunan province has been gradually realized.
Figure 2 shows the cumulative effect of different factors on the change in carbon emissions in Hunan province. The cumulative overall effect shows an inverted U-shape, with a cumulative increase of 29.4876 million tons of carbon emissions up to 2017. Among them, economic development is the most important factor of carbon emission increase; energy intensity has the greatest inhibitory effect on carbon emissions; population size has a small effect on emission increase; industrial structure has a positive effect first and then a negative effect; and the effect of energy structure shows a diversified state.
As shown in Figure 3, in general, for the increase in carbon emissions, energy intensity and energy structure have a negative effect, while economic development, population size, and industrial structure have a positive effect.

3.2. Analysis of the Effect of Each Influencing Factor

(1) The population size of Hunan province has contributed to an increase in carbon emissions, but its overall effect is not significant. During the study period, its total increase in carbon emissions was 16.2283 million tons. Specifically, influenced by the two-child birth policy in 2007 and the inertia of population growth formed by the fertility peak, the significant rebound in the population growth rate in 2009 led to a sudden increase in carbon emissions from the population size effect.
(2) Economic development is the most important influencing factor for emission increase, and the annual contribution value is positive. The effect curve of economic development on carbon emission shows an inverted U-shape. As the level of urbanization continues to improve, Hunan province’s economic development has entered a new stage. From 2006 to 2011, the contribution of economic development factors to carbon emissions increased from 22.5470 million tons to 25.5022 million tons. In 2009, the Copenhagen Conference included carbon emission reduction in the economic growth index. In the context of “low carbon”, the growth rate of carbon emissions began to slow down. As a result, the carbon emission contribution decreased to 12.86 million tons in 2017. From the perspective of the cumulative effect, the contribution rates of Hunan province’s economic development over the years are positive. The contribution rate of economic development fluctuated in 2011 and before, while it increased gradually after 2011. The cumulative contribution rate of economic development has exceeded 200% since 2013 and exceeded 500% from 2015 to 2017, all the way to 793.18% in 2017, with a cumulative increase of 233.8887 million tons of carbon emissions. It can be seen that the rapid economic development and the increase in GDP per capita contribute to the rapid increase in carbon emissions.
(3) The industrial structure first promotes and then curbs carbon emissions at the node of 2014, showing an inverted U-shape as a whole. In addition, the contribution rate of the industrial structure is positive every year, and the cumulative contribution rate has exceeded 100% after 2014. In recent years, Hunan province is in a period of rapid industrialization. Specifically, the scale of industry is expanding, and the industrial structure is continuously optimized and adjusted. The ratio of the tertiary industry increased from 41.3% in 2005 to 51.9% in 2017 and has exceeded the secondary industry for the first time in 2014. It can be seen that the industrial structure adjustment of Hunan province is gradually realized, and the reduction in the rate of secondary industry is conducive to the suppression of carbon emissions. However, the proportion of manufacturing, heavy industry, and three high (high pollution, high energy consumption, and high water consumption) enterprises in the industry is still large. The work of industrial structure adjustment and transformation should be further deepened to promote emission reduction.
(4) The energy intensity of Hunan province has made the largest contribution to reducing carbon emissions. It has a significant suppression effect on emission reduction throughout the period. From the perspective of the cumulative effect, the annual contribution rate of energy intensity is negative. The cumulative contribution to curbing carbon emissions exceeded 100% after 2011, exceeded 500% from 2015 to 2017, and reached 876.95% in 2017, with a cumulative reduction of 258.593 million tons of carbon emissions. The energy intensity reflects the overall efficiency of energy consumption in industrial economic activities. As shown in Figure 4, the industrial energy intensity of Hunan province has been in a downward trend, indicating that as energy efficiency is improving, the energy consumption per unit of industrial output value is decreasing. In 2012, under the context of the decline in the growth rate of industrial output, the energy use efficiency increased due to the decrease in coal energy consumption, the increase in clean energy consumption, and the improvement of energy technology. Moreover, the decrease in energy intensity is larger than the decrease in carbon emission. Therefore, the inhibiting effect of energy intensity on carbon emission is significantly increased.
(5) The contribution value of the energy structure in Hunan province is diversified. In general, the industrial structure had a favorable impact on carbon emissions from 2006 to 2011, while it mainly reflected a trend to curb carbon emissions after 2011. In particular, the emission reductions in 2012 and 2015 were significant, with carbon emissions reduced by 15.5994 million tons and 12.8085 million tons, respectively. Although the effect of energy structure varies over the years, the trend is consistent with the total effect. Judging from the cumulative effect, the cumulative contribution value and contribution rate of the energy structure from 2005 to 2014 are positive but negative from 2015 to 2017. Moreover, the inhibitory effect of the last three years is greater than the promotional effect of the first nine years. The cumulative emission reduction in energy structure is 10.2112 million tons in twelve years. The reason can be summarized as follows: on the one hand, the adjustment of the industrial structure of Hunan province and the policy of removing production capacity began to take effect, and energy consumption decreased from 2011 to 2012. On the other hand, the energy structure has been adjusted significantly since 2012, and the proportion of raw coal has decreased. Therefore, under the dual effect, the energy structure presents the influence on emission reduction.

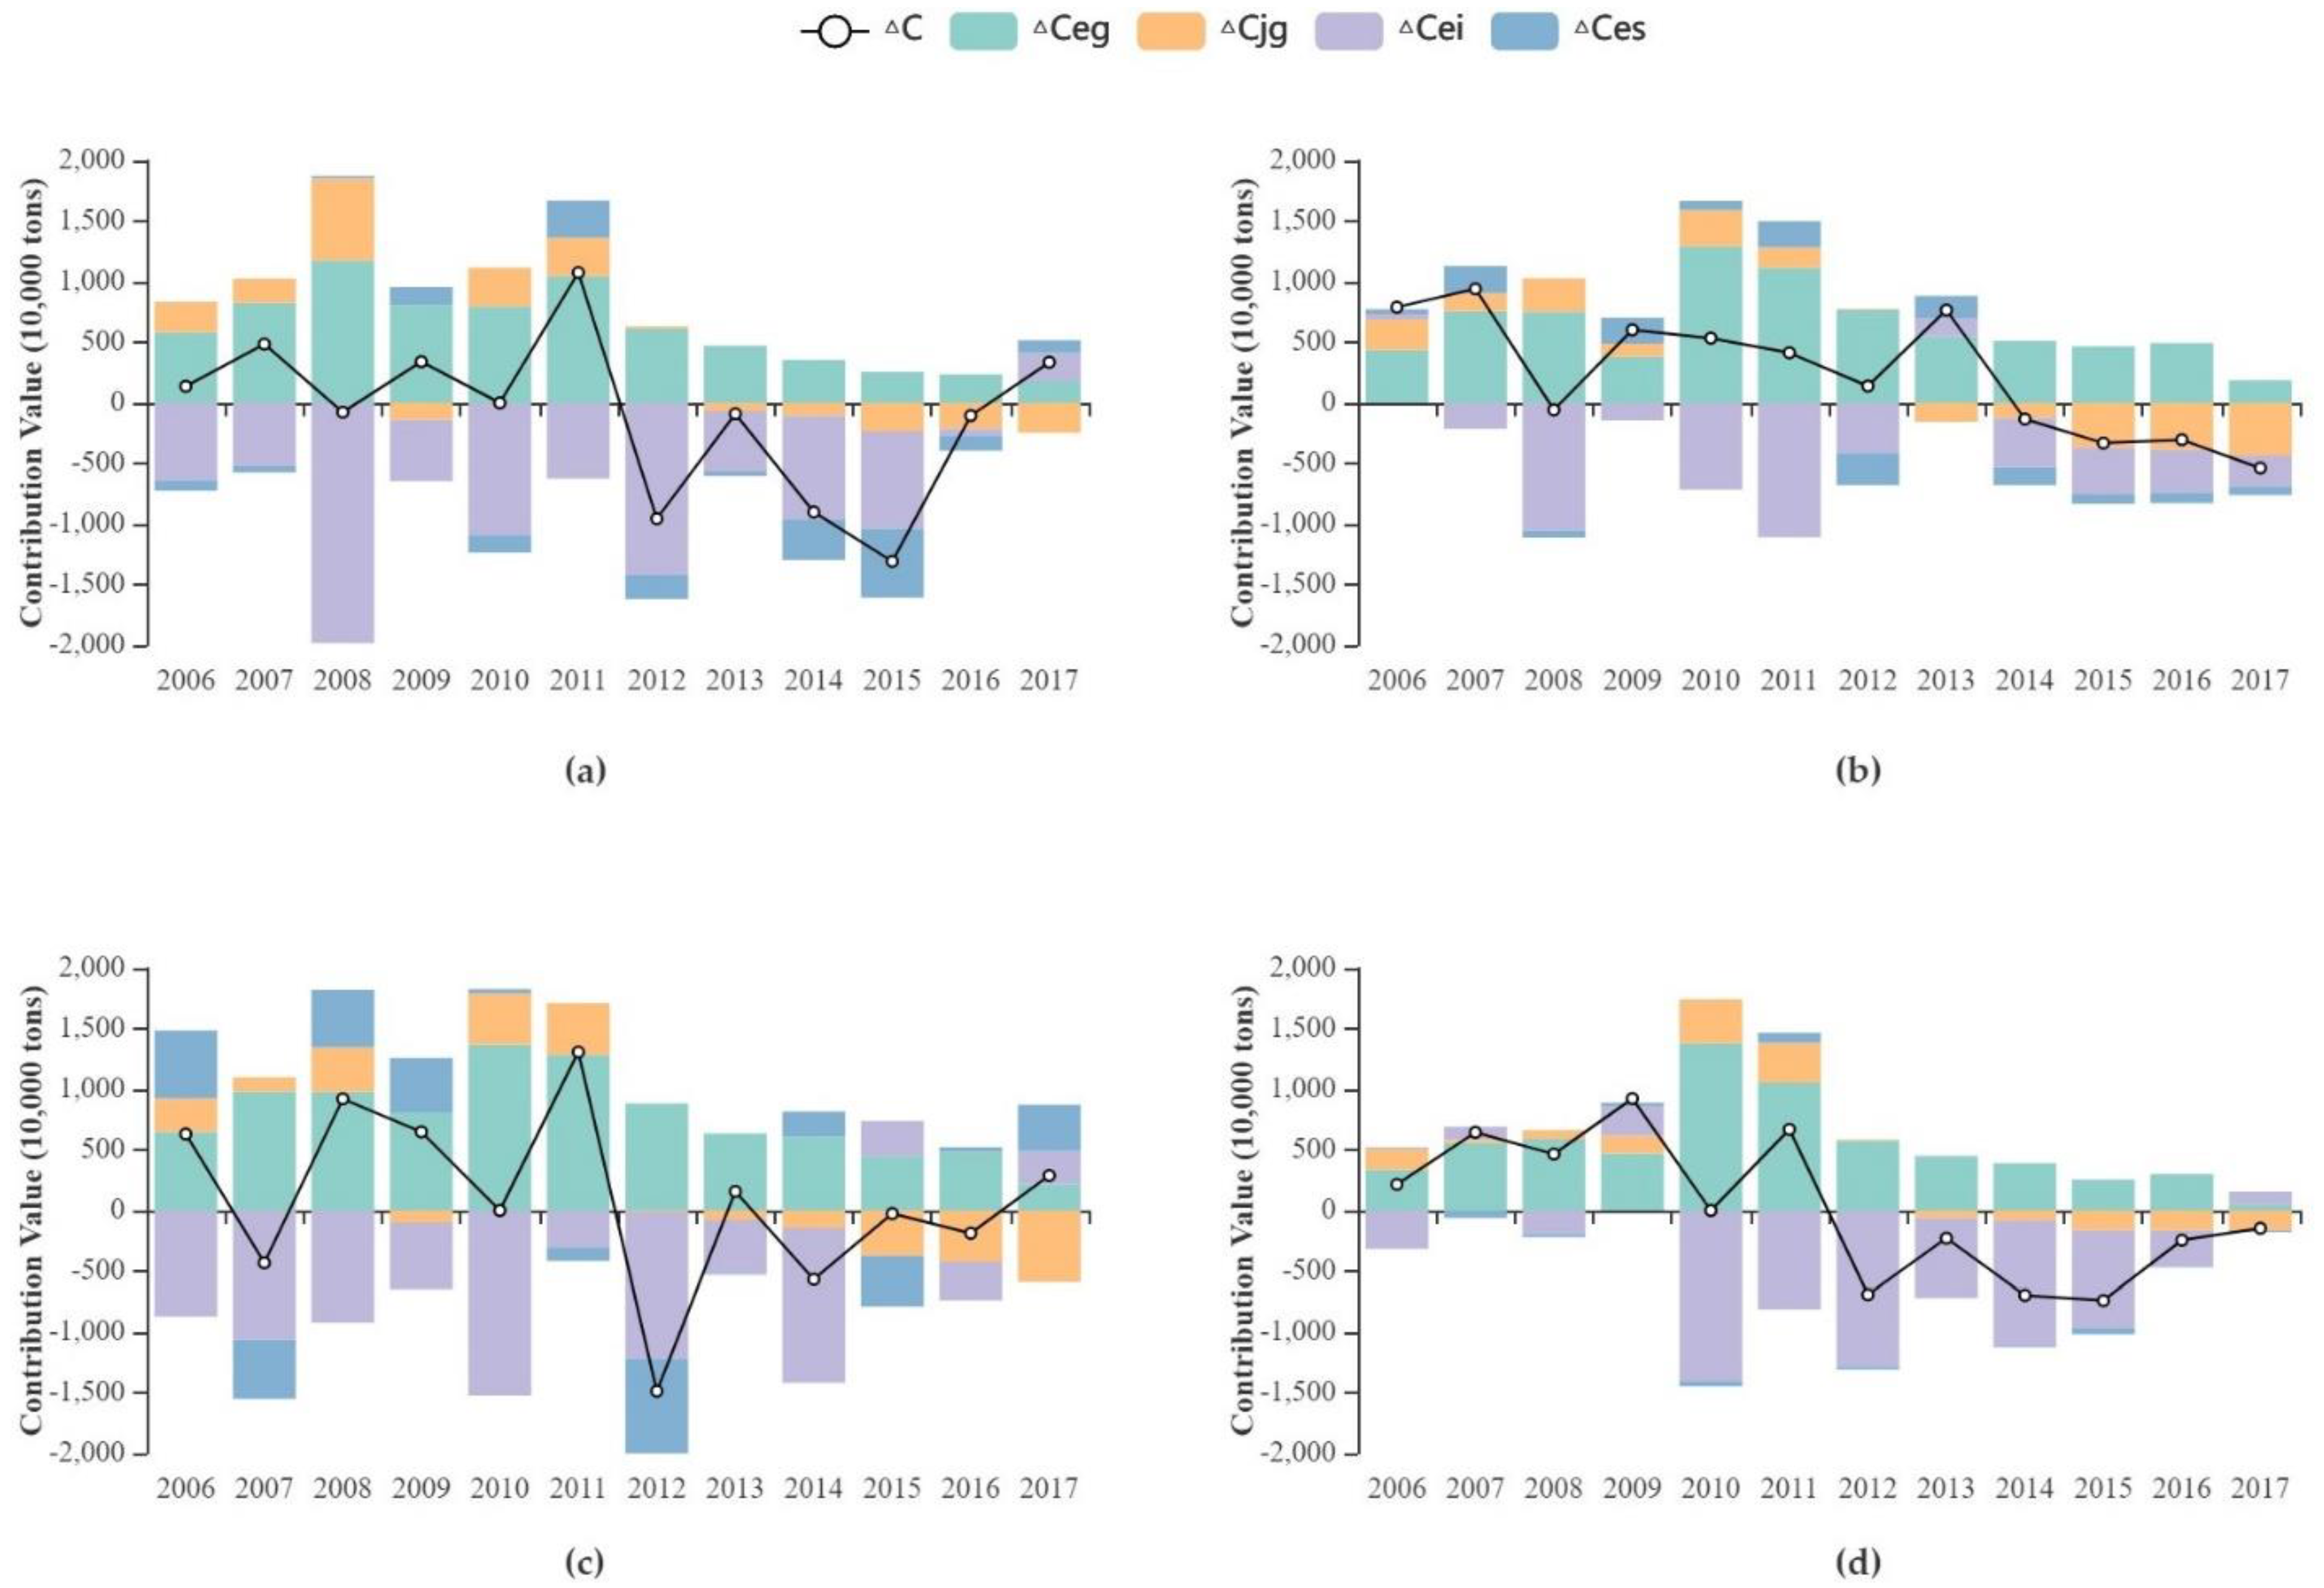
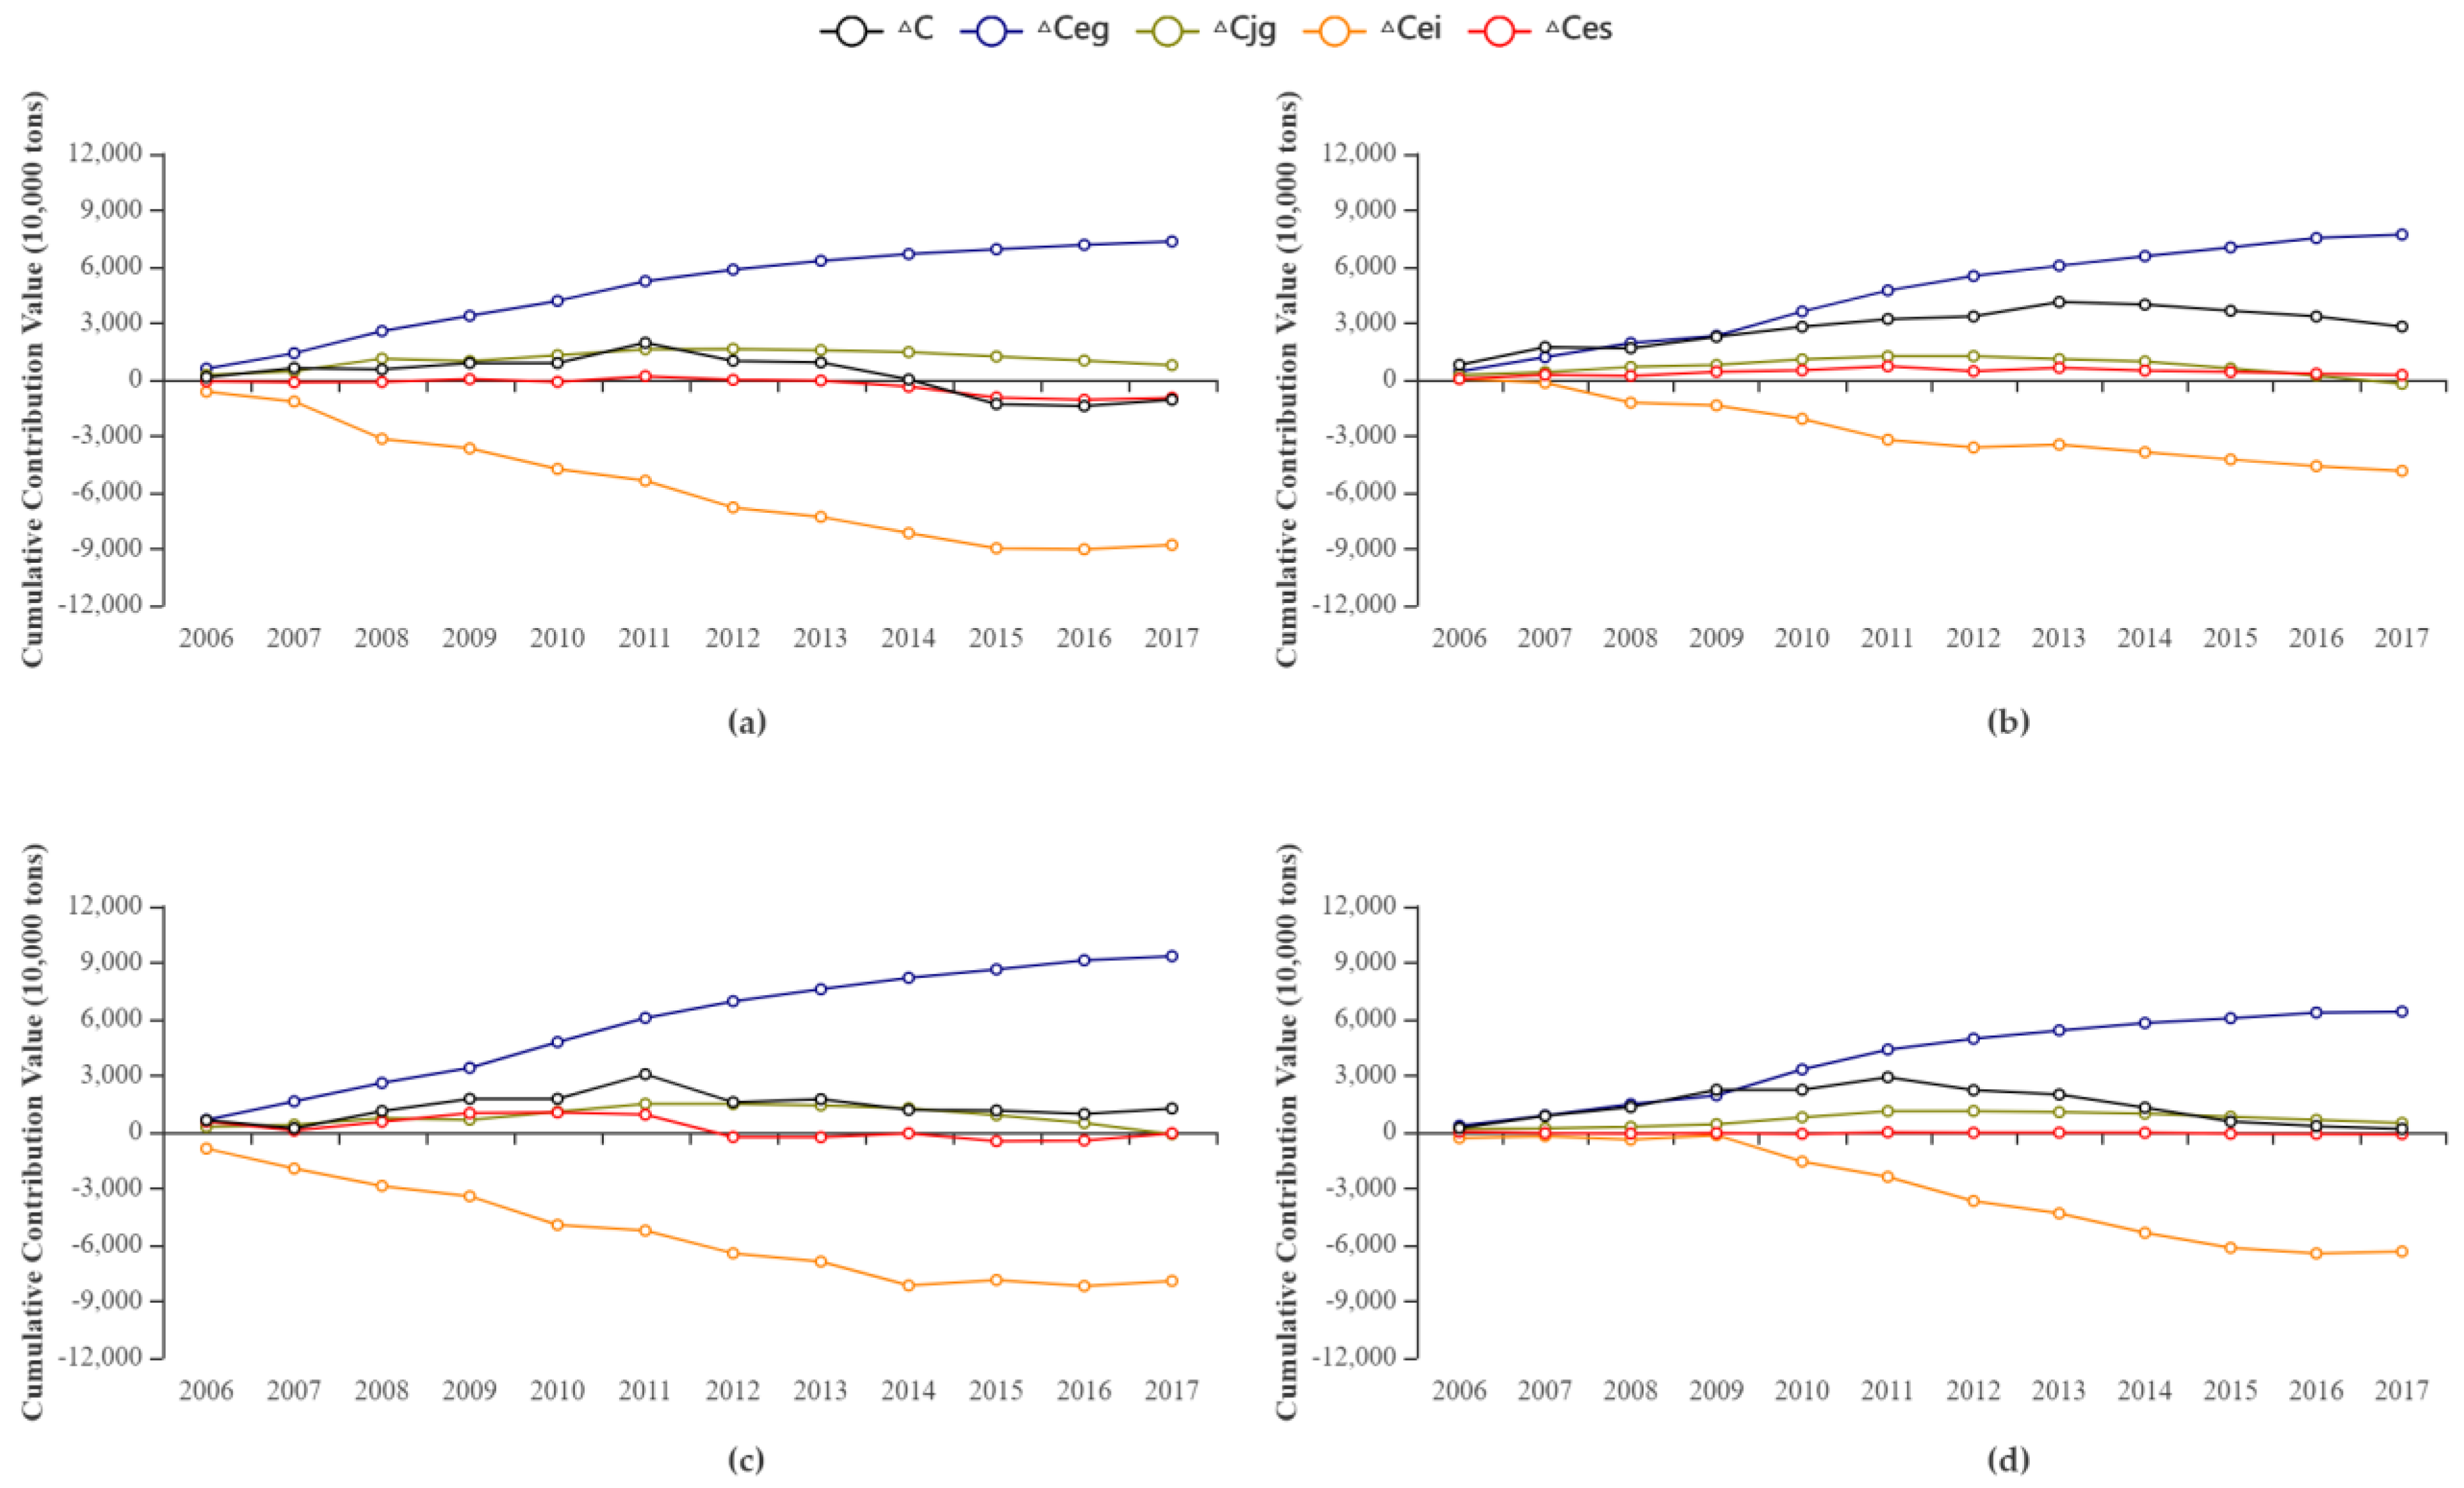
3.3. Analysis of the Spatial Effect

According to the regional economic development plan of Hunan province, the fourteen cities in Hunan province are divided into four economic zones, namely, Changsha–Zhuzhou–Xiangtan Economic Zone (CZT Economic Zone), Southern Hunan Economic Zone (SH Economic Zone), Western Hunan Economic Zone (WH Economic Zone), and Dongting Lake Economic Zone (DL Economic Zone). Figure 5 shows the inclusion relationship between these zones and cities.
To analyze the spatial effects of carbon emissions, four economic zones in Hunan province were calculated and comparatively analyzed by the LMDI model in Section 3.1. Figure 6 shows the results of the influencing effects of different influencing factors and Figure 7 shows the cumulative influence effects.
Based on Figure 6 and Figure 7, the spatial effects of carbon emissions in Hunan province are analyzed.

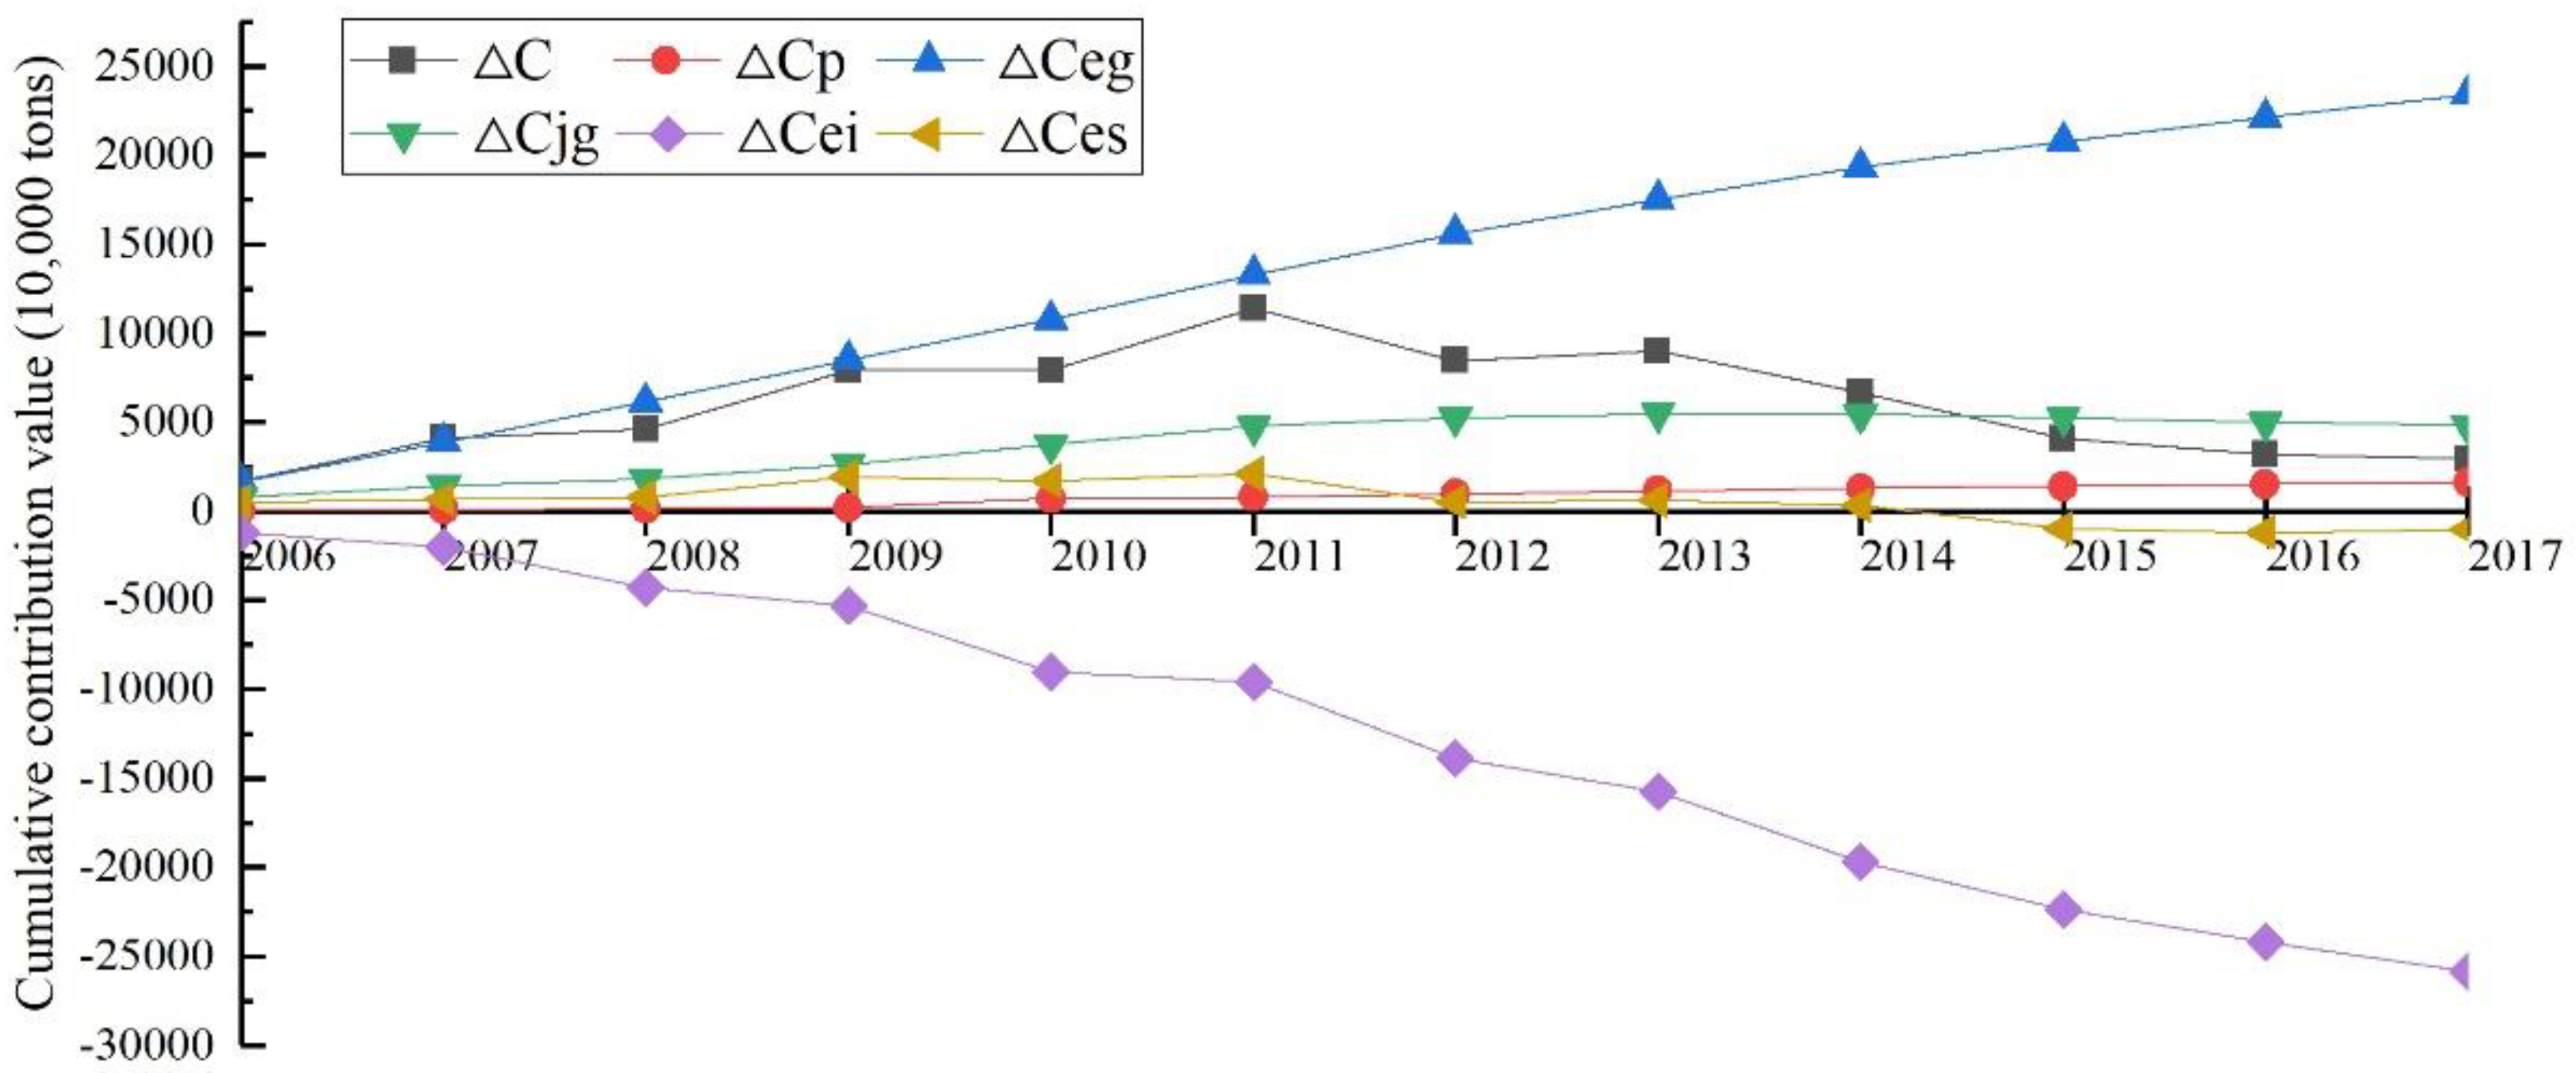
3.3.1. The Overall Cumulative Contribution

The overall cumulative contribution of the influencing factors differs greatly among the four economic regions (Figure 8). The WH Economic Zone has the largest absolute value of cumulative contribution, followed by the DL and CZT Economic Zones, and SH has the smallest. Among them, only the CZT Economic Zone has a negative cumulative total effect contribution value, i.e., the influencing factors contribute to the emission reduction.

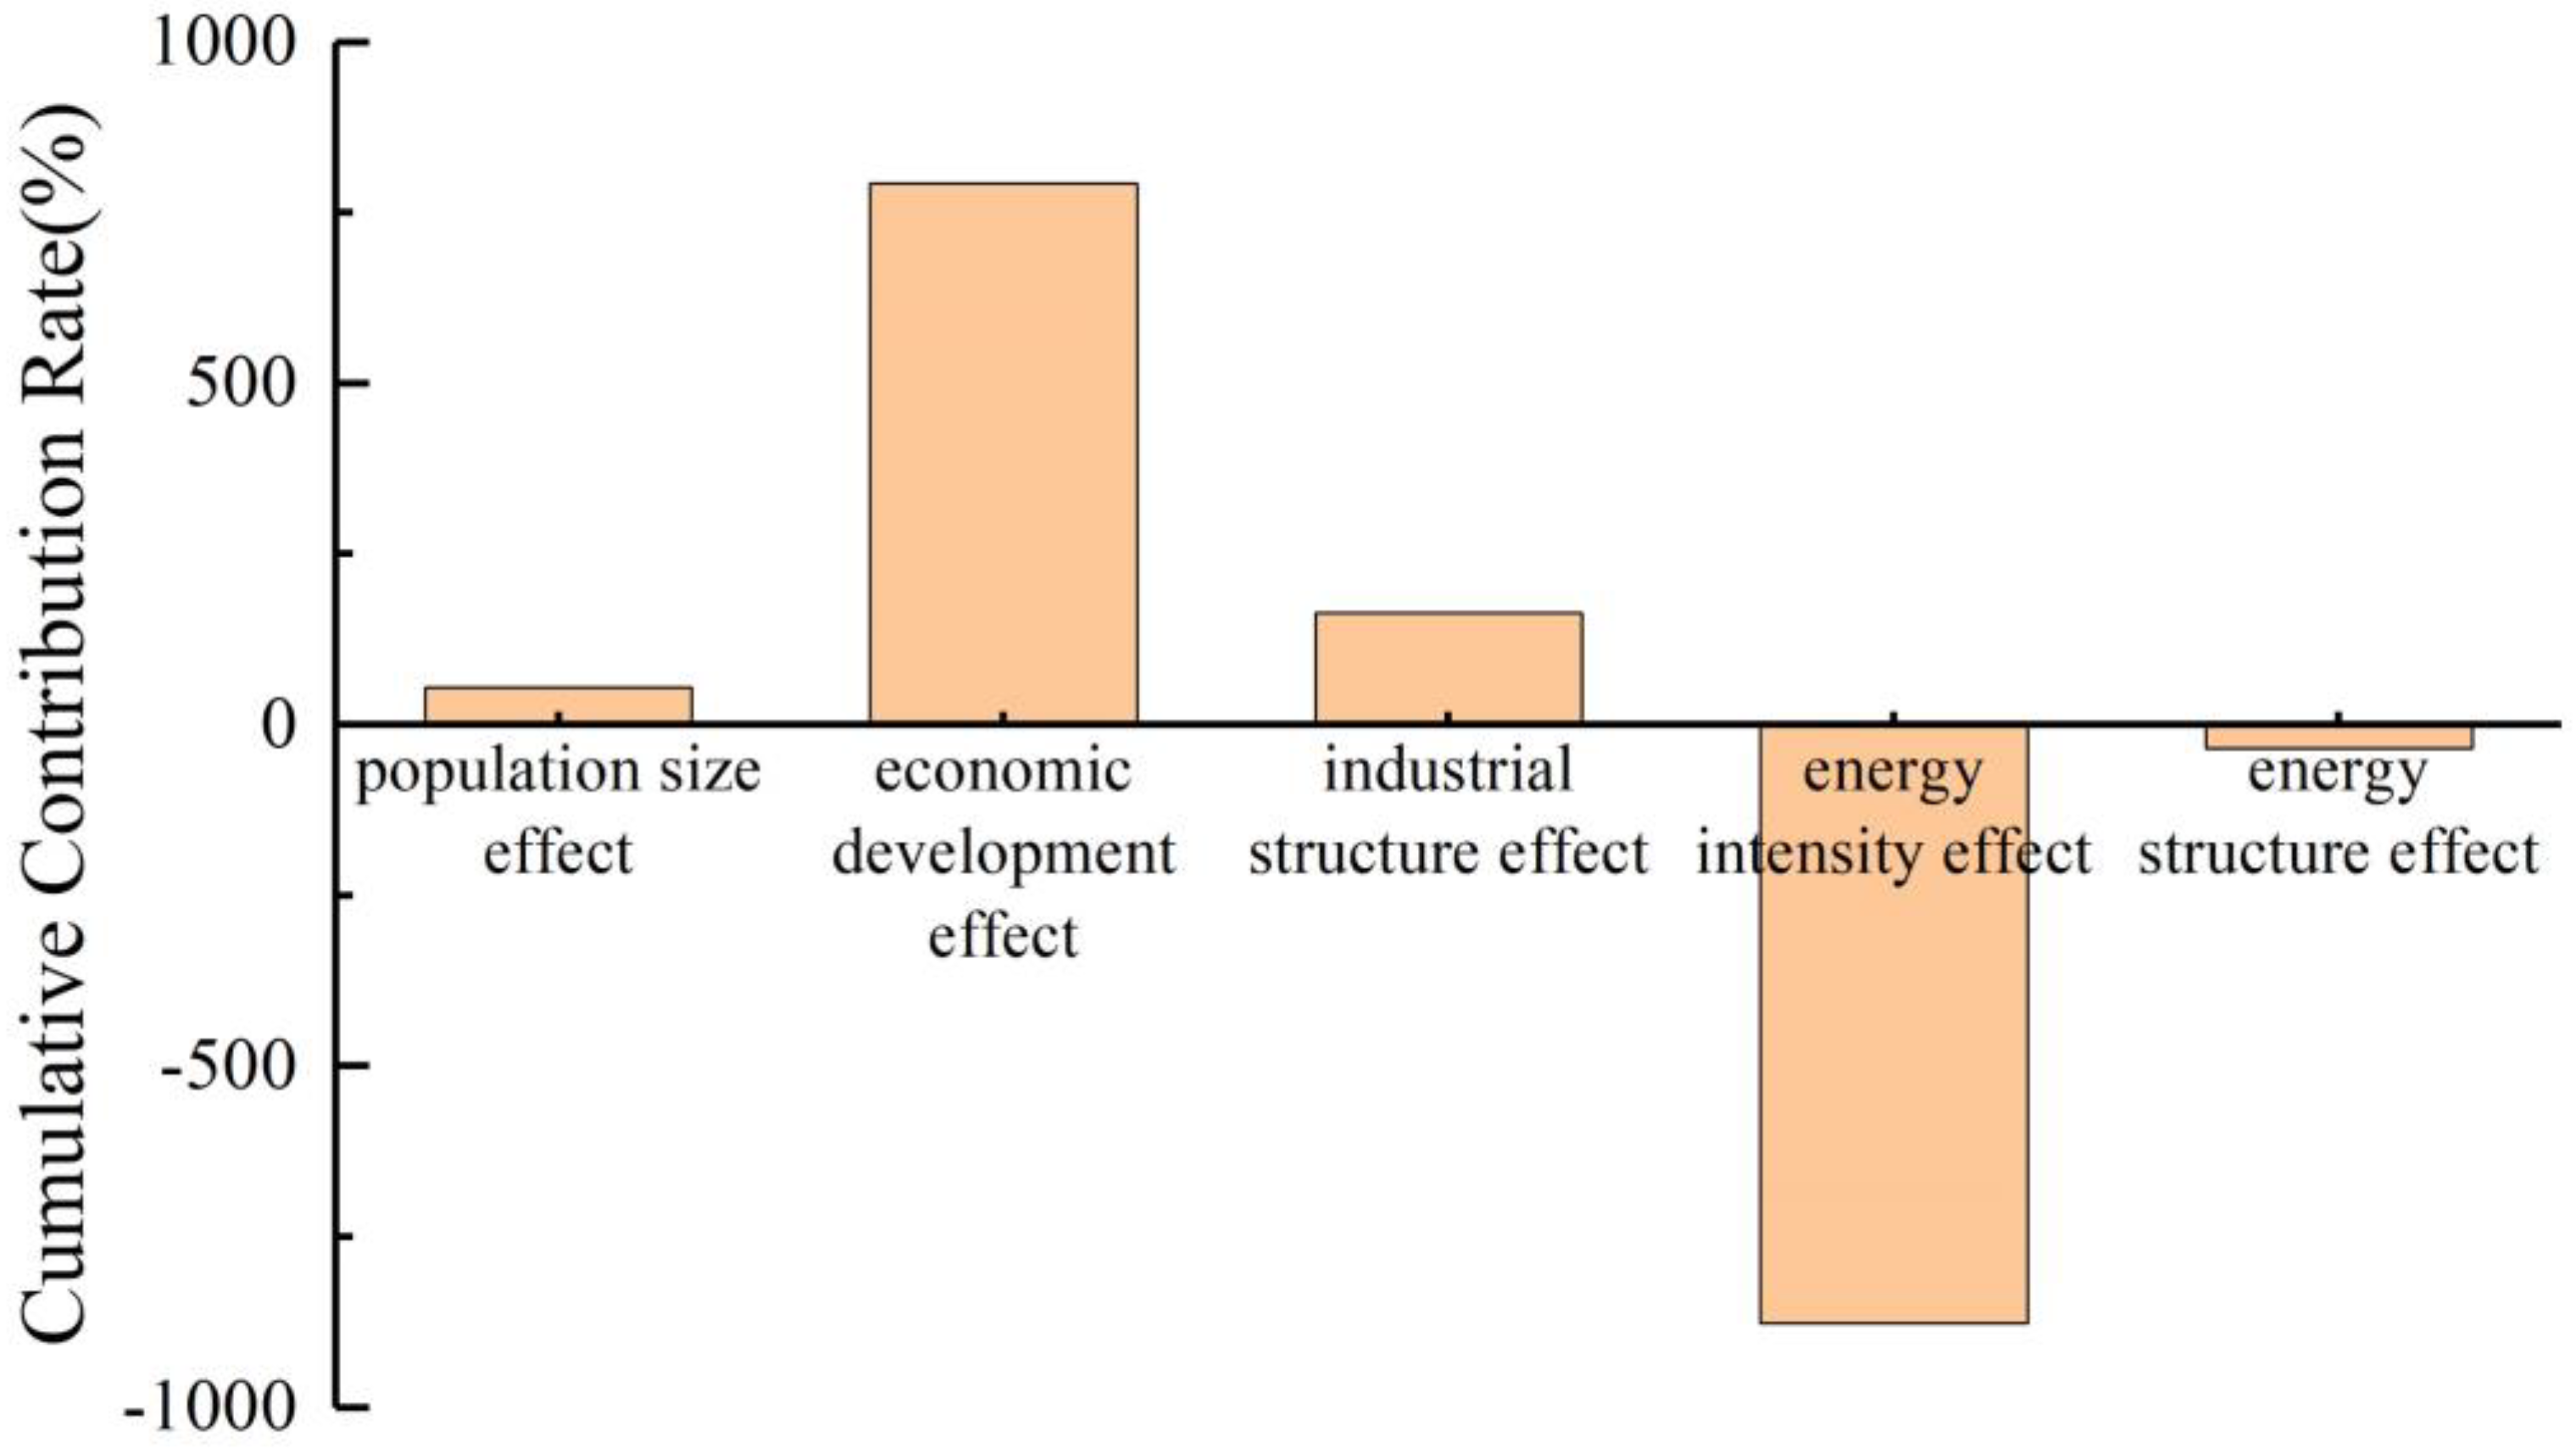
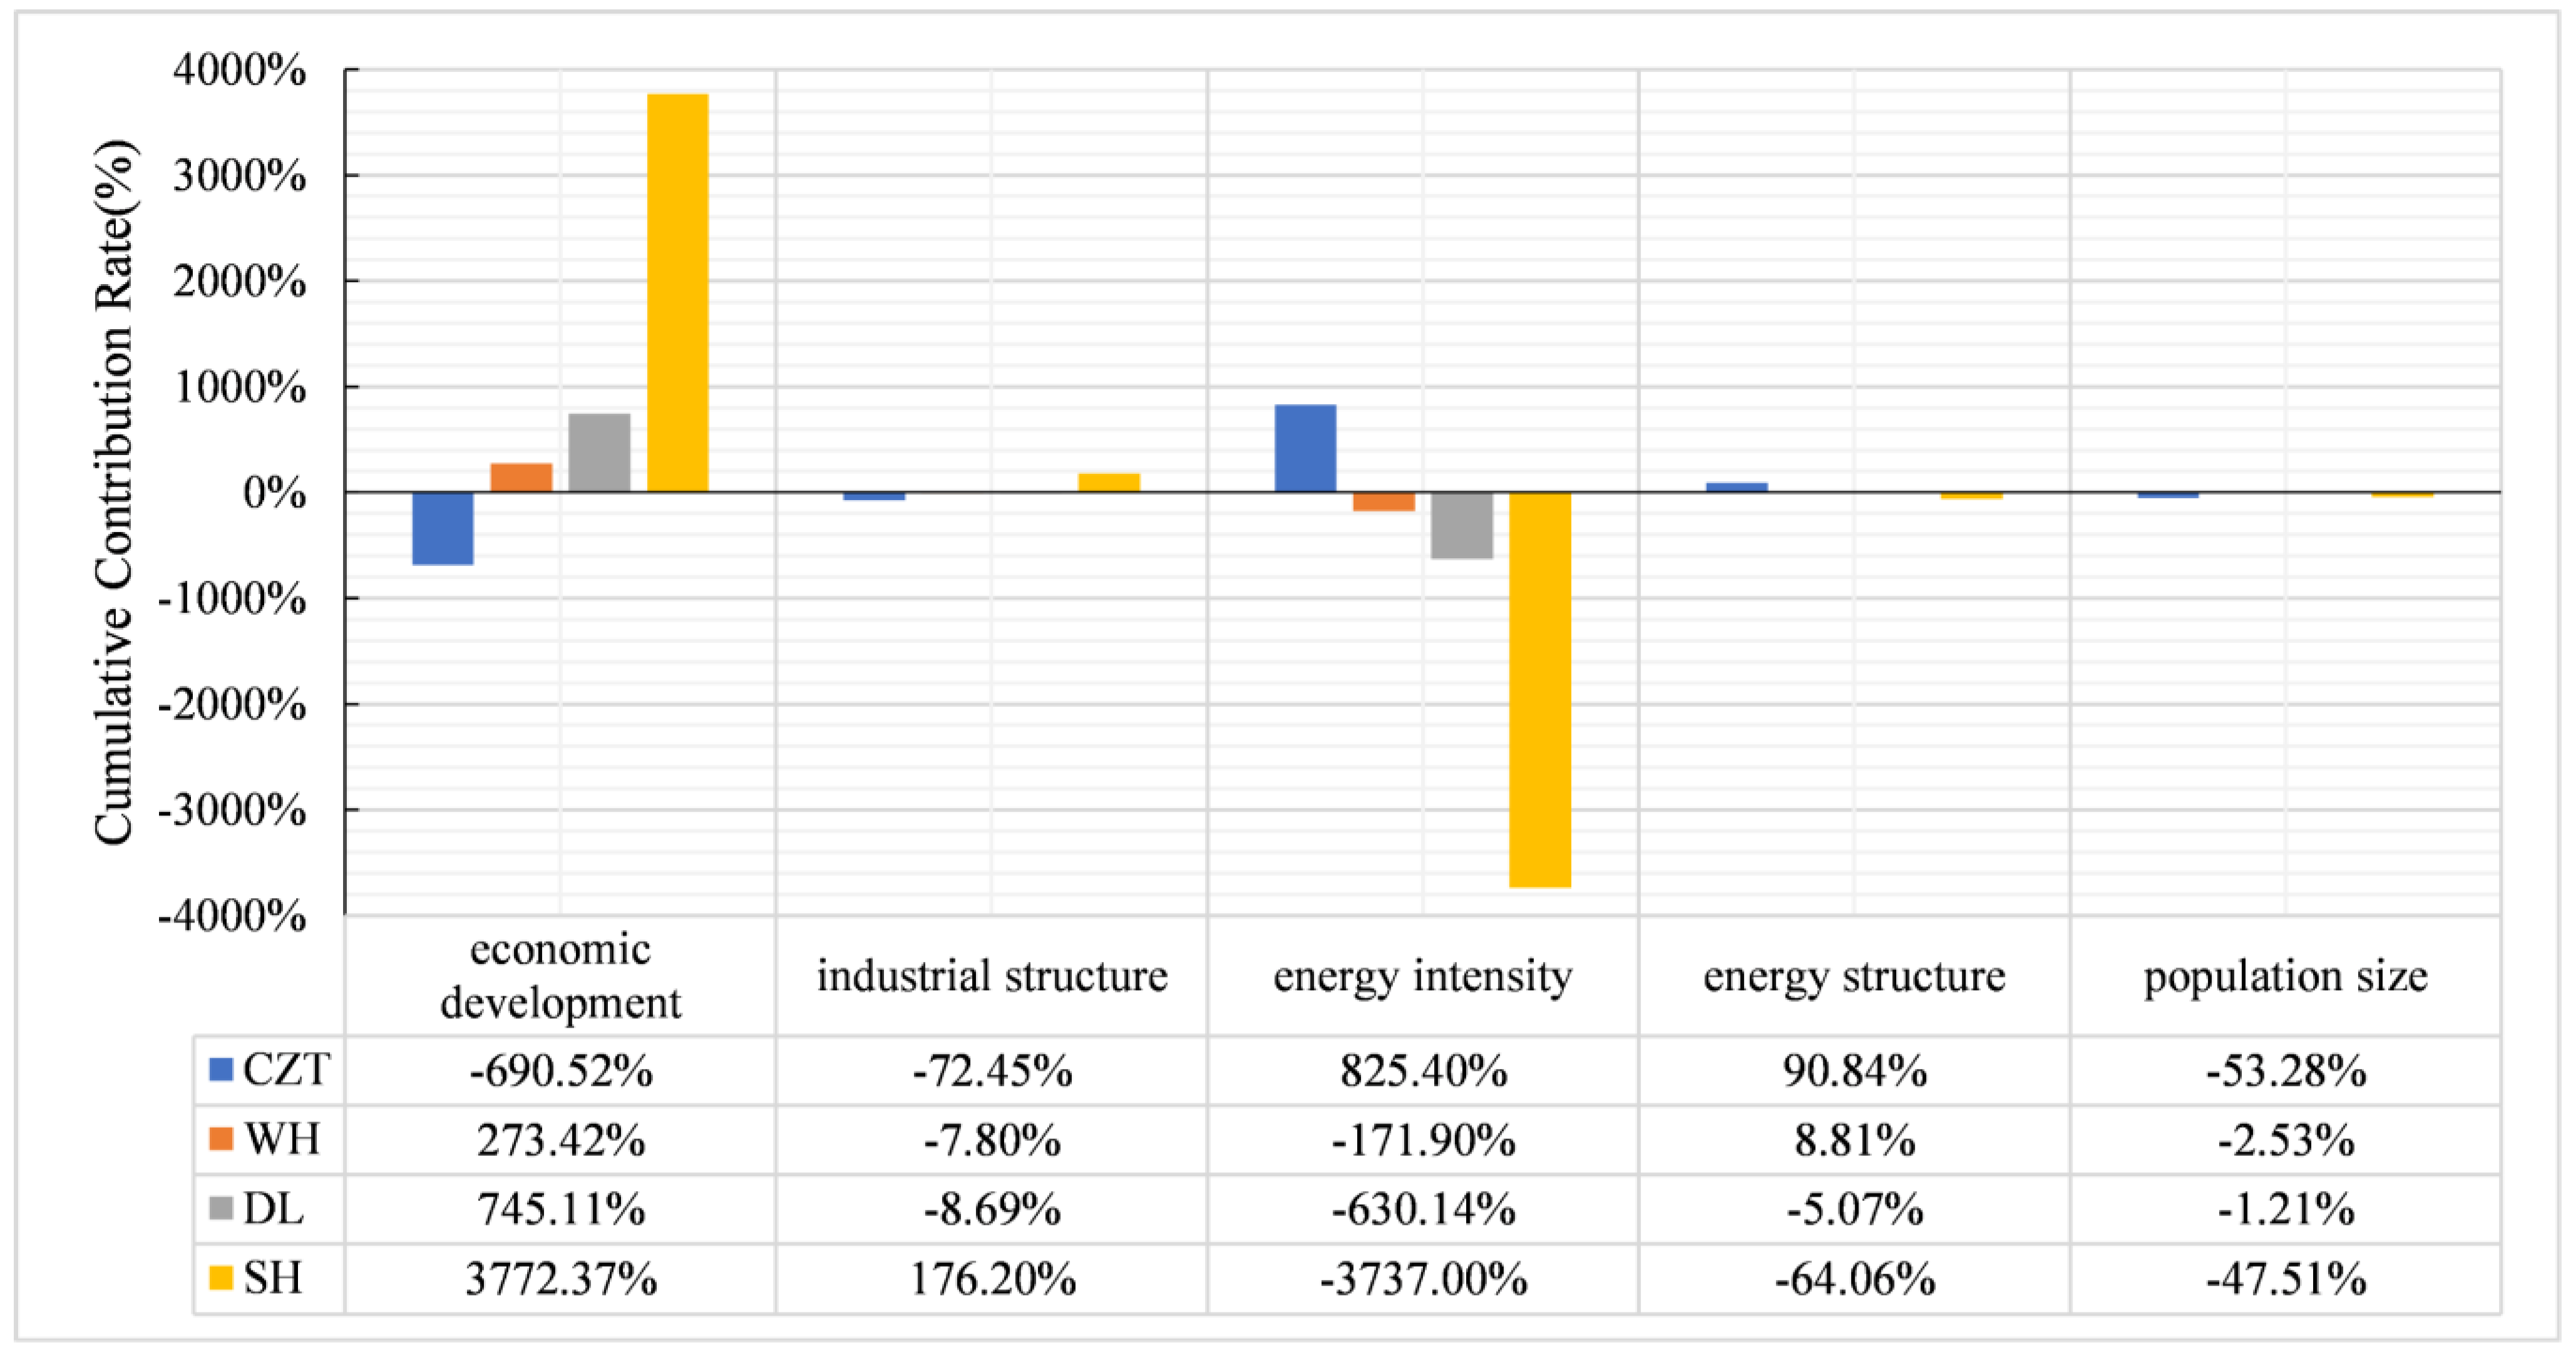
3.3.2. The Cumulative Contribution Rate

From the perspective of the cumulative contribution rate of the influencing factors, the effects of each factor varied widely across regions (Figure 9). The cumulative contribution rate of the same influence factor differed in different economic regions, and the spatial differences of different influencing factors were extremely significant. Combined with the analysis in Table 1, it can be seen that economic development has a positive effect on carbon emission increase in all four economic zones. Since only the total effect of the CZT Economic Zone is negative, when analyzing the influence effect of each factor in this economic zone with reference to the cumulative contribution rate, the reverse analysis should be conducted according to the positive or negative cumulative contribution values of the influencing factor.

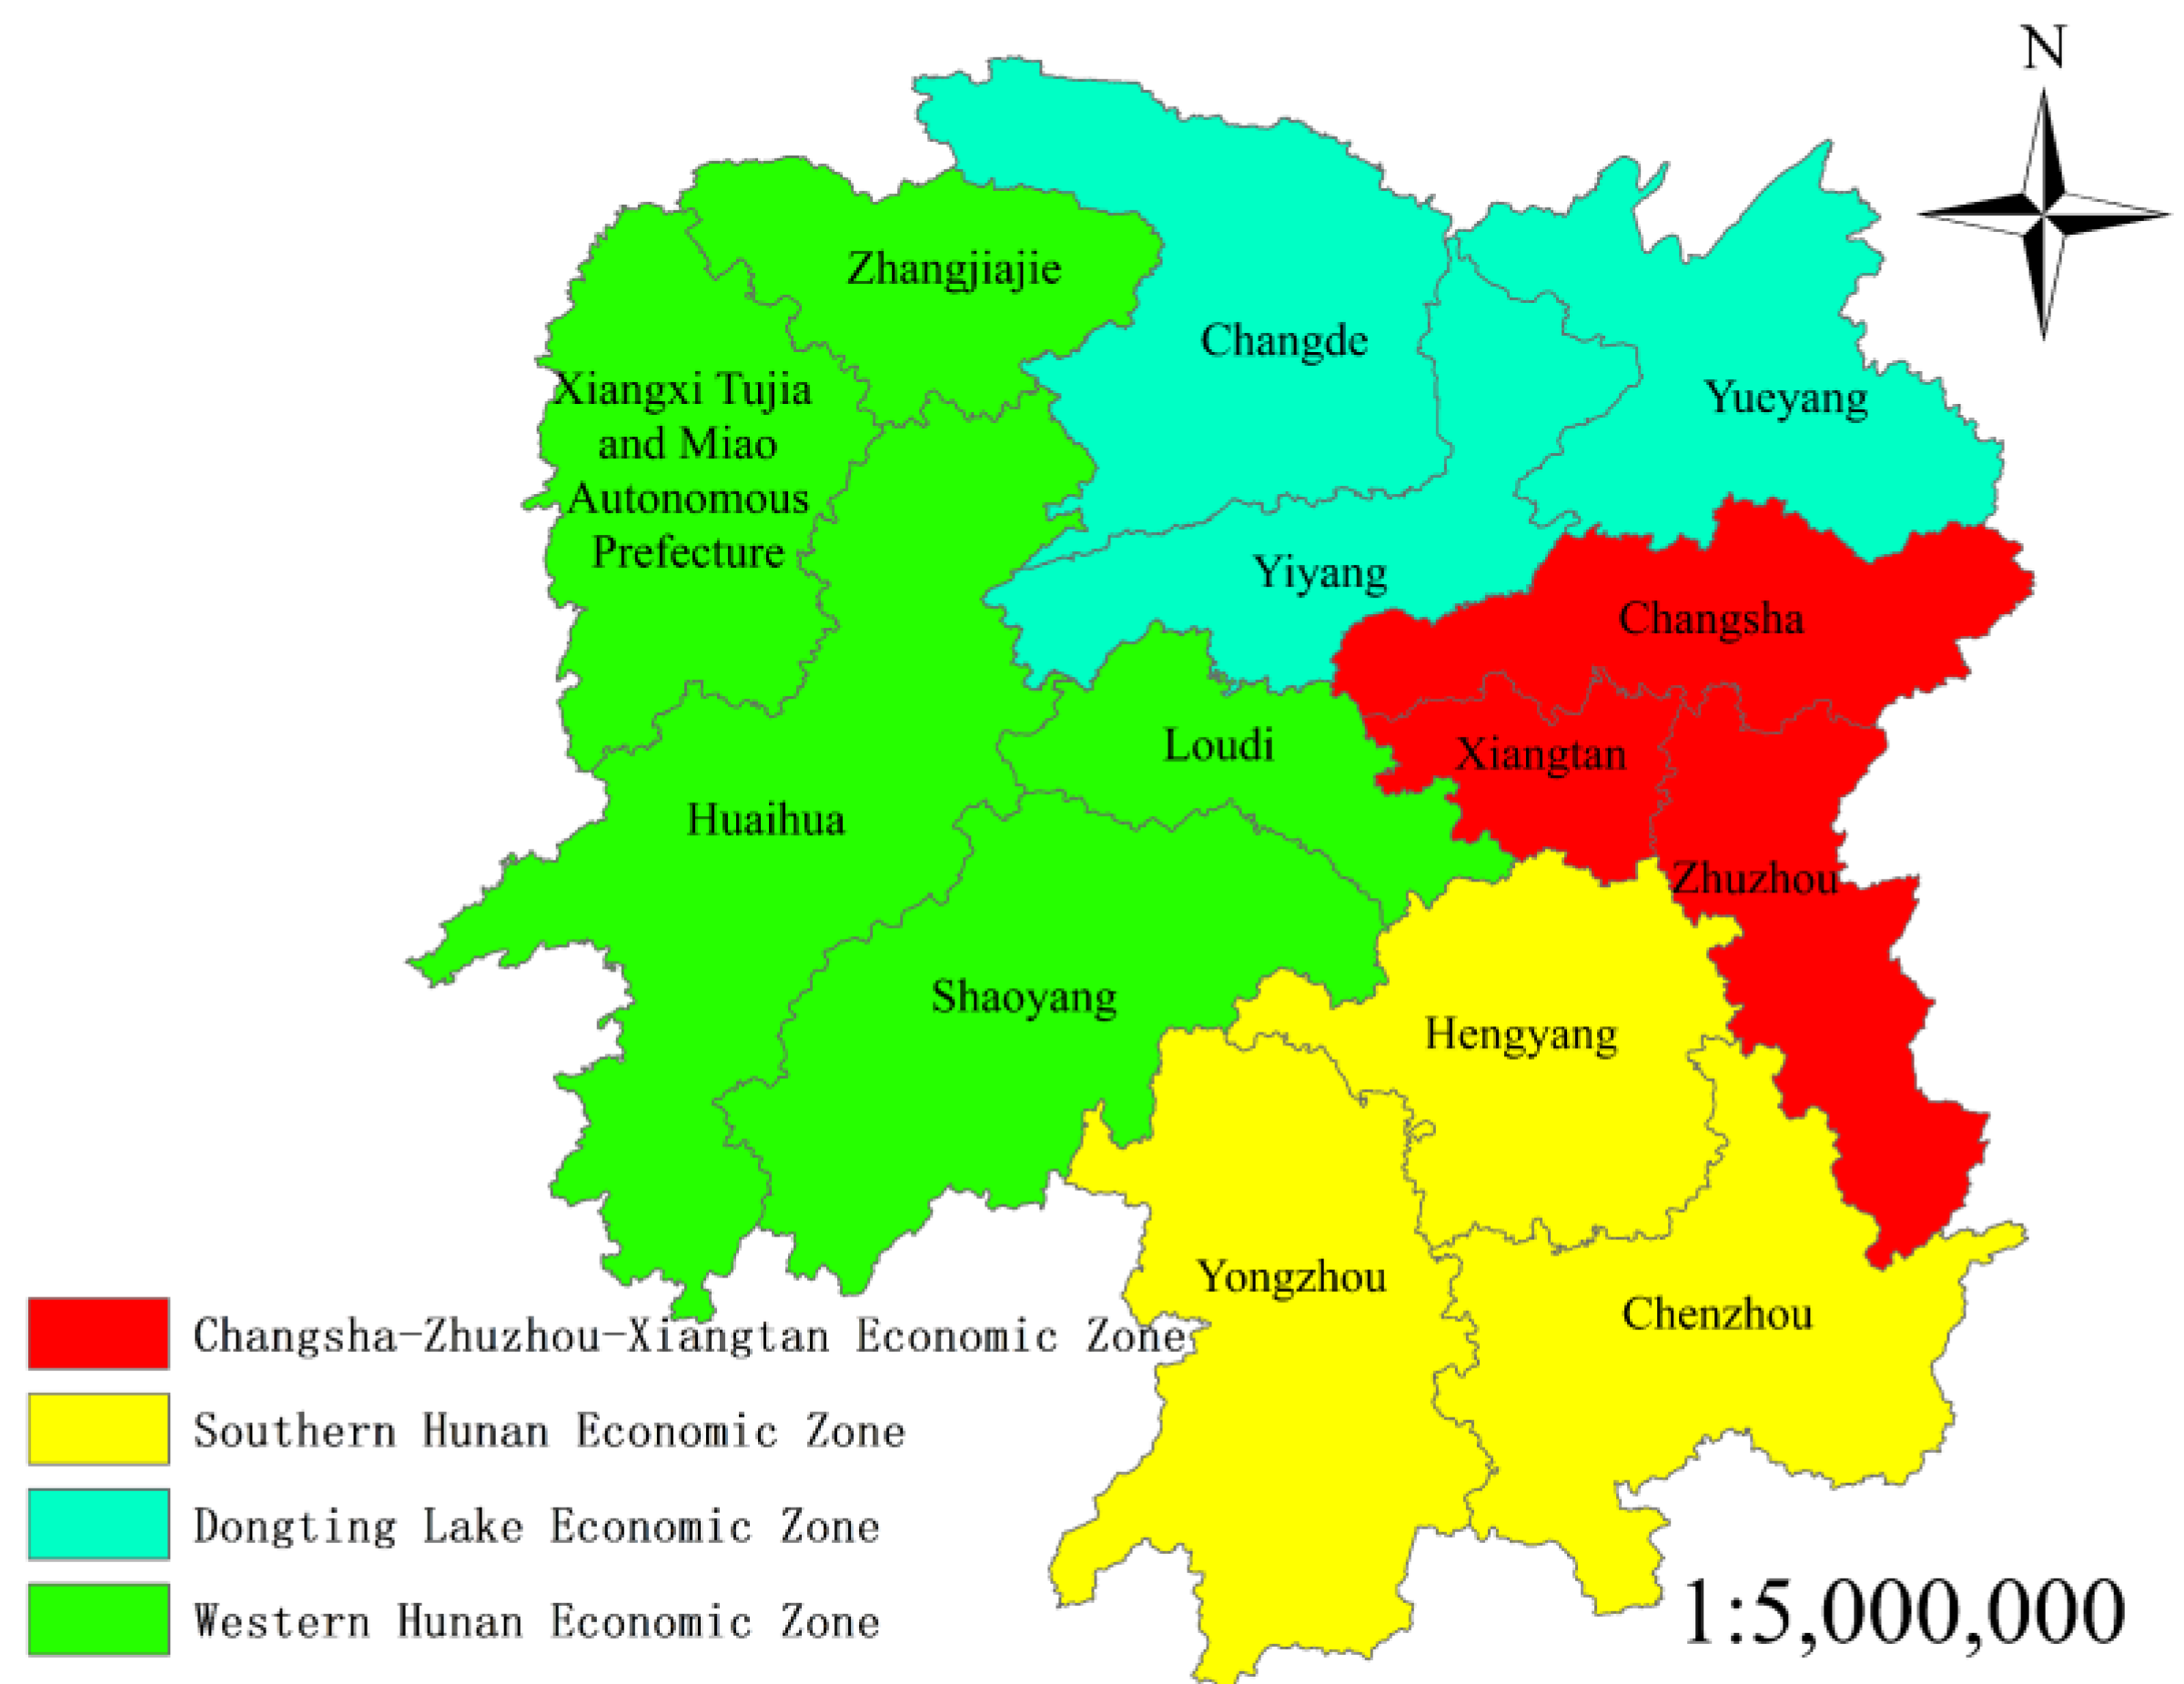
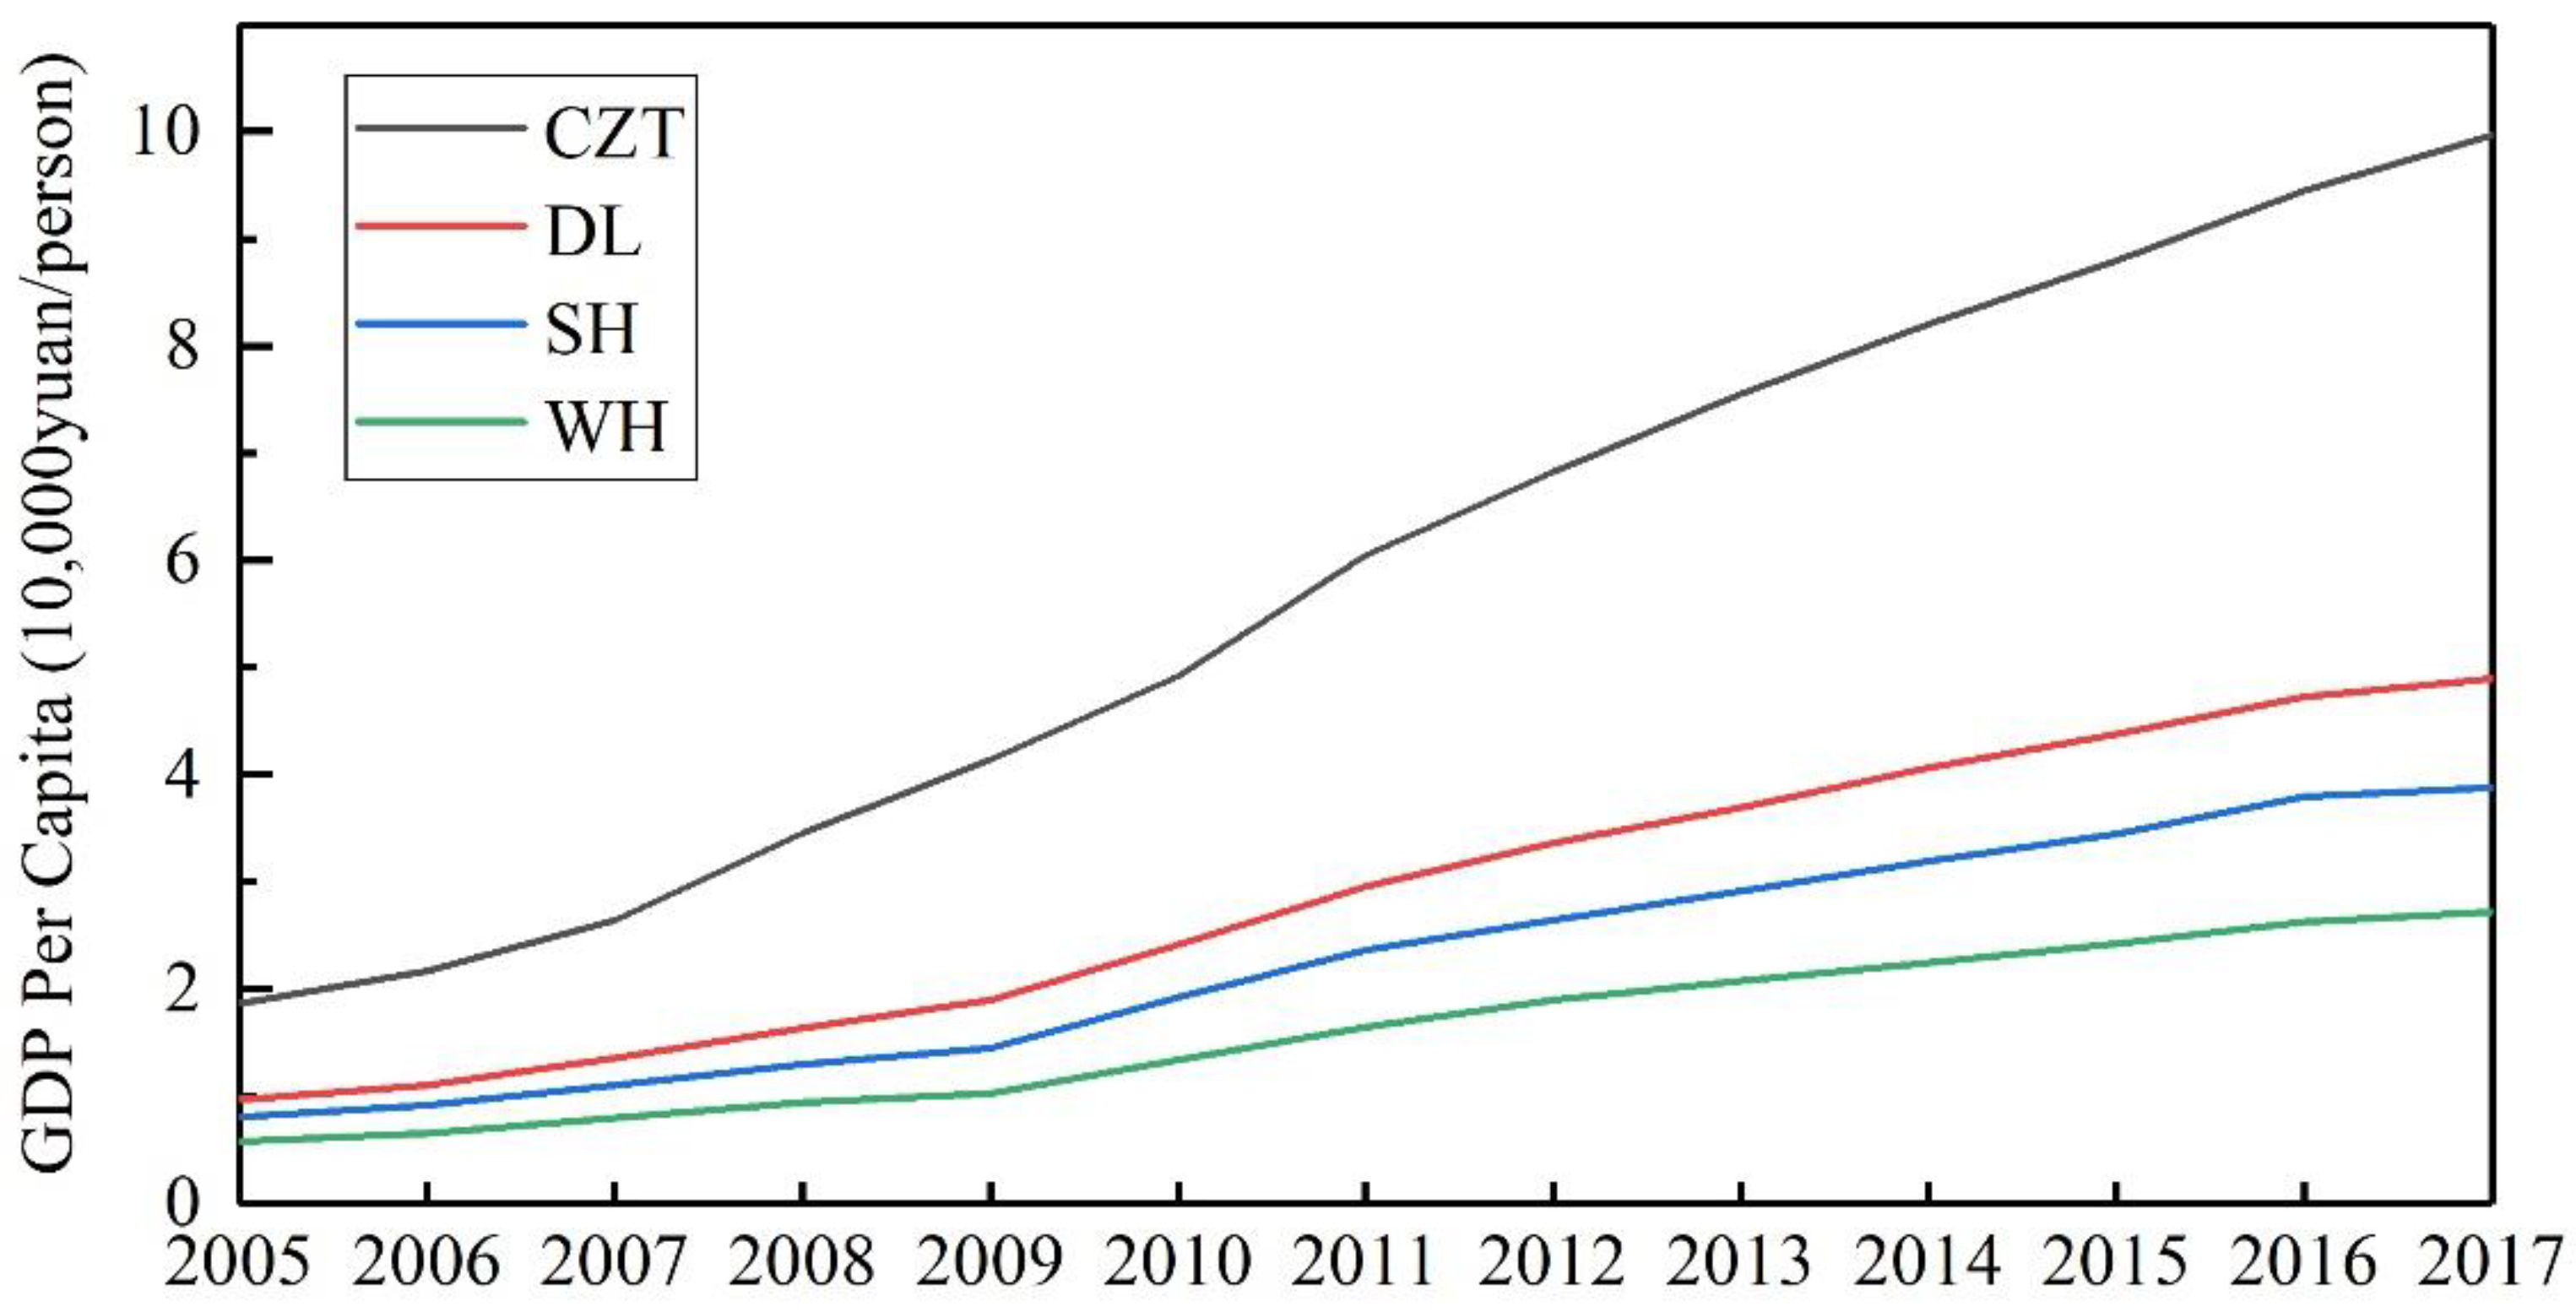
3.3.3. The Spatial Differences

(1) Economic expansion is an important driving factor for carbon emissions in various economic zones of Hunan province. The SH Economic Zone has the largest absolute value of the cumulative contribution of economic development, followed by the DL, CZT, and WH Economic Zones.
The relationship between the level of economic development and its effect strongly confirms the rationality of the Environmental Kuznets Curve (EKC). In the early stage of economic development, carbon emissions increase with the rapid development of the economy. The cumulative contribution of economic development in the SH Economic Zone is 3772.37%, which is 13.8 times higher than that of the WH Economic Zone (273.42%). This phenomenon is inextricably linked to the added value of regional GDP per capita (Figure 10). The cumulative increase in GDP per capita of SH and WH Economic Zones over the twelve years is 306.38 million yuan per person and 214.22 million yuan per person, respectively. Both of them belong to the relatively backward areas of economic development in the four economic zones. As the per capita income increases, environmental pollution increases at the same time. Therefore, the increase in GDP per capita causes the economic development factor to contribute more to the increase in carbon emissions. When economic development reaches a certain level, the degree of environmental pollution gradually slows down. The cumulative added value of GDP per capita in the CZT and DL Economic Zone during twelve years is 809.89 million yuan per person and 392.90 million yuan per person, which are 2.64 times and 1.28 times that of the SH Economic Zone, respectively. However, for the absolute value of the cumulative contribution of economic effects, the CZT Economic Zones (690.52%) and DL Economic Zones (745.11%) are much smaller than that of the SH Economic Zone (3772.37%). This indicates that the pull of economic growth on carbon emissions in the SH Economic Zone is larger than that in the CZT and DL Economic Zones.
CZT Economic Zone is a national two-oriented society pilot area, with a regional GDP accounting for 41.5% of the province, a per capita GDP of 99,700 yuan per person, and an average annual growth rate of 15.2% of GDP per capita as of 2017. The DL Economic Zone connects Changsha–Zhuzhou–Xiangtan, Wuhan, and other large urban agglomerations and owns the only international trade port in Hunan. As of 2017, the per capita GDP of DL Economic Zone reached 49,000 yuan per person, with an average annual growth rate of 14.6%, exceeding the two major economic regions of SH and WH Economic Zones. Therefore, after a certain stage of rapid economic development and increase in income level, carbon emissions are reduced due to the rising demand for environmental quality, the strengthening of environmental regulations, and the increasing investment in emission reduction. This is evidenced by the negative annual contribution of economic development in these two economic zones after 2012, which also confirms the existence of the EKC.
(2) Energy intensity has the greatest inhibiting effect on the carbon emissions of each zone in Hunan province. The SH Economic Zone (3737%) has the largest absolute values of the cumulative contribution of the energy intensity effect, followed by the CZT (825.4%) and DL (630.14%) Economic Zones, while the WH Economic Zone (171.9%) has the smallest effect. In addition, WH Economic Zone (1.97) has the largest mean value of energy intensity, followed by the DL (1.66) and SH (1.17) Economic Zones, while the CZT Economic Zone has the smallest value (0.67) in tons of standard coal per million yuan. The larger the average annual energy intensity of the region, the smaller the absolute value of the cumulative contribution of the energy intensity. Specifically, the WH Economic Zone has the largest average annual energy intensity and the smallest absolute value of the cumulative contribution of the energy intensity effect. It indicates that the change in energy intensity in the WH Economic Zone has the least effect on the reduction in carbon emissions. Therefore, the energy intensity of the WH economic zone has the largest room for reduction, and the room for the reduction in carbon emission by reducing energy consumption intensity is also the greatest.
(3) The industrial structure facilitates the reduction in carbon emissions in the DL and WH Economic Zones, while it causes emissions to be increased in CZT and SH Economic Zones. The SH Economic Zone has the largest absolute value of the cumulative contribution of the industrial structure effect, followed by the CZT, DL, and WH Economic Zones. It means that the change in industrial structure plays the biggest role in pulling and reducing carbon emissions in SH and WH Economic Zones, respectively. However, as the core of the Hunan economy, CZT Economic Zone has maintained an industrial structure dominated by industry for a long time. SH Economic Zone contains traditional industrial cities such as Hengyang. Since 2010, Hunan province has strengthened industrial structure adjustment and vigorously developed tertiary industry, which has reduced carbon emissions to a certain extent.
Figure 11 shows the share of industry in the GDP of the four economic zones throughout the period. Specifically, the average annual share of industrial output value in the WH Economic Zone is lower than that of the other three economic zones. However, the WH Economic Zone, which has the ancient city of Phoenix and the Zhangjiajie Scenic Area, is making great efforts to develop the tourism economy and increase the proportion of the tertiary industry. According to the calculation based on the statistical yearbook of Hunan province, as of the end of 2017, the proportion of secondary industry (35.68%) was much lower and the proportion of tertiary industry (50.59%) was higher than that of the other three economic zones. The strong development of the tertiary industry in WH Economic Zone is the reason why the cumulative contribution rate of its industrial structure effect is small and the industrial structure is conducive to reducing carbon emissions.
(4) The energy structure of most economic zones is beneficial to reducing carbon emissions, and it slightly promotes emission increases in the WH Economic Zone. The CZT Economic Zone has the largest absolute value of the cumulative contribution of the energy structure effect, followed by the SH, WH, and DL Economic Zones. The absolute value of the cumulative contribution rate is the largest in the CZT Economic Zone (90.84%), so the change in its energy structure plays the largest role in carbon emission reduction. The cumulative contribution of the energy structure effect in the WH Economic Zone is negative, indicating that its energy structure is the most unfavorable to curb carbon emissions. During the study period, the high energy-consuming industries in the WH economic zone were overrepresented, and the consumption of raw coal increased by 7.7483 million tons in 12 years, which was the highest among the four economic zones. Therefore, the energy structure of the WH Economic Zone is unreasonable and increases the carbon emissions from industrial energy consumption.
(5) The population size causes the increase in carbon emission in the CZT Economic Zone, while it facilitates the reduction in carbon emissions in the other three economic zones. The CZT Economic Zone has the largest absolute value of the cumulative contribution rate, followed by the SH, WH, and DL Economic Zones. Among them, the absolute value of the cumulative contribution in the CZT Economic Zone is 53.28% with a positive effect. It suggests that the change in population scale has the largest effect on carbon emissions. The negative effect of the population size in the SH Economic Zone (47.51%) indicates that the change in population size has the greatest effect on emission reduction. In contrast, it has a weak effect on emission reduction in the other two economic zones. Figure 12 shows the population size of the four economic zones in Hunan province in 2005 and 2017 and the average annual population growth rate during the 12 years. The average annual population growth rate of the WH, DL, and SH Economic Zones are all negative, with a cumulative population decrease of 361,300 people, 88,300 people, and 166,900 people. In contrast, the permanent resident population of the CZT Economic Zone shows an increasing trend year by year, with a cumulative population increase of 1,897,000 people in 12 years. The increase in population leads to an increase in energy consumption demand, which in turn leads to an increase in carbon emissions. Therefore, the population size has a significant effect on carbon emission increase in the CZT Economic Zone. To reduce the carbon emission caused by the population size, the population number and population growth rate need to be controlled within a reasonable range.

4. Discussion

Given the above analysis, the measures of sustainable development and the practical impact on a global scale are discussed from the following three dimensions.
First, there are obvious regional differences in the impact of industrial structure on carbon emissions. In particular, the secondary industry in the WH Economic Zone has the lowest proportion in GDP, while the tertiary industry accounts for 50.59%. This is the reason why the industrial structure of the WH Economic Zone has a strong carbon emission reduction effect. In practice, it is not advisable to forcibly control the proportion of the secondary and tertiary industries. For regions with unreasonable industrial structures worldwide, efforts should be made to optimize the industrial structure and vigorously develop an environmentally friendly economy. The government should implement differentiated industrial development policies to increase the proportion of low-emission and low-energy-consuming enterprises in the industry, regulate the three high enterprises and industries by macroeconomic means, and implement the withdrawal mechanism in accordance with the law. At the same time, the government should adjust the structure of import and export products, promote the export of low-carbon green products, and limit the export of high-energy-consuming and low-energy-efficient products. In addition, the government should promote the transformation and upgrading of traditional industries and accelerate the development of new industries. For instance, Hunan should take action to regulate vehicular emissions [45]. More importantly, the automotive industry in Hunan can gradually shift to the development and production of new energy vehicles and hybrid vehicles. The information industry and internet technology industry have limited energy consumption and environmental pollution; the software industry is intellectually and technologically intensive; the internet industry is also a low-energy consumption and zero pollution industry. The development of these industries is conducive to the low carbonization of industrial structure. Hunan can combine the existing comparative advantages in the industrial foundation, technology, and talents and build the electronic information industry into an industrial cluster with high reputation at home and certain influence in the world.
Second, economic development is one of the most important factors of carbon emission increase in the research region. This finding is similar to the results of previous studies [27,46]. The results show that the relationship between economic development and carbon emissions is consistent with the Environmental Kuznets Curve. Therefore, while ensuring forward economic development, improving the low-carbon market system is conducive to sustainable economic development. On the one hand, promulgation of special low-carbon economy laws will specifically guide and refine the development of low-carbon economy, energy emissions, and environmental governance and, at the same time, establish an effectiveness evaluation and feedback correction mechanism. On the other hand, the government should establish a carbon emissions trading and tax control mechanism. Specific measures may include implementation of differentiated emission taxes and environmental subsidies for enterprises with different carbon emission intensities. This approach can encourage enterprises to implement technological innovation and adjust corporate financing costs, thereby improving their energy use and production efficiency. In this way, enterprises can be encouraged to implement technological innovation and adjust corporate financing costs, thereby improving their energy use and production efficiency.
Third, technological innovation is an important driver of carbon emission reduction. It makes sense to increase scientific and technological investment in green production technologies and encourage the widespread use of renewable energy sources in various fields [47]. In particular, the government can establish special funds to support the three high enterprises with high potential for carbon emission reduction. Moreover, the government can improve the technological innovation of industrial industries. Enterprises should strive to learn from foreign advanced production processes and core energy technologies [48], eliminate outdated production equipment and production management methods, and improve product quality and production efficiency. For example, the manufacturing industry, which accounts for a large proportion of Hunan’s industry, can promote the consumption of backward production capacity, guide upstream and downstream enterprises to reorganize resources, and establish industrial clusters. At the same time, the innovation model of industry–university–research–use can be implemented to transform the comparative advantages into core technological advantages.

5. Conclusions and Outlook

5.1. Conclusions

The carbon emissions from industrial energy consumption are affected by many factors. A five-factor LMDI model was constructed to analyze the overall effect on carbon emission, the influence trend of the influencing factors, and spatial differences in four economic zones of Hunan province. Through the above research, the main conclusions are as follows.
(1) The overall effect of all influencing factors on carbon emission reduction in Hunan province changed from inhibiting effect to promoting effect after 2011, indicating that carbon emission reduction in Hunan province is gradually achieved. On the whole, the influencing factors of economic development, population size, and industrial structure facilitate the emission increase, while energy intensity and energy structure facilitate the emission reduction. Among them, economic development has the strongest ability to increase carbon emissions, while energy intensity contributes the most to carbon emission reduction. Population size makes a small contribution to the increase in carbon emissions. Industrial structure shows a trend of promoting and then inhibiting carbon emissions. The carbon emission reduction effect of energy structure is very weak.
(2) In terms of the spatial effect, the overall effect of the influencing factors promotes carbon emission reduction only in the CZT Economic Zone and increases carbon emission in the WH, DL, and SH Economic Zones. Therefore, the CZT Economic Zone is the key area to achieve carbon emission reduction in Hunan province, while the other three economic zones still have the phenomenon of the emission increase.
(3) For all economic zones, economic development contributes the most to the increase in carbon emissions. The relationship between the level of economic development and the effect of economic development on carbon emissions in the four economic zones conforms to the Environmental Kuznets Curve. The energy intensity of each zone shows the strongest inhibitory effect. Industrial structure has a detrimental impact on carbon emission reduction in DL and WH Economic Zone. In addition to the WH Economic Zone, the energy structure of other economic zones has contributed to reducing carbon emissions. Population size only leads to the increase in carbon emissions in the CZT Economic Zone, which is related to the increasing population in this area.

5.2. Outlook

Due to the limited availability and great difficulty in obtaining data, this paper has measured and analyzed the data from 2005 to 2017. In the next research stage, the author will consider analyzing the fluctuation in carbon emission data during the COVID-19 period and its aftereffects.
This paper has analyzed the influence degree and spatial characteristics of carbon emission factors in Hunan province and its four economic zones. However, the marginal contribution of each influencing factor to carbon emissions has not been measured. In future research, reasonable econometric models can be used to measure the marginal effects of various factors. In addition, the cross-section weighted variable coefficient regression model based on the panel data can be constructed to analyze the spatial differences in the impact of factors in each zone on overall carbon emissions.

Author Contributions

Conceptualization, S.Y. and H.L.; methodology, S.Z.; validation, S.Y., H.L. and G.D.; formal analysis, S.Z.; resources, H.L. and G.D.; data curation, S.Y.; writing—original draft preparation, S.Y., S.Z. and H.L.; writing—review and editing, S.Y., S.Z. and H.L.; visualization, S.Z.; project administration, S.Y. All authors have read and agreed to the published version of the manuscript.

Funding

This research was funded by the National Natural Science Foundation Project of China under Grant No. 72088101.

Institutional Review Board Statement

Not applicable.

Informed Consent Statement

Not applicable.

Data Availability Statement

The data presented in this study are openly available in the Hunan Statistical Yearbook, https://navi.cnki.net/knavi/yearbooks/YHNJJ/detail?uniplatform=NZKPT (accessed on 28 September 2022); Hunan Energy Statistics Yearbook, https://navi.cnki.net/knavi/yearbooks/YHNNT/detail?uniplatform=NZKPT (accessed on 28 September 2022); and China Energy Statistics Yearbook, https://navi.cnki.net/knavi/yearbooks/YCXME/detail (accessed on 28 September 2022), reference numbers are [42,43,44].

Acknowledgments

The authors would like to express their thanks to the National Natural Science Foundation.

Conflicts of Interest

The authors declare no conflict of interest.

Abbreviations

CTotal carbon emissions
GCTotal industrial output
ETotal energy consumption
PPopulation size
EGEconomic development
JGIndustrial structure
EIEnergy intensity
ESEnergy structure
CECarbon emission factor
ΔCChange in carbon emissions (unit: 10,000 tons)
ΔCceContribution values of change in carbon emission factor (unit: 10,000 tons)
ΔCpContribution values of change in population size (unit: 10,000 tons)
ΔCegContribution values of change in economic development (unit: 10,000 tons)
ΔCjgContribution values of change in industrial structure (unit: 10,000 tons)
ΔCeiContribution values of change in energy intensity (unit: 10,000 tons)
ΔCesContribution values of change in energy structure (unit: 10,000 tons)
Δrsddecomposition residual
CZTChangsha–Zhuzhou–Xiangtan Economic Zone
SHSouthern Hunan Economic Zone
WHWestern Hunan Economic Zone
DLDongting Lake Economic Zone

References

  1. Yusuf, M.; Bazli, L.; Alam, M.A. Hydrogen production via natural gas reforming: A comparative study between DRM, SRM and BRM techniques. In Proceedings of the 2021 Third International Sustainability and Resilience Conference: Climate Change, Sakheer, Bahrain, 15 November 2021. [Google Scholar]
  2. Qureshi, F.; Yusuf, M.; Pasha, A.A.; Khan, H.W.; Imtayaz, B.; Irshad, K. Sustainable and energy efficient hydrogen production via glycerol reforming techniques: A review. Int. J. Hydrog. Energy 2022, 47, 41397–41420. [Google Scholar] [CrossRef]
  3. Qureshi, F.; Yusuf, M.; Kamyab, H.; Vo, D.N.; Chelliapan, S.; Joo, S.-W.; Vasseghian, Y. Latest eco-friendly avenues on hydrogen production towards a circular bioeconomy: Currents challenges, innovative insights, and future perspectives. Renew. Sustain. Energy Rev. 2022, 168, 112916. [Google Scholar] [CrossRef]
  4. Notice of the State Council on Printing and Distributing the Comprehensive Work Plan for Energy Conservation and Emission Reduction during the 14th Five-Year Plan. Available online: http://www.gov.cn/zhengce/content/2022-01/24/content_5670202.htm (accessed on 27 September 2022).
  5. Ang, B.W.; Liu, N. Handling zero values in the logarithmic mean Divisia index decomposition approach. Energy Policy 2007, 35, 238–246. [Google Scholar] [CrossRef]
  6. Wang, Y. Research on Spatial-Temporal Characteristics and Regional Difference of Influencing Factors of Carbon Dioxide Emissions in China; Tianjin University: Tianjin, China, 2016. [Google Scholar]
  7. Ang, B.W. Decomposition methodology in industrial energy demand analysis. Energy 1995, 20, 1081–1095. [Google Scholar] [CrossRef]
  8. Ang, B.W.; Zhang, F.Q. A survey of index decomposition analysis in energy and environmental analysis. Energy 2000, 25, 1149–1176. [Google Scholar] [CrossRef]
  9. Ang, B.W.; Choi, K.-H. Decomposition of aggregate energy and gas emission intensities for industry: A refined Divisia index method. Energy J. 1997, 18, 59–73. [Google Scholar] [CrossRef]
  10. Ang, B.W. Decomposition analysis for policymaking in energy: Which is the preferred method? Energy Policy 2004, 32, 1131–1139. [Google Scholar] [CrossRef]
  11. Ang, B.W. The LMDI approach to decomposition analysis: A practical guide. Energy Policy 2005, 33, 867–871. [Google Scholar] [CrossRef]
  12. Ang, B.W.; Liu, F.L. A new energy decomposition method: Perfect in decomposition and consistent in aggregation. Energy 2001, 26, 537–548. [Google Scholar] [CrossRef]
  13. Ang, B.W.; Zhang, F.Q.; Choi, K. Factorizing changes in energy and environmental indicators through decomposition. Energy 1998, 23, 489–495. [Google Scholar] [CrossRef]
  14. Su, B.; Ang, B.W. Structural decomposition analysis applied to energy and emissions: Some methodological developments. Energy Economics 2012, 34, 177–188. [Google Scholar] [CrossRef]
  15. Sheinbaum, C.; Ruíz, B.J.; Ozawa, L. Energy consumption and related CO2 emissions in five Latin American countries: Changes from 1990 to 2006 and perspectives. Energy 2011, 36, 3629–3638. [Google Scholar] [CrossRef]
  16. González, D.; Martínez, M. Changes in CO2 emission intensities in the Mexican industry. Energy Policy 2012, 51, 149–163. [Google Scholar] [CrossRef]
  17. González, D.; Martínez, M. Decomposition analysis of CO2 emissions in the Mexican industrial sector. Energy Sustain. Dev. 2012, 16, 204–215. [Google Scholar] [CrossRef]
  18. O’Mahony, T. Decomposition of Ireland’s carbon emissions from 1990 to 2010: An extended Kaya identity. Energy Policy 2013, 59, 573–581. [Google Scholar] [CrossRef] [Green Version]
  19. O’Mahony, T.; Zhou, P.; Sweeney, J. The driving forces of change in energy-related CO2 emissions in Ireland: A multi-sectoral decomposition from 1990 to 2007. Energy Policy 2012, 44, 256–267. [Google Scholar] [CrossRef] [Green Version]
  20. Hammond, G.P.; Norman, J.B. Decomposition analysis of energy-related carbon emissions from UK manufacturing. Energy 2012, 41, 220–227. [Google Scholar] [CrossRef] [Green Version]
  21. Tunç, G.I.; Türüt-Aşık, S.; Akbostancı, E. A decomposition analysis of CO2 emissions from energy use: Turkish case. Energy Policy 2009, 37, 4689–4699. [Google Scholar] [CrossRef]
  22. Oh, I.; Wehrmeyer, W.; Mulugetta, Y. Decomposition analysis and mitigation strategies of CO2 emissions from energy consumption in South Korea. Energy Policy 2010, 38, 364–377. [Google Scholar] [CrossRef]
  23. Jung, S.; An, K.J.; Dodbiba, G.; Fujita, T. Regional energy-related carbon emission characteristics and potential mitigation in eco-industrial parks in South Korea: Logarithmic mean Divisia index analysis based on the Kaya identity. Energy 2012, 46, 231–241. [Google Scholar] [CrossRef]
  24. Lee, K.; Oh, W. Analysis of CO2 emissions in APEC countries: A time-series and a cross-sectional decomposition using the log mean Divisia method. Energy Policy 2006, 34, 2779–2787. [Google Scholar] [CrossRef]
  25. Li, H.; Lu, Y.; Zhang, J.; Wang, T. Trends in road freight transportation carbon dioxide emissions and policies in China. Energy Policy 2013, 57, 99–106. [Google Scholar] [CrossRef]
  26. Wang, W.; Liu, R.; Zhang, M.; Li, H. Decomposing the decoupling of energy-related CO2 emissions and economic growth in Jiangsu Province. Energy Sustain. Dev. 2013, 17, 62–71. [Google Scholar] [CrossRef]
  27. Liu, K.; Xie, X.; Zhao, M.; Zhou, Q. Carbon Emissions in the Yellow River Basin: Analysis of Spatiotemporal Evolution Characteristics and Influencing Factors Based on a Logarithmic Mean Divisia Index (LMDI) Decomposition Method. Sustainability 2022, 14, 9524. [Google Scholar] [CrossRef]
  28. Videras, J. Exploring spatial patterns of carbon emissions in the USA: A geographically weighted regression approach. Popul Environ. 2014, 36, 137–154. [Google Scholar] [CrossRef]
  29. Chen, J.; Lin, Y.; Wang, X.; Mao, B.; Peng, L. Direct and Indirect Carbon Emission from Household Consumption Based on LMDI and SDA Model: A Decomposition and Comparison Analysis. Energies 2022, 15, 5002. [Google Scholar] [CrossRef]
  30. Guo, W.X.; Sun, H. A Grey Correlation Analysis of Carbon Emission and Industrial Structure Carbon Locked in Northwest Five Provinces. J. Ind. Technol. Econ. 2018, 37, 119–127. [Google Scholar]
  31. OY, Q.; Li, Q. Grey Relational Analysis and Forecast of Hunan Carbon Emissions Influencing Factors. J. Chang. Univ. Sci. Technol. 2012, 27, 65–69. [Google Scholar]
  32. Yuan, Y.; Qi, Y. The drivers of Tianjin CO2 emission identified base on the grey relational analysis. Environ. Pollut. Control 2013, 35, 101–106. [Google Scholar]
  33. Song, F.; Ma, J. Grey correlation analysis of industrial structure and carbon emission in Inner Mongolia. J. Inn. Mong. Agric. Univ. 2014, 77, 30–35. [Google Scholar]
  34. Li, C.; Tang, D.; Chang, F. Research on carbon emissions driving factors of Nanjing based on grey correlation model. J. Nanjing Univ. Inf. Sci. Technol. 2016, 8, 365–373. [Google Scholar]
  35. Yang, Y. A Study on the Driving Factors Behind Carbon Emissions in Tangshan City Based on Grey Relational Analysis. J. Tangshan Univ. 2017, 30, 66–71. [Google Scholar]
  36. Wang, C. Dynamic Gray Relation Analysis of Factors Affecting Carbon Emissions in China’s Manufacturing Industry. J. Nanjing Univ. Aeronaut. Astronaut. 2013, 15, 25–29. [Google Scholar]
  37. Xie, S.; Shao, Z.; Ding, H. Decomposition and Gray Correlation Analysis on Wuxi’s Industrial Carbon Emissions. Urban Dev. Stud. 2012, 19, 113–117. [Google Scholar]
  38. IPCC. IPCC Guidelines for National Greenhouse Gas Inventories. 2006. Available online: https://www.ipcc-nggip.iges.or.jp/public/2006gl/chinese/index.html (accessed on 28 September 2022).
  39. Liu, X.; Chen, H.; Peng, C.; Li, M. Assessing the Drivers of Carbon Intensity Change in China: A Dynamic Spatial–Temporal Production-Theoretical Decomposition Analysis Approach. Sustainability 2022, 14, 12359. [Google Scholar] [CrossRef]
  40. Dong, J.; Li, C.; Wang, Q. Decomposition of carbon emission and its decoupling analysis and prediction with economic development: A case study of industrial sectors in Henan Province. J. Clean. Prod. 2021, 321, 129019. [Google Scholar] [CrossRef]
  41. Xu, G.; Liu, Z.; Jiang, Z. Decomposition Model and Empirical Study of Carbon Emissions for China, 1995–2004. China Popul. Resour. Environ. 2006, 16, 158–161. [Google Scholar]
  42. Hunan Statistical Yearbook. Available online: https://navi.cnki.net/knavi/yearbooks/YHNJJ/detail?uniplatform=NZKPT (accessed on 28 September 2022).
  43. Hunan Energy Statistics Yearbook. Available online: https://navi.cnki.net/knavi/yearbooks/YHNNT/detail?uniplatform=NZKPT (accessed on 28 September 2022).
  44. China Energy Statistics Yearbook. Available online: https://navi.cnki.net/knavi/yearbooks/YCXME/detail (accessed on 28 September 2022).
  45. Singh, T.S.; Rajak, U.; Verma, T.N.; Nashine, P.; Mehboob, H.; Manokar, A.M.; Afzal, A. Exhaust emission characteristics study of light and heavy-duty diesel vehicles in India. Case Stud. Therm. Eng. 2022, 29, 101709. [Google Scholar] [CrossRef]
  46. Mu, D.; Hanif, S.; Alam, K.M.; Hanif, O. A Correlative Study of Modern Logistics Industry in Developing Economy and Carbon Emission Using ARDL: A Case of Pakistan. Mathematics 2022, 10, 629. [Google Scholar] [CrossRef]
  47. Chaurasiya, P.K.; Rajak, U.; Veza, I.; Verma, T.N.; Ağbulut, Ü. Influence of injection timing on performance, combustion and emission characteristics of a diesel engine running on hydrogen-diethyl ether, n-butanol and biodiesel blends. Int. J. Hydrogen Energy 2022, 47, 18182–18193. [Google Scholar] [CrossRef]
  48. Verma, T.N.; Rajak, U.; Dasore, A.; Afzal, A.; Manokar, A.M.; Aabid, A.; Baig, M. Experimental and empirical investigation of a CI engine fuelled with blends of diesel and roselle biodiesel. Sci. Rep. 2021, 11, 18865. [Google Scholar] [CrossRef]
Figure 1. The effect of different factors on the change in carbon emissions in Hunan province.
Sustainability 14 15868 g001
Figure 2. Cumulative effect of different factors on the change in carbon emissions in Hunan province.
Sustainability 14 15868 g002
Figure 3. Cumulative contribution rate of different factors on the change in carbon emissions in Hunan province from 2005 to 2017.
Sustainability 14 15868 g003
Figure 4. Trend of carbon emission and energy intensity growth rate in Hunan province from 2005 to 2017.
Sustainability 14 15868 g004
Figure 5. Diagram of the four economic zones in Hunan province.
Sustainability 14 15868 g005
Figure 6. Effect of each factor on the change in carbon emissions in the four zones. (a) CZT Zone; (b) WH Economic Zone; (c) DL Economic Zone; and (d) SH Economic Zpyone.
Sustainability 14 15868 g006
Figure 7. Cumulative effect of different factors on the change in carbon emissions in the four regions. (a) CZT Economic Zone; (b) WH Economic Zone; (c) DL Economic Zone; and (d) SH Economic Zone.
Sustainability 14 15868 g007
Figure 8. Total effect contribution of influencing factors of carbon emission in four economic zones (unit: 10,000 tons).
Sustainability 14 15868 g008
Figure 9. Cumulative contribution rate of different influencing factors in four economic zones of Hunan province.
Sustainability 14 15868 g009
Figure 10. Trend of GDP per capita in four economic regions of Hunan province.
Sustainability 14 15868 g010
Figure 11. The ratio of the industry to GDP in four economic regions of Hunan province.
Sustainability 14 15868 g011
Figure 12. Population size and population growth rate of four economic zones in Hunan province (unit: 10,000 people).
Sustainability 14 15868 g012
Table 1. Effects of carbon emissions from energy consumption in four economic zones of Hunan province.
ZoneTotal EffectEconomic
Development Effect
Industrial
Structure Effect
Energy Intensity EffectEnergy Structure EffectPopulation Size Effect
CZT+++
DL++
SH+++
WS+++
Note: “+” and “−” represent the effect on carbon emission increase and carbon emission reduction.
Publisher’s Note: MDPI stays neutral with regard to jurisdictional claims in published maps and institutional affiliations.

