

A Development of Green Finance and Regional Eco-Efficiency in China
1
School of Economics, Shandong University of Technology, Zibo 255049, China
2
School of Economics, Ocean University of China, Qingdao 266005, China
3
School of Economics and Management, Southeast University, Nanjing 210096, China
*
Author to whom correspondence should be addressed.
Sustainability 2022, 14(22), 15206; https://doi.org/10.3390/su142215206
Submission received: 18 September 2022
/
Revised: 30 October 2022
/
Accepted: 3 November 2022
/
Published: 16 November 2022
(This article belongs to the Special Issue Sustainable Perspectives: Renewable Energy Policy and Economic Development)
Abstract
:Based on panel data collected from 30 Chinese provinces between 2009 and 2020, we used the Super-SBM model to calculate regional eco-efficiency (EE) and analyze its spatial–temporal evolution characteristics. Furthermore, we constructed SDM to analyze the direct impact and spillover effect and tested its mechanism with a mediating effects model. According to the SDM results, it is confirmed that both the direct impact of green financial development on regional eco-efficiency improvement and the spatial spillover effects on neighboring provinces have a “U” shaped relationship, and there is significant heterogeneity among the three major regions of China (East, Central, and West). The intermediary effect model found an asset scale and technological progress effect. Based on the findings of the study, policy implications are proposed to expand the scale of green finance, promote its coordinated regional development, promote technological progress and expand the scale of capital.
1. Introduction
In the context of the “30· 60” dual-carbon goal, the 2021 Chinese government work report proposes to implement a particular policy on financial support for green and low-carbon development, and green finance will be the main focus of future policies. Green finance pays attention to environmental factors and regional eco-efficiency that can reflect the concept of green development in terms of ecological environment and economic development. Ultimately it leads to sustainability in production systems [1,2,3,4,5]. This study focused on the direct and spatial spillover effects of green finance development on regional eco-efficiency from a spatial perspective, providing theoretical support for China’s green development.
Green finance refers to the financial instruments that invest in greening activities [6]. Green finance takes environmental protection as its main purpose and promotes social and economic green development. Financial products can help green and environmental protection enterprises access financial support [7]. However, financial products may be misused [8]. Green financial derivative products can reduce investment in high-polluting enterprises and are essential for the sustainable development of society and the economy [9]. Scholars constructed green financial evaluation systems from the aspects of financial instruments, institutions, and supervision to measure green finance [10,11] and analyzed the current development status and existing problems from the perspectives of financial institutions and countries and regions [12]. In response to the problems existing in financial institutions, such as the lack of diversification of green financial products, some scholars proposed policies to improve green finance products [13]. From the perspective of countries, they face challenges such as small-scale green finance financing, unbalanced regional development, and slow development speed. All departments should work together to increase support for green finance so that green industries can stimulate green finance development [14].
Schaltegger and Sturn [15] proposed ecological efficiency, referring to the rational allocation of natural, economic, and social factors to maximize desired output and minimize polluting output [16]. Initially, scholars used a single ratio method to measure regional eco-efficiency, but this method was limited to studying the impact of a single environment on regional eco-efficiency [17]. The indicator method overcomes the limitation of a single environmental impact but increases the uncertainty of subjective factors in the weighting process [18]. The model methods for evaluating regional eco-efficiency include the TOPSIS model [19], the stochastic frontier model [20], and the ecological footprint method [21]. However, the above research methods cannot reflect the comprehensiveness and complexity of the economic production process and the correlation between different ecological and environmental pressures. Therefore, most scholars used the data envelopment model [22]. In addition to using traditional DEA models, scholars have also improved DEA models to obtain more accurate measurement results, such as the two-stage network DEA [23], the super-efficiency DEA [24], and the Super-SBM model [25]. On this basis, scholars have further explored the driving factors. Studies have shown that factors such as urbanization rate, industrial structure characteristics, scientific and technological investment, population growth, and so on, are all important driving factors for the improvement of regional eco-efficiency [26].
Green finance integrates the financial and environmental industries and is crucial to regional eco-efficiency enhancement [27]. Therefore, scholars have begun to study their (or similar concepts) correlations. Green finance considers economic development and ecological protection by reducing financial support for industries with high pollution [28,29]. The pollutant caused negative impacts on humans. Green finance is an environmental regulation measure that aids in the construction of the ecological environment. Environmental regulations can direct corporations to prioritize environmental benefits and improve regional eco-efficiency.
A summary of the literature review and research gap is given in Table A2. Previous studies mainly focused on either green finance or regional eco-efficiency and the impact of green finance development on the economy or environment. The current study emphasizes green finance as an entry point. It integrates economic, environmental, and spatial factors, and constructs an SDM and an intermediary effects model to study its direct impact, spillover effects, and intermediary effects based on analyzing the spatial and temporal evolution characteristics of regional eco-efficiency. Moreover, the study focuses on regional heterogeneity. It provides a theoretical basis for coordinated regional development and a new perspective for enhancing regional eco-efficiency.
2. Mechanisms of Green Finance Development Affecting Regional Eco-Efficiency
Following the studies of Levine [30] and Hsu [31] on financial functions, we discuss green finance’s economic and environmental benefits. Due to the lack of relevant research and the complexity of the impact pathways, it is not easy to analyze all pathways in a comprehensive overview. Therefore, we focused on two of its most important mechanisms of action: the asset scale effect and the technological progress effect.
2.1. Asset Scale Effect
There are two ways to the asset scale effect based on capital supply, capital allocation, and the risk management function of green finance. On one hand, at low economic levels and at the expense of consuming massive resources to promote rapid economic growth and cause a lot of pollution emissions, green financial development increases the ecological burden, hindering regional eco-efficiency improvement. On the other hand, when the economy exceeds a certain level, green finance-driven economic growth also pays attention to ecological and environmental protection. The government actively promotes the green transformation of the economy to improve regional eco-efficiency [32]. Although China has begun to focus on environmental protection in recent years, its low level of economic development and its status as an economic transition country has had a more negative than positive impact on the asset scale effect transmission mechanism. To accurately explain, we proposed the given hypothesis:
Hypothesis 1.
There is an asset scale effect. Green finance inhibits regional eco-efficiency improvement.
2.2. Technological Progress Effect
Based on the capital supply and innovation incentive function of green finance, enterprises obtain financial support through green finance to compensate for the lack of funds caused by scientific and technological research activities, and they have sufficient funds to support technological innovation [33]. On one hand, by taking the lead in adopting environmentally friendly technologies and developing and producing green products, enterprises can gain a “first mover advantage” in the market, thereby gaining more profits, compensating for economic losses caused by environmental regulations, and promoting economic growth. On the other hand, technological progress is conducive to reducing energy consumption, resource utilization, and pollution emissions, thereby enhancing regional eco-efficiency. We proposed hypothesis 2 to explain accurately:
Hypothesis 2.
There is a technological progress effect. Green finance improves regional eco-efficiency by promoting technological progress.
3. Materials and Methods
3.1. Study Area
We selected 30 provinces and cities in China as the initial research sample. Based on the level of economic development and geographical location, the 30 provinces of China are divided into three economic regions: eastern, central, and western (Table A1). In particular, the data were collected from 2009 to 2020. The study area excludes Tibet, Hong Kong, Macau, and Taiwan. It is mainly based on the following reasons: Firstly, the data of the four places excluded above are incomplete and not scientifically rigorous enough. Secondly, green finance in China started with the “Green Credit Guidelines” issued by the Environmental Protection Administration in 2007. Due to the time lag of the policy, green finance was in its early stages in 2007 and 2008. It was immature, and there was no systematic statistical data.
3.2. Selection of Indicators and Source of Data
3.2.1. Indicator Selection
Explained Variable—Regional Eco-Efficiency (EE)
We followed a study conducted by Yan and Tu [26] to construct the regional eco-efficiency assessment index system (as shown in Table 1) consisting of five categories of factors, namely: water, energy, land, labor, and capital, which are selected to represent natural resources and economic factor inputs, respectively. The expected economic output is expressed in regional GDP, and water and air pollution are selected to represent the non-expected output of ecological and environmental loads.
The traditional DEA model ignores the slackness of inputs and outputs and has the disadvantage that efficiency values cannot exceed one, making comparisons between DMUs impossible. The Super-SBM model is presented by Tone [34], which effectively solved the problem of slack measurement and overcame the traditional DEA model’s flaw that the efficiency value cannot exceed one, allowing comparison of DMUs with efficiency values of one. In this study, some provinces with eco-efficiency values exceed one. Therefore, the Super-SBM model included non-desired outputs chosen with Equation (1).
where is DMU in the system, each DMU includes kinds of inputs, kinds of expected outputs and kinds of unexpected outputs., and are the elements in the input matrix (), the expected output matrix ), and the unexpected output matrix (, respectively. p represents the efficiency value of the DMU.
Core Explanatory Variables-Green Finance Development Index (GF)
We followed the study of Zeng et al. [35] and constructed the green finance development level evaluation index system from four dimensions: green credit, green investment, green insurance, and carbon finance. We use the entropy method to calculate GF. The criterial of evaluation of Indicator System of the GF is given in Table 2. Since carbon finance aims to reduce greenhouse gas emissions and has a significant impact on the reduction of emissions. Therefore, this study uses carbon intensity to measure carbon finance. Drawing on the calculations provided by the United Nations Intergovernmental Panel on Climate Change (IPCC), CO2 emissions are expressed as the multiplication of energy consumption and the energy CO2 emission factor, including raw coal, coke, crude oil, gasoline, paraffin, diesel, fuel oil, and natural gas. The energy and CO2 emission factor were collected using the 2006 IPCC Guidelines for National Greenhouse Gas Inventories.
Mediating Variables
The asset scale (AS) and technological progress (TP) were chosen to represent the effect of the asset scale and technological progress. The asset scale (AS) is expressed as the increasing rate of total fixed asset investment and can reflect changes in the scale of social assets. The technological progress (TP) is expressed in the number of patent applications granted, which can accurately reflect the level of science and technology in each region.
Other Control Variables
Other control variables included Industrial Structure (Industry), FDI, Human Capital (Human), and Scientific and Technological Research Investment (ST) are given in Table 3. The industry is represented by the proportion of the tertiary industry’s output value to the province’s GDP, promoting low-pollution development for regional eco-efficiency. FDI is measured by the proportion of foreign direct investment in the province’s GDP, broadening financing channels, and attracting international talent and advanced technology [33], which will generate economic and ecological effects to improve regional eco-efficiency. Human Capital is measured by the proportion of the employed population with higher education, representing the labor force level. ST is expressed as the proportion of government investment in science and technology in fiscal expenditure, which promotes technological innovation and improves regional eco-efficiency.
3.2.2. Source of Data
The data were collected from the Wind database, the China Statistical Yearbook, the China Financial Yearbook, the China Energy Statistical Yearbook, the Banking Social Responsibility Report, the China Insurance Yearbook, the China Environmental Yearbook, the China Science and Technology Statistical Yearbook, and the statistical yearbooks of various provinces. The energy CO2 emission factor was collected from the 2006 IPCC Guidelines for National Greenhouse Gas Inventories.
3.3. Model Setting
3.3.1. Spatial Measurement Model
Green finance, as a financial instrument that serves to construct an ecological environment, is also an environmental regulation measure. This paper fully considers the spatial factors and uses the SDM to analyze the nonlinear impact. The spatial weight matrix influences the measurement results. We use the following matrix:
Binary adjacency weight matrix:
It is difficult to comprehensively describe the complex spatial effects between regions by only considering geographical factors to construct a weight matrix. Therefore, this paper introduces economic factors. denotes the straight-line distance between the city center of the region and the region . and show the average real GDP of the region and the region respectively. The economic geography nested weight matrix formula can be written as:
According to the characteristics of green finance on regional eco-efficiency, we introduce the quadratic term GF, consider the spatial lag term of explanatory variables, and construct SDM for empirical studies. The model can be constructed as:
where AGF is used as the square term of the GF, represents the control variable, W denotes the economic geography nested matrix, denotes the spatial autoregressive coefficient, indicates the intercept term, is the constant, are the coefficients of the spatial cross-product term of each explanatory variable, and and represent the time-fixed effects and area-fixed effects, respectively. denotes the random error term, which is assumed to be generally distributed at zero mean value [36,37,38] and constant variance [39,40,41].
3.3.2. Mediating Effect Model
To verify hypotheses 1 and 2, we determined the mediating effect model of Wen et al. [42], the causal stepwise regression method. Furthermore, we estimated the regression models of the GF on EE, the GF on intermediate variable M (AS and TP), and the GF and intermediate variable M (AS and TP) on EE. The asset scale and technological progress mechanism between green finance and regional eco-efficiency was also determined. To accomplish the analysis, the following regression functions are used:
where , , are constants. , and are the coefficients of variables. is the intermediate variable and represents the control variable. is the random error that is assumed to be normally distributed at zero mean value and constant variance.
4. Results and Discussion
4.1. Temporal and Spatial Evolution Characteristics of Regional Eco-Efficiency
4.1.1. Time-Series Evolution Characteristics
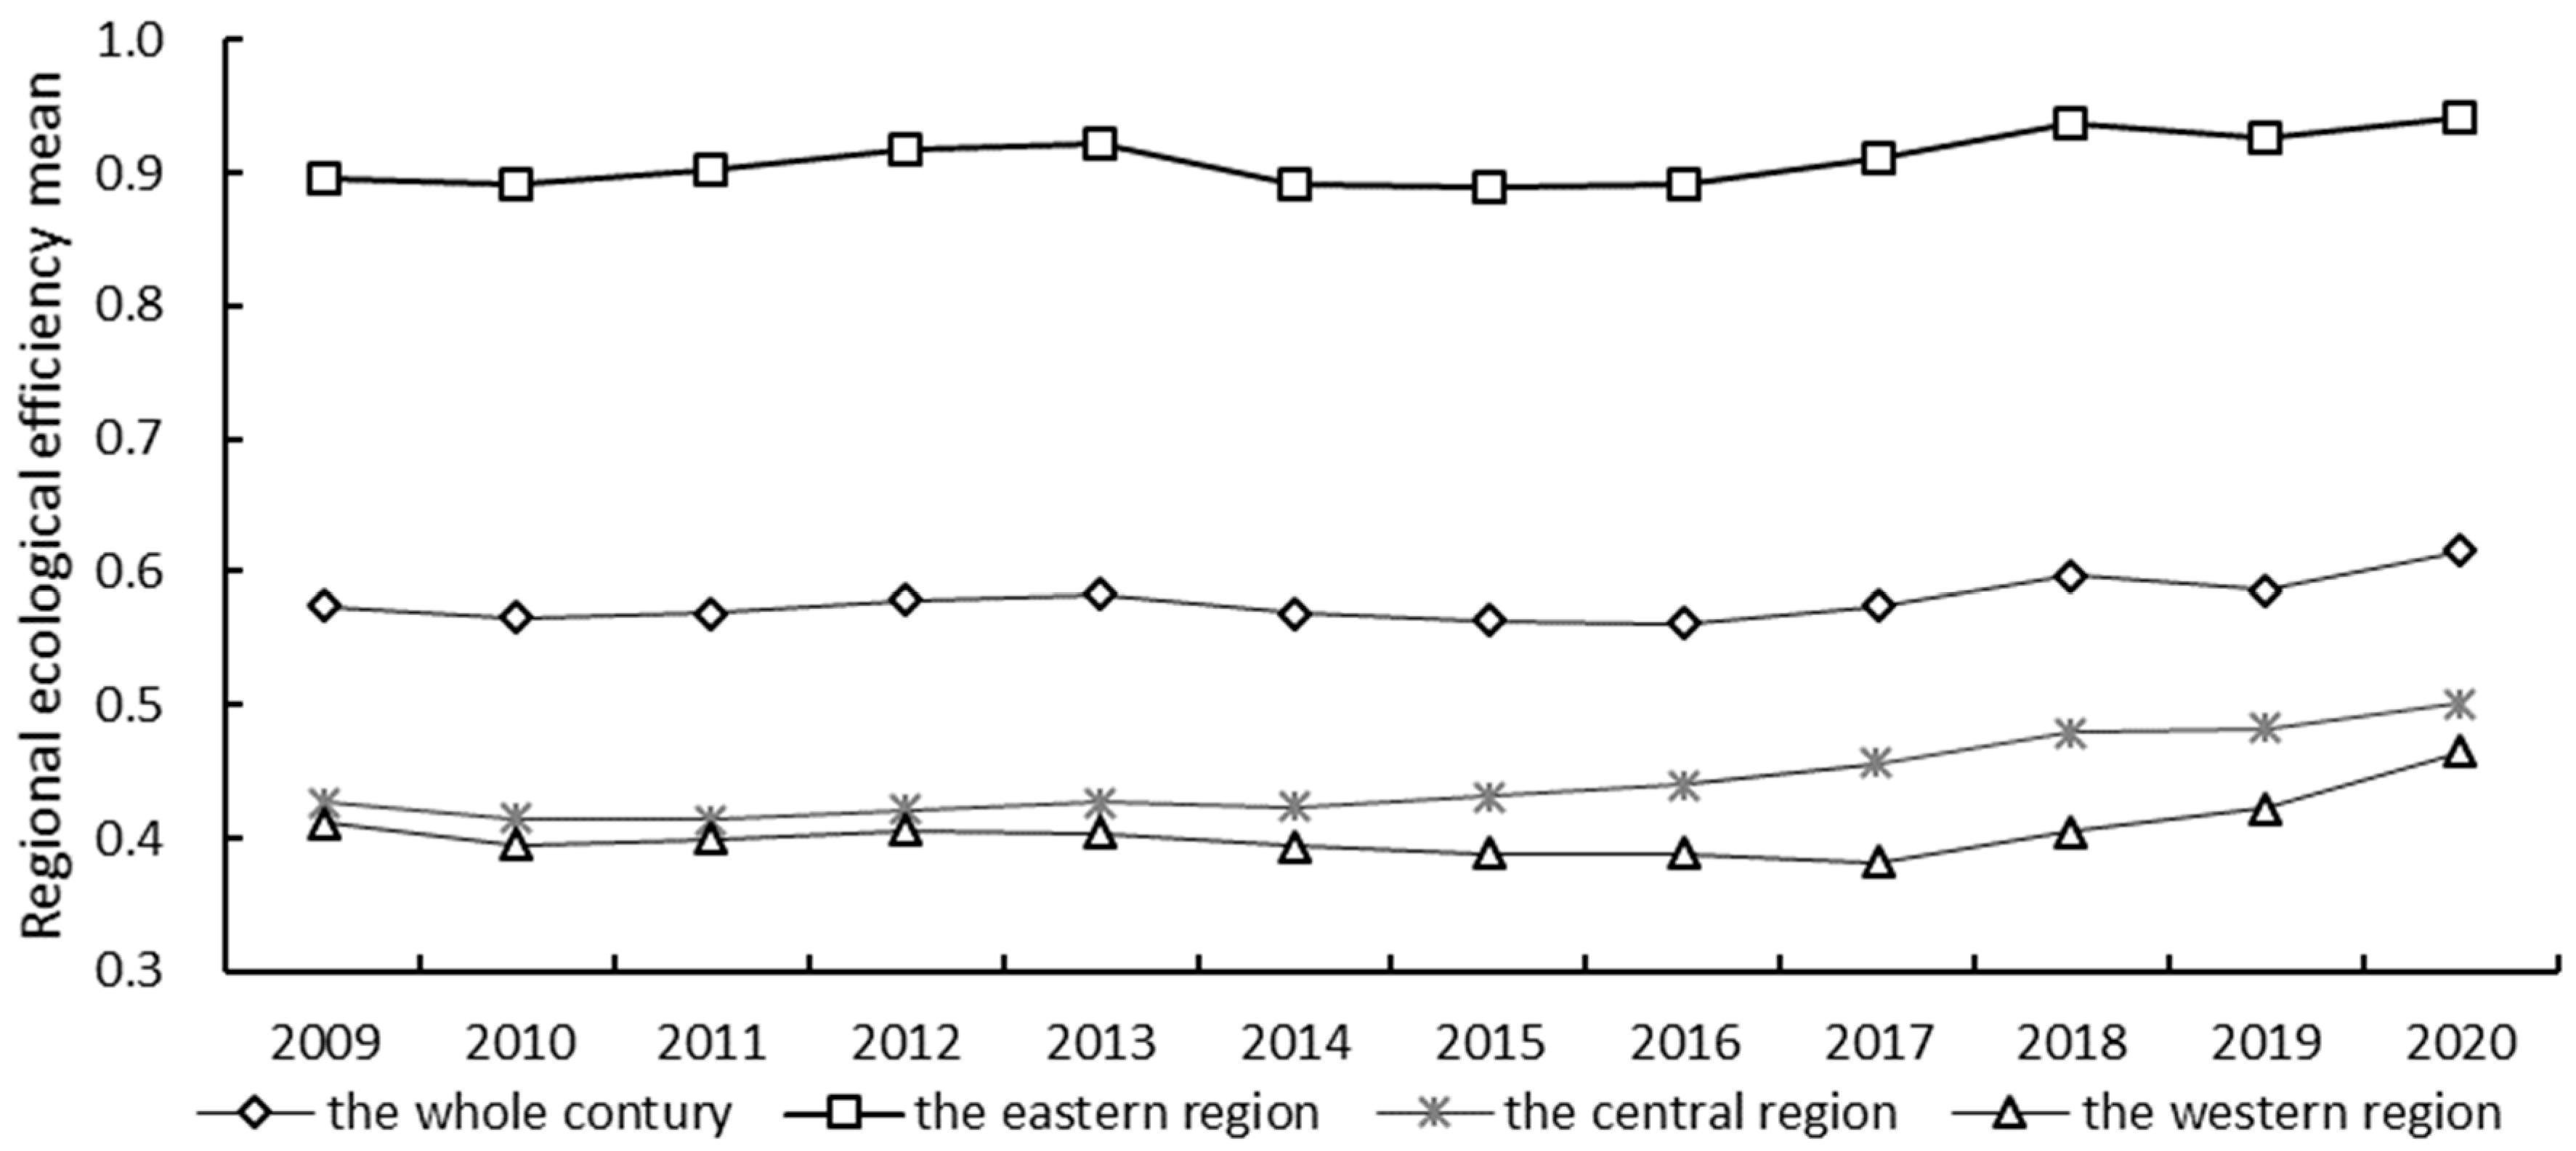
Figure 1 illustrates an overall change in regional eco-efficiency. It can be seen that the overall change is stable and showed a slight decline followed by an increase. There was a downward trend from 2009 to 2015, but the decline was small and, after 2016, there was an upward trend. The eastern region has a better foundation in natural conditions and economic development. Therefore, a higher regional eco-efficiency was found; however, the central and western regions have a poorer foundation, and therefore a lower regional eco-efficiency was found. Overall, the eco-efficiency of the national average is relatively low. In the past, China mainly focused on the consumption of energy and resources to achieve a target of economic growth and, therefore, less emphasis was placed on the deterioration of the environment. The country has realized the importance of environmental protection and has taken specific measures. However, due to the exploratory stage, it is not easy to achieve balanced development of the economy and environment. With excessive environmental pollution penalties, the production cost of the enterprise is too high, causing some enterprises to abandon production and affect economic output. When the environmental pollution penalty is too low, enterprises pursue profit maximization at the cost of pollution emissions, slightly improving the ecological environment. In recent years, with the accumulation of environmental governance experience, it has been possible to achieve balanced economic growth and ecological development effectively and take reasonable measures to control environmental pollution. Simultaneously, due to the lag of environmental pollution control measures, regional eco-efficiency has increased as environmental governance has produced effects to improve the ecological environment.
4.1.2. Evolution Characteristics of the Spatial Pattern
As shown in Figure 2, the visualization is processed with 2009, 2015, and 2020 as the representative years. There are five classes based on the characteristics of the distribution of regional eco-efficiency values. During the study period, the eco-efficiency showed a small decrease followed by an increase, with the turning point being 2015, so the years 2009, 2015, and 2020 were chosen for visualization. There are large spatial differences, with the overall distribution pattern being “high in the eastern region, and low in the central and western regions”. From an economic point of view, the economic benefits are higher in the east, caused by a combination of factors such as history, geography, and production methods. Since the Song Dynasty, China’s economic center has shifted to eastern coastal areas, and the gap has further widened after reform and opening. Due to natural factor constraints, backward infrastructure, and weak awareness of the commodity economy, development in inland areas is hindered. Regarding the ecological environment, economic agents in the eastern regions are highly aware of environmental protection, have earlier realized the environmental problems caused by the high-input and high-pollution mode of economic development, and have actively changed their economic development model. Based on better economic development, they have abandoned the highly polluting heavy industry development model, promoted industrial upgrading, guided capital flow into green industries, and vigorously developed technology-intensive and knowledge-intensive new industries. At the same time, the government has formulated environment-oriented policies, increased financial support for environmental pollution control, and adopted measures such as defining environmental pollution property rights and increasing environmental pollution taxes to improve the economic development structure, further enhancing regional eco-efficiency and promoting ecological construction. In the central region, the rich natural resources and the relative convenience of transportation provide the conditional basis for resource-consuming industries. The high output value of the heavily polluting industries has led to massive resource consumption and severe ecological pollution. It caused the central region’s eco-efficiency to be relatively low. The western region is an ecologically fragile area, with poor ecological carrying capacity, lack of natural resources, underdeveloped transportation, and a poor foundation for economic development, resulting in low regional eco-efficiency. With the regional differences, coordinated development should be promoted, ecological environment construction should be strengthened, development gaps between regions should be narrowed, and regional eco-efficiency should be developed in a balanced manner.
4.2. Impact Analysis
4.2.1. Spatial Autocorrelation
Global Spatial Correlation
Aggregation within the whole space is analyzed by global spatial autocorrelation, which we measure by the commonly used Moran’s I index.
where represents the total number of provinces, shows the observed value of the province, and denotes the mean. Similarly, the values of the spatial weight matrix are denoted by .
As shown in Table 4, Moran’s I for both the GF and EE in China from 2009 to 2020 are positive. It indicates that China’s provinces are not completely randomly distributed. Both the GF and EE have a positive spatial autocorrelation and significant spatial aggregation was observed in areas with similar levels.
Local Spatial Correlation
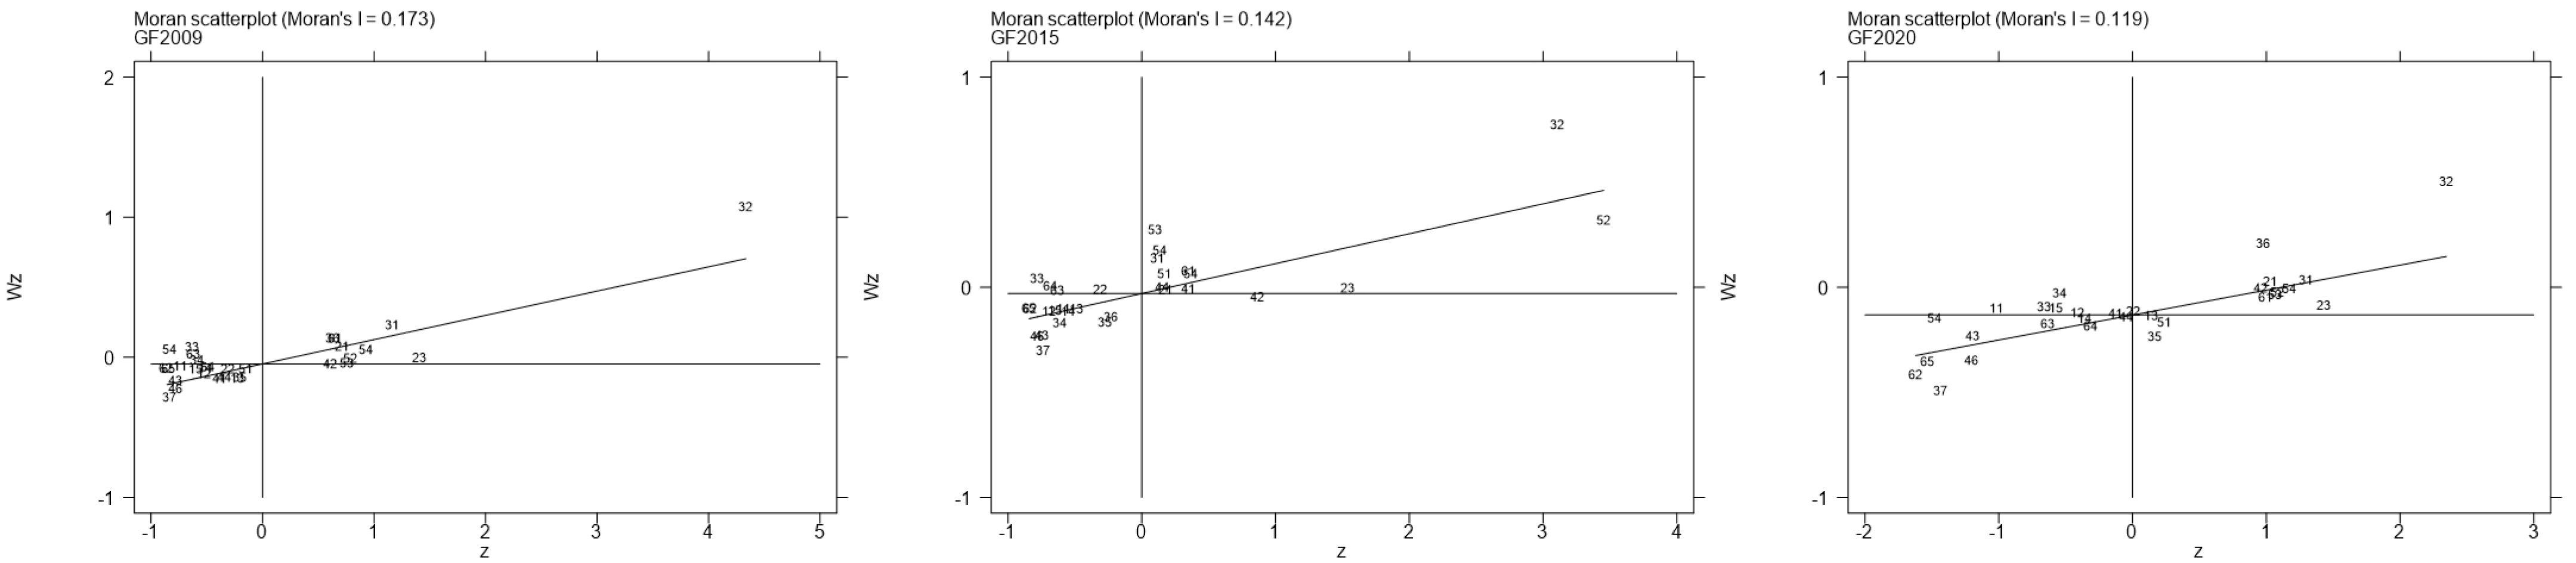
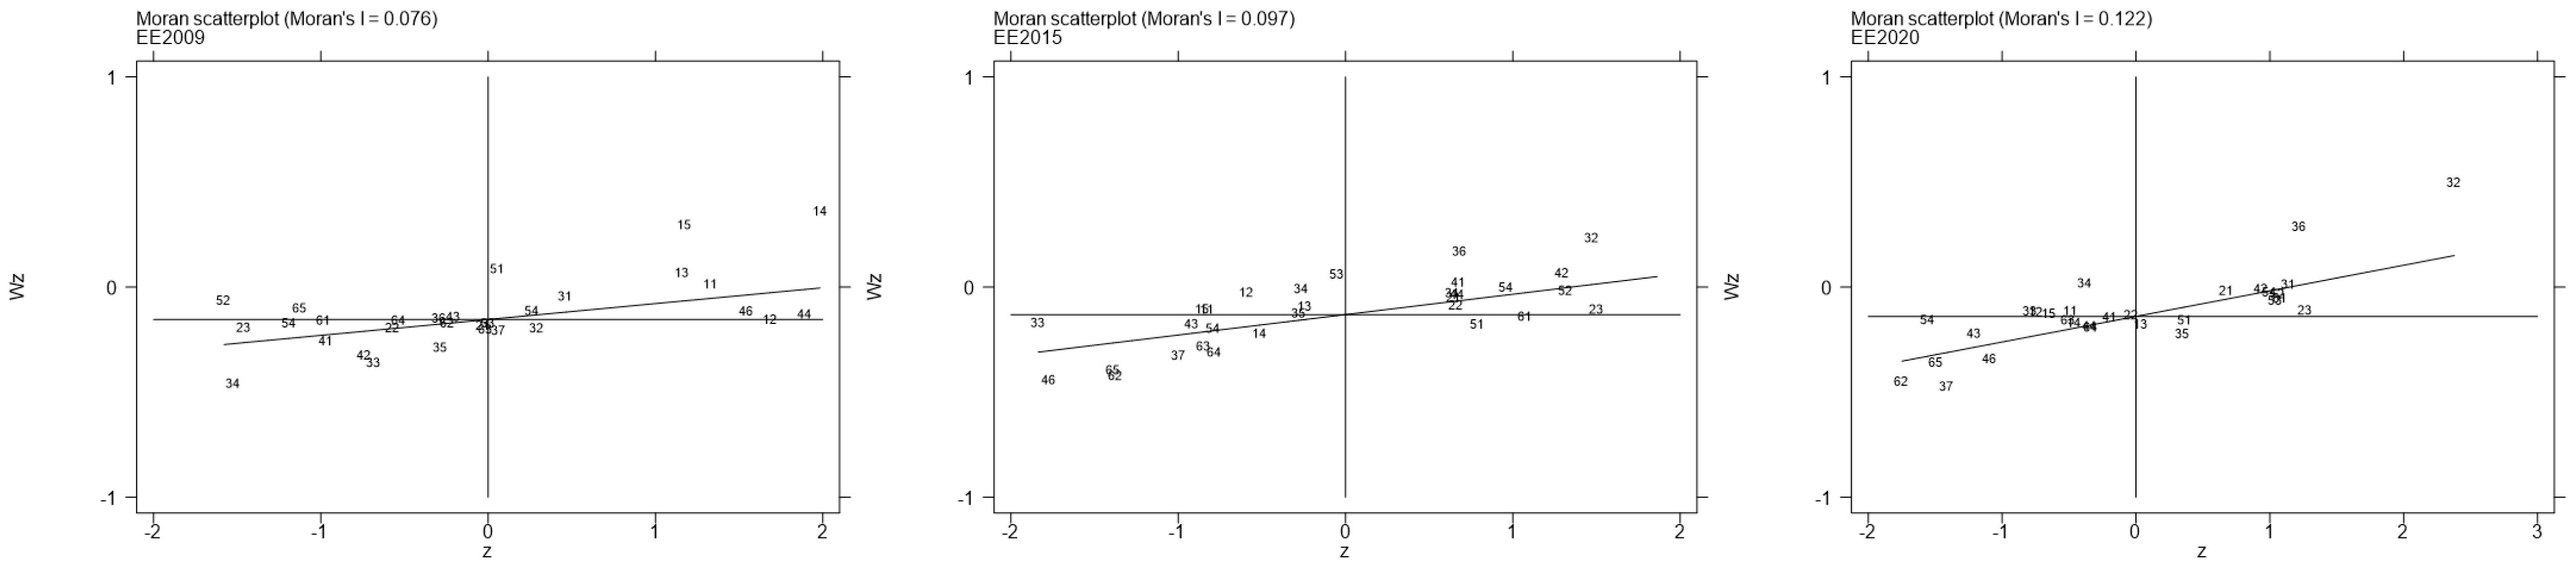
To deeply analyze the spatial correlation, we draw the local Moran’s I scatter plot, as shown in Figure 3 and Figure 4. It showed a consistent pattern of green finance and regional eco-efficiency in China for the period between 2009 and 2020. Therefore, the local Moran’s I scatter plots were drawn from left to right for the start (2009), middle (2015), and ending year (2020) of the study period (Table A1). Both are primarily concentrated in the first and the third quadrant, with fewer abnormal units in the second and fourth quadrants, indicating that the clustering effect and correlation of the GF and EE are relatively significant. The first quadrant consisted of mostly eastern provinces with a high economic level and a shift towards technology-intensive and knowledge-intensive industries, attracting high-quality talents and promoting high-tech research and development, which improves resource use, reduces environmental pollution, and increases regional eco-efficiency, thus achieving a “high-high” regional eco-efficiency agglomeration. The second and fourth quadrants are very few central and western provinces with low regional eco-efficiency. The economic development structure and the ecological environment in this part of the region are extremely uncoordinated and fragile, resulting in low regional eco-efficiency. Although the surrounding area has a reasonable economic development structure and an excellent ecological environment, it is difficult to achieve effective diffusion in this part of the area, forming a “high-low” and “low-high” aggregation of regional efficiency. The third quadrant mainly consists of central and western provinces. With rich resource endowments, their main industries are heavy industries with high input and pollution. The development model with environmental pollution as the cost of economic development has led to low regional eco-efficiency in the central region. The western region’s lack of resources, fragile ecological environment, and underdeveloped transportation have resulted in slow economic development and low regional eco-efficiency. Because of the unfavorable economic fundamental conditions, the central and western regional eco-efficiency is low, causing the formation of a “low-low” cluster.
4.2.2. Analysis of Spatial Measurement
As the explanatory variables contain lagged terms of EE, the model is regressed using the Maximum Likelihood Estimation method [43]. To further confirm the spatial econometric model specification, the Lagrange Multiplier test (LM test) was used to determine the spatial lag and spatial error terms. The results are shown in Table 5. The spatial lag test for the Lagrange multiplier and Robust Lagrange multiplier were 3.617 and 14.991, respectively, and were significant at the 1% level, rejecting the hypothesis of no spatial lag term. the spatial error test for the Lagrange multiplier and Robust Lagrange multiplier were 4.245 and 18.619, respectively. It rejected the original hypothesis of no spatial error term. Then, the LR test was performed and the values for LR spatial lag and LR spatial error were 139.74 and 105.17, indicating that the SDM cannot degenerate into an SEM or a SAR. As a result, the SDM is chosen for the spatial econometric test. The fixed effect and random effect models of SDM were selected through the Hausman test, indicating that the fixed effect was superior [44]. We have taken the natural logarithm of each variable to reduce the effect of heteroskedasticity.
Results found that the impact of green financial development has a “U” shape on China’s regional eco-efficiency. Firstly, without considering spatial effects, the panel fixed effects model reveals (as shown the model 1 in Table 6) that the GF coefficient is −0.3776 and its squared coefficient is 0.0698. Both are significant, allowing for a preliminary judgment that there is a U-shaped effect. However, ignoring the important factor of spatial effects is likely to affect the estimation results’ unbiasedness, consistency, and validity. Incorporating spatial effects, the SDM results (as shown in model 2) show that at the 1% significance level, the coefficient of the GF is −1.3443 and its square term is 0.4809, indicating that green financial development first inhibited and then promoted regional eco-efficiency. It showed a “U” shape change with an inflection point of 1.39. Green finance can generate economic benefits; however, environmental protection cannot be considered due to the country’s low economic level. Green finance brings economic growth while increasing resource consumption and pollution emissions. In addition, green finance requires strict environmental auditing of projects, which leads to the unavailability of specific resources and environmental constraints on production decisions, increasing the cost of enterprises and hindering the improvement of production efficiency, resulting in an asset scale effect on regional eco-efficiency. According to the “Porter Hypothesis”, the environmental requirements of green finance can stimulate enterprises to innovate in green technology, reduce pollution emissions, and expand the scale of green products. Simultaneously, because enterprises take the lead in technological innovation, they gain first-mover advantages in the market, compensating for the economic losses caused by environmental constraints, which has a technological progress effect. The GF of only a few provinces has exceeded the inflection point in a few years. The scale and structure of green finance are currently small and unreasonable. Therefore, the effect of technological progress is not enough to compensate for the asset scale effect, and green finance hinders regional eco-efficiency, that is, it is in the first half of the U-shaped curve. As a result, China should broaden the scope of green finance, encourage the diversification of its products, and improve the quality of its development to cross the inflection point and improve regional eco-efficiency.
Regarding the control variables, at the 1% significance level, the coefficients of human capital and scientific and technological research investment are positive at 0.8409 and 0.0841, respectively. In contrast, the FDI and industrial structure coefficients are negative at −0.2171 and −0.2332, respectively. Human capital reflects workforce quality, and improving it can enhance the efficiency of technological innovation, which improves regional eco-efficiency. Similarly, scientific and technological research investment increases the capital stock and provides a financial guarantee for technological innovation, which promotes regional eco-efficiency improvement. To avoid foreign environmental cost constraints, foreign direct investment invests capital into China’s highly polluting industries, impeding China’s regional eco-efficiency improvement. China’s secondary industry’s “high input” and “high consumption” mode of development has hindered regional eco-efficiency enhancement. Therefore, measures should be taken by the government and enterprises from these aspects, such as increasing investment in research, improving workers’ quality, promoting industrial structure rationalization to encourage new environmental protection industries development, and rationally allocating foreign direct investment.
Green finance development has a U-shaped spatial spillover effect on regional eco-efficiency. As shown in Table 6 (model 2), the coefficient of the spatial lag of regional eco-efficiency (W*lnEE), rho is 1.7502 and it is significantly positive at the 10% level, indicating that regional eco-efficiency in China shows a positive clustering trend and a significant spatial spillover effect. We draw on the partial differential approach of Lesage and Pace [44] to analyze spatial spillover effects. Each variable has a direct effect on its province, and each variable has an indirect effect on neighboring provinces (spillover effect). The effect decomposition results in Table 7 show that green finance has a “U” shape with the improvement of regional eco-efficiency in its province. The spillover effect in the surrounding provinces is also a “U” shape. According to the “pollution paradise hypothesis”, when a country’s environmental regulation policies become stricter, polluting industries will migrate to countries with relatively weak environmental regulations to avoid cost constraints. Green finance is an environmental regulation measure. As a province’s green finance development level rises, polluting industries will migrate to neighboring provinces with lower levels, leading to ecological deterioration and regional eco-efficiency decline in neighboring provinces. Green finance can not only affect its own province’s regional eco-efficiency but also affect neighboring provinces. Therefore, to improve the province’s regional eco-efficiency, green finance of its own province and surrounding provinces should be thoroughly considered, and regional coordinated development should be emphasized.
4.3. Regional Heterogeneity Analysis
To verify the regional heterogeneity in China, with the western region as a base group, we introduced two dummy variables, Central and East. The Central = 1 if the province is ∈ Central, otherwise Central = 0. Similarly, East = 1 if the province is ∈ East, otherwise East = 0. The interaction terms lnGF*Central and lnGF*East were generated for the dummy variables and the GF, which were then substituted into the SDM. As shown in Table 6, Model (4), there is significant heterogeneity in the three regions. Among them, the greatest impact is in the central region (with a coefficient 0.4172 higher than that of the western) because it is in the rising stage of resource development, and the impact on resource and environmental constraints is greatest. It should regulate orderly development by raising the threshold of access to resource development enterprises and reasonably determining the intensity of supervised resource development. The second is the eastern region (with a coefficient 0.1172 higher than that of the western), which is in a stable stage of resource development, with strong resource security capabilities, and the constraints of green finance on resource development are stable. Green finance provides financial support for resource industries, stimulates technological innovation, improves industrial technology, accelerates forming of several pillar-type alternative industries, and promotes leapfrog development. The least impacted is in the western region, with a fragile ecological environment that restricts resource development. Green finance has fewer resource development constraints and supports the western region’s transformation by attracting idle capital and strongly supporting alternative industries to enhance sustainable development. There is clear regional heterogeneity in the three regions. Green finance functions should be strategically chosen based on the characteristics of each region to improve regional eco-efficiency in each region.
4.4. Robustness Analysis
To verify whether the above model results are robust, we introduce a binary adjacency weight matrix for robustness testing. The results of model (3) in Table 6 show that the coefficient of the GF has a small change, but the sign and significance are consistent with the variables given in model (2). The signs of control variable coefficients are also consistent with a model (2). Therefore, the Spatial Durbin Model mentioned above passed the robustness test.
4.5. Inspection of Mechanism
We tested the mechanism through a mediating effects model in the next step. The results are given in Table 8. The coefficients of the GF and its square term on the mediating variable M (AS, TP) are −1.2665,0.3955, −0.4252, and 0.0637, respectively, and they are significant in Model (1) and Model (3). The coefficients of the mediating variable M (AS, TP) on regional eco-efficiency are −0.1165 and 0.0902, which are significant in Model (2) and Model (4). Further, using the Bootstrap method, the sample is repeated 1000 times to obtain confidence intervals. The results found that the confidence interval of the asset scale and technological progress does not contain zero, and the mediating effect is significant. It can be seen that there is an intermediary effect of the asset scale and technological progress, which verified hypotheses 1 and 2. Green finance generates economic benefits. However, excessive resource consumption and pollution emissions hinder regional eco-efficiency improvement. Green finance provides financial support for technology-intensive and knowledge-intensive industries, encourages enterprises to research and develop new technologies, promotes scientific and technological progress, improves resource utilization, and thus enhances regional eco-efficiency.
5. Conclusions and Policy Implications
5.1. Conclusions
From a spatial perspective, this study takes 30 provinces in China from 2009 to 2020 as samples to study the direct impact and spillover effects of green finance on regional eco-efficiency and draws the following conclusions: (1) Spatial and Temporal Evolution Characteristics. Regional eco-efficiency showed a slight decrease and then an increase during the study period, showing a distribution pattern of high in the eastern region and low in the central and western regions. Globally, regional eco-efficiency shows a significant positive spatial autocorrelation; locally, it shows high-high and low-low aggregation. (2) Direct Impact. The findings of SDM show that green finance first hinders regional eco-efficiency enhancement and, after exceeding a certain limit, promotes its enhancement in a “U” shape. Further research found that there is obvious heterogeneity in different economic regions. (3) Spillover Effect. According to the decomposition of the effect, it was found that there was an obvious U-shaped spatial spillover effect, indicating that green finance has an impact on the regional eco-efficiency of both the region and the neighboring areas. (4) Intermediary Effect. The results of the intermediary effect model show that there is a technological progress effect and an asset scale effect, with the technological progress effect greater than the asset scale effect. Thus, China is currently in the first half of the U-shaped curve.
5.2. Policy Implications
Based on the study findings, we proposed the following policy implications:
- ●
- Firstly, expand the scale of green finance and strengthen green finance innovation. Green finance’s scale and structure are small and unreasonable at the first half of the “U” curve, inhibiting regional eco-efficiency improvement. China’s green financial products are single, and only green credit is relatively mature in development. Other green financial products need to be improved with a low market share and large room for development. Now China realizes the importance of developing green finance. Still, more work remains to be completed to improve the quality of green credit, implement a diversified green financial product, increase financial innovation support, accelerate green finance to cross the turning point, and promote green finance to improve regional eco-efficiency.
- ●
- Secondly, it is required to improve the mobility of green financial resources and coordinated development. Due to significant regional imbalances in green finance and regional eco-efficiency, we can improve and optimize its overall development level and structure by building a cross-regional cooperation platform. The cross-regional cooperation platform can improve the mobility of resource elements, close the gap, and achieve balanced development.
- ●
- Thirdly, promote technological progress and expand asset scale. Green finance affects regional eco-efficiency through scientific and technological progress and asset scale. The government and financial institutions should provide financial assistance to green industries, such as green energy and enterprises with sufficient funds, to carry out green innovation activities to promote scientific and technological progress. The government and enterprises should increase investment in fixed assets and expand the scale of capital to continuously improve productivity, increase economic benefits, and promote regional eco-efficiency.
Author Contributions
K.W., E.E., and Y.Z. were responsible for the data collection and arrangement of relevant literature, data analysis, and article writing. Z.K. and D.W. contributed to the data analysis. E.E. also revised and edited the final draft of the article. All authors have read and agreed to the published version of the manuscript.
Funding
The study is sponsored by the Taishan Young Scholar Program (tsqn202103070), the Taishan Scholar Foundation of Shandong Province, China.
Institutional Review Board Statement
The study was conducted in accordance with the Declaration of Helsinki. Moreover, on 01/08/2022, the study was approved by the Institutional Review Board (or Ethics Committee) of the Shandong University of Technology, Zibo, China (protocol code 010).” for studies involving humans.
Informed Consent Statement
Informed consent was obtained from all subjects involved in the study.
Data Availability Statement
The data will be available from the corresponding author upon a reasonable request.
Acknowledgments
The comments of anonymous reviewers to improve the quality of the article are highly appreciated.
Conflicts of Interest
The authors declare that the research was conducted without any commercial or financial relationships that could be construed as a potential conflict of interest.
Appendix A

Table A1.
Provinces included in the Eastern, Central, and Western regions of China.
| Codes | Provinces | Economic Regions |
|---|---|---|
| 11 | Beijing | Eastern regions |
| 12 | Tianjin | Eastern regions |
| 13 | Hebei | Eastern regions |
| 14 | Shanxi | Central regions |
| 15 | Neimenggu | Western regions |
| 21 | Liaoning | Eastern regions |
| 22 | Jilin | Central regions |
| 23 | Heilongjiang | Central regions |
| 31 | Shanghai | Eastern regions |
| 32 | Jiangsu | Eastern regions |
| 33 | Zhejiang | Eastern regions |
| 34 | Anhui | Central regions |
| 35 | Fujian | Eastern regions |
| 36 | Jiangxi | Central regions |
| 37 | Shandong | Eastern regions |
| 41 | Henan | Central regions |
| 42 | Hubei | Central regions |
| 43 | Hunan | Central regions |
| 44 | Guangdong | Eastern regions |
| 45 | Guangxi | Western regions |
| 46 | Hainan | Eastern regions |
| 51 | Chongqing | Western regions |
| 52 | Sichuan | Western regions |
| 53 | Guizhou | Western regions |
| 54 | Yunnan | Western regions |
| 61 | Shaanxi | Western regions |
| 62 | Gansu | Western regions |
| 63 | Qinghai | Western regions |
| 64 | Ningxia | Western regions |
| 65 | Xinjiang | Western regions |
Table A2.
Literature review and research gap.
| Studies | Publication Year | Research Focus | Methods |
|---|---|---|---|
| [4] | 2022 | Energy use efficiency | ANN |
| [6] | 2021 | Green Finance | Bibliographic research method |
| [10] | 2021 | Greenwashing; Responsible Investment | Survey method |
| [12] | 2020 | Green Bonds | Bibliographic research method |
| [14] | 2022 | Green Finance; Ecological Footprint | FE |
| [17] | 2020 | Eco-Efficiency | DEA, SFA, and FRM |
| [18] | 2019 | Eco-Efficiency | DEA |
| [22] | 2019 | Efficiency | DEA |
| [23] | 2022 | Eco-Efficiency and Innovation | Two-stage network DEA |
| [26] | 2021 | Eco-Efficiency | Super-SBM |
| [30] | 1997 | Financial Development and Economic Growth | Bibliographic Research Method |
| [31] | 2021 | Financial Development | GMM |
| [34] | 2002 | Data Envelopment Analysis | Super-SBM |
| [35] | 2014 | Green Finance | A combination of subjective and objective empowerment methods |
| [42] | 2014 | Mediating Effects Methods and Models | Step-by-Step method; Bootstrap |
| [43] | 2014 | Indirect Effects | Spatial Regression Estimates |
| [44] | 2009 | Spatial Econometrics | Maximum Likelihood Estimation (MLE) |
| [45] | 2002 | Environmental Finance | Functional Analysis Method |
| [46] | 2022 | Economic growth | Regression analysis |
| [47] | 2022 | Sustainable Growth of Firms | Regression analysis |
| Current Study | 2022 | Eco-Efficiency and Green Finance | Super-SBM and SDM |
References
- Elahi, E.; Khalid, Z.; Zhang, Z. Understanding farmers’ intention and willingness to install renewable energy technology: A solution to reduce the environmental emissions of agriculture. Appl. Energy 2022, 309, 118459. [Google Scholar] [CrossRef]
- Elahi, E.; Zhang, H.; Lirong, X.; Khalid, Z.; Xu, H. Understanding cognitive and socio-psychological factors determining farmers’ intentions to use improved grassland: Implications of land use policy for sustainable pasture production. Land Use Policy 2021, 102, 105250. [Google Scholar] [CrossRef]
- Elahi, E.; Weijun, C.; Jha, S.K.; Zhang, H. Estimation of realistic renewable and non-renewable energy use targets for livestock production systems utilising an artificial neural network method: A step towards livestock sustainability. Energy 2019, 183, 191–204. [Google Scholar] [CrossRef]
- Elahi, E.; Zhang, Z.; Khalid, Z.; Xu, H. Application of an artificial neural network to optimise energy inputs: An energy- and cost-saving strategy for commercial poultry farms. Energy 2022, 244, 123169. [Google Scholar] [CrossRef]
- Elahi, E.; Khalid, Z. Estimating smart energy inputs packages using hybrid optimisation technique to mitigate environmental emissions of commercial fish farms. Appl. Energy 2022, 326, 119602. [Google Scholar] [CrossRef]
- Gilchrist, D.; Jing, Y.; Rui, Z. The limits of green finance: A survey of literature in the context of green bonds and green loans. Sustainability 2021, 13, 478. [Google Scholar] [CrossRef]
- Park, S.K. Investors as Regulators: Green Bonds and the Governance Challenges of the Sustainable Finance Revolution. Stanf. J. Int. Law 2019, 54, 1–47. [Google Scholar]
- Elahi, E.; Abid, M.; Zhang, L.; Haq, S.U.; Sahito, J.G.M. Agricultural advisory and financial services; farm level access, outreach and impact in a mixed cropping district of Punjab, Pakistan. Land Use Policy 2018, 71, 249–260. [Google Scholar] [CrossRef]
- Li, Z.; Kuo, T.-H.; Siao-Yun, W.; Vinh, L.T. Role of green finance, volatility and risk in promoting the investments in Renewable Energy Resources in the post-covid-19. Resour. Policy 2022, 76, 102563. [Google Scholar] [CrossRef]
- Olatubosun, P.; Nyazenga, S. Greenwashing and responsible investment practices: Empirical evidence from Zimbabwe. Qual. Res. Financial Mark. 2019, 13, 16–36. [Google Scholar] [CrossRef]
- Zhang, L.L.; Xiao, L.M.; Gao, J.F. Measurement and Comparison of Green Finance Development Level and Efficiency in China—Based on Data of 1040 Public Companies. Forum Sci. Technol. China 2019, 9, 100–112, 120. [Google Scholar]
- Jones, R.; Baker, T.; Huet, K.; Murphy, L.; Lewis, N. Treating ecological deficit with debt: The practical and political concerns with green bonds. Geoforum 2020, 114, 49–58. [Google Scholar] [CrossRef] [PubMed]
- Long, J.R.; Zhong, C.B.A.; Ahmad, B.; Irfan, M.; Nazir, R. How do green financing and green logistics affect the circular economy in the pandemic situation: Key mediating role of sustainable production. Econ. Res. Ekon. Istraz. 2021, 35, 3836–3856. [Google Scholar]
- Khan, M.A.; Riaz, H.; Ahmed, M.; Saeed, A. Does green finance really deliver what is expected? An empirical perspective. Borsa Istanb. Rev. 2021, 22, 586–593. [Google Scholar] [CrossRef]
- Schaltegger, S.; Sturm, A. Environmental rationality. Die Unter-Nehmung 1990, 4, 117–131. [Google Scholar]
- Tang, C.; Xue, Y.; Wu, H.; Irfan, M.; Hao, Y. How does telecommunications infrastructure affect eco-efficiency? Evidence from a quasi-natural experiment in China. Technol. Soc. 2022, 69, 101963. [Google Scholar] [CrossRef]
- Moutinho, V.; Madaleno, M.; Macedo, P. The effect of urban air pollutants in Germany: Eco-efficiency analysis through fractional regression models applied after DEA and SFA efficiency predictions. Sustain. Cities Soc. 2020, 59, 102204. [Google Scholar] [CrossRef]
- Ramana, G. Benchmarking urban eco-efficiency and urbanites’ perception. Cities 2019, 74, 109–118. [Google Scholar]
- Ren, Y.F.; Fang, C.L.; Lin, X.Q. Evaluation of ecological efficiency of four major urban agglomerations in eastern coastal areas of China. Acta Geogr. Sin. 2017, 72, 2047–2063. [Google Scholar]
- Yang, Y.; Deng, X.Z. The spatio-temporal evolution characteristics and regional differences in affecting factors analysis of China’s urban eco-efficiency. Sci. Geogr. Sin. 2019, 39, 1111–1118. [Google Scholar]
- Wang, S.Y.; Lin, Y.J. Spatial Evolution and its Drivers of Regional Agro-ecological Efficiency in China’s from the Perspective of Water Footprint and Gray Water Footprint. Sci. Geogr. Sci. 2021, 41, 290–301. [Google Scholar]
- George, H.; Kleoniki, N.P. Assessing 28 EU Member States’ environmental efficiency in national waste generation with DEA. J. Clean. Prod. 2019, 10, 1–38. [Google Scholar]
- Mavi, R.K.; Saen, R.F.; Goh, M. Joint analysis of eco-efficiency and eco-innovation with common weights in two-stage network DEA: A big data approach. Technol. Forecast. Soc. Chang. 2019, 144, 553–562. [Google Scholar] [CrossRef]
- Yasmeen, H.; Tan, Q.; Zameer, H.; Tan, J.; Nawaz, K. Exploring the impact of technological innovation, environmental regulations and urbanization on ecological efficiency of China in the context of COP21. J. Environ. Manag. 2020, 274, 111210. [Google Scholar] [CrossRef] [PubMed]
- Liu, Y.; Zou, L.; Wang, Y. Spatial-temporal characteristics and influencing factors of agricultural eco-efficiency in China in recent 40 years. Land Use Policy 2020, 97, 104794. [Google Scholar] [CrossRef]
- Yan, X.; Tu, J.-J. The spatio-temporal evolution and driving factors of eco-efficiency of resource-based cities in the Yellow River Basin. J. Nat. Resour. 2021, 36, 223–239. [Google Scholar] [CrossRef]
- Liu, X.L.; Wen, W.Y. Should Financial Institutions be Environmentally Responsible in China? Facts, Theory and Evidence. Econ. Res. 2019, 54, 38–54. [Google Scholar]
- Wu, B.; Peng, B.; Wei, W.; Ehsan, E. A comparative analysis on the international discourse power evaluation of global climate governance. Environ. Dev. Sustain. 2021, 23, 12505–12526. [Google Scholar] [CrossRef]
- Su, D.W.; Lian, L.L. Does green credit policy affect corporate financing and investment? Evidence from publicly listed firms in pollution—Intensive industrie. Financ. Res. 2019, 12, 123–137. [Google Scholar]
- Levine, R. Financial development and economic growth: Views and agenda. J. Econ. Lit. 1997, 35, 688–726. [Google Scholar]
- Hsu, C.-C.; Quang-Thanh, N.; Chien, F.; Li, L.; Mohsin, M. Evaluating green innovation and performance of financial development: Mediating concerns of environmental regulation. Environ. Sci. Pollut. Res. 2021, 28, 57386–57397. [Google Scholar] [CrossRef] [PubMed]
- Xie, S.W.; Liao, J.; Tao, R. Delay on Scheduled Annual Report Disclosure, Financial Ecological Environment and Cost of Debt: Evidence from Information Risk Identification and Transformation of Risk Compensation. Manag. Rev. 2018, 30, 200–211. [Google Scholar]
- Zhu, M.; Wan, K.L.; Tang, H.Y. Study on the Spatial Spillover Effect of Green Finance Development on Ecological Efficiency: A Case Study of Resource-Based Cities in the Yellow River Basin. Financ. Dev. Res. 2022, 4, 55–62. [Google Scholar]
- Tone, K. A slacks-based measure of super-efficiency in data envelopment analysis. Eur. J. Oper. Res. 2002, 143, 32–41. [Google Scholar] [CrossRef]
- Zeng, X.W.; Liu, Y.Q.; Man, M.J. Measurement and Analysis of the Development Degree of China’s Green Finance. J. China Yan’an Cadre Coll. 2014, 7, 112–121, 105. [Google Scholar]
- Elahi, E.; Khalid, Z.; Tauni, M.Z.; Zhang, H.; Lirong, X. Extreme weather events risk to crop-production and the adaptation of innovative management strategies to mitigate the risk: A retrospective survey of rural Punjab, Pakistan. Technovation 2021, 117, 102255. [Google Scholar] [CrossRef]
- Elahi, E.; Khalid, Z.; Weijun, C.; Zhang, H. The public policy of agricultural land allotment to agrarians and its impact on crop productivity in Punjab province of Pakistan. Land Use Policy 2019, 90, 104324. [Google Scholar] [CrossRef]
- Elahi, E.; Weijun, C.; Zhang, H.; Abid, M. Use of artificial neural networks to rescue agrochemical-based health hazards: A resource optimisation method for cleaner crop production. J. Clean. Prod. 2019, 238, 117900. [Google Scholar] [CrossRef]
- Elahi, E.; Weijun, C.; Zhang, H.; Nazeer, M. Agricultural intensification and damages to human health in relation to agrochemicals: Application of artificial intelligence. Land Use Policy 2019, 83, 461–474. [Google Scholar] [CrossRef]
- Elahi, E.; Abid, M.; Zhang, H.; Weijun, C.; Hasson, S.U. Domestic water buffaloes: Access to surface water, disease prevalence and associated economic losses. Prev. Vet. Med. 2019, 154, 102–112. [Google Scholar] [CrossRef]
- Gong, M.; Elahi, E. A nexus between farmland rights, and access, demand, and amount of agricultural loan under the socialist system of China. Land Use Policy 2022, 120, 106279. [Google Scholar] [CrossRef]
- Wen, Z.L.; Ye, B.J. Analysis of Mediating Effect: Method and Model Development. Adv. Psychol. Sci. 2014, 22, 731–745. [Google Scholar] [CrossRef]
- Lesage, J.P.; Pace, R.K. The biggest myth in spatial econometrics. Econometrics 2014, 2, 217–249. [Google Scholar] [CrossRef] [Green Version]
- Lesage, J.P.; Pace, R.K. Introduction to Spatial Econometrics; CRC Press: Boca Raton, FL, USA, 2009. [Google Scholar]
- Labatt, S. Environmental Finance: A Guide to Environmental Risk Assessment and Financial Products. Transplantation 2002, 66, 405–409. [Google Scholar]
- Liu, T.; Hu, M.; Elahi, E.; Liu, X. Does digital finance affect the quality of economic growth? Analysis based on Chinese city data. Front. Environ. Sci. 2022, 10, 951420. [Google Scholar] [CrossRef]
- Liu, T.; Liu, W.; Elahi, E.; Liu, X. Supply Chain Finance and the Sustainable Growth of Chinese Firms: The Moderating Effect of Digital Finance. Front. Environ. Sci. 2022, 10, 922182. [Google Scholar] [CrossRef]
Figure 1.
Regional Eco-Efficiency.

Figure 2.
Spatial distribution of EE in China for 2009 (a), 2015 (b), and 2020 (c).

Figure 3.
Moran’s I scatter plots of the GF for 2009, 2015, and 2020.

Figure 4.
Moran’s I scatter plot of EE for 2009, 2015, and 2020.

Table 1.
Evaluation Indicator System of EE.
| Criterion Layer | Indicator Layer | Specific Instructions |
|---|---|---|
| Natural resource input | Water input | Total urban water consumption/10,000 cubic meters |
| Energy input | Total urban electricity consumption/10,000 kWh | |
| Land input | Urban construction land area/square kilometer | |
| Economic factors input | Labor input | Number of employees in the unit/10,000 people |
| Capital investment | Fixed asset investment/10,000 yuan | |
| Economic expected output | Regional GDP | Regional GDP/10,000 yuan |
| Ecological load | Water pollution | Discharge of industrial wastewater/10,000 tons |
| Air pollution | Industrial sulfur dioxide emissions/10,000 tons |
Table 2.
Evaluation of Indicator System of the GF.
| Criterion Layer | Indicator Layer | Indicator Meaning |
|---|---|---|
| Green credit | The proportion of green credit | Green credit loan balance/financial institution loan balance (+) |
| Green investment | The proportion of energy conservation and environmental protection expenditure | Financial esxpenditure on energy conservation and environmental protection/total financial expenditure (+) |
| Green insurance | The proportion of environmental liability insurance claims | Environmental liability claims/environmental liability insurance income (−) |
| Carbon finance | Carbon intensity | CO2 emissions/GDP (−) |
Table 3.
Descriptive statistics.
| Variables | Sample Size | Mean | Standard Deviation | Minimum | Maximum |
|---|---|---|---|---|---|
| Regional Eco-Efficiency (EE) | 360 | 0.585 | 0.304 | 0.216 | 2.383 |
| Green Finance Development Index (GF) | 360 | 0.155 | 0.098 | 0.044 | 0.793 |
| Foreign Direct Investment (FDI) | 360 | 0.437 | 0.095 | 0.286 | 0.835 |
| Human Capital (Human) | 360 | 0.314 | 0.384 | 0.013 | 1.885 |
| Scientific and Technological Research Investment (ST) | 360 | 0.020 | 0.014 | 0.004 | 0.072 |
| Industrial Structure (Industry) | 360 | 0.228 | 0.179 | 0.001 | 0.819 |
| Asset Scale (AS) | 360 | 0.191 | 0.130 | −0.627 | 0.595 |
| Technological Progress (TP) | 360 | 3.733 | 6.072 | 0.022 | 47.808 |
Table 4.
Moran’s Index.
| Years | Green Finance | Regional Eco-Efficiency | ||
|---|---|---|---|---|
| Moran’s I | p-Value | Moran’s I | p-Value | |
| 2009 | 0.169 | 0.000 | 0.066 | 0.009 |
| 2010 | 0.161 | 0.000 | 0.075 | 0.004 |
| 2011 | 0.143 | 0.000 | 0.094 | 0.001 |
| 2012 | 0.145 | 0.000 | 0.082 | 0.002 |
| 2013 | 0.139 | 0.000 | 0.082 | 0.002 |
| 2014 | 0.139 | 0.000 | 0.093 | 0.001 |
| 2015 | 0.138 | 0.000 | 0.095 | 0.000 |
| 2016 | 0.125 | 0.000 | 0.121 | 0.000 |
| 2017 | 0.111 | 0.000 | 0.125 | 0.000 |
| 2018 | 0.114 | 0.000 | 0.130 | 0.000 |
| 2019 | 0.116 | 0.000 | 0.149 | 0.000 |
| 2020 | 0.125 | 0.000 | 0.111 | 0.000 |
Table 5.
Model test results.
| Test Methods | Statistic Value | p-Value |
|---|---|---|
| LM spatial lag | 3.617 | 0.042 |
| LM spatial error | 4.245 | 0.039 |
| Robust LM spatial lag | 14.991 | 0.000 |
| Robust LM spatial error | 18.619 | 0.000 |
| LR spatial lag | 139.74 | 0.000 |
| LR spatial error | 105.17 | 0.000 |
| Hausman | 70.31 | 0.000 |
Table 6.
Empirical results.
| Variables | Model (1) FE Model | Model (2) SDM Model | Model (3) SDM Model | Model (4) SDM Model |
|---|---|---|---|---|
| lnGF | −0.3776 *** | −1.3443 *** | −0.7327 *** | −1.3527 *** |
| (0.1282) | (0.1607) | (0.1510) | (0.1341) | |
| AlnGF | 0.0698 ** | 0.4809 *** | 0.1488 ** | 0.4781 *** |
| (0.0329) | (0.0418) | (0.0329) | (0.0346) | |
| lnFDI | −0.0143 | −0.2171 *** | −0.0057 * | −0.0524 *** |
| (0.0159) | (0.0653) | (0.0150) | (0.0148) | |
| lnHuman | 0.0248 | 0.8409 *** | 0.1771 ** | 0.3427 *** |
| (0.0272) | (0.1238) | (0.1098) | (0.1008) | |
| lnST | 0.1278 *** | 0.0841 *** | −0.0787 * | −0.1691 *** |
| (0.0333) | (0.0232) | (0.1297) | (0.0237) | |
| lnIndustry | −0.1865 ** | −0.2332 *** | 0.0667 ** | 0.2460 *** |
| (0.0859) | (0.0402) | (0.0336) | (0.0351) | |
| lnGF*Central | 0.4172 *** | |||
| (0.0418) | ||||
| lnGF*East | 0.1172 *** | |||
| (0.0364) | ||||
| W*lnEE | 3.5764 *** | 0.4440 * | 2.8294 *** | |
| (0.3766) | (0.4149) | (0.3475) | ||
| W*lnGF | 7.7447 *** | 1.3140 * | 4.2154 *** | |
| (0.9615) | (0.7028) | (0.8102) | ||
| W*AlnGF | −1.6573 *** | −0.1710 * | 0.5839 ** | |
| (0.3034) | (0.1696) | (0.2434) | ||
| W*Xctrl | Spatial lag term | Spatial lag term | Spatial lag term | |
| cons | 0.1796 | |||
| (0.1823) | ||||
| rho | 1.7502 * | 1.7643 * | 1.6948 * | |
| (0.2072) | (0.2212) | (0.2172) | ||
| sigma2 | 0.0418 *** | 0.0118 *** | 0.0323 *** | |
| (0.0031) | (0.0009) | (0.0024) | ||
| R2 | 0.4995 | 0.8722 | 0.6346 | 0.9207 |
| Log-likelihood | −62.1521 | −287.8878 | −107.3288 | |
| Time fixed effects | Control | Control | Control |
***, **, and * represent a level of significance of the parameters at 1%, 5%, and 10%, respectively. Standard errors are given in parentheses.
Table 7.
Direct and indirect effects of the SDM.
| Variables | Direct Effect | Indirect Effect | Total Effect |
|---|---|---|---|
| lnGF | −1.3801 *** | −8.4927 *** | −9.8728 *** |
| (0.2038) | (2.8508) | (2.9743) | |
| AlnGF | 0.1877 *** | 1.8164 *** | 2.0041 *** |
| (0.0490) | (0.6149) | (0.6404) | |
| lnFDI | −0.2355 *** | −3.5063 *** | −3.7418 *** |
| (0.0793) | (1.1188) | (1.1644) | |
| lnHuman | 0.8664 *** | 6.0659 *** | 6.9323 *** |
| (0.1577) | (2.2377) | (2.3511) | |
| lnST | 0.0878 *** | 1.0653 ** | 1.1531 *** |
| (0.0282) | (0.4276) | (0.4446) | |
| lnIndustry | −0.2418 *** | −2.4226 *** | −2.6645 *** |
| (0.0523) | (0.8257) | (0.8589) |
***, and ** represent a level of significance of the parameters at 1%, and 5%, respectively. Standard errors are given in parentheses.
Table 8.
Results of the mediation effect.
| Variables | Model (1) lnAS | Model (2) lnEE | Model (3) lnTP | Model (4) lnEE |
|---|---|---|---|---|
| lnGF | −1.2665 *** | −0.4252 *** | −0.9601 ** | −0.3945 *** |
| (0.2605) | (0.1292) | (0.4810) | (0.1337) | |
| lnGF2 | 0.3955 *** | 0.0637 * | 0.0894 ** | 0.0792 ** |
| (0.0669) | (0.0337) | (0.0528) | (0.0339) | |
| lnFDI | −0.0381 | −0.0187 | −0.0309 | −0.0160 * |
| (0.0323) | (0.0155) | (0.0593) | (0.0164) | |
| lnHuman | −0.0945 * | −0.0138 | −0.0973 * | −0.0416 |
| (0.0554) | (0.0266) | (0.1020) | (0.0282) | |
| lnST | 0.1811 *** | 0.1488 *** | 0.2214 * | 0.1059 *** |
| (0.0677) | (0.0328) | (0.1256) | (0.0349) | |
| lnIndustry | 0.4141 ** | −0.1383 | −1.3847 *** | −0.1416 * |
| (0.1747) | (0.0844) | (0.3271) | (0.0929) | |
| M | −0.1165 *** | 0.0902 * | ||
| (0.0266) | (0.0157) | |||
| cons | 5.0580 *** | 0.7688 *** | −5.1486 *** | 0.1211 |
| (0.3705) | (0.1717) | (0.6699) | (0.2020) | |
| R2 | 0.8978 | 0.5499 | 0.4729 | 0.4998 |
| Bca (indeff) | (−0.4978, −0.3322) | (−0.1343, −0.0555) | ||
| Bca (direff) | (0.7288, 1.0112) | (0.3374, 0.6441) | ||
***, **, and * represent a level of significance of the parameters at 1%, 5%, and 10%, respectively. Standard errors are given in parentheses.
Publisher’s Note: MDPI stays neutral with regard to jurisdictional claims in published maps and institutional affiliations. |
© 2022 by the authors. Licensee MDPI, Basel, Switzerland. This article is an open access article distributed under the terms and conditions of the Creative Commons Attribution (CC BY) license (https://creativecommons.org/licenses/by/4.0/).
Share and Cite
MDPI and ACS Style
Wang, K.; Elahi, E.; Zhang, Y.; Wang, D.; Khalid, Z. A Development of Green Finance and Regional Eco-Efficiency in China. Sustainability 2022, 14, 15206. https://doi.org/10.3390/su142215206
AMA Style
Wang K, Elahi E, Zhang Y, Wang D, Khalid Z. A Development of Green Finance and Regional Eco-Efficiency in China. Sustainability. 2022; 14(22):15206. https://doi.org/10.3390/su142215206
Chicago/Turabian StyleWang, Kaili, Ehsan Elahi, Yuge Zhang, Di Wang, and Zainab Khalid. 2022. "A Development of Green Finance and Regional Eco-Efficiency in China" Sustainability 14, no. 22: 15206. https://doi.org/10.3390/su142215206
Note that from the first issue of 2016, this journal uses article numbers instead of page numbers. See further details here.