Article

Comfort Assessment and Optimization Based on FE Simulation for High-Speed Train Seats: Comparison with Different Design Parameters

1
School of Business, Hunan Industry Polytechnic, Changsha 410208, China
2
School of Architectural Technology, Liuzhou Railway Vocational Technical College, Liuzhou 545616, China
3
Key Laboratory of Traffic Safety on Track of Ministry of Education, School of Traffic and Transportation Engineering, Central South University, Changsha 410075, China
4
Joint International Research Laboratory of Key Technology for Rail Traffic Safety, Central South University, Changsha 410075, China
5
Chongqing Key Laboratory of Vehicle Crash/Bio-Impact and Traffic Safety, Institute for Traffic Medicine, Daping Hospital, Army Medical University, Chongqing 400038, China
*
Authors to whom correspondence should be addressed.
Sustainability 2022, 14(22), 15185; https://doi.org/10.3390/su142215185
Submission received: 21 October 2022 / Revised: 10 November 2022 / Accepted: 12 November 2022 / Published: 16 November 2022
(This article belongs to the Topic Built Environment and Human Comfort)

Abstract

:
Nowadays, riding comfort is more significant than before for evaluating the quality of high–speed railways and sitting is the most common posture for its passengers. This study aimed to analyze and optimize the pressure distribution and sitting comfort of second–class seats with different design parameters. Firstly, 21 pressure features were calculated after the field sitting tests conducted on a CRH Train. The subjective comfort was quantified as a linear combination of 6 pressure features in 21, which were selected using stepwise regression analysis (R2 = 0.684). A seat-human finite element model was established using THUMS for a human body and MAT_57 for the seat foam. Finally, this study analyzed the effects of foam and seat angles on interface pressure distribution and comfort ratings. The set of design parameters with the highest comfort was selected from 12 free combinations. The results show that the seat foam with less stiffness may not improve sitting comfort due to the asymmetry of the seat frame. Moreover, appropriately increasing the stiffness of the cushion and backrest will not lead to a decrease in subjective feelings and the pressure distribution becomes more reasonable as the inclination angle increases within 10 degrees. The final optimization increases the computational comfort of the seat-human model by 6.5 in a −50 to 50 scale.

1. Introduction

With the development of modern transportation, riding comfort has become more important than ever as a parameter for assessing the quality of high–speed railways [1]. Generally, the passenger’s travel experiment can be affected by the seat [2], noise [3,4], vibration [5], personal space [6], and comprehensive factors [7,8]. Different from subways and regular–speed trains, sitting is the most common posture for people on high–speed railways and, therefore, a more comfortable seat will effectively improve subjective feelings and reduce fatigue [9,10]. In the automotive and furniture manufacturing industries, seats have become the key to unlocking future brand competitiveness. In the conventional seat design process, comfort optimization is executed based on the empiricism and reference in prototype production, as well as subjective ratings by participants in riding tests [11], which usually come with longer cycle times and higher costs. Due to the important contribution of Computer Aided Engineering (CAE) in interaction analysis, the seat-human simulation is used for more efficient and accurate comfort optimization iterations [12].
In the current research, the muti–body dynamics model and finite element (FE) model are two types of seat-human simulation [13,14]. The former aims to analyze the transmission of vibration from the rail–wheel to the seat and human body parts, while the global deformation can be calculated in this process. Wu and Qiu [15] found the contribution of stiffness and the dampening of seat-human vertical contact on the seat pan on high–speed railway riding comfort based on their rigid-flexible coupled model. However, the penetration between the human body and the seat surface cannot be measured, leading to the neglect of local stresses and deformations [16], which are considered to significantly affect sitting comfort [17].
On the other hand, finite element simulation allows for more detailed calculations and to solve the problem with a much lower running speed [18,19]. Finite element models of passengers and seats are widely used in the analysis of collision damage caused by high–speed trains. For example, Wang et al. [20] built an electric multiple unit (EMU) train with a detailed cabin structure based on the FE method and found that the effect of the driver’s seat position on human injury. Unfortunately, the calculation of crash damage is accompanied by a rather high deformation rate, while the analysis of riding comfort is more likely to occur in a quasi–static condition. In furniture and automotive manufacturing, FE dummies with full–body geometry, which are coupled with seats, have been used to perform sitting analysis and improve user experiences [21,22,23]. To study the comfort influence mechanism from the perspective of the seat-human contact surface, it is necessary to conduct an FE simulation for high–speed train seats.
Since comfort ratings cannot be fed back from the CAE analysis reports, appropriate evaluation indicators are required. Interface pressure distribution, which can be read directly from the FE simulation results, seems to be the objective measure with the most obvious contribution to the subjective ratings [24,25]. In addition, it is highly correlated with the seat material and geometry and is suitable for optimal design [26]. However, evaluating comfort using objective methods is subject to uncertainty. For example, researchers found that satisfactory pressure levels are different for passengers with different anthropometric parameters [27,28]. It appears clear that sitting experiments and subjective comfort scales are still necessary to conduct a comfort assessment with enough precision and accuracy.
The aim of the present work is to establish a seat-human FE model and a comfort evaluation model based on second–class seats on high–speed railways. Then, a simple optimization of seat comfort is completed based on the analysis and comparison of several orthogonal experimental design cases. The field sitting tests were carried out on a China Railway High–speed (CRH380A) train to obtain original objective and subjective data and the necessary quasi–static tests were performed with the foam specimens taken from its second–class seat. Additionally, the genetic algorithm was used in this study to define the material keywords.

2. Materials and Methods

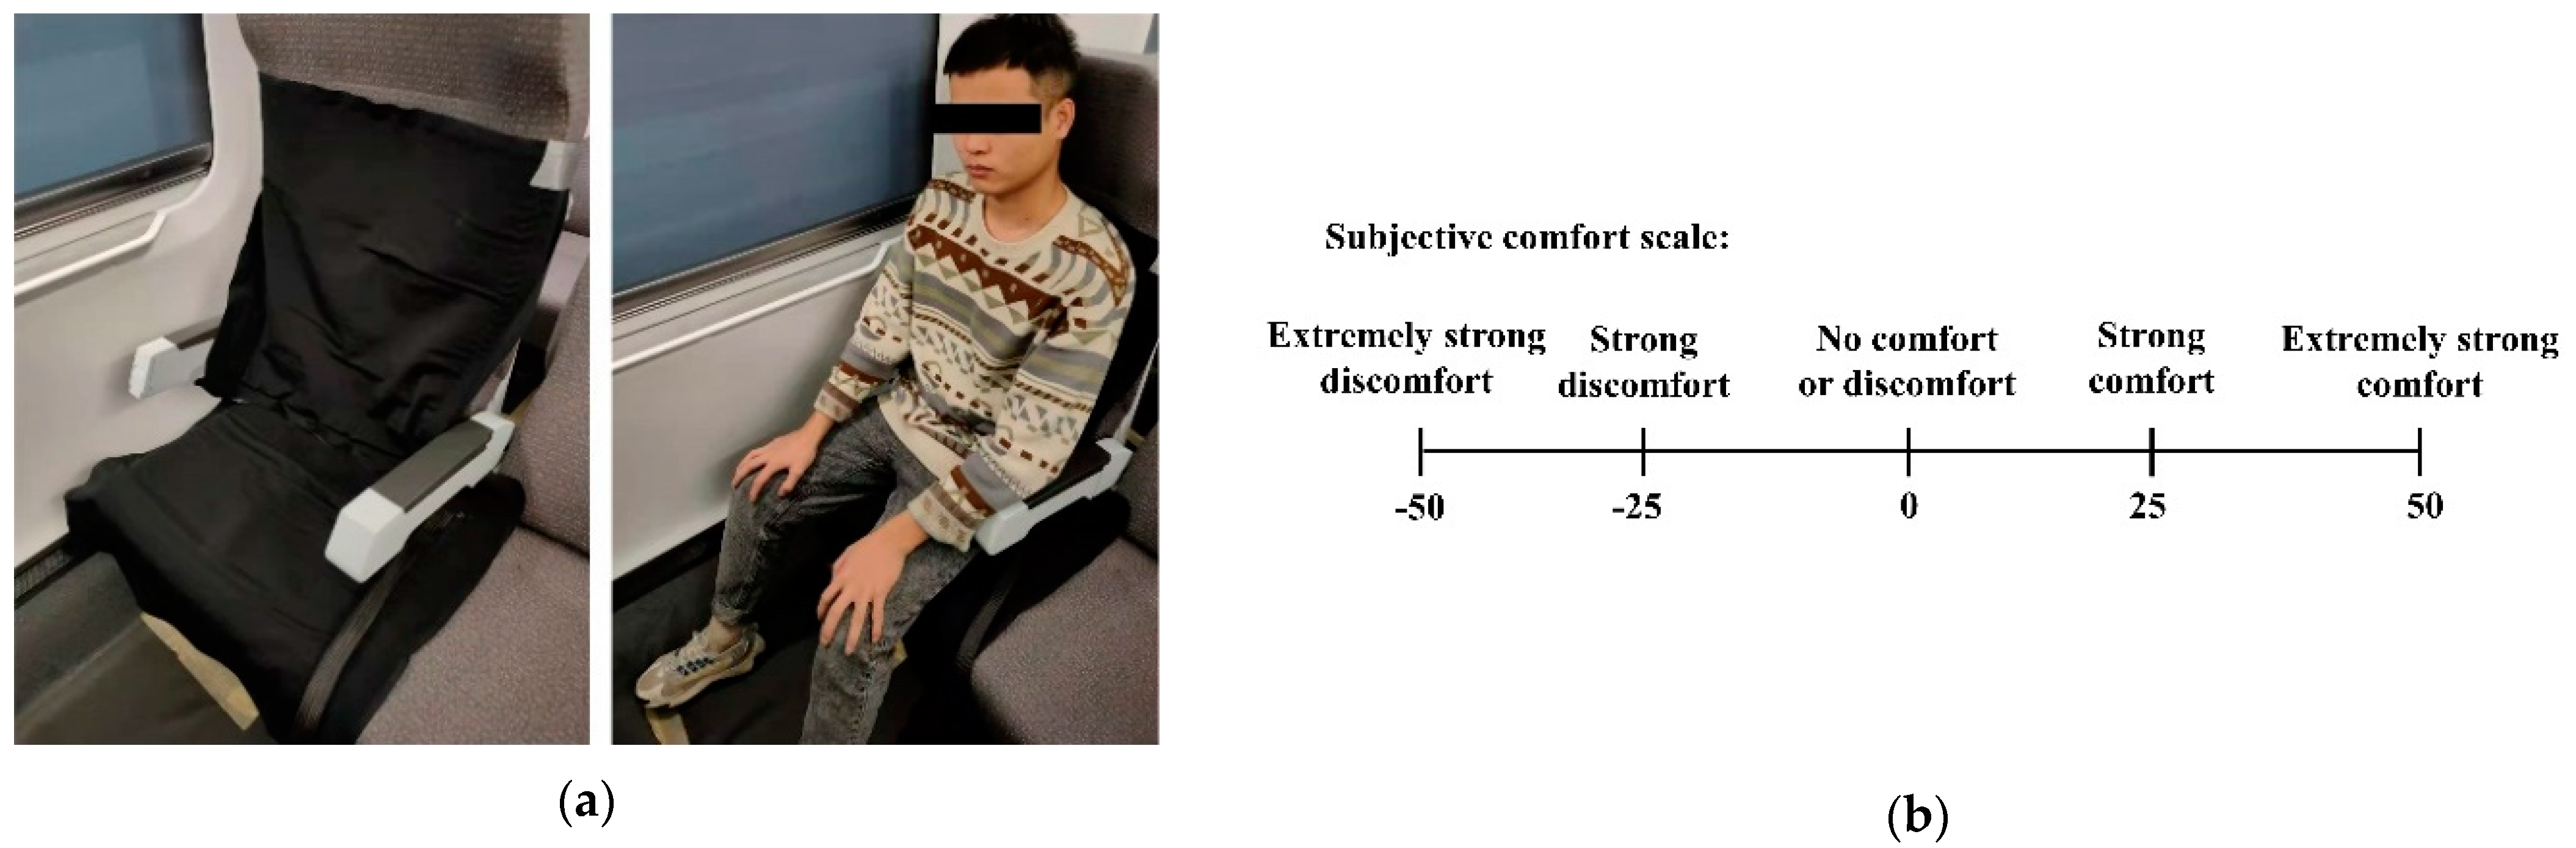
2.1. Sitting Experiment Design

The sitting experiments were carried out with 10 healthy adults, including 4 females and 6 males. Their anthropometric parameters in Mean ± SD were age 23.40 ± 1.50 years, height 1.65 ± 0.07 m, weight 63.30 ± 10.02 kg, and BMI 23.02 ± 2.46 kg/m2. Based on the Chinese National Physique Monitoring Bulletin and empirical formulas related to human factors engineering, their body sizes were validated close to the Chinese 50th percentile. Before the experiment, they were informed of the experimental content and provided written consent. The study was conducted in accordance with the American Psychological Association Code of Ethics and the protocol was approved by Xiangya No.2 Hospital of Central South University Institutional Review Board 2022–326. The CRH Train running on the Shanghai-Kunming line were selected as the experiment site to provide the most realistic riding feeling. Two sensor pads were used to obtain the interface pressure distribution between the seat and human, each with 32 × 32 capacitive sensors and a sampling rate of 5 Hz (Figure 1a). The Tactilus software (created by Sensor Products LLC in Madison, NJ, USA) was used to generate 2D pressure distribution graph and calculate the peak pressure, mean pressure, and contact area for each frame. The Visual Analogue Scale (VAS) method was used to design the comfort questionnaire and obtain subjective data [29]. These scales ranged from 0 to 50 and 0 to −50 for comfort and discomfort, respectively (Figure 1b).
All participants were asked to take the train at 7 AM and 2 PM to complete a round–trip during the day and all sitting tests are carried out with the same second–class seat in a coach. After the train started, they had a 10 min break and then sat in second–class seats with pressure sensor pads to start the experiment. The seat angle was preset to the participants’ preference. The questionnaire needed to be completed at the beginning of the experiment and then every ten minutes. Typically, long–term sitting can lead to fatigue and cause in–chair movement, which may affect the accuracy of seat comfort analysis and optimization. According to the research of Fasulo et al. [30], there are less in–chair movements in the first 20 min and the fatigue is not accumulated at this time. Therefore, the data collection time was limited to 20 min to obtain at least three comfort questionnaires for each participant.

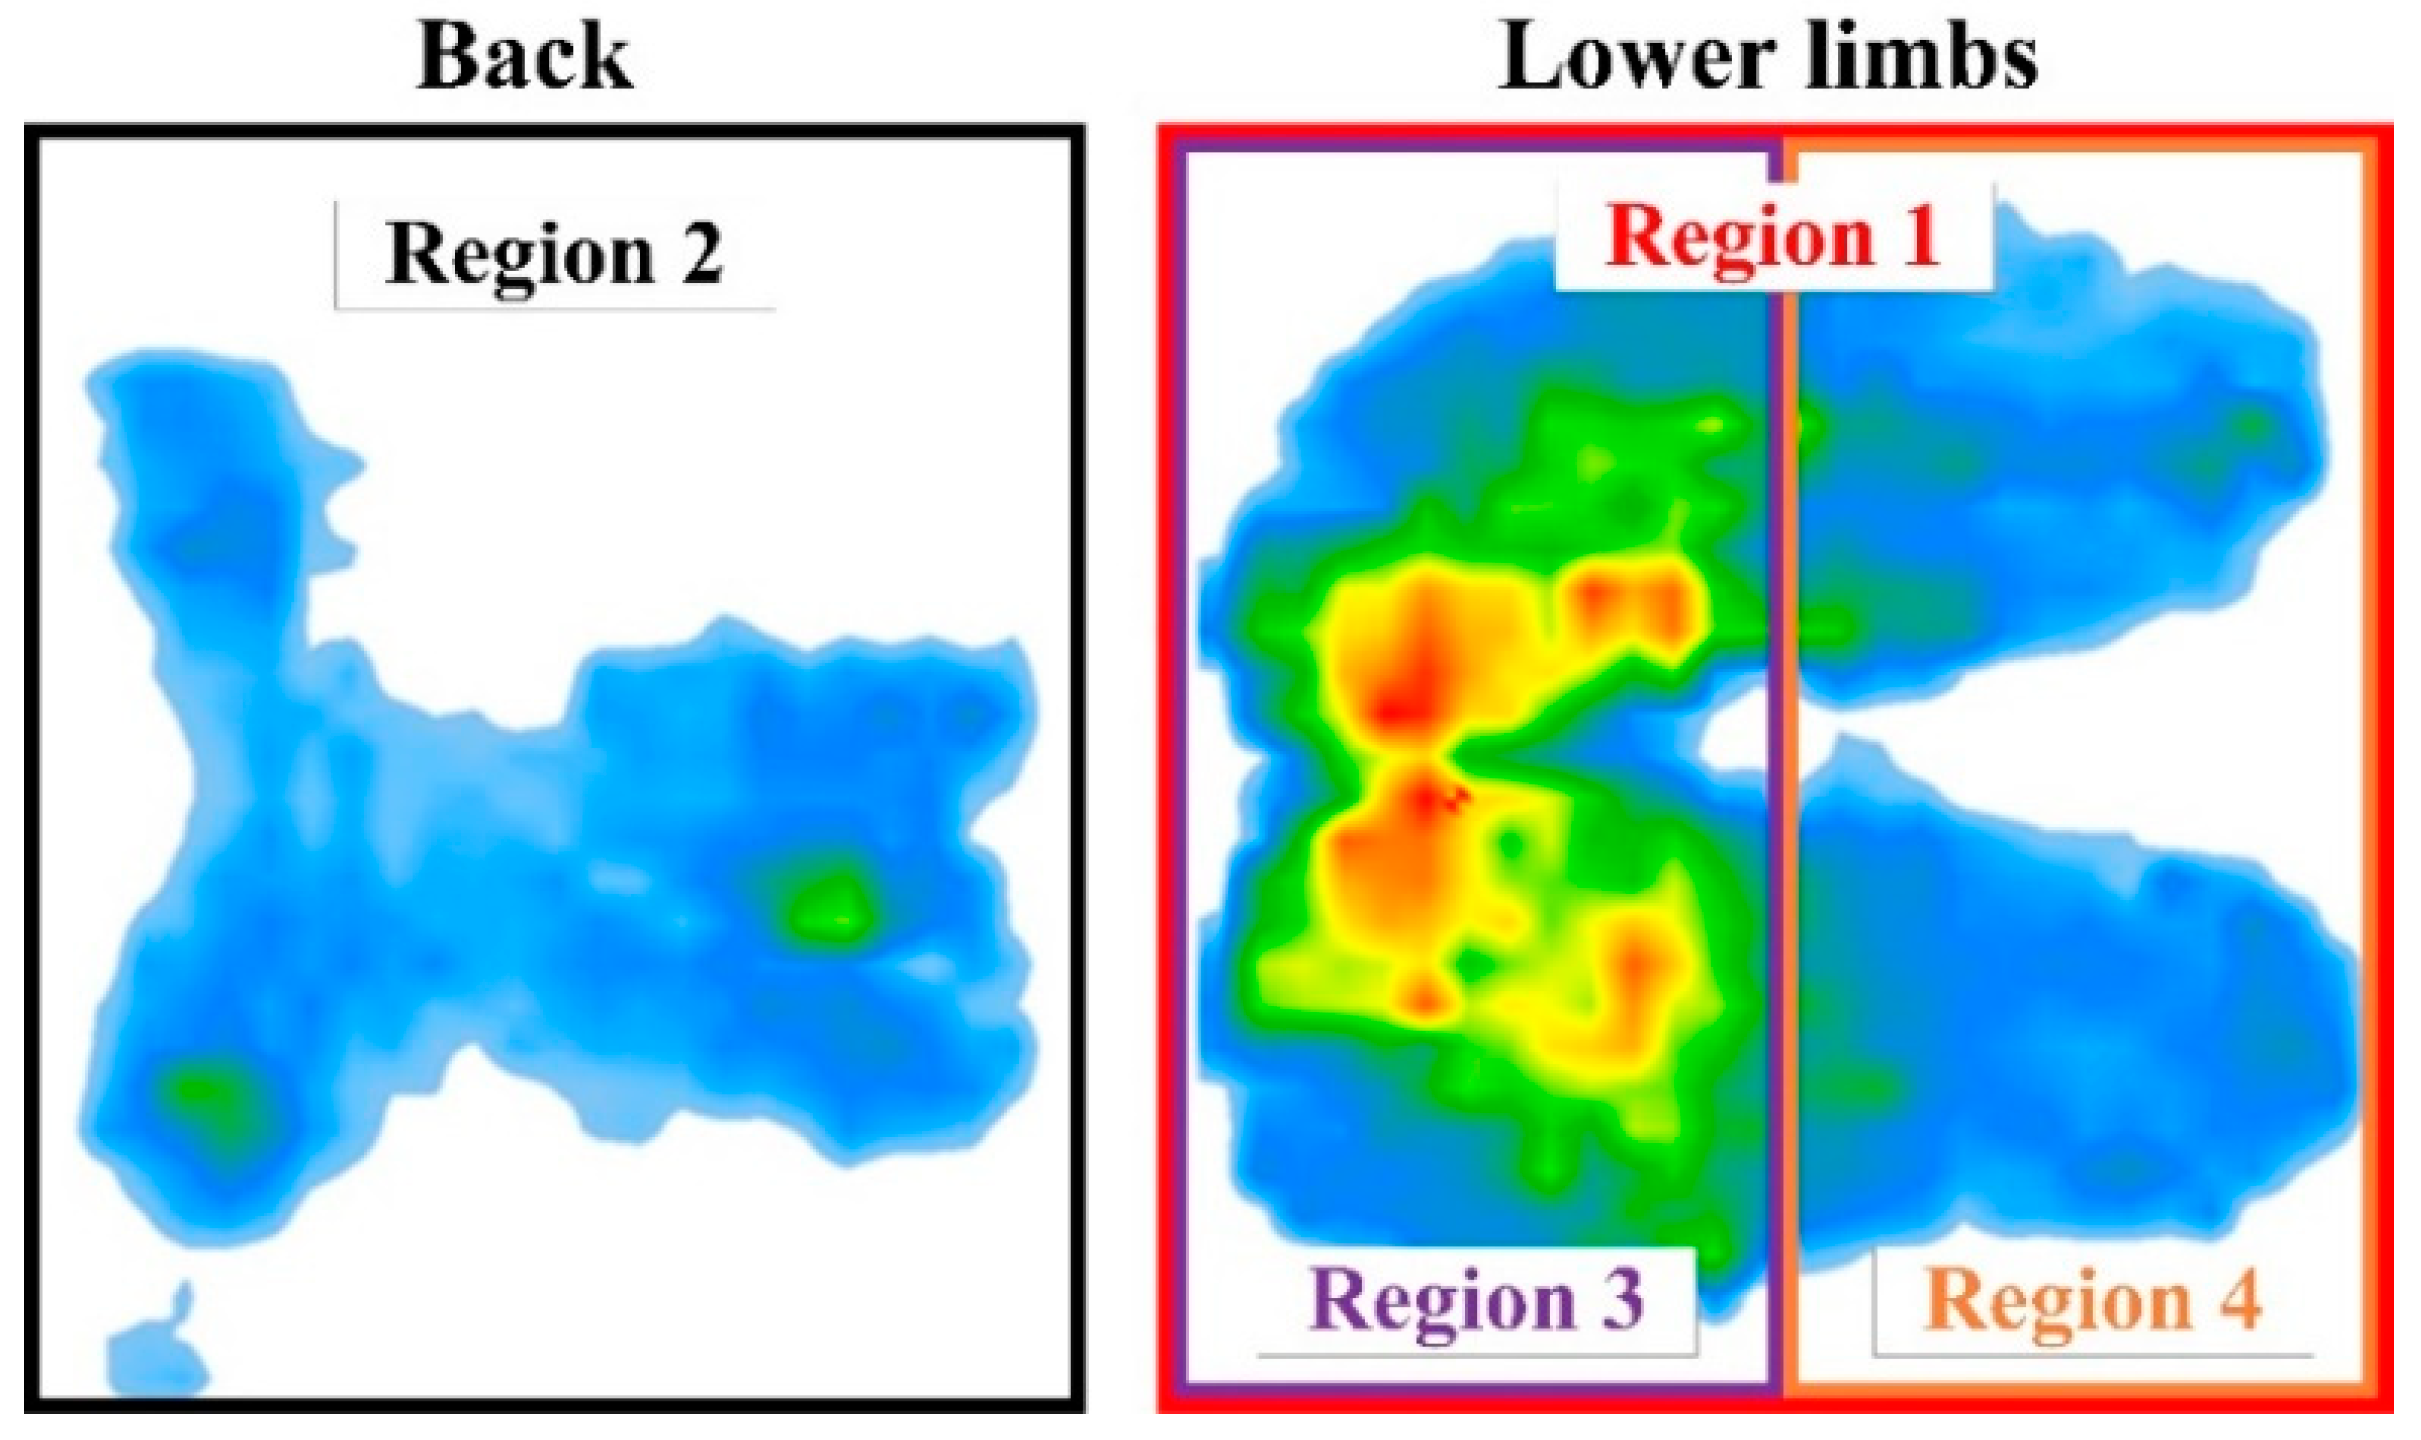
2.2. Data Analysis and Sitting Comfort Evaluation

Before the analysis of the original data, it is necessary to divide the interface pressure into several regions. Unlike car drivers, the passengers on high–speed trains do not need to step on the accelerator or brake, with both sides of bodies in a symmetrical environment. A simple calculation is used to compare the interface pressure distribution on the left and right sides of the passenger. The result shows that the difference is not more than 25% during whole test. In this study, the left and right sides of a passenger were not distinguished. The pressure matrix of the seat was divided into four regions, where Region 1 was the combination of Region 3 and Region 4 (Figure 2).
According to the research of Romano et al. [31], the pressure features are calculated by using the average of the pressure matrices over six seconds to reduce measurement errors. In order to expand the sample set, overlapping sampling was used and the average matrix was calculated every three seconds. Each sample contains 21 features extracted from one average matrix (Table 1). The first 12 features described the average peak pressure, mean pressure, and contact area of each region. In addition, the ratio features have been widely used in the current study [32]. Therefore, the second 9 features were the ratios of average peak pressure, mean pressure, and contact area in Regions 2 to 4.
Generally, short–term sitting will not exceed 20 min in a seat comfort study [31,32,33]. As the effect of fatigue is not significant, seat factors contribute more to riding comfort in short–term sitting. Generally, it can be considered that the subjective comfort rating will not change significantly within one minute [31]. For this reason, subjective questionnaires in the first 20 min were used to label samples within one minute around the filling time. Then, the statistical analysis was used to build a sitting comfort evaluation model based on all labeled samples. First, the bivariate correlation analysis was performed between the comfort ratings and 21 pressure features. The independent variable was composed of features with a significant correlation (p < 0.05) and a correlation coefficient more than 0.4. Finally, a stepwise regression analysis was used to construct the regression equation of the independent variables and the subjective comforts.

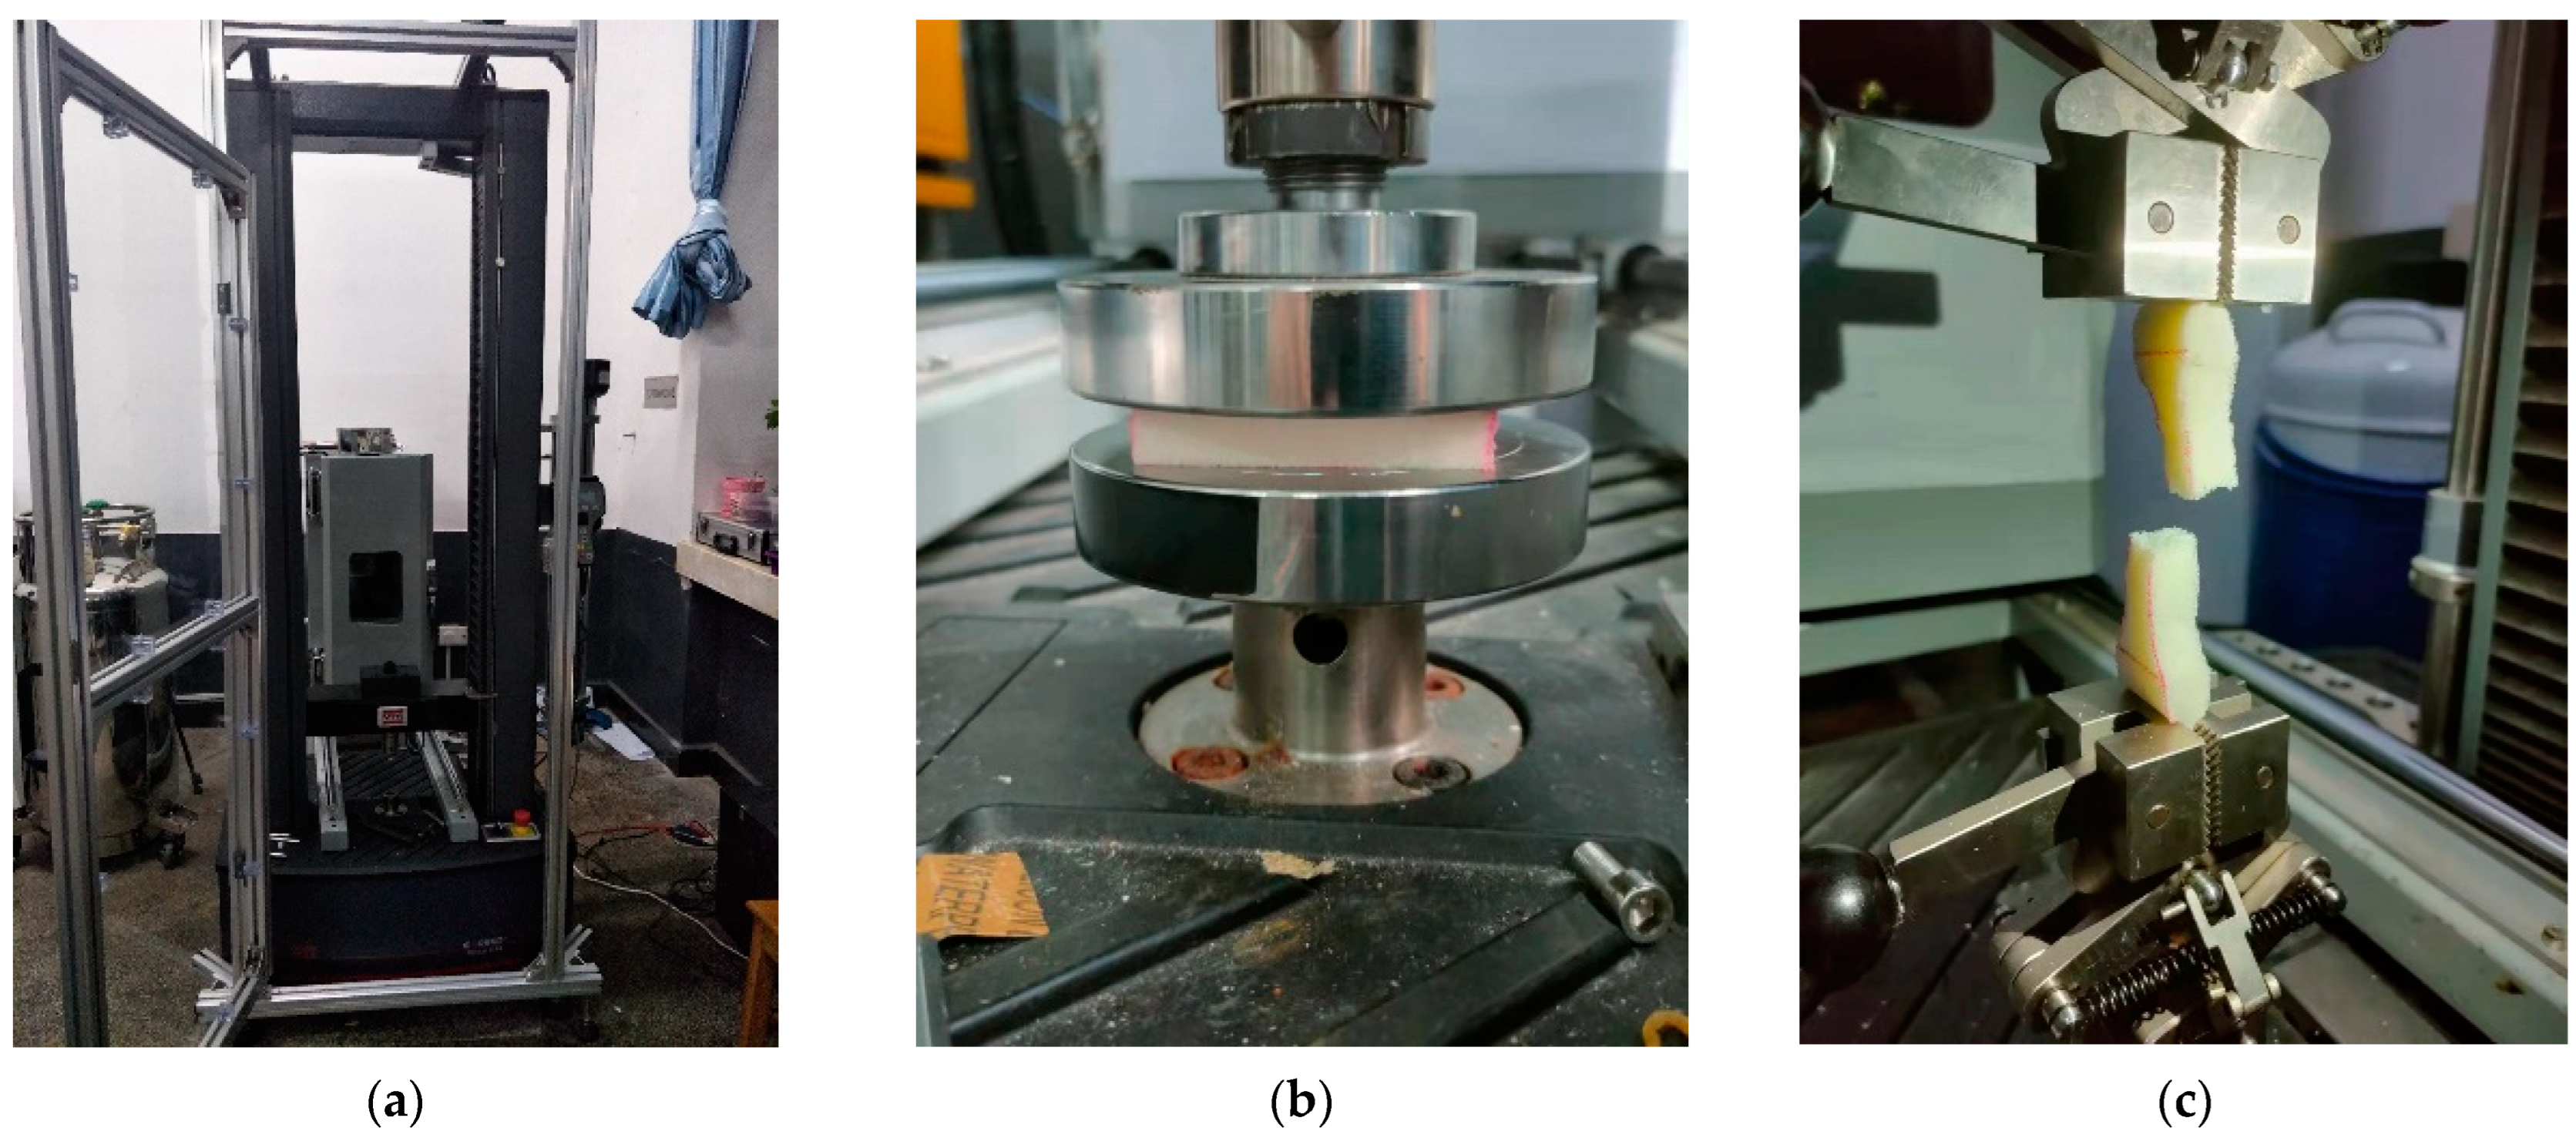
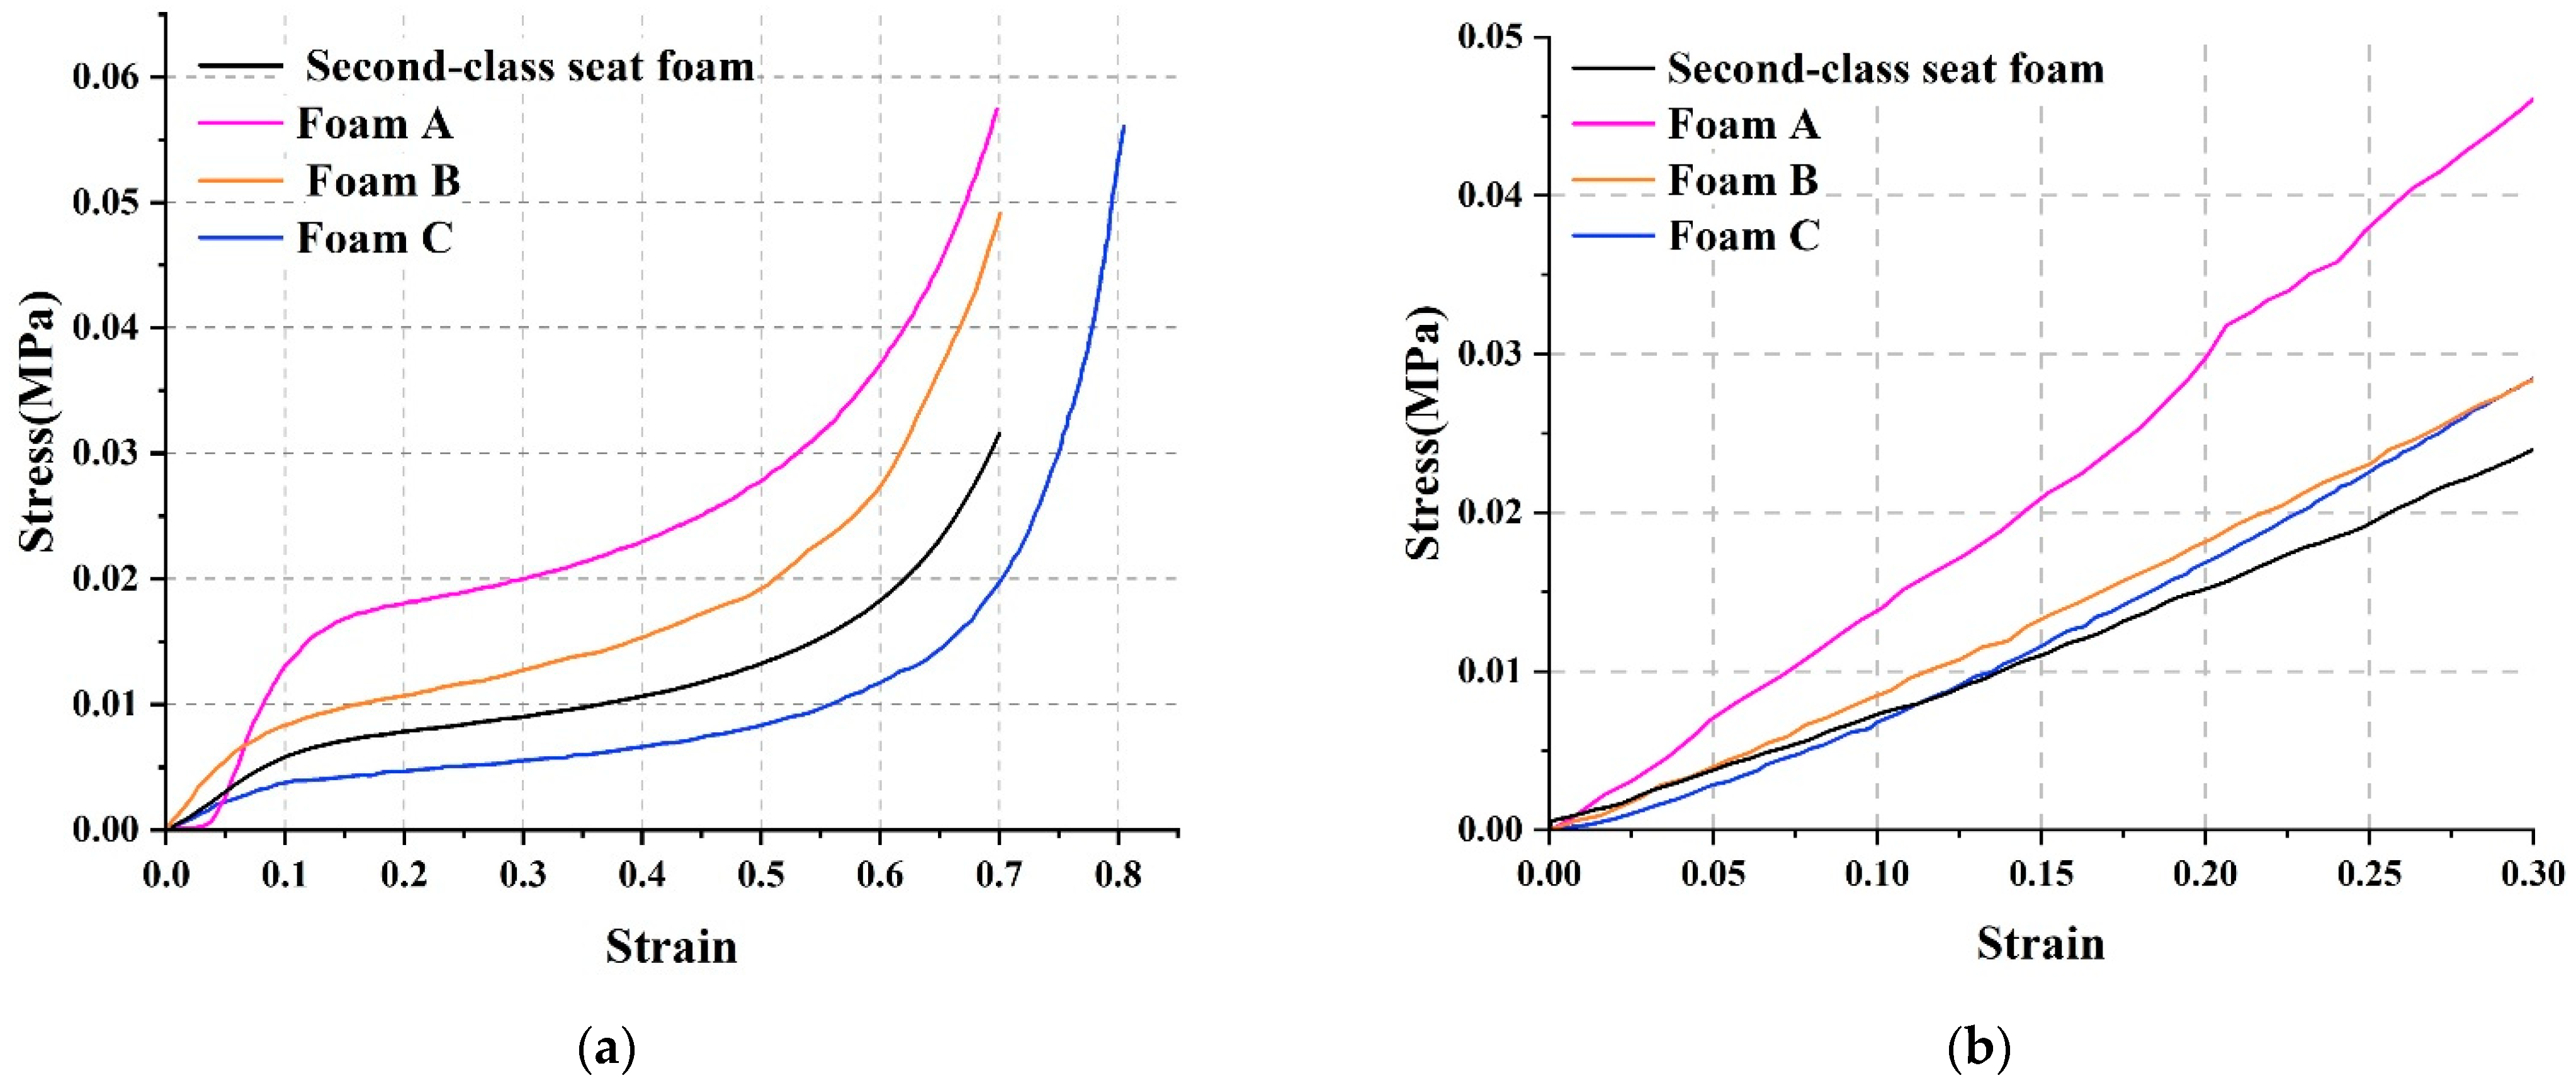
2.3. Measurement of Polyurethane Foam Characteristic

For simulating the relationship between the human and the seat in LS–DYNA (created by Livermore Software Technology Corporation in Livermore, CA, USA), a MAT_57 material model was applied to the seat cushion and backrest in this study. To complete the definition of the material model, the following parameters need to be known: material density, loading curves for the compression, Young’s modulus in tensile, hysteretic unloading factor (HU), shape factor for unloading (SHAPE), and decay constant for modeling creep in reloading (BETA). Two experiments were carried out to identify the compressive and tensile properties of polyurethane foam with the ISO 3386–1 [34] standard and ASTM D 3574–03 [35] standard. The specimens were taken from the middle area of the second–class seat cushion on the high–speed train. Three had a cuboid shape with dimensions of 60 × 60 × 30 mm for a compression test and the other three had a specific shape for the tensile test.
Both the compression and tensile test were performed on an MTS electronic testing machine with a constant displacement rate of 100 mm/min [34,35] (Figure 3a). The force sensor was set under the cross–beam of the test equipment and the cross–beam displacement was recorded as the compression/tension distance, which was obtained by measuring the number of output pulses of the photoelectric encoder. The loading process had two sub–processes in the quasi–static compression test: loading up to 0.7 of strain and then unloading with the same strain rate immediately (Figure 3b). Each specimen needed to be preloaded twice before the formal experiment. There is no limit to the maximum strain in a quasi–static tensile test, so the loading continued until the specimen broke (Figure 3c).

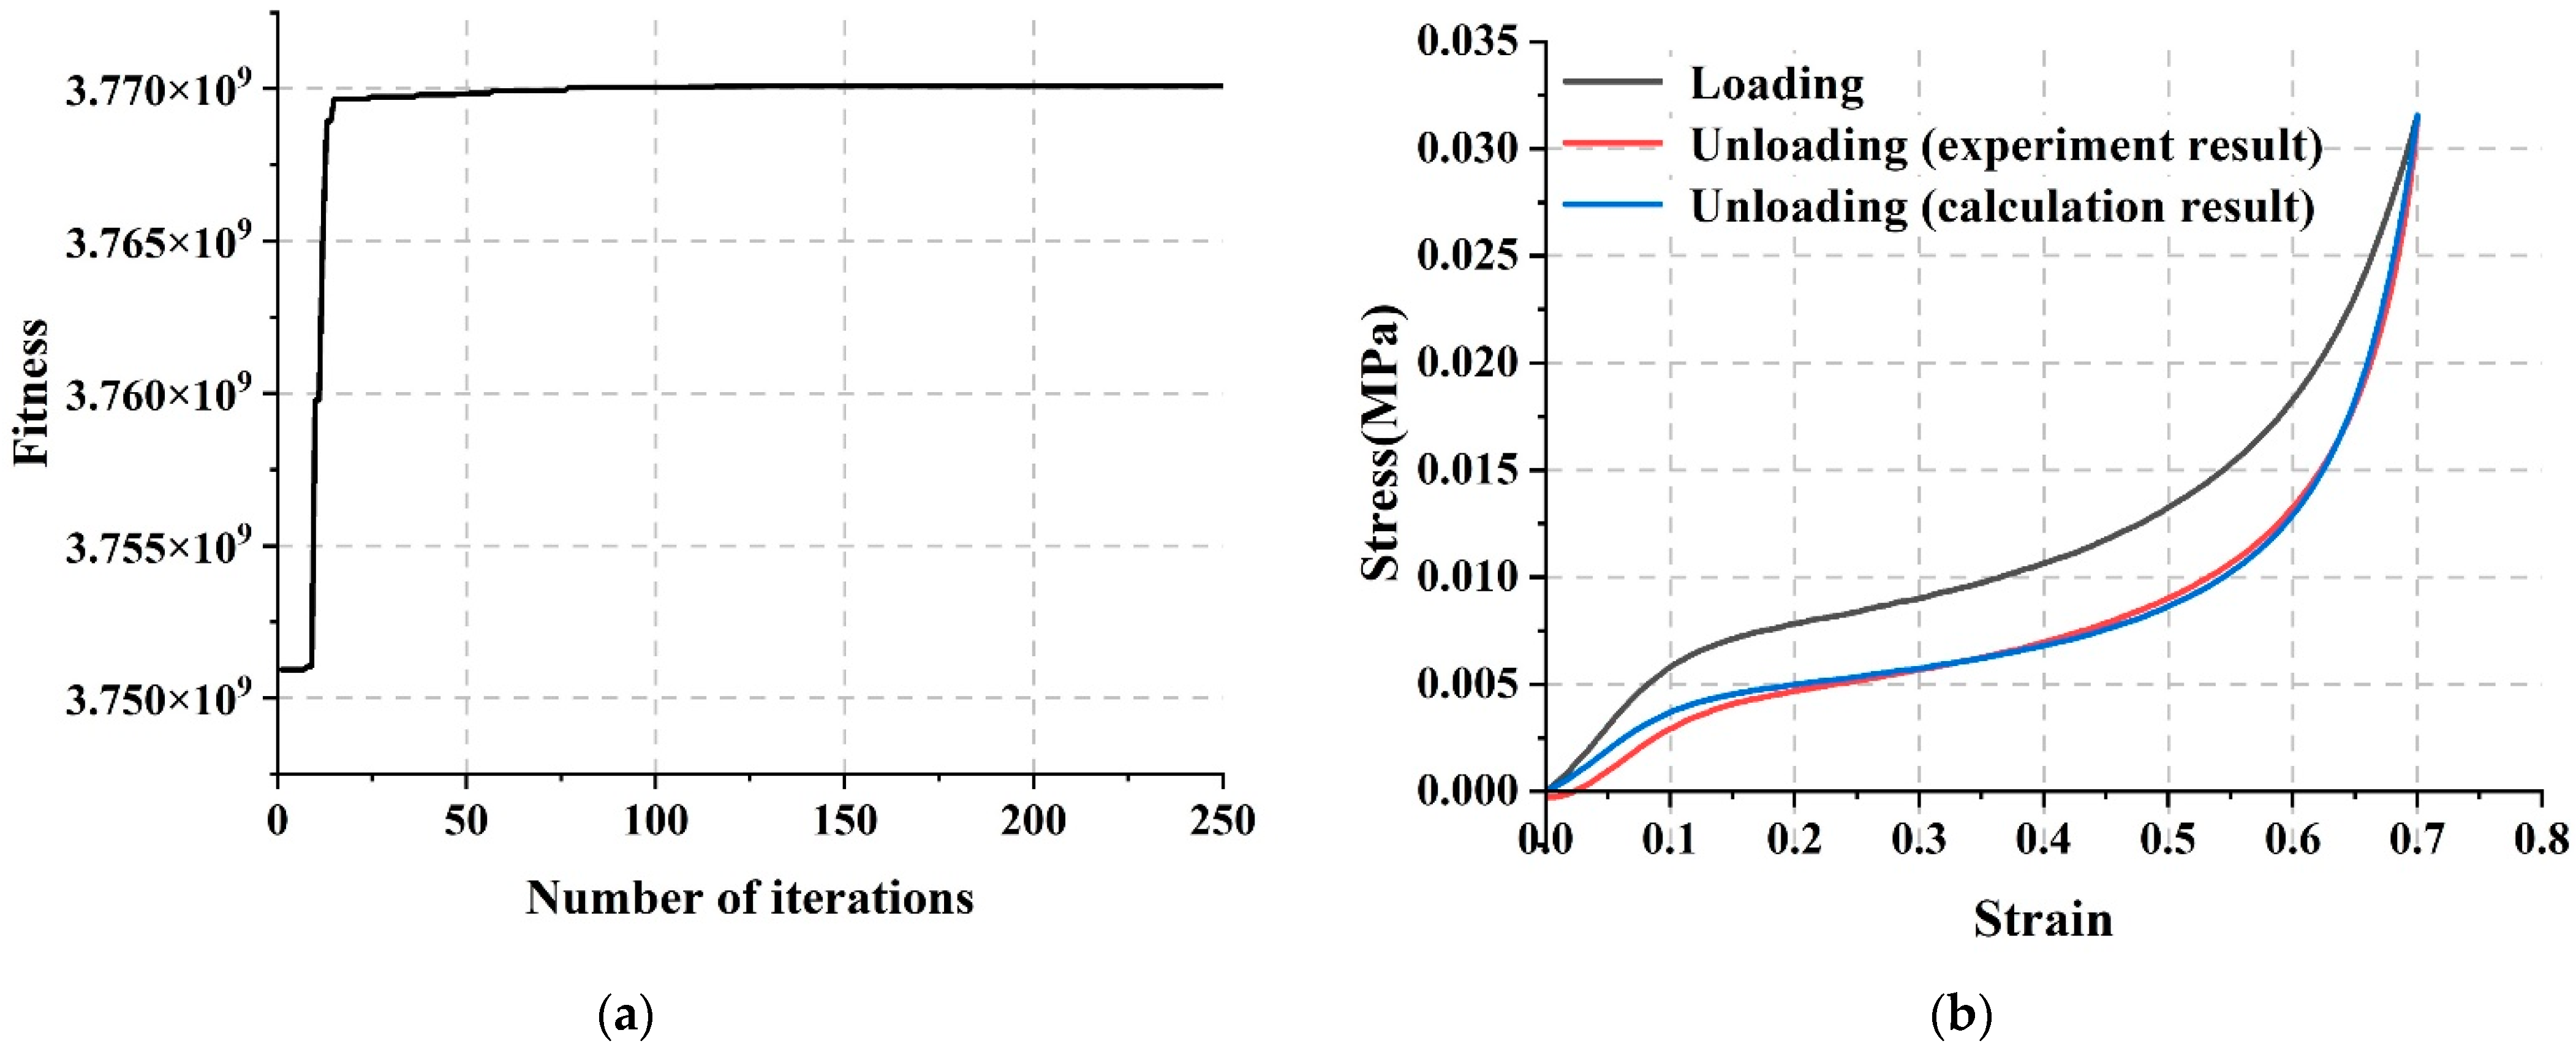
2.4. Parameter Identification Based on Genetic Algorithm

In the MAT_57 material model, the parameters HU, SHAPE, and BETA are used to describe the behavior of polyurethane foam during the compressive unloading and reloading. According to the research of Škrlec et al. [33], the loading and unloading processes in the FE model conform to the following equations:
σ u n l o a d i n g ( ε ) = H U + 1 H U 0 ε σ l o a d i n g ( ε ) d ε 0 ε max σ l o a d i n g ( ε ) d ε S H A P E σ l o a d i n g ( ε ) ,
where σ l o a d i n g ( ε ) and σ u n l o a d i n g ( ε ) represent the stress–strain curve of the polyurethane foam during the compressive loading and unloading, respectively, and the integral 0 ε σ l o a d i n g ( ε ) d ε represents the strain energy density. The factor BETA determines the deformation pattern that a reloading curve will follow after a loading and unloading process [36]:
σ r e l o a d i n g ( ε ) = σ u n l o a d i n g ( ε ) + σ l o a d i n g ( ε ) σ u n l o a d i n g ( ε ) 1 e β t ,
where σ r e l o a d i n g ( ε ) represents the mechanical curve while the foam is reloaded after a complete loading and unloading cycle. If BETA is zero, the reloading curve will coincide with the unloading curve in the previous cycle. Since the polyurethane foam is loaded and unloaded for only one cycle during the process of sitting, the factor BETA is set to the default value (zero) in this study. Then, the genetic algorithm was used to calculate the parameters HU and SHAPE based on the current material science research results [37,38] and the compression curve obtained in Section 2.3. Each parameter was described by 20 genes in a chromosome and the genetic code is as follows:
P = b 11 , b 12 , , b 1 j , , b 1 , 20 ; b 21 , b 22 , , b 2 j , , b 2 , 20 ,
where b i j represents the gene on the chromosome and is defined as a binary number. The gene code of each individual in the initial population is determined in a completely random way. This means that each gene in a code has a 50% probability of being either 0 or 1. Using HU as an example, the decoding formula is defined as follows:
H U = H U min + j = 1 20 b 1 j 2 j 1 H U max H U min ,
where H U max and H U min represent the upper and lower limits. The parameter SHAPE can be calculated in a similar way. Then, the fitness function f ( P ) was defined to describe the difference between the experimental and simulated curve and draw a convergence history graph:
f H U , S H A P E = 1 0 ε max σ sim ( ε ) σ exp ( ε ) 2 d ε ,
where σ sim ( ε ) and σ exp ( ε ) represent the simulated and experimental results. The initial population contains 100 randomly generated individuals and the individuals with fitness in the top 20% will be kept as elites at the beginning of each iteration. All the other individuals in the population have a probability of 0.9 and 0.1 for crossover and mutation, respectively. The fitness of the optimal individual in the population is defined as fmax and the change of function fmax with the generations is recorded as the convergence history. The calculation will terminate when the iteration number reaches 250 unless the function fmax is still not stabilized.

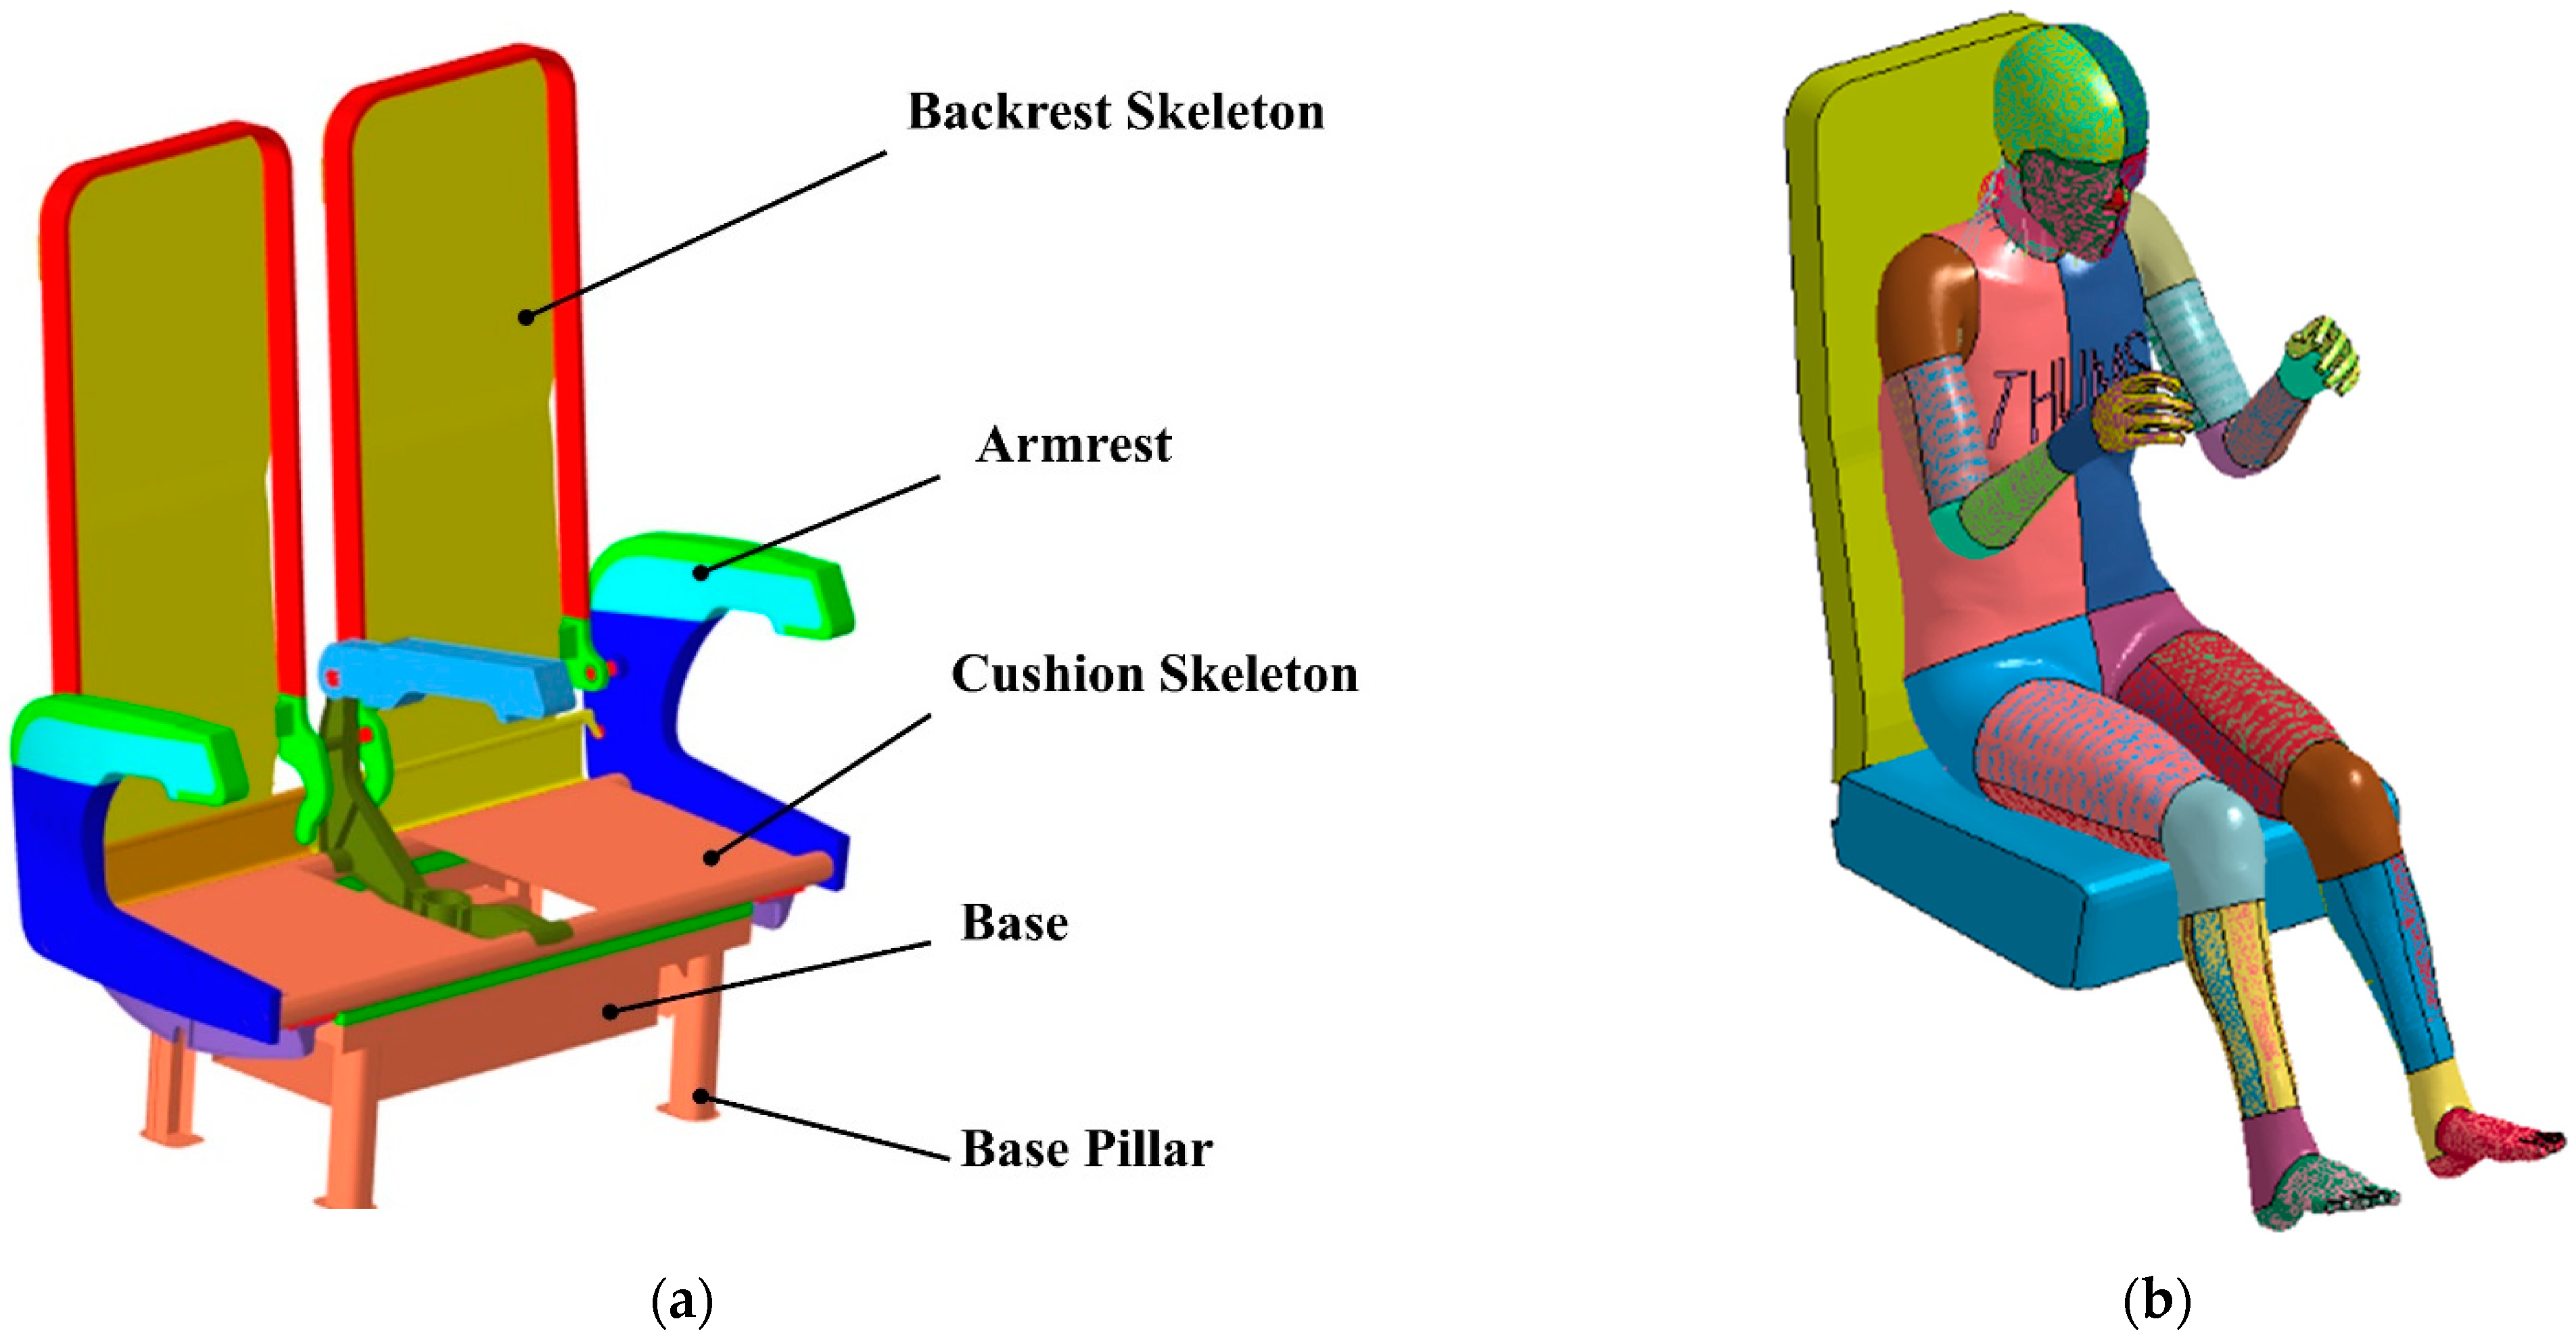
2.5. Construction and Validation of Seat-Human Finite Element Model

A generic seat-human finite element model was constructed within this study (Figure 4b). First, a solid-geometrical model of seat was developed using NX 10.0 (created by Siemens PLM Software in Plano, TX, USA), a CAD program. The relative positions of the cushion and backrest are determined by the seat frame (Figure 4a), but the latter is omitted in the final model. Then, the CAD model was pre–processed by using HyperMesh 2019 (created by Altair Engineering Inc. in Troy, MI, USA), a finite element analysis pre–processing software. Both the cushion and backrest models consisted of first–order hexahedral elements of sizes 10 mm and 5 mm, respectively, and both were constructed using LOW_DENSITY_FOAM (MAT_57). Finally, the THUMS (Total Human Model for Safety) with a height 154 cm and weight 52 kg was used in this research to simulate the seated human body. The seat angle was set to the initial state (0 degree) and human model was about to touch the seat model at 0 s.
The interactions between the human and the second–class seat were analyzed in LS–DYNA using a penalty–based contact method. In this case, the penetration of the component surfaces into each other is resisted by a linear spring force [39].
The human torso and thighs are set to “master surface” and the seat cushion and backrest are set to “slave surface”. There is no limit to the magnitude of the normal stress between the contact surface and the shear stress is calculated based on the static and dynamic friction coefficients and the upper–bound static shear stress limit.
To validate the seat-human model built in the present work, a static sitting experiment was carried out with a female participant (height 157 cm and weight 48 kg) in a laboratory. The posture and seat angle are the same as the FE model. Then, the calculation result including the interface pressure distribution and pressure features was compared with their test counterparts. The pressure curve in transverse and longitudinal directions, σ ( x ) and σ ( y ) , were used for further comparison, which are defined as follows:
σ ( x ) = 0 y max σ B P x , y d y ,
σ ( y ) = 0 x max σ B P x , y d x ,
where σ B P x , y is the pressure distribution function on the contact surface. Generally, the interface pressure is recorded as a matrix P in the simulation and experiment results, within which the elements P i j T follow the equation:
P i j T = σ B P x i , y j ,
In this case, Equations (7) and (8) can be rewritten as follows:
σ ( x i ) = j = 1 n σ B P x i , y j b ,
σ ( y j ) = i = 1 m σ B P x i , y j a ,
where a and b represent the length and width of a cell, x i = a i , y j = b j .

2.6. Seat Comfort Optimization Based on Seat-Human Model

According to the current research, the interface pressure can be affected by the polyurethane foam characteristic and angle of the seat cushion and backrest [22,25]. Three other different polyurethane foams A, B, and C were obtained through the literature investigation [40,41,42], and their mechanical characteristic curves are shown in Figure 5.
To reduce the influence of irrelevant factors on the interface pressure distribution [43], the angle of the human pelvis relative to the seat was fixed in simulation [44]. The passenger always sits in an upright posture and the angle between the backrest and seat cushion is consistent in any situation. Table 2 shows the 12 orthogonal test conditions obtained by free combination between three seat inclination angles and four foam materials. In addition, the seat inclination is defined based on the current second–class seat angle.

3. Results and Discussion

3.1. Sitting Comfort Evaluation Based on Statistical Analysis

Based on sitting times of no more than 20 min, a total of 418 samples were extracted from the original objective and subjective data. According to the results of the bivariate correlation analysis between 21 pressure features and sitting comfort, the feature with r > 0.4 were selected as initial independent variables for the next stepwise regression analysis. After several iterations, the adjusted R–square of the final regression model reached 0.684. Since the model is only used for comfort prediction, less collinearity of independent variables is allowed. The parameter values of the final regression model are shown in Table 3.

3.2. Mechanical Characteristic Measurement of Polyurethane Foam

The tensile and compressive properties of three polyurethane foam taken from second–class seat specimens are shown in Figure 6. Their curves are almost identical, which verifies its reliability. According to the measurement during the compression test, no significant lateral deformation of the foam specimen was observed. Therefore, the Poisson’s ratio effect is not necessary to be considered in the simulation. In addition, the loading and unloading curves in Figure 6a coincide at the origin, therefore no plastic deformation occurs in the compression experiment.
The calculation result of the genetic algorithm is shown in Figure 7. In the last iteration, the values of HU and SHAPE are obtained by decoding the genes of the optimal individual, which are 0.6370 and 4.6416, respectively. Since the fitness function value converges with the number of iterations, it can be considered that the parameter values in the final result are the closest to the actual.

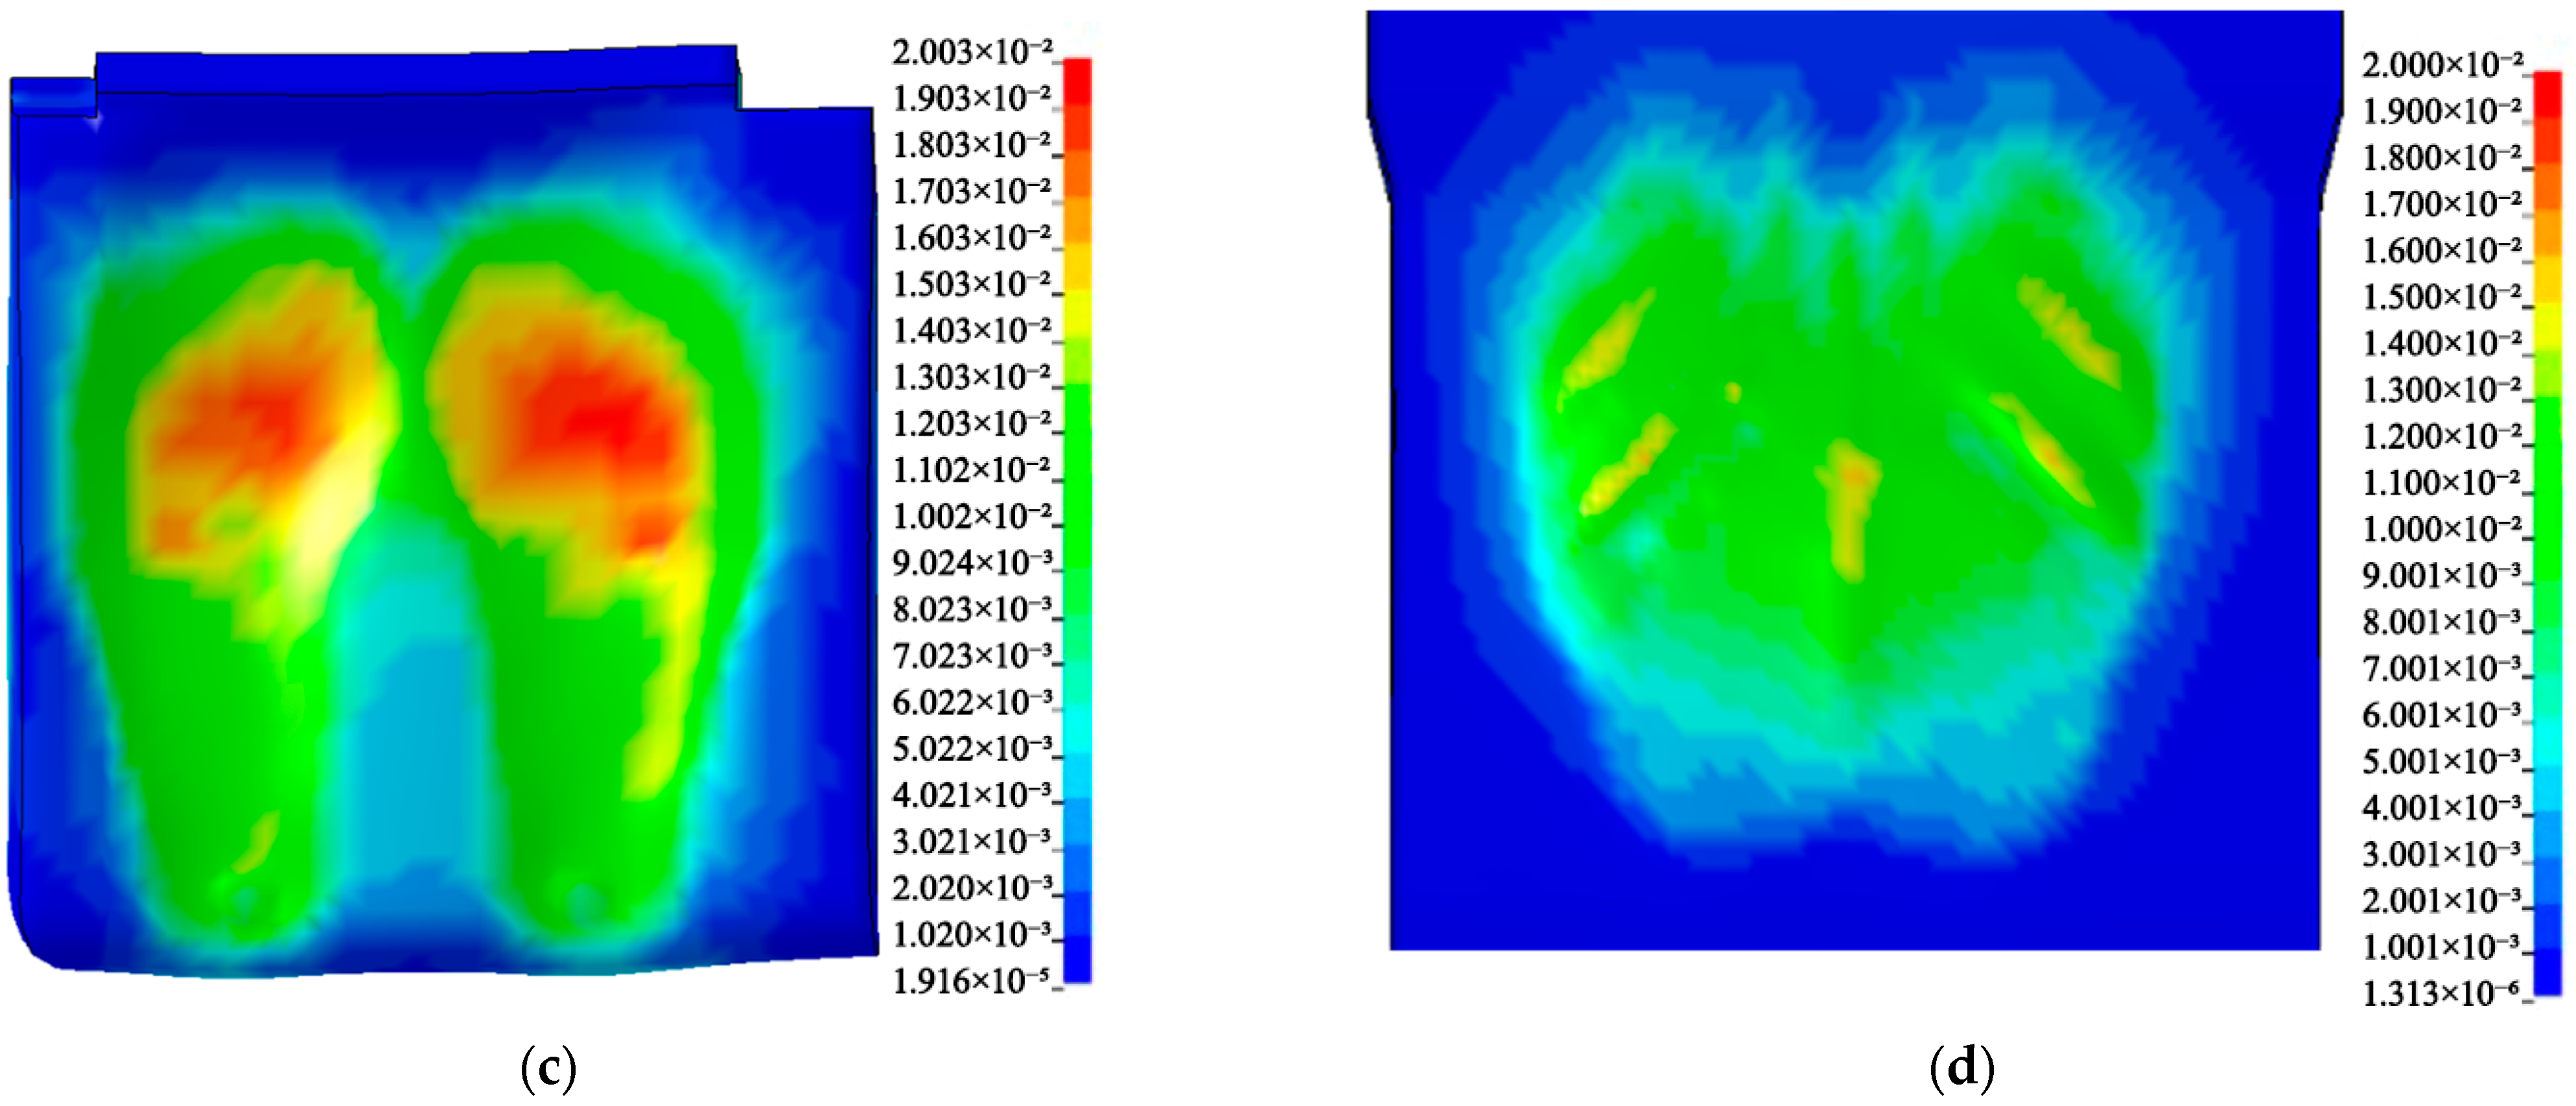
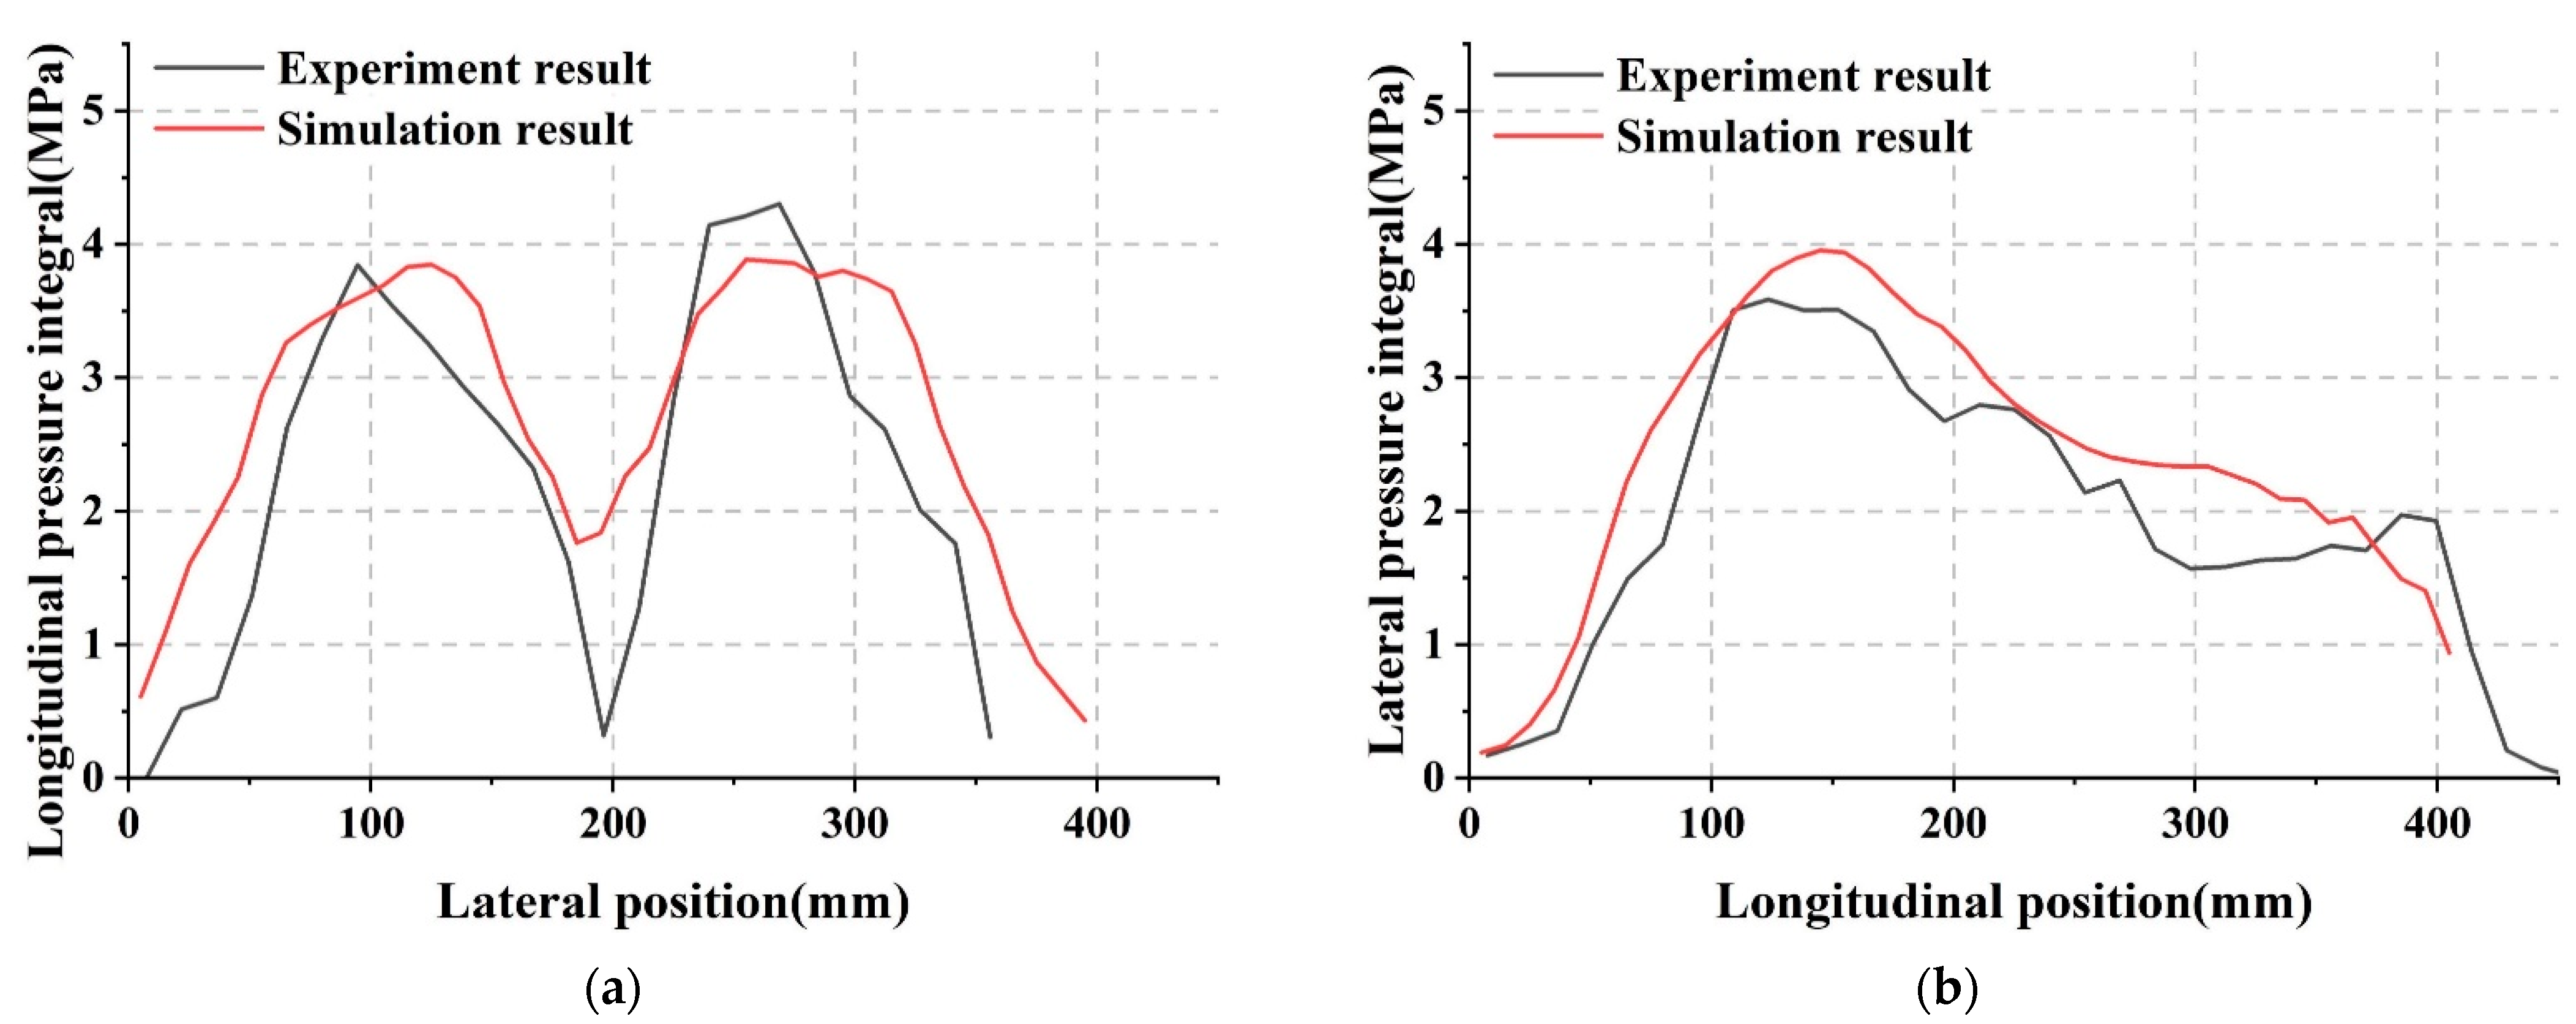
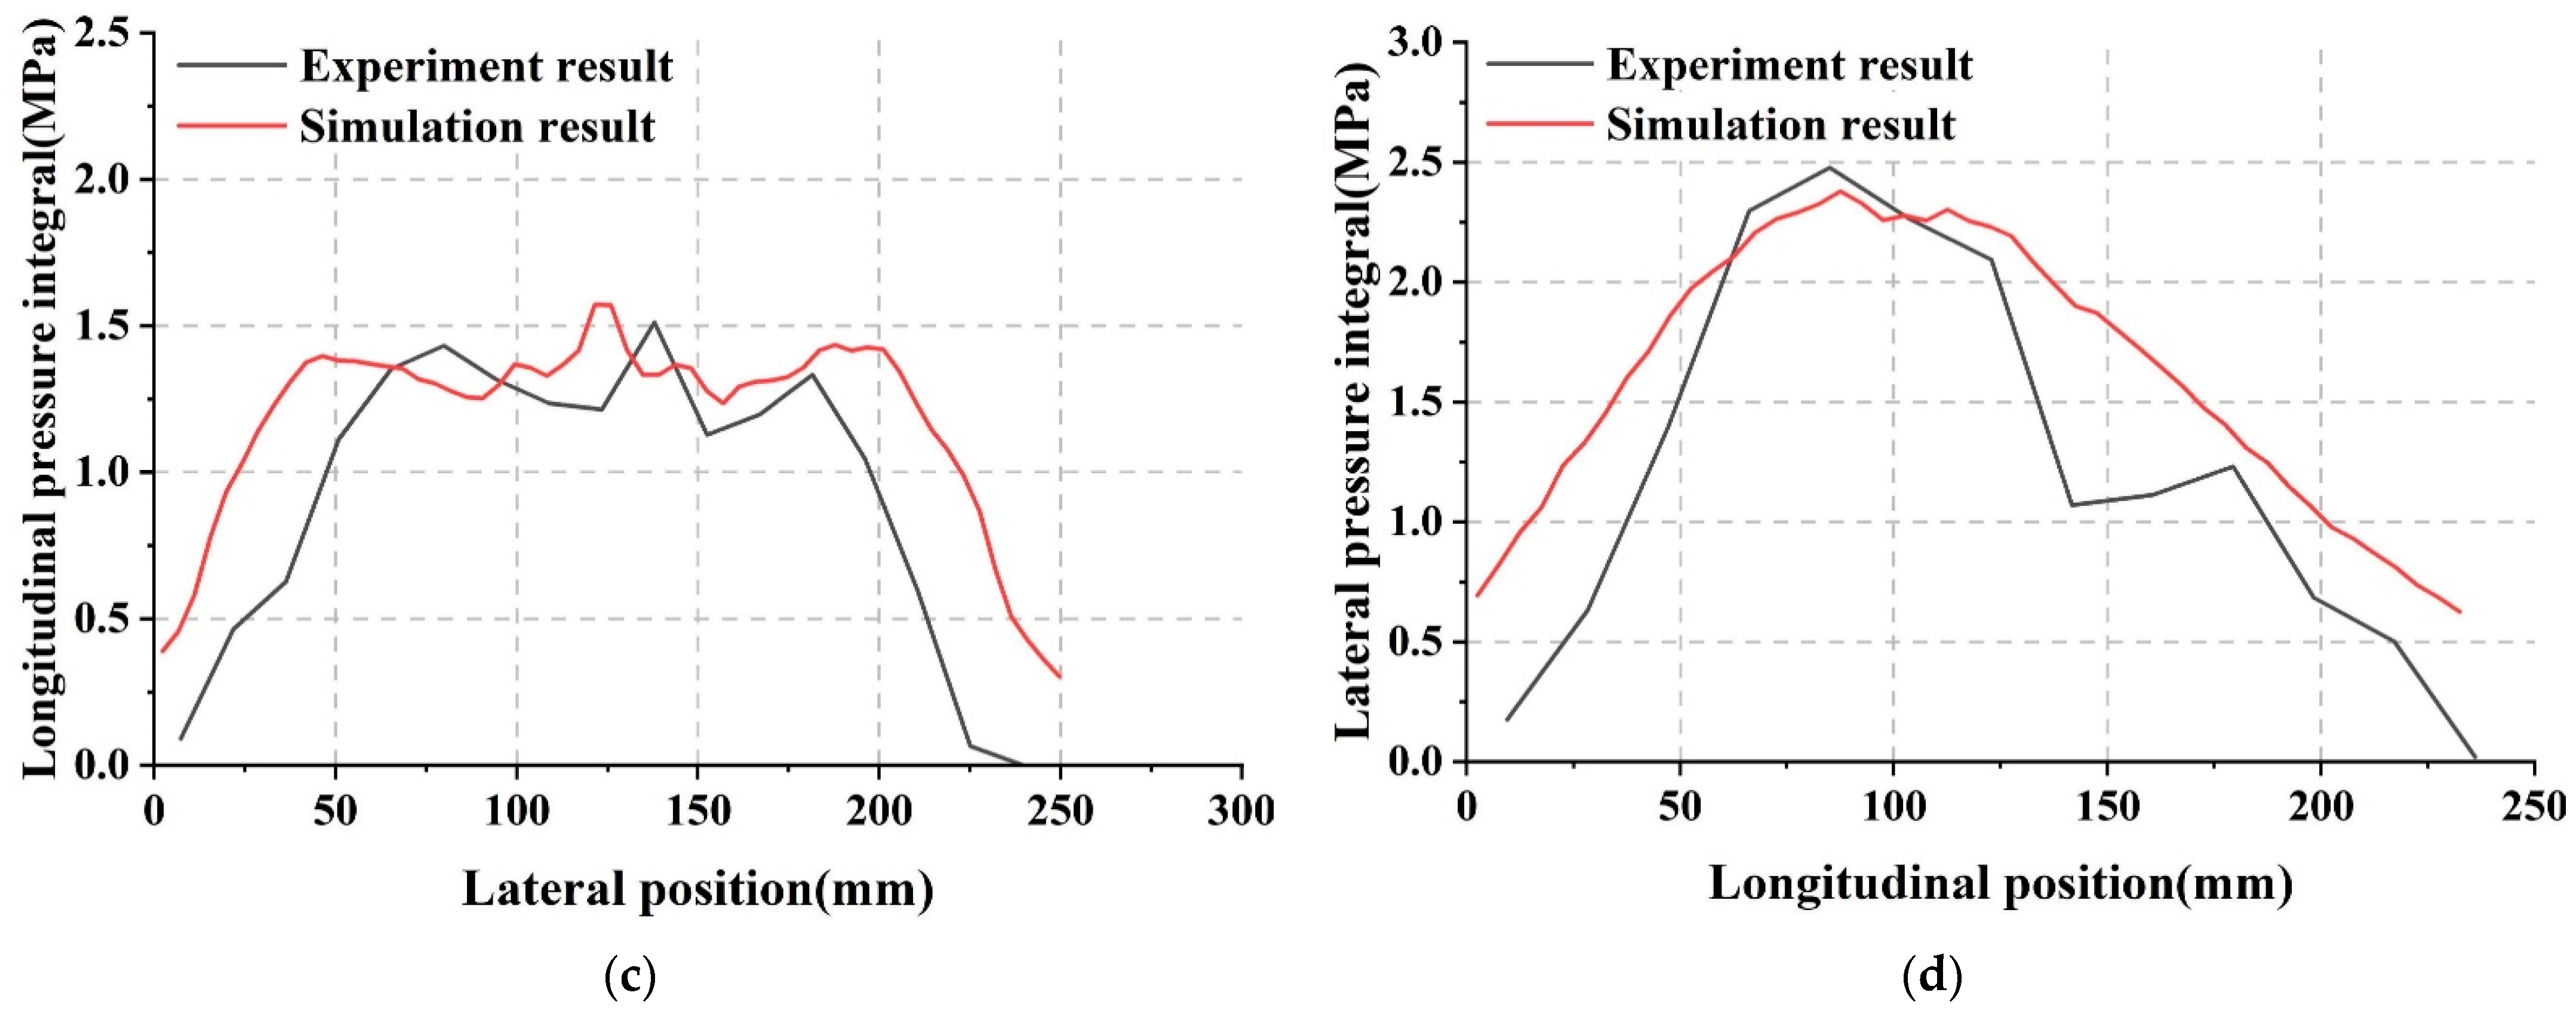
3.3. Seat-Human Model Validation

From the comparison of experimental and computational results shown in Figure 8, there is a moderately good agreement between their pressure matrices. In both cases, the peak pressure is around 0.021 MPa (or 160 mmHg) and is located at the ischial tuberosity and spine with a similar shape. Besides, the local maximum pressure at the ribs in Figure 8d may be due to the less clothing outside the human model.
Then, the pressure matrices of the experiment and simulation were further compared by calculating the pressure curve (Figure 9). Since the element size of pressure pads is larger than that of FE model, which leads to the difference in the size of the pressure matrices, the pressure curve of the experiment results has fewer sample points and more sharp corners. In both cases the pressure curves have similar trends, heights, and widths. Moreover, the difference between the six main pressure features in the actual and calculated cases is within 15% (Table 4), which means that the comfort assessment model also applies to the simulation results. Therefore, the present model can reflect the seat-human interactions to a considerable extent and can be used for further analysis.

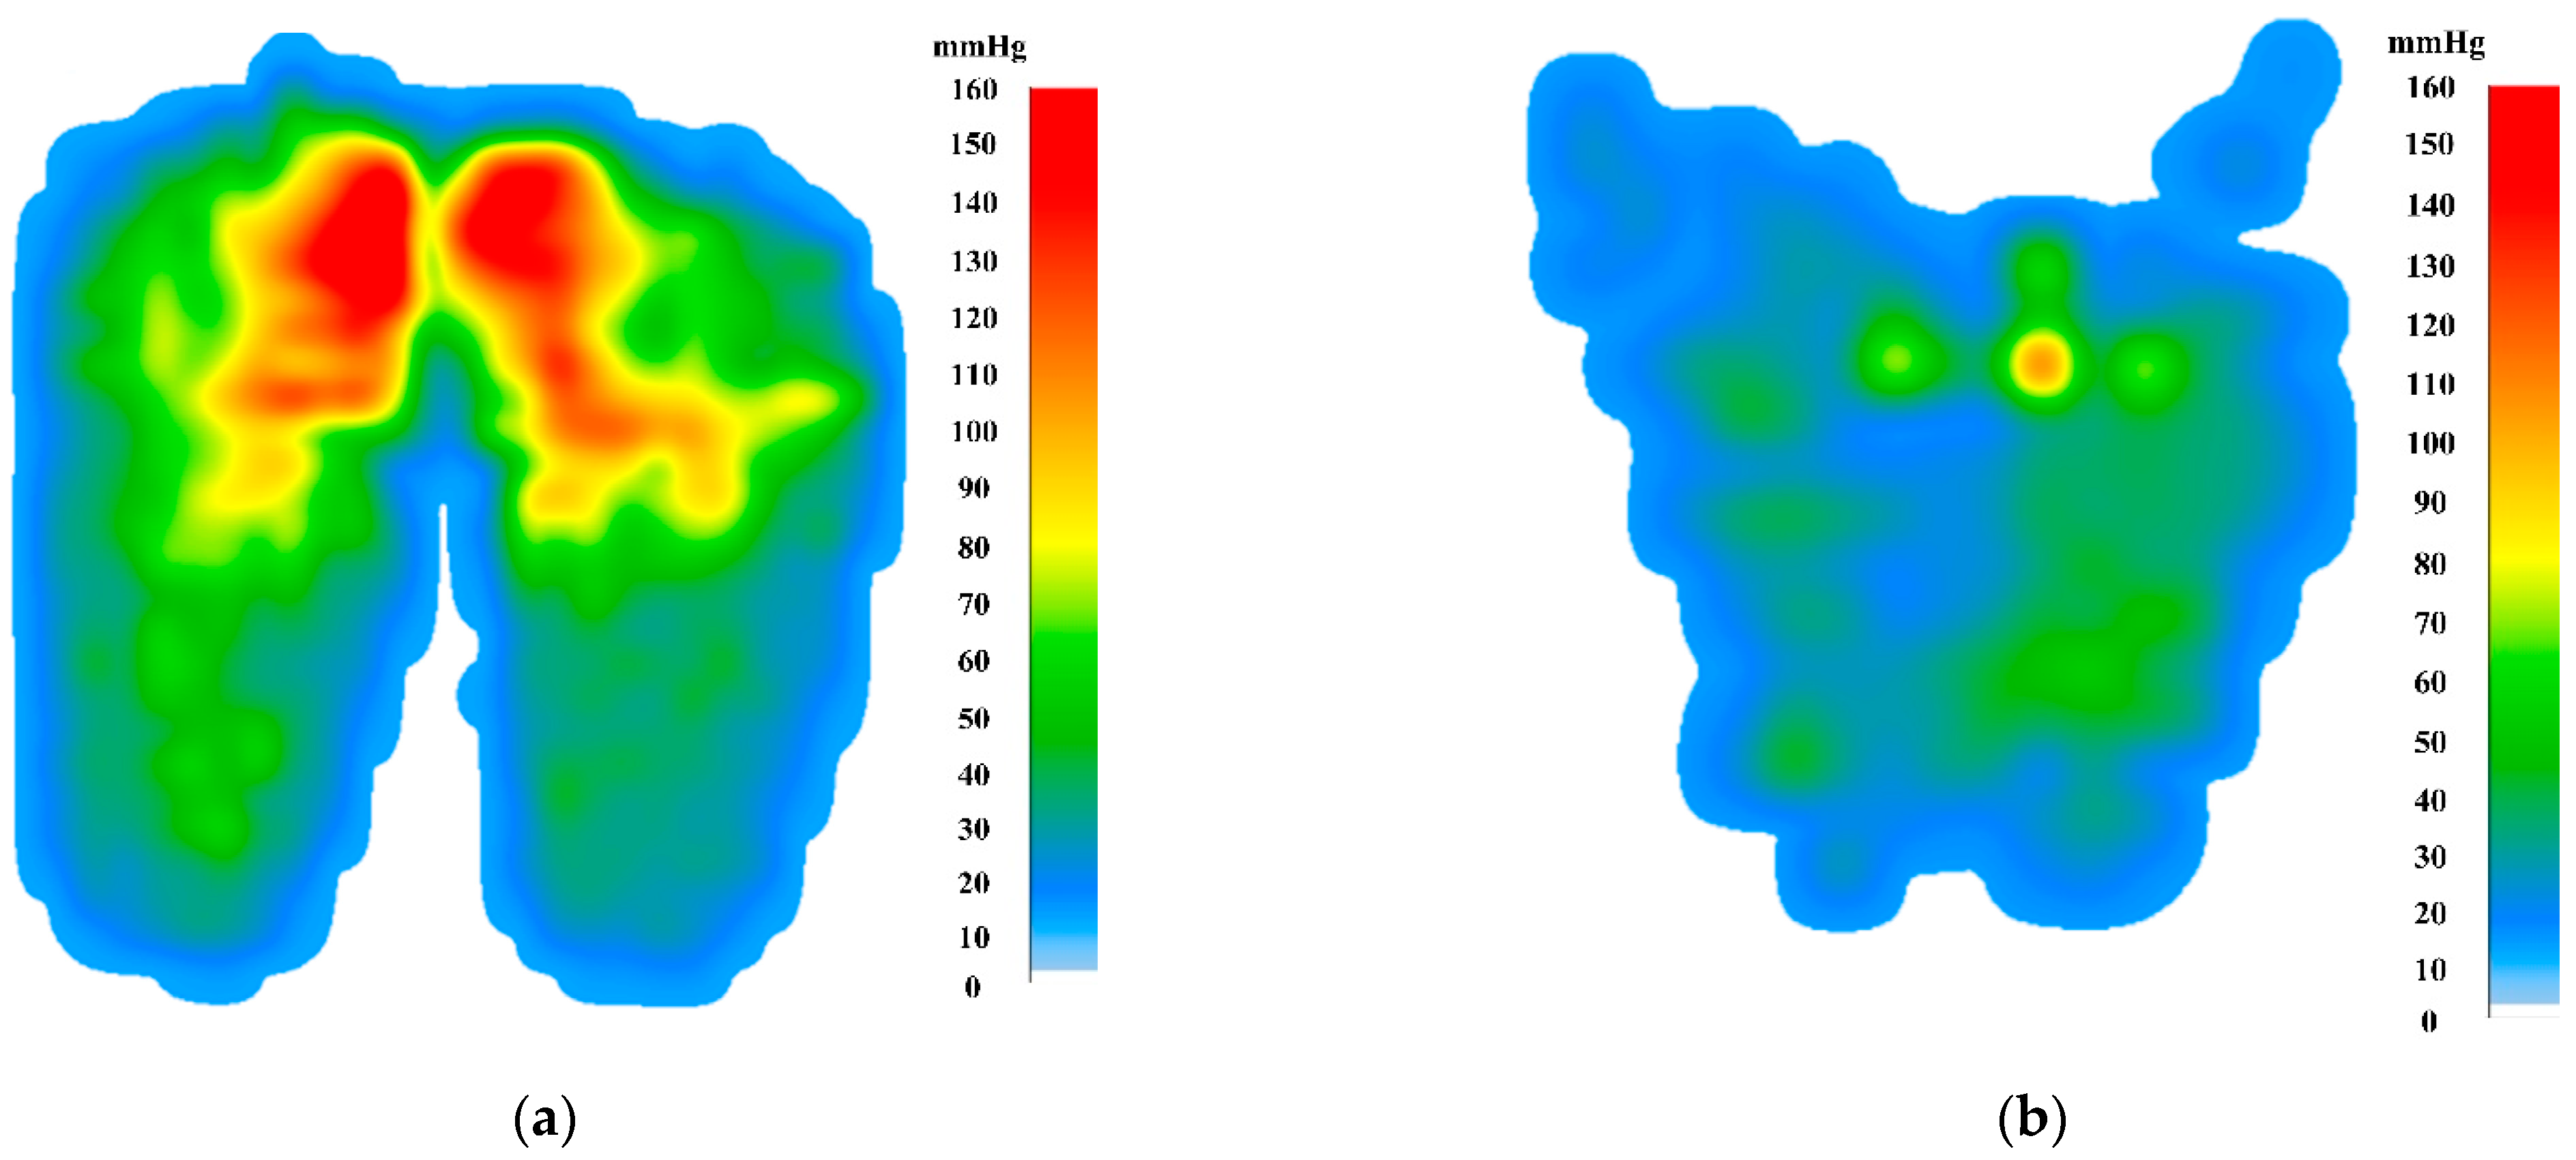
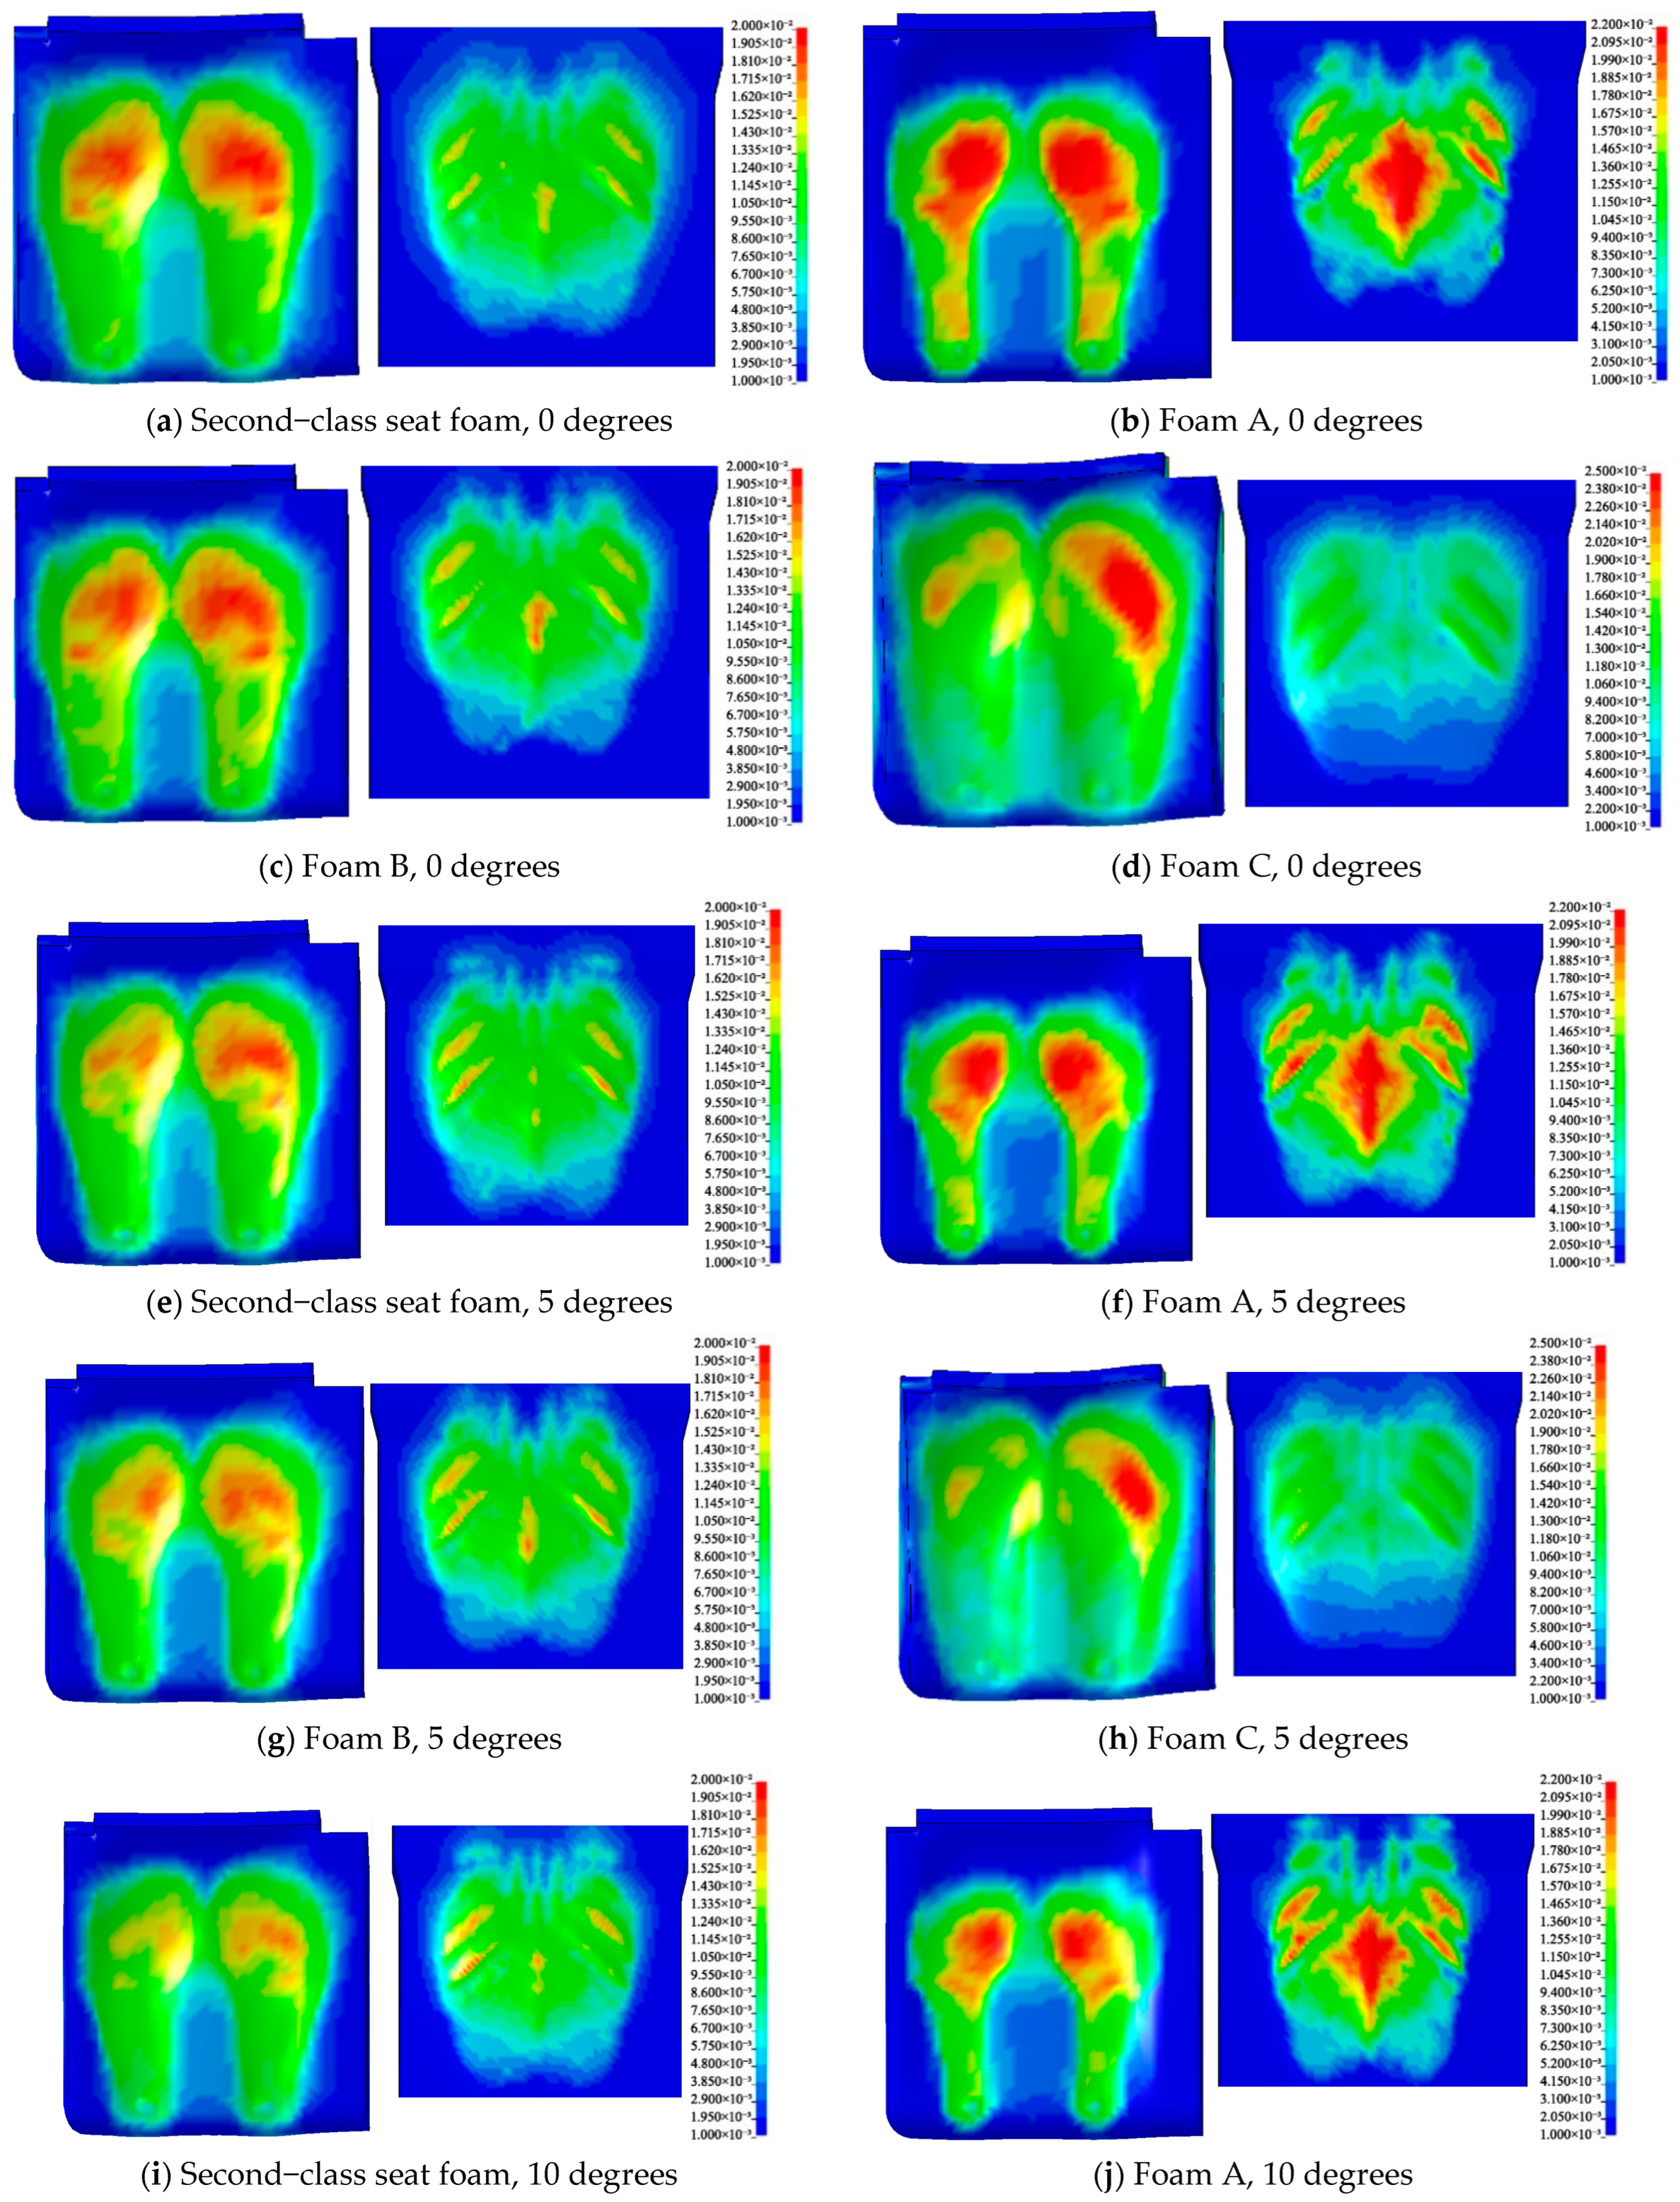
3.4. Effects of Seat Foam and Angle on Interface Pressure

According to the parameter combinations in Table 2, the calculation results of the seat-human FE model when the seat angle is 0 degrees are shown in Figure 10a–d and Figure 11a–d. When sitting upright, a reduction in polyurethane foam stiffness typically results in a reduction in the symmetry of the lower limbs’ pressure distribution. In the calculation result of Foam C, the stress is concentrated toward the left hip region and causes the highest peak of the seat cushion pressure curve. This may be since the rigid constraint surface at the bottom of the cushion is asymmetrical. When the foam stiffness is sufficient, the interface pressure distribution is mainly affected by the surface shape of the seat cushion and the defects in thickness are not significant. Generally, higher foam stiffness means less cushion deformation and a higher symmetry of interface pressure distribution. Therefore, if a softer foam is required for comfort optimization, the thickness of that cushion should be appropriately increased and it is necessary to provide a symmetrical bottom support surface. On the other hand, the backrest frame has better symmetry on the left and right and its interface pressure shows less pressure and a larger contact area as the foam becomes softer.
Figure 10e–l shows the calculation results of the seat-human model when the seat inclination is 5 degrees and 10 degrees. The finite element models using different foam materials show similar changes in the interface pressure distributions as the inclination increases, which can be described as: the back contact area increases and the non–zero part of its pressure matrix becomes slenderer, and the pressure in each area of the lower limbs decreases significantly. Using Foam A as an example, Figure 12a–d shows the effect of seat inclination on the pressure curve. The lateral and longitudinal pressure curves of the lower limbs decrease uniformly with a proportional increase in second–class seat angle. In this case, the passenger’s center of gravity is shifted backward and part of the interface pressure is transferred from the seat cushion to the backrest. However, no significant changes occurred at the peak of the backrest pressure curve, which means there are less pressure changes in the longitudinal line where the spine is located.

3.5. Effects of Seat Foam and Angle on Features and Comfort Ratings

According to the pressure distribution matrices of each case in Table 2, the peak pressure, mean pressure, and contact area of the seat cushion and backrest were calculated and shown in Figure 13. As the inclination angle increases, the pressure features in the calculated results of these four polyurethane foams show similar characteristics, which is consistent with the conclusion obtained by observing the pressure curve. The pressure on the lower limbs is gradually transferred to the back in this process.
Finally, the comfort rating for each simulation result is calculated by the evaluation model established in Section 2.2 (Figure 13d). It can be considered that the increase in seat inclination within 10 degrees has a positive contribution to the improvement of comfort. This is because in the regression equation, the static features related to lower limbs have a negative contribution to comfort, and their standardized regression coefficients have larger absolute values. Moreover, no back–related features are considered in the equation. Therefore, a transfer of pressure to the back is usually accompanied by an increase in the overall comfort. In addition, the peak pressure ratio of back (F13) is positively correlated with comfort, which means that passengers are not sensitive to back pressure when their riding time is short. In this case, foam A with the greatest stiffness produces a higher level of comfort. Seats with foam C have severe asymmetry pressure due to its stiffness and therefore they have the lowest comfort rating. In summary, when sitting upright, seats with foam B and an inclination angle of 10 degree achieve the best optimization result, which can improve comfort rating by 6.5 in a −50 to 50 scale.

4. Conclusions

This study focuses on optimizing the comfort of high–speed railways’ second–class seats by selecting the best set of seat design parameters that provide the highest comfort rating based on CAE technology. Firstly, the original interface pressure distribution matrix and comfort rating were obtained during the field sitting test and 21 pressure features were extracted for comfort assessment. The final comfort evaluation model is represented as a linear combination of six of these features with an adjusted R2 of 0.684. Then, the THUMS and MAT_57 were used to define the human body and seat foam, respectively, of the FE model. Quasi–static tests and genetic algorithms were performed in this process to obtain the required keywords. Finally, based on the seat-human FE model and comfort evaluation method, this work analyzed the effects of 12 sets of seat design parameters, which are freely combined from four foam types and three seat angles, on interface pressure distribution and comfort ratings. The results show that polyurethane foams with lower stiffness are not suitable for current second–class seat frames in terms of improving comfort unless their symmetry is optimized. Moreover, an appropriate increase in foam stiffness does not result in a reduction in sitting comfort. The interface pressure distribution on the seat cushion and backrest become more reasonable as the seat inclination angle increases within 10 degrees and the highest comfort rating with 6.5 improvement in a −50 to 50 scale occurs when foam B and 10–degree inclination are applied to the seat-human model. The above finds provide a novel method for evaluating and optimizing the riding comfort of high–speed railways from the perspective of seats.

Author Contributions

Conceptualization, S.H. and D.S.; methodology, D.S.; software, J.Z.; validation, L.Z.; formal analysis, D.S.; investigation, S.H.; resources, S.H.; writing—original draft preparation, D.S. and J.Z.; writing—review and editing, S.H. and D.S.; supervision, L.Z. and Z.W. All authors have read and agreed to the published version of the manuscript.

Funding

This research was funded by Natural Science Foundation of Hunan, grant number 2020JJ7030.

Institutional Review Board Statement

The study was conducted in accordance with the American Psychological Association Code of Ethics, and the protocol was approved by Xiangya No.2 Hospital of Central South University Institutional Review Board 2022–326.

Informed Consent Statement

Informed consent was obtained from all subjects involved in the study. Written informed consent has been obtained from the patients to publish this paper.

Data Availability Statement

Not applicable.

Conflicts of Interest

The authors declare no conflict of interest.

References

  1. Peng, Y.; Zhou, J.; Fan, C.; Wu, Z.; Zhou, W.; Sun, D.; Lin, Y.; Xu, D.; Xu, Q. A review of passenger ride comfort in railway: Assessment and improvement method. Transp. Saf. Environ. 2022, 4, tdac016. [Google Scholar] [CrossRef]
  2. Cooley, D.; Pedersen, S. A pilot study of increasing nonpurposeful movement breaks at work as a means of reducing prolonged sitting. J. Environ. Public Health 2013, 2013. [Google Scholar] [CrossRef] [PubMed]
  3. Guo, J.Q.; Ge, J.M.; Sun, Z.J.; Liu, S.Q.; Zhao, Y.J.; Lin, J.S. Pantograph Area Noise and Vibration Transmission Characteristics and Interior Noise Reduction Method of High–Speed Trains. Notes Numer. Fluid Mech. Multidiscip. Des. 2015, 126, 563–570. [Google Scholar]
  4. Peng, Y.; Fan, C.; Hu, L.; Peng, S.; Xie, P.; Wu, F.; Yi, S. Tunnel driving occupational environment and hearing loss in train drivers in China. Occup. Environ. Med. 2019, 76, 97–104. [Google Scholar] [CrossRef] [PubMed]
  5. Peng, Y.; Wu, Z.; Fan, C.; Zhou, J.; Yi, S.; Peng, Y.; Gao, K. Assessment of passenger long–term vibration discomfort: A field study in high–speed train environments. Ergonomics 2022, 65, 659–671. [Google Scholar] [CrossRef]
  6. Wang, L.; Fan, H.; Chu, J.; Chen, D.; Yu, S. Effect of Personal Space Invasion on Passenger Comfort and Comfort Design of an Aircraft Cabin. Hindawi Ltd. 2021. [Google Scholar] [CrossRef]
  7. Peng, Y.; Lin, Y.; Fan, C.; Xu, Q.; Xu, D.; Yi, S.; Zhang, H.; Wang, K. Passenger overall comfort in high–speed railway environments based on EEG: Assessment and degradation mechanism. Build. Environ. 2022, 210, 108711. [Google Scholar] [CrossRef]
  8. Fan, C.; Hu, J.; Huang, S.; Peng, Y.; Kwong, S. EEG–TNet: An End–To–End Brain Computer Interface Framework for Mental Workload Estimation. Front. Neurosci. 2022, 16, 869522. [Google Scholar] [CrossRef]
  9. Peng, B.; Yue, Y.; Huang, L. Analysis for the Impact of the Geometric Parameters of Train Seat on Riding Comfort Based on Human Body CAD Models. In Proceedings of the International Conference on Measuring Technology and Mechatronics Automation, Washington, DC, USA, 11–12 April 2009. [Google Scholar]
  10. Chen, X.; Xu, B.; Zhang, W. Optimization of seat comfort of high–speed train. J. Southwest Jiaotong Univ. 2009, 44, 906–911. [Google Scholar]
  11. Wang, W.; Rakheja, S.; Boileau, P. Relationship between measured apparent mass and seat–to–head transmissibility responses of seated occupants exposed to vertical vibration. J. Sound Vib. 2008, 314, 907–922. [Google Scholar] [CrossRef]
  12. Alawneh, O.; Zhong, X.; Faieghi, R.; Xi, F. Finite Element Methods for Modeling the Pressure Distribution in Human Body–Seat Interactions: A Systematic Review. Appl. Sci. 2022, 12, 6160. [Google Scholar] [CrossRef]
  13. Yin, W.; Ding, J.; Qiu, Y. Nonlinear Dynamic Modelling of a Suspension Seat for Predicting the Vertical Seat Transmissibility. Math. Probl. Eng. 2021, 2021, 3026108. [Google Scholar] [CrossRef]
  14. Wang, W.; Ji, J.; Yue, Z.; Zhang, D.; Tian, H.; Zhao, H. Research on secondary impact safety of train driver based on THUMS dummy. MATEC Web Conf. 2016, 81, 02016. [Google Scholar] [CrossRef] [Green Version]
  15. Wu, J.; Qiu, Y. Analysis of ride comfort of high–speed train based on a train–seat–human model in the vertical direction. Veh. Syst. Dyn. 2021, 59, 1867–1893. [Google Scholar] [CrossRef]
  16. Karlsson, D.; Osvalder, A.L. Towards better seating design—A discussion and comparison between office chairs and car seats. In Proceedings of the 39th Nordic Ergonomics Society Conference, Lysekil, Sweden, 1–3 October 2007. [Google Scholar]
  17. Ahmadian, M.; Seigler, T.M.; Clapper, D.; Sprouse, A. Alternative test methods for long term dynamic effects of vehicle seats. SAE Trans. 2002, 111, 684–692. [Google Scholar]
  18. Kim, S.-H.; Hwang, S.-H.; Lee, K.-N.; Pyun, J.-K.; Choi, H.Y.; Kim, K.M.; Sah, S.; Montmayeur, N. New Anthropometry of Human Body Models for Riding Comfort Simulation. In Proceedings of the Digital Human Modeling Conference, Beijing, China, 22–27 June 2007. [Google Scholar]
  19. Wang, F.; Wu, J.; Hu, L.; Yu, C.; Wang, B.; Huang, X.; Miller, K.; Wittek, A. Evaluation of the head protection effectiveness of cyclist helmets using full–scale computational biomechanics modelling of cycling accidents. J. Saf. Res. 2022, 80, 109–134. [Google Scholar] [CrossRef]
  20. Wang, W.; Zhou, H.; Zhan, J. Train driver protection under secondary impact. J. Cent. South Univ. 2019, 26, 905–915. [Google Scholar] [CrossRef]
  21. Paul, G.; Pendlebury, J.; Miller, J. The contribution of seat components to seat hardness and the interface between human occupant and a driver seat. Int. J. Hum. Factors Model. Simul. 2012, 3, 378–397. [Google Scholar] [CrossRef]
  22. Grujicic, M.; Pandurangan, B.; Arakere, G.; Bell, W.; He, T.; Xie, X. Seat–cushion and soft–tissue material modeling and a finite element investigation of the seating comfort for passenger–vehicle occupants. Mater. Des. 2009, 30, 4273–4285. [Google Scholar] [CrossRef]
  23. Amer, S.T.; Onyebueke, L. Experimental Validation of the Computer Aided Design Technique for Seat Comfort Design and Evaluation. In Proceedings of the SAE 2013 World Congress & Exhibition, Detroit, MI, USA, 16–18 April 2013. [Google Scholar]
  24. De Looze, M.P.; Kuijt-Evers, L.F.M.; Van Die, N.J. Sitting comfort and discomfort and the relationships with objective measures. Ergonomics 2003, 46, 985–997. [Google Scholar] [CrossRef]
  25. Hiemstra-van Mastrigt, S.; Groenesteijn, L.; Vink, P.; Kuijt-Evers, L.F. Predicting passenger seat comfort and discomfort on the basis of human, context and seat characteristics: A literature review. Ergonomics 2017, 60, 889–911. [Google Scholar] [CrossRef] [PubMed] [Green Version]
  26. Peng, Y.; Sun, D.; Fan, C.; Wu, Z.; Yi, S.; Peng, Y.; Liu, Y. Research on the comfort degradation mechanism of high–speed railway passengers: A field study using dynamic interface pressure. Transp. Saf. Environ. 2022, 4, tdac022. [Google Scholar] [CrossRef]
  27. Kamijo, K.; Tsujimura, H.; Obara, H.; Katsumata, M. Evaluation of seating comfort. SAE Trans. 1982, 2615–2620. [Google Scholar]
  28. Gyi, D.E.; Porter, J.M. Interface pressure and the prediction of car seat discomfort. Appl. Ergon. 1999, 30, 99–107. [Google Scholar] [CrossRef]
  29. Tan, X.; Lin, J.; Xu, K.; Chen, P.; Ma, L.; Lau, R.W. Mirror Detection with the Visual Chirality Cue. IEEE Trans. Pattern Anal. Mach. Intell. 2022, 1–13. [Google Scholar] [CrossRef] [PubMed]
  30. Fasulo, L.; Naddeo, A.; Cappetti, N. A study of classroom seat (dis) comfort: Relationships between body movements, center of pressure on the seat, and lower limbs’ sensations. Appl. Ergon. 2019, 74, 233–240. [Google Scholar] [CrossRef] [PubMed]
  31. Romano, E.; Pirozzi, M.; Ferri, M.; Calcante, A.; Oberti, R.; Vitale, E.; Rapisarda, V. The use of pressure mapping to assess the comfort of agricultural machinery seats. Int. J. Ind. Ergon. 2020, 77, 102835. [Google Scholar] [CrossRef]
  32. Kyung, G.; Nussbaum, M.A. Driver sitting comfort and discomfort (part II): Relationships with and prediction from interface pressure. Int. J. Ind. Ergon. 2008, 38, 526–538. [Google Scholar] [CrossRef]
  33. Mitsuya, R.; Kato, K.; Kou, N.; Nakamura, T.; Sugawara, K.; Dobashi, H.; Sugita, T.; Kawai, T. Analysis of body pressure distribution on car seats by using deep learning. Appl. Ergon. 2019, 75, 283–287. [Google Scholar] [CrossRef]
  34. ISO 3386–1; Document Information. Polymeric Materials, Cellular Flexible–Determination of Stress–Strain Characteristic in Compression–Part 1 Low–Density Materials. ISO International: Geneva, Switzerland, 1986.
  35. ASTM D 3574–03; Document Information. Standard Test Methods for Flexible Cellular Materials—Slab, Bonded, and Molded Urethane Foams. ASTM International: West Conshohocken, PA, USA, 2008.
  36. Chang, F.S.; Hallquist, J.O.; Lu, D.X.; Shahidi, B.K.; Kudelko, C.M.; Tekelly, J.P. Finite element analysis of low–density high–hysteresis foam materials and the application in the automotive industry. SAE Trans. 1994, 699–706. [Google Scholar]
  37. Pokkalla, D.K.; Wang, Z.; Teoh, J.C.; Poh, L.H.; Lim, C.T.; Quek, S.T. Soft Missing Rib Structures with Controllable Negative Poisson’s Ratios over Large Strains via Isogeometric Design Optimization. J. Eng. Mech. 2022, 148, 04022063. [Google Scholar] [CrossRef]
  38. Pokkalla, D.K.; Poh, L.H.; Quek, S.T. Isogeometric shape optimization of missing rib auxetics with prescribed negative Poisson’s ratio over large strains using genetic algorithm. Int. J. Mech. Sci. 2021, 193, 106169. [Google Scholar] [CrossRef]
  39. Peng, Y.; Li, J.; Tang, X.; Yang, W.; Chen, X.; Fan, C.; Wang, K. Molecular dynamics study on the tribological properties of phosphorene/polyethylene composites. Coatings 2019, 9, 342. [Google Scholar] [CrossRef] [Green Version]
  40. Liu, Y. Analysis and Optimization of Static Comfort for Driver Seat of a Certain Model. Master’s Thesis, Hunan University, Changsha, China, 23 May 2019. [Google Scholar]
  41. Li, J. Research on Seat Static Comfort Based on Body Pressure Distribution. Master’s Thesis, Hunan University, Changsha, China, 5 June 2017. [Google Scholar]
  42. Škrlec, A.; Klemenc, J.; Fajdiga, M. Parameter identification for a low–density–foam material model using numerical optimisation procedures. Eng. Comput. 2014, 31, 1532–1549. [Google Scholar] [CrossRef]
  43. Zemp, R.; Taylor, W.R.; Lorenzetti, S. Seat pan and backrest pressure distribution while sitting in office chairs. Appl. Ergon. 2016, 53, 1. [Google Scholar] [CrossRef] [PubMed]
  44. Nüesch, C.; Kreppke, J.-N.; Mündermann, A.; Donath, L. Effects of a dynamic chair on chair seat motion and trunk muscle activity during office tasks and task transitions. Int. J. Environ. Res. Public Health 2018, 15, 2723. [Google Scholar] [CrossRef] [PubMed]
Figure 1. Experiment equipment and subjective comfort scale: (a) the relative position of two sensor pads and participants; (b) visual analog scale and comfort level corresponding to different scores.
Sustainability 14 15185 g001
Figure 2. The division scheme of the pressure matrix. Regions 1 to 4 correspond to the lower limbs, back, buttocks, and thighs.
Sustainability 14 15185 g002
Figure 3. Material testing equipment and mechanical testing: (a) MTS electronic testing machine; (b) quasi–static compression test; (c) quasi–static tensile test.
Sustainability 14 15185 g003
Figure 4. Seat frame and seat-human model: (a) the skeleton of the second–class seats numbered D and F; (b) relative position of passenger, seat cushion, and backrest.
Sustainability 14 15185 g004
Figure 5. Mechanical properties of four polyurethane foams: (a) loading curves of quasi–static compression; (b) stress–strain curve of quasi–static tensile.
Sustainability 14 15185 g005
Figure 6. Stress–strain curves of three foam specimens in quasi–static test: (a) quasi–static compression characteristics; (b) quasi–static tensile properties.
Sustainability 14 15185 g006
Figure 7. The iteration results of GA: (a) the convergence history for GA–based parameter identification; (b) the unloading curve of the optimal individual in last iteration compared with the experimental results.
Sustainability 14 15185 g007
Figure 8. Comparison of experiment and simulation results: interface pressure measured in experiment of (a) lower limbs and (b) back; calculated von Mises equivalent stress (scale: MPa) of (c) seat cushion and (d) backrest.
Sustainability 14 15185 g008aSustainability 14 15185 g008b
Figure 9. Comparison of pressure curves in orthogonal directions between experiment and simulation results: (a) lateral and (b) longitudinal pressure curves of seat cushion; (c) lateral and (d) longitudinal pressure curves of backrest.
Sustainability 14 15185 g009aSustainability 14 15185 g009b
Figure 10. Interface pressure distributions (scale: MPa) calculated by seat-human model with seat recline at 0, 5, and 10 degrees.
Sustainability 14 15185 g010aSustainability 14 15185 g010b
Figure 11. Comparison of pressure curves of different foam type: (a) lateral and (b) longitudinal pressure curves of seat cushion, (c) lateral and (d) longitudinal pressure curves of backrest.
Sustainability 14 15185 g011
Figure 12. Comparison of pressure curves of foam A with different seat inclinations: (a) lateral and (b) longitudinal pressure curves of seat cushion, (c) lateral and (d) longitudinal pressure curves of backrest.
Sustainability 14 15185 g012
Figure 13. Comparison of pressure features and comfort while 12 different parameter combinations are used for simulation: the comparison of (a) peak pressure, (b) average pressure, (c) contact area, and (d) comfort ratings.
Sustainability 14 15185 g013aSustainability 14 15185 g013b
Table 1. Pressure features and groups.
GroupFeature NumberRegionDescription
Average peak pressureF1 to F4RO1 to RO4Average peak pressure of each region
Average mean pressureF5 to F8RO1 to RO4Average mean pressure of each region
Average contact areaF8 to F12RO1 to RO4Average contact area of each region
Average peak pressure ratioF13RO2F2/(F2 + F3 + F4)
F14RO3F3/(F2 + F3 + F4)
F15RO4F4/(F2 + F3 + F4)
Average mean pressure ratioF16RO2F6/(F6 + F7 + F8)
F17RO3F7/(F6 + F7 + F8)
F18RO4F8/(F6 + F7 + F8)
Average contact area ratioF19RO2F10/(F10 + F11 + F12)
F20RO3F11/(F10 + F11 + F12)
F21RO4F12/(F10 + F11 + F12)
Table 2. Orthogonal test combination.
Test NumberPolyurethane Foam TypeSeat Inclination
1Foam A
2Foam B
3Foam C
4Second–class seat foam
5Foam A
6Foam B
7Foam C
8Second–class seat foam
9Foam A10°
10Foam B10°
11Foam C10°
12Second–class seat foam10°
Table 3. Comfort evaluation regression model parameters.
Independent VariableUnstandardized
Regression
Coefficients
Standardized
Regression
Coefficients
t TestSignificanceVariance
Inflation Factor
Constant59.795 13.813<0.013.509
F4−0.187−0.491−9.515<0.012.101
F11−0.060−0.397−9.962<0.017.870
F3−0.069−0.617−7.988<0.012.671
F1322.3340.2244.990<0.0112.015
F50.1520.3083.231<0.014.876
F1820.2370.1232.0200.0443.509
Table 4. Comparison of peak pressure, mean pressure, and contact area between experiment and simulation.
RegionPressure FeaturesNumberExperimentSimulationRelative Error
Region 1
(seat cushion)
Peak pressure (mmHg)F1175.54150.2314.43%
Mean pressure (mmHg)F557.3165.2113.78%
Contact area (cm2)F91152.031242.907.89%
Region 2
(backrest)
Peak pressure (mmHg)F2132.45127.813.5%
Mean pressure (mmHg)F647.1453.6913.89%
Contact area (cm2)F10390.34434.3111.26%
Publisher’s Note: MDPI stays neutral with regard to jurisdictional claims in published maps and institutional affiliations.

