Article

Effects of Different Levels of Nitrogen Supply on Key Enzyme Activities of Nitrogen Metabolism and Growth Stimulation of Endive (Cichorium endivia L.)

Key Laboratory of Special Fruits and Vegetables Cultivation Physiology and Germplasm Resources Utilization of Xinjiang Production and Construction Corps, Department of Agricultural College of Shihezi University, Shihezi 832003, China
*
Author to whom correspondence should be addressed.
These authors contributed equally to this work.
Sustainability 2022, 14(22), 15159; https://doi.org/10.3390/su142215159
Submission received: 15 October 2022 / Revised: 9 November 2022 / Accepted: 10 November 2022 / Published: 16 November 2022
(This article belongs to the Topic Innovation and Solution for Sustainable Agriculture)

Abstract

:
In recent decades, people have blindly pursued increased yield; the excessive use of fertilizer not only causes the widespread waste of resources but also puts great pressure on environmental protection. In this study, to find out the optimum nitrogen application to endive crops under hydroponic conditions, this experiment was conducted to investigate the changes in nitrate reductase (NR), nitrite reductase (NiR), glutamine synthetase (GS), and glutamate dehydrogenase (GDH) activities under different nitrogen supply levels, and to fit the equations between nitrogen supply levels and aboveground dry matter accumulation, the aboveground nitrogen accumulation, and the yield of endive crops. The results showed that the activities of the key enzymes of nitrogen metabolism were higher at nitrogen supply concentrations of 8 and 11 mmol·L−1. The dry matter and nitrogen accumulation of endive at different nitrogen supply levels were analyzed with the logistic model; the theoretical yield was found to be the highest at 9.935~11.448 mmol·L−1 of nitrogen application in the two different fertility trials by function fitting.

1. Introduction

Endive (Cichorium endivia L.) is in the Compositae family and is also known as chicory, bitter chrysanthemum, mosaic lettuce, or Sonchus plant; it is an annual or biennial herb grown as a salad crop [1]. The conical root extends vertically with many fibrous roots and its young leaves are edible for human consumption, offering antibacterial, antipyretic, and anti-inflammatory benefits with high nutritional value [2,3]. Due to its good healthcare efficacy and high nutritional value, the current market demand is increasing day by day. Therefore, it is extremely important to prolong the market supply period and improve the output of endive plants.
Nitrogen is a colorless and odorless gas that cannot be directly used by organisms. It must be taken up by plants as fixed nitrogen, namely, nitrate, via bacteria [4]. Therefore, providing the right amount of nitrate nitrogen directly to the endive is more conducive to photosynthesis, thereby increasing the yield of the endive. However, in recent years, an excessive pursuit of crop yield has resulted in a large amount of fertilizer waste and will bring enormous pressure from “nitrogen pollution” on the soil and atmosphere [5]. Hence, the appropriate nitrogen application rate has a great effect on the future crop yield increase and the quality of the environment.
At present, studies on nitrogen management and nutrient accumulation model construction under hydroponic conditions are mostly focused on tomato [6], rice [7], bell pepper [8,9], and other crops, while studies on endive are rarely reported. In this study, the effects of different nitrogen supply levels on the changes in nitrogen metabolic enzymes in the leaves of endive were studied, and the dynamic changes of dry matter accumulation and nitrogen accumulation in the young stems of endive under hydroponic conditions were compared and analyzed, and the results under soilless cultivation conditions were clarified. The optimal nitrogen supply level of endive was verified, and the simulation model of dry matter accumulation and nitrogen accumulation, based on growth time, was established to achieve optimal nitrogen management, which laid a foundation for accurate nitrogen management and the good environmental maintenance of endive in the future.

2. Materials and Methods

2.1. Experimental Materials and Experimental Design

The “sorrel with fine leaves” cultivar developed by the Beijing Green East Agricultural Technology Research Institute (Beijing, China) was selected as the experimental material. The experiment was conducted in the solar greenhouse of the Experimental Station of the Agricultural College of Shihezi University (Shihezi, China).
The experiment used hydroponics. Seeds were soaked for 72 h for germination and then sown in 72-well seedling plug trays. Once they grew to three leaves and one core of endive, the seedlings were planted in a 50-L hydroponic tank (Dingsheng Plastic Industry, Guangdong, China) with a transplanting row spacing of 20 cm × 15 cm. The hydroponic tank is 200 cm × 30 cm × 15 cm (L × W × H) and is composed of PE semicircular pipe. The nutrient solution formula was based on the standard nutrient solution formula of leafy vegetables Class B, set by the South China Agricultural University (Guangzhou, China) (Table 1). Under the premise that the contents of other nutrient elements remained unchanged, five nitrogen concentration gradient treatments were established (Table 2), including N2 (2 mmol·L−1), N5 (5 mmol·L−1), N8 (8 mmol·L−1, which is the concentration used in the leafy vegetables class-B nutrient solution used by the South China Agricultural University), N11 (11 mmol·L−1), and N14 (14 mmol·L−1). The experiment adopted a randomized block design, and each treatment was repeated three times, with each replication containing 20 plants. After transplanting, the N8 (8 mmol·L−1) nutrient solution was used to initially slow the growth of seedlings and was then changed to a pre-configured nutrient solution with different nitrogen concentrations after one week. During the hydroponic period, the nutrient solution was supplied with oxygen throughout the day. The pH was adjusted every two days, and the nutrient solution was replaced six times during the growth period of endive in both experiments. The seedlings were sampled and measured on days 7, 14, 21, 28, and 35 after transplanting, and they were harvested on day 42.
Experiment 1: Germination was initiated on 4 May 2015, sown in a 72-hole seedling tray on 7 May, and the seedlings were transplanted on 10 June to a hydroponic tank when they grew to three leaves and one endive heart, then harvested on 21 July.
Experiment 2: Germination was initiated on 29 September; the seedlings were sown in nursery trays on 1 October. The seedlings were transplanted into hydroponic tanks on 29 October and were harvested on 13 December.

2.2. Determination of Related Indicators

2.2.1. Determination of the Key Enzyme Activities of Nitrogen Metabolism and Protein Content

The third to the fifth fully expanded leaves of the plant leaf stalk from the inside to the outside were sampled. After transplanting, samples were collected every other week, quick-frozen with liquid nitrogen, weighing 0.2 g per replication, and stored at −70 ℃ for nitrogen determination.
Enzyme activity: The test uses a double-antibody one-step sandwich method enzyme-linked immunosorbent assay kit (ELISA), provided by the Koitze Science Laboratory (Shanghai, China). Into the microwells, which are pre-coated with the nitrogen metabolizing enzyme antibody, the sample, the standard, and the HRP-labeled detection antibody were sequentially added, incubated, and thoroughly washed. Using the substrate TMB (3,3′,5,5′-Tetramethylbenzidine, stored at 4 °C away from light) to develop color, the TMB of NR, NiR, and GDH is converted into the blue color with the catalysis of peroxidase and is converted into the final yellow color under the action of acid; the color depth is positively correlated with the enzyme in the sample. The TMB of GS is converted into the blue color with the catalysis of glutamine synthase, and into the final yellow color with the action of acid. The shade of color is positively correlated with GS in the sample. Finally, the absorbance (OD value) was measured with a microplate reader (Thermo Scientific Multiskan FC, USA) at a wavelength of 450 nm, and the sample activity was calculated.

2.2.2. Determination of Dry Matter and Nitrogen Accumulation in the Shoots of Plants

In Experiment 1, endive plants were selected for broken ring sampling after each week of growth, and two plants were taken from each replicate. The fresh weight was weighed and heated at 105 °C for 30 min, dried at 75 °C until a constant weight was weighed, then the nitrogen mass fraction was determined according to the method used by Kjeldahl [10]:
Dry matter accumulation per unit area (g·m−2) = average dry weight per plant (g·plant−1) × the number of the plant·m−2;
Total protein per unit area (g·m−2) = dry matter accumulation(g·m−2) × the nitrogen mass fraction (%) × 6.25 (the conversion coefficient between protein and nitrogen in the plant dry sample).

2.3. The Model Construction Method of Dry Matter and the Nitrogen Accumulation of Endive

In this study, the logistic model [11] was used to fit the growth characteristics of the accumulation of dry matter and nitrogen in the aboveground parts of the endive with the growth days after transplanting. The calculation formula is as follows:
D M T = D M M 1 + a e b T
where DMT is the function of the accumulation of dry matter or nitrogen in the aboveground part of the endive, with the growth time after transplanting (kg·hm−2). DMM represents the theoretical maximum of the accumulation of dry matter or nitrogen in the aboveground parts of the endive (kg·hm−2). T is the growth time after the transplanting of the endive (d).
Calculating the first, second, and third derivatives in Formula (1) provides the cumulative growth time (T1) at the fastest start date, the growth time at the end (T2), the maximum growth rate (Vm), and the growth time (Tm), when it appears, of the corresponding growth curve:
The   start   time   of   the   fastest   accumulation :   T 1 = 1 b ln 2 + 3 a
The   end   time   of   fastest   accumulation :   T 2 = 1 b ln 2 3 a
The   appearing   time   of   maximum   growth   rate :   T m = 1 b ln a
The   maximum   growth   rate :   V m = b D M M 4 .

2.4. Acquisition of Environmental Data

A Li1400 small weather station (LICOR, Lincoln, NE, USA) was used to measure the air temperature, air humidity, solar irradiance, and other related environmental factors. The data was measured every 30 s, and the average value was recorded every 30 min. The monthly average maximum temperature was the average of the daily maximum temperature, and the average minimum temperature was the average of the daily minimum temperature. The range of the average relative air humidity was the range of variation of the average daily relative air humidity.

2.5. Statistical Analysis

Microsoft Excel 2003 (Redlands, CA, USA) was used for data processing. OriginPro 2022 (OriginLab, Northampton, MA, USA) was used for graphing, and a one-way ANOVA (Analysis of Variance) and correlation analysis were performed on the data using SPSS 20.0 software, while the significance of differences between treatments was analyzed using Duncan’s method. Curve Expert 1.4 (Hyams, Central, SC, USA) was used to fit the data.

3. Results

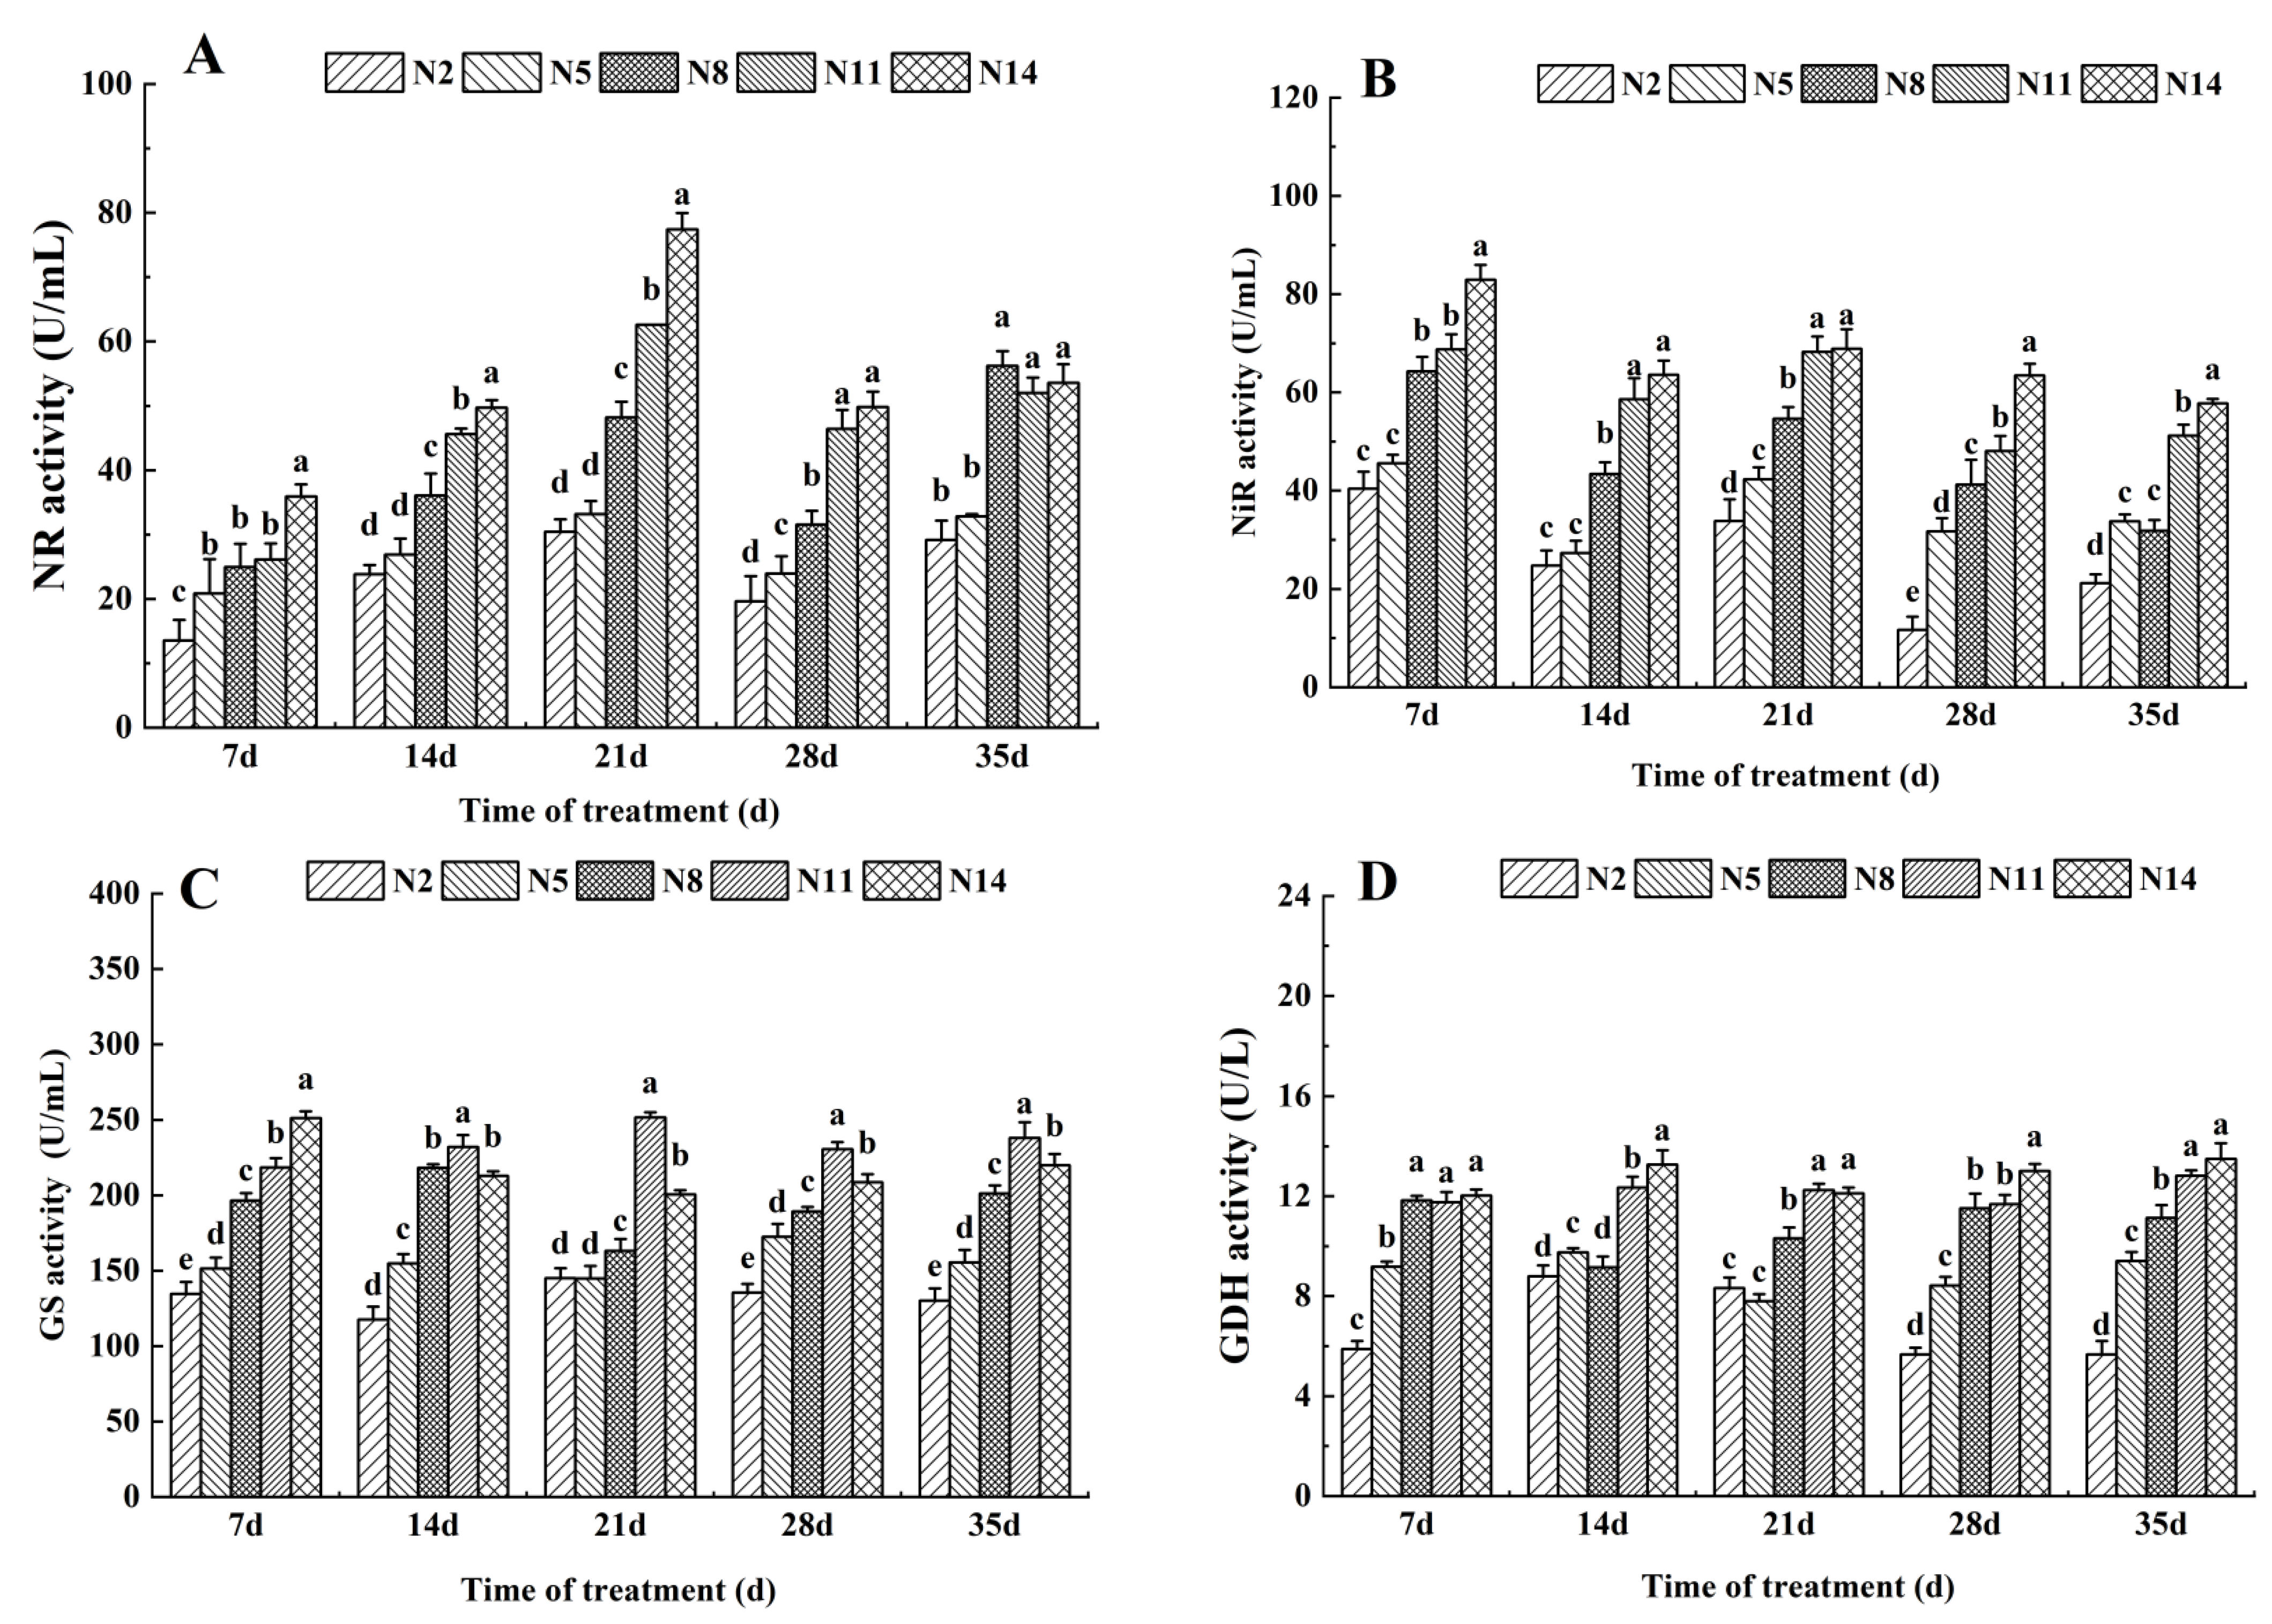
3.1. Effects of Nitrogen Levels on the Activities of Key Enzymes in Nitrogen Metabolism of Endive Leaves

The nitrate reductase activity of endive leaves showed a bimodal curve during the whole treatment process and peaked at 21 d and 35 d. With the increase in nitrogen supply, the NR activity of endive leaves in different treatments increased significantly at each growth stage (p < 0.05). The increased effect of high nitrogen treatment up to 21 d was the most obvious change; the N14 treatment was 154.23% higher than the N2 treatment (Figure 1A). During the whole growth period of the endive, the NiR activity showed a decreasing trend. The NiR activity varied between different nitrogen treatments during the same growth period, and the activity increased with the nitrogen level significantly at 28 d, with 445.43%, 100.21%, 53.85%, and 32.05% higher for the N14 treatment than N2, N5, N8, and N11, respectively (Figure 1B). In the same growth period, when the nitrogen supply was within a certain range, the GS activity of endive leaves increased with the increase in nitrogen fertilizer, but when the nitrogen fertilizer supply was too high (N14), the GS activity of leaves was significantly increased, except for the 7th day of nitrogen treatment. Compared with N2, N5, N8, and N14, the activity of N11 increased by 85.64%, 45.94%, 32.85%, and 25.41%, respectively (Figure 1C). Under different nitrogen treatments, the GDH activity of endive leaves was quite different, and its overall activity showed a trend of increasing with the increase in nitrogen supply (Figure 1D).

3.2. Effect of Nitrogen Level on the Crude and Total Protein of Endive Plant

As shown in Table 3, the dry matter production of the shoots of endive during each growth period increased with the increase in the level of nitrogen supplied. However, when the level of nitrogen supplied was too high, there was a downward trend. There was a significant difference between the treatments. The dry matter accumulation per unit area of the plant under treatment with nitrogen was the highest. The nitrogen content of the plant overall showed an increase with the increase in nitrogen supply. In some growth periods, such as days 14, 21, 28, and 35, the difference between the N2 and N5 treatments was not significant, on days 7, 21, 28, and 35, there was also no significant difference between the N11 and N14 treatments. In addition, the total accumulation of plant protein per unit area of the aboveground parts of the endive also showed the same changing trend as the dry matter production of the aboveground parts. Within a certain range of nitrogen supply, the total amount of plant protein in each growth stage increased with the increase in nitrogen supply. However, when the level of nitrogen supplied was too high, it decreased, indicating that a proper supply of nitrogen can increase the accumulation of dry matter and the nitrogen mass fraction of the aboveground parts of endive, thereby increasing the total accumulation of plant aboveground protein and improving the quality and nutritional value. When the level of nitrogen supplied was too high, it affected the accumulation of dry matter and total protein by the plant and affected the quality and nutritional value. In this experiment, a regression analysis was performed on the level of nitrogen supplied (x, mmol·L−1) and the total amount of aboveground protein of endive per unit area (y, g·m−2); the two conformed to the quadratic equation y = −0.253x2 + 5.439x + 12.287 (R2 = 0.936). Thus, when the concentration of nitrogen supplied was 10.730 mmol·L−1, the total production of protein was the highest.

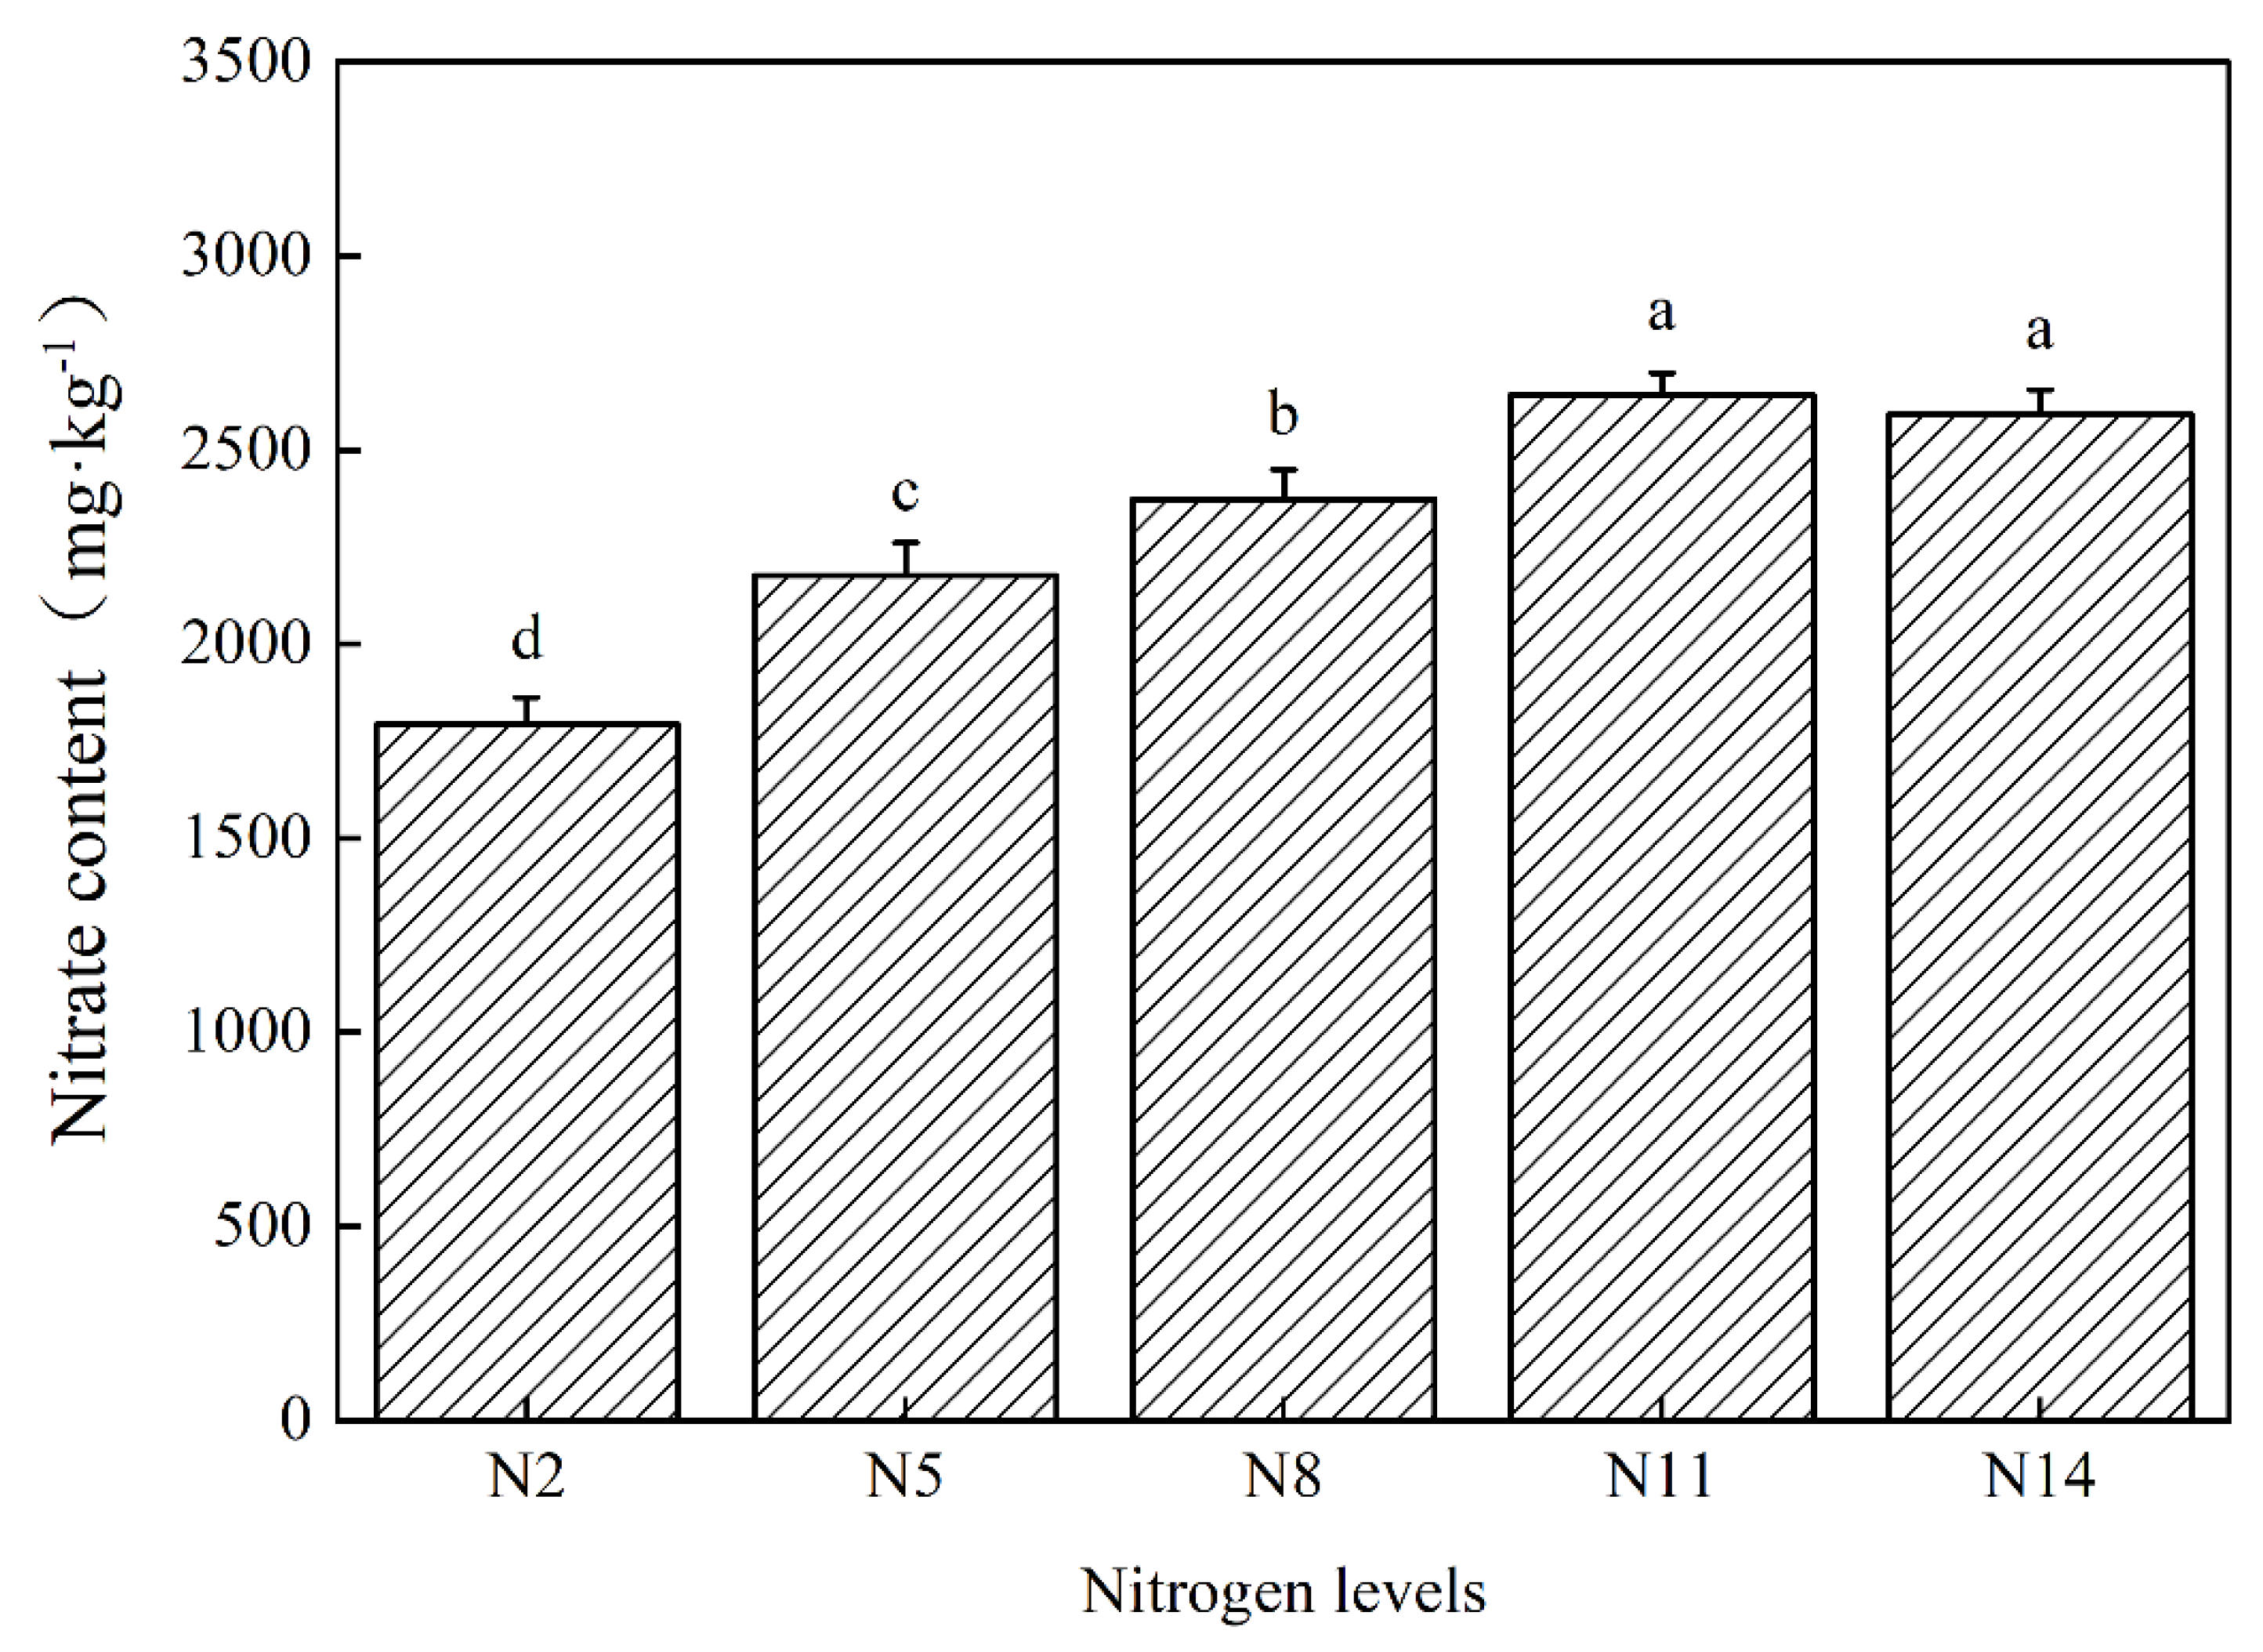
3.3. Effects of Nitrogen Levels on the Nitrate Content in the Leaves of Endive during Harvest

Figure 2 shows that the nitrate content of endive leaves differed significantly between treatments with different nitrogen levels. The nitrate content of the N2 treatment was the lowest, which was significantly lower than those of the other treatments. The N11 and N14 treatments were significantly higher than those of the N2, N5, and N8 treatments, but the difference between the N11 and N14 treatments was not significant. With the increase in nitrogen levels, the nitrate content gradually increased. This shows that increasing the level of nitrogen supplied increases the nitrate content in vegetables. The nitrate contents of endive leaves under the five different nitrogen treatments were all lower than the limit of nitrate content of leaf vegetables to meet the national standard (GB 19338) of <3000 mg·kg−1. The nitrate content of endive leaves treated with N11 and N14 was nitric acid. The salt content was the closest to the national standard limit.

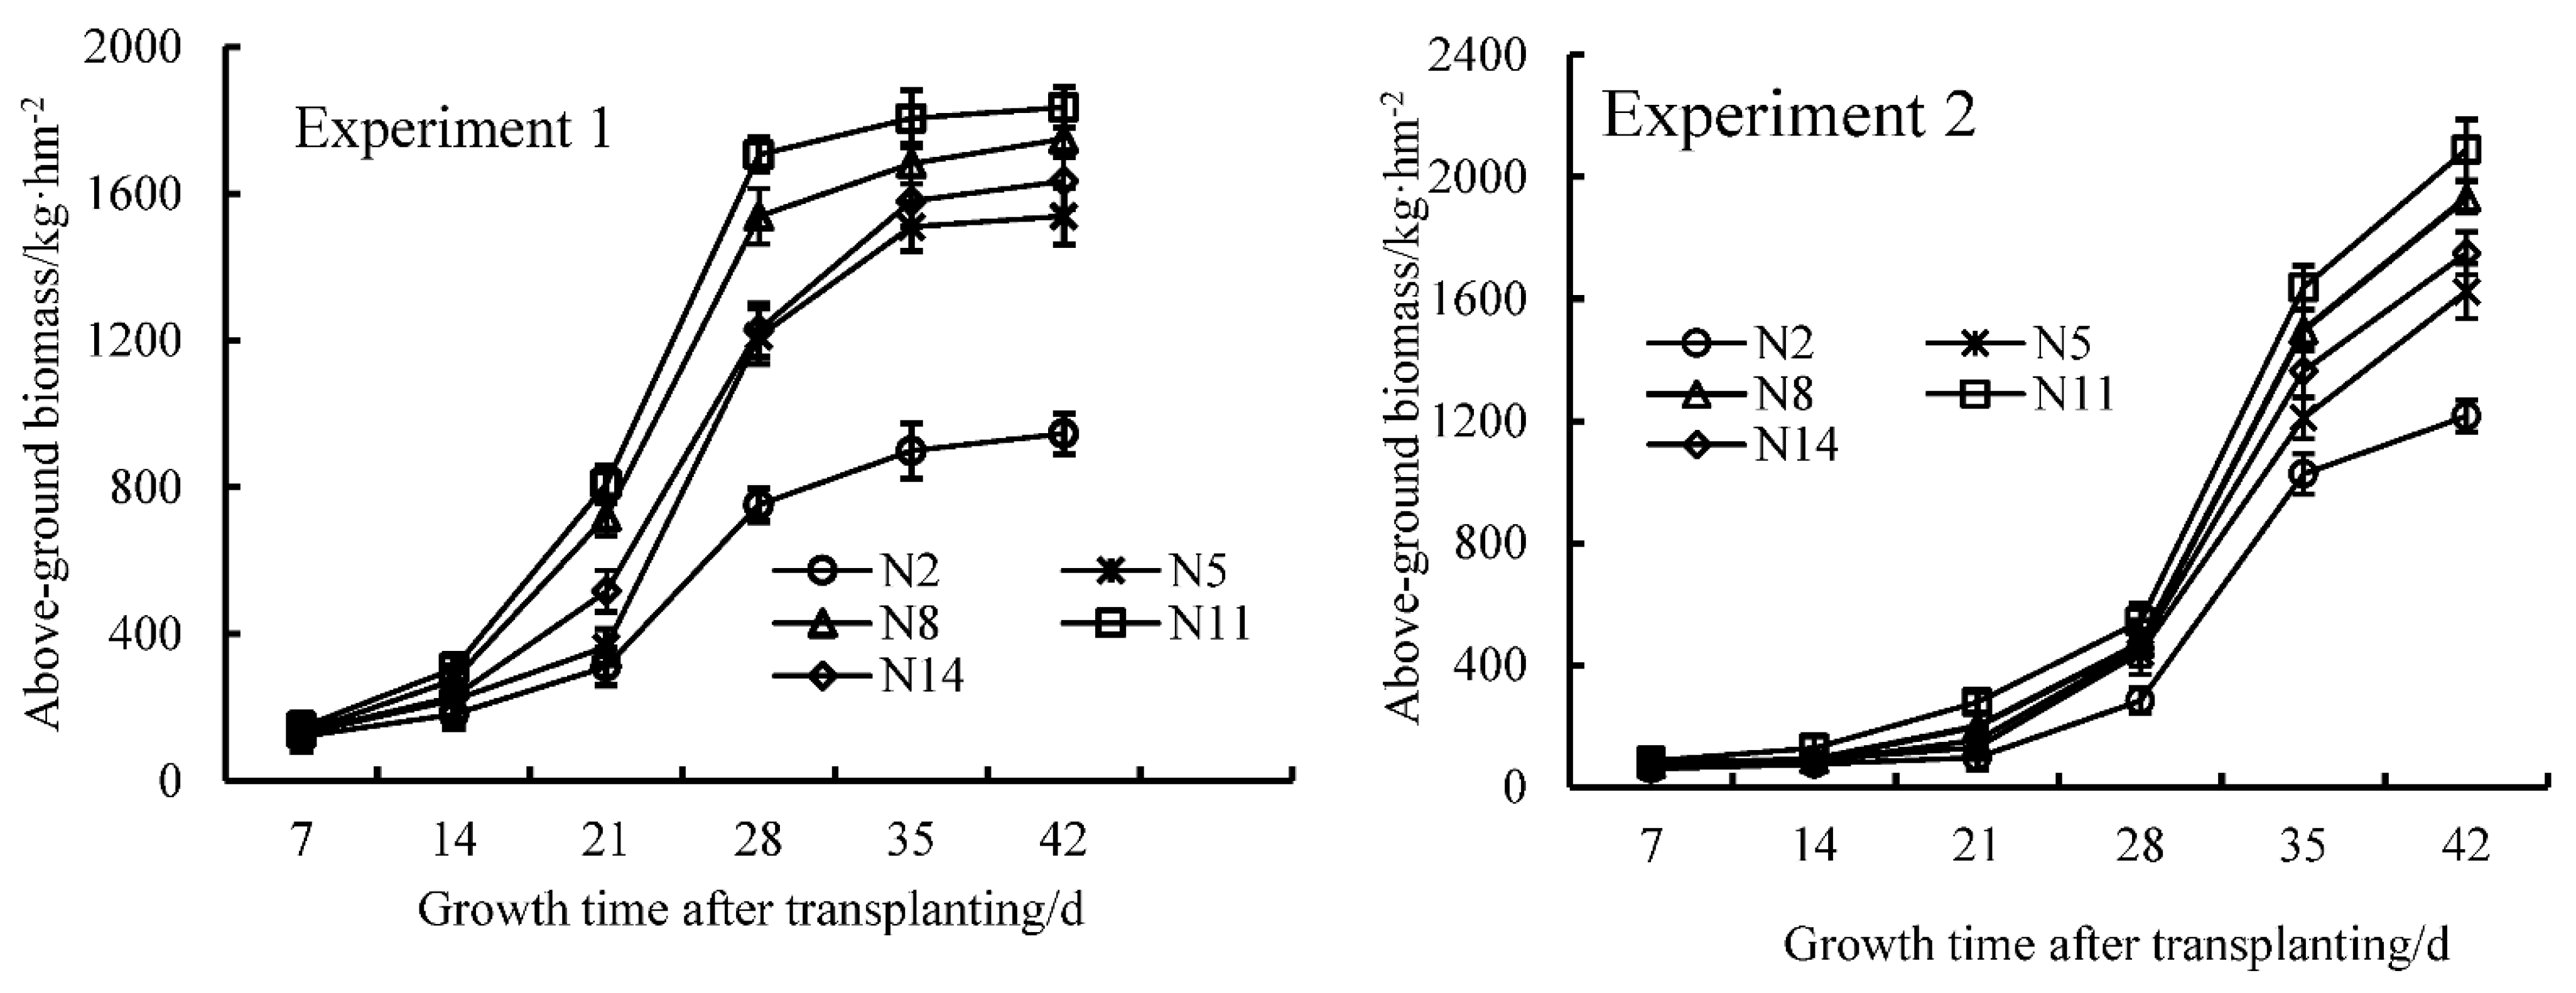
3.4. Effect of the Level of Nitrogen Supplied on Dry Matter Accumulation and the Dynamic Simulation of Endive

The supply of nitrogen has a significant effect on the dry matter accumulation of the aboveground parts of the endive; under different nitrogen supply conditions, the accumulation of dry matter in the aboveground parts of the endive first increased and then decreased (Table 4). The N11 (770 kg·hm−2) treatment had the highest accumulation of dry matter in the aboveground parts of the endive, which was 5.93–63.63% and 5.02–56.68% higher than the other treatments in the two experiments.
As shown in Figure 3, the growth dynamics of dry matter accumulation in the aboveground parts of the endive present a “slow-fast-slow” growth characteristic with the growth time, which conforms to the logistic curve model. Equation (2) can be used to fit the dry matter accumulation of the aboveground parts of the story to the growth time, T, which obtains the equation for the dry matter accumulation of the aboveground parts of the endive. The parameters of the equation were imported into Equations (2)–(5) to obtain the relevant characteristic value of the dynamic accumulation of dry matter.
As shown in Table 5, the theoretical maximum order of dry matter accumulation between the treatments was as follows: N11 > N8 > N14 > N5 > N2. Under different batches of experiments and different nitrogen treatments, the dry matter accumulation in the aboveground parts of the endive gradually increased with the increase in nitrogen treatment. The dry matter accumulation of the N11 treatment reached the maximum, while it decreased with N14. Through the two experiment iterations of each nitrogen treatment, the rapid growth period of the dry matter accumulation of endive (T1) started between 17.96–20.36 days and 23.59–25.32 days, respectively, and the rapid accumulation duration (T2T1) was between 5.44–11.02 days and 11.83–15.75 days, respectively. Experiment 1, treated with N11, started growth more quickly and earlier, and Experiment 2, treated with N11 and N8, also started early. Thus, there was no difference in T1 between the two. In Experiment 1, the time of occurrence (Tm) of the maximum rate of dry matter accumulation was the earliest in N11. In Experiment 2, N8 was the earliest. However, the difference between these treatments was not significant. In both experiments, the T1 of the N8 and N11 treatments was earlier, and the Vm was higher than that of the other treatments. Compared with nitrogen treatments that were too low or high, the correlation eigenvalue of the aboveground dry matter accumulation of endive plants was highly coordinated. Moreover, they had a positive effect on the aboveground dry matter accumulation of endive plants.

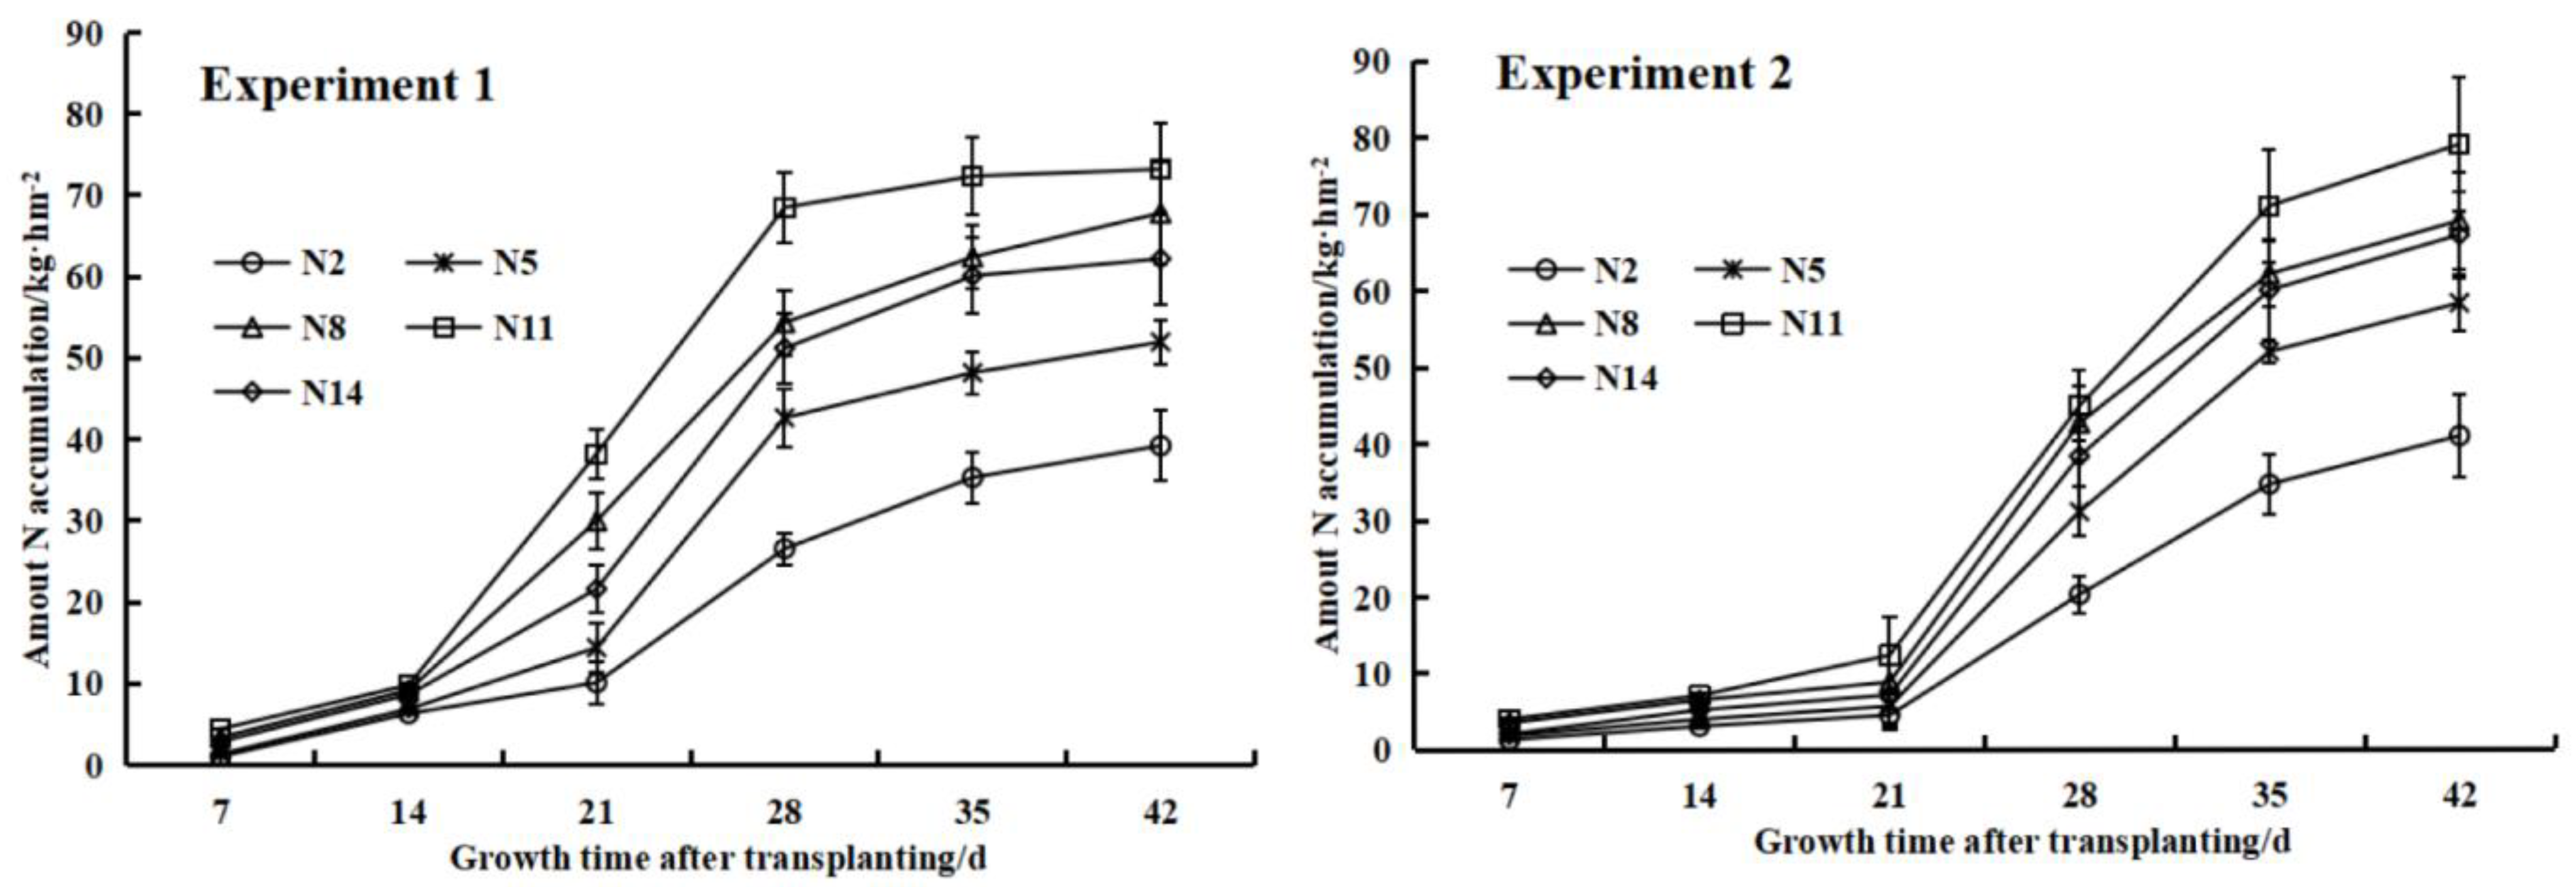
3.5. The Effect of Nitrogen Treatments on the Aboveground Nitrogen Accumulation of Endive and Its Dynamic Simulation

Different nitrogen treatments had significant effects on the nitrogen content of endive plants (p < 0.05) (Table 6). Appropriate nitrogen treatments can increase the nitrogen absorption and utilization of endive plants. With the increase in nitrogen treatments, the nitrogen content of the endive gradually increased. The aboveground nitrogen accumulation of endive was the highest when treated with N11 (770 kg·hm−2). The N11 treatment in the two experiments was 18.51–96.02% and 10.68–79.76% higher than the other treatments, respectively.
The dynamic change of the aboveground nitrogen accumulation of endive plants with growth time is consistent with the change in the aboveground dry matter accumulation of endive plants. Under different nitrogen treatment conditions, the aboveground nitrogen accumulation of endive plants all showed a trend of first increasing and then decreasing with the increase in nitrogen treatments (Figure 4). The aboveground dry matter accumulation of endive plants grew slowly in the early stage, rapidly in the middle stage, and more slowly in the later stage with the growth time, which conforms to the logistic curve model. Equation (1) was used to fit the aboveground nitrogen accumulation in the endive with the growth time T, which enabled us to obtain the equation for dynamic change of the aboveground nitrogen accumulation in the endive with the growth time. The equation parameters were brought into Equations (2)–(5), which enabled us to obtain the correlation eigenvalue of nitrogen accumulation in endive plants. As shown in Table 6, the theoretical maximum value of nitrogen accumulation in the endive plant in Experiment 1 had the same variation rule of the theoretical maximum value of dry matter accumulation, which was N11 > N8 > N14 > N5 > N2. Moreover, the theoretical maximum value of nitrogen accumulation in experiment 2 was N11 > N14 ≥ N8 > N5 > N2, in which the difference between N8 and N14 was not significant. The start time (T1) of the rapid accumulation of the aboveground nitrogen accumulation of endive plants in the two experiments was between 17.29–19.95 days and 22.87–25.32 days, respectively, which was 0.25–0.56 days and 0.3–0.77 days earlier than the start time of the rapid accumulation of dry matter, respectively.

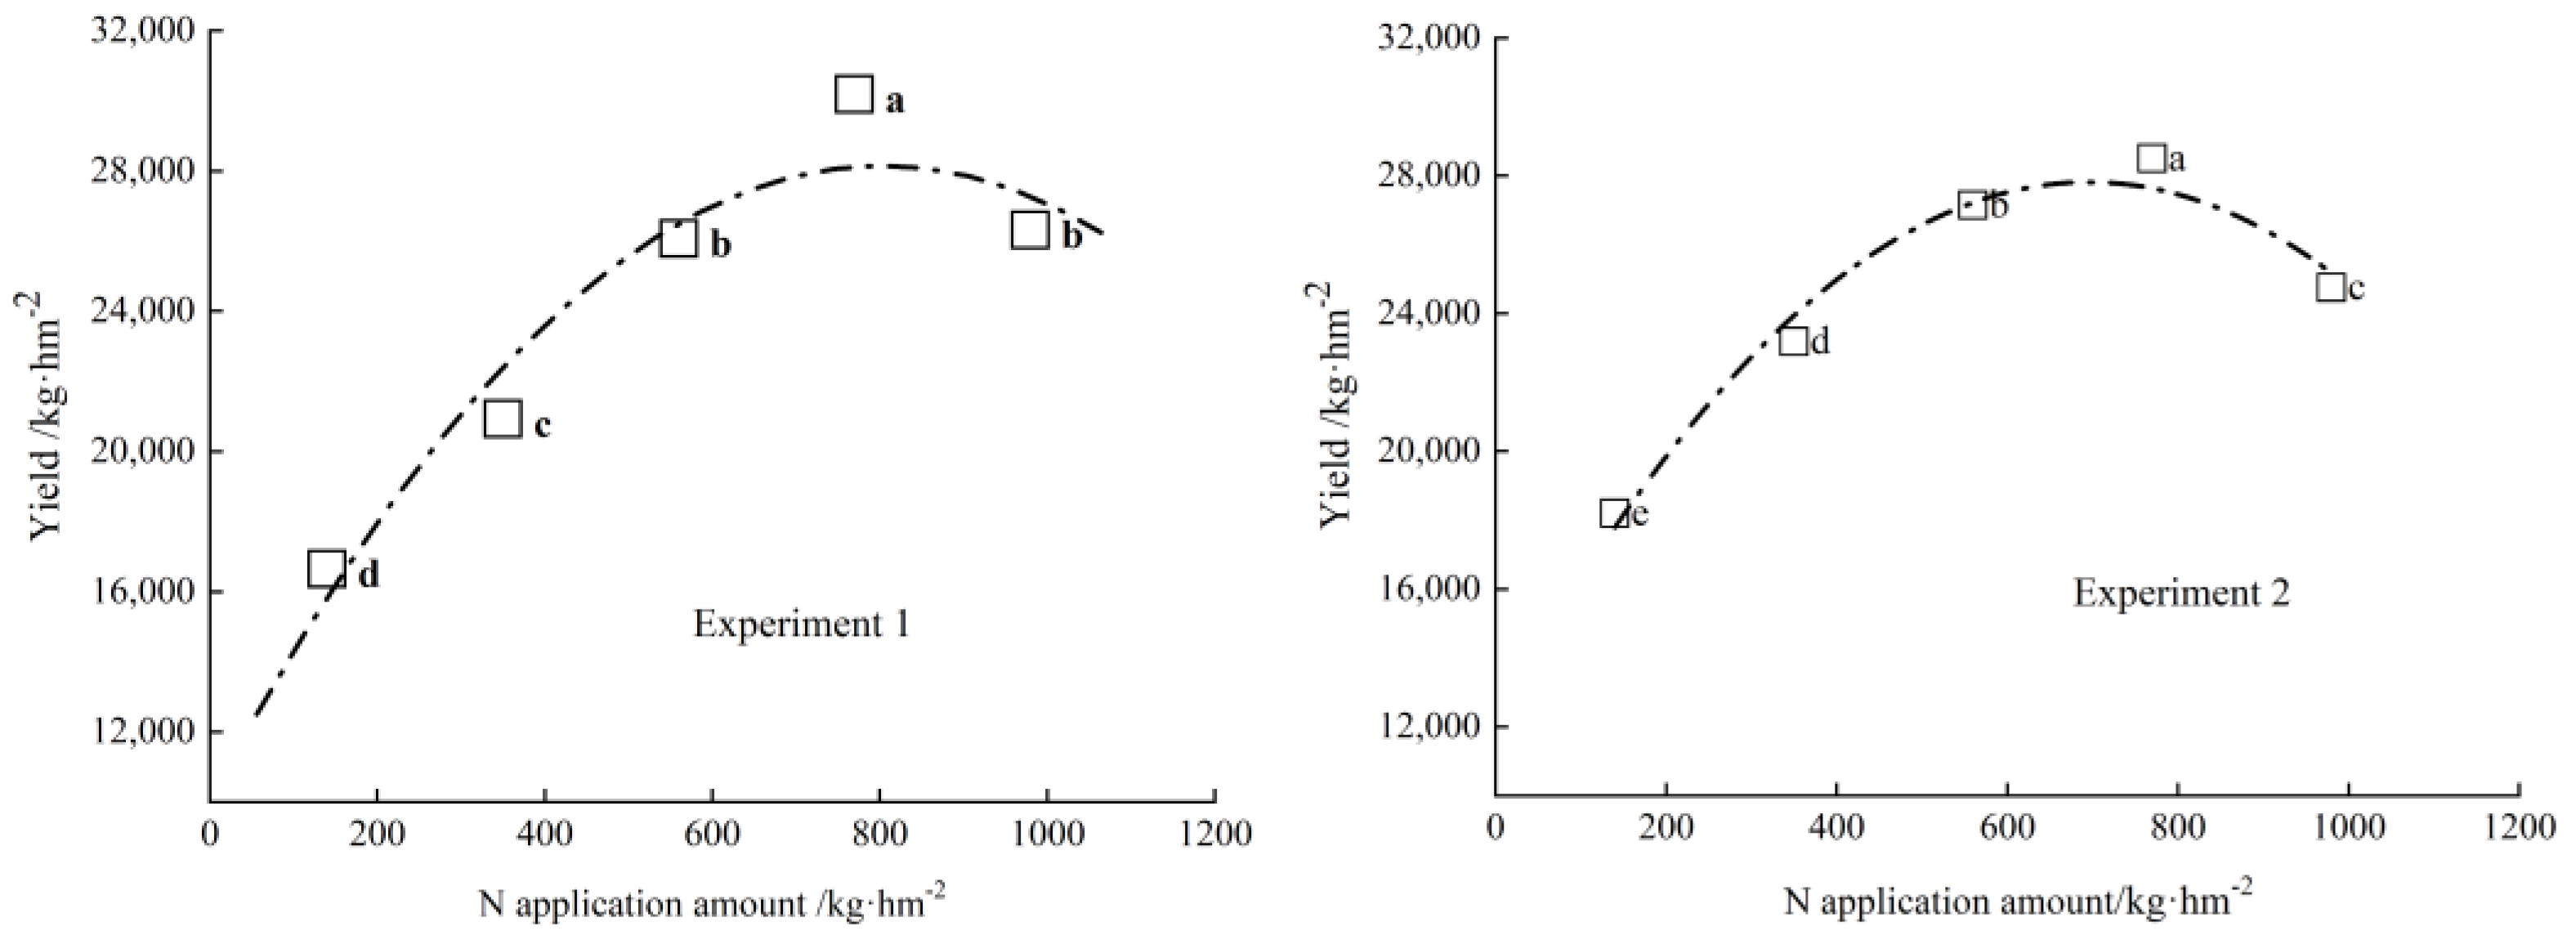
3.6. The Effect of Rates of Nitrogen Application on the Yield of Endive

As shown in Figure 5, different rates of nitrogen application have significant effects on the yield of endive (p < 0.05). With the increase in the rates of nitrogen applications, the yield of endive first increased and then decreased. In both experiments, the yield of endive treated with N11 was the highest, which was 30,183.15 kg·hm−2 and 28,508 kg·hm−2, respectively. Compared with the N14 treatment, the yield increased by 14.68% and 15.14%, respectively. This indicates that excessive rates of nitrogen application will adversely affect the yield of endive plants. Fitting the yield of endive (Y) and nitrogen treatment (x), the following two equations can be obtained:
Y1 = −0.0281x2 + 45.035x + 10079.97      R2 = 0.927
Y2 = −0.0325x2 + 45.205x + 12110.62      R2 = 0.974
According to the fitting equation, the optimal nitrogen application rates in the two experiments were 11.448 mmol·L−1 and 9.935 mmol·L−1, and the theoretical yields were 28,124.120 kg·hm−2 and 27,829.793 kg·hm−2, respectively.

4. Discussion

The nitrogen metabolism of plants is a complex process whereby a variety of enzymes participate in coordination [12], which includes nitrogen assimilation, accumulation, protein synthesis, etc. [13]. There are many enzymes closely related to the physiological process of nitrogen metabolisms, such as nitrate reductase, nitrite reductase, glutamine synthase, glutamate dehydrogenase, and other key enzymes. The strength of nitrogen metabolism is extremely important for plant growth and development. Nitrogen application can significantly affect the activities of plants, including nitrate reductase, nitrite reductase, glutamine synthase, glutamate dehydrogenase, protease, and RNA polymerase [14]. Nitrogen fertilization can promote the growth of plant roots, which directly affects the nitrogen absorption of plants, effectively promotes the accumulation and distribution of nitrogen to the “sink” [15], and significantly improves the accumulation and utilization of nitrogen in plants. Meanwhile, nitrogen is also an important component of amino acids [16].
Nitrate reductase (NR) is the first enzyme in plant nitrogen metabolism and is the rate-limiting enzyme in plant nitrogen assimilation [17]. The enzyme can affect nitrogen metabolism through nitrate; its activity reflects the nitrogen metabolism and protein synthesis ability of plants, to a certain extent [18], and is connected to the carbon metabolism process [19]. In this experiment, nitrogen supply significantly increased the activity of NR in the leaves of endive plants at each growth stage and reached the highest in the middle growth stage (at 21 d) (Figure 1A), which may be because the synthesis of nitrate reductase is affected by the substrate nitrate. Nitrate reductase is induced by nitrogen, while nitrate reductase activity is affected by factors such as substrate concentration, light, temperature, the presence of inorganic salts, and the pH of the nutrient solution [20]. When endive plants have grown for 21 days, the environment is better, and the plant is in a vigorous growth period. The nitrogen absorption and assimilation ability were strong at this point, and the nitrate content in endive leaves was relatively high, which further promoted the improvement of NR activity. With the increase in nitrogen supply level among the different treatments, the NR activity of the leaves was enhanced. When the nitrogen supply concentration was 11 mmol·L−1, the NR activity of endive leaves at each growth stage was the highest (Figure 1A), which indicated that a proper nitrogen supply could improve the growth of endive plants. The activity of nitrate reductase in the leaves ensures the absorption and utilization of nitrogen by plants. This experiment further confirmed the findings reported by Liu Xiaojing [21], Diao Zhiwei [22], Li Dongfang [23], and others.
Nitrite reductase (NiR) activity reflects the strength of plant nitrogen metabolism to a certain extent and plays an important role in plant nitrogen assimilation [24]. Nitrate nitrogen that is absorbed by plants is reduced to nitrite nitrogen via nitrate reductase (NR), which enters the chloroplast or plastid and is degraded into ammonia by nitrite reductase (NiR) [25]. Zhang Yingying etc. [26] researched water hyacinth blue and showed that the nitrite reductase (NiR) activity decreased with the increase in nitrogen concentration. In this experiment, the NiR activity of endive leaves increased with the increase in nitrogen supply level. Enhanced nitrogen supply significantly increased the nitrite reductase activity of endive leaves, which may be caused by the different characteristics of crops and different nitrogen requirements. Among the treatments with different nitrogen supply levels, the NiR activity of the leaves in the N14 treatment was the highest. With the extension of the growth time, the NiR activity in the leaves of each treatment decreased slightly, but the decrease was not obvious (Figure 1B).
Glutamine synthase (GS) is also one of the key enzymes in plant nitrogen metabolism [27]. It is the first enzyme of the “GS-GOGAT cycle”, that is, the initial assimilation of ammonia occurs in the GS-GOGAT cycle [28,29,30]. GS is closely related to the assimilation, absorption, and utilization of nitrogen by plants, which can improve the nitrogen use efficiency of plants, thereby affecting crop yield [31]. This experimental study showed that within the appropriate nitrogen application range, the GS activity of endive leaves increased with the increase in nitrogen application rate. On the 7th day, the GS activity of the N14 treatment was the highest, and the GS activity of the leaves treated with N11 was the highest for the rest of the time. In the middle and late stages of growth, with the further increase in nitrogen supply, the GS activity of leaves decreased (Figure 1B), which was consistent with the research results on winter wheat [32]. It shows that within the appropriate nitrogen supply level, plants can better absorb inorganic nitrogen in the transformed nutrient solution by adjusting the GS activity and also improving the nitrogen assimilation efficiency of plants. Excessive nitrogen supply may affect the GS activity of plants and may thus affect the plant’s nitrogen assimilation efficiency.
GDH can not only catalyze the synthesis of glutamate from NH4+ and α-ketoglutarate but also catalyze the oxidation of glutamate and the release of NH4+ [33]. Compared with the GS-GOGAT cycle, it represents another way for plants to assimilate ammonium [34]. When the external environment contains excessive inorganic nitrogen sources, GDH performs ammonium assimilation. When plants lack inorganic carbon sources, GDH can degrade glutamic acid to provide a carbon skeleton for the tricarboxylic acid (TCA) cycle [35]. When plants are deleteriously affected by ammonia, GDH can relieve or alleviate the toxicity of ammonia, to some extent [36]. The results of this experiment showed that the GDH activity of leaves of endive increased with the increase of nitrogen supply level on the whole, and the GDH activity of leaves under N2 treatment was the lowest. Except at 14d, the GDH activity of leaves under N14 treatment was lower than that under N11 treatment, and the GDH activity of leaves under N14 treatment was the highest at the rest time GDH had the highest activity. This shows that the proper supply of nitrogen could increase the GDH activity of endive leaves and increase the ammonia assimilation of the plant. When the nitrogen level supplied is the highest, the plant nitrogen content is the highest; however, the accumulation of plant nitrogen decreases, and the plant leaf GDH activity remains at a high level. It could be that crops maintain a high level of GDH to relieve or alleviate the toxicity of ammonium.
Within the range of an appropriate level of nitrogen supplied, increasing the nitrogen concentration can increase the activity of key enzymes in nitrogen metabolism and the nitrogen mass fraction of endive during each growth period and promote the accumulation of nitrogen in the plant [37]. When the level of nitrogen supplied in the nutrient solution is 11 mmol·L−1, the total protein accumulates to the highest level, and there is a linear regression relationship between the total protein accumulation and the level of nitrogen supplied (R2 = 0.978) (p < 0.01). The correlation analysis between the total accumulation of plant protein and the activities of key enzymes in nitrogen metabolism indicates that increasing the level of nitrogen in the liquid nutrient solution within an appropriate range has a positive effect on the accumulation of nitrogen in endive plants. It shows that an appropriate level of nitrogen being supplied can increase the dry matter quality and nitrogen content of the endive, thereby increasing the total protein and improving the edible quality of the endive. There was a significant positive correlation between the accumulation of nitrogen in the shoots of endive plants and the activities of NR, NiR, GS, and GDH under different nitrogen levels. This shows that increasing the level of nitrogen supplied in the nutrient solution can significantly increase the activity of key enzymes in nitrogen metabolism, enhance the nitrogen absorption and transformation ability of the endive plant, and have an important impact on the dry matter accumulation and nitrogen accumulation in the aboveground parts of the endive plant. This experimental study shows that when the concentration of nitrogen in the nutrient solution is 11 mmol·L−1, the key enzyme activities of nitrogen metabolism in the endive leaves are maintained at a high level, which has a positive effect on the nitrogen accumulation of the endive plant, i.e., the total protein content.
This study also shows that the dry matter and nitrogen accumulation of endive plants with the different levels of nitrogen supplied conforms to the logistic model. When the level of nitrogen in the nutrient solution was between 2 and 11 mmol·L−1, the dry matter accumulation, nitrogen accumulation, and yield of endive all increased with the increase in the level of nitrogen supplied. When the level of nitrogen supplied is 14 mmol·L−1, the indicators increase insignificantly or even decrease, indicating that the excessive supply of nitrogen is not conducive to the accumulation and growth of endive nitrogen. The function simulation indicates that when the level of nitrogen supplied ranges from 9.935 mmol·L−1 to 11.448 mmol·L−1, the yield of endive plants was the highest. The rapid growth period of nitrogen accumulation in this study was earlier than the rapid growth period of dry matter accumulation, which is similar to the results reported by Jing Bo et al. [38] regarding the processing of tomatoes (Solanum lycopersicum).
Previous studies have pointed out that a reasonable nitrogen management method has a positive impact on improving crop dry matter, nitrogen accumulation, and yield [39]. Different nitrogen sources had significant effects on the activities and expression concentrations of nitrogen-metabolizing enzymes and mineral elements in crop plants [40]. Mechanical potted seedling transplanting (PST) is an effective transplanting method. Deep nitrogen fertilizer application has the advantage of improving nitrogen use efficiency [41].
In summary, within the range of appropriate nitrogen concentrations, increasing the level of nitrogen in nutrient liquid can significantly increase the enzyme activity and soluble protein content of the key enzymes of NR, NiR, GS, and GDH in the nitrogen metabolism of endive leaves and can also increase plant nitrogen levels. The mass fraction and dry matter accumulation can increase the total protein and nitrogen accumulation of the plant, reduce the accumulation of nitrate in the leaves, and improve the edible quality of endive plants. When the nutrient liquid nitrogen concentration is 11 mmol·L−1, the promotion of activity is most obvious. The activities of key enzymes in the nitrogen metabolism of endive leaves are closely related to the nitrogen accumulation of plants. The equation fitting shows that the total protein production is the highest when the concentration of nitrogen supplied is 10.730 mmol·L−1. In actual production, the intensity of plant nitrogen metabolism can be strengthened by adjusting the nitrogen supply and increasing the plant nitrogen content and dry matter accumulation, thereby increasing the accumulation of plant nitrogen and realizing the high-yield and high-quality cultivation of crops. Simultaneously, the dry matter accumulation and nitrogen accumulation characteristics of the two batches of cultivated endive conformed to the logistic curve. An appropriate level of nitrogen supplied can promote the accumulation of dry matter and nitrogen by endive plants. Both batches were treated with N11 for the best growth, and the dry matter accumulation of different batches of N11 treatment reached 1950.41 and 2041.07 kg·hm−2, respectively. The nitrogen accumulation reached 75.802 and 85.804 kg·hm−2, respectively. The yield of the endive was significantly affected by the level of nitrogen supplied. As the level of nitrogen supply increased, the yield first increased and then decreased. The yield of the N11 treatment was the highest, which increased by 56.67% and 81.30%, respectively, compared with the N2 treatment. After function fitting, the theoretical yield is the highest when the rate of nitrogen application is from 9.935 mmol·L−1 to 11.448 mmol·L−1.

5. Conclusions

(1) At nitrogen supply concentrations of 8 and 11 mmol·L−1, the activity of key enzymes related to nitrogen metabolism in endive leaves was higher, which was more conducive to improving the nitrogen uptake capacity of the plants, thereby increasing the nitrogen mass fraction in the plants and ensuring higher nitrogen accumulation and protein yield in the plants.
(2) The dry matter and nitrogen accumulation in endive plants at different nitrogen supply levels were established by the logistic model, and the highest theoretical yield of chicory was found at nitrogen supply levels of 9.935 mmol·L−1 to 11.448 mmol·L−1 by means of a functional simulation.

6. Patents

Application (patent) number: CN202020279766.9; Authorization Publication Number: CN212260063U.
Name of utility model patent: A kind of cultivation frame for soilless cultivation.

Author Contributions

Conceptualization, Y.M. and Y.C.; methodology, T.T., H.L. and M.D.; software, Y.C.; validation, Y.C., S.G. and Y.M.; formal analysis, Y.C. and S.G.; investigation, Z.Z.; resources, H.L. and M.D.; data curation, Y.M.; writing—original draft preparation, Y.M. writing—review and editing, Y.C. and S.G.; visualization, Y.C.; manuscript revising, H.L. and M.D.; study design, Y.M., T.T. and M.D.; supervision, H.L. and M.D.; project administration, H.L. and M.D.; funding acquisition, M.D. All authors have read and agreed to the published version of the manuscript.

Funding

This work was funded by the National Spark Key Funding Project (2012GA8910033, 2015GA891008) and the National Natural Science Foundation of China (31360478).

Institutional Review Board Statement

Not applicable.

Informed Consent Statement

Not applicable.

Data Availability Statement

Not applicable.

Conflicts of Interest

The authors declare no conflict of interest.

References

  1. Koudela, M.; Petříková, K. Nutritional composition and yield of endive cultivars–Cichorium endivia L. Hortic. Sci. 2007, 34, 6–10. [Google Scholar] [CrossRef] [Green Version]
  2. Zhu, R.H. Physiological Response and Transcriptome Analysis of Chicory Seedlings under Cadmium Stress. Ph.D. Thesis, Sichuan Agricultural University, Ya’an, China, 2020. [Google Scholar]
  3. Hawrylak-Nowak, B. Comparative effects of selenite and selenate on growth and selenium accumulation in lettuce plants under hydroponic conditions. Plant Growth Regul. 2013, 70, 149–157. [Google Scholar] [CrossRef] [Green Version]
  4. Iqbal, A.; Dong, Q.; Wang, X.; Gui, H.; Zhang, H.; Zhang, X.; Song, M. Variations in Nitrogen Metabolism are Closely Linked with Nitrogen Uptake and Utilization Efficiency in Cotton Genotypes under Various Nitrogen Supplies. Plants 2020, 9, 250. [Google Scholar] [CrossRef] [Green Version]
  5. Boyle, E. Nitrogen pollution knows no bounds. Science 2017, 356, 700–701. [Google Scholar] [CrossRef]
  6. Tavassoli, A.; Ghanbari, A.; Ahmadian, A. Effect of zinc and manganese nutrition on fruit yield and nutrient concentrations in greenhouse tomato in hydroponic culture. J. Soil Plant Interact. Isfahan Univ. Technol. 2010, 1, 1–7. [Google Scholar]
  7. Chen, J.; Tang, L.; Liu, X.J.; Cao, W.; Zhu, Y. Modeling plant nitrogen uptake and grain protein accumulation in rice. Sci. Agric. Sin. 2011, 44, 1997–2004. [Google Scholar]
  8. Kim, Y.B.; Bae, J.H.; Park, M.H. Effects of supplemental lighting on growth and yield of sweet pepper (Capsicum annuum L.) in hydroponic culture under low levels of natural light in winter. Hortic. Sci. Technol. 2011, 29, 317–325. [Google Scholar]
  9. Diao, M.; Dai, J.F.; Luo, W.H.; Yuan, C.M.; Bu, C.X.; Xian, K.M.; Zhang, S.F.; Xu, R. Growth and yield prediction model of greenhouse sweet pepper. Trans. CSAE 2009, 25, 241–246. [Google Scholar]
  10. Stuart, N.W. Adaptation of the micro-Kjeldahl method for the determination of nitrogen in plant tissues. Plant Physiol. 1936, 11, 173. [Google Scholar] [CrossRef] [Green Version]
  11. Wang, X.; Ma, F.; Diao, M.; Fan, H.; Cui, J.; Jia, B.; He, H.; Liu, Q. Dynamic simulation of plant growth, nitrogen accumulation, and utilization in processed tomato plants under different nitrogen application levels. Chin. J. Appl. Ecol. 2014, 25, 1043–1050. [Google Scholar]
  12. Xin, W.; Zhang, L.; Zhang, W.; Gao, J.; Yi, J.; Zhen, X.; Du, M.; Zhao, Y.; Chen, L. Morphological and Physiological Characteristics of Rice Cultivars with Higher Yield and Nitrogen Use Efficiency at Various Nitrogen Rates. Agronomy 2022, 12, 358. [Google Scholar] [CrossRef]
  13. Zhao, Q.Z.; Chen, J.R.; Liu, H.; Qiao, J.F.; Gao, T.M.; Yang, H.X.; Wang, J.H. The relationship between key enzyme activities of nitrogen assimilation in rice and changes in leaf color. Chin. Agric. Sci. 2008, 09, 2607–2616. [Google Scholar]
  14. Cakmak, I. Enrichment of cereal grains with zinc: Agronomic or genetic biofortification. Plant Soil 2008, 302, 1–17. [Google Scholar] [CrossRef]
  15. Yu, B.; Qin, S.J.; Lv, D.D. Appropriate amount of zinc supply significantly improves carbon and nitrogen absorption and assimilation efficiency of Pingyi sweet tea seedlings. J. Plant Nutr. Fertil. 2021, 27, 97–108. [Google Scholar]
  16. Ji, C.; Li, J.; Jiang, C.; Zhang, L.; Shi, L.; Xu, F.; Cai, H. Zinc and nitrogen synergistic act on root-to-shoot translocation and preferential distribution in rice. J. Adv. Res. 2021, 35, 187–198. [Google Scholar] [CrossRef]
  17. Zhang, H.Z.; Xu, H.Y. Research progress of related enzymes in the process of nitrogen assimilation in plants. North. Hortic. 2011, 20, 180–183. [Google Scholar]
  18. Yin, H.; Li, B.; Wang, X.; Xi, Z. Effect of ammonium and nitrate supplies on nitrogen and sucrose metabolism of Cabernet Sauvignon (Vitis vinifera cv.). J. Sci. Food Agric. 2020, 100, 5239–5250. [Google Scholar] [CrossRef]
  19. Wang, H.; Yang, Z.; Yu, Y.; Chen, S.; He, Z.; Wang, Y.; Jiang, L.; Wang, G.; Yang, C.; Liu, B.; et al. Drought Enhances Nitrogen Uptake and Assimilation in Maize Roots. Agron. J. 2017, 109, 39–46. [Google Scholar] [CrossRef]
  20. Xu, H.C.; Shang, J.; Liu, M.H.; Zhang, F.; Li, Y.Y. Research progress on enzymes related to nitrogen metabolism. Anhui Agric. Sci. 2022, 50, 17–20. [Google Scholar]
  21. Liu, X.J.; Zhang, J.X.; Ye, F.; Qi, P. Effects of nitrogen application on nitrogen metabolism and nitrogen accumulation in alfalfa. J. Nucl. Agric. 2015, 29, 1399–1405. [Google Scholar]
  22. Diao, Z.W.; Yu, X.; Wang, Y.B.; Li, C.F.; Gai, Z.J.; Zhang, Y.F.; Ma, F.M. Study on the coupling regulation of nitrate reductase and nitrite reductase in sugar beet. J. Nucl. Agric. 2014, 28, 138–145. [Google Scholar]
  23. Li, D.F.; Li, Z.Y.; Li, S.Q.; Wang, Q.J.; Shao, M.G.; Li, F.G. Effects of nitrogen application on nitrate nitrogen and nitrate reductase activity in winter wheat plants of different varieties. Northwest Bot. 2006, 1, 104–109. [Google Scholar]
  24. Chen, H.; Wang, L.; Zhao, C.L.; Xiao, F.; Zheng, Y.F.; Liu, S.C. Effects of nitrogen and red-blue composite light ratio on nitrite reductase activity and gene expression in amaranth seedlings. J. China Agric. Univ. 2021, 26, 61–71. [Google Scholar]
  25. Kyaing, S.M.; Gu, L.H.; Cheng, H.M. The role of nitrate reductase and nitrite reductase in plant. Curr. Biotechnol. 2011, 1, 159–164. [Google Scholar]
  26. Zhang, Y.Y.; Song, X.F.; Xu, J.B.; Zhou, Q.; Liu, H.Q.; Wang, Y.; Zhang, Z.Y.; Song, H.L. Effects of different nitrogen concentrations on the growth and physiological indicators of hyacinth, especially the activities of key enzymes in nitrogen metabolism. Chin. J. Environ. 2021, 30, 39–46. [Google Scholar]
  27. Zhang, T.; Shi, Y.; Piao, F.; Sun, Z. Effects of different LED sources on the growth and nitrogen metabolism of lettuce. Plant Cell Tissue Organ Cult. (PCTOC) 2018, 134, 231–240. [Google Scholar]
  28. Jabeen, N.; Ahmad, R. Growth response and nitrogen metabolism of sunflower (Helianthus annuus L.) to vermicompost and biogas slurry under salinity stress. J. Plant Nutr. 2017, 40, 104–114. [Google Scholar]
  29. Wani, A.S.; Tahir, I.; Ahmad, S.S.; Dar, R.A.; Nisar, S. Efficacy of 24-epibrassinolide in improving the nitrogen metabolism and antioxidant system in chickpea cultivars under cadmium and/or NaCl stress. Sci. Hortic. 2017, 225, 48–55. [Google Scholar] [CrossRef]
  30. Forde, B.G.; Lea, P.J. Glutamate in plants: Metabolism, regulation, and signaling. J. Exp. Bot. 2007, 58, 2339–2358. [Google Scholar] [CrossRef]
  31. Zhang, C.; Peng, S.; Peng, X.; Chavez, A.Q.; Bennett, J. Response of glutamine synthetase isoforms to nitrogen sources in rice (Oryza sativa L.) roots. Plant Sci. 1997, 125, 163–170. [Google Scholar] [CrossRef]
  32. Wang, J.F.; Wang, Z.Z.; Gu, F.X.; Mu, H.M.; Wang, Y.; Duan, J.Z.; Feng, W.; Wang, Y.H.; Guo, T.C. Effects of nitrogen density regulation on carbon and nitrogen metabolism and yield of two winter wheat cultivars. Sci. Agric. Sin. 2021, 54, 4070–4083. [Google Scholar]
  33. Kishore Kumarkumar, R.; Bulle, M.; Wany, A.; Gupta, K.J. An overview of important enzymes involved in nitrogen assimilation of plants. Nitrogen Metab. Plants 2020, 2057, 1–13. [Google Scholar]
  34. Wang, F.; Gao, J.; Yong, J.W.; Liu, Y.; Cao, D.; He, X. Glutamate over-accumulation may serve as an endogenous indicator of tricarboxylic acid (TCA) cycle suppression under NH4+ nutrition in wheat (Triticum aestivum L.) seedlings. Environ. Exp. Bot. 2020, 177, 104130. [Google Scholar] [CrossRef]
  35. Ashraf, M.; Shahzad, S.M.; Imtiaz, M.; Rizwan, M.S. Salinity effects on nitrogen metabolism in plants—Focusing on the activities of nitrogen metabolizing enzymes: A review. J. Plant Nutr. 2018, 41, 1065–1081. [Google Scholar] [CrossRef]
  36. Moda, L.R.; de Mello Prado, R.; de Souza Júnior, J.P.; da Silva Júnior, G.B.; dos Santos, L.C.N.; Soares, M.V.G.; Kadyampakeni, D.M. Response of orange seedlings to the proportion of nitrate-ammonium in the nutrient solution and the benefits of phosphorus in ammonia toxicity. Sci. Hortic. 2021, 285, 110166. [Google Scholar] [CrossRef]
  37. Wang, J.; Nan, Z.; Christensen, M.J.; Zhang, X.; Tian, P.; Zhang, Z. Effect of Epichloë gansuensis endophyte on the nitrogen metabolism, nitrogen use efficiency, and stoichiometry of Achnatherum inebrians under nitrogen limitation. J. Agric. Food Chem. 2018, 66, 4022–4031. [Google Scholar] [CrossRef] [PubMed]
  38. Jing, B.; Diao, M.; Zhang, K.; Guo, P.; Wan, W.; Niu, N. Optimal fertilization effect of processed tomato based on critical nitrogen concentration. Soil Fertil. Sci. China 2020, 06, 205–212. [Google Scholar]
  39. Cui, Z.; Zhang, F.; Chen, X.; Miao, Y.; Li, J.; Shi, L.; Xu, J.; Ye, Y.; Liu, C.; Yang, Z.; et al. On-farm evaluation of an in-season nitrogen management strategy based on soil Nmin test. Field Crop. Res. 2008, 105, 48–55. [Google Scholar]
  40. Imran, M.; Sun, X.; Hussain, S.; Ali, U.; Rana, M.S.; Rasul, F.; Saleem, M.H.; Moussa, M.G.; Bhantana, P.; Afzal, J.; et al. Molybdenum-induced effects on nitrogen metabolism enzymes and elemental profile of winter wheat (Triticum aestivum L.) under different nitrogen sources. Int. J. Mol. Sci. 2019, 20, 3009. [Google Scholar] [CrossRef] [Green Version]
  41. Li, L.; Zhang, Z.; Tian, H.; Mo, Z.; Ashraf, U.; Duan, M.; Wang, Z.; Wang, S.; Tang, X.; Pan, S. Roles of nitrogen deep placement on grain yield, nitrogen use efficiency, and antioxidant enzyme activities in mechanical pot-seedling transplanting rice. Agronomy 2020, 10, 1252. [Google Scholar] [CrossRef]
Figure 1. Effects of different nitrogen supply levels on key enzyme activities of nitrogen metabolism in the leaves of endive plants. Figures (AD) show the responses of NR, NiR, GS, and GDH to different nitrogen supply levels, respectively. Note: Different lower-case letters show significant differences among the different treatments in the same week (p < 0.05).
Sustainability 14 15159 g001
Figure 2. The effects of different nitrogen treatments on the nitrate content in the leaves of endive plants during harvest. Note: Different lowercase letters indicate significant differences between treatments (p < 0.05).
Sustainability 14 15159 g002
Figure 3. Dynamic change of the dry matter accumulation of endive under different nitrogen treatments.
Sustainability 14 15159 g003
Figure 4. Dynamic change of the amount of N that accumulated in endive plants under different N treatments.
Sustainability 14 15159 g004
Figure 5. Effects of different N application rates on the yield of endive plants. Note: Different lowercase letters indicate significant differences between different levels of nitrogen application (p < 0.05).
Sustainability 14 15159 g005
Table 1. South China Agricultural University leafy vegetables (class B) nutrient solution formula.
ClassificationCompoundChemical FormulaDosage (mg/L)
Liquid ACalcium nitrateCa(NO3)2·4H2O472
Potassium nitrateKNO3267
Ammonium nitrateNH4NO353
Liquid BPotassium dihydrogen phosphateKH2PO4100
Potassium sulfateK2SO4116
Magnesium sulfate heptahydrateMgSO4·7H2O246
Liquid CChelated ironNaFe-EDTA13
Boric acidH3BO32.86
Manganese sulfateMnSO4·4H2O2.13
Zinc sulfateZnSO4·7H2O0.22
Copper sulfateCuSO4·5H2O0.05
Ammonium molybdate(NH4)6Mo7O2·4H2O0.02
Table 2. The treatment formula, with different levels of nitrogen.
TreatmentDosage of Salt Compounds (mg·L−1)Nitrogen
Content (mmol·L−1)
Calcium Nitrate TetrahydratePotassium NitrateAmmonium NitrateDipotassium PhosphateMagnesium Sulfate HeptahydratePotassium Dihydrogen PhosphatePotassium SulfateCalcium Sulfate Dihydrate
N2236 29624601161722
N5472101 1292460197 5
N847226753 246100116 8
N11472267173 246100116 11
N14472267293 246100116 14
Table 3. The effect of N on the dry matter production, N concentration, and total protein of endive in different growth stages.
IndicatorsTreatmentsGrowth to 7 dGrowth to 14 dGrowth to 21 dGrowth to 28 dGrowth to 35 d
Dry-matter production/(g·m−2)N24.291 ± 0.27 d15.353 ± 0.87 d29.034 ± 1.18 d79.785 ± 4.11 d106.163 ± 7.20 c
N54.774 ± 0.14 c16.574 ± 0.78 d52.272 ± 2.67 c129.344 ± 4.69 c141.954 ± 4.22 b
N85.518 ± 0.34 b22.323 ± 0.88 b85.533 ± 3.96 a152.069 ± 4.03 b178.852 ± 6.55 a
N116.549 ± 0.34 a24.233 ± 1.46 a70.719 ± 4.20 b165.573 ± 3.98 a184.283 ± 8.87 a
N145.562 ± 0.19 b20.551 ± 0.7154.344 ± 4.86 c128.902 ± 3.52 c149.174 ± 7.49 b
N concentration (%)N23.233 ± 0.37 b3.687 ± 0.08 c3.526 ± 0.10 c3.454 ± 0.21 bc3.529 ± 0.16 b
N53.696 ± 0.16 a3.714 ± 0.14 c3.535 ± 0.15 c3.136 ± 0.28 c3.448 ± 0.34 b
N83.817 ± 0.09 a4.084 ± 0.16 b3.906 ± 0.36 b3.365 ± 0.29 c3.562 ± 0.22 b
N113.825 ± 0.13 a4.152 ± 0.24 b4.337 ± 0.22 a3.733 ± 0.27 ab3.869 ± 0.228 a
N143.585 ± 0.14 a4.510 ± 0.29 a4.443 ± 0.26 a3.861 ± 0.30 a4.021 ± 0.18 a
Total protein/(g·m−2)N20.868 ± 0.12 c3.553 ± 0.76 b6.403 ± 0.63 e17.111 ± 2.90 c23.462 ± 2.57 d
N51.102 ± 0.1 bc3.845 ± 0.62 b8.336 ± 1.01 d26.784 ± 2.42 b30.504 ± 4.43 c
N81.313 ± 0.10 ab5.704 ± 0.85 a17.184 ± 2.01 b31.990 ± 5.09 b39.650 ± 5.76 ab
N111.562 ± 0.47 a6.277 ± 0.34 a23.121 ± 1.43 a41.641 ± 4.49 a43.994 ± 2.44 a
N141.265 ± 0.34 ab5.966 ± 1.00 a14.524 ± 2.06 c31.133 ± 3.82 b37.472 ± 3.98 b
Note: Different lowercase letters indicate significant differences between data in the same column (p < 0.05).
Table 4. Accumulation of dry matter and nitrogen in endives under different nitrogen treatments.
TreatmentExperiment 1Experiment 2
Dry Matter
Accumulation
Nitrogen
Accumulation
Dry Matter
Accumulation
Nitrogen Accumulation
/(kg·hm−2)/(kg·hm−2)/(kg·hm−2)/(kg·hm−2)
N21191.932 e38.680 e1302.671 e47.732 d
N51497.270 d53.456 d1660.137 d64.895 c
N81840.474 b70.075 b1943.472 b77.281 b
N111950.402 a75.803 a2041.075 a85.800 a
N141596.333 c63.961 c1772.532 c77.520 b
Note: Different lowercase letters in the same column indicate significant differences between treatments (p < 0.05).
Table 5. Eigenvalues for the dynamics of aboveground dry matter accumulation of endive plants under different rates of N application. (** Significant at p < 0.01).
ExperimentTreatmentFitting EquationCorrelationCoefficientT1T2TmVmT2T1
R2(d)(d)(d)(kg·hm−2·d−1)(d)
Experiment 1N2DMT = 1199.241/(1 + 436.771e−0.2389T)0.998 **19.9330.9525.4471.64211.02
N5DMT = 1473.714/(1 + 71474e−0.4843T)0.996 **20.3625.823.08178.4505.44
N8DMT = 1833.875/(1 + 918.172e−0.3014T)0.999 **18.272722.63138.1918.73
N11DMT = 1915.492/(1 + 2940.9e−0.3714T)0.998 **17.9625.0521.5177.8627.09
N14DMT = 1578.544/(1 + 921.942e−0.2939T)0.998 **18.7527.7123.23115.9858.96
Experiment 2N2DMT = 1397.910/(1 + 1046.10e−0.2226T)0.998 **25.3237.1531.2477.79411.83
N5DMT = 1769.764/(1 + 481.605e−0.1984T)0.999 **24.537.7831.1487.77113.28
N8DMT = 2038.854/(1 + 307.342e−0.1869T)0.998 **23.5937.6830.6495.29014.09
N11DMT = 2238.432/(1 + 195.10e−0.1672T)0.997 **23.6639.4131.5393.59515.75
N14DMT = 1891.533/(1 + 488.02e−0.1988T)0.998 **24.5137.7631.1494.01013.25
Table 6. Eigenvalues for the dynamics of aboveground N accumulation of endive plants under different rates of N application. (** Significant at p < 0.01).
ExperimentTreatmentFitting EquationCorrelation CoefficientT1T2TmVmT2T1
R2(d)(d)(d)(kg·hm−2·d−1)(d)
Experiment 1N2DMT = 39.651/(1 + 571.58e−0.2556T)0.997 **19.6829.9924.832.534310.31
N5DMT = 52.33/(1 + 3055.1e−0.3363T)0.997 **19.9527.7823.864.39937.83
N8DMT = 68.87/(1 + 289.191e−0.2432T)0.999 **17.8928.7223.34.187210.83
N11DMT = 73.56/(1 + 1555.7e−0.3490T)0.999 **17.2924.8321.066.41817.54
N14DMT = 63.68/(1 + 448.630e−0.2633T)0.996 **18.1928.1923.194.19210
Experiment 2N2DMT = 51.29/(1 + 1011.62e−0.2213T)0.998 **25.3237.2331.272.836811.91
N5DMT = 68.66/(1 + 751.121e−0.2192T)0.999 **24.236.2230.213.761812.02
N8DMT = 80.92/(1 + 507.254e−0.2148T)0.998 **22.8735.14294.344312.27
N11DMT = 93.10/(1 + 274.872e−0.1878T)0.996 **22.8936.9129.94.37214.02
N14DMT = 82.45/(1 + 727.723e−0.2186T)0.998 **24.1236.1630.144.506912.04
Publisher’s Note: MDPI stays neutral with regard to jurisdictional claims in published maps and institutional affiliations.

