Article

The Dynamic Impact of Renewable Energy and Economic Growth on CO2 Emissions in China: Do Remittances and Technological Innovations Matter?

by
Chafic Bassam Saliba
1,2,
Fida Ragheb Hassanein
3,
Seyed Alireza Athari
4,
Hazar Dördüncü
5,
Ephraim Bonah Agyekum
6,* and
Parise Adadi
7
1
School of Business, Lebanese International University, Beirut 14604, Lebanon
2
Department of Finance, Holy Spirit University of Kaslik, Kaslik 14604, Lebanon
3
Business Department, Lebanese International University, Beirut 14604, Lebanon
4
Department of Business Administration, Faculty of Economics and Administrative Sciences, Cyprus International University, Nicosia 99258, Northern Cyprus, Turkey
5
Department of International Trade and Logistics, Faculty of Economics, Administrative and Social Sciences, Nisantasi University, Istanbul 34020, Turkey
6
Department of Nuclear and Renewable Energy, Ural Federal University Named after the First President of Russia Boris Yeltsin, 19 Mira Street, 620002 Ekaterinburg, Russia
7
Department of Food Science, University of Otago, Dunedin 9054, New Zealand
*
Author to whom correspondence should be addressed.
Sustainability 2022, 14(21), 14629; https://doi.org/10.3390/su142114629
Submission received: 15 October 2022 / Revised: 3 November 2022 / Accepted: 3 November 2022 / Published: 7 November 2022

Abstract

:
Several investigations show that remittances, renewable energy, and innovation promote the socioeconomic advancement of a nation. Nevertheless, the impacts of remittances and renewable energy on ecological quality are yet to be evaluated thoroughly. Therefore, the current investigation assesses the effects of remittances and renewable energy on CO2 emissions while taking into account the roles of technological innovation, globalization, and economic growth. Toward this end, this paper depends on yearly data between 1990 and 2019. The study employed bounds testing and its results disclosed long-term connections between CO2 and the regressors. Moreover, unlike prior studies that employ time-domain causality, we employed frequency domain causality, which considers causality at different frequencies. Furthermore, the ARDL long- and short-run results showed that economic growth amplified CO2 emissions, while green energy, remittances, and globalization lessened CO2 emissions. Lastly, the frequency domain causality approach revealed that globalization, renewable energy, economic growth, technological innovation, and remittances could predict CO2 emissions in the long-term. These findings’ sturdiness was established utilizing DOLS and FMOLS regression. Several policy recommendations are suggested in light of these ground-breaking discoveries.

1. Introduction

As negative consequences of environmental degradation such as global warming and climate change become more palpable, the global awareness of environmental issues is raised. This awareness compels nations to take action to lessen environmental devastation. The inevitability of ecological deterioration due to economic expansion makes it difficult for policymakers to put ecological regulations into action rapidly [1,2]. As a result, economists focus their studies on the connection between ecological and macroeconomic indicators. At the same time, policymakers continue to look for environmental measures that have the fewest negative effects on economic indicators [3,4]. Over the years, both developing and developed nations have tried to find solutions to the environmental degradation that has resulted into global warming and climate change. The recent floods in Nigeria, Pakistan, and India, among others, are examples of the damaging effects of global warming and climate change. Though several nations have signed the Paris accord, meeting their carbon reduction targets is in jeopardy due to their pro-growth agendas. Several studies have highlighted the environmental effects of economic growth, globalization, financial development, political risk, green energy, and technological innovation, among others [5,6,7,8,9,10,11,12,13,14].
The earlier-mentioned studies are often feasible in terms of the effective use of energy and the transition from fossil sources to green sources, since the structure of production and, consequently, the economy is centered mostly on fossil fuels for several nations. From this perspective, the financial sector is viewed as a crucial resource in supporting environmental expenditures due to the high costs of technology investments in enhancing energy efficacy and diversifying the portfolio of green energy [15,16,17,18,19]. Consequently, the amount of research studying drivers of ecological deterioration has significantly grown in recent years [20,21,22,23]. The most important resource in supporting environmental expenditures is official development aid for nations that wish to finance ecological investments using public funds [24]. Nevertheless, critics of public finance claim that these subsidies drain the economy and bloat the private sector. Remittances are being underutilized as essential resources. They help lessen ecological damage since they are one of the foundational components of the international financial sector [24,25]
Investigations of the connection between the environment and remittance (REM) are few since REM’s effects on the ecosystem indirectly happen through several pathways. The first route is made possible by the rise in remittances, which raises individuals’ disposable income. On the one hand, an increase in personal affluence results in an increase in energy-focused consumption, which worsens the ecosystem [26]. On the other hand, the rise in personal income encourages the creation of new employment and boosts output. Depending on the economy’s degree of development, the effects of increased output brought on by economic expansion on the environment varies. The second route is concerned with how remittances affect consumption. Consumption growth is accompanied by output expansion, and as a result, energy demands rise sharply. Environmental contamination is thus anticipated to increase as energy demands rise. As more money is transferred from remittances to the banking sector, a third route opens up [8,9,27].
A complicated transmission mechanism that may be extended with different environmental and remittance-related elements was created [28,29]. For example, it is said that people can boost their educational attainment by utilizing the profits from their personal income increases brought on by their remittances [24,25,26]. Thus, a higher educational level can result in a greater understanding of the environment, which could aid in reducing behaviors that cause pollution. Foreign commerce is a potential outlet that is frequently disregarded. Due to remittances, an overvalued currency can harm a nation’s ability to compete internationally by exposing a public moral hazard issue and restricting the variety of exports by adversely influencing internal commerce [26,29]. Lastly, since remittances are a crucial source of finance for nations with underdeveloped banking systems, sponsoring projects from this source with a focus on advancing renewable energy technology alters their ecological consequences. We must characterize the impact of remittances on the environment because of the intricate effects of all these pathways on environmental variables.
China intends to start along the route of a low-carbon transition by striving to become carbon neutral by 2060 in the face of escalating CO2 emissions [8,9]. In addition to its domestic pledge to reduce CO2 emissions, China has accepted the Paris Agreement under the UNFCCC and pledged to implement CO2 emission-reduction measures to meet the relevant objectives for combating climate change [30,31]. China has changed its pledge to phase out coal use at the recently completed 26 Conference of the Parties (COP26) in Glasgow by promising to reduce coal usage. This change reflects China’s position that CO2 emissions will peak by 2030 and gradually decline to achieve the 2060 carbon neutrality goal. However, the country is committed to diversifying its national energy portfolio by growing and lowering the percentages of renewables (wind and solar) and coal, respectively, to achieve carbon neutrality by 2060 [32]. The world’s economies are working to find pertinent elements that can separate CO2 from economic growth to achieve carbon neutrality [31]. China also intends to implement specific decoupling techniques in this area [30]. It is dedicated to accomplishing these linked goals by implementing novel efforts to create a modern energy system, particularly in respect to the 2060 carbon-neutrality aim. Modernization is anticipated to take the shape of a shift to clean energy, increased energy efficiency, and reduced reliance on fossil fuels for power production. Innovation may be considered a modern approach in attaining low-carbon growth in China by applying the most recent technologies, not just inside the energy sector but in the whole economy [31].
Given the facts above, the main goal of this essay is to ascertain the implications of remittances on the environment in China. In order to refrain from ignoring potential intermediary pathways in the remittances-environment interaction, the effects of GDP, REC, and INV are also explored. The following are the research’s literary contributions: (i) The assessment is strengthened by accounting for the intricate relationships amongst remittance, the environment, and the prospective channels that constitute the relationship between CO2 and remittances; (ii) The FMOLS and DOLS are employed for their sturdiness and to produce more thorough policy suggestions; (iii) Lastly, the frequency domain causality, which can evaluate causality at various frequencies suggested by [
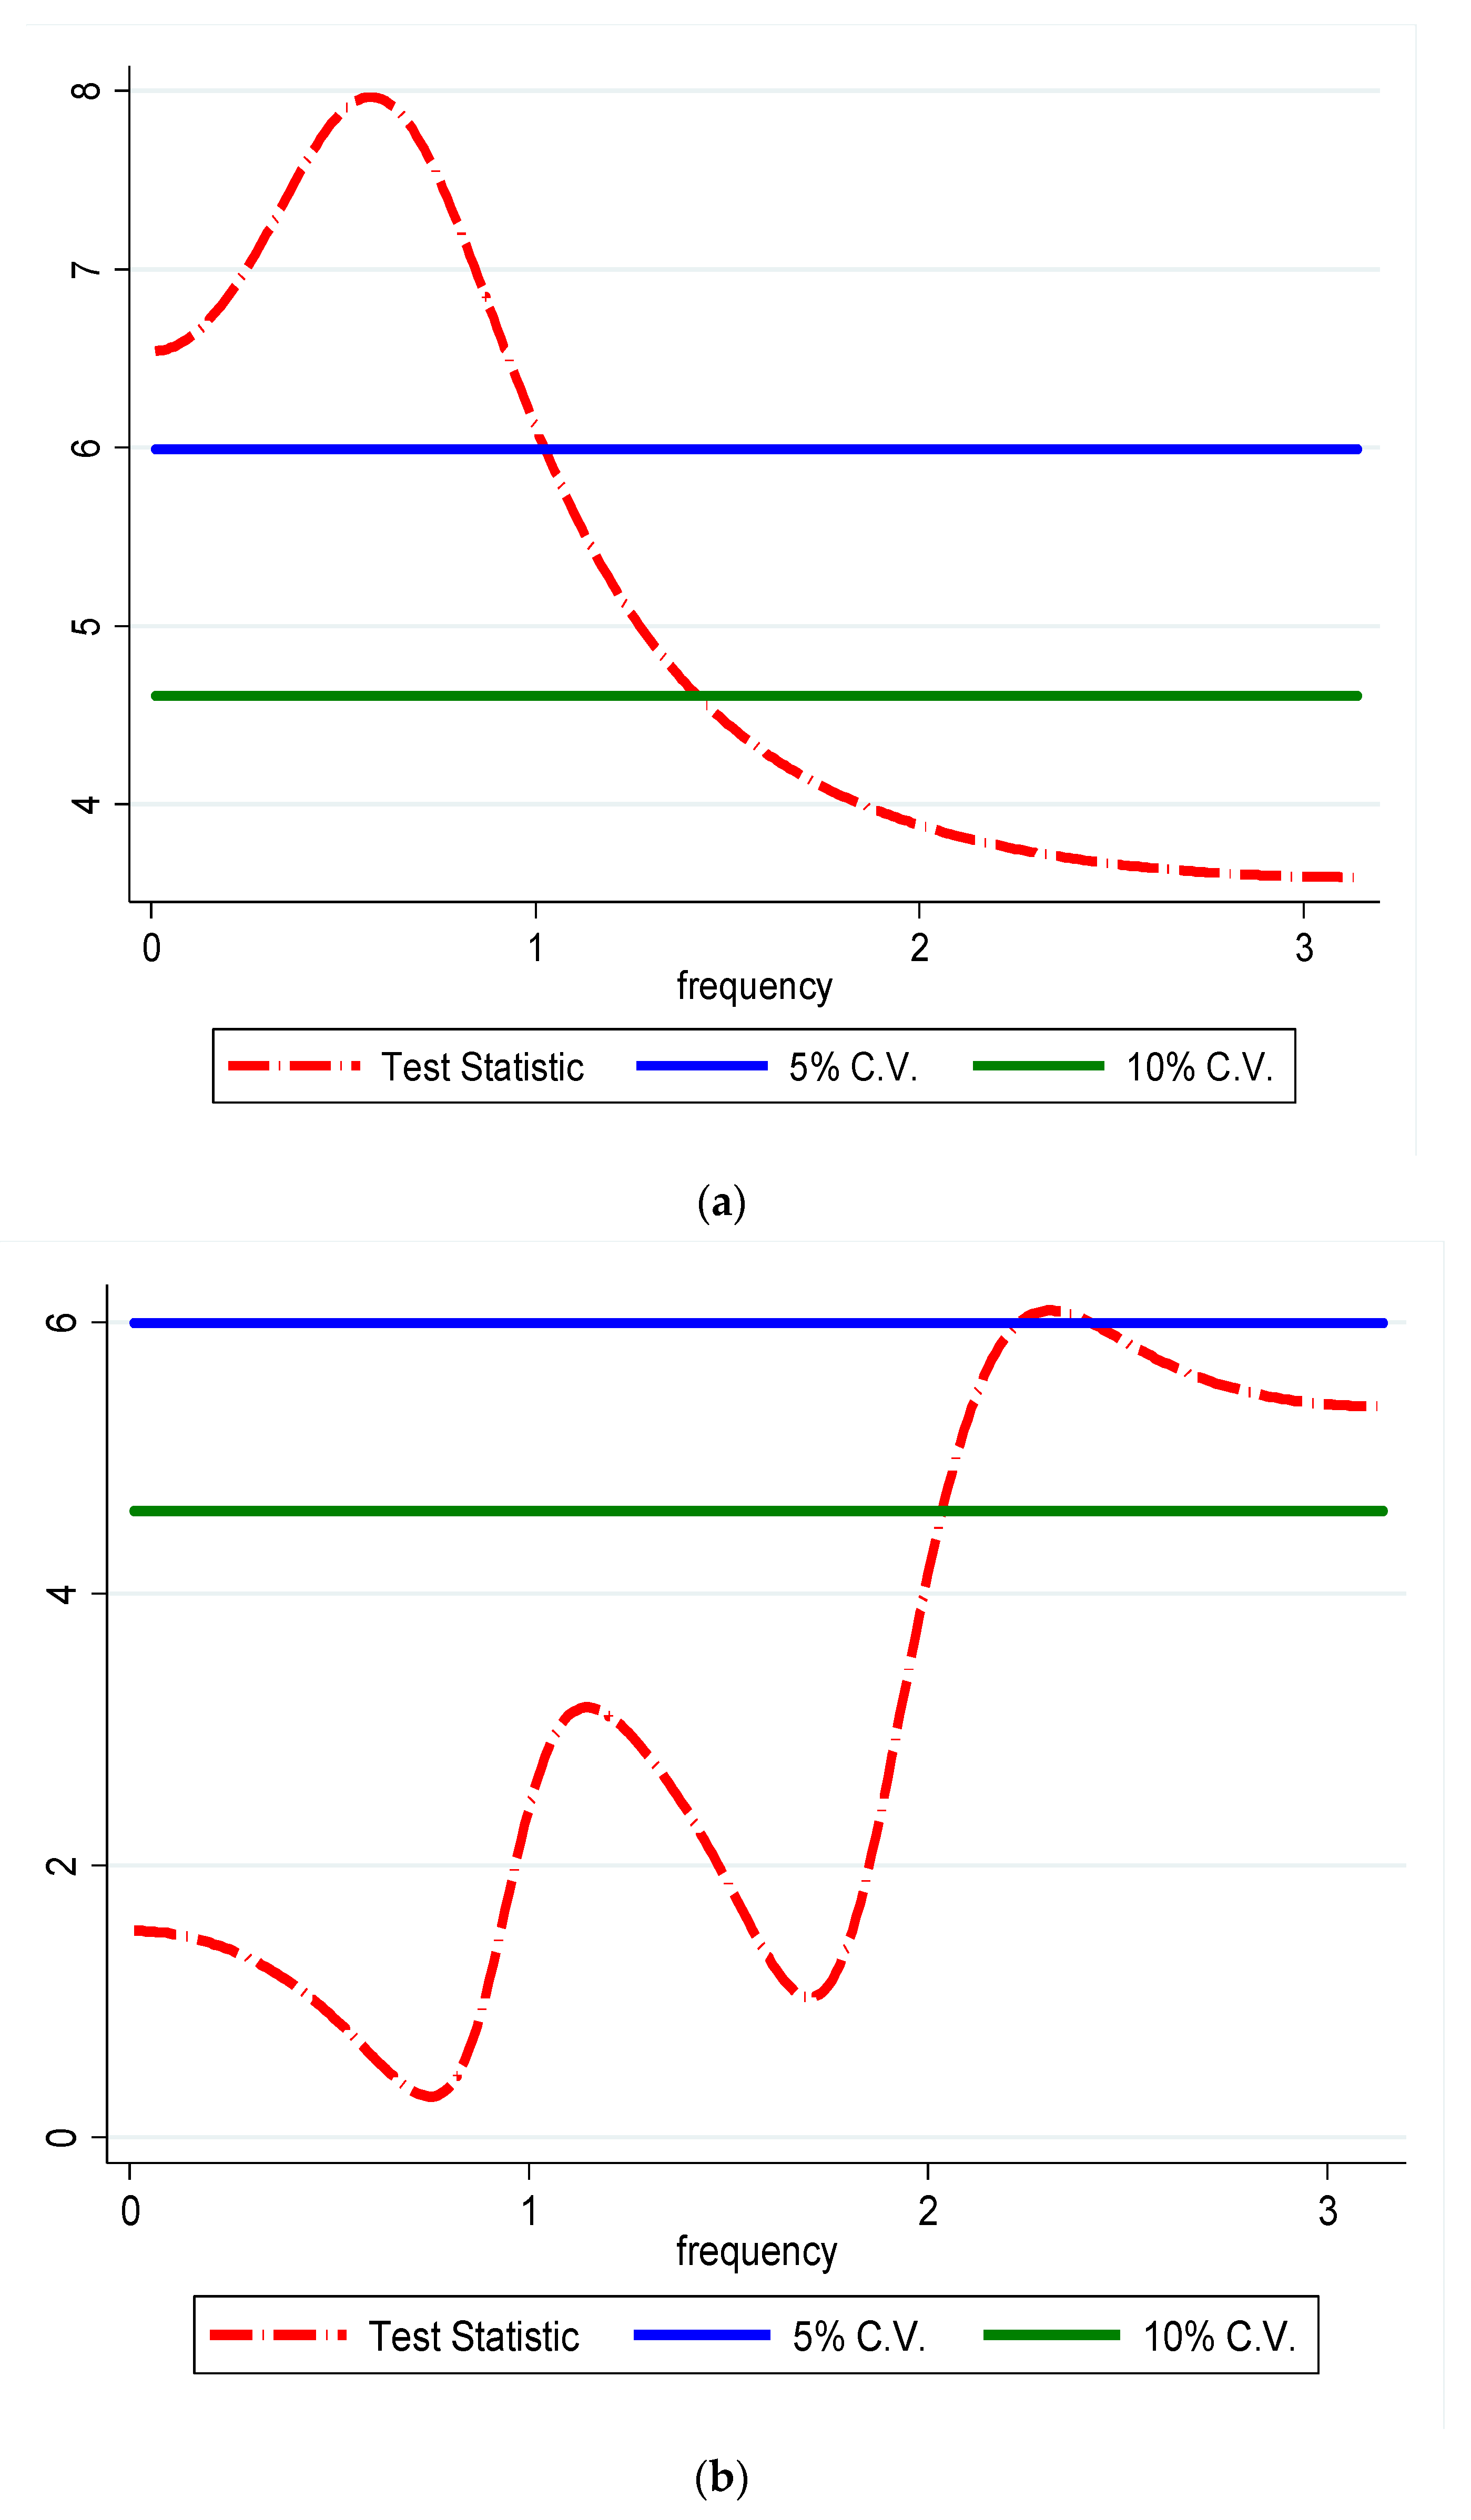
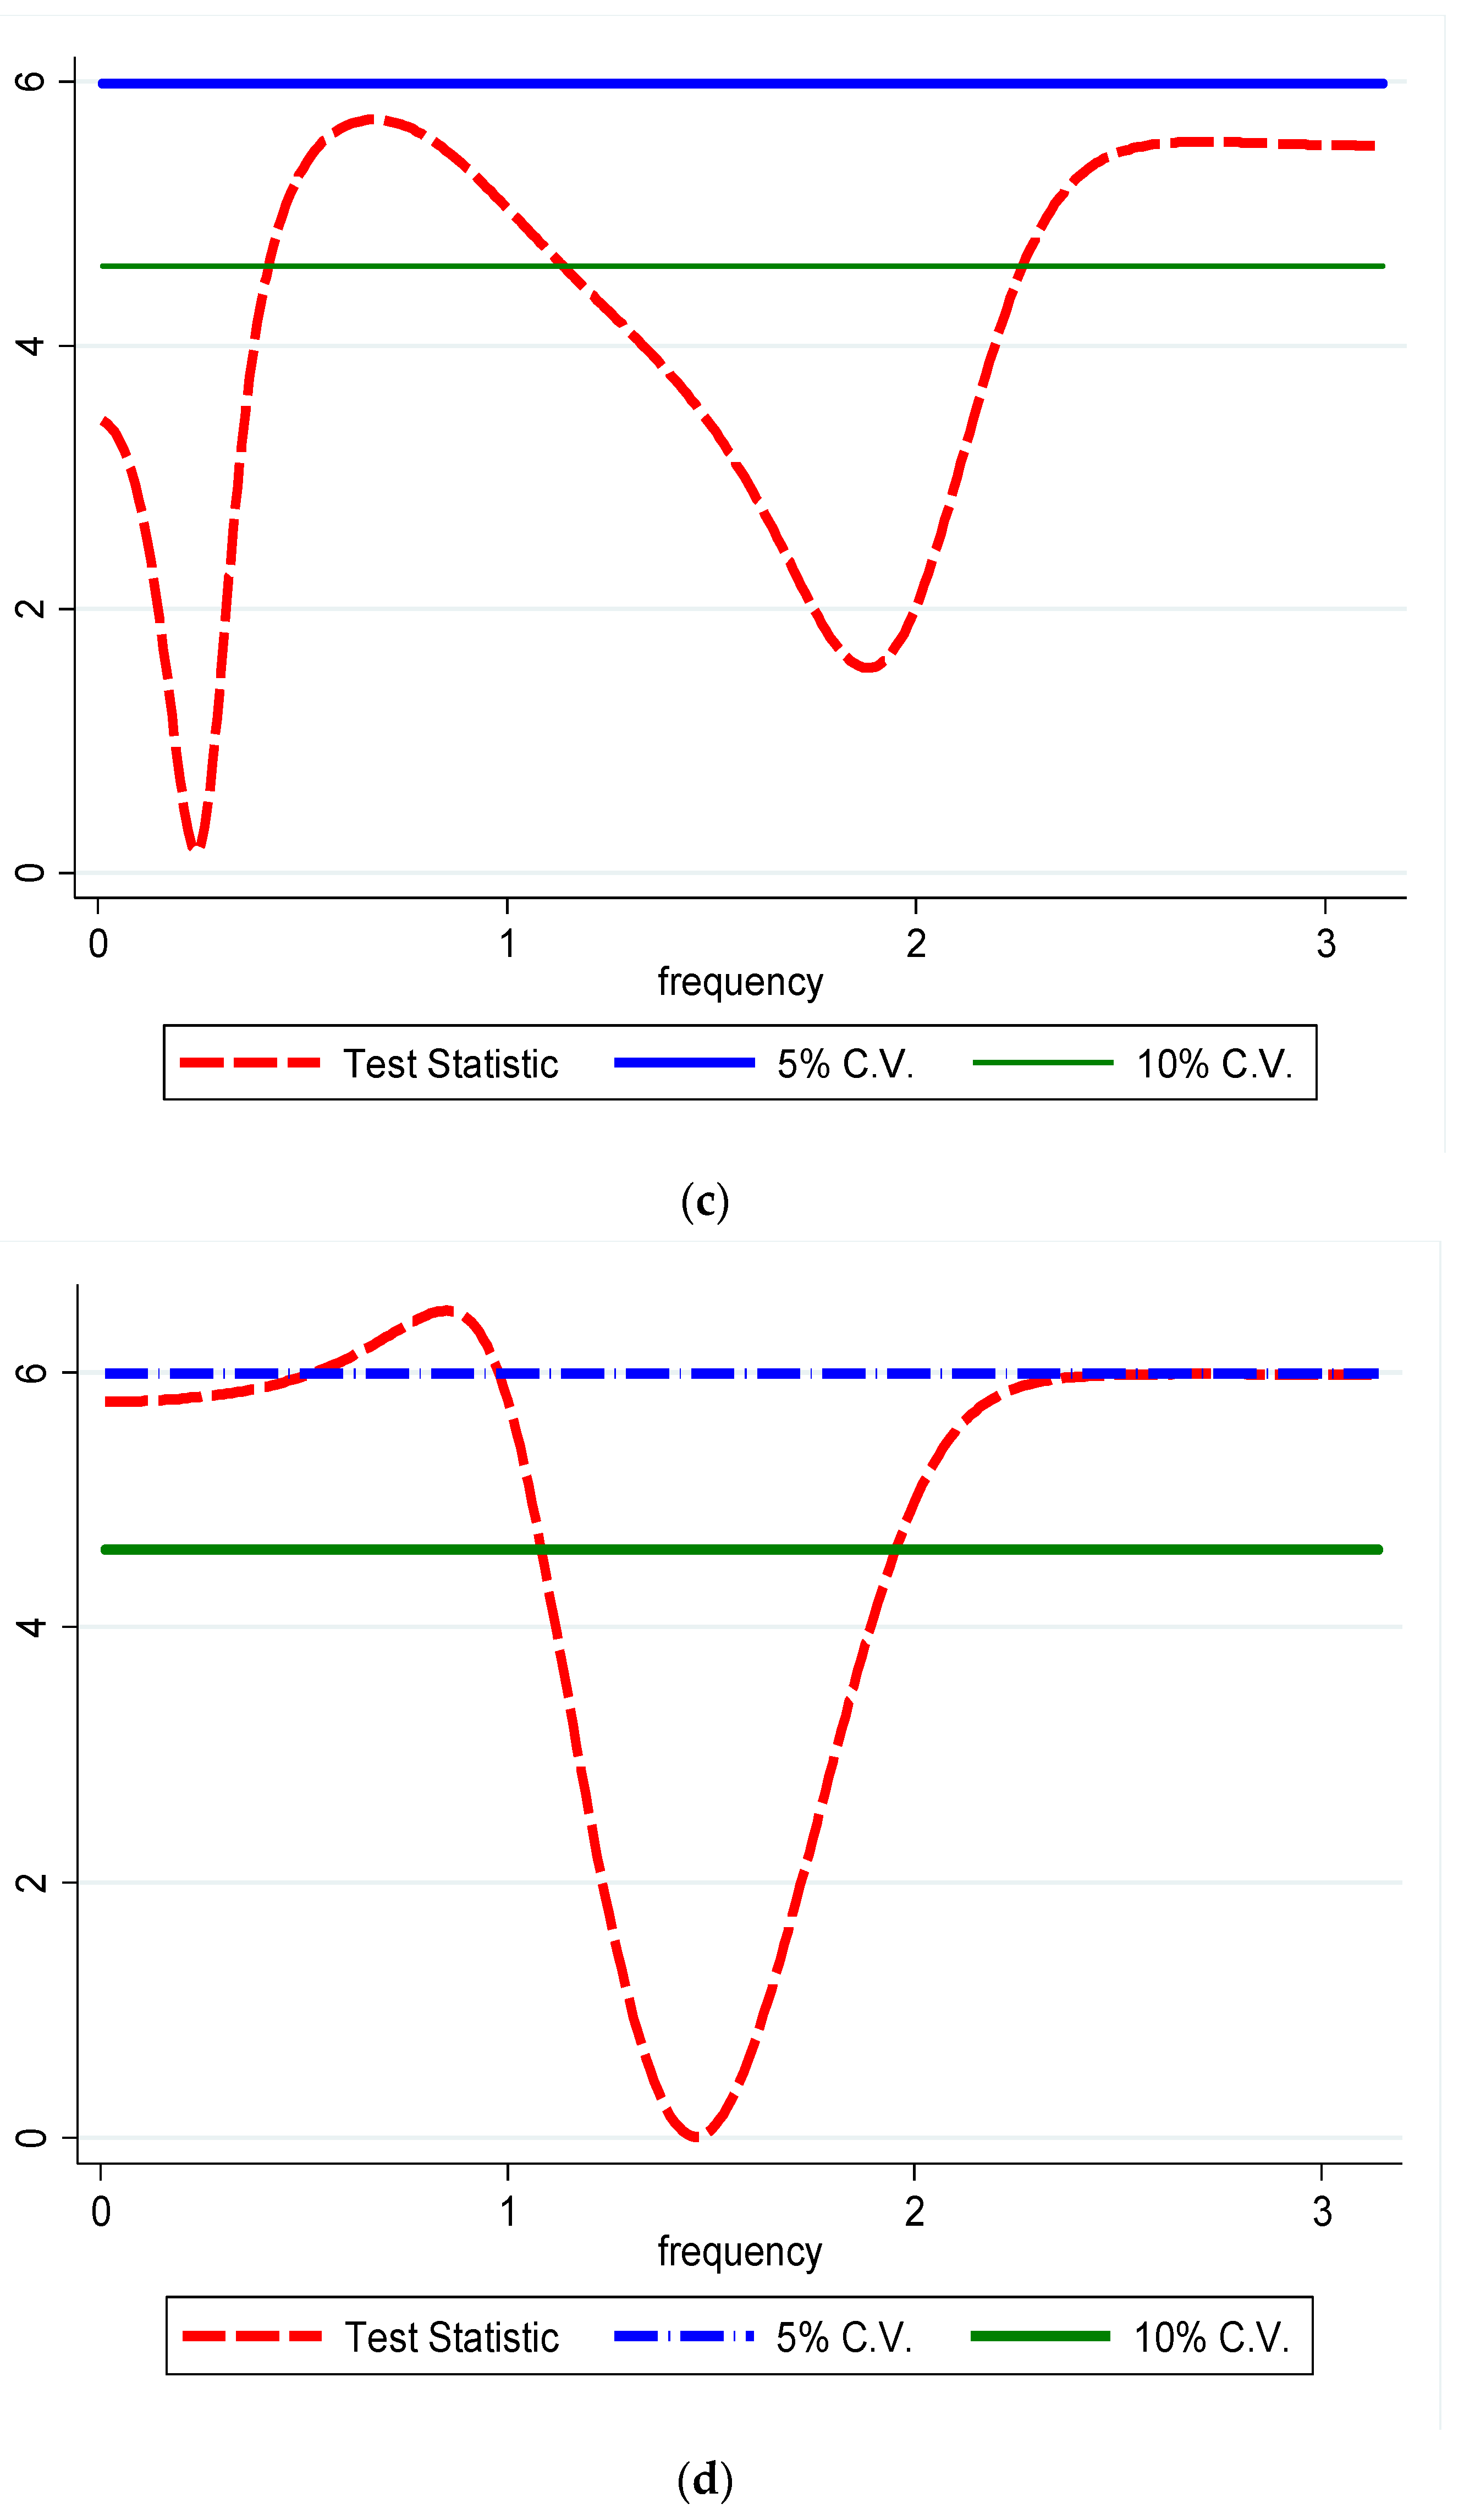
33], was employed. Thus, we can capture causality in the short-, medium-, and long-term.
The research’s remaining sections are organized as follows: The literature is reviewed in Section 2. The methods and empirical models are described in Section 3. A discussion of the empirical findings is presented in Section 4. The findings’ practical recommendations are highlighted in Section 5.

2. Literature Review

2.1. Synopsis of Studies between CO2 Emissions and Economic Growth and Remittances

Between the years 1986 to 2017, [25] examined the relationship between remittances, growth, and emissions. In its econometric methodology, this research used second-generation unit root approaches. The results showed that remittances contribute to slowing down ecological deterioration because they have a detrimental impact on emissions, whereas economic growth increases CO2 emissions. From 1980 to 2016, [24] investigated the emissions-remittances-growth nexus in Pakistan and Bangladesh. The researchers used a panel cointegration approach and a panel ARDL model to examine long-run correlations. The panel cointegration approach’s predicted finding corroborated the presence of a long-term link between REM, GDP, and CO2 emissions. Its conclusions showed that both economic development and an improvement in remittances received contributed to reducing emissions from the chosen panel nations. The short-run ARDL analysis, on the other hand, demonstrated that CO2 emissions increased at a substantial rate in response to an increase in economic growth and remittance inflow. Additionally, this research utilized DOLS for reliable assessment and came to the same long-term conclusion as ARDL.
Moreover, Ref. [26] inspected the nexus of remittances and CO2 emissions. For the period between 1980 and 2014, the study investigated the asymmetric connections between remittances, real growth, and CO2 in India. Using time series data, the research adopted a nonlinear ARDL model to predict theoretical connections. The NARDL bound test’s findings affirmed the indicators’ long-run associations. The results demonstrated that, in contrast to a negative shock, positive surprise in remittances caused a rise in CO2. Real growth had a positive coefficient but lost statistical significance with time. According to empirical findings, the parameters had an asymmetric long-run interrelationship. Furthermore, [34] used FMOLS and DOLS models to estimate yearly data from 1990 to 2019 to compare CO2 emissions, real growth, and remittance in a subset of G-20 nations. The CD was identified via LM tests, and the CADF test was used to determine if the variables were stationary. In the framework of the G-20 nations, the Panel Cointegration confirmed a long-run association. Two models showed a positive correlation between CO2 emissions and the economic development of a subset of G-20 countries. Additionally, evidence found that remittances significantly reduced CO2 emissions. Researchers, policymakers, environmentalists, and governments will benefit from this research’s illumination on achieving an eco-friendly ecosystem through the prudent use of remittances and real growth.

2.2. Synopsis of Studies between CO2 Emissions and Renewable Energy and Technological Innovation

In addition to being a reliable solution to guaranteeing green energy and security, renewable energy also aids in the transition to a low-carbon society and economy. The growth of renewable energy is influenced by a number of fundamental factors, including the advancement of technological innovation. Chinese province data from 2000 to 2015 were utilized by [35] to assess the causes of climate change and investigate how technical advancements in renewable energy were responding to high levels of CO2. The study revealed that the degree of technological innovation in China’s regions varied significantly. Additionally, the research showed that the high levels of CO2 emissions had boosted technical innovation in renewable energy sources; this indicated that the innovation process proactively reacts to climate change. Additionally, business and government R&D spending both contributed to raising the degree of innovation.
Moreover, ref. [36] utilized the yearly data from 1990 to 2018 to examine the influence of technological innovation and green energy in lowering the transport sector’s CO2 emissions in China. Implementing the QARDL technique revealed that clean energy and technological innovation significantly impacted CO2 emissions in China’s transportation industry. The use of green energy and green innovation both had a negative effect on CO2 associated with transportation. In addition, the results showed that as innovation and clean energy grew, so too did the amount of CO2 emitted in the transportation sector; yet, as a nation’s GDP increased, so too did the amount of CO2 emissions in that sector. To reduce CO2 emissions, China should adopt new regulations that spur innovation in the transportation industry.
Based on the STIRPAT model, ref. [37] investigated the relationships between green technology, CO2, and renewable energy use in Turkey from 1990 to 2018. The research implemented tests similar to “unit-root” to confirm the integrative characteristics of the factors holding the information for structural fractures. The connection between the parameters was also examined using the BARDL-bound test procedure. A Granger causality test was used to examine the causative connection between the development of green technologies, renewable energy, and CO2 emissions. The research findings uncovered the long-term integration of green renewable energy, emissions, and technological progress. Furthermore, it showed that innovation and clean energy reduced CO2 emissions, but energy use increased CO2 emissions.
From 1990 to 2017, ref. [38] examined the CO2 dynamics of the N-11 nations. The research evaluated novel elements to determine CO2, such as technical innovation and the utilization of green energy. The empirical estimates were based on methodologies from the second generation. Consumption of renewable energy and technological innovation were negatively correlated with CO2. These results have significant ramifications, and prompt us to advise encouraging technical advancement and the usage of green energy sources. This will assist in accomplishing the COP21 objectives.

3. Data and Methods

3.1. Data

This study aims to explore the role of economic growth, remittances, innovation, and globalisation on CO2 emissions in China using yearly data stretching between 1990 and 2019. The regressors are remittances (REM), renewable energy (REC), innovation (INV), globalisation (GLOB), and economic growth (GDP), while the dependent variable is Carbon emissions (CO2). The precise measurement, source, and variable name is presented in Table 1. All the variables are logged to ensure conformity to normality in line with the research of [39].
Table 2 presents the data description with the results presented as follows: the mean of GDP (29.07) is the highest, which ranges from 27.658 to 30.291; followed by LnINV (11.410), which ranges between 8.6712 and 14.194; LnGLOB (3.9889), which falls from 3.5866 to 4.1676; LnREC (2.9814), which ranges from 2.4283 to 3.5288; Ln CO2 (1.3988), which ranges from 0.6494 to 2.0289; and LnREM (−1.8795), which ranges from −3.3983 to −0.7397. With the exemption of LnINV, the values of the other variables (LnCO2, LnGDP, LnGLOB, LnREC, and LnREM) are negatively skewed. Furthermore, the kurtosis values show that LnCO2, LnGDP, LnGLOB, LnREC, LnREM, and LnINV are platykurtic. Lastly, the JB Probability shows that all the variables align with normal distribution.

3.2. Estimation Strategies

To achieve the goal of our study, the necessary data on the relevant variables were compiled from the outset. The empirical model was then specified in this research by referencing the literature. The timeframe of the study covered the period between 1990 and 2019. The defined empirical model was examined using a variety of advanced econometric methods to obtain results that can be relied upon for formulating policy. As a result, the investigation started by looking at the time series data’ stationarity feature. The investigation validated the stated model’s long-term association after defining the series’ integration order. Since the Jarque Bera probability is insignificant, we refuted the null hypothesis of “nonlinearity”. Therefore, the variables of investigation were linear, which warranted the study to use a linear approach. Based on this knowledge, we formulated the study’s economic model as follows:
C O 2 t = β 0 + β 1 G D P + β 2 I N V t + β 3 G L O B t + β 4 R E C t + β 5 R E M t + ε t    
where CO2, GDP, INV, GLOB, REC, and REM represent carbon emissions, economic growth, technological innovation, globalisation, renewable energy, and remittances, respectively. Furthermore, β 1 β 5 represents the coefficients of the regressors. Moreover, ε t represents an error term.
Given its numerous advantages over the traditional cointegration methods, the analysis employed the approach suggested by [43], named the ARDL model, as an efficient estimation technique to reveal short- and long-term connections among the parameters of the specified model. Before using other cointegration strategies, it was crucial to uncover a series’ integration property; nevertheless, this strategy did not call for pre-testing. The ARDL model can be used to address the endogeneity issue with the aid of the variable’s lag length. Secondly, it can be used regardless of how the series under investigation is integrated [43,44]. Last but not least, the ARDL model can generate reliable results even when the sample size is small [45]. The ARDL bound testing approach for the provided econometric model in Equation (1) may be written in Equation (2) in the manner shown below. Consequently, it is simple to understand how the variables are connected in the long-run, as shown in Equation (2).
Δ L n C O 2 = θ 0 + β D U M + i = 1 p β 1 i Δ I n C O 2 t + i = 1 p β 2 i Δ I n G D P t + i = 1 p β 3 i Δ I n I N V t + i = 1 p β 4 i Δ I n G L O B t + i = 1 p β 5 i Δ I n R E C t + i = 1 p β 6 i Δ I n R E M t + γ 1 Δ C O 2 t 1 + γ 2 Δ G D [ t 1 + γ 3 Δ I N V t 1 + γ 4 Δ G L O B t 1 + γ 5 Δ R E C t 1 + γ 6 Δ R E M t 1 + ε t      
After the long-term connection between series is defined, the short-run coefficient must be gathered. Thus, the error correction model must be evaluated to gather the short-run coefficients, as is shown in Equation (3).
Δ L n C O 2 = θ 0 + β D U M + i = 1 p β 1 i Δ I n C O 2 t + i = 1 p β 2 i Δ I n G D P t + i = 1 p β 3 i Δ I n I N V t + i = 1 p β 4 i Δ I n G L O B t + i = 1 p β 5 i Δ I n R E C t + i = 1 p β 6 i Δ I n R E M t + ρ E C T t 1 + ε t
In Equations (2) and (3), Δ denotes the first difference operator, p represents the lag length of the series, and ε t denotes the error term. Furthermore, E C T and ρ denote the error correction term and the coefficient of the ECT, respectively. Additionally, the above equation presents error correction dynamics and the series’ long-term relationships. In Equation (2), we evaluate the existence of the long-run connection with the aid of the ARDL bounds test by proposing the following null and alternative hypotheses as shown in Equations (4) and (5):
H0: θ1 = θ2 = θ3 = θ4 = θ5 = 0
H0: θ1 ≠ θ2 ≠ θ3 ≠ θ4 ≠ θ5 ≠ 0
The computed F-stat and its reference to the critical value provided by Pesaran et al. [43] determined the final verdict about the hypothesis (2001). Pesaran et al. [43] was chosen as the critical value because of its virtue in taking a longer duration into account. When the recorded statistical value of F exceeded the upper limit’s crucial boundary value, the Ho was dismissed. When the computed F-statistic fell short of the lower critical limit, the H0 was supported. When the estimated number was between the top and lower boundary values, there was insufficient evidence against the Ho. The conclusion about the long-run interrelationship also relied on the ECT and its direction, i.e., the long-term connection required the negative and statistically significant ECT [46]. Furthermore, we used the AIC to evaluate the optimal lag length.
We also used the FMOLS (completely modified OLS) and dynamic OLS (DOLS) on the stated model to examine the long-term effects of explanatory factors on the CO2 as a robustness assessment for the proposed model. Two aspects drove the justification for utilizing these techniques. First, the DOLS and FMOLS can be employed if the cointegration requirement among the I(1) parameters are met. Second, these techniques address serial correlation and endogeneity biases resulting from the cointegration connection. As a result, it provides asymptotic effectiveness in the results.
Lastly, the frequency domain causality, which can evaluate causality at various frequencies suggested by [33], was employed. Thus, we were able to capture causality in the short-, medium-, and long-term.

4. Results and Discussion

4.1. Pre-Estimation Results

The primary objective of this research was to examine the emergence of a long-term interrelationship between the series being discussed. The suggested model does not apply to I(2) indicators, even though ARDL bound testing does not need previous knowledge about the nature of the series associated with the integration order. Thus, to use the methods for creating a long-term interrelationship, unit root test evaluation gives vital knowledge about the integration characteristic of the parameters. As a result, several standard root tests, including the PP and ADF tests, were used to examine the series’ integration properties. Table 3 summarizes the evolving results of the stationarity test. All variables have the unit root issue at level, as per the standard tests of unit root output, but it shifts to stationary at the first difference.
If the structural discontinuity in the time series is not accounted for during the estimating procedure, the computed traditional unit root test may yield misleading results. In order to comprehend the structure of the series while taking breaks into account, [47] test was used. According to Table 3, the results of the ZA showed that the investigated series were or I(1). Consequently, it has been determined that the variables continue to follow the first difference stationarity despite the structural break. It has also been confirmed that none of the series are I(2).

4.2. Cointegration Results

We have observed that the under-consideration series is I(1) series, based on unit root findings. Hence, we are required to assess the long- and short-term relationships between the series under consideration by utilizing the bounds test technique that was built on the ARDL framework proposed by Pesaran et al. [43]. The findings from ARDL are susceptible to the selection order of lag as an empirical method. Therefore, picking the right lag is crucial to solving the endogeneity issue in the model formulation. Based on our model’s reliable findings from the different alternatives’ information criterion, we decided to use the AIC for lag specification. By examining the test statistics for the cointegration investigation, the results shown in Table 4 demonstrate that the calculated F-stat is considerably above the upper CV of [45]. Thus, at the statistically significant level of 1%, the model shows an exceeding of the upper CV. As a result, we concluded that the regressors and dependent variable are cointegrated.

4.3. ARDL Long and Short-Term Results

This section elucidates the results of the ARDL both in long- and short-term (see Table 5). As observed in Table 5, the coefficient of GDP was positive and significant, implying that a 0.869% (long-term) and a 0.161% (short-term) upsurge in GDP contributed to an intensification of LnCO2. In summary, in both the short- and long-term, an increase in ecological deterioration was caused by economic progress in China. Moreover, the coefficient of InINV was negative and significant, implying that a 0.869% (long-term) and 0.161% (short-term) upsurge in LnINV contributed to the mitigation of LnCO2 emissions with an insignificant association in the short-term. Therefore, in the long-term, a lessening in ecological deterioration was caused by an upsurge in technological innovation in China.
Furthermore, the effect of LnGLOB on LnCO2 emissions was negative, as shown by the negative and significant coefficients in both short- and long-term. This demonstrates that a 0.381% (long-term) and 0.789% (short-term) lessening of LnCO2 was caused by a 1% upsurge in LnGLOB. These outcomes further imply that decarbonisation in China can be achieved via an increase in globalization. As expected, the coefficient of LnREC was significant and negative, suggesting that a 0.789% (long-term) and 1.027% (short-term) upsurge in LnREC promoted ecological quality. Lastly, the coefficient of LnREM was significant and negative, demonstrating that a 1.208% (long-term) and 1.947% (short-term) upsurge in LnREM contributed to the mitigation of LnCO2. In summary, in both the short and long-term, the increase in ecological quality was caused by the inflow of remittances in China.
We have used 2009 as a dummy (DUM) variable in the estimate procedure to reflect the one structural break in CO2. Nevertheless, the DUM was negligible in both the short- and long-term results, demonstrating that structural discontinuities do not significantly affect CO2. Additionally, it was discovered that the ECT was significantly negative. This estimate, of 0.396, illustrated changes in the short-run equilibrium as it progressed toward achieving a long-run stable equilibrium, adjusted annually at a rate of 39%. It highlighted the feedback mechanism’s usefulness in stabilizing China’s CO2 emissions. Lastly, the post-estimation results uncovered no serial correlation issue or heteroskedasticity; the residuals were distributed normally and without misspecification. The stability tests (see Figure 1a,b) show that the model was stable at 5%.

4.4. Robustness Check Results

Additionally, FMOLS and DOLS were utilized in this research to strengthen the validity of the ARDL framework’s long-term results. While DOLS outperformed the FMOLS (Shahbaz et al., 2016) in some circumstances, two options were employed because we could not assess how the outcomes progressed consistently. The predicted outputs of FMOLS and DOLS are shown in Table 6. The FMOLS and DOLS results showed that they are reliable and consistent in sign and significance. As a result, they replicate the ARDL long-run outcomes in Table 5. The results uncovered that GDP intensified CO2 while LnGLOB, LnREC, LnINV, and LnREM lessen CO2 emissions. Consequently, the results may be utilized to formulate strategies with some degree of certainty.

4.5. Causality Results

The causality test results are shown in Figure 2. The outcomes show that in the long-term, LnREC can forecast LnCO2 (see Figure 2a) at 5% and 10% significance. Furthermore, in the short-term, LnREM can predict LnCO2 (see Figure 2b) at a 5% and 10% level of significance with no causality in the long- and medium-term. Likewise, in the short- and long-term, LnGDP can forecast LnCO2 (see Figure 2c) at a 10% level of significance. Similarly, in all frequencies, LnGLOB can forecast LnCO2 (see Figure 2d) at a 10% level of significance. Lastly, in all frequencies, LnINV can predict LnCO2 (see Figure 2e) at a 5% and 10% level of significance in the long-term.

4.6. Discussion of Results

As reported by ARDL, FMOLS, and DOLS, LnREM impacts LnCO2 negatively. The findings of [25,29,34] are in direct opposition to our findings. Conversely, our results are in line with the results of [24,28]. In this case, an upsurge in remittances has reduced CO2 emissions by producing minor and significant scaled impacts in a production process, which entails shifting to energy-efficient inputs at the level of SMEs and industries. Remittances are a source of revenue that directly raises individual income. For a household, the increase in income opens up two possibilities. The first relates to spending, while the other relates to saving [34]. The demand for goods rises when the expenditure trend is in effect, directly impacting the industrial sector and indirectly affecting energy usage. In times of active saving, people spend a portion of their higher income on interest payments from financial institutions. Again, indirect energy consumption arises due to these companies lending the money they have raised to industrial groups to earn interest revenue [48]. Considering all the evidence, our findings demonstrate that remittances tend to shift toward renewable energy sources.
The findings also demonstrate that GDP-based economic expansion correlates favorably with promoting larger CO2 emissions. This suggests that the strategies intended to boost economic activities in China are not ecologically friendly and that these unsuitable measures do not support China’s goal of becoming carbon neutral. This finding aligns with the views put forward by [9,17,49,50], in which the researchers affirmed that economic progress lessens environmental quality.
Energy is also a major factor in any economy’s ability to advance economically. In essence, it is a crucial input for both consumption and production. People’s daily lives are significantly impacted by energy. As such, we added renewable energy to the model to see if it affects CO2 emissions. The results showed that changes in China’s usage of renewable energy decreased the nation’s CO2 emissions. Our results support the claim made by [51,52] that REC can enhance ecological quality. Other research by [53] also demonstrated the negative effect of REC on CO2 emissions, which matches our discoveries. They did, nevertheless, discover a short-term positive connection, which is distinct from our findings. This difference might be due to the fact that their study used data from the United States, while our analysis was conducted using data from China.
Our findings demonstrate the emissions-reducing effect of globalization. The principal defense is that lowering the obstacles created by international boundaries encourages the exchange of commodities and more environmentally friendly new technologies [54,55]. Parallel to this, there is a widespread assumption backed up by some proof that information will enhance concern and advocacy for ecological quality. Thus, environmental degradation should be reduced as society becomes more knowledgeable [14,56].
The results of this study showed a negative correlation between INV and CO2. These findings highlight the importance of implementing new technologies in the nation’s industrial sector to foster an environment conducive to industrial transformation. These results offer crucial information for formulating policies that comply with the decisions made at the worldwide climate change conference (COP21). Our outcomes are consistent with (REF) research, which showed how innovation could help China reduce its CO2 emissions. The premise of our analysis is in accordance with [35]’s suggestion of the important contribution of R&D spending to ecological deterioration. Ullah et al.’s [2] findings, in contrast, diverge from our conclusions in that they discovered that while technological development does lower CO2, its impact on the environment is negligible. In contrast, our results demonstrate that the outcomes are significant. Additionally, [57,58] discovered outcomes that differed from our investigation. This research was carried out because the conclusions of earlier studies were ambiguous. As a result, our research’s findings offer important information for formulating policy and are reliable because they were obtained using cutting-edge methods [59,60]. These results provide a useful starting point for the nation’s innovation and ecological policy development.
Furthermore, in the long-term, there is evidence of causality from remittances, globalization, renewable energy use, economic growth, and technological innovation to CO2 emissions in China. These interesting findings show that in the long-term, policies formulated to reduce CO2 emissions must take into account the role of remittances, globalization, renewable energy use, economic growth, and technological innovation.

5. Conclusions and Policy Implications

5.1. Conclusions

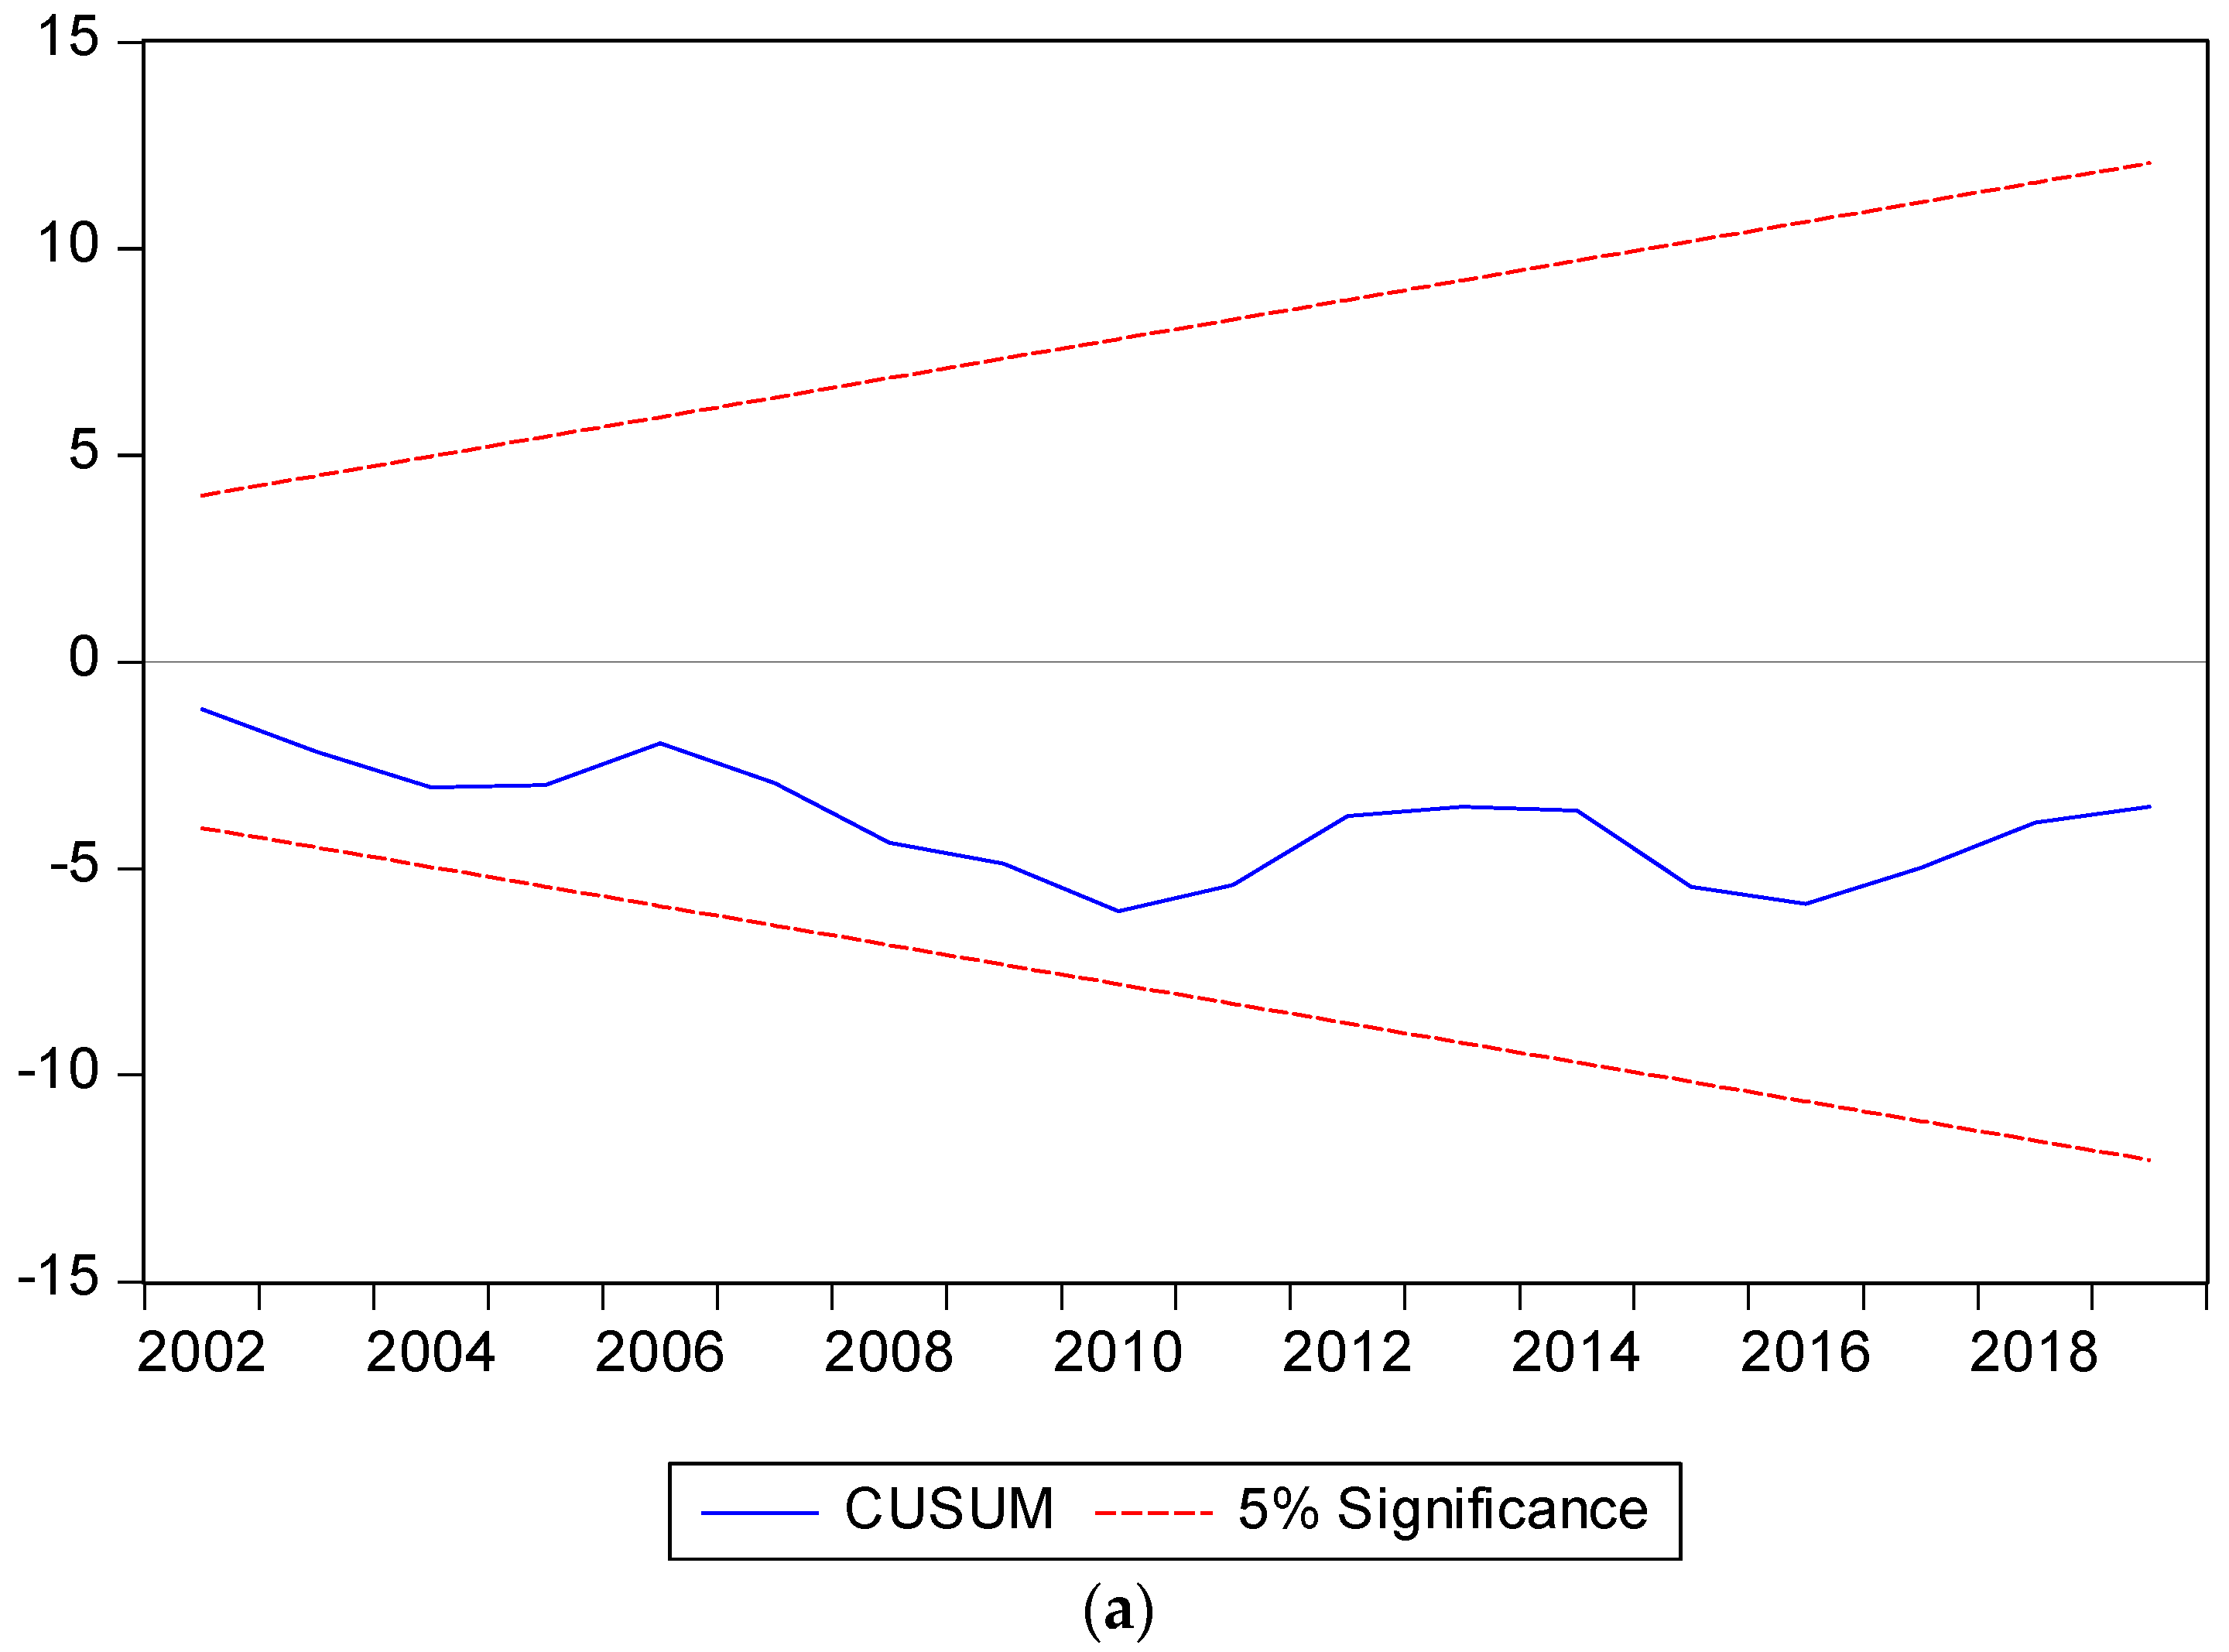
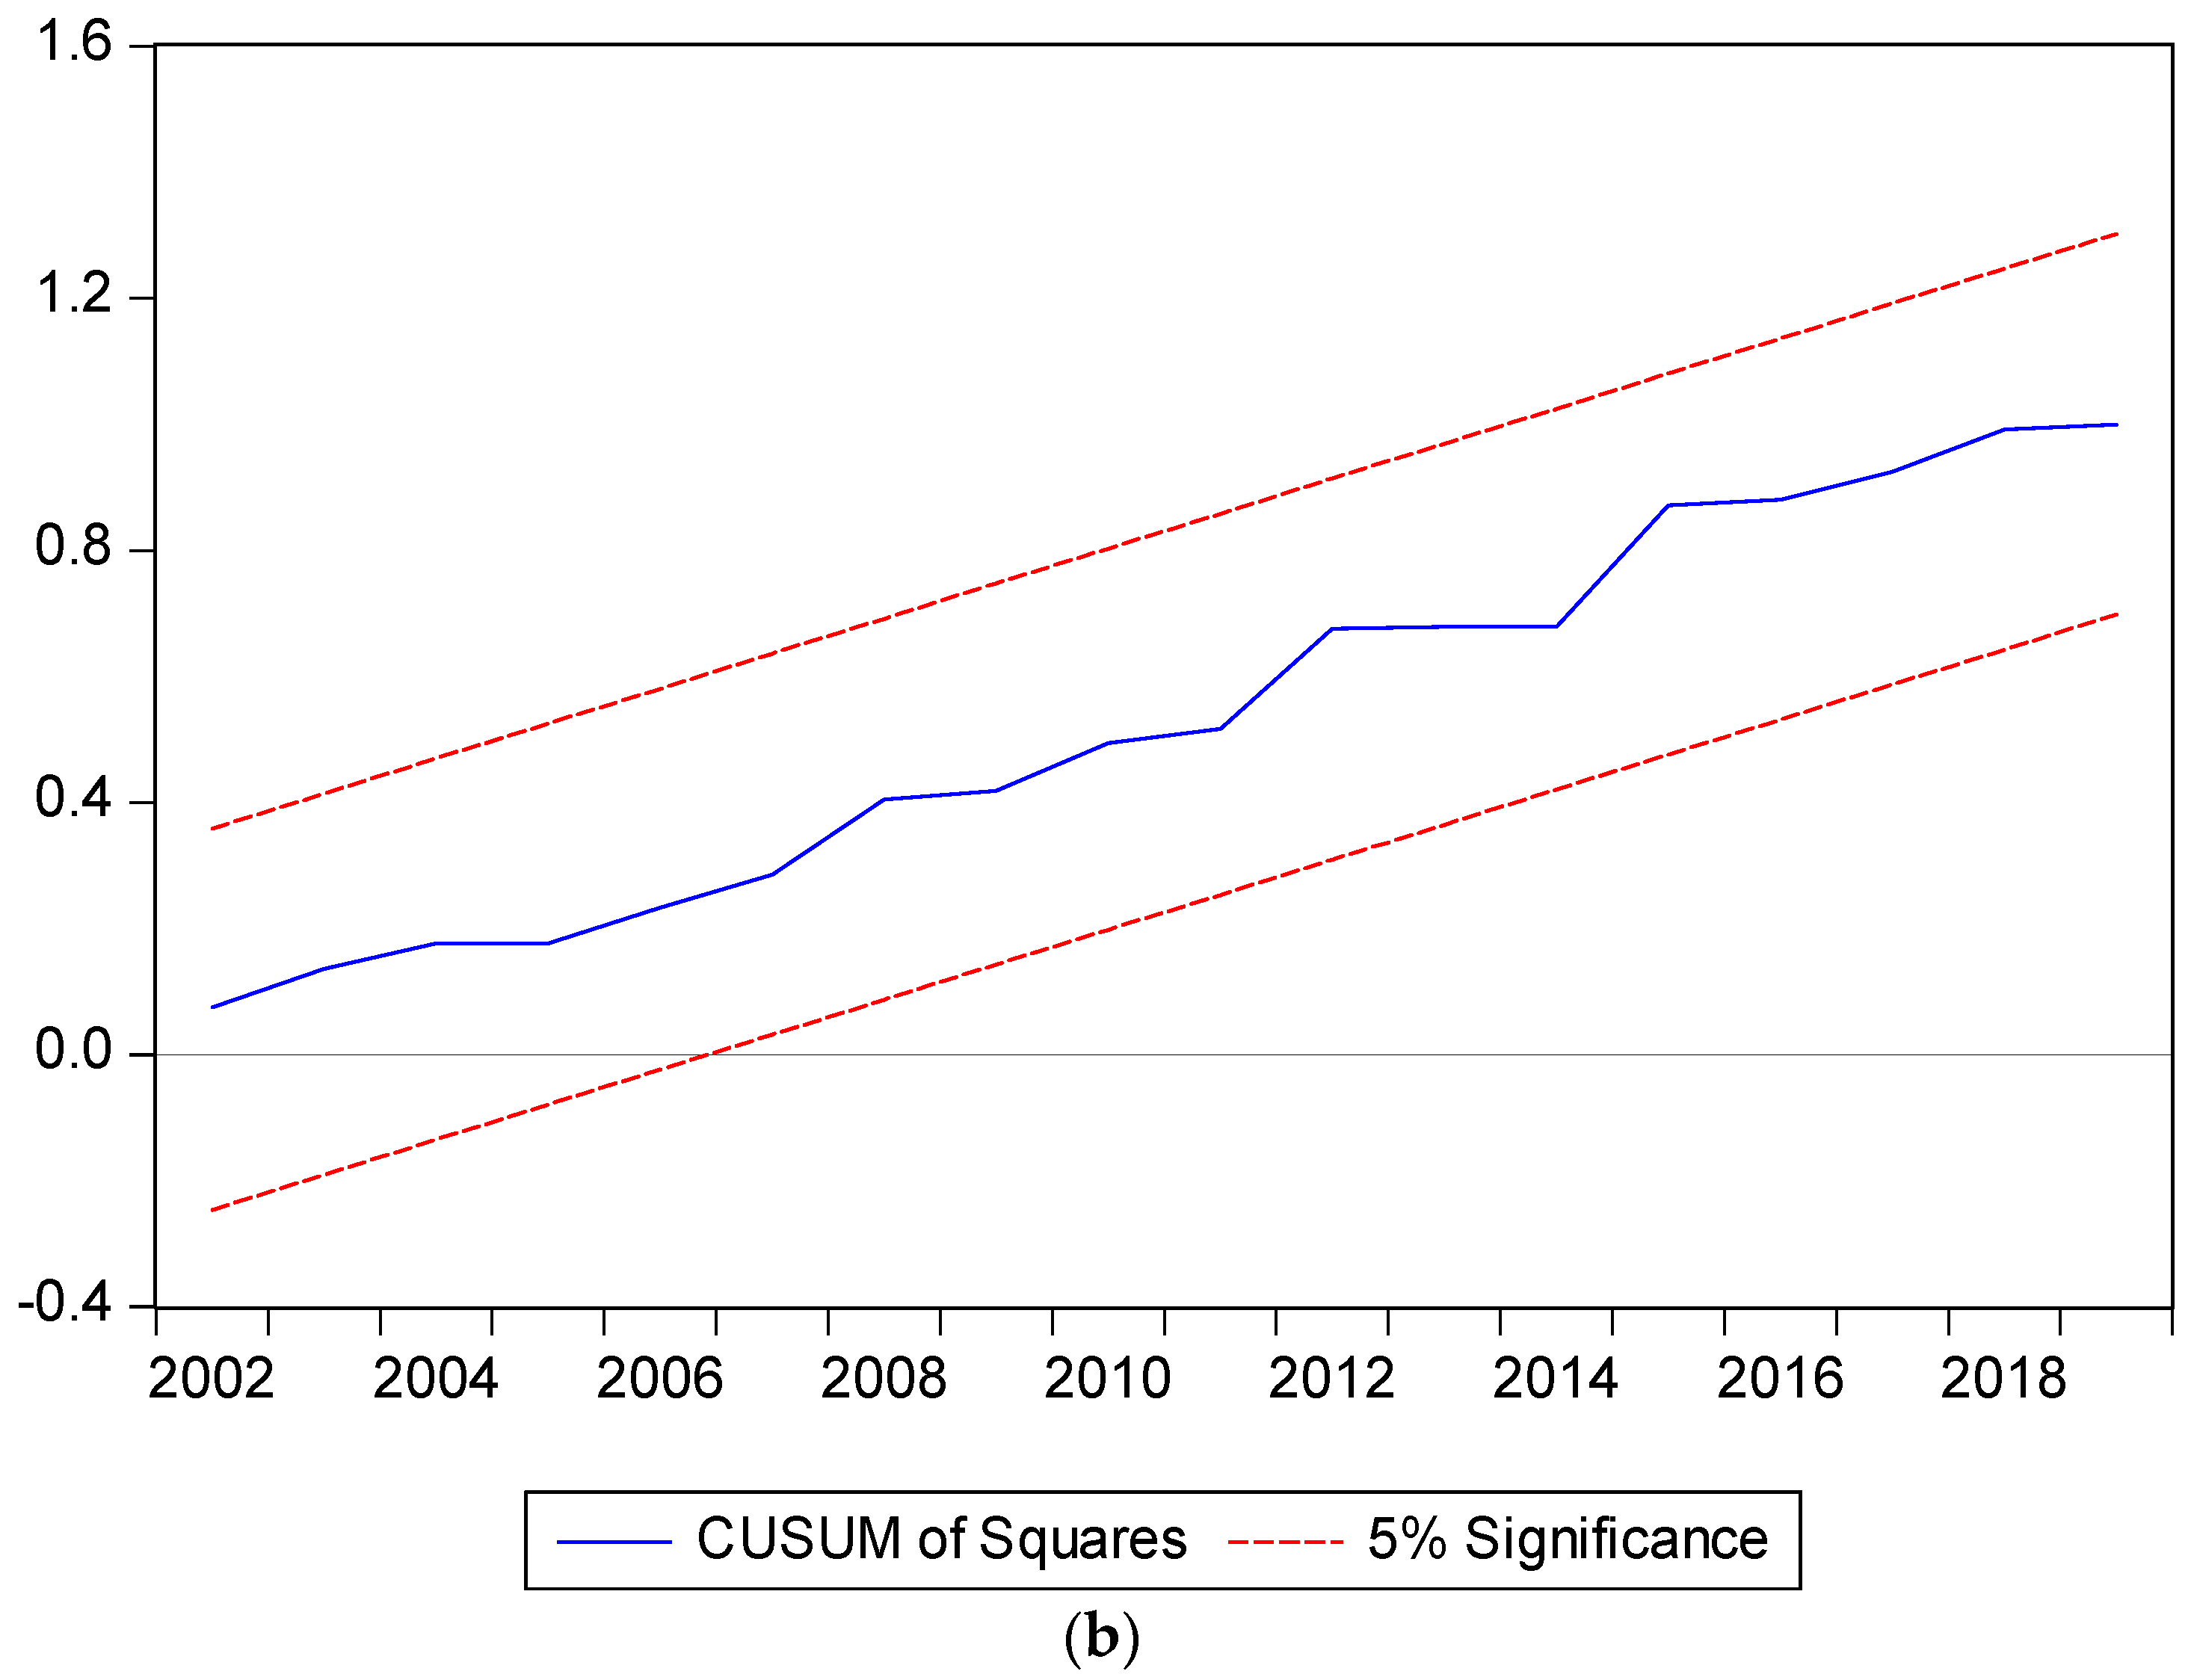
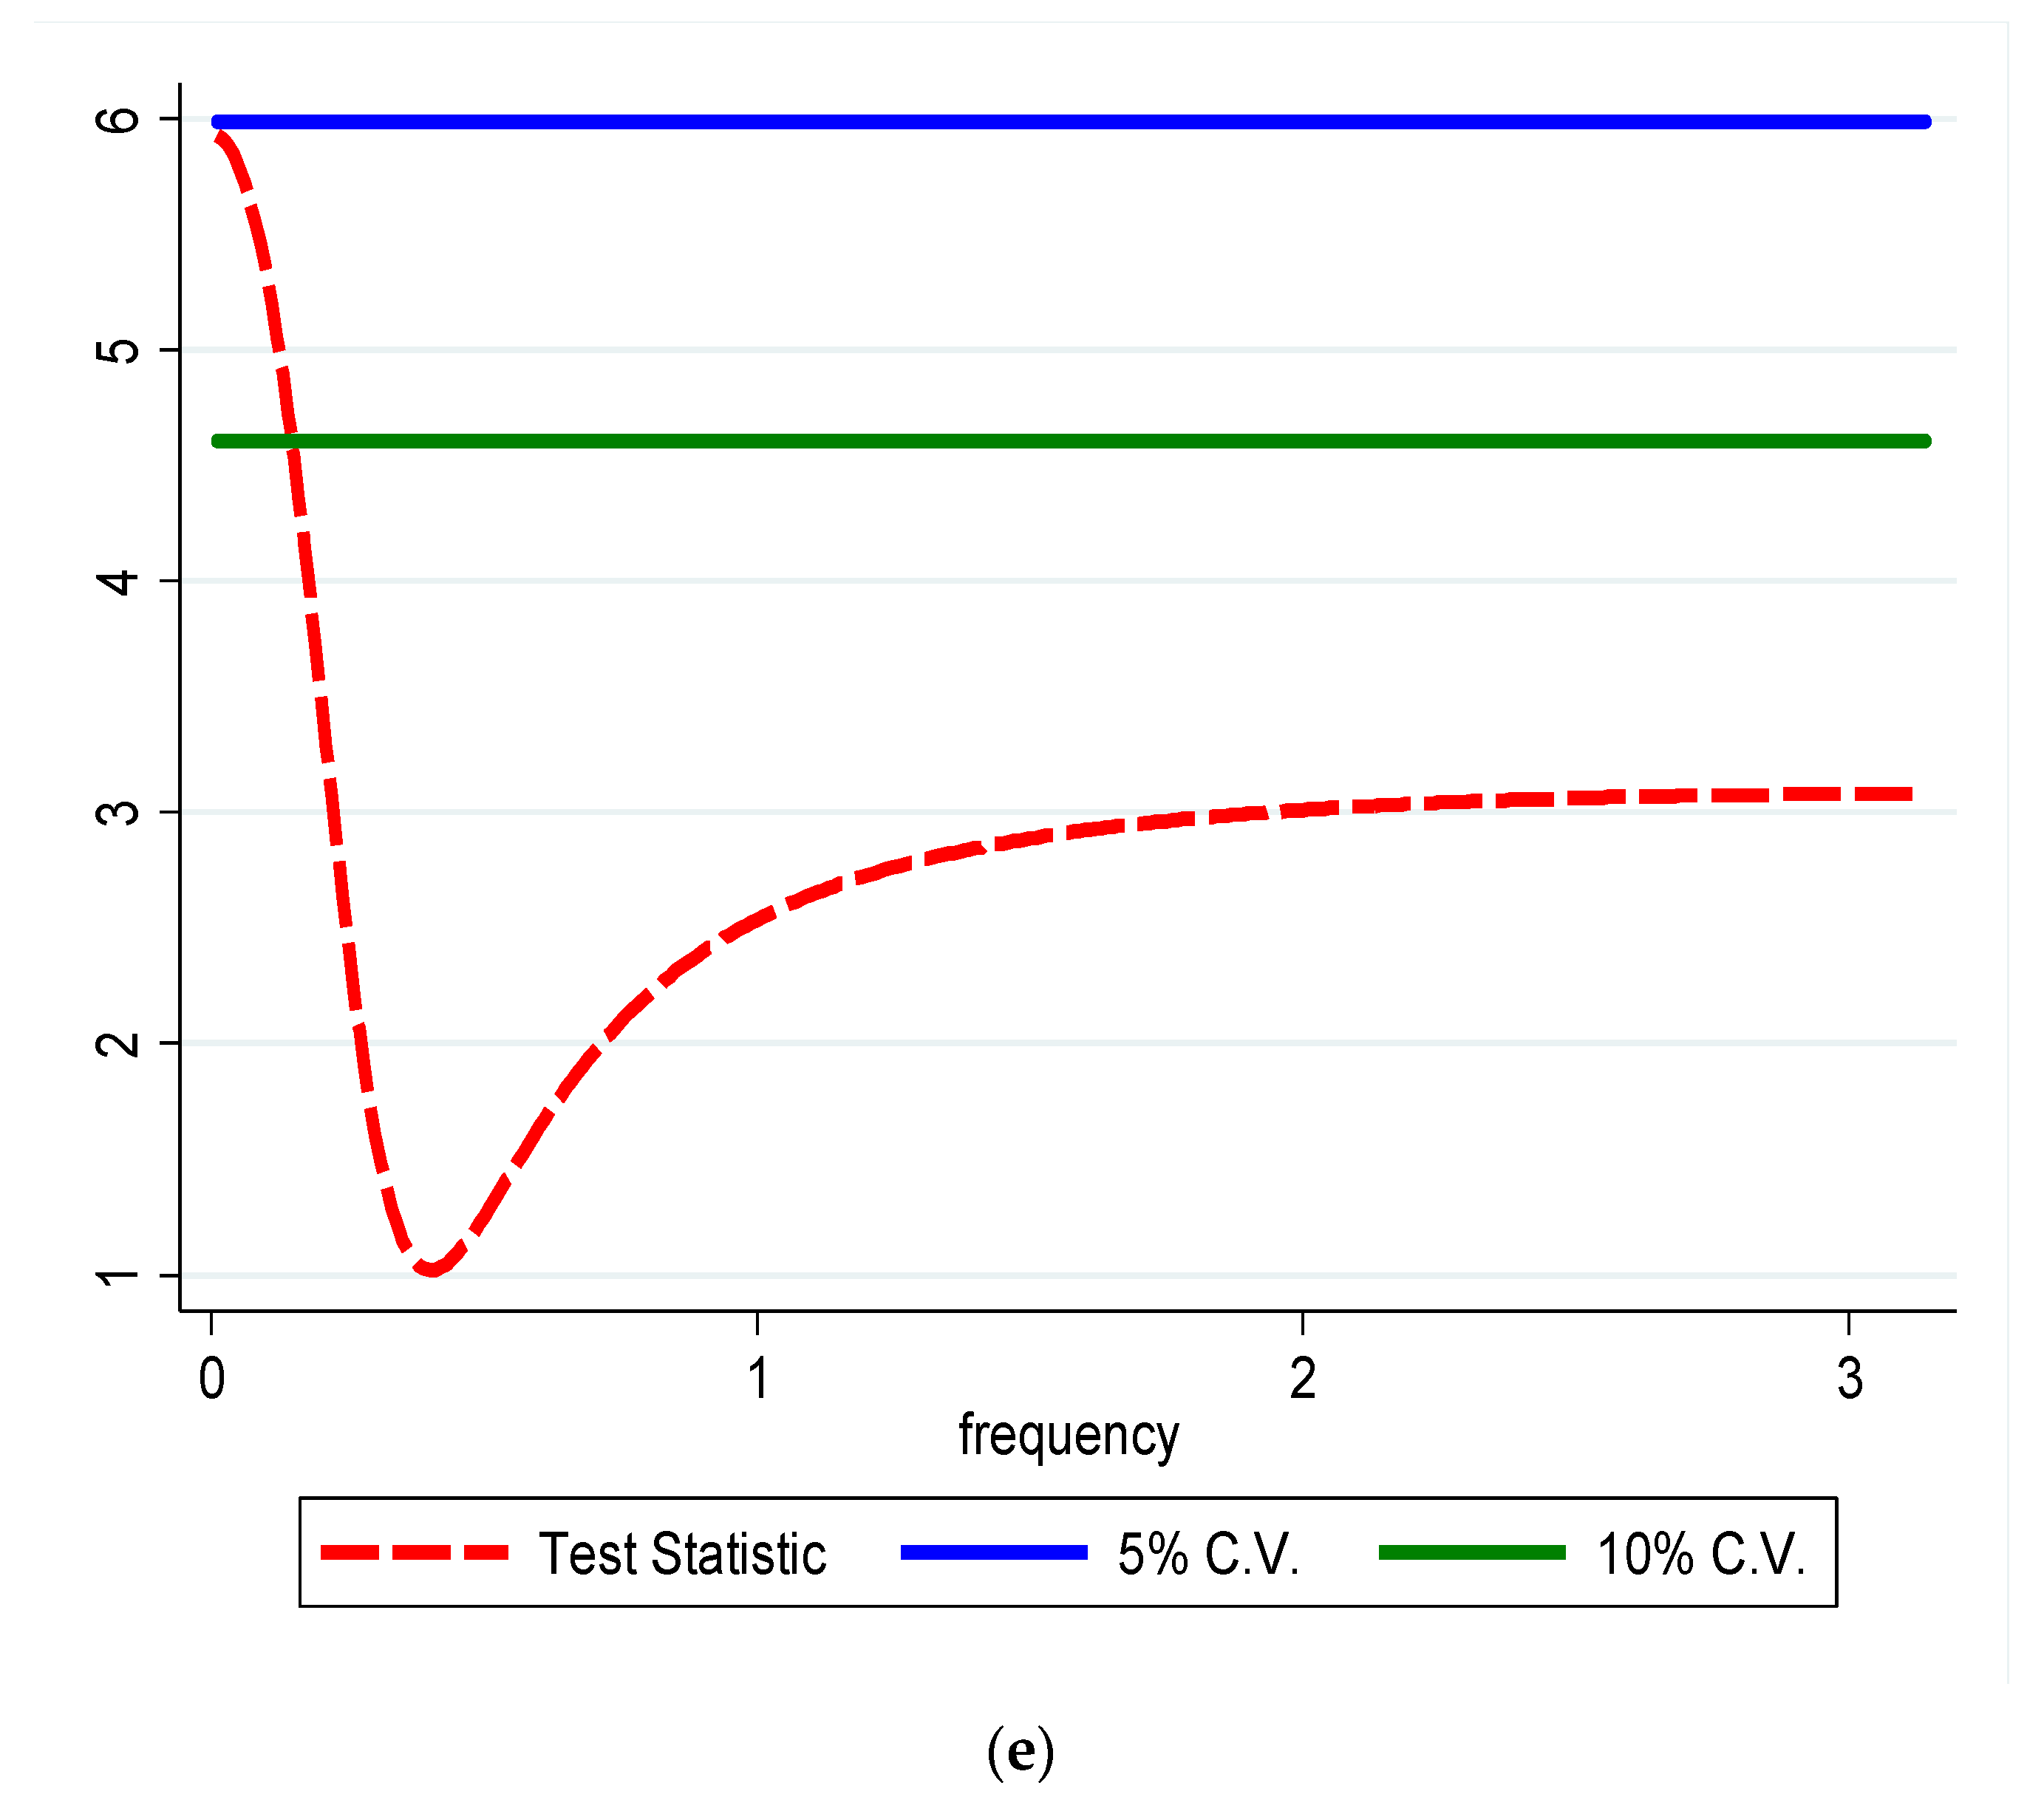
This study examined the effect of remittance and renewable energy on CO2 emissions in China by considering other drivers such as economic growth and technological innovation. The study uses data spanning between 1990 and 2019. The study used an autoregressive distributed lag model (ARDL) as well as the FMOLS and DOLS long-run estimators as a robustness check. Furthermore, unlike prior studies that employ the time domain causality, we employed frequency domain causality, which considers causality at different frequencies. The results of the ARDL, FMOLS, and DOLS revealed that economic growth amplifies CO2 emissions while green energy, remittances, and globalization lessens them. Furthermore, the causality results show that remittances, globalization, renewable energy use, economic growth, and technological innovation can predict CO2 emissions in the long-term.

5.2. Policy Recommendations

The research’s findings suggest potentially significant policy ramifications. The research encourages policymakers to develop strategies to prevent the harmful impacts of remittances on the ecosystem by revealing a negative correlation between emissions and remittances. For example, individuals can be given incentives to use remittance money to buy environmentally friendly home appliances. Parallel to this, China may consider making its current emission control rules more stringent. Ultimately, the report recommends that ecological quality improvement activities be scaled following an upsurge in remittance inflows.
In terms of its ramifications for policy, this research suggests that China incorporate R&D and technological innovation linked with its 2060 carbon neutrality objective to make it more feasible. The Chinese government should concurrently increase R&D spending levels and encourage the private sector to fund R&D for the creation of technologies that promote ecological welfare. The government should focus on creating green technologies in this respect so that China can quickly attain low-carbon growth. In order to gradually eliminate the detrimental effects of economic expansion on the ecosystem, China should also look forward to promoting green economic activities. For example, it is advised that China invest in the construction of renewable energy facilities rather than building new coal power plants.
Thirdly, our analysis shows overwhelming evidence that renewable energy lowers emissions. Irrespective of a country’s emission situation, renewable energy sources reduce emissions in all circumstances. Renewable energy, nevertheless, has significant infrastructural needs. However, once they are installed, these technologies gradually recuperate their expenses. China needs to stabilize its energy supply, beginning with less expensive renewable energy sources. Therefore, investment in renewable energy is needed in China. Furthermore, since renewable energy is driven by technological innovations in the tides of biomass, geothermal, wind, and solar, investment in green technologies will boost renewable energy and as a result improve ecological quality.
Lastly, environmental degradation has grown along with economic progress, showing that green growth has not yet started in China. Currently, a shift to a green economy is essential for sustainable development. As a result, policymakers in China should not be reluctant to employ some instruments in this regard: (i) Tax reductions should be reduced or stopped to boost remittances; (ii) The financial industry should be encouraged and assisted in creating internet applications; (iii) All private and public sectors, particularly educational institutions, should obtain training on ecological consciousness to promote ecological consciousness.

Author Contributions

Conceptualization, C.B.S., F.R.H., S.A.A. and H.D.; methodology, C.B.S., F.R.H., S.A.A., H.D., E.B.A. and P.A.; software, C.B.S., F.R.H., S.A.A., H.D., E.B.A. and P.A.; validation, C.B.S., F.R.H., S.A.A., H.D., E.B.A. and P.A.; formal analysis, C.B.S., F.R.H., S.A.A., H.D., E.B.A. and P.A.; investigation, C.B.S., F.R.H., S.A.A., H.D., E.B.A. and P.A.; resources C.B.S., F.R.H., S.A.A., H.D., E.B.A. and P.A.; data curation, C.B.S., F.R.H., S.A.A., H.D., E.B.A. and P.A.; writing—original draft preparation, C.B.S., F.R.H., S.A.A., H.D., E.B.A. and P.A.; writing—review and editing, C.B.S., F.R.H., S.A.A., H.D., E.B.A. and P.A.; project administration, E.B.A. and P.A.; funding acquisition, E.B.A. and P.A. All authors have read and agreed to the published version of the manuscript.

Funding

The research funding from the Ministry of Science and Higher Education of the Russian Federation (Ural Federal University Program of Development within the Priority-2030 Program) is gratefully acknowledged. The youth laboratory with Grant number: FEUZ-2022-0031.

Institutional Review Board Statement

Not applicable.

Informed Consent Statement

Not applicable.

Data Availability Statement

The sources of data used are provided in the main text.

Conflicts of Interest

The authors declare no conflict of interest.

Abbreviations

ADFAugmented Dickey Fuller
CO2Carbon Emissions
DUMDummy
GDPEconomic Growth
GLOBGlobalisation
INVTechnological Innovation
PPPhillip Perron
RECRenewable Energy Consumption
REMRemittances
SDGsSustainable Development Goals

References

  1. AbdulKareem, H.K.K.; Bilal; Kirikkaleli, D.; Shah, M.I.; Abbas, S. CO2 Behavior amidst the COVID-19 Pandemic in the United Kingdom: The Role of Renewable and Non-Renewable Energy Development. Renew. Energy 2022, 189, 492–501. [Google Scholar] [CrossRef]
  2. Ullah, S.; Luo, R.; Kartal, M.T. Dynamics between Environmental Taxes and Ecological Sustainability: Evidence from Top-Seven Green Economies by Novel Quantile Approaches. Sustain. Dev. 2022, 4, 12–26. [Google Scholar] [CrossRef]
  3. Adebayo, T.S.; Kirikkaleli, D. Impact of Renewable Energy Consumption, Globalization, and Technological Innovation on Environmental Degradation in Japan: Application of Wavelet Tools. Env. Dev. Sustain 2021, 23, 16057–16082. [Google Scholar] [CrossRef]
  4. Awosusi, A.A.; Altuntaş, M.; Agyekum, E.B.; Zawbaa, H.M.; Kamel, S. The Dynamic Impact of Biomass and Natural Resources on Ecological Footprint in BRICS Economies: A Quantile Regression Evidence. Energy Rep. 2022, 8, 1979–1994. [Google Scholar] [CrossRef]
  5. Samour, A.; Moyo, D.; Tursoy, T. Renewable Energy, Banking Sector Development, and Carbon Dioxide Emissions Nexus: A Path toward Sustainable Development in South Africa. Renew. Energy 2022, 193, 1032–1040. [Google Scholar] [CrossRef]
  6. Lin, X.; Zhao, Y.; Ahmad, M.; Ahmed, Z.; Rjoub, H.; Adebayo, T.S. Linking Innovative Human Capital, Economic Growth, and CO2 Emissions: An Empirical Study Based on Chinese Provincial Panel Data. Int. J. Environ. Res. Public Health 2021, 18, 8503. [Google Scholar] [CrossRef]
  7. Soylu, Ö.B.; Kirikkaleli, D. The Imperativeness of Environmental Quality in China Amidst Renewable Energy Consumption and Trade Openness. Sustainability 2021, 13, 5054. [Google Scholar] [CrossRef]
  8. Shahbaz, M.; Shahzad, S.J.H.; Ahmad, N.; Alam, S. Financial Development and Environmental Quality: The Way Forward. Energy Policy 2016, 98, 353–364. [Google Scholar] [CrossRef] [Green Version]
  9. Ojekemi, O.S.; Rjoub, H.; Awosusi, A.A.; Agyekum, E.B. Toward a Sustainable Environment and Economic Growth in BRICS Economies: Do Innovation and Globalization Matter? Env. Sci. Pollut. Res. 2022, 29, 57740–57757. [Google Scholar] [CrossRef]
  10. Kirikkaleli, D.; Oyebanji, M.O. Consumption-Based Carbon Emissions, Trade, and Globalization: An Empirical Study of Bolivia. Env. Sci. Pollut. Res. 2022, 29, 29927–29937. [Google Scholar] [CrossRef]
  11. Pata, U.K.; Samour, A. Do Renewable and Nuclear Energy Enhance Environmental Quality in France? A New EKC Approach with the Load Capacity Factor. Prog. Nucl. Energy 2022, 149, 104249. [Google Scholar] [CrossRef]
  12. Acheampong, A.O. Economic Growth, CO2 Emissions and Energy Consumption: What Causes What and Where? Energy Econ. 2018, 74, 677–692. [Google Scholar] [CrossRef]
  13. Ozturk, I.; Acaravci, A. Energy Consumption, CO2 Emissions, Economic Growth, and Foreign Trade Relationship in Cyprus and Malta. Energy Sources Part B Econ. Plan. Policy 2016, 11, 321–327. [Google Scholar] [CrossRef]
  14. Destek, M.A.; Sarkodie, S.A. Investigation of Environmental Kuznets Curve for Ecological Footprint: The Role of Energy and Financial Development. Sci. Total Environ. 2019, 650, 2483–2489. [Google Scholar] [CrossRef] [PubMed]
  15. Zhang, Q.; Ibrahim, R.L.; Al-Faryan, M.A.S. Do the Asymmetric Effects of Technological Innovation amidst Renewable and Nonrenewable Energy Make or Mar Carbon Neutrality Targets? Int. J. Sustain. Dev. World Ecol. 2022, 3, 1–13. [Google Scholar] [CrossRef]
  16. He, X.; Kirikkaleli, D.; Umar, M. Consumption-Based Carbon Emissions in Mexico: An Analysis Using the Dual Adjustment Approach. Sustain. Prod. Consum. 2021, 27, 947–957. [Google Scholar] [CrossRef]
  17. Kirikkaleli, D.; Güngör, H.; Adebayo, T.S. Consumption-Based Carbon Emissions, Renewable Energy Consumption, Financial Development and Economic Growth in Chile. Bus. Strategy Environ. 2022, 31, 1123–1137. [Google Scholar] [CrossRef]
  18. Irfan, M.; Cai, J.; Dördüncü, H.; Shahzad, F. Analyzing the Mechanism between Nuclear Energy Consumption and Carbon Emissions: Fresh Insights from Novel Bootstrap Rolling-Window Approach. Energy Environ. 2022, 4, 0958305X221133260. [Google Scholar] [CrossRef]
  19. Wang, C.; Raza, S.A.; Yi, S.; Shah, M.I. The Roles of Hydro, Nuclear and Biomass Energy towards Carbon Neutrality Target in China: A Policy-Based Analysis. Energy 2022, 262, 125303. [Google Scholar] [CrossRef]
  20. Alola, A.A.; Adebayo, T.S. Are Green Resource Productivity and Environmental Technologies the Face of Environmental Sustainability in the Nordic Region? Sustain. Dev. 2022, 2, 1–13. [Google Scholar] [CrossRef]
  21. Gyamfi, B.A.; Adebayo, T.S.; Bekun, F.V.; Agboola, M.O. Sterling Insights into Natural Resources Intensification, Ageing Population and Globalization on Environmental Status in Mediterranean Countries. Energy Environ. 2022, 4, 216–231. [Google Scholar] [CrossRef]
  22. Gyamfi, B.A.; Bekun, F.V.; Rjoub, H.; Agboola, M.O.; Agyekum, E.B. Another Look at the Nexus between Economic Growth Trajectory and Emission within the Context of Developing Country: Fresh Insights from a Nonparametric Causality-in-Quantiles Test. Environ. Dev Sustain 2022, 3, 65–80. [Google Scholar] [CrossRef]
  23. Kirikkaleli, D.; Adebayo, T.S. Do Renewable Energy Consumption and Financial Development Matter for Environmental Sustainability? New Global Evidence. Sustain. Dev. 2021, 29, 583–594. [Google Scholar] [CrossRef]
  24. Wang, Z.; Zaman, S.; Uz Zaman, Q.; Rasool, S.F. Impact of Remittances on Carbon Emission: Fresh Evidence from a Panel of Five Remittance-Receiving Countries. Environ. Sci Pollut Res 2021, 28, 52418–52430. [Google Scholar] [CrossRef] [PubMed]
  25. Zafar, M.W.; Saleem, M.M.; Destek, M.A.; Caglar, A.E. The Dynamic Linkage between Remittances, Export Diversification, Education, Renewable Energy Consumption, Economic Growth, and CO2 Emissions in Top Remittance-Receiving Countries. Sustain. Dev. 2022, 30, 165–175. [Google Scholar] [CrossRef]
  26. Neog, Y.; Yadava, A.K. Nexus among CO2 Emissions, Remittances, and Financial Development: A NARDL Approach for India. Environ. Sci Pollut Res 2020, 27, 44470–44481. [Google Scholar] [CrossRef]
  27. Awosusi, A.A.; Xulu, N.G.; Ahmadi, M.; Rjoub, H.; Altuntaş, M.; Uhunamure, S.E.; Akadiri, S.S.; Kirikkaleli, D. The Sustainable Environment in Uruguay: The Roles of Financial Development, Natural Resources, and Trade Globalization. Front. Environ. Sci. 2022, 10, 875577. [Google Scholar] [CrossRef]
  28. Ahmad, M.; Ul Haq, Z.; Khan, Z.; Khattak, S.I.; Ur Rahman, Z.; Khan, S. Does the Inflow of Remittances Cause Environmental Degradation? Empirical Evidence from China. Econ. Res.-Ekon. Istraživanja 2019, 32, 2099–2121. [Google Scholar] [CrossRef] [Green Version]
  29. Khan, Z.U.; Ahmad, M.; Khan, A. On the Remittances-Environment Led Hypothesis: Empirical Evidence from BRICS Economies. Environ. Sci Pollut Res 2020, 27, 16460–16471. [Google Scholar] [CrossRef]
  30. Dong, K.; Sun, R.; Dong, X. CO2 Emissions, Natural Gas and Renewables, Economic Growth: Assessing the Evidence from China. Sci. Total Environ. 2018, 640–641, 293–302. [Google Scholar] [CrossRef]
  31. Dong, C.; Dong, X.; Jiang, Q.; Dong, K.; Liu, G. What Is the Probability of Achieving the Carbon Dioxide Emission Targets of the Paris Agreement? Evidence from the Top Ten Emitters. Sci. Total Environ. 2018, 622–623, 1294–1303. [Google Scholar] [CrossRef] [PubMed]
  32. WRI China Releases New Climate Commitment Ahead of COP26 World Resources Institute. 2021. Available online: https://www.wri.org/news/statement-china-releases-new-climate-commitment-ahead-cop26 (accessed on 5 June 2022).
  33. Breitung, J.; Candelon, B. Testing for Short- and Long-Run Causality: A Frequency-Domain Approach. J. Econom. 2006, 132, 363–378. [Google Scholar] [CrossRef]
  34. Yang, B.; Jahanger, A.; Khan, M.A. Does the Inflow of Remittances and Energy Consumption Increase CO2 Emissions in the Era of Globalization? A Global Perspective. Air Qual. Atmos. Health 2020, 13, 1313–1328. [Google Scholar] [CrossRef]
  35. Lin, B.; Zhu, J. Determinants of Renewable Energy Technological Innovation in China under CO2 Emissions Constraint. J. Environ. Manag. 2019, 247, 662–671. [Google Scholar] [CrossRef]
  36. Godil, D.I.; Yu, Z.; Sharif, A.; Usman, R.; Khan, S.A.R. Investigate the Role of Technology Innovation and Renewable Energy in Reducing Transport Sector CO2 Emission in China: A Path toward Sustainable Development. Sustain. Dev. 2021, 29, 694–707. [Google Scholar] [CrossRef]
  37. Shan, S.; Genç, S.Y.; Kamran, H.W.; Dinca, G. Role of Green Technology Innovation and Renewable Energy in Carbon Neutrality: A Sustainable Investigation from Turkey. J. Environ. Manag. 2021, 294, 113004. [Google Scholar] [CrossRef]
  38. Rahman, M.M.; Nepal, R.; Alam, K. Impacts of Human Capital, Exports, Economic Growth and Energy Consumption on CO2 Emissions of a Cross-Sectionally Dependent Panel: Evidence from the Newly Industrialized Countries (NICs). Environ. Sci. Policy 2021, 121, 24–36. [Google Scholar] [CrossRef]
  39. Adebayo, T.S. Environmental Consequences of Fossil Fuel in Spain amidst Renewable Energy Consumption: A New Insights from the Wavelet-Based Granger Causality Approach. Int. J. Sustain. Dev. World Ecol. 2022, 12, 1–14. [Google Scholar] [CrossRef]
  40. World Bank. World Developmental Indicator; World Bank: Washington, DC, USA, 2022. [Google Scholar]
  41. Gygli, S.; Haelg, F.; Potrafke, N.; Sturm, J.-E. The KOF Globalisation Index—Revisited. Rev. Int. Organ 2019, 14, 543–574. [Google Scholar] [CrossRef] [Green Version]
  42. BP British Petroleum. 2022. Available online: https://www.bp.com/content/dam/bp/business-sites/en/global/corporate/pdfs/energy-economics/statistical-review/bp-stats-review-2022-full-report.pdf (accessed on 10 April 2022).
  43. Pesaran, M.H.; Shin, Y.; Smith, R.J. Bounds Testing Approaches to the Analysis of Level Relationships. J. Appl. Econom. 2001, 16, 289–326. [Google Scholar] [CrossRef]
  44. Pesaran, M.H. An Autoregressive Distributed Lag Modelling Approach to Cointegration Analysis. In Proceedings of the Centennial of RagnarFrisch, The Norwegian Academy of Science and Letters, Oslo, Norwegian, 3–5 March 1995; Cambridge University: Cambridge, UK, 1999; pp. 134–150. [Google Scholar]
  45. Pesaran, M.H.; Shin, Y.; Smith, R.J. Testing for the “Existence of a Long-Run Relationship”; Cambridge Working Papers in Economics; Faculty of Economics, University of Cambridge: Cambridge, UK, 1996. [Google Scholar]
  46. Narayan, P.K. The Saving and Investment Nexus for China: Evidence from Cointegration Tests. Appl. Econ. 2005, 37, 1979–1990. [Google Scholar] [CrossRef]
  47. Zivot, E.; Andrews, D.W.K. Further Evidence on the Great Crash, the Oil-Price Shock, and the Unit-Root Hypothesis. J. Bus. Econ. Stat. 2002, 20, 25–44. [Google Scholar] [CrossRef]
  48. Abbasi, F.; Riaz, K. CO2 Emissions and Financial Development in an Emerging Economy: An Augmented VAR Approach. Energy Policy 2016, 90, 102–114. [Google Scholar] [CrossRef]
  49. Wu, L.; Yue, X.-G.; Umut, A. The Role of Renewable Energy Consumption and Financial Development in Environmental Sustainability: Implications for the Nordic Countries. Int. J. Sustain. Dev. World Ecol. 2022, 6, 1–16. [Google Scholar] [CrossRef]
  50. Altuntaş, M.; Awosusi, A.A.; Kirikkaleli, D. Role of Technological Innovation and Globalization in BRICS Economies: Policy towards Environmental Sustainability. Int. J. Sustain. Dev. World Ecol. 2022, 11, 1–18. [Google Scholar] [CrossRef]
  51. Qin, L.; Hou, Y.; Miao, X.; Zhang, X.; Rahim, S.; Kirikkaleli, D. Revisiting Financial Development and Renewable Energy Electricity Role in Attaining China’s Carbon Neutrality Target. J. Environ. Manag. 2021, 297, 113335. [Google Scholar] [CrossRef]
  52. Kartal, M.T. Production-Based Disaggregated Analysis of Energy Consumption and CO2 Emission Nexus: Evidence from the USA by Novel Dynamic ARDL Simulation Approach. Environ. Sci. Pollut. Res. 2022, 3, 2015–2028. [Google Scholar] [CrossRef]
  53. Onifade, S.T.; Alola, A.A.; Muoneke, O.B. Does It Take International Integration of Natural Resources to Ascend the Ladder of Environmental Quality in the Newly Industrialized Countries? Resour. Policy 2022, 76, 102616. [Google Scholar] [CrossRef]
  54. Ngoc, H.T.; Tuan, B.A.; Duy, N.V.; Kien, D.T.; Dat, N.N. Impact of Foreign Direct Investment and Urbanisation on CO2 Emissions in Vietnam. Int. J. Bus. Glob. 2021, 27, 313–332. [Google Scholar] [CrossRef]
  55. Yameogo, C.E.W.; Omojolaibi, J.A.; Dauda, R.O.S. Economic Globalisation, Institutions and Environmental Quality in Sub-Saharan Africa. Res. Glob. 2021, 3, 100035. [Google Scholar] [CrossRef]
  56. Alola, A.A.; Bekun, F.V.; Sarkodie, S.A. Dynamic Impact of Trade Policy, Economic Growth, Fertility Rate, Renewable and Non-Renewable Energy Consumption on Ecological Footprint in Europe. Sci. Total Environ. 2019, 685, 702–709. [Google Scholar] [CrossRef] [PubMed]
  57. Magazzino, C.; Giolli, L. The Relationship among Railway Networks, Energy Consumption, and Real Added Value in Italy. Evidence Form ARDL and Wavelet Analysis. Res. Transp. Econ. 2021, 90, 101126. [Google Scholar] [CrossRef]
  58. Mutascu, M.I.; Albulescu, C.T.; Apergis, N.; Magazzino, C. Do Gasoline and Diesel Prices Co-Move? Evidence from the Time–Frequency Domain. Environ. Sci. Pollut. Res. 2022, 29, 68776–68795. [Google Scholar] [CrossRef] [PubMed]
  59. Agyekum, E.B.; Altuntaş, M.; Khudoyqulov, S.; Zawbaa, H.M.; Kamel, S. Does Information and Communication Technology Impede Environmental Degradation? Fresh Insights from Non-Parametric Approaches. Heliyon 2022, 8, e09108. [Google Scholar] [CrossRef]
  60. Fareed, Z.; Rehman, M.A.; Wang, Y.; Ahmad, M.; Shahzad, F. Financial Inclusion and the Environmental Deterioration in Eurozone: The Moderating Role of Innovation Activity. Technol. Soc. 2022, 69, 101961. [Google Scholar] [CrossRef]
Figure 1. (a): CUSUM of the model. (b): CUSUM of Squares of the model.
Sustainability 14 14629 g001aSustainability 14 14629 g001b
Figure 2. (a) Causality from LnREC to LnCO2; (b) Causality from LnREM to LnCO2; (c) Causality from LnREM to LnCO2; (d) Causality from LnGLOB to LnCO2; (e) Causality from LnINV to LnCO2.
Sustainability 14 14629 g002aSustainability 14 14629 g002bSustainability 14 14629 g002c
Table 1. Variables Description.
SignVariablesMeasurementSources
GDPEconomic GrowthConstant 2010 US$World Bank [40]
GLOBGlobalisationIndexKOF [41]
RECRenewable EnergyRenewable energy consumption (% of total final energy consumption)World Bank [40]
REMRemittancePersonal remittances received (% of GDP)World Bank [40]
INVInnovationNumber of patent applicationWorld Bank [40]
CO2Carbon EmissionsMetric tonnes per capitaBP [42]
Table 2. Descriptive Statistics.
LnCO2LnGDPLnGLOBLnRECLnREMLnINV
Mean1.398829.0743.98892.9814−1.879511.410
Median1.435829.0634.07252.9314−1.727611.317
Maximum2.028930.2914.16763.5288−0.739714.194
Minimum0.649427.6583.58662.4283−3.39838.6712
Std. Dev.0.50000.81340.18370.42270.62891.8841
Skewness−0.0414−0.1102−0.7959−0.0056−0.77770.1143
Kurtosis1.35621.76292.27071.24493.07531.5308
JB3.38591.97353.83263.85053.03142.7633
Probability0.18390.37270.14710.14580.21960.2511
Table 3. Unit Root Test Results.
ADFPPZA
I(0)I(1)I(0)I(1)I(0)BYI(1)BY
LnGDP−1.016−3.695 **−1.788−3.705 ***−4.16720105.937 *2005
LnINV−1.219−4.018 **−1.646−4.114 **−4.7082015−6.002 *2010
LnGLOB−0.928−5.540 *−0.928−5.540 *−4.3492004−8.544 *2008
LnREC−1.329−4.468 *−1.069−4.526 *−4.0432010−5.204 **2003
LnREM−1.839−3.996 **1.930−4.045 **−3.9402003−5.677 *2003
InCO2−1.675−3.923 ***−1.358−4.082 **−3.6522009−5.837 *2009
Note: *, ** and *** portrays 1%, 5% and 10% level of significance.
Table 4. ARDL Bounds Test Results.
Test StatisticValueSignif.I(0)I(1)
F-statistic5.1397 *10%−2.57−3.86
k55%−2.86−4.19
2.5%−3.13−4.46
1%−3.43−4.79
Note: * represents 1% level of significance.
Table 5. Long and Short-run Results.
Long-TermShort-Term
VariableCoefficientt-StatisticProbCoefficientt-StatisticProb
LnGDP0.869 ***1.8350.0830.161 ***1.7860.090
LnINV−0.370 *3.7530.001−0.003−0.136−0.863
LnGLOB−0.381 **−2.6030.018−0.789 *−4.2580.000
LnREN−0.789 *−6.7020.000−1.027 **2.6830.015
LnREM−1.208 *−3.8710.000−1.947−5.1130.000
DUM4.9471.8640.078---
ECT (−1)---−0.396−5.1350.000
R20.99
Adj-R20.98
Diagnostic Test Results
Valuep-value
Heteroskedasticity Test0.3740.545
Serial Correlation2.4270.120
Normality Test1.3360.517
Ramsey RESET Test1.1270.275
Note: *, ** and *** portrays 1%, 5% and 10% level of significance.
Table 6. Robustness Results.
FMOLSDOLS
VariableCoefficientt-StatisticProb.Coefficientt-StatisticProb.
LnGDP0.921 *4.3970.0000.869 **2.5130.021
LnGLOB−0.403 *−6.2170.000−0.381 *−3.5660.002
LnINV−0.101 *−4.1370.000−0.403 *−4.1860.000
LnREC−0.809 *−15.520.000−0.789 *−9.1800.000
LnREM−0.008 **−2.6360.017−0.008 ***−1.7420.098
DUM0.0140.7050.488−2.973−1.5280.142
R20.960.97
Adj R20.940.96
Note: *, ** and *** portrays 1%, 5% and 10% level of significance.
Publisher’s Note: MDPI stays neutral with regard to jurisdictional claims in published maps and institutional affiliations.

