1. Introduction
The integration of Environmental, Social and Governance (ESG) factors has attracted a great deal of attention from the business media in recent years [
1,
2,
3]. The reason for this is that ESG is regarded as a method of increasing firm value and improving financial performance [
4,
5]. Companies are gradually recognizing the importance of ESG. Specifically, companies that are highly compliant with ESG principles alleviate conflicts with stakeholders, the probability of failure and the likelihood of default [
6,
7,
8]. In addition, the future-oriented investor is deeply convinced that investing in non-financials is an effective way to build a sustainable global economy [
9]. Investors who invest according to the ESG ranking can effectively avoid ‘sinful companies’ (such as alcohol, tobacco and gambling companies) that may pose greater financial risks due to their environment, society and community practices [
10]. Therefore, ESG performance is crucial for organizations as well as stakeholders [
11].
ESG performance is particularly important in the manufacturing industry due to industry specificity. The manufacturing industry has a significant positive impact on economic development [
12], but it also causes some damage to the environment [
13]. Because the manufacturing industry obtains economic benefits by converting resources into outputs and there will be pollutants released during the transfer process, the environmental problems in the manufacturing industry cannot be neglected [
14]. It, consequently, requires the manufacturing industry to pay more attention to ESG performance [
15,
16]. While natural resource scarcity and environmental insecurity have become increasingly serious [
17,
18,
19], the manufacturing sector still uses huge amounts of resources and produces waste worldwide [
12]. Compared to the US and EU, developing countries in Asia and Africa are not very concerned about environmental issues, but most of the world’s industrial production and processing is concentrated in these countries [
13,
20]. Thus, as a major supplier of global raw materials and commodities and a hub of global supply chains, the fulfillment of ESG in China’s manufacturing industry is a valuable research topic [
21].
Ownership structure demonstrates the characteristics of the distribution of rights of the owners of a business [
22]. In most Chinese literature, ownership structure and equity structure have the same meaning, but there are some practical differences between the two. With the development of social economy, traditional ownership and equity are no longer seen as the same concept. The organizational form of enterprises has been separated from ownership and operation through continuous improvement and the operational risks borne by shareholders have been dispersed to stakeholders, such as managers, creditors and employees [
23]. As a result, ownership includes equity and other stakeholders’ rights and the management goal of maximizing shareholders’ interests becomes maximizing stakeholders’ rights and interests [
24]. Currently, most foreign scholars measure the ownership structure by the number and nature of shares held by natural and legal persons in the enterprise [
25]. It is necessary to analyze ownership structure because it is crucial in corporate governance.
The aim of this study is to investigate the relationship between ESG performance and firm value and the moderating role of ownership structure on the relationship between them. We take Chinese manufacturing listed companies from 2016 to 2020 as our sample. Sino-Securities ESG Rating is adopted to measure ESG performance. Ownership concentration, equity balances, executive shareholding and institutional investor shareholding are taken to measure ownership structure.
This paper contributes to the existing literature in the following ways. Firstly, previous studies on ESG have mainly focused on developed countries, such as the US, France and Italy, and little has been done in developing countries. This study extends the existing literature and provides evidence by using the sample of Chinese manufacturing listed companies. In addition, a heterogeneity analysis is conducted to help better understand the impact of ESG on firm value under different regions. Secondly, to the best of our knowledge, this is the first study to investigate the moderating effect of ownership structure on the relationship between ESG performance and firm value, filling the gap of existing literature. Finally, this study provides informative conclusions and recommendations to investors and companies to make them aware of the role of ESG in corporate governance and its contribution to corporate value, thus, contributing to the direction of green and sustainable development of Chinese manufacturing companies.
This paper is structured as follows. Starting with the Introduction,
Section 2 deals with the theoretical underpinning and hypothesis development. This is followed by
Section 3 and
Section 4, in which the research method and results are presented. Then, an overview of the key findings of this study and a detailed discussion will be presented in
Section 5. The paper ends with the conclusions of our study.
2. Literature Review and Research Hypotheses
2.1. ESG Performance and Firm Value
Sustainability theory points out that the disclosure of ESG-related information by enterprises is conducive to the acquisition of social recognition and social capital and the promotion of their sustainable development [
26]. The environmental protection measures, social responsibility and governance status of enterprises directly affect the evaluation of ESG and the improvement of such an evaluation is beneficial to the enhancement of enterprise value. Moreover, ESG is widely supported and valued because of its broad scope and wealth of information, which can reflect a company’s operating conditions and potential risks [
27]. Sectors with good ESG performance are more likely to be recognized by government agencies, thus, gaining the trust of consumers and investors. This improves the credibility and competitiveness of the company and reduces the losses caused by related penalties.
A majority of scholars indicate that there is a positive relationship between ESG performance and firm value. In the past few years, a study conducted by Liu and Zhang (2017) [
28] showed that social responsibility disclosure is not beneficial to firms’ short-term profits, but can increase their long-term value. Subsequently, the findings of Aboud and Diab (2018) [
29] revealed that firms included in the ESG Index have higher enterprise value and there is a positive correlation between a firm’s higher ranking in the index and firm value measured by Tobin’s q. In addition, Fatemi et al. (2018) [
30] discovered that ESG strengths increase firm value. Later on, taking Chinese listed companies as an example, Zhang et al. (2020) [
31] divided ESG into three different dimensions to investigate the interaction effect on corporate value and they demonstrated that only the disclosure of environmental and social information can positively affect corporate value. Recently, a study carried out by Wong et al. (2021) [
32] showed that ESG certification can reduce the cost of capital and significantly increase Tobin’s Q. Benjamia and Biswas (2022), using a sample of 14,039 US firm-years between 2002 and 2018, found that CSR dimensions of environmental, social and governance criteria positively influence the relationship with firm value [
33]. By analyzing 57 U.S. non-financial firms belonging to the S&P 500, Nguyen et al. (2022) discovered that having a better practice of ESG could enhance firm value measured by ROA, ROE and Tobin’s Q [
34].
Most of the studies on ESG performance and firm value support their positive relationship, while some scholars suggest that ESG performance has no impact or a negative impact on firm value. For example, Brammer and Pavelin (2006) [
35] stated that investments in corporate ESG consume part of the firm’s capital and, therefore, improving ESG performance is not conducive to enhancing firm value. Sassen et al. (2016) [
36] studied the impact of ESG factors on corporate risk in European firms and showed that higher ESG performance inhibits firm value enhancement. Atan et al. (2018) [
37] reported that the effect of ESG performance on return on net worth and enterprise value is not significant by studying Malaysian companies.
Based on the above analysis, this paper proposes the following hypothesis:
Hypothesis 1 (H1).
ESG performance is positively related to firm value.
2.2. Ownership Structure and Firm Value
In the process of solving principal-agent problems and reducing agency costs, ownership structure has become one of the main corporate governance mechanisms [
38] and scholars have verified the important role of ownership structure heterogeneity on corporate governance after years of theoretical discussions and empirical tests. This paper measures ownership structure in four aspects, which include ownership concentration, equity balances, executive shareholding and institutional investor shareholding. Principal-agent theory is the main underlying theory for studying the relationship between ownership and financial or non-financial performance of firms and is frequently used in finance, treasury, economics and strategic management literature [
39]. It is believed that ownership structure characteristics affect the organizational structure and corporate performance of firms.
According to the principal-agent theory, nowadays, owners separate the management and ownership rights in order to run the enterprise more professionally, thus, creating the principal-agent problem [
40]. The fragmentation of shareholding directly affects the effectiveness of supervision of the management and various operational aspects of the company and increases the management cost of the company, so that the higher management cost does not match the lower shareholder return and, therefore, the shareholders’ motivation to supervise the company will decrease [
41,
42]. At the same time, in the case of inconsistent objectives between managers and owners, information asymmetry facilitate managers to usurp shareholders’ rights and interests. Therefore, a majority shareholder with sufficient control is able to effectively supervise the operations of the company and the executive team, reducing conflicts of interest and self-interest among management, thus, decreasing the agency costs of the company. By analyzing a sample of 126 globally listed shipping firms, Drobetz et al. (2019) illustrated that higher ownership concentration improves firm value [
43]. In recent years, Aboud and Diab (2022) [
44], taking companies listed in the Egyptian Corporate Responsibility Index between 2007 and 2016 as a sample, pointed out a significant positive relationship between equity concentration and firm value. Furthermore, there is a significant positive effect of equity separation on the relationship between equity and firm financial performance. In particular, the positive relationship between equity concentration and firm performance is further enhanced after the equity split reform. In addition, when the ownership concentration of a company is high, the majority shareholder can implement decisions in accordance with the vision of corporate development. Taken together, an appropriate increase in ownership concentration can reduce agency costs and contribute to the improvement of operational efficiency, thereby increasing corporate value. This leads to the following hypothesis:
Hypothesis 2a (H2a).
Corporate ownership concentration is positively related to firm value.
The second type of agency problem of principal-agent theory points out that a large shareholding of major shareholders and concentrated ownership cause conflicts of interests between major shareholders and minority shareholders, and major shareholders may encroach on the interests of minority shareholders. Therefore, a balance mechanism needs to be formed among the shareholders of the company, which can provide the relatively small shareholders with the right to obtain consultation and resolve the conflict of interest among the shareholders of the enterprise [
45]. The study of Laeven and Levine (2004) [
46] showed that even distribution of equity balance in listed companies is conducive to promoting corporate performance. Zhou and Fan (2020) [
47] demonstrated that a more evenly distributed equity system increases executive motivation and loyalty, thus, enhancing corporate M&A performance and that equity balance shows an inverted U-shaped relationship with M&A performance. In short, the ability of shareholders to monitor each other and reduce internal conflicts is beneficial to the long-term development of the company. This leads to the following hypothesis:
Hypothesis 2b (H2b).
Corporate equity balance is positively related to firm value.
According to principal-agent theory, there are agency costs between the owners and managers of a firm. The separation of ownership and agency results in different utility functions for the two and there are certain differences in their goals. Mehran (1995) [
48] proved that the shareholding of the managing director can influence the resolution of the proxy problem between shareholders and executives and has a significant positive effect on corporate performance. In the process of daily operation, the entrusted manager has access to corporate information that is closer to the current situation, while the information obtained by the ownership may not always be in sync with the current situation of the enterprise and, under such conditions of information asymmetry, the manager is likely to seek personal interests and encroach on the rights and interests of the owner [
49]. In order to align the goals of owners and managers, equity incentives are one of the best ways to reduce conflicts of interest and alleviate the principal-agent problem between them. Zhang et al. (2021) [
50] suggested that the managers who have equity will have certain residual claims, which makes the managers’ goals more closely related to the business objectives and improves the managers’ motivation to focus on the long-term development of the enterprise. The research conducted by Morck et al. (2000) revealed that executive ownership is positively and significantly related to Tobin’s Q [
51]. Therefore, a moderate increase in the shareholding ratio of management is conducive to improving managerial efficiency and promoting the stable development of the company. This leads to the following hypothesis:
Hypothesis 2c (H2c).
Corporate executive ownership is positively related to firm value.
With the continuous improvement of the financial market, the proportion of shares held by institutional investors in enterprises is becoming higher and more stable. In recent years, institutional shareholding and board size have had a positive effect on firm performance [
52]. Buchanan et al. (2018), taking 3000 French firms around 2018 as an example, discovered that high institutional ownership improves firm value [
53]. Moreover, the research of Din et al. (2021) [
54] illustrated that institutional shareholding has a significant positive effect on return on equity (ROE) and market-to-book ratio (MBR), indicating that institutional investors play a significant role in improving financial performance. Subsequently, after controlling for the equilibrium effects of capital structure and management ownership, Hermeindito (2022) [
55] discovered a positive causal relationship between firm value and institutional ownership. In the past, institutional investors who aimed to obtain short-term benefits gradually changed to institutional investors who focused on long-term development of enterprises [
56]. This transformation is inseparable from the improvement in financial markets and the change in investment philosophy of institutional investors. These investors participate in part of the operation of enterprises and monitor the operation of enterprises when making investment decisions. They are more scientific and prudent in making decisions that are beneficial to the long-term development of enterprises and use their own advantages and resources to help the invested enterprises. Investors provide enterprises with timely information and important opportunities through a wide range of information channels. Therefore, the level of institutional investors’ shareholding has a certain influence on the business status and future development of the enterprise. This leads to the following hypothesis:
Hypothesis 2d (H2d).
Corporate institutional ownership is positively related to firm value.
2.3. The Moderating Effect of Ownership Structure
Based on relevant theories and previous literature, ESG performance, ownership structure and firm value are very closely related. Good ESG performance increases stakeholder and investor confidence, which, in turn, increases corporate value [
57,
58]. Solving the principal-agent problem enables firms to improve operation efficiency and decision execution. Ownership structure affects business activities through the perspectives of agency costs, operating costs and management efficiency, which, in turn, facilitate or hinder the role of ESG performance on corporate value [
59,
60]. In companies with higher ownership concentration, decision makers are more inclined to make decisions for long-term corporate development [
61], thus, increasing the efficiency of ESG performance on corporate value. In companies with a more balanced distribution of ownership, the major shareholders can improve the quality of corporate decision making through mutual checks and balances [
62] and ESG investment is more valued in such companies, improving the efficiency of ESG investment and, thus, promoting the impact of ESG performance on corporate value. Management shareholding can effectively solve the principal-agent problem and improve operational efficiency [
63]. Companies with higher operating efficiency and higher profitability have more capital to invest in ESG areas and ESG performance can effectively play a role in risk prevention and corporate governance. Therefore, ESG performance has a large impact on firm value in firms with higher executive ownership compared to firms with lower executive ownership. Institutional ownership reduces business risk and firms with low business risk achieve higher ESG performance; higher ESG performance also reduces potential risk and improves corporate sustainability [
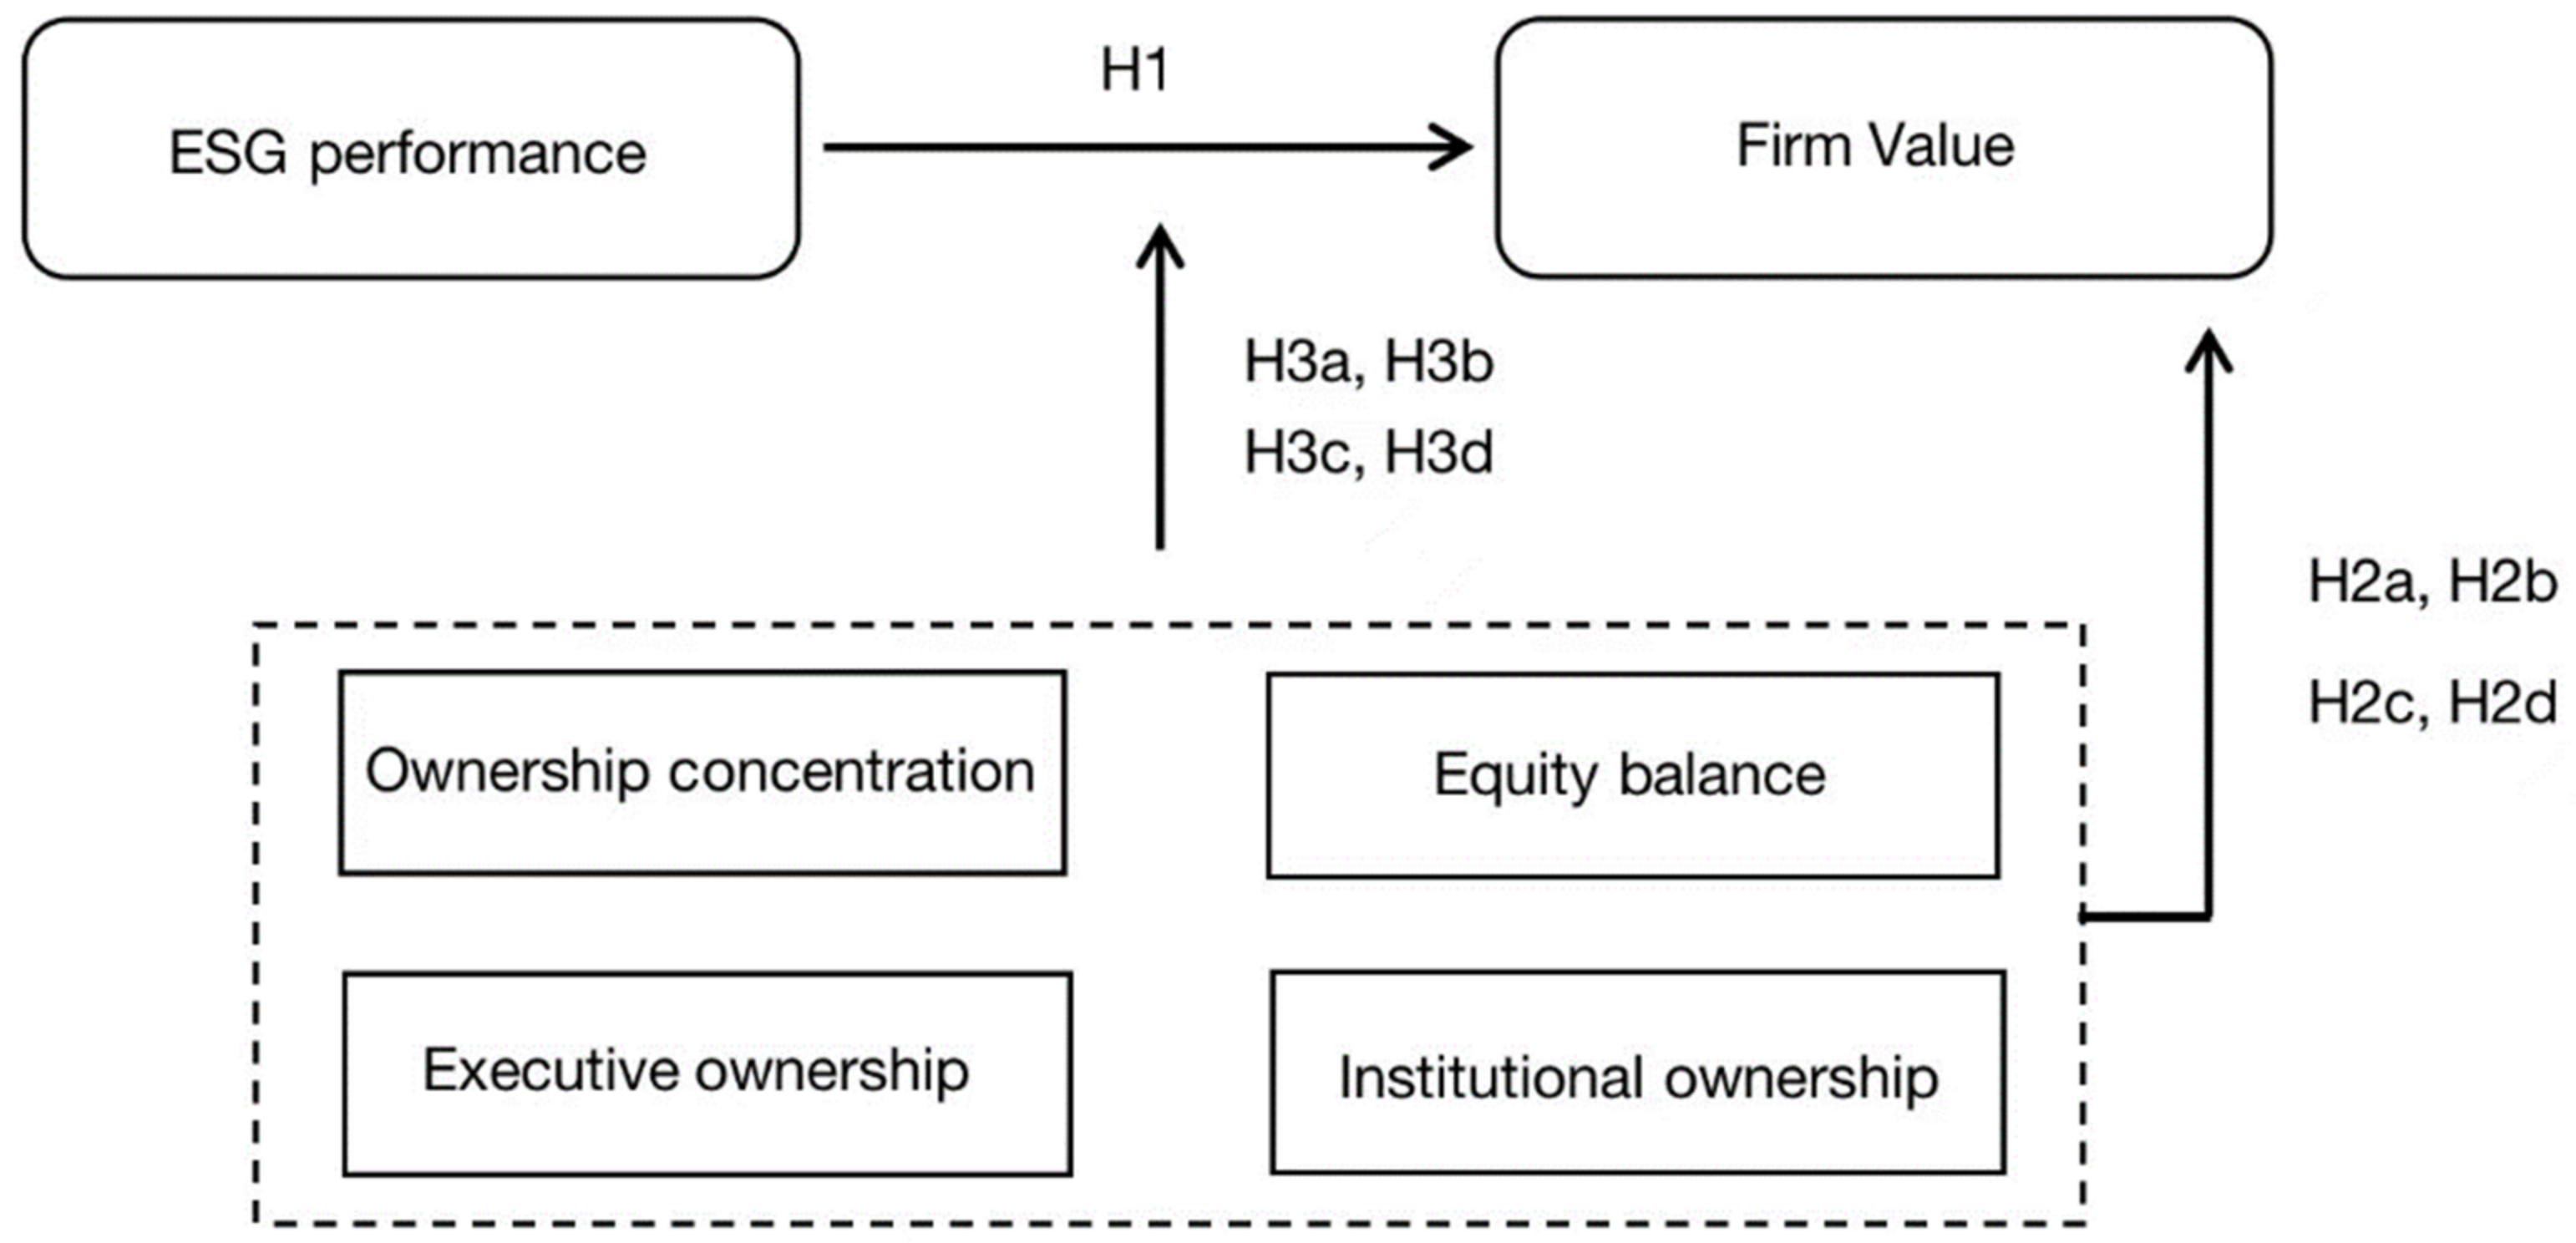
64]. Stable shareholding by investment institutions promotes corporate investment in ESG areas and, thus, the two synergistically contribute to the enhancement of corporate value. In the existing studies, the relationship between ESG performance and firm value is studied from different aspects and a relatively unified conclusion has been drawn. However, few studies have explored the relationship between ESG performance and firm value from the perspective of ownership structure. Based on the above analysis, this paper proposes the following hypotheses:
Hypothesis 3a (H3a).
Corporate ownership concentration positively moderates the relationship between ESG performance and firm value.
Hypothesis 3b (H3b).
Corporate equity balance positively moderates the relationship between ESG performance and firm value.
Hypothesis 3c (H3c).
Corporate executive ownership positively moderates the relationship between ESG performance and firm value.
Hypothesis 3d (H3d).
Corporate institutional ownership positively moderates the relationship between ESG performance and firm value.
Figure 1 shows the conceptual framework.
3. Methodology
3.1. Data and Sample
In this study, China’s manufacturing sector during 2016–2020 is chosen as the sample to investigate the relationship between ESG performance and firm value. The data in this paper come from the China Stock Market Accounting Research (CSMAR) and Wind database for relevant years. After the exclusion of companies with unavailable and incomplete data, companies issuing other kinds of shares and special treatment (ST) companies, 6895 firm-year observations for 1379 manufacturing listed companies are selected as our research sample in the analysis.
3.2. Variables
3.2.1. Dependent Variable
Following previous studies [
34,
36,
65], this study uses Tobin’s Q, a market-based performance measure, to measure firm value. Tobin’s Q is calculated by dividing the sum of market value of shares outstanding at year-end, market value of non-marketable shares at year-end and market value of net debt at year-end by the total assets at year-end and it has a high positive correlation with the relative value of the firm. Tobin’s Q value will not be affected when the book value of the enterprise is changed by the accounting policy [
66].
3.2.2. Independent Variable
Consistent with existing literature [
67,
68,
69], this paper adopts ESG indices from the ESG rating system developed by Sino-Securities Index Information Service Co., Ltd. (Shanghai, China) to measure the ESG performance. Based on the core connotation and development experience of ESG and taking into account the actual situation of the Chinese market, Sino-Securities Index ESG Evaluation System builds a three-tier index system from top to bottom. It includes 3 primary indicators, 14 secondary indicators, 26 tertiary indicators and more than 130 underlying indicators. ESG indices are divided into 9 levels: C, CC, CCC, B, BB, BBB, A, AA and AAA. In this paper, nine levels are assigned a score of 1–9 as ESG performance. Higher scores indicate higher ESG performance, while lower scores indicate problems with ESG performance.
3.2.3. Moderating Variables
Guided by Wei et al. (2005) [
70], Andreou et al. (2014) [
71], Yu et al. (2018) [
72], Ghalerodkhani et al. (2018) [
73], Perez-Calero et al. (2019) [
74], Zhang and Zhang (2021) [
75] and Abu Afifa et al. (2021) [
22] and Chen et al. (2022) [
76], the ownership structure is measured in terms of both quantitative and qualitative aspects. The quantitative aspect is measured by ownership concentration (Top) and equity balance (Z) and the nature aspect is measured by executive ownership (Mhold) and institutional investor ownership (Inst). Among them, the measure of ownership concentration is expressed by most scholars in terms of the shareholding ratio of the top-10 shareholders. In the preliminary statistical analysis after collecting samples, it is found that most of companies listed in Shanghai and Shenzhen A-shares are controlled by the first-largest shareholder and there is a large gap between the shareholding ratio of the first-largest shareholder and the second-largest shareholder. Therefore, this paper selects the shareholding ratio of the first-largest shareholder as the proxy variable of ownership concentration. For the measure of equity balance, this paper uses Z-index to measure equity balance, which is the ratio of the sum of the number of shares held by the second- to fifth-largest shareholders to the number of shares held by the first-largest shareholder. The measure of executive shareholding is measured by the ratio of the amount of executive shareholding to the total number of shares. A measure of institutional ownership is expressed by the ratio of the number of shares held by institutional investors to the total number of shares.
3.2.4. Control Variables
In accordance with previous literature [
34,
37,
77,
78], five indicators, including debt-to- assets ratio (Lev), firm size (Size), firm growth (Growth), executive pay (Pay), company type (State) and return on equity (ROE), are selected as control variables. In addition, a year dummy variable is added to the regression model in order to control the impact of time-varying macroeconomic conditions on firm value.
Table 1 shows the variable definition.
3.3. Models
Model (1) is applied to examine H1.
We apply Models (2)–(5) to verify H2a–H2d.
Models (6)–(9) are employed to test H3a–H3d.
where i stands for the firm; t represents the year; β is the parameter; ε denotes the disturbance.
4. Regression Results
4.1. Descriptive Statistics
Table 2 lists the descriptive statistics for all variables used in our study. Excluding ESG and State, all remaining variables are winsorized at the 1% level, curbing the impact of the outlier.
It can be seen that the average of Tobin’s Q is 1.931, standard deviation is 1.604 and there is a huge difference between the maximum and minimum values, showing that the firm value of Chinese manufacturing listed companies is much different. The mean value of ESG is 4.066 and the median value is 4.00, suggesting that most of the companies are at average levels in terms of ESG performance. Further, 63% of companies have ESG value below 4.000, indicating that there are still some companies that do not pay attention to ESG performance.
Among the moderating variables, the highest and lowest values of Top are 0.692 and 0.086, respectively, proving that there is great variation among firms’ ownership concentrations. The mean value of Z is 0.77, along with the median of 0.579 and the standard deviation of 0.608, which both illustrate the relatively high degree of equity balances in most companies, which can effectively curb the infringement in the interests of listed companies by major shareholders. Mhold has a standard deviation of 0.125, with an average estimation of 0.064, which means that most companies have a relatively small number of shares held by executives. As for the Inst variable, the mean is 0.408 and it ranges from a minimum of 0.002 to a maximum of 0.875, reflecting great variation.
Regarding control variables, the average leverage value of 0.399 is similar with the median leverage value of 0.395, implying that most companies have a good capital structure and are not threatened by capital shortages. The mean of Size, Growth, Pay, State and ROE is 22.332, 0.157, 15.115, 0.307 and 0.058, respectively.
4.2. Correlation Analysis
Table 3 shows the correlation analysis of all variables. It can be observed that ESG is significantly related to Tobin’s Q. Among the ownership variables, Top, Z and Mhold are positively and strongly correlated with Tobin’s Q, but Inst has a negative relationship with Tobin’s Q. As a whole, the correlation of Tobin’s Q with control variables is significant, except for Growth. Variance inflation factor (VIF) test is conducted to check the multicollinearity and all the VIF values are less than 3, demonstrating that multicollinearity is not crucial for our study.
4.3. Regression Results
Based on the Hausman test, a fixed-effect model is applied to Models (1)–(9).
Table 4 shows the regression results of Models (1)–(5). The results of Model (1) show that ESG has a positive and significant relationship with Tobin’s Q, suggesting that ESG performance can help companies increase firm value. Therefore, H1 is supported. Among the four ownership variables, Top and Z have no impact on Tobin’s Q, while Mhold and Inst are positively and significantly correlated with Tobin’s Q, illustrating that equity incentives for executives motivate them to be committed to their positions and, thus, create greater value for the company and the higher the shareholding of institutional investors, the more active they are in their monitoring role in order to maintain their increased equity, which helps to increase the value of the company. Consequently, H2a and H2b are not tenable, whereas H2c and H2d are accepted.
As for control variables, Lev, Size and State are negatively related to Tobin’s Q, while Growth and Pay have a positive relationship with Tobin’s Q.
Table 5 shows the regression results of moderating variables. The coefficient of ESG × Top is positive but insignificant at the 5% level (β = 0.097, t = 0.78), so H3a is not supported. A negative but insignificant impact of the interaction of ESG × Z on firm value proves H3b is not verified. The coefficient of ESG × Mhold is negative but significant (β = −0.297, t = −1.82), which indicates H3c is not supported. The interaction of ESG × Inst affects Tobin’s Q strongly and positively (β = 0.281, t = 3.83). Hence, H3d is fully accepted.
4.4. Additional Analysis
We divide our sample into three sub-samples by region, including eastern, middle and western regions. Beijing, Tianjin, Hebei, Liaoning, Shanghai, Jiangsu, Zhejiang, Fujian, Shandong, Guangdong and Hainan are included in the eastern region. The middle region consists of Shanxi, Inner Mongolia, Jilin, Heilongjiang, Anhui, Jiangxi, Henan, Hubei, Hunan and Guangxi. Gansu, Guizhou, Ningxia, Qinghai, Shanxi, Sichuan, Xizang, Xinjiang, Yunnan and Chongqing are involved in the western region. The descriptive statistics for the heterogeneity analysis can be seen in
Table A1 in
Appendix A.
Table 6,
Table 7,
Table 8,
Table 9,
Table 10 and
Table 11 show the regression results of Models (1)–(9) in the eastern, middle and western regions, respectively. ESG has an enhancing effect on firm value in the eastern and western regions, while in the middle region, it has no effect on firm value. Compared with Top and Z, having no impact on firm value in three regions, Inst shows a strong correlation with firm value in all three regions. Mhold has only demonstrated a relationship with corporate value in the middle region. There is no correlation between ESG × Top and ESG × Z and firm value in all three regions, while ESG × Mhold correlates with Tobin’s Q slightly in the eastern region and ESG × Inst correlates with Tobin’s Q strongly in the eastern and western regions.
It is noticeable that the impact of ESG and ESG × Inst on firm value in the western region is greater than that in the other regions, while Inst in the middle region can influence the firm value to a greater extent compared to the other two regions. According to the “Guidance on Promoting Orderly Transfer of Manufacturing Industries” issued by the Chinese government, China’s labor-intensive industries focus on transferring to labor-rich and transportation-friendly areas in Central and Western China and technology-intensive industries move to areas with abundant innovation factors and strong industrial bases in central and western cities. Governments in the central and western regions can provide enterprises with policy support, such as funding and tax incentives, so enterprises have a stronger incentive to improve their ESG performance. In the middle region, institutional investors with high shareholding will be more actively involved in making major economic decisions, making executives more deliberate in their decisions. Institutional investors indirectly ensure that individual decisions are implemented precisely, thus, enhancing corporate value.
5. Discussion
The results of our study illustrate that ESG performance influences firm value positively. One reason might be that excellent ESG performance helps alleviate corporate financing constraints, improve operational efficiency and reduce corporate financial risk, thereby enhancing firm value [
79]. Similar to our study, Lin et al. (2021) [
80], using Fin-Tech companies in China from 2017 to 2019 as the sample, proved that good ESG performance significantly improves firm value. Wong et al. (2021) [
32] also found that ESG performance is positively correlated with firm value. However, there is research arguing for conflicting results. For example, the study of Buallay (2019) [
81] showed that there is a negative relationship between ESG and corporate value.
Our study also finds that executive ownership and institutional ownership both have a significant positive impact on firm value, while ownership concentration and equity balance do not have any effect on firm value. Regarding executive ownership, one explanation might be that executives are better informed about a company’s real business situation than outside investors on the basis of information asymmetry. When the company operates in good condition, executives will tend to increase their stake in the company and also release signals to the outside world about the future growth of the company’s value. Therefore, the higher the percentage of executive shareholding, the greater the value of the company. Inconsistent with our research, the study conducted by Qi et al. (2022) [
82] revealed that the proportion of executive shareholding in petroleum and petrochemical companies is positively but insignificantly related to firm value. For institutional ownership, it could be explained by the fact that as the shareholding ratio increases, the rights and status that institutional investors enjoy in corporate governance also rise. This gives institutional investors the strength to contend with company management, increasing their motivation to participate in corporate governance and achieving the effect of enhancing company value. In line with us, Azmi et al. (2021) [
83], taking 595 firms listed in Malaysia between 2013 and 2017 as samples, investigated the relationship between institutional ownership and firm value and pointed out institutional ownership and firm value are positively related. In terms of ownership concentration, the shareholding ratio of controlling shareholders is the result of competitive selection and there is no optimal shareholding ratio applicable to every company. Each firm chooses its shareholding in accordance with the profit-maximization principle based on the environment in which it operates. When there are important changes in the environment, the controlling ratio will change, but the firm’s value may not change much. Contrary to our study, Saona and Martín’s study (2016) [
84] illustrated that ownership structure has a U-shaped effect, which means ownership concentration initially increases the value of most firms. However, after a certain threshold, the risk of wealth appropriation by large shareholders at the expense of minority shareholders increases in firms with growth opportunities. Greater private gains in control for controlling shareholders could explain why equity balance does not increase firm value. As for equity balance, different degrees of equity balances have different effects on corporate performance. When the degree of equity balances is low, the counterbalancing shareholders do not fully play their governance role. Specifically, the counterbalancing shareholders do not constrain the controlling shareholders, nor do they restrain management behavior. When the degree of equity balances is high, shareholders bargain with each other, thus, reducing the efficiency of decision making. Contrasting from our study, the study conducted by Chen (2019) [
85] showed that equity balance can help companies increase firm value.
Institutional ownership positively moderates the relationship between firm value and ESG performance and executive shareholding negatively moderates the relationship between these two, but ownership concentration and equity balance have no impact on the relationship between firm value and ESG performance. Consistent with our study, the study of Tuerhong (2021) [
86] revealed that there is no relationship between ESG and ownership concentration and equity balance. However, unlike the results of Tuerhong’s study (2021) [
86], in our study results, the sign of the interaction term between ESG and institutional shareholding is positive, while the sign of the interaction term between ESG and executive shareholding is negative.
We also tested the relationship between ESG performance and firm value in three regions and found that ESG has a positive impact on firm value in the eastern and western regions. One reason might be that the economic development and institutional environment vary greatly across regions and companies in the eastern region are more willing to use ESG to reduce the cost of environmental management and the pressure of social opinion. Since China is in the process of shifting manufacturing to the west, the government provides more support to the western manufacturing sector, thus, giving the western manufacturing sector more incentive to improve their ESG performance.
Institutional ownership has a strong and positive effect on firm value in all three regions, while both ownership concentration and equity balance have no impact on firm value in all three regions. For executive ownership, it only influences firm value in the middle region. In terms of institutional ownership, it can be explained by the fact that institutional investors, who hold more shares, are more professional and have more means to obtain effective information and have more motivation and ability to intervene in the governance of listed companies. Institutional investors can directly participate in the decision-making process of the company by communicating with the management, electing directors and supervisors, attending shareholders’ meetings and submitting shareholder proposals, thus, increasing the value of the company. For ownership concentration and equity balance, one of the reasons may be that China’s capital market is in the early stage of development, the level of standardization is not high and the stock issuance system, trading system and market regulation system are still in the process of continuous evolution and improvement, while any change in the system may affect factors related to equity structure and company value, thus, having an impact on the relationship between the two. Institutional ownership positively and significantly moderates the relationship of firm value and ESG performance in the eastern and western regions and executive ownership only moderates the relationship between firm value and ESG performance in the middle region, while ownership concentration and equity balance moderate the relationship between firm value and ESG performance in all three regions. It can be explained by the fact that higher executive ownership implies that corporate executives are highly competent and visionary. Compared with the eastern and western regions, the middle region has poor ESG performance and visionary executives will pay more attention to corporate ESG development, so in the middle region, executive ownership plays a significant negative moderating effect between ESG performance and corporate value. For institutional ownership, ESG performance is relatively better in the eastern and western regions, so investors are more willing to pursue the long-term interests of enterprises, while in the central region, with a relatively poor ESG performance, corporate investors are more concerned with the short-term interests of their companies.
6. Conclusions
Using panel data of Chinese listed manufacturing companies during 2016–2020, we examine the relationship between ESG performance and firm value and the moderating role of ownership structure between them. The main conclusions are as follows. First, ESG performance has a positive and significant impact on firm value in the eastern and western regions, but not in the middle region. Second, executive ownership and institutional ownership have been shown to enhance firm value, while ownership concentration and equity balance do not. Third, executive ownership and institutional ownership will function as critical moderating factors to explain the link between ESG performance and firm value, but ownership concentration and equity balance have no influence on the relationship between ESG performance and firm value. Additionally, institutional ownership significantly and positively moderates the relationship between ESG and firm value in the eastern and western regions, while executive ownership moderates the relationship only in the eastern region.
Our research has made several theoretical contributions. First, we extend the existing ESG and firm value studies by focusing on developing countries. We use Chinese manufacturing listed companies from 2016–2020 to investigate the relationship between ESG performance and firm value, thus, giving other developing countries advice and reference for ESG development. Second, the current study also emphasizes the moderating role of ownership structure, enriching the existing research and providing more suggestions for companies to modify and improve their ESG performance. Finally, this research promotes manufacturing listed companies to recognize the impact of ESG on their corporate value, thus, helping them focus on their business philosophy and their own sustainable development.
The study provides some practical implications for corporations and government for better improvement of firm value.
ESG performance provides a comprehensive picture of corporate responsibility and potential for future development, so manufacturing listed companies need to continue to focus on investing in ESG to improve their environmental protection, social responsibility awareness and corporate governance performance, thus, improving ESG performance. In particular, manufacturing listed companies in the middle region should respond to the government’s call for green production that requires manufacturing companies to improve the production efficiency and reduce energy waste and focus more on ESG performance to enhance corporate value.
Manufacturing listed companies need to make appropriate adjustments to equity concentration and equity balance according to their own situation in order to enhance corporate value. In addition, manufacturing listed companies should appropriately increase the proportion of executive shareholding to reduce agency costs and provide good development space for ESG performance. What’s more, manufacturing listed companies should try to attract high-quality institutional investors who are concerned about the long-term development of the company. Such institutional shareholding is more stable, has better governance effect on the company and helps the company to deliver information about the potential of the invested company in the capital market.
The Chinese government can improve China’s ESG disclosure system by referring to the system structure of ESG performance in developed countries. In addition, the Chinese government should implement corporate ESG disclosure requirements by enacting laws and also motivate companies to disclose ESG information more actively by formulating relevant policies.
This study still has some limitations, which can be directions for future research. Firstly, this study only focuses on the Chinese manufacturing industry, limiting the breadth of the research. Therefore, future research could include more countries and industries. Secondly, despite the fact that this study investigates the moderating role of ownership structure, there is still a substantial unexamined moderating role between ESG performance and firm value. Therefore, scholars could pay more attention to the moderating role in future research.


