1. Introduction
Animal husbandry is an important source of animal protein for human nutritional needs and has a far-reaching significance for enriching agro-food systems and the agricultural economy. The rapidly expanding demand for consumable livestock products has correspondingly stimulated livestock production, which has led to a series of serious problems, such as resource shortages and environmental pollution. Such problems are particularly prominent in nations that use traditional farming methods, as well as those with limited animal husbandry resources and poor environmental endowments [
1,
2,
3]. In recent decades, the rapid development of animal husbandry in China has solved the consumption shortage of animal proteins, such as meat, egg, and milk. However, the expansion of the breeding scale has also caused severe resource and environmental problems, and the unsustainable development of animal husbandry has gradually emerged. To eliminate the contradiction between environmental protection and the development needs of animal husbandry and resource supplies, the Chinese government has implemented a set of environmental protection policies, such as pollution discharge fees and environmental taxation, to impose restrictions on the production behaviors of breeding companies, as well as measures that encourage the green transformation of traditional husbandry, such as tax reductions and exemptions, assistance for the establishment of corresponding facilities, and financial incentives [
4].
The presence of environmental policy and severity of regulation have a pronounced influence on the development of the social economy, as well as the related industrial sectors. Numerous scholars have paid attention to and studied this issue. In the examination of this impact, Wang et al. [
5] utilized an extended slacks-based measure of a directional distance function model to empirically investigate the use of environmental regulations by the governments of the Organization for Economic Co-operation and Development member states and their effects on the growth of green productivity. Their findings supported the Porter hypothesis that environmental policies have a significant positive impact on green development. Teng et al. [
6] applied system dynamics models to construct a green eco-environmental model and simulate policy adjustments, revealing that green development policy led to a larger economic improvement in urban environmental quality, than traditional development policy. Romano et al. [
7] illustrated the effectiveness of green development policy, from the perspective of the development stage for both developing and developed countries. Their findings showed that different stages of economic development are better suited to different types of green development policies. Specifically, developing countries should strengthen their direct government intervention, while developed countries should pay more attention to social and public interventions. Fu et al. [
8] developed a difference in differences (DID) model, based on the propensity score matching to investigate the impact of China’s sulfur dioxide emissions trading on green development, and suggested that market-oriented mechanisms played a key role in its promotion.
Existing research on environmental protection and green development policies can be divided into two categories. The first focuses on building multi-dimensional policy evaluation frameworks, such as studies on the relationships between energy policy and energy efficiency [
9] and between environmental policy and sewage treatment [
10]. The second uses econometric models to evaluate the effects of policy implementation, such as studies that use DID models to evaluate the environmental performance of relevant policies [
11,
12,
13] and studies that assess the effectiveness of environmental policy by measuring productivity or constructing mathematical models [
14,
15,
16,
17,
18]. Past research has emphasized the development of green animal husbandry while neglecting evaluation methods for policy effectiveness and interactions of decisions by local governments and breeding companies. To fill this research gap, we constructed an evolutionary game theory (EGT) model, using local governments and breeding companies as players to determine both the evolutionary decision-making process and the stable strategies used by both players in the game. Hence, two scenarios were considered and contrasted: a game set within the context of strict environmental protection policies and one set within relaxed policy conditions. It was believed that strict policies force local governments to pay more attention to the effectiveness of supervision and implement flexible reward and punishment systems, based on the development stages of the breeding companies, thereby transforming static reward and punishment measures into dynamic ones. This paper is arranged as follows. First, the background of China’s animal husbandry resources and environment policy is introduced; and then, the research methods and application process adopted in the study are described. Finally, the main findings of this study are discussed.
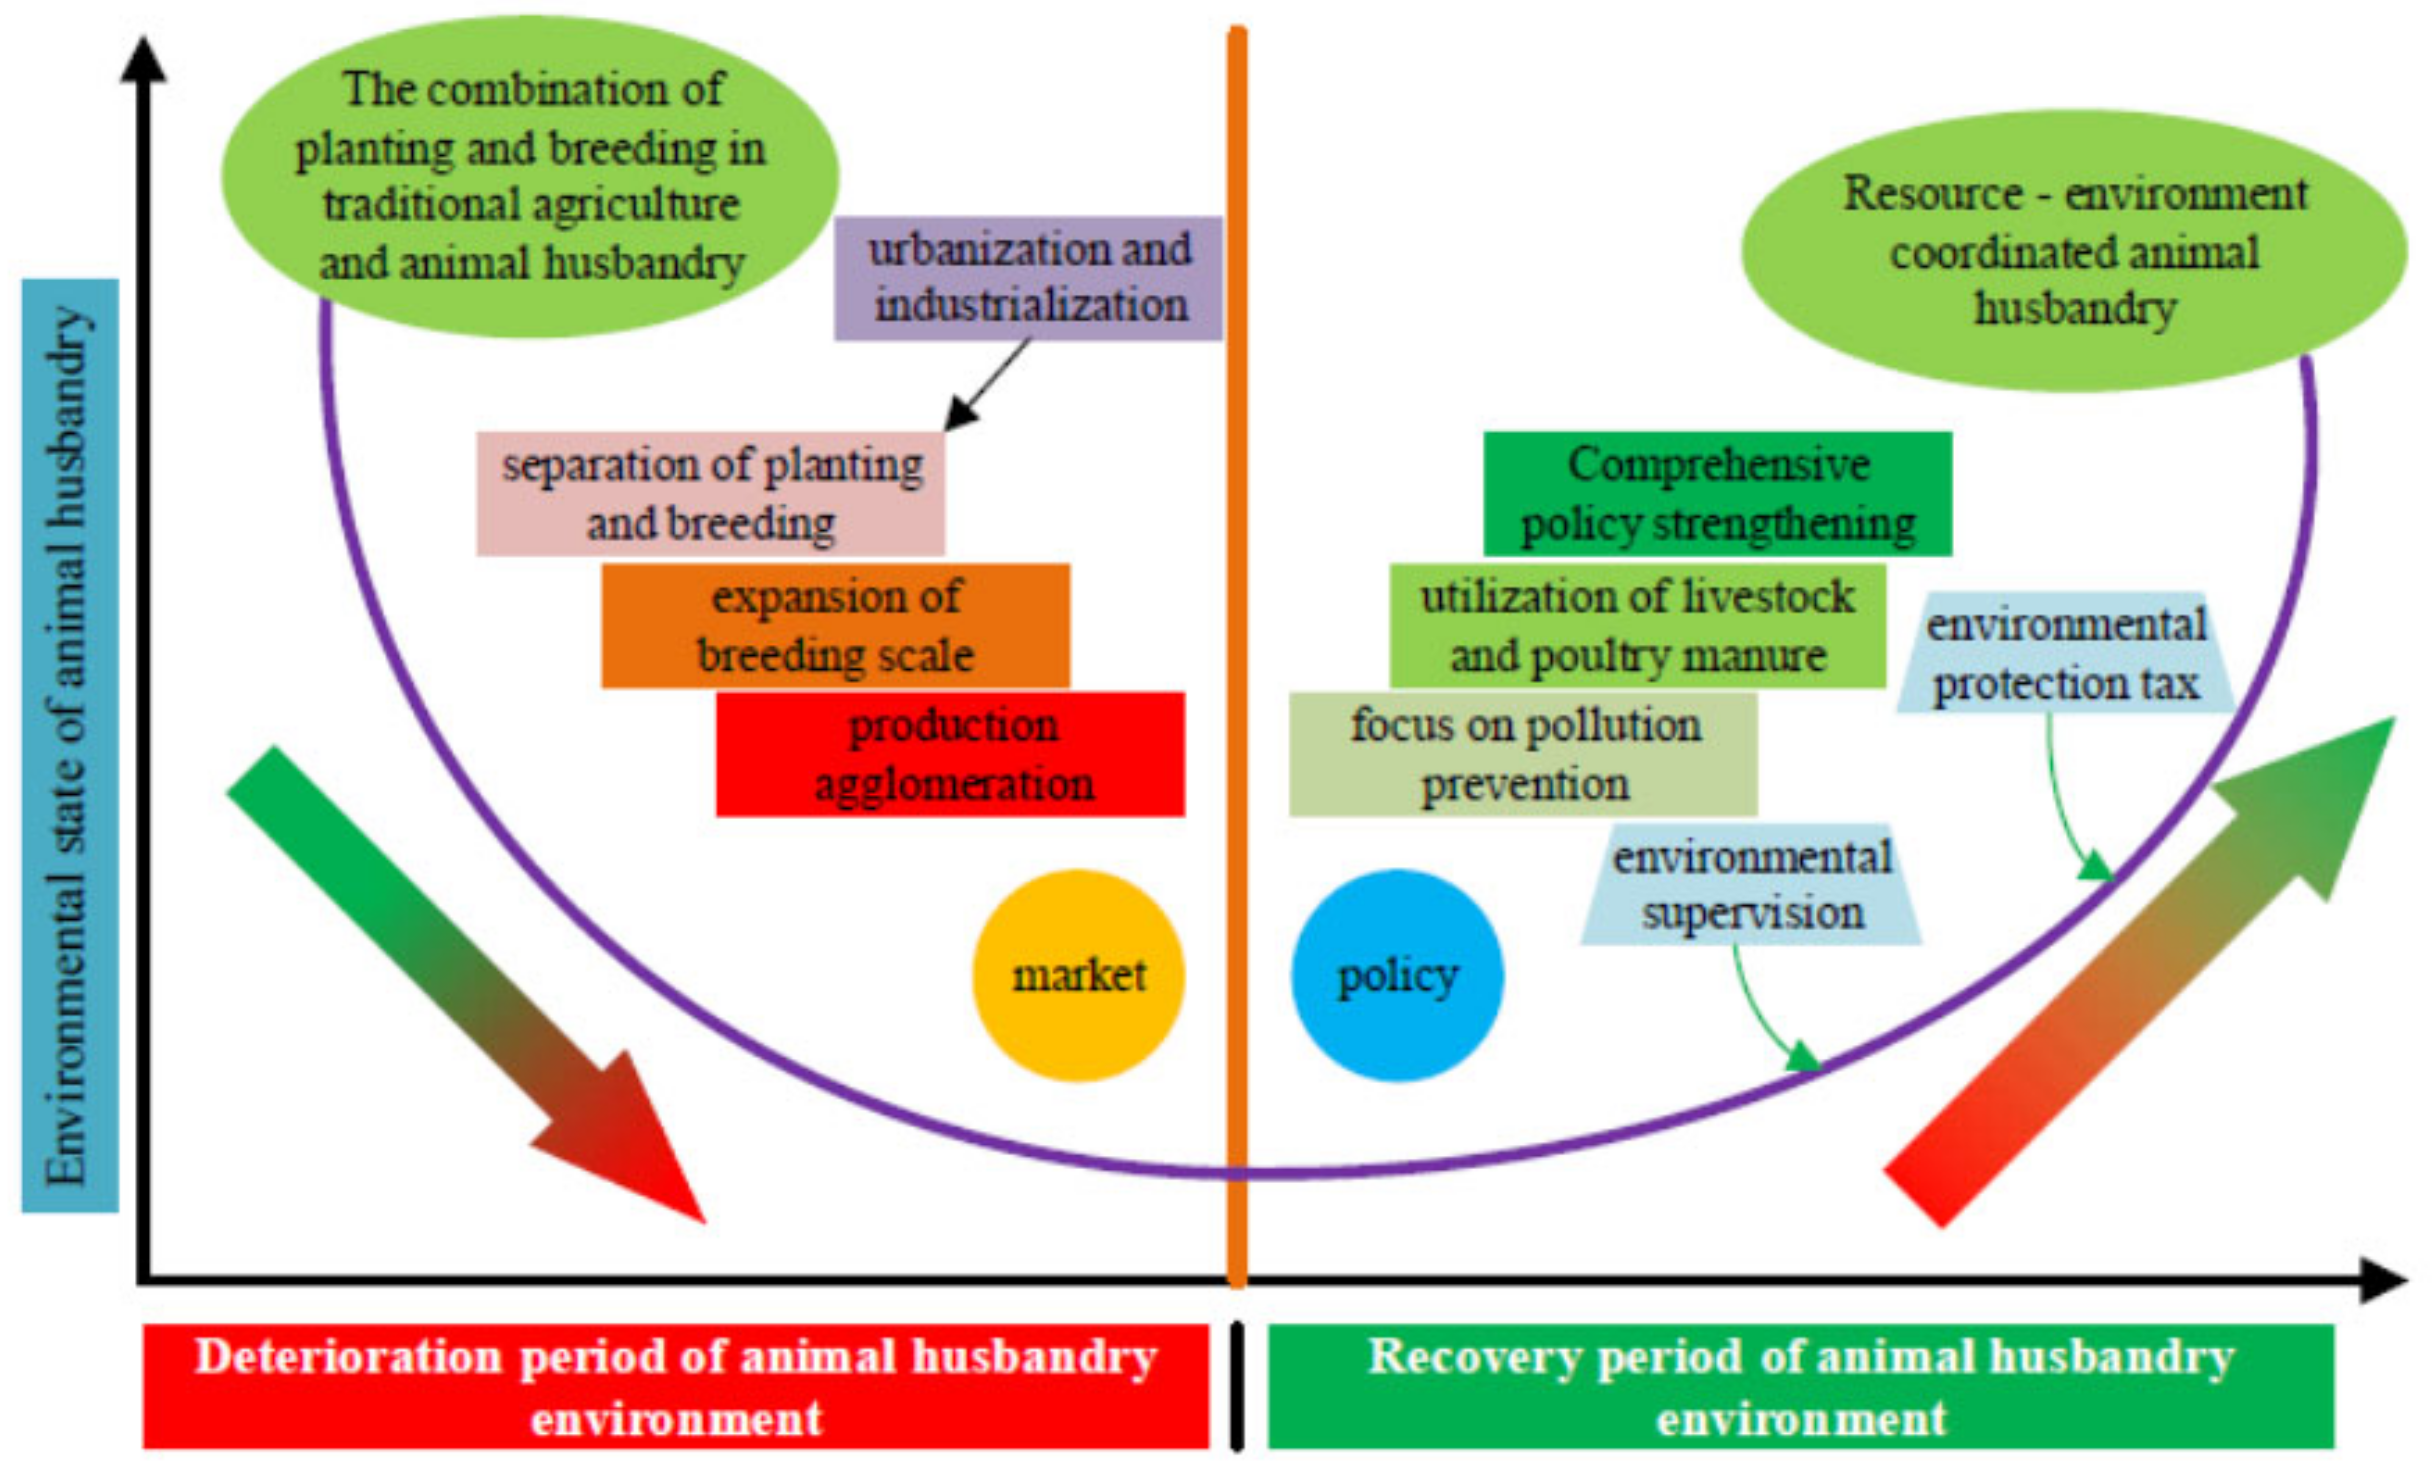
2. Policy Background
This study systematically sorted out the development process and policy evolution process of China’s livestock industry, and summarized the overall state of livestock industry development under different policy backgrounds. Through industrialization and urbanization, the traditional farming model of plant cultivation and livestock breeding has shifted toward intensive and large-scale modern animal husbandry. As modern animal husbandry has expanded at an increasingly rapid rate, the carrying capacity of resources and the environment have been downgraded in priority, posing a severe challenge to capacities in the regional resource supply, environmental absorption, and ecological restoration [
19,
20]. In response to these prominent resource and environmental issues, the Chinese government has bolstered governance of agricultural non-point source pollution and the utilization of livestock and poultry manure as a resource [
21,
22].
Based on the analysis of the policy documents, this study concludes that animal husbandry-related environmental policies in China have undergone three phases. The first phase, in which policy focused on the prevention and control of pollution from breeding, such as the “Discharge Standard of Pollutants for Livestock and Poultry Breeding (GB 18596-2001)” and “Administrative Measures on Livestock and Poultry Breeding Pollution Control,” which aimed to reduce environmental and human hazards from waste residue, sewage, and odors, occurred between 2001 and 2013. The second phase, during which policy shifted from pure pollution prevention and control to resource utilization and transformation, encouraging and supporting the on-site utilization of livestock and poultry manure as fertilizer and fuel, and providing a legal basis for the prevention and control of farming pollution, arose between 2014 and 2016. The third and current phase began in 2017 and marks an unprecedented degree of stringency. The target of the policies expanded from large-scale farms to all breeding companies. This supervision system placed a time limit on several breeding farms, forcing them to either close down or transform operations. The implementation of policies, such as the “Action Plan of Livestock & Poultry Manure Utilization (2017–2020)” and the “Work Plan for the Entire Nation to Promote the Utilization of Livestock and Poultry Manure (2018–2020)” aimed, to promote the green and circular development of animal husbandry. In 2018, the government promulgated the “Environmental Protection Tax Law,” which stipulates that the discharge of pollutants will be taxed, and outlined a set of conditions to force the re-internalization of pollution externalities by the generating companies [
23,
24]. The third policy has thus accelerated a dramatic shift in the operational models of breeding companies.
Figure 1 shows the environmental status of China’s livestock industry and the evolution trend of environmental protection policies.
3. Model and Methods
In this section, the constructed EGT model between local governments and breeding companies is outlined, including the evolutionary decision-making processes and stable strategies for both players, under the constraints of conventional environmental policies. Conditions for the stability of the system are then proposed, based on the method applied by Friedman [
25].
3.1. Evolutionary Game Model
EGT is widely used in economics to study the players’ decision-making and their payoffs equilibria, under the premise of bounded rationality and incomplete information. It has been widely applied in institutional research and behavioral decision-making research [
26,
27]. The application of EGT has increased significantly in recent years in environmental research. Chen and Hu [
28] constructed a game between government and manufacturers, based on various scenarios of differing carbon taxes and subsidies and found that levying carbon tax was more conducive to the low-carbon development of manufacturing industries than subsidizing low-carbon technologies. Ji et al. [
29] constructed a model between local governments and automakers and empirically tested the impact that canceling subsidies for new energy vehicles has on the development of the auto industry and government decision-making. Kang et al.’s [
30] model for a low-carbon supply chain strategy suggested that the government should reduce carbon emissions by controlling carbon trading prices. EGT has become a powerful tool for exploring environmental strategies in an increasingly prominent global environmental context involving a range of stakeholders [
31,
32]. It has emerged as an analytical tool for reducing resource and environmental issues in animal husbandry, as well as for optimizing the players’ behavioral decisions when dealing with environmental issues, and particularly for modern China, which is at a critical point in its development of green policy optimization and environmental regulation. Local governments and companies that emit pollutants are involved in a game, which includes a diverse set of strategies with differentiated interests and preferences [
33,
34,
35]. As the conflict intensifies between the need to develop animal husbandry and the limitations of resources and the environment, the decisions made by both governments and enterprises are vital.
3.2. Model Assumptions
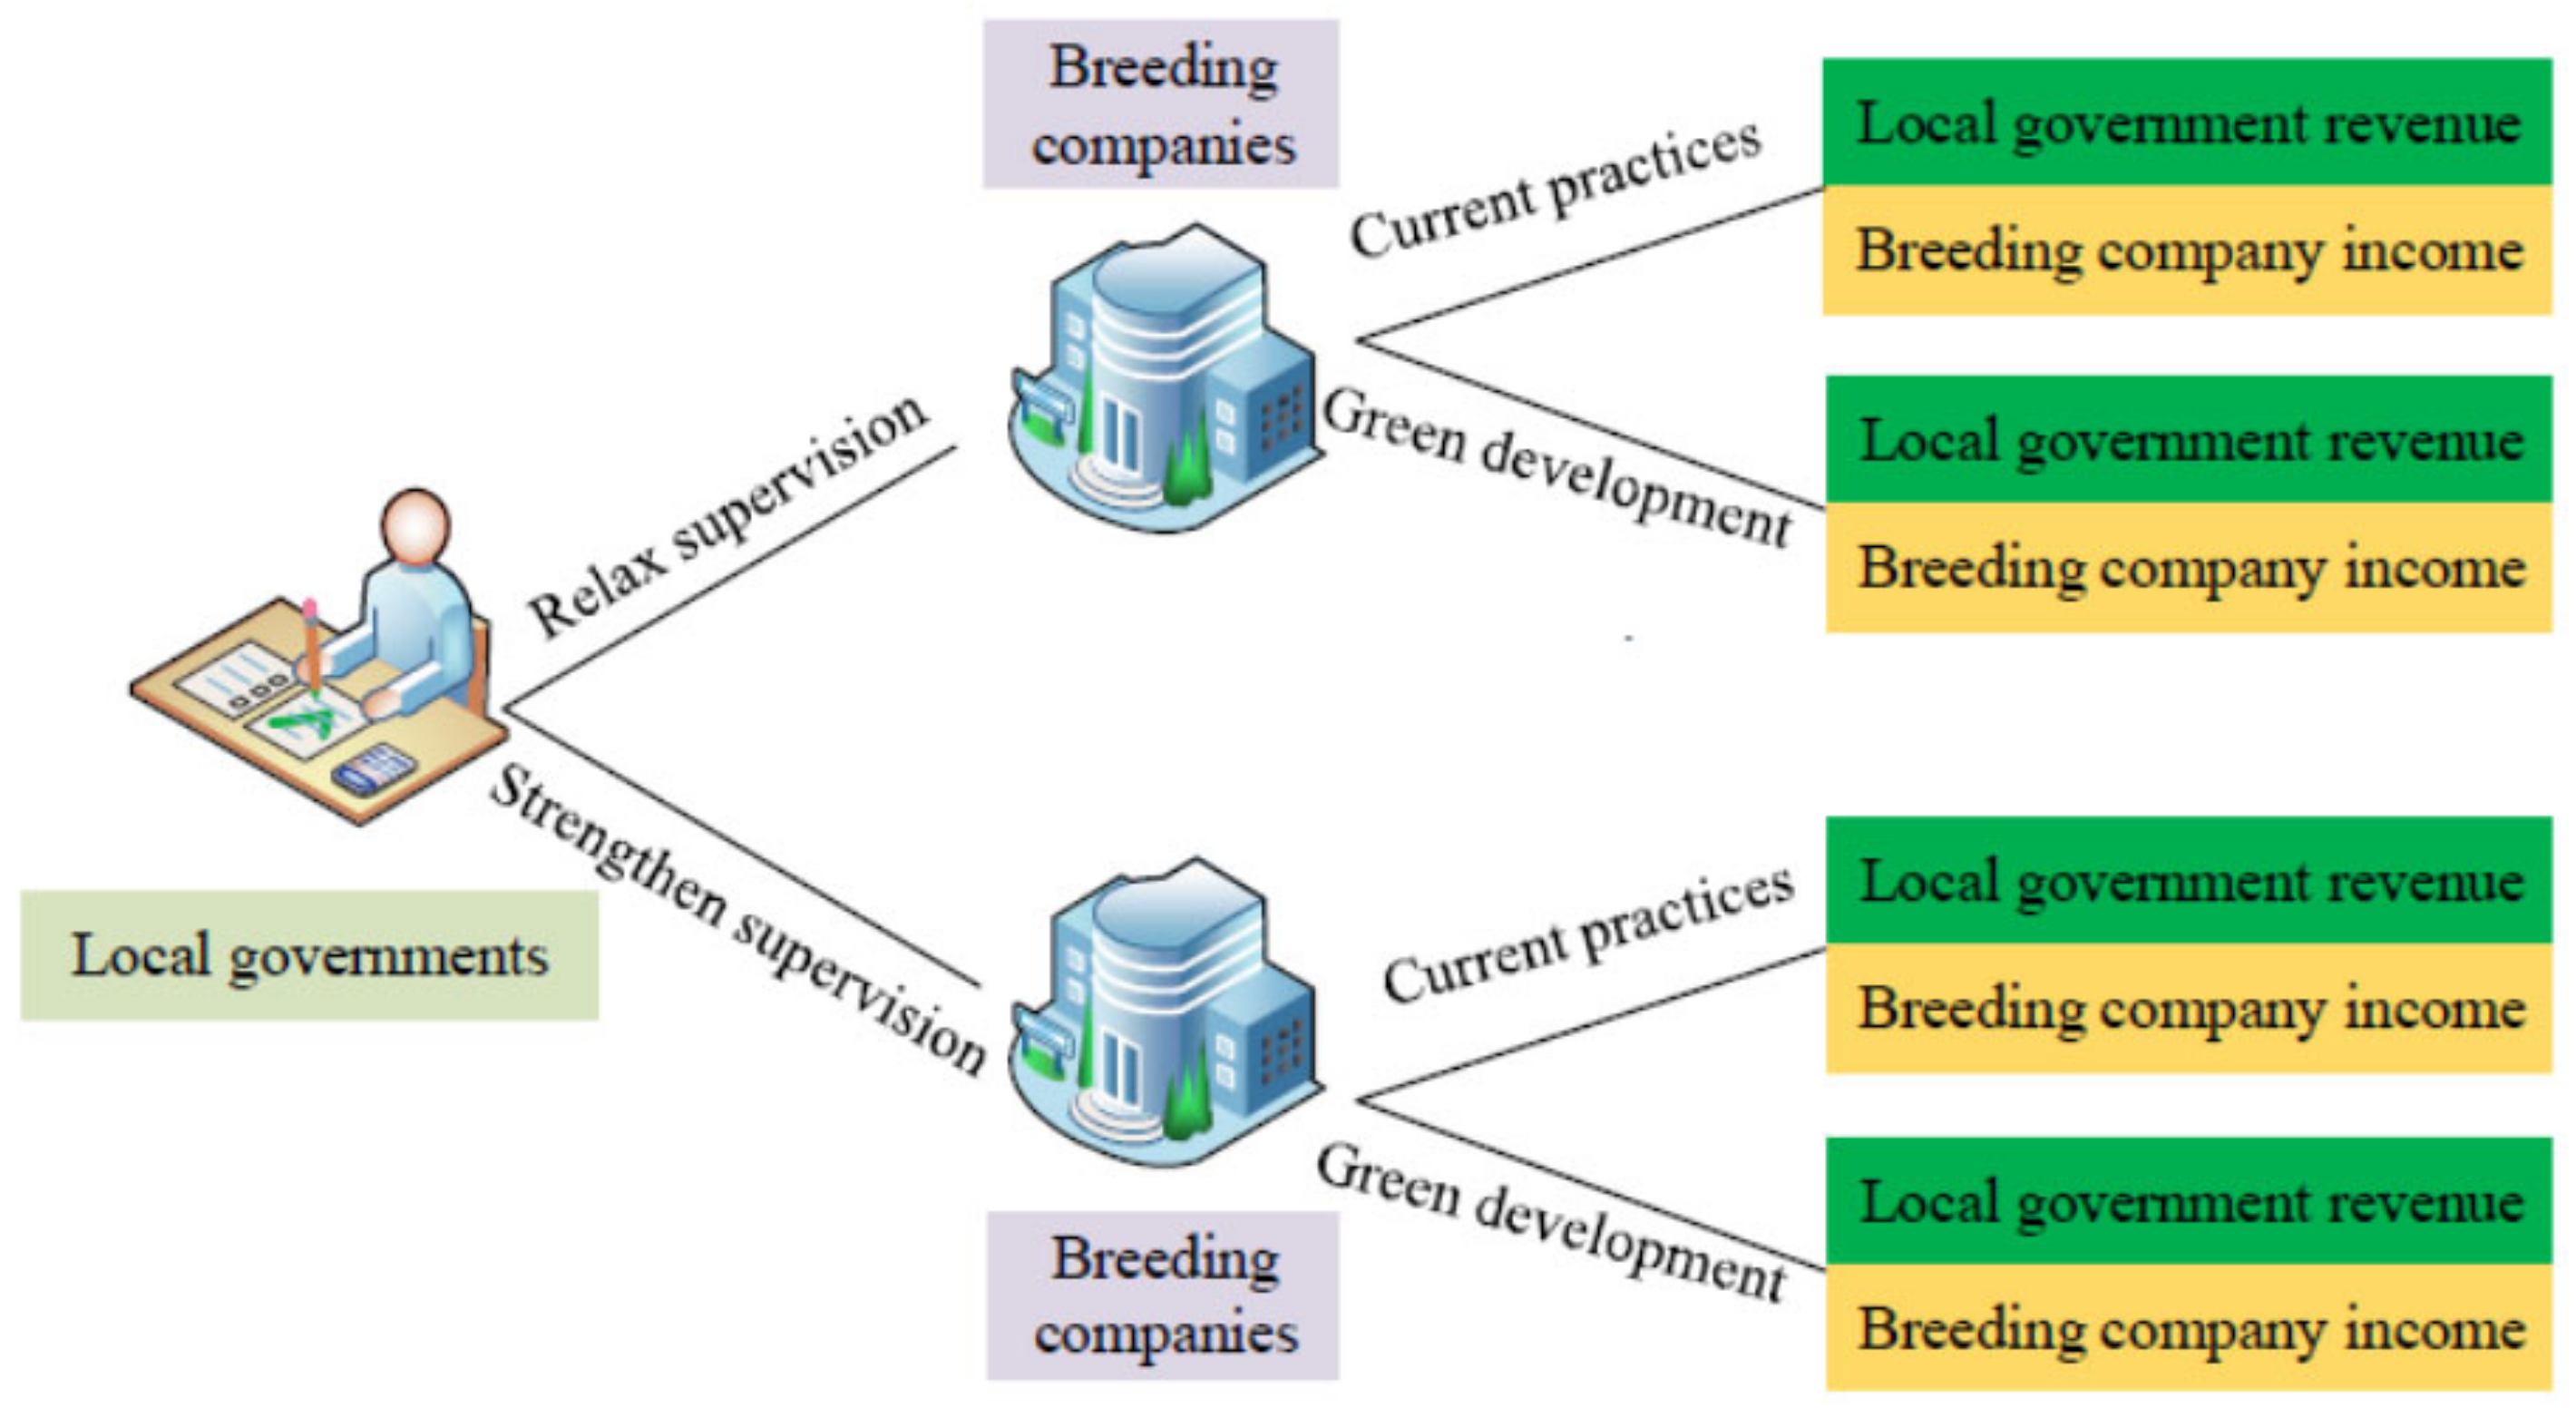
Local governments are the primary bodies of environmental supervision within their scope of jurisdiction and those responsible for the regional environmental quality. According to the “Regulation on the Prevention and Control of Pollution from Large-scale Breeding of Livestock and Poultry” (Article 5), “the environmental protection departments of the People’s Government, at or above the county level shall be responsible for the unified supervision and administration of the prevention and control of pollution from livestock and poultry breeding.” Therefore, players were defined as the local government and breeding companies (including large-scale breeding entities, such as pastural and livestock companies). The model was constructed, based on the following assumptions:
- a.
Players cannot accurately and completely obtain information regarding the other player’s decision-making mechanisms. Equally, the market cannot make accurate and timely judgments to maximize optimal benefits. That is, the players behave with bounded rationality, yet they can adjust decision-making by learning from past experiences and adapting to environmental changes.
- b.
The local government faces two decisions: relaxing or strengthening its supervision policy. Breeding companies face two decisions: maintaining the current practices or pursuing green development transformations. The decision tree in
Figure 2 clearly shows the strategic choices of the local governments and breeding companies.
- c.
Pursuing green development increases companies’ breeding costs, while generating additional benefits and positive externalities. Strengthening supervision increases the costs for the government, while increasing income through fines and expenditure through subsidies.
- d.
China’s environmental protection policies and supervision are becoming more and more stringent, and as national environmental policies tighten, local governments shift the static reward and punishment system to a dynamic one.
Figure 2.
Game tree between the local government and breeding companies.
Figure 2.
Game tree between the local government and breeding companies.
3.3. Model Description
Based on the above assumptions, a model was constructed, and the strategic space of the local government and breeding companies was defined as being either or , respectively.
To encourage green transformations, the local government provides subsidies for companies to support the construction of manure treatment facilities and imposes fines and environmental tax on companies that refuse to make changes. Environmental tax is positively correlated with the equivalent pollutants emitted/discharged. The tax rate was calculated, based on the Environmental Protection Tax Law. The implementation of green development is conducive to reducing the emissions/discharge of pollutants, such as carbon dioxide and chemical oxygen demand, leading to positive externalities (such as improvements in the environmental quality) for the local area. Maintaining current breeding practices deteriorates the local eco-environmental quality and causes negative externalities, such as limited resource depletion and environmental damage. The two strategies of the breeding companies correspond to varying production costs and profit before tax (PBT). Specifically, the use of clean energy, expanding pollution control coverage, and increasing environmental controls, led to an increase in costs for the business, while green transformations bring additional benefits, such as added product value and social recognition.
For the local government, the difference in costs between implementing relaxed and strict supervision policies differs substantially. Relaxed supervision increases time costs while lowering labor and other direct financial costs; strict supervision leads to higher direct investment costs in labor, materials, and financial resources but saves time. The effectiveness of environmental policy depends on the strategy adopted by the local government. Relaxed supervision results in fewer penalties and fines, while breeding companies receive neither subsidies nor penalties adopting green practices. Concurrently, the local government has fewer subsidy expenditures and lower income from fines. Regardless of the strategy implemented by the government, the positive and negative impacts of breeding companies’ production model on the regional environment remain.
The varying income and expenditures were then used to form a payoff matrix. The results are presented in
Table 1, and the definitions of the symbols are listed in
Table 2.
3.4. Evolutionary Game Strategy
3.4.1. Strategies of the Breeding Companies
When a breeding company adopts the green development strategy, its expected utility is expressed as
When a breeding company elects to maintain its current practice, its expected utility is expressed as
Thus, the average expected utility of the two strategies can be expressed as
Formula (4) outlines the replicator dynamics equation
The first derivative of
is expressed as
Let ; then , , and . According to stability theory, when and , is the evolutionarily stable strategy (ESS). Therefore, if , regardless of the value of , and . is a stable state, and any production decision by the breeding company after this point, maintains the stable strategy. If, however, different scenarios involving require further exploration, as outlined in the following paragraphs.
Scenario 1: If , , then . Here, and ; hence, is the only ESS, and the company adopts the green development strategy. For a breeding company in Scenario 1, the income from green development always exceeds that of maintaining current practices, regardless of the strategy adopted by the government. Hence, the company chooses the green development strategy.
Scenario 2: If , , which means . There are two possibilities. When , , , is the only ESS. When , , , is the only ESS. In Scenario 2, if the government reinforces supervision, the income generated by the transformation to green development exceeds that of maintaining current practices; however, if the government relaxes supervision, the income from maintaining current practices exceeds that of green development.
Scenario 3: if , , then . In this case, , , and is the only ESS. For a breeding company in Scenario 3, the income generated by maintaining current practices always exceeds that of green development, regardless of the strategy preferred by the government. Hence, the company prefers to maintain current practices.
3.4.2. Strategies by the Local Government
When the local government chooses an enhanced supervision, its expected utility is
When the local government adopts a relaxed supervision, its expected utility can be expressed as
Thus, the average expected utility of the local government is
Formula (9) is the relevant replicator dynamics equation:
The first derivative of
is represented in
Let , then , , and . According to stability theory, when and , is the ESS. Referring to the aforementioned studies, the following hypotheses were proposed:
If , regardless of the value of , and . is a stable state, and any supervision strategy adopted following this point is a stable strategy. If , different scenarios of emerge, as outlined below.
Scenario 4: If nad , then . , and , and is the only ESS, indicating that the local government adopts a relaxed supervision strategy. For the government in Scenario 4, the income generated by the relaxed supervision always exceeds that generated by the stricter supervision, regardless of the strategy adopted by the breeding companies, and the government prefers a relaxed supervision strategy.
Scenario 5: If , , which means . There are two possibilities. When , , , and is the only ESS. When , , , and is the only ESS. For the government in Scenario 5, the income earned from a relaxed supervision exceeds that earned from a strict supervision if the breeding companies adopt the green development strategy; however, if they maintain their current practices, the income generated by strengthening the supervision exceeds that generated by the relaxed position. At this point, the cost of environmental regulations under a relaxed supervision would be lower than the sum of the environmental regulation costs and subsidy expenditures under the strict supervision strategy.
Scenario 6: If , , then . In this scenario, , , and is the only ESS, indicating that the local government prefers a strict supervision. For the government in Scenario 6, the income from strengthening supervision always exceeds that from relaxing supervision, regardless of the strategy adopted by the breeding companies. Hence, the government adopts a stricter supervision strategy. In such a case, the costs of environmental regulation under a relaxed supervision are higher than the sum of the costs of environmental regulations and subsidy expenditures under a strict supervision.
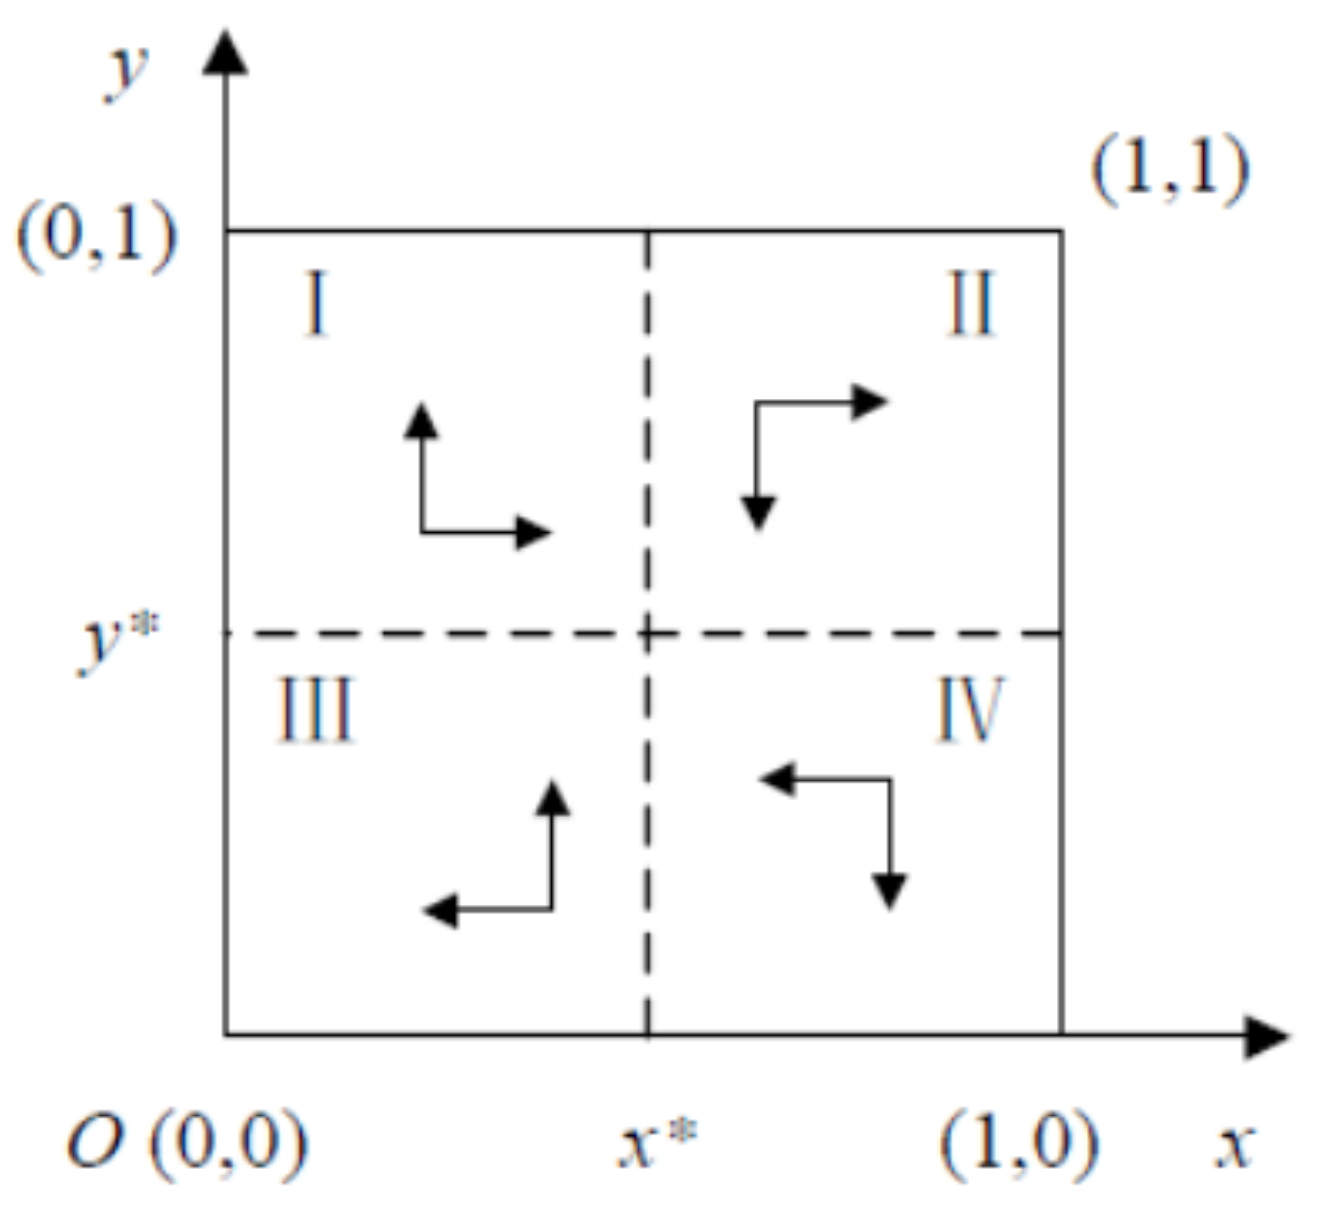
Figure 3 outlines the evolutionary phase positions of both players in Scenarios 2 and 5.
3.5. Stability Analysis
The above analysis shows that the two-player game involving local governments and breeding companies correspond to three stable strategies. From the perspective of research rigor, this study considers and presents the whole situation when local governments and aquaculture enterprises make different decisions. Based on China’s current animal husbandry development and policy supervision, complete adoption of either strategy by either party is neither in line with reality nor conforms to the underlying premise of this study (tightening the regulatory system). Therefore, the analyses of Scenarios 1, 3, 4, and 6 were omitted, and focus was cast on the dynamic evolution of the system in Scenarios 2 and 5. Solving Formulas (4) and (9) simultaneously, generates a two-dimensional replicator dynamic system (I), expressed as
Let and ; the equilibrium points (0, 0), (0, 1), (1, 0), (1, 1), and (, ) can then be obtained, and , .
Proposition 1. The equilibrium points (0, 0), (0, 1), (1, 0), and (1, 1) are saddle points, and (, ) is the center point of system (I) but not the asymptotic ESS.
Proof. Using the local stability analysis of a Jacobian matrix to investigate the two-dimensional nonlinear dynamic system, the Jacobian matrix of System (I) can be expressed as.
where
According to the embedded assumptions, any initial or evolved points need to be in a two-dimensional space
; that is,
and
, which can be interpreted as the equilibrium condition for the replicator dynamic system.
Table 3 presents the numerical expressions and ESS of the equilibrium points. The matrix determinants of the equilibrium points (0, 0), (0, 1), (1, 0), and (1, 1) are negative; hence, these four points are saddle points.
Table 3 also exhibits the center point (
,
) of System (I). Its Jacobian matrix is
where
The eigenvalue of matrix
can be represented using Formula (20):
The eigenvalues
and
of the equilibrium point (
,
) in the above formula are imaginary roots. According to the studies of Taylor and Jonker [
36] and Morin and Samson [
37], (
,
) is the central point (stable equilibrium point) of the two-dimensional nonlinear dynamic system; however, it is not the asymptotic ESS. This concludes the proof. □
Referring to Liu et al. [
38], the periodic fluctuation of System (I) can be interpreted, and the motion trajectory of the replicator dynamics equation at the center point (
,
) is
where
,
, and
The hybrid strategy trajectory of the replicator dynamic system is a closed loop curve centered on point (, ). The economic implications are, thus, as follows: if the government relaxes supervision, the breeding companies maintain current practices; if the government strengthens supervision, the breeding companies pursue green development. Similarly, if the breeding companies maintain current practices, the government strengthens supervision; if the breeding companies adopt the green development strategy, the government relaxes supervision. Therefore, no ESS is possible under a static reward and punishment system.
4. Evolutionary Game and Numerical Simulation under Strict Policies
The central government has incorporated the ecological construction into the performance assessments of local governments, serving as a political binding force for local governments to choose stricter supervision policies [
39]. However, over the long term, relying on government supervision to maintain green development is unsustainable, as it increases the financial stress of the local government and leads to policy dependence. Once future policy is relaxed, the willingness of enterprises to maintain transformations reduces, correspondingly. Hence, the high-cost regulatory strategy should be replaced with an effective and flexible punishment system. In this section, the stability of the replicator dynamic system under stricter yet dynamic reward and punishment policies is examined. The empirical analysis and numerical simulation were performed, based on survey and statistical data.
4.1. System Stability under Strict Environmental Policies
Assuming that the government policies become stricter as environmental pollution worsens, breeding companies that adopt green development are provided with more subsidies, and breeding companies that maintain current practices have more fines imposed. Thus, the subsidy amount is positively correlated with the probability of adopting the green development strategy, and the amount of fines is positively correlated with the probability of maintaining current practices. The original fixed values
and
are adjusted separately, as a function of breeding companies’ production decisions,
,
, where
is the lower fine limits and
is the upper subsidy limits. Thus, a two-dimensional replicator dynamic System (II) can be obtained
Let and ; the equilibrium points (0, 0), (0, 1), (1, 0), (1, 1), and (, ) can then be obtained, and , .
Proposition 2. Equilibrium points (0, 0), (0, 1), and (1, 1) are the saddle points, (1, 0) is the point of instability, and (, ) is the asymptotic ESS of the system.
Proof. Based on the above simultaneous equations, the Jacobian matrix of System (II) can be expressed as
where
Any initial and evolved point needs to be in two-dimensional space , where and , which can be interpreted as the equilibrium condition for the replicator dynamic system. By calculating the matrix determinant and trace corresponding to the equilibrium points, equilibrium points (0, 0), (0, 1), and (1, 1) are indeed the saddle point, and (1, 0) is an unstable point. Substituting the central point (, ) into the Jacobian matrix shows that the characteristic roots of the matrix ( and ) are a pair of characteristic complex roots with negative real components. Thus, System (II) has asymptotic stability, and the evolutionary trajectory approximates a stable equilibrium point (, ). This concludes the proof. □
4.2. Empirical Analysis and Simulation
Affected by factors, such as the variance in the development of the local economy and in the animal husbandry industry, local governments’ attitude toward and reinforcement of governance of animal husbandry resources and environmental issues, differs substantially [
40,
41] In general, more developed eastern coastal regions take the lead in promoting the transformation and in transforming animal husbandry practices. Such regions are thus pioneering the implementation of new environmental policies, while the central and western regions have less strict government supervision, owing to limited financial resources and more conservative development attitudes [
42]. For that reason, this study combined statistical [
43,
44] and survey data to conduct a series of numerical simulations, with the aim of providing a reliable empirical example of the above theoretical analysis.
4.2.1. Data Analysis
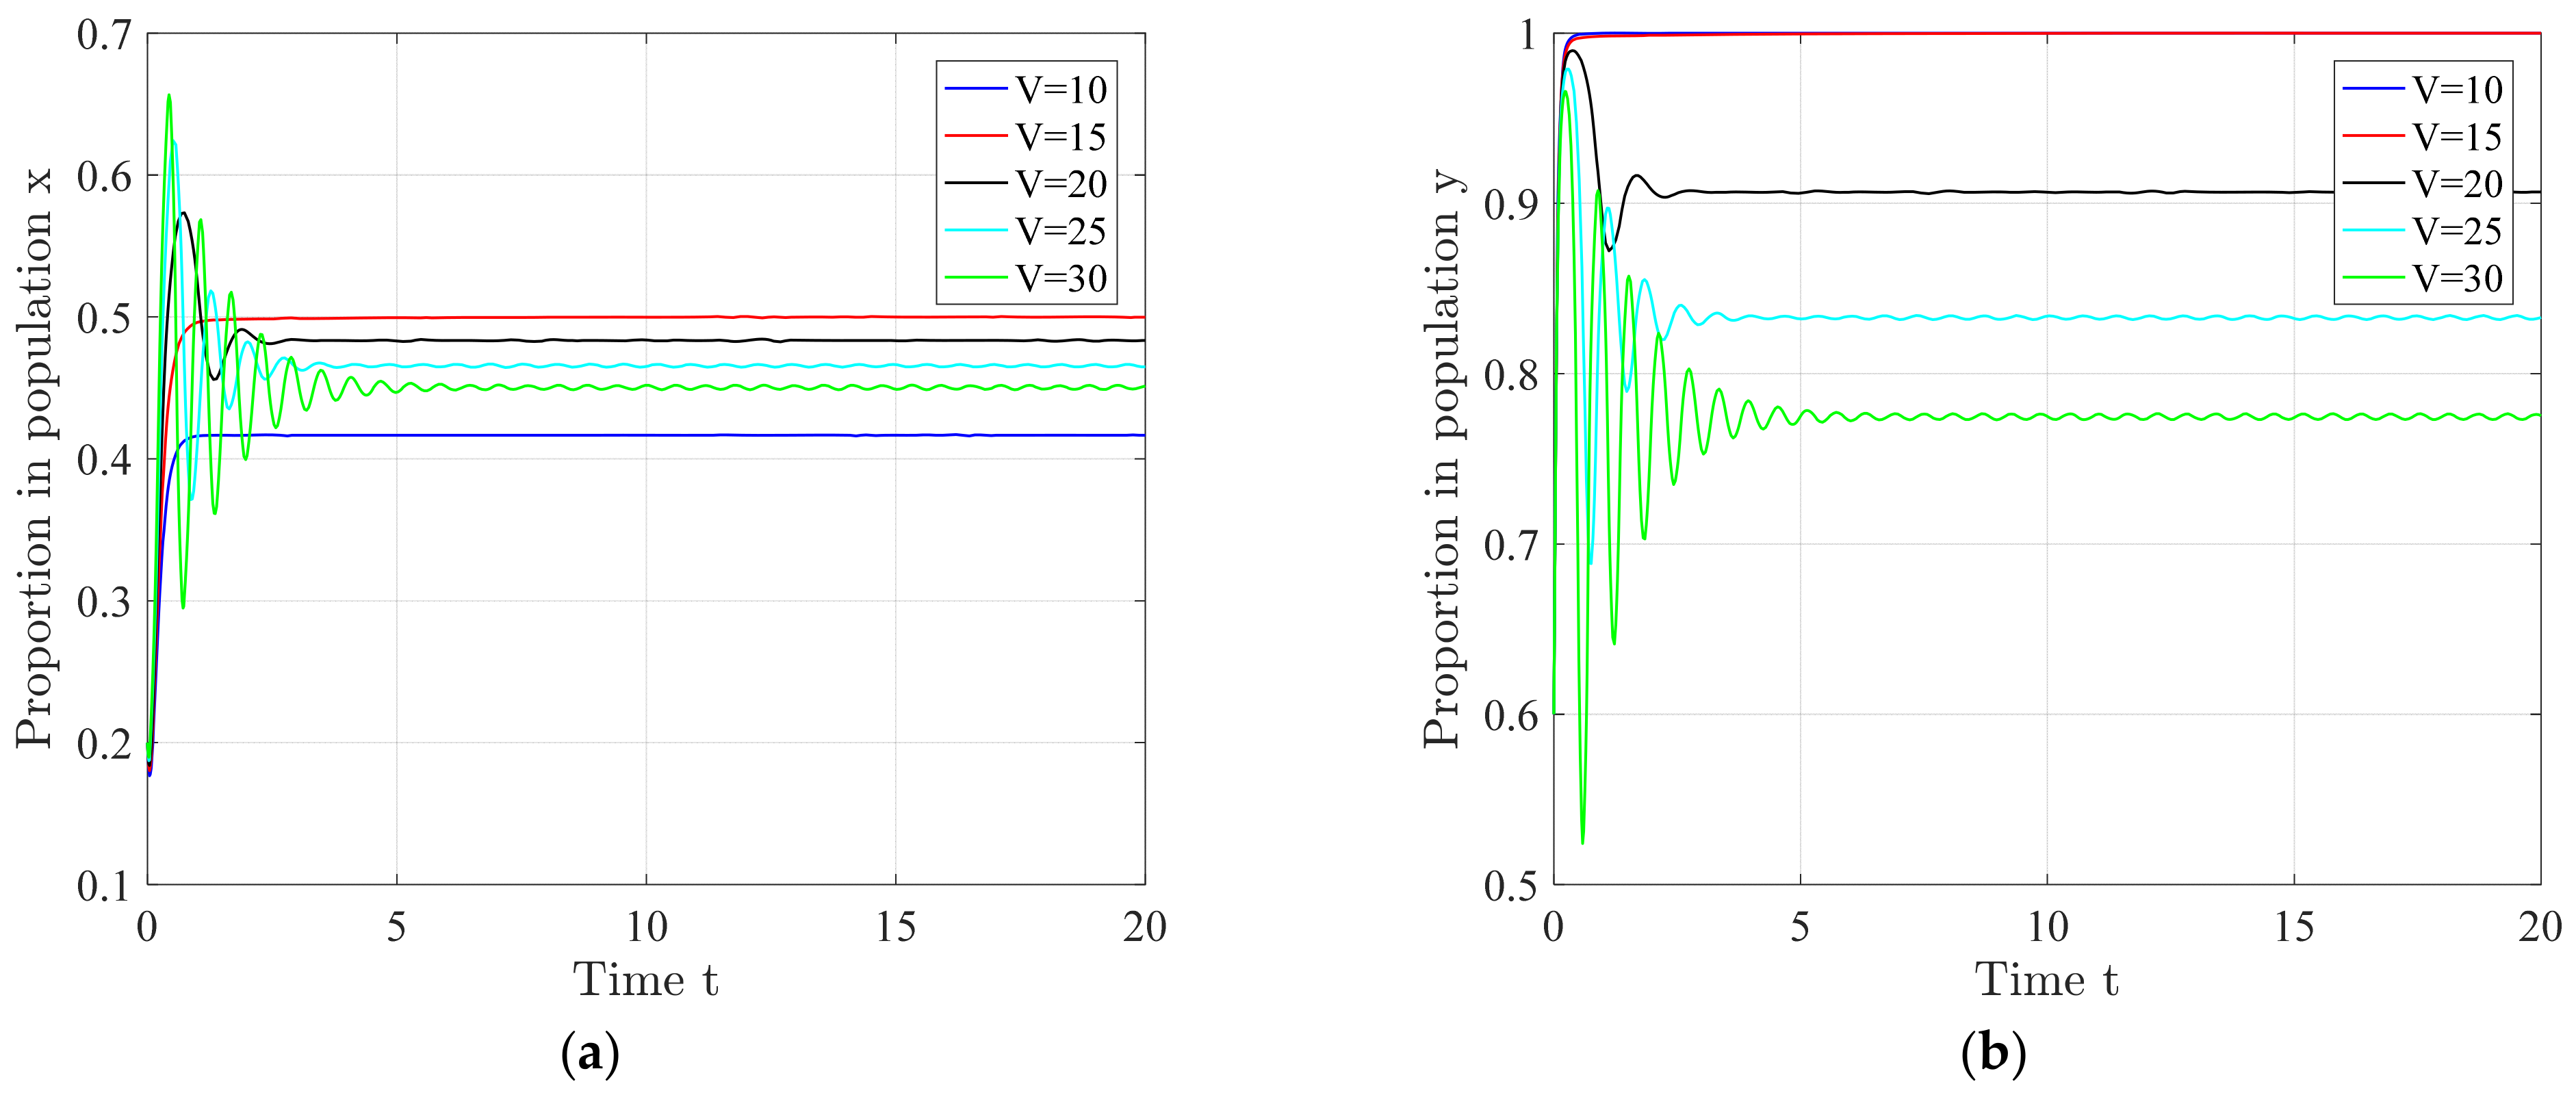
The simulation parameter values were assigned, based on the assumption that Scenarios 2 and 5 are satisfied. The specific contexts of China were also considered. Specifically, the China Environment Statistical Yearbook and the China Statistical Yearbook were used to collect the corresponding data. Zhejiang and Shaanxi Provinces, which were similar in scale, in regard to animal husbandry production, and are located in the eastern coastal and western inland regions, respectively, were selected. The environmental regulation costs, during strict and relaxed supervision policies were estimated, based on the difference in investments in environmental governance between the two provinces. It was estimated that and were 10 and 16, respectively. To determine the differences in PBT for the breeding companies when adopting different strategies, a survey was conducted among the breeding companies in Jilin, Shanxi, and Shandong Provinces. The results showed that during the initial stage of the transformation, replacing traditional energy with clean energy increased costs by approximately 10%, and the construction and operation of environmental protection facilities increased the costs by 30%. In addition, a comprehensive calculation revealed that the average PBT of companies that adopted the green development strategy, was 33% lower than that of companies that maintained current practices. Hence, and were assigned the values of 300 and 200, respectively. The results also showed that green development was conducive to increasing the value added of products, reducing production risks, and enhancing the goodwill value of corporate reputation. Hence, compared to maintaining current practices, companies could obtain 20–30% increases in additional benefits. It is assumed that the local government imposes fines on companies that maintain current practices and issues subsidies for those that elect a green development strategy. Thus, the revenue for companies that pursue change increases, while the net income of companies that resist change reduces. Based on common practice, the value for the rewards and fines were defined as 10% of the PBT.
4.2.2. Simulation Results
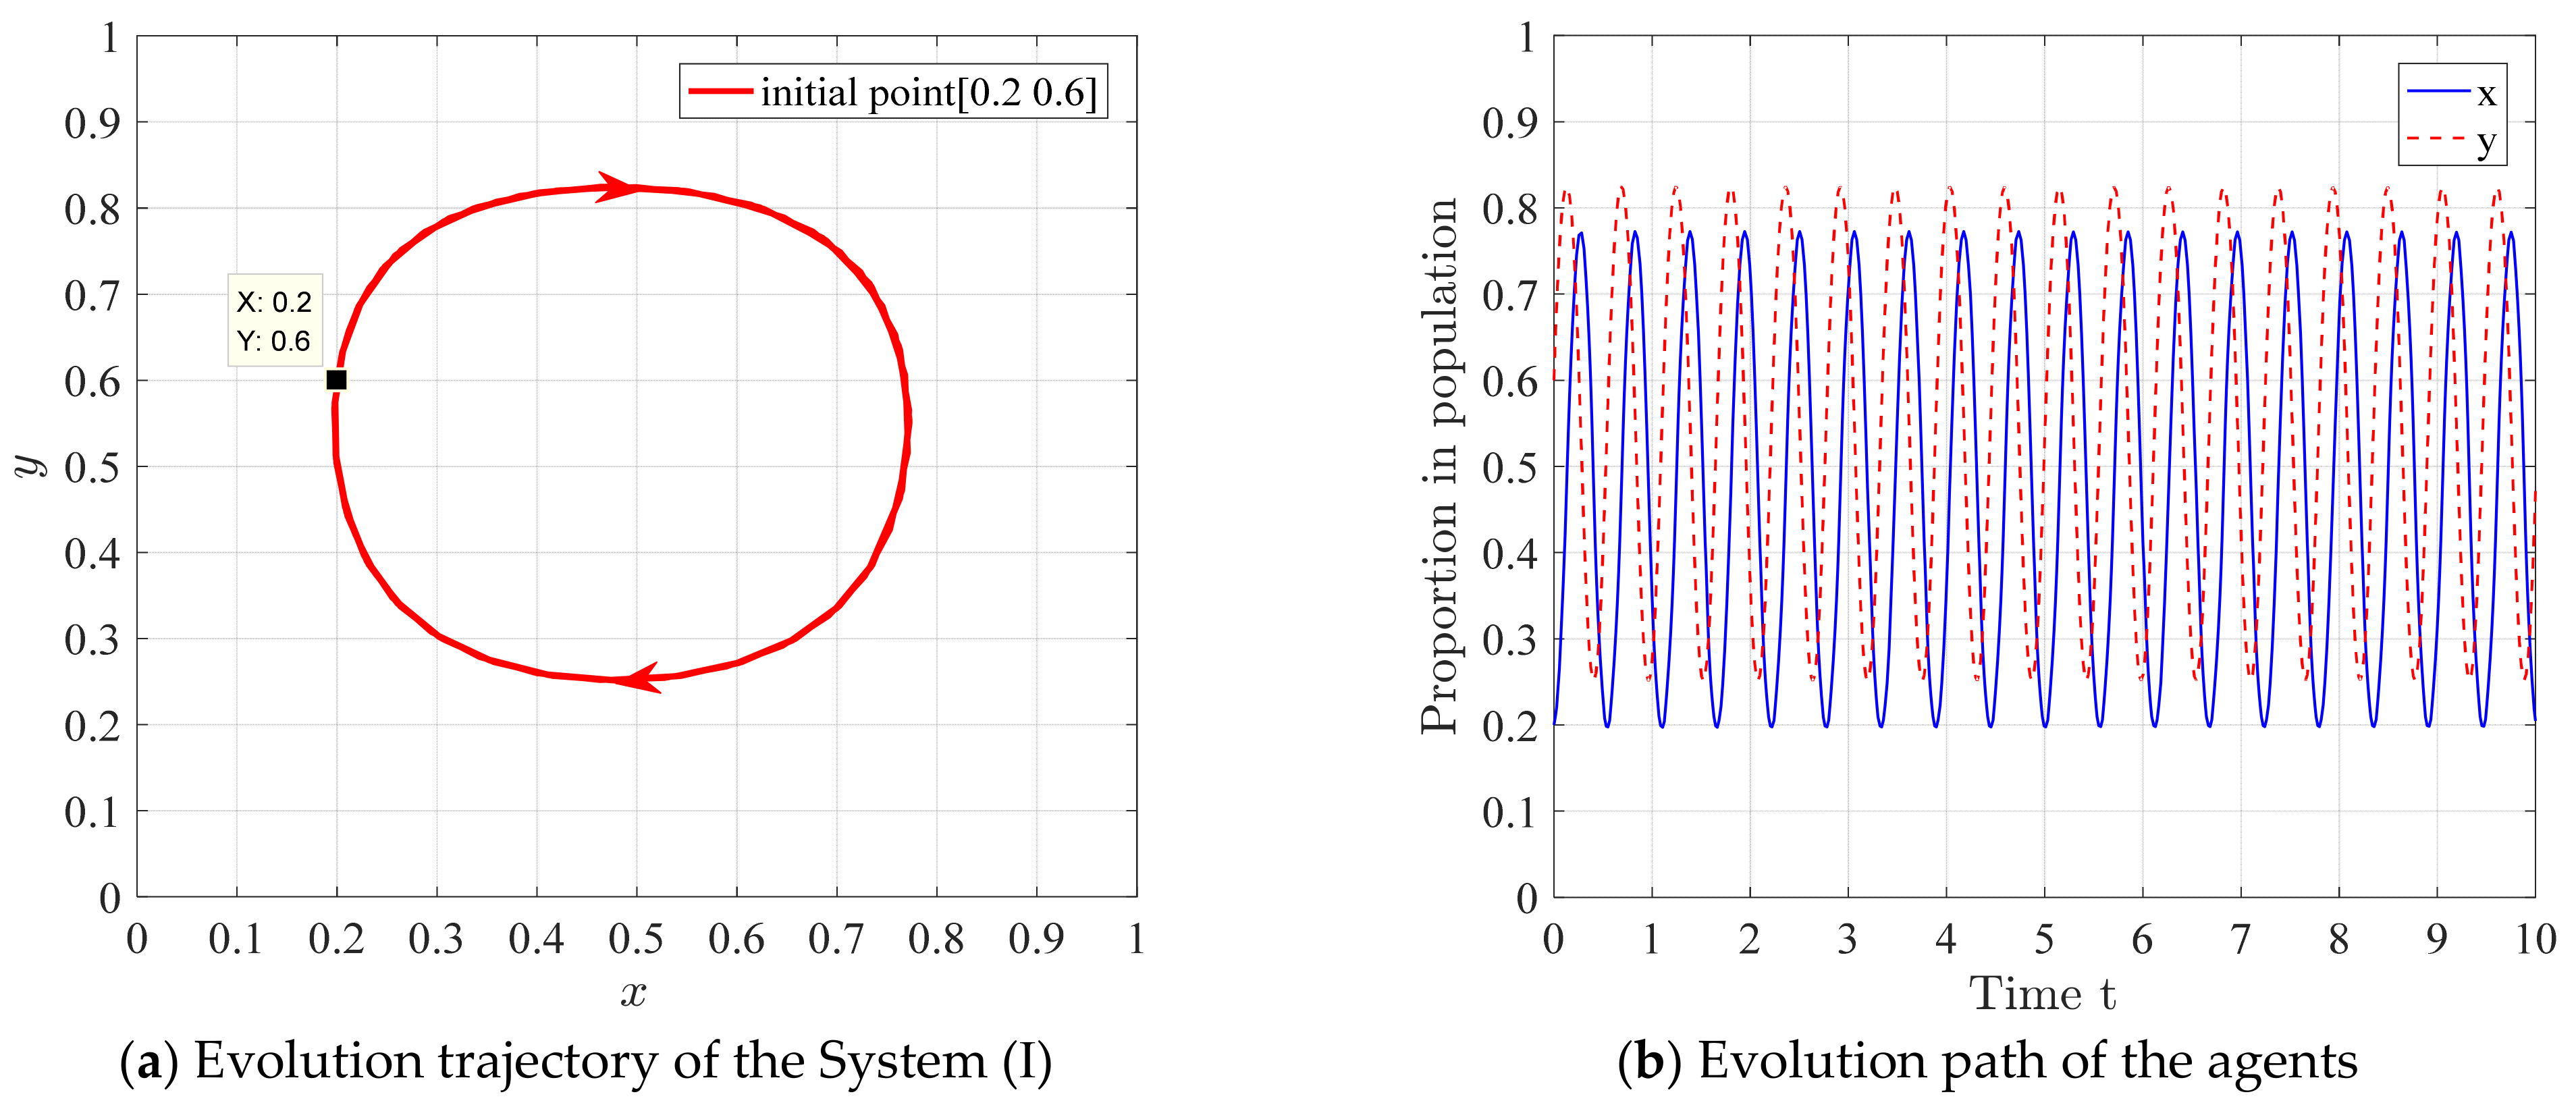
The dynamic evolutionary processes for Systems (I) and (II) are shown in
Figure 4 and
Figure 5.
Figure 4a shows that in the absence of stricter environmental protection requirements, the evolutionary trajectory is a closed loop surrounding the central point; therefore, the system does not have asymptotic stability. This finding supports Proposition 1.
Figure 4b shows the evolutionary paths of the local government and breeding enterprises over time. The trajectories under a static reward and punishment system vary evenly.
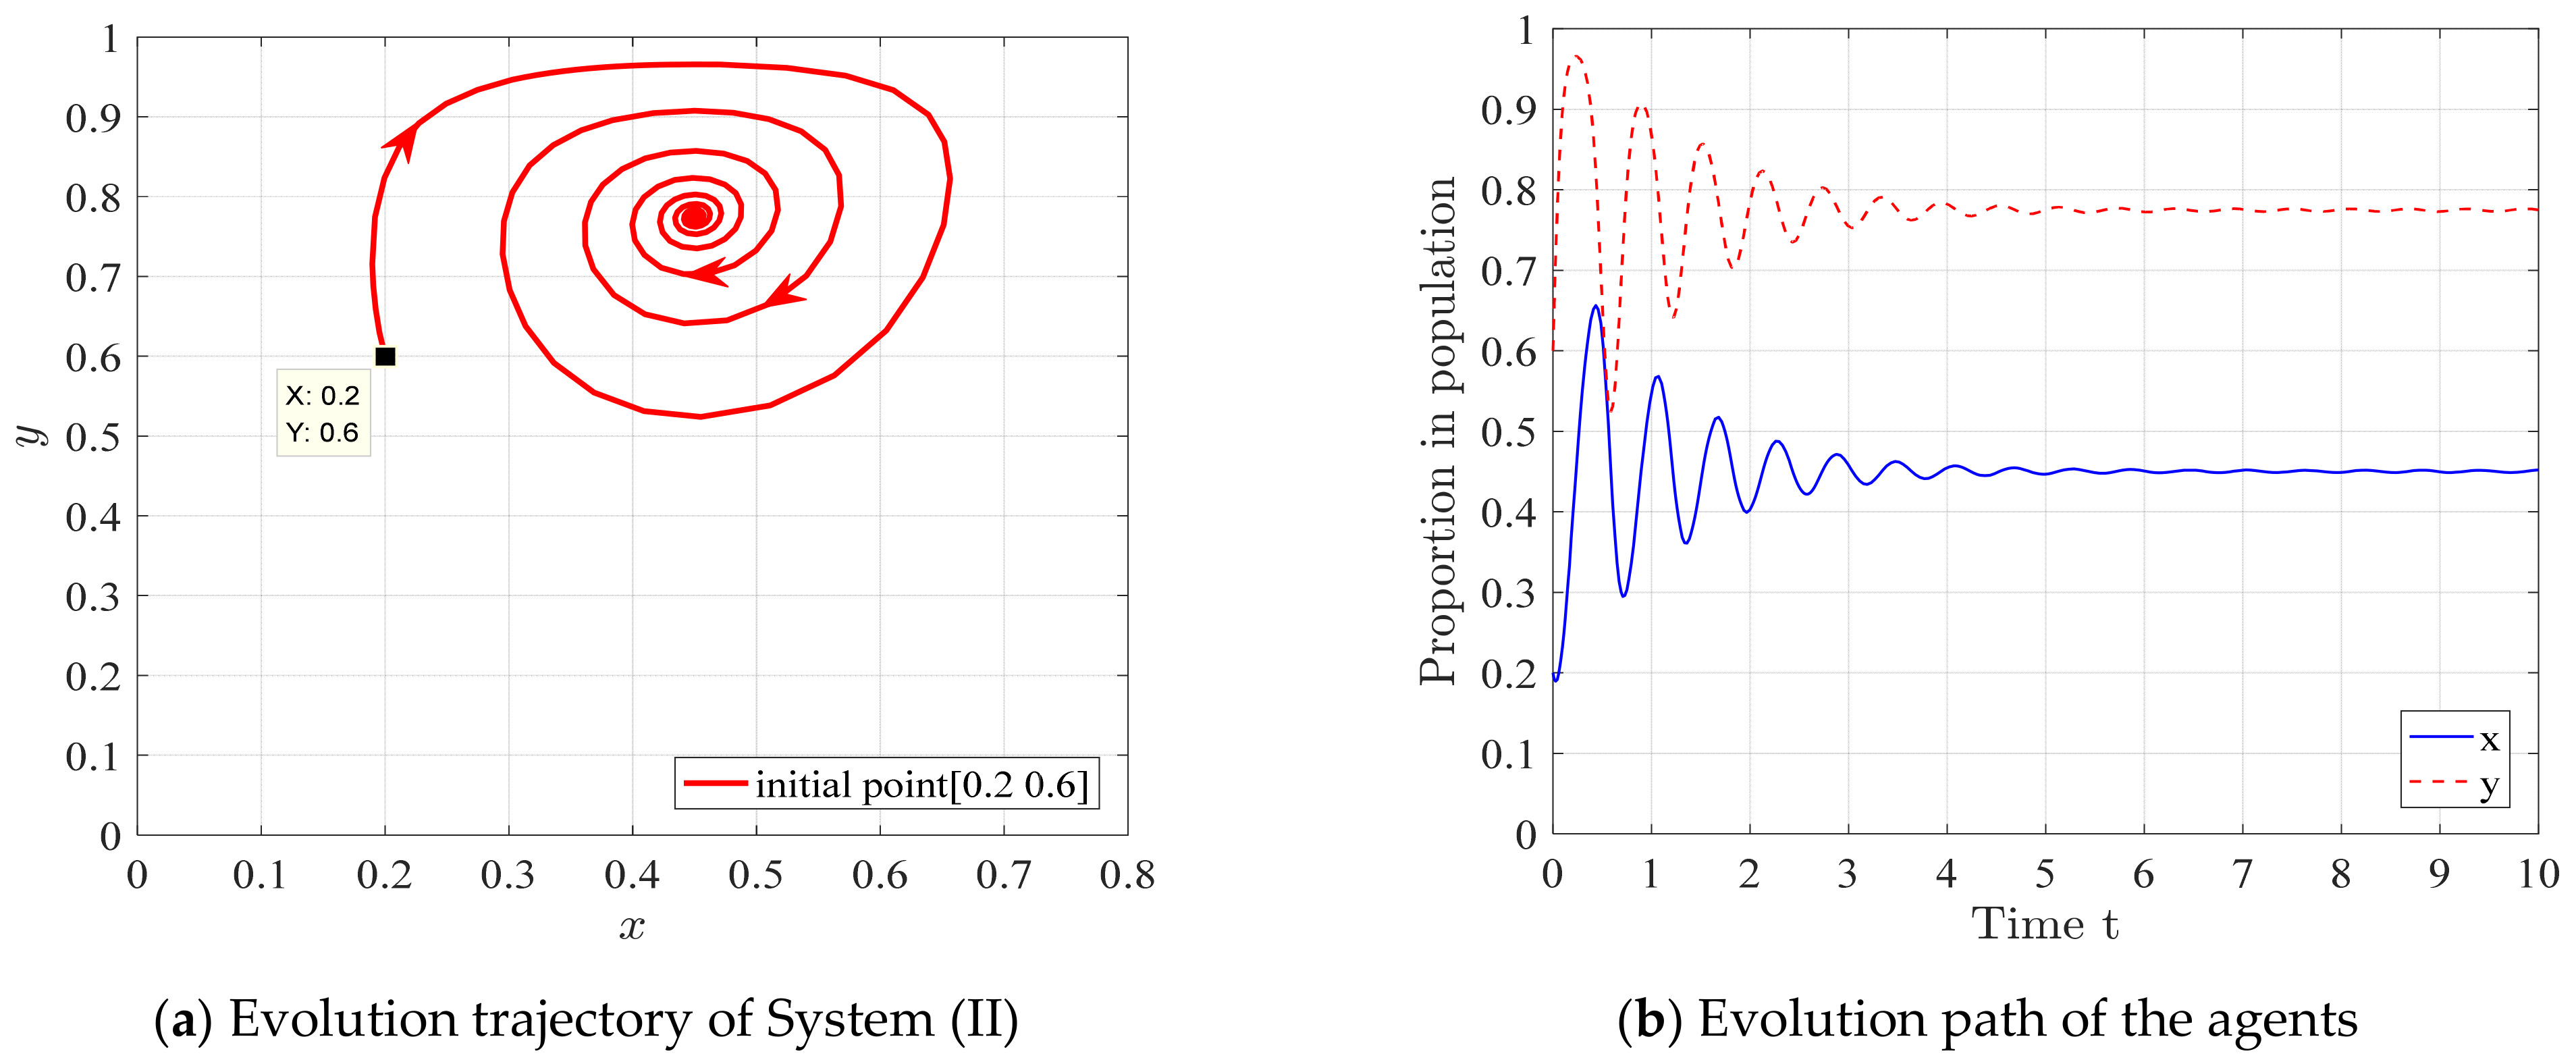
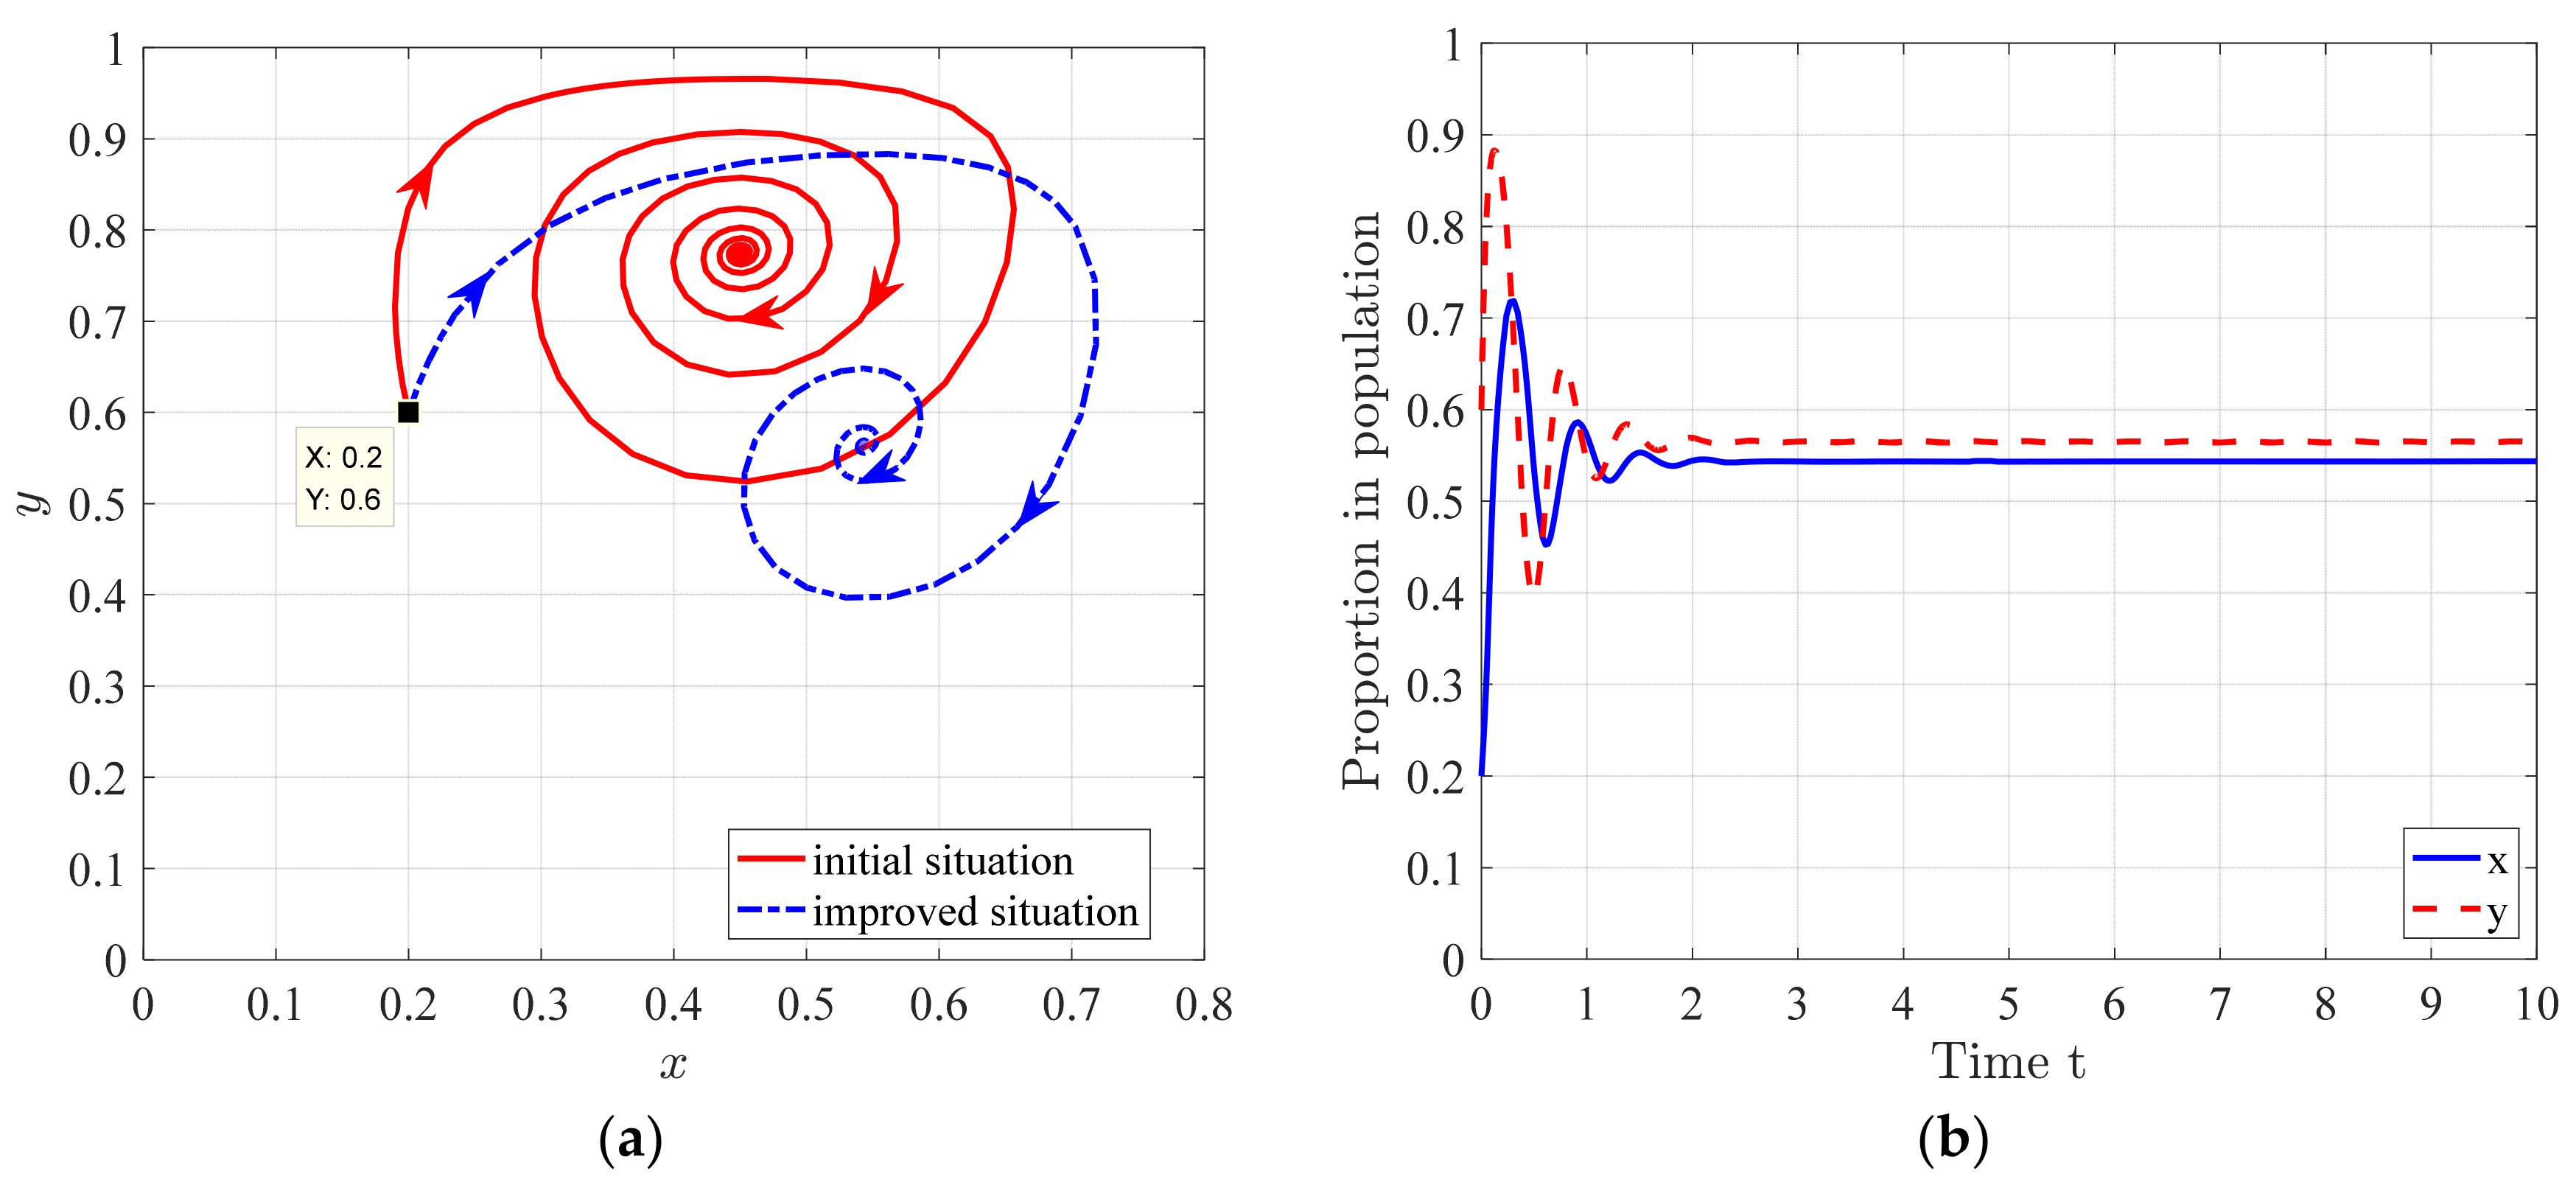
Figure 5 illustrates the evolutionary paths of both parties under stricter environmental protection requirements.
Figure 5a demonstrates that stricter policies facilitate spiral convergence of the evolutionary trajectory, and a Nash equilibrium exists, which supports Proposition 2.
Figure 5b shows that the proportion of local governments that elect to strengthen supervision and that of breeding companies that adopt green development strategies no longer fluctuate infinitely but, rather, stabilize accordingly.
Thus, a rigid reward and punishment system does not promote green development, and adopting a static system is likely to cause continuous fluctuations in the decisions of both players. However, applying the dynamic reward and punishment system may lead to stabilized decisions. In China, green transformations in animal husbandry face multiple risks, such as policy changes, market shocks, and animal diseases. Therefore, the green development process requires stability amidst fluctuations if it is to be adopted. A flexible reward and punishment system is thus important to promoting stability in decision-making. In addition, the findings also indicate that relying solely on environmental tax and fixed rewards and penalties does not promote the transition to sustainable green development. Local governments must adjust the reward and punishment system in a timely manner in conjunction with the production outputs of breeding enterprises and build a dynamic reward and punishment system, if such a system is to be effective.
6. Conclusions and Practical Implications
Based on an evolutionary game model, this study explored the behavioral decision-making of local governments and breeding companies, under the premise of bounded rationality. An evolutionary game with a dynamic reward and punishment system under strict environmental protection requirements was constructed, and statistical and survey data were used for the numerical simulation and sensitivity analysis. The conclusions are as follows.
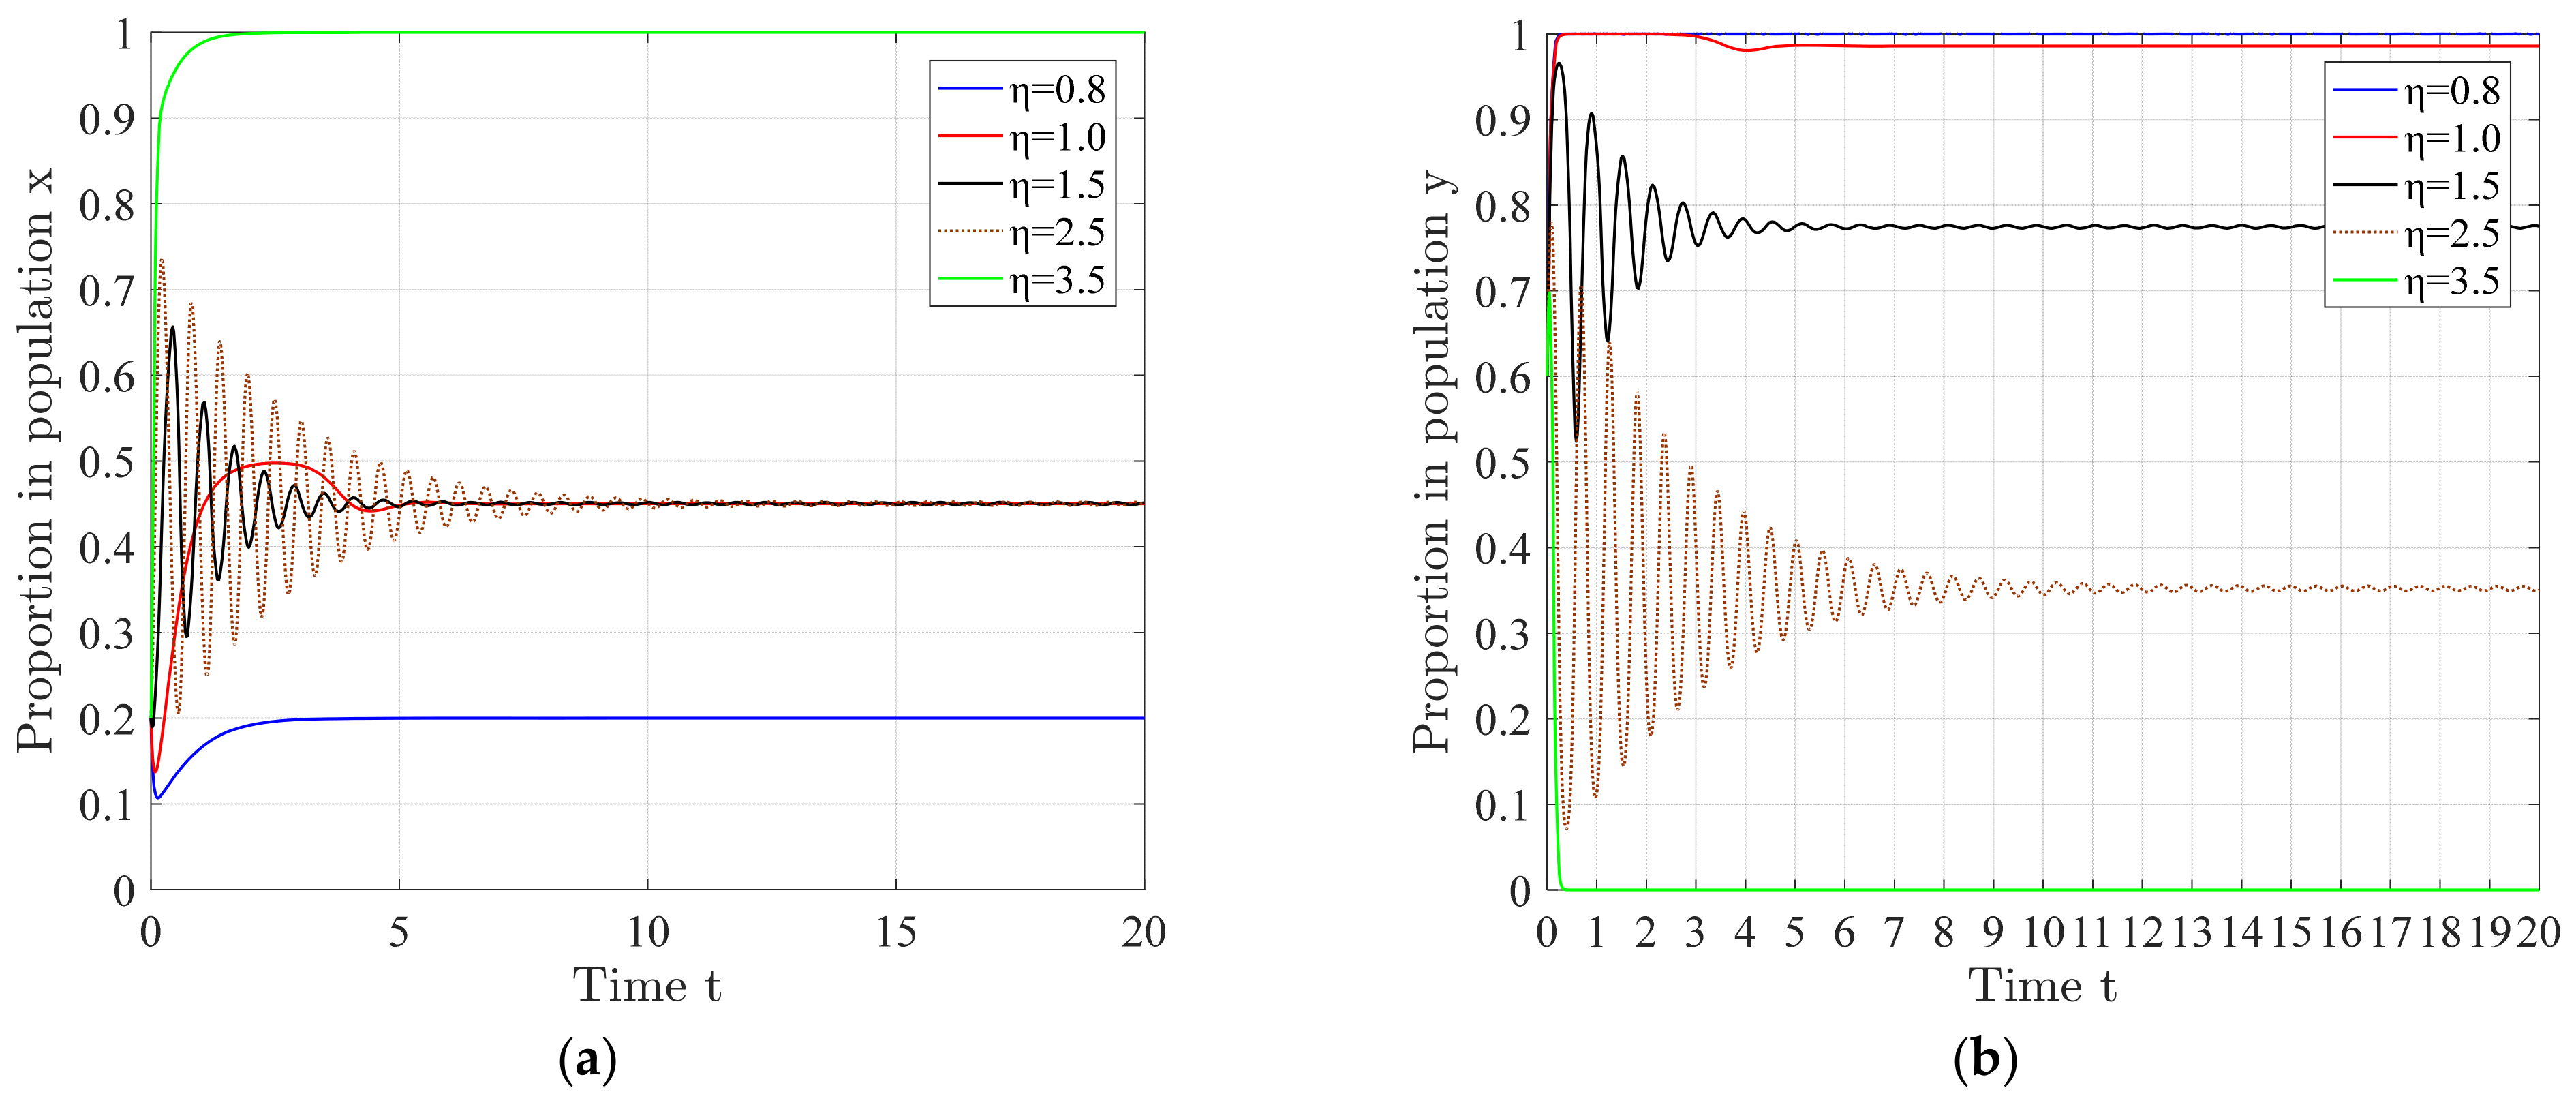
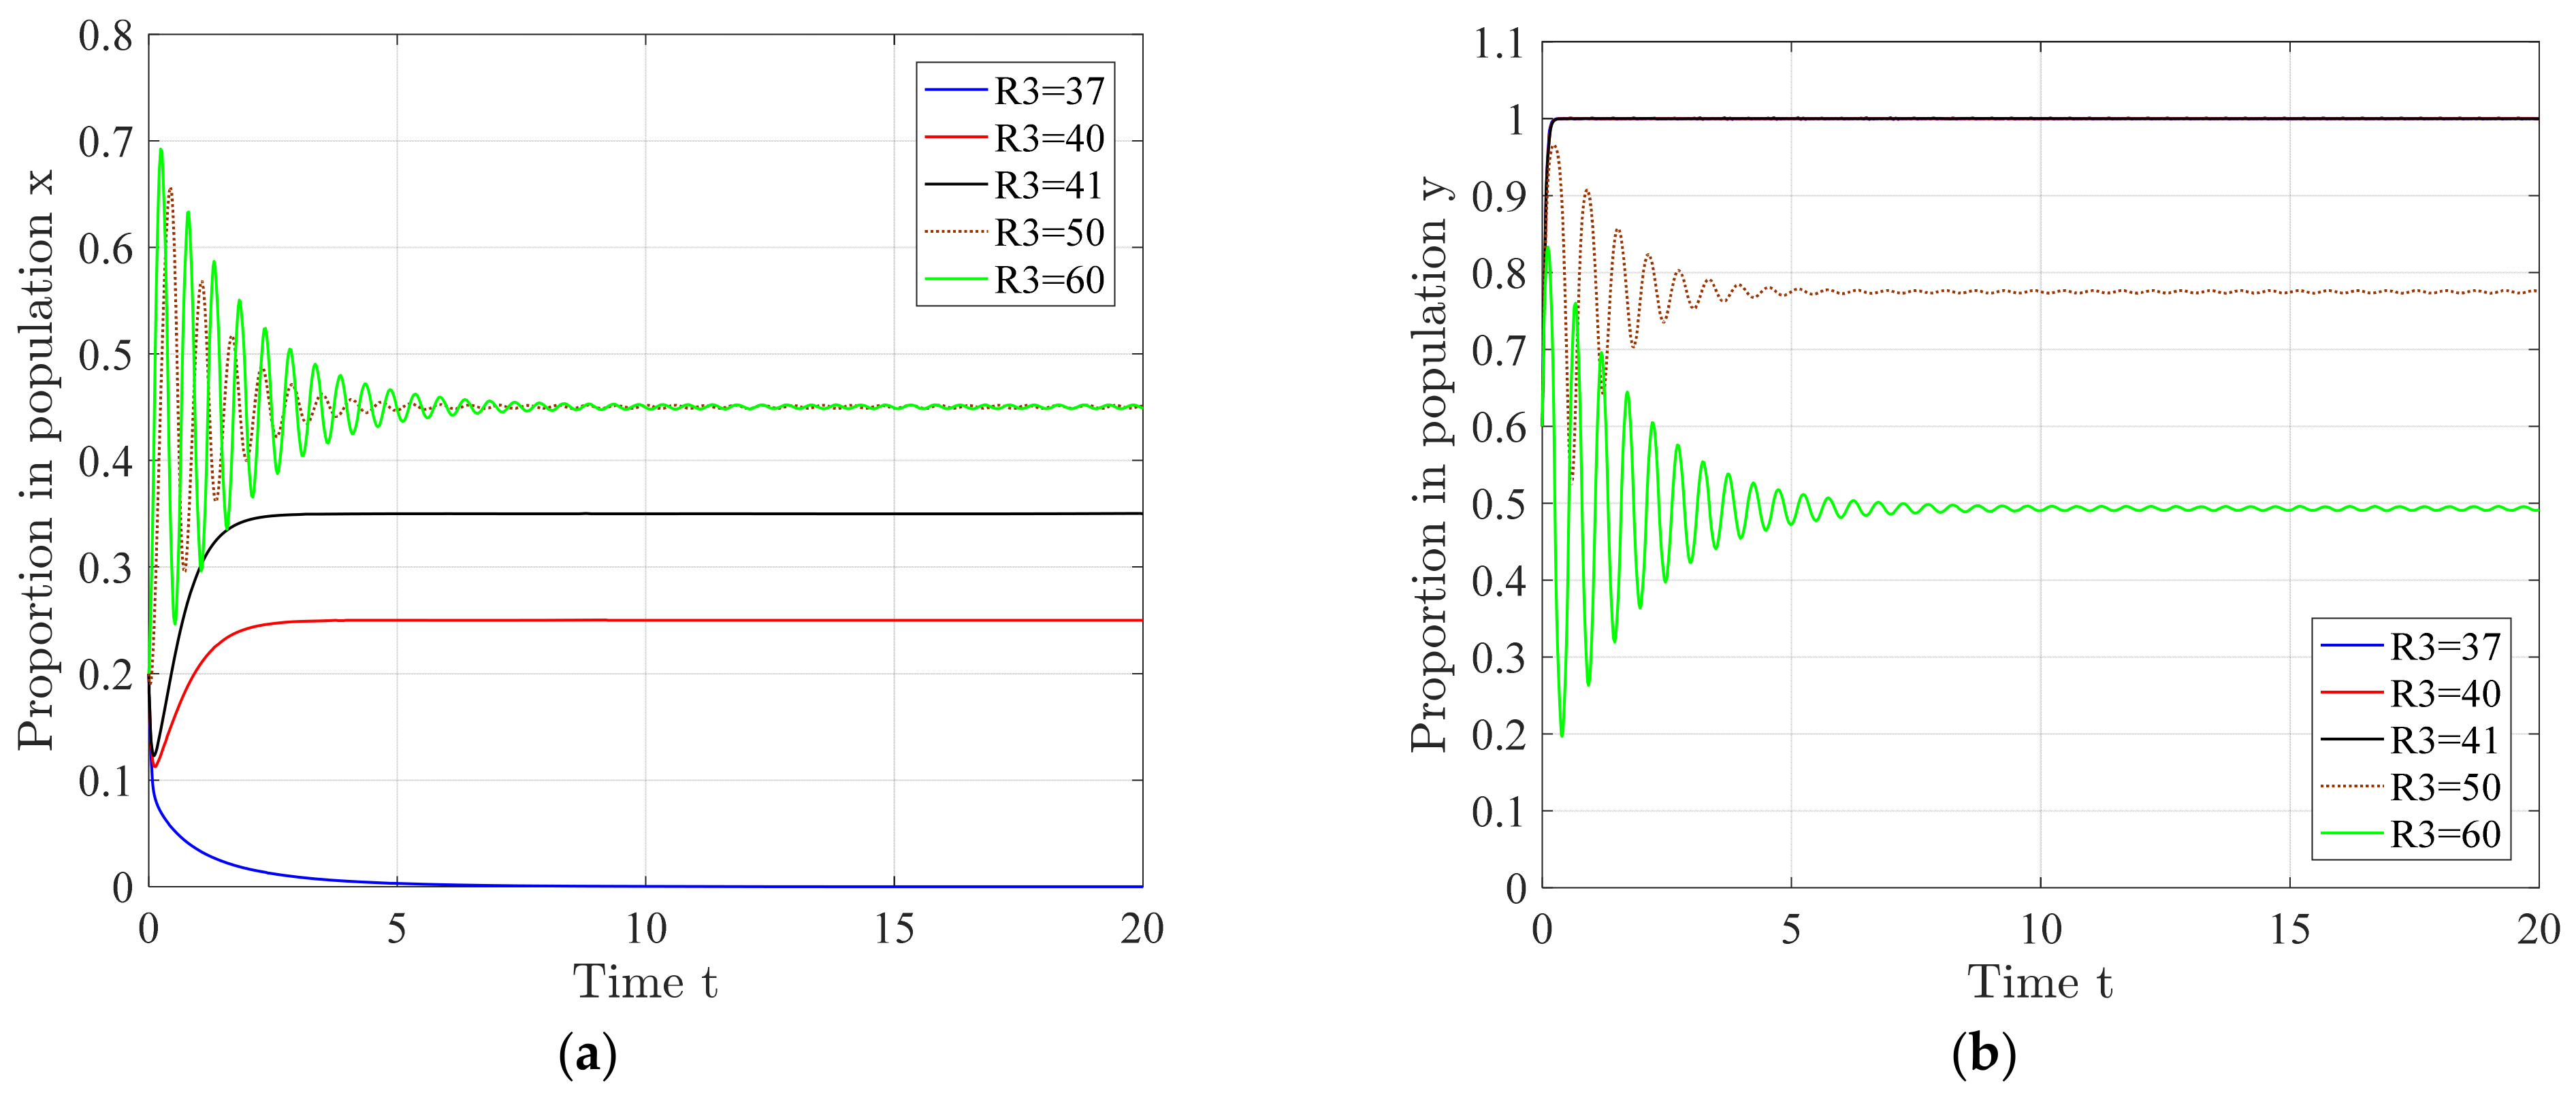
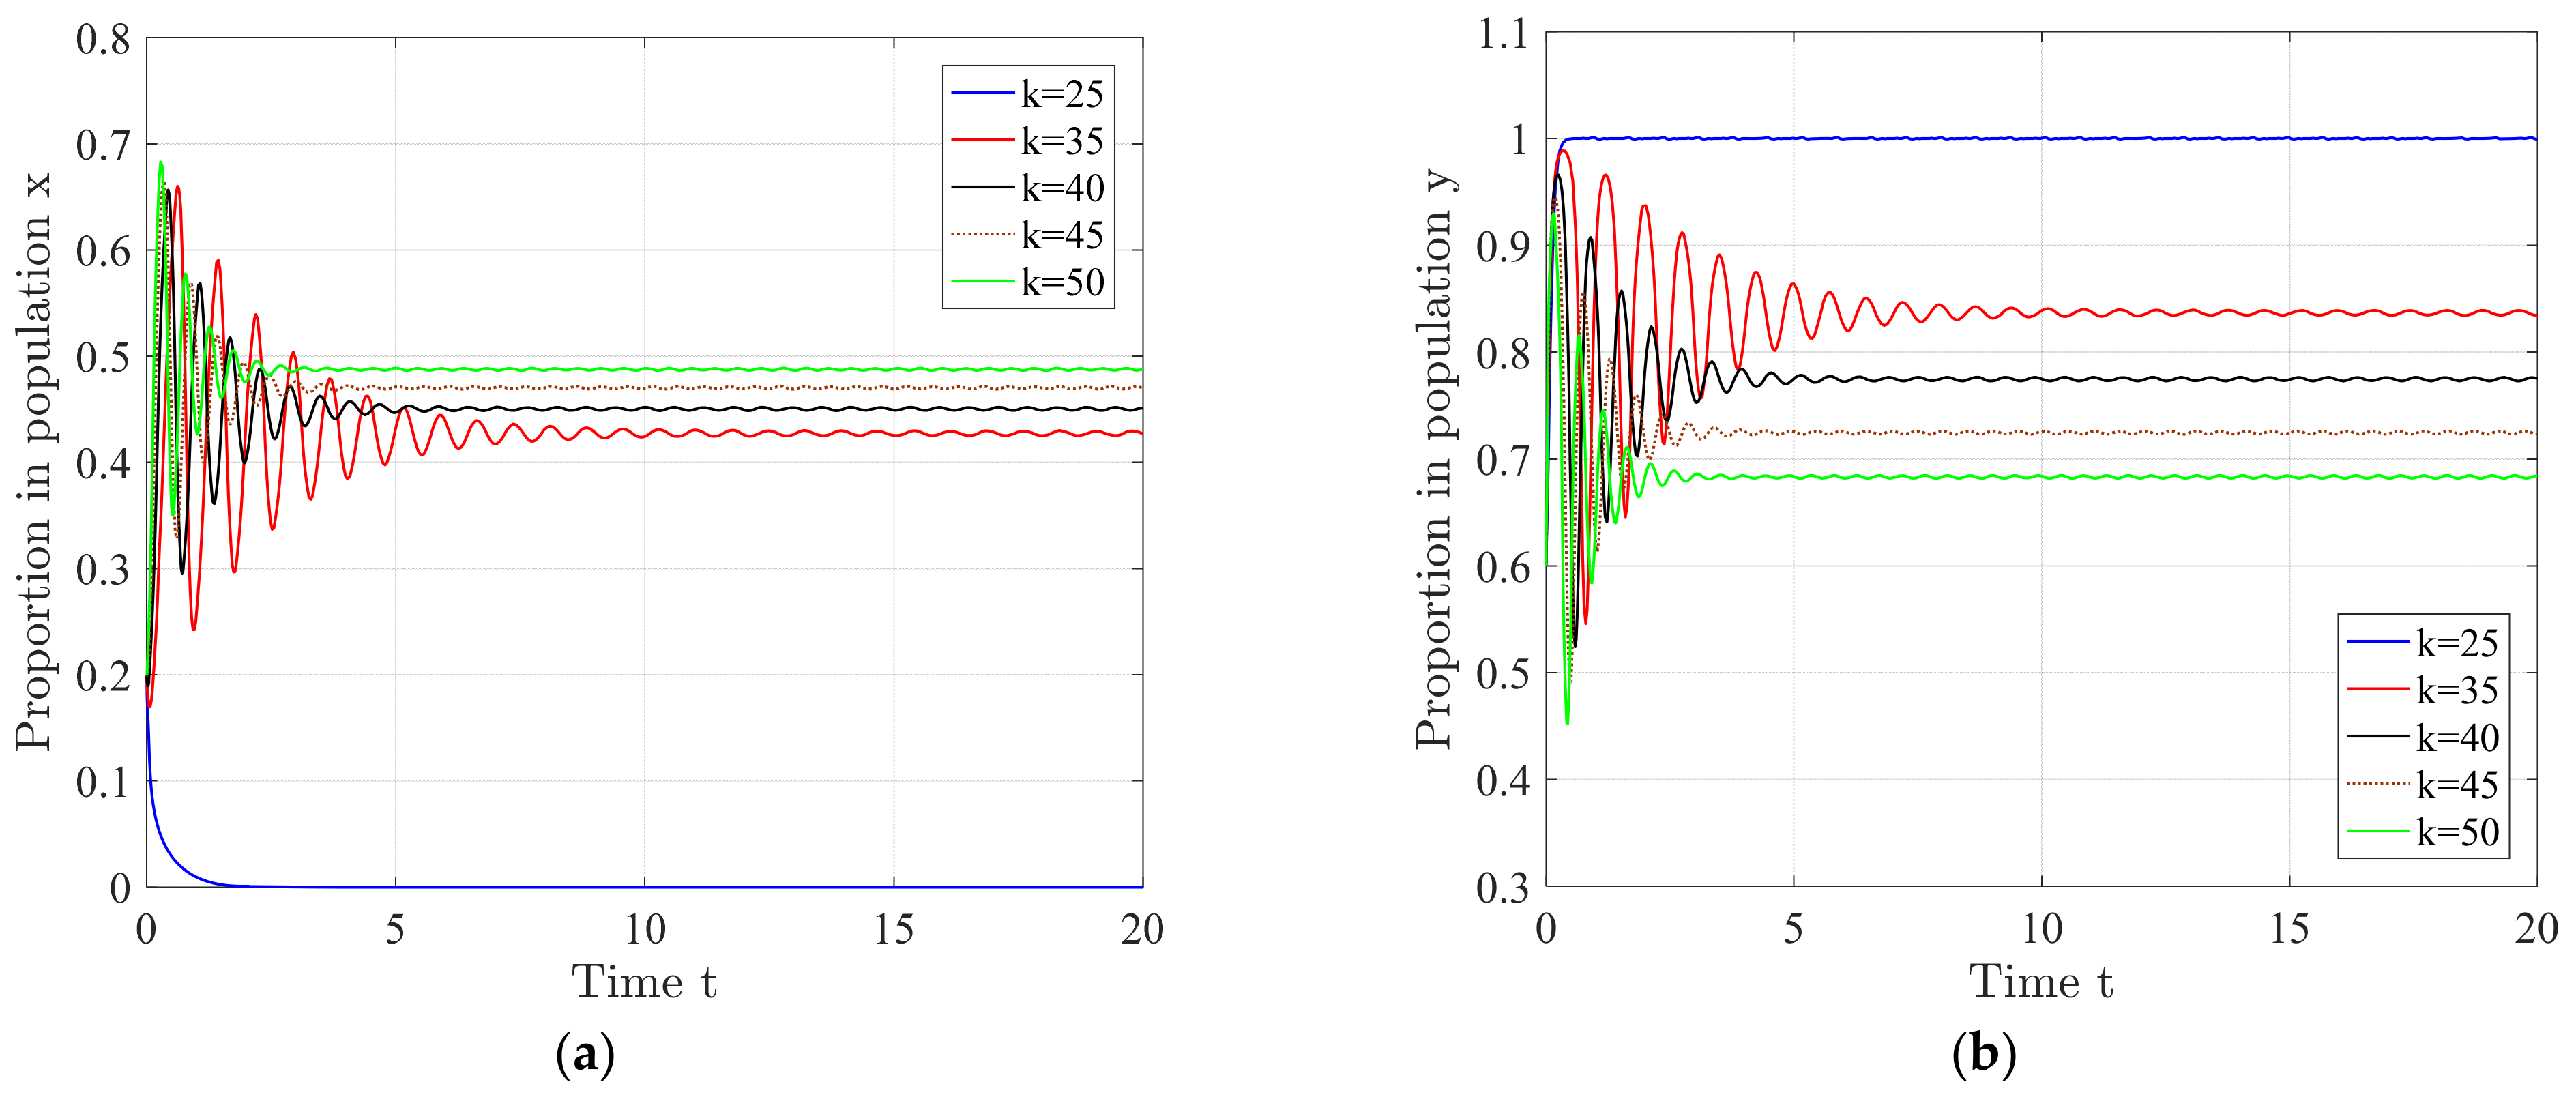
First, without considering the strict environmental protection requirements, the incentives and penalties introduced by the local government had no direct correlation with companies’ emission reduction practices. When the reward and punishment system was static, gameplayers’ behaviors presented a closed loop surrounding a center point, and no ESS existed in the system. When stricter requirements were considered, assuming that the government’s incentives and penalties were determined by emissions reductions for the companies, a dynamic reward and punishment system was formed. At this point, regardless of the initial state of the government or companies, the system spirals toward a stable equilibrium point. Second, the sensitivity analysis showed that a moderate increase in the environmental tax rate, additional benefits, lower fine limits, and upper reward limits increased the probability of adopting green development. However, subject to the constraints of the internal and external environment in the early stage of green development, excessively increasing the tax rate, additional benefits, and upper reward limits beyond the threshold did not have a significant impact on companies’ final decisions and might even play a negative role. Moreover, continuously raising the lower fine limits led to a noticeable diminishment in marginal utility. In addition, increasing the four parameter values prompted the local government to shift from a strict to a relaxed supervision policy. Finally, a comparison between the initial evolutionary trajectory of the system and that following improvement showed that the improved system converges toward equilibrium more swiftly than it otherwise would, suggesting that optimized parameters improved system efficiency and increased the probability of companies independently adopting green development in the context of a relaxed government supervision. Thus, determining the optimal key parameters within a reasonable range is key to ensuring stable and efficient green transformations.
The main contributions of the study are as follows: (1) an EGT model was constructed to model gameplay between local governments and breeding companies. (2) The impact of stricter policies on the development of green animal husbandry was revealed through static and dynamic reward and punishment systems. (3) The impact of key parameters, such as environmental tax rates, additional benefits gained, lower fine limits, and upper reward limits, was analyzed for both players, based on the simulation results. An optimization direction was proposed for the development of green animal husbandry.
Based on strictly implementing the requirements of environmental protection policies formulated by the central government, local governments should speed the construction of a dynamic reward and punishment system and continue to optimize key parameters, such as environmental tax rates and rewards, and punishments, based on local production conditions to steadily form a sustainable green development system that is independent of government supervision. Breeding companies could pay close attention to government decisions, actively seek financial support, steadily adapt to the direction of industry development with respect to the actual contextual conditions, and expand additional benefits through green business models, such as combining crop farming and animal husbandry.
Despite several achievements, there are a number of limitations to this study. First, in order to simplify the research, this research abstract concept of time. Adjusting production decisions of breeding companies, and decision-making process of local governments was considered a long-term process. Consequently, any adjustments will have a long-term impact on future development. Since this study focuses on the game process, formed by the two parties, due to different interests, the concept of time, long-term nature, and lag of effect is not fully considered. Second, the evolutionary game only included the local government and breeding companies and did not consider social preferences or the market environment. Future research is recommended to include other stakeholders into the model. Second, the model considered the optimization direction of the initial state but did not provide the optimal parameters. Future studies are suggested to conduct more extensive investigations to explore the model parameters suitable for a range of situations. Third, the model constructed in this study restricted players’ choices, allowing only one strategy to be chosen, which is generally not aligned with reality as decision makers tend to think in a more diversified and less linear manner.


