Article

Feasibility Analysis of Creating Light Environment for Growing Containers with Marine Renewable Energy

State Key Laboratory of Marine Resources Utilization in South China Sea, Hainan University, Haikou 570228, China
*
Authors to whom correspondence should be addressed.
Sustainability 2022, 14(21), 14186; https://doi.org/10.3390/su142114186
Submission received: 27 September 2022 / Revised: 27 October 2022 / Accepted: 27 October 2022 / Published: 31 October 2022
(This article belongs to the Topic Innovation and Solution for Sustainable Agriculture)

Abstract

:
Offshore renewable energy is essential to reduce carbon emissions in China. However, due to the lack of application scenarios, it is difficult to use renewable energy locally near offshore power plants. To find an application scenario for offshore renewable energy, a growing container is developed and combined with offshore renewable energy for food production. Small experimental containers were tested, and their light intensities were compared to simulation results. The light intensity range and uniformity of 20-foot containers were evaluated for some short-growth cycle crops. Adding side reflectors and using LED light beads improved the energy efficiency considerably. Side reflectors improved both the light intensity U and lighting uniformity u on the irradiated surface, but the improvement decreased with increased plant height. With a plant height of 0–25 cm, U increased by 57.4–16.6% and u by 13.1–8%, compared to the case without reflectors. Considering the energy consumption of lighting, air conditioning, and ventilation, the daily power consumption of growing containers was between 50 and 79 kWh; a 5 MW wind plant could support the operation of up to 294 growing containers. Growing containers can also tolerate short-term output fluctuations in renewable power production and they can be adapted to sizeable seasonal output fluctuations by reducing the proportion of leafy vegetables and increasing the proportion of sprouts and mushrooms, which require less light.

1. Introduction

Agriculture is one of the core application areas of sustainability science [1]. The development of traditional agriculture is limited by factors such as land, environment, and climate [2,3], with more uncontrollable factors. While plant factories are controlled environment agriculture [4], plant factories may become a competitive production technology compared to traditional horticulture [5]. Plant factories are sustainable in a range of ways, with lower CO2 emissions, less water use, and smaller footprints [6]. They are also less affected by extreme weather and environmental pollution, and can achieve high-quality output year-round.
A growing container is a miniature planting factory that converts a container into a standard production unit [7,8], which can be arranged on multiple planting levels to multiply the planting areas, but at the same time increase the lighting and energy requirement compared to single-level planting. Growing containers can tolerate large environmental changes [9] and are more suitable for building marine farms on coasts, islands, and ocean platforms than film trellises. Although growing containers can ideally produce most vegetables [5], some vegetables are preferred considering the efficiency of resource utilization and the existence of individual differences among species. Many studies are more concerned with the optimal lighting environment for plant factories, creating the optimal light intensity or photoperiod for a crop [10,11], but these are more limited to a single crop. In this paper, it is hoped that the light intensity range can be flexibly adjusted to increase the variety of vegetables suitable for cultivation. A few studies have combined wind power generation with plant factories [12], proving that it is feasible to grow some leafy vegetables. However, combining plant factories with offshore renewable energy sources is a new attempt.
Light is one of the most important conditions affecting the growth and development of crops [13]. Although using natural solar radiation directly is the cheapest way to create a planting light environment, fluctuations in the solar irradiance and its duration put limitations on creating a stable planting light environment and achieving multi-layered planting to improve space utilization. In contrast, planting buildings with artificial lighting can create a light environment more conducive to plant growth than outdoors. A more favorable spectrum [14,15,16] and photoperiod [17,18] for plant growth can be achieved by increasing the planting density and shortening the growth cycle [19,20,21]. More importantly, planting buildings can utilize multiple forms of renewable energy to create a standard light environment. The cost of wind power and photovoltaic electricity has rapidly declined [22,23], to the point of being below the cost of coal and natural gas-fired electricity generation in some countries and regions. The intermittence of wind and photovoltaic power, however, poses challenges to steady power production [24]. Additionally, their low energy density raises challenges with land use, which would favor moving to marine environments. Food growing would be a relevant application in marine environments due to the relatively high power demand needed for creating a light environment for large-scale planting buildings and high tolerance against fluctuations in energy input during plant production. Moreover, shipping costs are significantly lower than that of land transportation, which is a unique advantage of growing containers in offshore areas and they can be transported while planting. The energy nodes can be arranged along the transportation route so that growing on the energy supply node takes place during the light response and disengaging from the node during the dark response to carry out transportation and then moving to the next energy supply node.
To understand the techno-economic feasibility of marine renewable energy sources for providing lighting conditions for such growing containers, a detailed investigation of the lighting solution for the growing container is undertaken. For the analyses, a small growing container was built used to verify the accuracy of the illuminance simulation tool TRACEPRO for designing the growing light environmental conditions in the container. Then, the simulation tool was used to find a lighting solution for the growing container with light intensity and uniformity meeting the plant growing requirements. The electricity consumption of the container is then obtained based on the photoperiod and light intensity requirements, which are used as the basis for the design of the renewable energy system to support the operation of the growing container. Finally, the economic feasibility of creating a light environment for the growing container with renewable energy is evaluated.

2. Methodology

2.1. Experimental Procedures

2.1.1. Testing Environment

To ensure the reliability of the optical simulation used to design the lighting solution for the growing container, a small optical container platform with dimensions of 1200 mm × 800 mm × 40 mm was built, and its frame was built of wooden boards. According to a preliminary assessment, four T8LED full-spectrum plant growth lights would be required inside the standard layer of the growing container as shown in Figure 1. To improve indoor illumination and lighting, some uniform reflective devices were added to the container. To verify the effects of the reflectors, the container was divided into two compartments: The first has a black light-absorbing cloth on the four inner sides of the container, corresponding to the case without reflection on the sides; the second compartment has reflective aluminum MIRO4 (ALANOD, Ennepetal, Germany) sheets on the four inner sides corresponding to the cases with reflection. In order to reduce the interference of external light, the container was put in a dark room for testing as shown in Figure 2.
The illuminance measurements were made with DELI illuminance meter DL333204 (Ningbo Deli Tools Co., Ltd., Ningbo, China). In the plane parallel to the irradiation surface at a distance of 37 cm apart, the 1200 × 800 mm plane of the container is divided into 96 small areas of 10 × 10 cm2 (8 rows of 12 columns) and the center illuminance of each small area is used as the illuminance value of the area.
In the experiment, differences were found in the illumination level of different lamp beads in the strip. To detect the errors, the 1200 mm area of the container directly under the LED was divided into 11 measurement points and the illuminance was measured close to the lamp shade. Data were analyzed using SPSS 24. Differences between measurement points were analyzed using analysis of variance (ANOVA). Mean values followed by the same letter are not significantly different as determined by ANOVA and the differences were compared by Duncan’s T3 test and LSD test to a significance level of 5%.

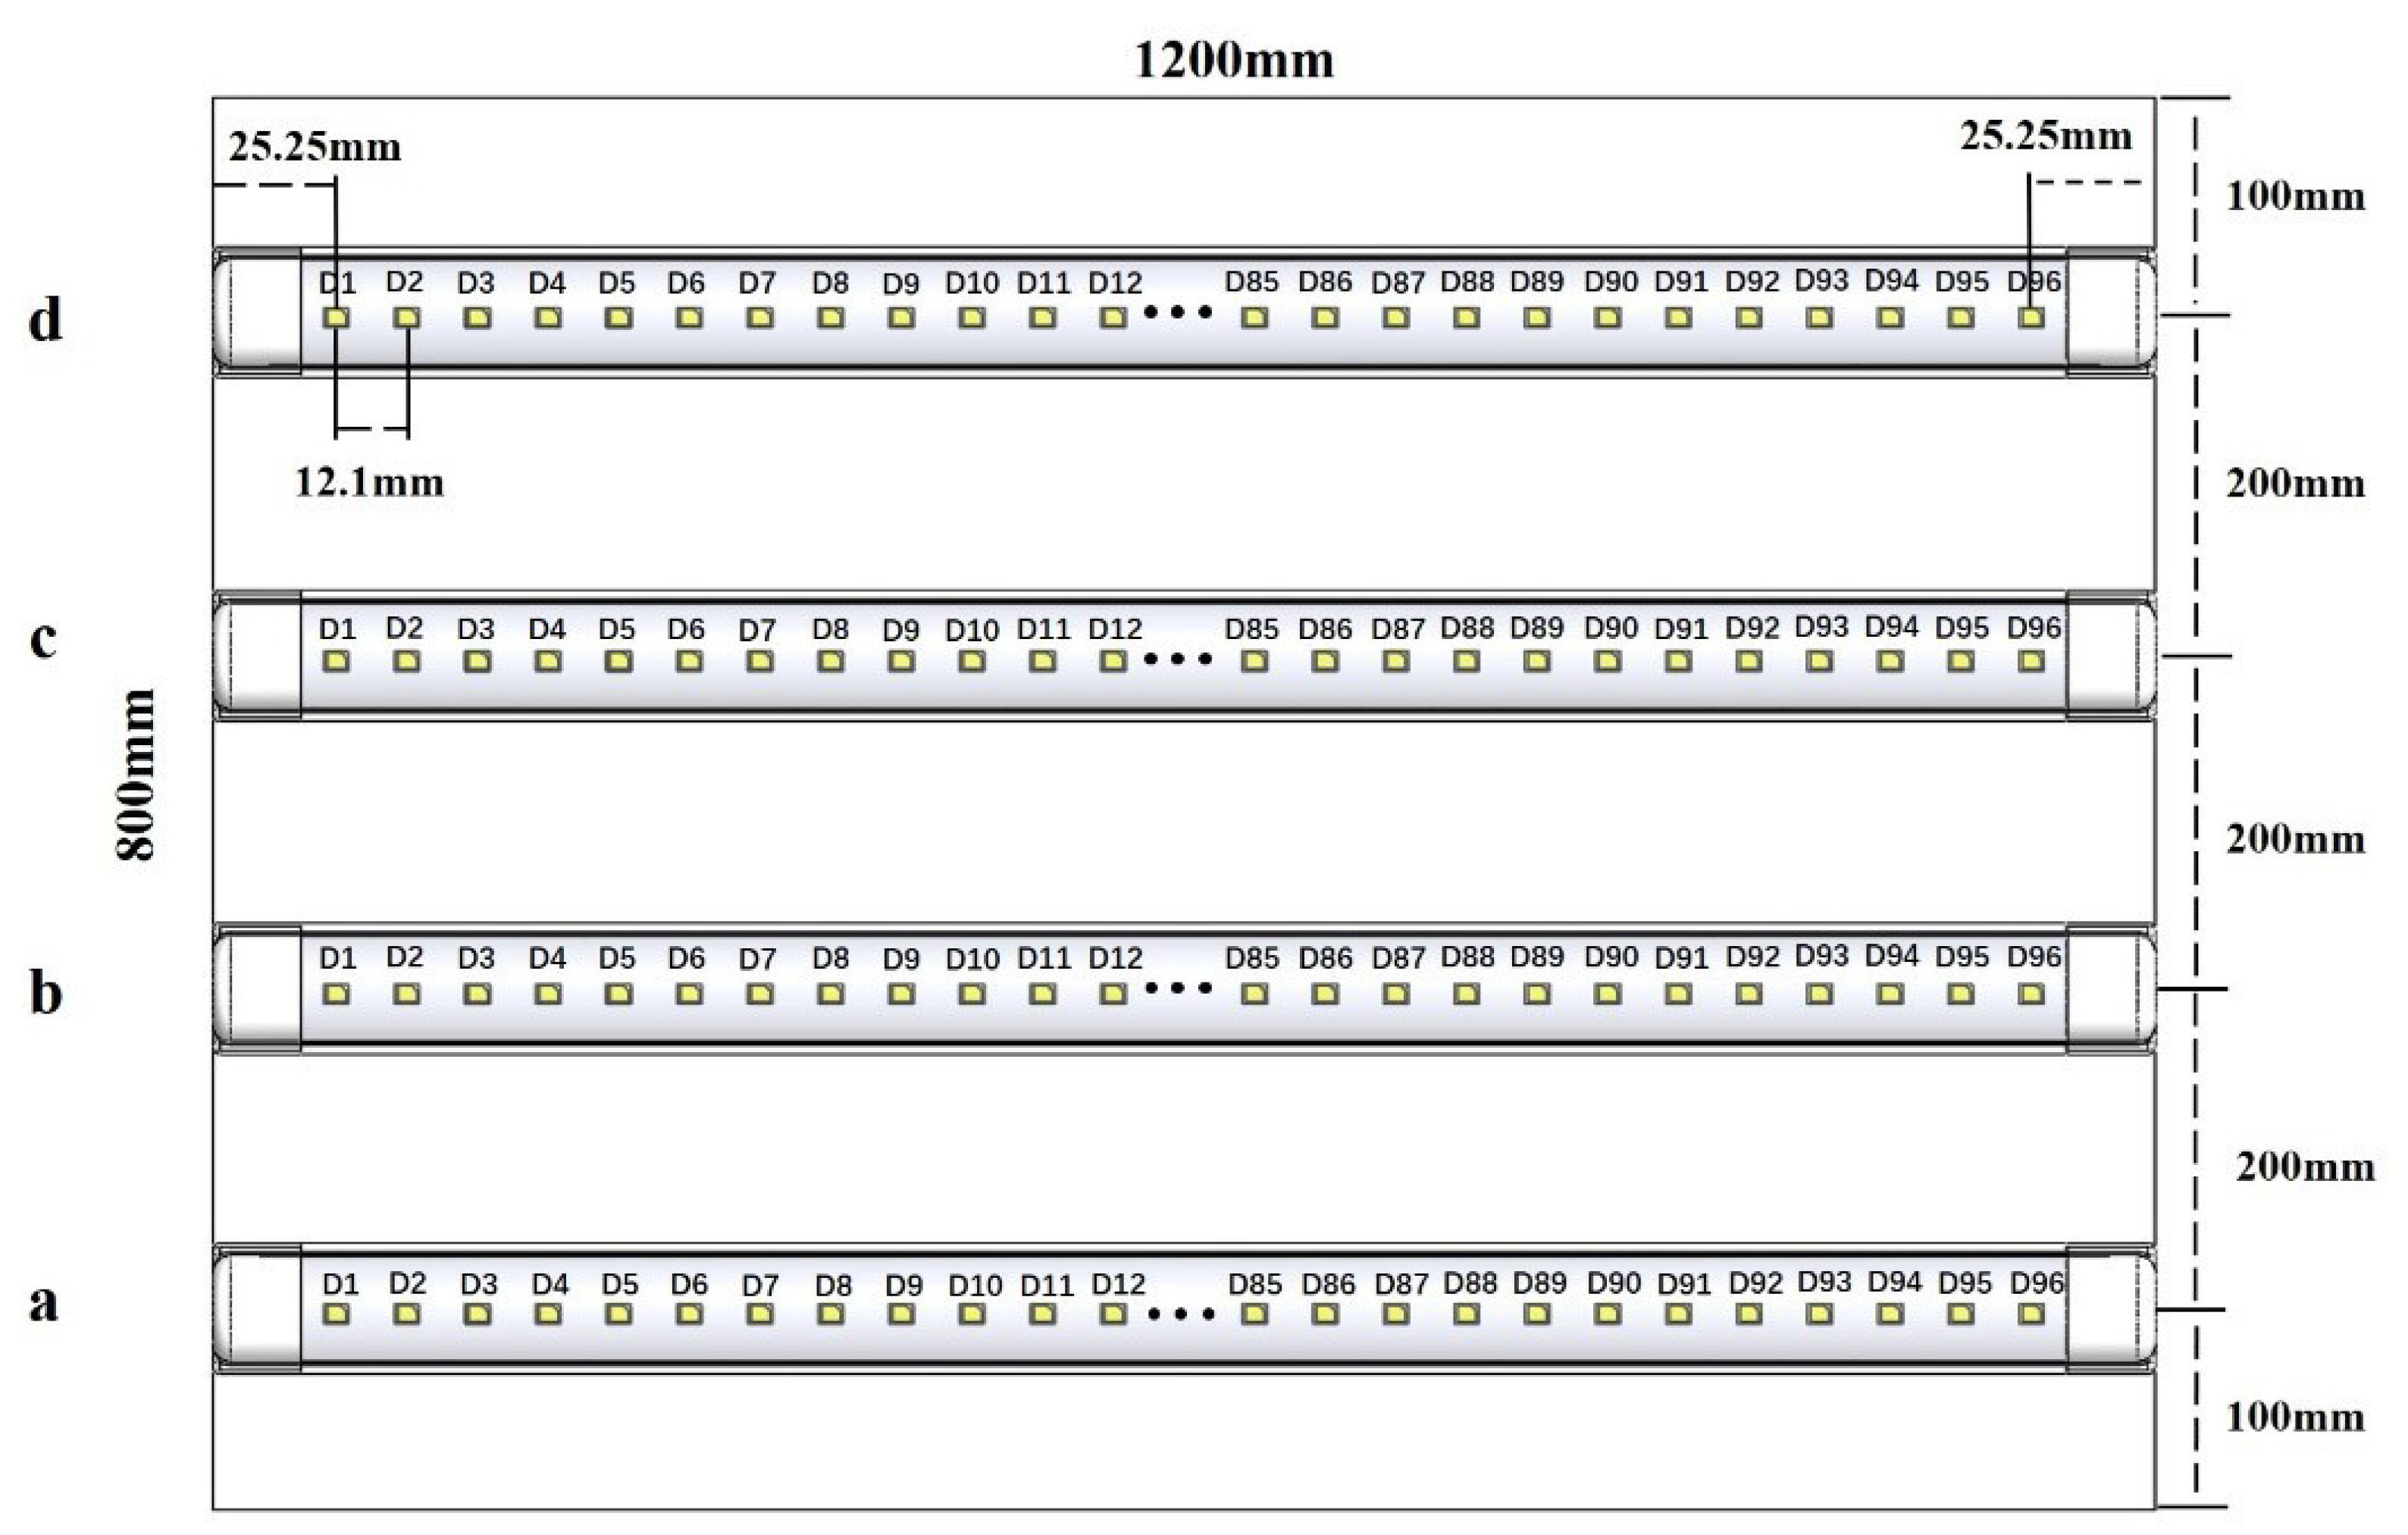
2.1.2. Designing Growing Container Solution

A standard 20-foot container (589.5 cm × 235.0 cm × 239.2 cm) is used to build the growing container. Each side of the container is arranged with a five-layer 5000 × 800 mm planting layer. Each layer can be planted with the same species, or different species can be planted under the premise of no conflict in the planting environment to more flexibly adapt to the market demand.
The basic layout scheme inside the container is shown in Figure 3. In order to be more suitable for the light environment required for container planting, the T8LED light source was modified for the primary adjustment of LED spacing as follows: Each strip is 5 m long, each strip contains 455 beads, the distance between the first LED and the last LED is 3 mm from the border, the distance between the centers of two adjacent LEDs is 11 mm, the luminous flux of a single LED (0.2 W) is 18.75 lm, each LED can achieve independent switching, and the distance between the strips is consistent with the test program. The height from the light-receiving surface to the light source can be adjusted in a range of between 15 and 40 cm. In order to obtain the light intensity to meet the planting requirements with fewer lamp beads, i.e., lower energy consumption, the aluminum reflective layer can be arranged on both sides of the planting frame. Although it has been argued that inwardly inclined reflectors enable more uniform illumination [25], this comes at the cost of reducing the planting area in a container with limited space, so vertical reflectors were used here.

2.2. Simulation Methods

TRACEPRO is software dedicated to the design and analysis of illumination and optical systems. It can build different optical models according to the needs of the experimenter and is commonly used in the field of plant lighting. A TRACEPRO software package was used for the 3-D illuminance simulations [26] in the container. We established a three-dimensional model of the standard layer of the container in TRACEPRO, used the lampshade material properties for Plycarb, and set each LED lamp as a surface light source. The field angle is divided into Lambertian luminous field types; the luminous flux of a single LED lamp is 18.75 lm, the light emission angle is 120°, and the emission contains 2000 rays. The light plane (5000 mm × 800 mm) surface properties are those of a perfect absorber; the initial height from the light source plane is 40 cm, and the light surface is divided into 1024 × 1024 square areas of equal size each area approximated as a point. In the case of a side reflector, the reflector surface property used is MERO4 (ALANOD, Ennepetal, Germany).
The number of pixels determines the resolution of the simulated irradiance map. If the value is too large, the irradiance map will not be smooth enough to enable the observation of differences in irradiance trends. Since this paper focuses on the illuminance distribution trend on the irradiation plane of 5000 × 800 mm, the average value (Eave) is used as the variable for irrelevance verification in Table 1. When the number of pixels is increased from 50 to 100, Eave changes from 7103 lx to 7138 lx with a difference of 0.49%. The difference drops to 0.17% when the pixels increased from 100 to 150. We used 100 pixels as Eave, which would be insensitive to the number of grids with this value.

2.3. Evaluation Indicators

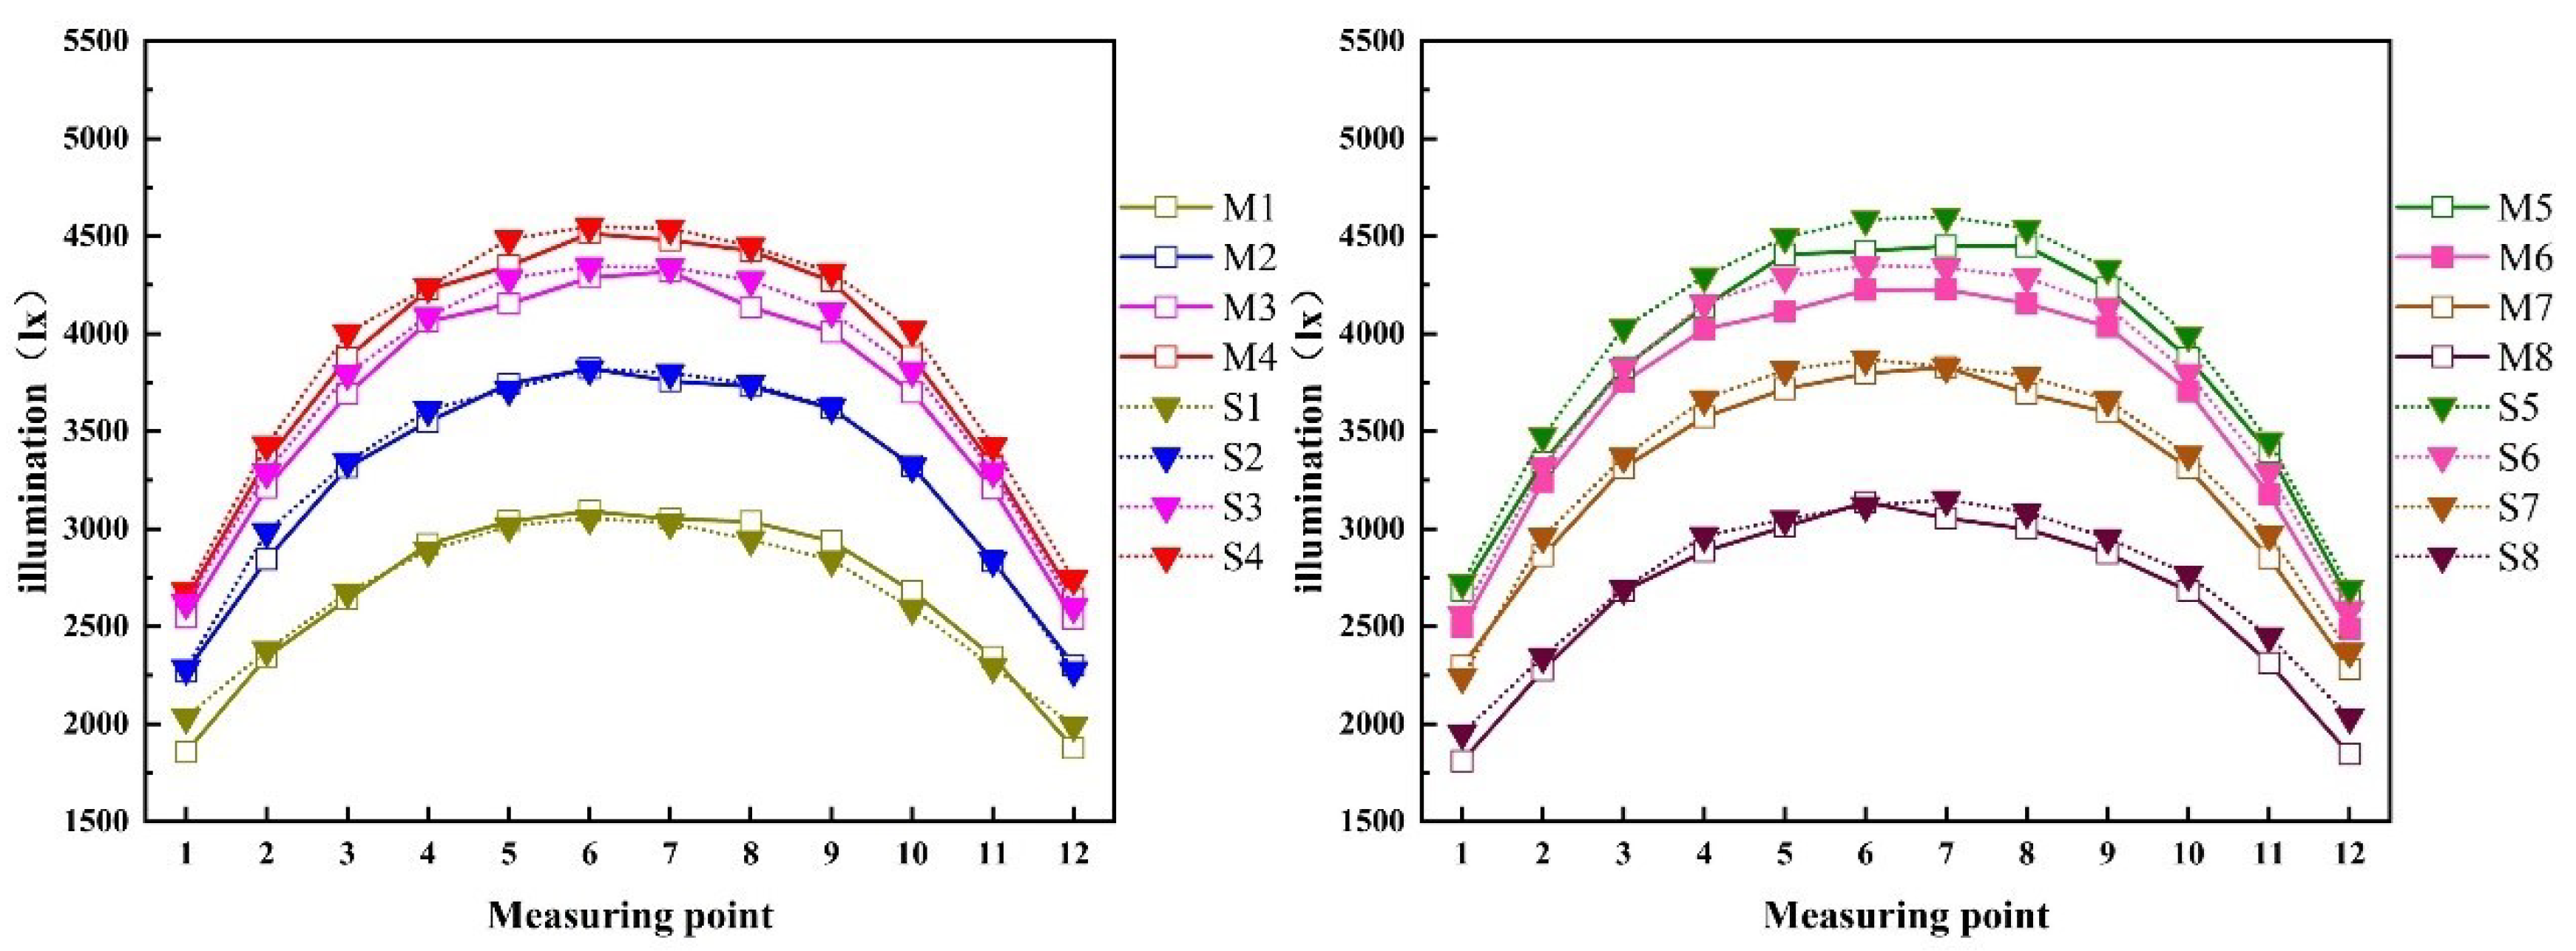
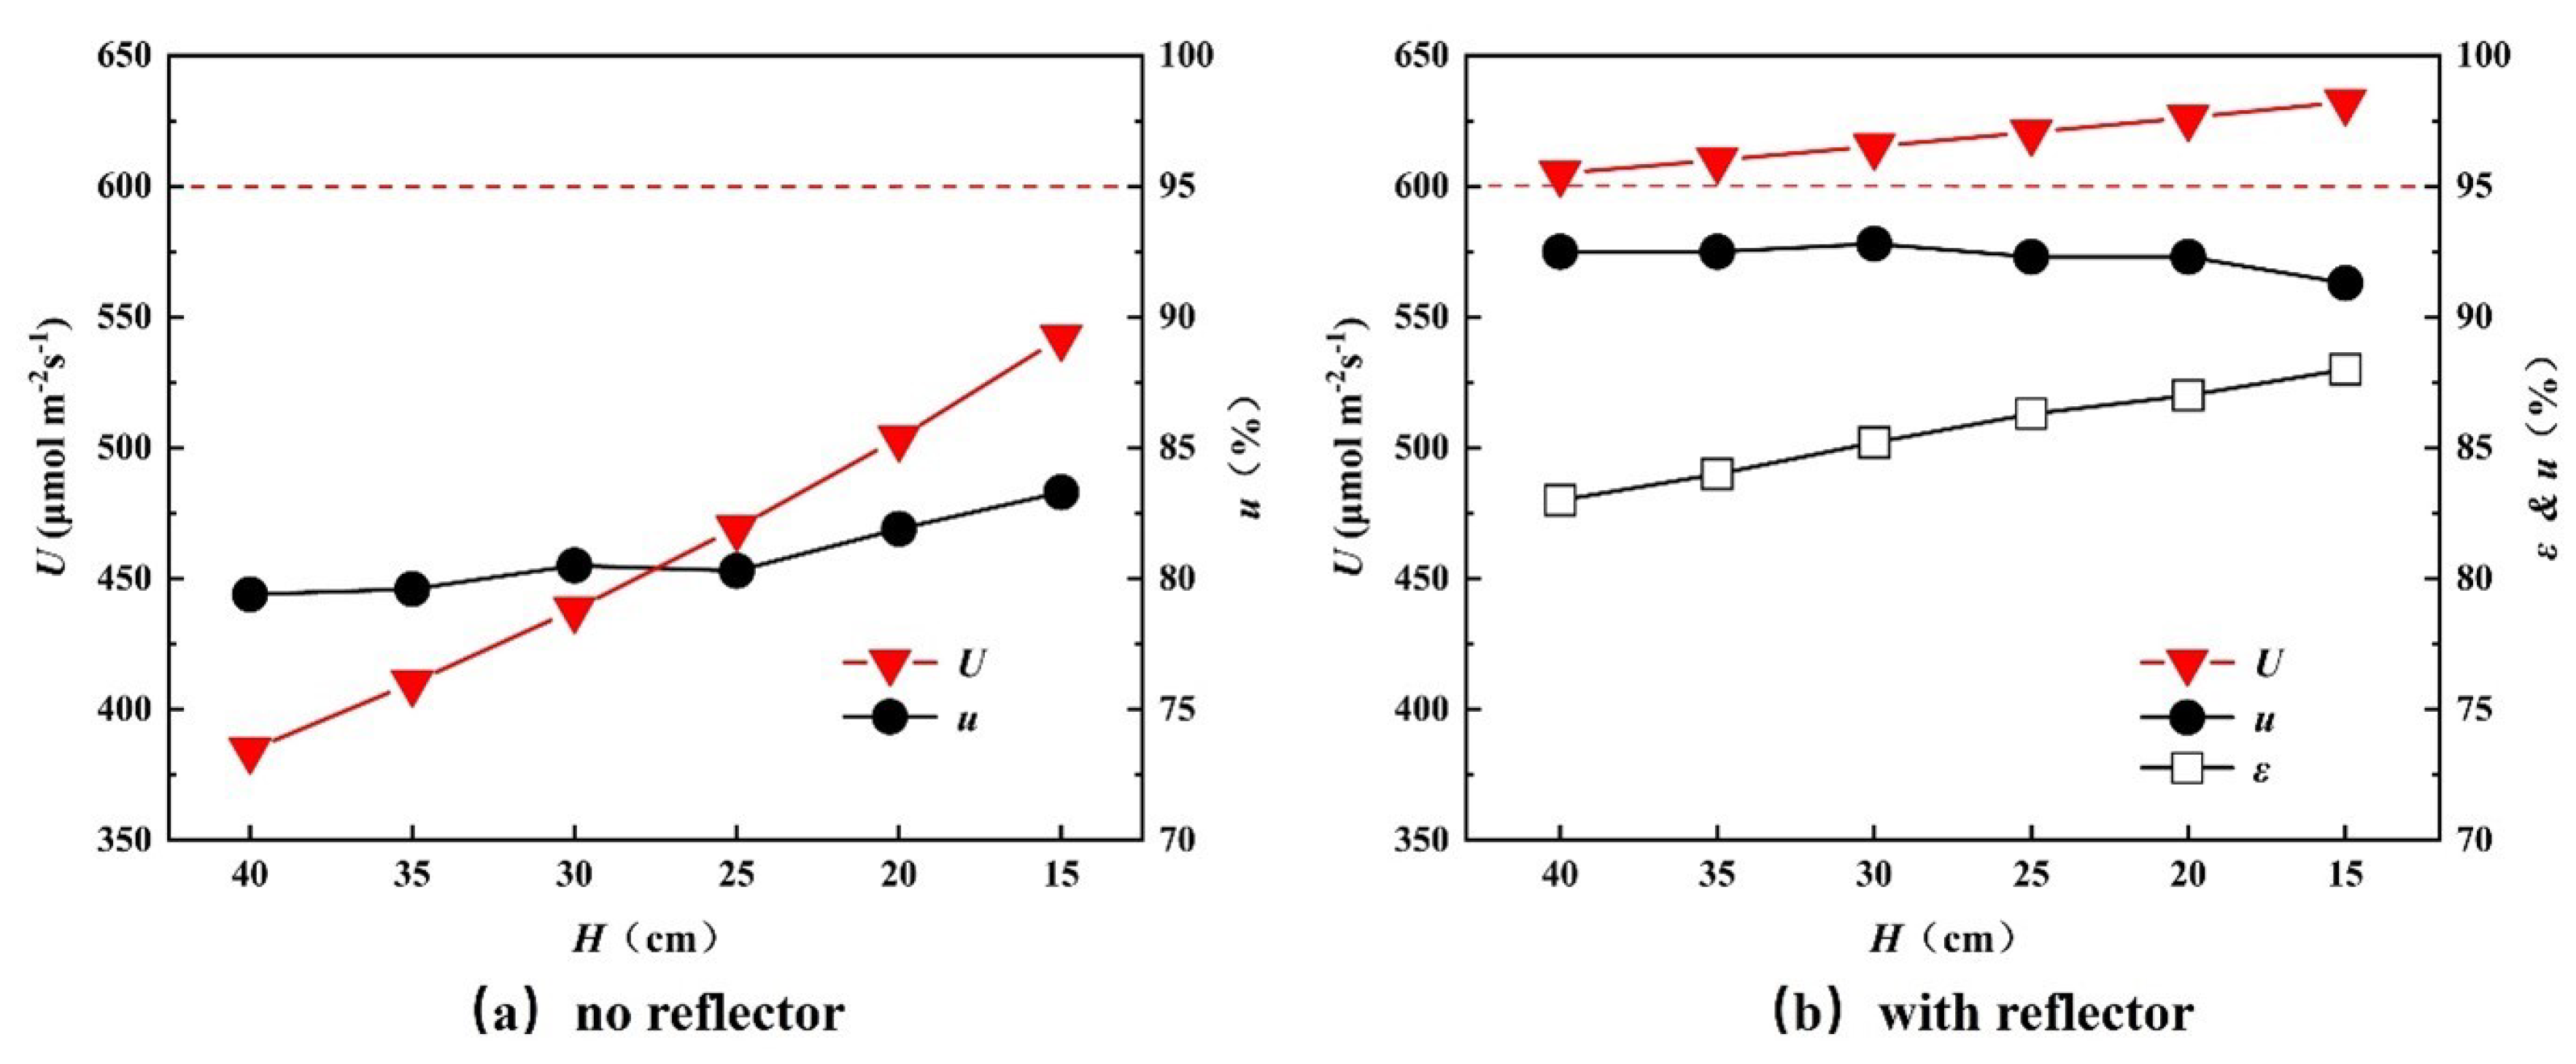
2.3.1. Light Intensity

The light intensity in plant lighting design was generally characterized using the plant photometric unit Photosynthetic Photon Flux Density (PPFD) [27], but in TRACEPRO the light intensity is characterized using the illuminance (E), which required using a conversion coefficient [28]. Growing containers are more suitable for crops with shorter growing cycles, mainly mushrooms, sprouts, and leafy vegetables. Leafy vegetables are the primary light energy consumers. They required higher light intensities between approximately 200–600 μmol m−2s−1 [29,30,31,32,33,34,35,36], corresponding to a luminosity E of 2307–6920 lx. Table 2 shows the optimum light intensity for some crops.
Different crop species required different light intensities and different growth stages of the same species, at least the seedling and maturity stages, required different light intensities [38,39]. Therefore, for growing containers, it is necessary to evaluate their light intensity under different relative light source heights, i.e., the spacing between the light source and the growing surface. Since most of the selected leafy vegetable varieties vary in height from seedling to maturity within 25 cm, a variation of 25 cm in relative light source height was allowed.

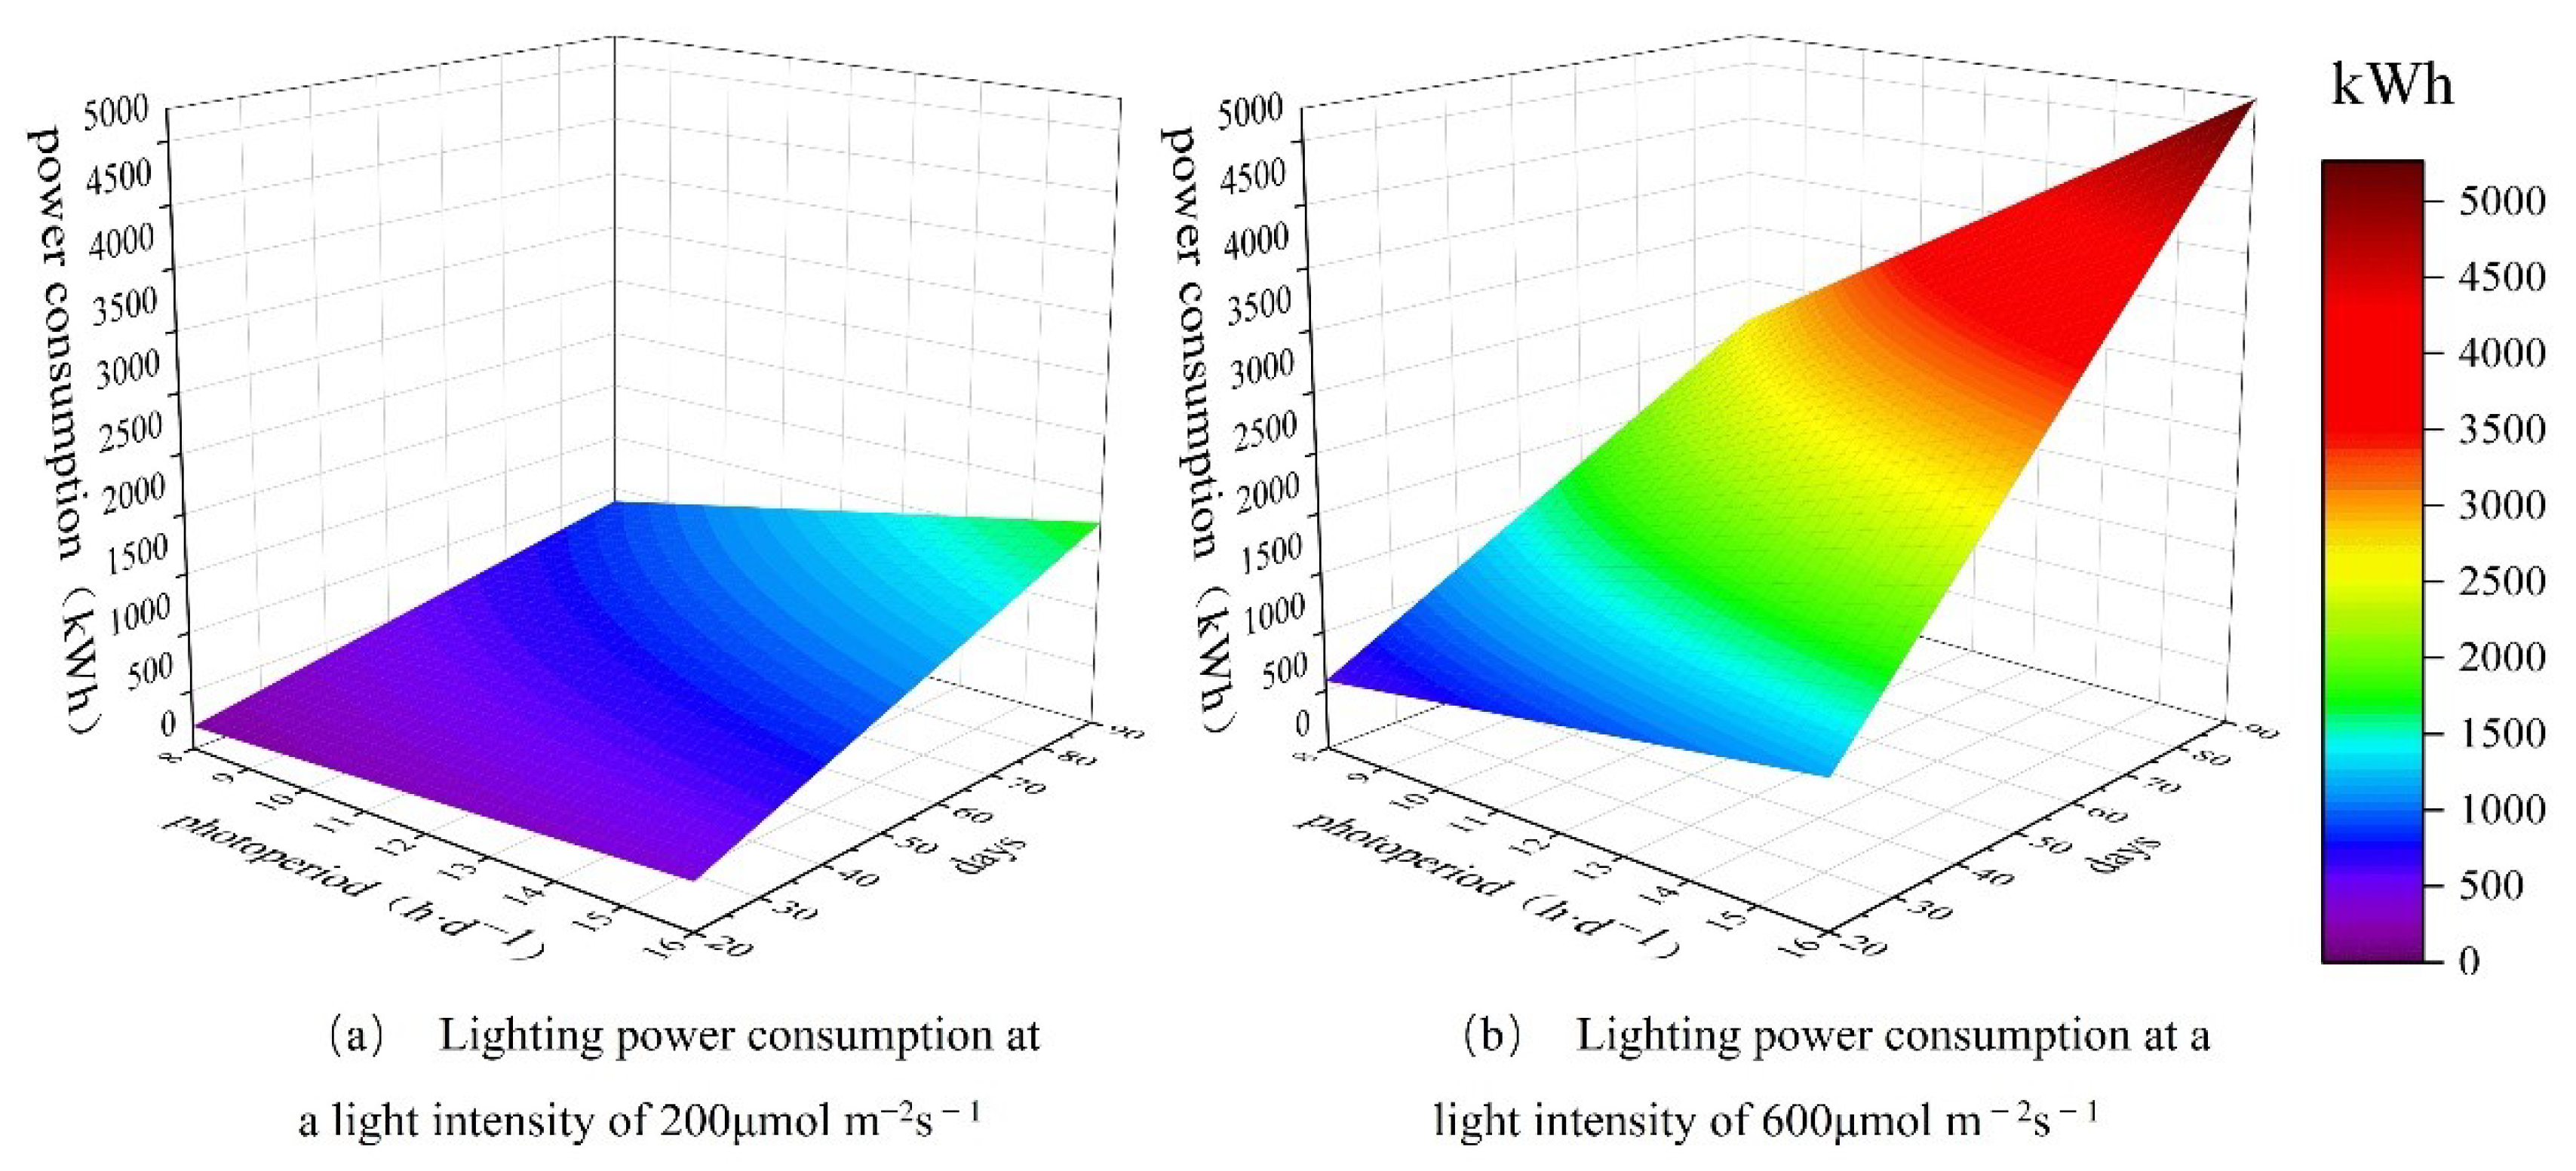
2.3.2. Energy Consumption per Unit Area

The energy consumption per unit area is equal to the light source power multiplied by the photoperiod divided by the planting area and is used to evaluate the daily power consumption on the unit planting area:
Q = P L E D × a × T S
where Q = daily electricity consumption per unit planted area (kWh·m−2·d−1), PLED = single lamp bead power (0.2 W), a= number of lamp beads, T= photoperiod (h·d−1), S = planting area (4 m2).

2.3.3. Light Intensity Distribution

The illumination uniformity can be used to evaluate the distribution of light intensity. The light uniformity u was defined as the ratio of the illuminance mean Eave to the maximum illuminance Emax [40,41,42].
u = E a v e E m a x × 100 %
Although the average light intensity in some light environments meets the growing requirements, a low light uniformity means that the light intensities locally will be too low or too high. Some areas would not meet the growing needs and some other areas would have excessive power consumption. Therefore, the closer u is to 1, the lower the energy consumption to form a light environment that meets the crop illumination requirement will be.
However, u does not directly give the proportion of planted areas with moderate light intensity. For this purpose, another light intensity distribution evaluation index ε is introduced, which indicates the proportion of the area SA with moderate light intensity to the whole planted area S.
ε = S A S

3. Results

3.1. Subsection

As shown in Figure 4, there are differences in the mean values of some areas and the differences are not exactly the same for the four light strips. For example, in Figure 4b, the difference in illumination between measurement points 1 and 2 was not significant (p > 0.05), but the difference in illumination with all other measurement points was significant (p < 0.05). However, the overall illumination levels showed higher illumination levels near the end of measurement point 1 (corresponding to the D1 side of the strip in Figure 1) for the four plant growth lights and gradually decreases or oscillates down toward the other end. As the LED lights are higher near the D1 side illumination. To reduce the error in the small container experiment, the measurement will first have four strips of the D1 end placed on the same side of the container as shown in Figure 1. For each point, the measurement is repeated three times. Then, the four rows of the D1 end and the D96 end were flipped and repeated three more times, and the average of the six measurements was taken as the final illuminance value of each measurement point.
The illuminance on the small container was measured and compared to the simulation model. The average simulated illuminance of the irradiated plane without a reflector was 3344 lx, with a maximum illuminance was 4510 lx, whereas the actual value was 3412 lx and the maximum was 4600 lx. The illuminance error on the plane was 2%. The simulated illuminance of the irradiated plane with a reflector was 5780 lx, the maximum value was 6015 lx, the actual measured value was 5788 lx, and the maximum value was 6033 lx. The illuminance error on the plane was thus 0.14%. The simulated and the measured values of the illuminance in each measurement point are shown in Figure 5 without a reflector and with a reflector in Figure 6. The results clearly show that the illuminance drops towards the ends, but in the case of using a reflector, the differences between the middle and the ends were much smaller. The simulated values follow the actual measured values in both cases.
The average illuminance on the irradiated plane with reflectors was 69.7% higher than that without reflectors, and the uniformity increased from 74.2% to 96.0%. The light intensity significantly increased, indicating that the same illumination without reflectors would require more lamps and lead to higher electricity demand. The better uniformity with reflectors provides better plant growth conditions. Therefore, because of these two major advantages, the solution with reflectors is used in the overall container design.

3.2. Container Simulations

The next full simulation results of illuminance conditions in the container are presented. Different heights corresponding to different growth stages of plants were set to correspond to the dynamic growth of plants. Crops grown in containers were required to have a shorter growing cycle, which means a faster growth rate, for lettuce, kale, and amaranth. Short-growth cycle crops were considered as they are more suitable for growing in containers requiring a light intensity of 200–600 μmol m−2s−1 (2307–6920 lx). Considering that an irradiation height that is too low can cause low uniformity of the irradiated surface [43], an irradiation height H ⊆ 15–40 cm was used, with a plant height h ⊆ 0–25 cm. Figure 7 shows a light intensity of 600 μmol m−2s−1 was reached in the middle area inside the 6920 lx contour, meeting the standard illumination requirements of common short-growth cycle crops.
Without reflectors, the light intensity reached 600 μmol m−2s−1 in only a tiny area of H = 15 and H = 20 shown in Figure 8a, i.e., ε = 0 in the range of H = 25–40 cm. The U value increases with decreasing H, but the light intensity remains below 600 μmol m−2s−1. The u value was quite smooth over the whole range of H, fluctuating around 80% and having a maximum of 83.3% at H = 15 cm. Adding reflectors in Figure 8b shows that the light intensity U was over 600 μmol m−2s−1) and the light intensity received gradually increased with the growth of plant height. Since the side reflectors were set around the planting plane, the light uniformity u was less affected by the height and was above 91%. At H = 15 cm, increasing h leads to a decrease in the actual area of the reflectors, which in turn leads to a slight decrease in the light uniformity, but the uniformity can still reach 91.3%. The ε value indicates the ratio of the area of reasonable light intensity to the total area. With the decrease of the irradiation distance, the light intensity gradually increases, and the area of moderate light intensity also increases. Therefore, ε tends to rise and had a minimum value of 83% at h = 0 cm, which has little effect on crop growth considering the small irradiance required at the seedling stage. However, in the later stages of crop growth, 13% of the total area at the edges and corners may not grow vigorously enough due to insufficient illumination.
Comparing the two cases, when H = 40 cm, U in the reflector-added case was 57.4% higher than that of the non-reflector-added case, and the u of the reflector case was 13.1% higher than in the non-reflector case. For H = 15 cm, U was 16.6% higher, and u was 8% higher, respectively. It shows that although the effect of the reflector decreases with the distance, it can improve the light intensity and uniformity.
The light intensity can be regulated from 200–600 μmol m−2s−1 by using different open settings for the LED lights. When 0.5 degrees was used, i.e., the LED beads in the base (even) position were turned on continuously (open state), the distance between the LED beads was 22 mm. When combined with the actual length of the strip, the actual number of beads turned on per row of the strip was 228, and the average light intensity of the illuminated surface under this condition was about 300 μmol m−2s−1. The number of beads per row was 152, and the light intensity was about 200 μmol m−2s−1.

4. Discussion

Plant factories need to be created an environment that is suitable for plant growth. Light, humidity, heat, and air composition conditions need to be suitable, which requires more electricity costs than traditional cultivation, accounting for 25–35% of the total operating costs [44]. Currently, the cost of photovoltaic power is about 0.35 Yuan per kWh, and the cost of wind power is 0.5–0.6 Yuan per kWh (1US$ = 6.74 Yuan, August 2022) in China, but further cost reductions can be achieved through technological advances and large industrial-scale production. For example, using chalcogenide materials in photovoltaic panels has shown a high conversion efficiency and cheaper cost [45]. Ocean wind power can feed compressed air energy storage [46] adapting to fluctuations in wind conditions and increasing the utilization factor. By 2035, PV and wind power generation costs are expected to be below 0.3 Yuan per kWh. By 2050, the cost of PV and wind power generation could drop to about 0.13 Yuan per kWh and 0.25 Yuan per kWh [47].
The intermittent nature of photovoltaic and wind power generation makes the lighting vary over time. The stability of the power supply can slightly be improved through small-scale energy storage. However, the stability of power is less critical in the planting process than in commercial and industrial processes. In [48] continuous 16 h/8 h (light/dark) as a control group was compared with five intermittent lightings while providing the same light duration of 16 h/8 h (L/D). The results showed that two cycles of 8 h/4 h (L/D) and three cycles of 6 h/3 h (L/D) or 4 h/2 h (L/D) within 24 h/D) all improved sweetness and crispness to promote lettuce flavor, with three light cycles increasing shoot biomass and significantly elevating glucose content of lettuce in all intermittent groups. Cabbage [49], sweet potato seedlings [50], and basil [51] plants all showed similar profiles under intermittent photoperiod treatment. This indicates that the intermittent photoperiod has less effect on the growth of some plants, and reasonable intermittency can even promote plant growth, which can be well combined with the intermittency of renewable energy generation.
According to (1), the daily power consumption of container lighting under different light intensities (T ⊆ 8–16 h·d−1) is 9.7–19.5 kWh for a light intensity of 200 μmol m−2s−1 and 29.1–58.2 kWh for a light intensity of 600 μmol m−2s−1. According to the photoperiod and growth days of typical short-growth cycles, the power consumption at the corresponding light intensities is shown in Figure 9, where the x-axis coordinate is the number of growth days (20 < x < 90), the y-coordinate is the crop photoperiod (8 < y < 16), and the z-coordinate is the container lighting power consumption. As shown in Figure 9, the total power consumption for lighting at a light intensity of 200 μmol m−2s−1 was 194.6–1751 kWh. The total power consumption for container lighting at a light intensity of 600 μmol m−2s−1 was 582.4–5241.6 kWh.
Other electricity consumption equipment for growing containers mainly include an air conditioner, irrigation system, and ventilation. The air conditioner is mainly used to cool down the container. According to the container space configuration one horsepower air conditioner, the electricity consumption is about 17.652 kWh per day, but most varieties do not need a long-term air conditioner. The irrigation system’s daily electricity consumption is about 1.8 kWh and the ventilation daily electricity consumption is about 1.44 kWh. The daily power consumption of the container is in the range of 50–79 kWh.
A 5 MW wind turbine with 1700 h of full operation hours in a year could support a minimum of 294 containers working simultaneously on an average day, covering the electricity demand for lighting, air conditioning, ventilation, and irrigation power. If the growing area were also employed to grow leafy vegetables, sprouts, and mushrooms, the number of containers supported simultaneously is even higher. In addition, during the season when renewable energy resources are low, the proportion of sprouts and mushrooms could be increased, and the proportion of leafy vegetables reduced, which means that the seasonal fluctuations in renewable energy power production can be accommodated by adjusting the varieties of plants.
Table 3 shows a summary of the techno-economic analysis of the containers with different plants and renewable energy sources. Considering the differences in illumination, photoperiod, planting days, and mu yield, the lighting energy costs for lettuce, kale, and amaranth are estimated to be 2.55, 1.52, and 3.03 Yuan·kg−1 with an electricity cost of 0.35 Yuan per kWh for PV, and 4.37, 2.62, and 5.18 Yuan·kg−1, with 0.6 Yuan per kWh for wind power, respectively. If the plant light is used correctly, it can shorten its growth cycle and increase its yield. Crops are marketed earlier or counter-seasonally, and crop prices are increased accordingly. Thus, PV and wind power prices are competitive in the market. Choosing the plant in practice is also dependent on the market price of the crop and available varieties of plants.

5. Conclusions

In this study, growing containers suitable for offshore renewable energy were analyzed. Small experimental containers were first tested and their light intensity was compared with simulations to verify the applicability of the simulation tool for estimating the illumination patterns in the container. Then, the light intensity range and uniformity of a 20-foot container was evaluated for short-growth cycle crops.
The results showed that using side reflectors in the container would improve the illumination level and uniformity of the crop growth plane. In the 20-foot container, the reflectors had a significant energy-saving effect. The reflectors increased the lighting level by 57.4% and uniformity by 13.1% at plant height h = 0 cm, and by 16.6% and 8% at h = 25 cm, respectively. If all standard layers in the container were planted with leafy vegetables, the daily power consumption would be 50–79 kWh. The seasonal fluctuation in renewable power production could be compensated by increasing the proportion of crop varieties growing, with lower illumination requirements such as mushrooms, sprouts, and some leafy vegetable species. Considering the differences in illumination, photoperiod, planting days, and yield per unit area, the lighting energy costs for lettuce, kale, and amaranth are estimated to be about 2.55, 1.52, and 3.03 Yuan·kg−1 when powered by PV, and 4.37, 2.62, and 5.18 Yuan·kg−1 with wind power.
Growing containers can potentially be beneficial in increasing food production, reducing environmental pollution, and contributing to sustainable farming. Marine renewable energy power generation systems such as offshore, shore-based, or floating photovoltaic and off-shore wind power are just emerging on the energy market, but their use for food production in marine conditions is still in its infancy. The renewable energy-based growing containers shown here may help to promote the sustainable development of marine farms.

Author Contributions

Conceptualization, methodology, and resources: R.K. and Y.S.; software and writing—original draft preparation: N.F.; formal analysis and visualization: W.Z. and S.G.; data curation and investigation: X.Z. and H.H. All authors have read and agreed to the published version of the manuscript.

Funding

This research was funded by National Natural Science Foundation of China (52166012); Key Research and Development Fund project of Hainan Province (ZDYF2020207) and the Research Start-up Fund project of Hainan University (KYQD(ZR)21092).

Institutional Review Board Statement

Not applicable.

Informed Consent Statement

Not applicable.

Data Availability Statement

The data that support the findings of this study are available from the corresponding author upon reasonable request.

Conflicts of Interest

The authors declare no conflict of interest.

Nomenclature

εArea of reasonable light intensity divided by total area [%]
aNumber of lamp beads
EIllumination [lx]
EaveAverage illumination [lx]
EmaxMaximum illumination [lx]
HIrradiation distance [cm]
hPlant height [cm]
LIrradiated surface length [mm]
QDaily electricity consumption per unit planting area [kWh·m−2·d−1]
STotal planted area [m2]
SAReasonable light intensity area [m2]
TPhotoperiod (h·d−1)
UPhotosynthetic photon flux density [μmol m−2s−1]
uLight uniformity [%]
PLEDLamp bead power [W]
WIrradiation surface width [mm]

References

  1. Kajikawa, Y.; Ohno, J.; Takeda, Y.; Matsushima, K.; Komiyama, H. Creating an academic landscape of sustainability science: An analysis of the citation network. Sustain. Sci. 2007, 2, 221–231. [Google Scholar] [CrossRef] [Green Version]
  2. Altieri, M.A.; Nicholls, C.I. The adaptation and mitigation potential of traditional agriculture in a changing climate. Clim. Chang. 2017, 140, 33–45. [Google Scholar] [CrossRef]
  3. Ferdous, Z.; Zulfiqar, F.; Datta, A.; Hasan, A.K.; Sarker, A. Potential and challenges of organic agriculture in Bangladesh: A review. J. Crop Improv. 2021, 35, 403–426. [Google Scholar] [CrossRef]
  4. Engler, N.; Krarti, M. Review of energy efficiency in controlled environment agriculture. Renew. Sustain. Energy Rev. 2021, 141, 110786. [Google Scholar] [CrossRef]
  5. Kikuchi, Y.; Kanematsu, Y.; Yoshikawa, N.; Okubo, T.; Takagaki, M. Environmental and resource use analysis of plant factories with energy technology options: A case study in Japan. J. Clean. Prod. 2018, 186, 703–717. [Google Scholar] [CrossRef]
  6. Kozai, T.; Niu, G. Role of the plant factory with artificial lighting (PFAL) in urban areas. In Plant Factory; Elsevier: Amsterdam, The Netherlands, 2020; pp. 7–34. [Google Scholar]
  7. Bafort, F.; Kohnen, S.; Maron, E.; Bouhadada, A.; Ancion, N.; Crutzen, N.; Jijakli, M.H. The Agro-Economic Feasibility of Growing the Medicinal Plant Euphorbia peplus in a Modified Vertical Hydroponic Shipping Container. Horticulturae 2022, 8, 256. [Google Scholar] [CrossRef]
  8. Liebman-Pelaez, M.; Kongoletos, J.; Norford, L.K.; Reinhart, C. Validation of a building energy model of a hydroponic container farm and its application in urban design. Energy Build. 2021, 250, 111192. [Google Scholar] [CrossRef]
  9. Avgoustaki, D.D.; Xydis, G. Plant factories in the water-food-energy Nexus era: A systematic bibliographical review. Food Secur. 2020, 12, 253–268. [Google Scholar] [CrossRef]
  10. Ahmed, H.A.; Yu-Xin, T.; Qi-Chang, Y. Optimal control of environmental conditions affecting lettuce plant growth in a controlled environment with artificial lighting: A review. S. Afr. J. Bot. 2020, 130, 75–89. [Google Scholar] [CrossRef]
  11. Sipos, L.; Balázs, L.; Székely, G.; Jung, A.; Sárosi, S.; Radácsi, P.; Csambalik, L. Optimization of basil (Ocimum basilicum L.) production in LED light environments–a review. Sci. Hortic. 2021, 289, 110486. [Google Scholar] [CrossRef]
  12. Xydis, G.A.; Liaros, S.; Avgoustaki, D.-D. Small scale Plant Factories with Artificial Lighting and wind energy microgeneration: A multiple revenue stream approach. J. Clean. Prod. 2020, 255, 120227. [Google Scholar] [CrossRef]
  13. Imam, S.; Fitzgerald, C.M.; Cook, E.M.; Donohue, T.J.; Noguera, D.R. Quantifying the effects of light intensity on bioproduction and maintenance energy during photosynthetic growth of Rhodobacter sphaeroides. Photosynth. Res. 2015, 123, 167–182. [Google Scholar] [CrossRef] [PubMed]
  14. Massa, G.D.; Kim, H.-H.; Wheeler, R.M.; Mitchell, C.A. Plant productivity in response to LED lighting. HortScience 2008, 43, 1951–1956. [Google Scholar] [CrossRef]
  15. Al Murad, M.; Razi, K.; Jeong, B.R.; Samy, P.M.A.; Muneer, S. Light emitting diodes (LEDs) as agricultural lighting: Impact and its potential on improving physiology, flowering, and secondary metabolites of crops. Sustainability 2021, 13, 1985. [Google Scholar] [CrossRef]
  16. Wan, Y.; Wu, Y.; Zhang, M.; Hong, A.; Liu, Y. Effects of photoperiod extension via red–blue light-emitting diodes and high-pressure sodium lamps on the growth and photosynthetic characteristics in Paeonia lactiflora. Acta Physiol. Plant. 2020, 42, 174. [Google Scholar] [CrossRef]
  17. Xu, Y.; Yang, M.; Cheng, F.; Liu, S.; Liang, Y. Effects of LED photoperiods and light qualities on in vitro growth and chlorophyll fluorescence of Cunninghamia lanceolata. BMC Plant Biol. 2020, 20, 269. [Google Scholar] [CrossRef]
  18. Jähne, F.; Hahn, V.; Würschum, T.; Leiser, W.L. Speed breeding short-day crops by LED-controlled light schemes. Theor. Appl. Genet. 2020, 133, 2335–2342. [Google Scholar] [CrossRef]
  19. Joshi, J.; Zhang, G.; Shen, S.; Supaibulwatana, K.; Watanabe, C.K.; Yamori, W. A combination of downward lighting and supplemental upward lighting improves plant growth in a closed plant factory with artificial lighting. HortScience 2017, 52, 831–835. [Google Scholar] [CrossRef] [Green Version]
  20. Zhang, X.; He, D.; Niu, G.; Yan, Z.; Song, J. Effects of environment lighting on the growth, photosynthesis, and quality of hydroponic lettuce in a plant factory. Int. J. Agric. Biol. Eng. 2018, 11, 33–40. [Google Scholar] [CrossRef]
  21. Carotti, L.; Graamans, L.; Puksic, F.; Butturini, M.; Meinen, E.; Heuvelink, E.; Stanghellini, C. Plant factories are heating up: Hunting for the best combination of light intensity, air temperature and root-zone temperature in lettuce production. Front. Plant Sci. 2021, 11, 592171. [Google Scholar] [CrossRef]
  22. Zhou, Y.; Gu, A. Learning curve analysis of wind power and photovoltaics technology in US: Cost reduction and the importance of research, development and demonstration. Sustainability 2019, 11, 2310. [Google Scholar] [CrossRef] [Green Version]
  23. Cong, R.-G. An optimization model for renewable energy generation and its application in China: A perspective of maximum utilization. Renew. Sustain. Energy Rev. 2013, 17, 94–103. [Google Scholar] [CrossRef]
  24. Liang, X. Emerging power quality challenges due to integration of renewable energy sources. IEEE Trans. Ind. Appl. 2016, 53, 855–866. [Google Scholar] [CrossRef]
  25. Zhipeng, W.; Zhiyu, M.; Hongyu, W.; Shaoming, L. Optimized Design of Combined Spectrum LED Light Source for Plant Growth. Zhaoming Gongcheng Xuebao 2018, 29, 25–30. [Google Scholar]
  26. Ji, Y.; Yuan, Y.; Wu, G.; Feng, C.; Cheng, R.; Ma, Q.; Chen, X.; Tong, Y. A novel spectral-splitting solar indoor lighting system with reflective direct-absorption cavity: Optical and thermal performance investigating. Energy Convers. Manag. 2022, 266, 115788. [Google Scholar] [CrossRef]
  27. Shibles, R. Terminology Pertaining to Photosynthesis 1. Crop Sci. 1976, 16, 437–438. [Google Scholar] [CrossRef]
  28. Mao, A.; Wang, J. Calculation and Application of Photosynthetic Photon Flux Density. Period. Ocean Univ. China 2006, 36, 151–155. [Google Scholar]
  29. Brazaitytė, A.; Sakalauskienė, S.; Samuolienė, G.; Jankauskienė, J.; Viršilė, A.; Novičkovas, A.; Sirtautas, R.; Miliauskienė, J.; Vaštakaitė, V.; Dabašinskas, L. The effects of LED illumination spectra and intensity on carotenoid content in Brassicaceae microgreens. Food Chem. 2015, 173, 600–606. [Google Scholar] [CrossRef]
  30. Song, J.; Huang, H.; Hao, Y.; Song, S.; Zhang, Y.; Su, W.; Liu, H. Nutritional quality, mineral and antioxidant content in lettuce affected by interaction of light intensity and nutrient solution concentration. Sci. Rep. 2020, 10, 2796. [Google Scholar] [CrossRef] [Green Version]
  31. Pennisi, G.; Pistillo, A.; Orsini, F.; Cellini, A.; Spinelli, F.; Nicola, S.; Fernandez, J.A.; Crepaldi, A.; Gianquinto, G.; Marcelis, L.F. Optimal light intensity for sustainable water and energy use in indoor cultivation of lettuce and basil under red and blue LEDs. Sci. Hortic. 2020, 272, 109508. [Google Scholar] [CrossRef]
  32. Sago, Y. Effects of light intensity and growth rate on tipburn development and leaf calcium concentration in butterhead lettuce. HortScience 2016, 51, 1087–1091. [Google Scholar] [CrossRef]
  33. Jiang, H.; Li, Y.; He, R.; Tan, J.; Liu, K.; Chen, Y.; Liu, H. Effect of Supplemental UV-A Intensity on Growth and Quality of Kale under Red and Blue Light. Int. J. Mol. Sci. 2022, 23, 6819. [Google Scholar] [CrossRef] [PubMed]
  34. Colonna, E.; Rouphael, Y.; Barbieri, G.; De Pascale, S. Nutritional quality of ten leafy vegetables harvested at two light intensities. Food Chem. 2016, 199, 702–710. [Google Scholar] [CrossRef]
  35. Meas, S.; Luengwilai, K.; Thongket, T. Enhancing growth and phytochemicals of two amaranth microgreens by LEDs light irradiation. Sci. Hortic. 2020, 265, 109204. [Google Scholar] [CrossRef]
  36. Jones-Baumgardt, C.; Llewellyn, D.; Ying, Q.; Zheng, Y. Intensity of sole-source light-emitting diodes affects growth, yield, and quality of Brassicaceae microgreens. HortScience 2019, 54, 1168–1174. [Google Scholar] [CrossRef] [Green Version]
  37. Lefsrud, M.G.; Kopsell, D.A.; Kopsell, D.E.; Curran-Celentano, J. Irradiance levels affect growth parameters and carotenoid pigments in kale and spinach grown in a controlled environment. Physiol. Plant. 2006, 127, 624–631. [Google Scholar] [CrossRef]
  38. Zhou, J.; Li, P.; Wang, J. Effects of Light Intensity and Temperature on the Photosynthesis Characteristics and Yield of Lettuce. Horticulturae 2022, 8, 178. [Google Scholar] [CrossRef]
  39. Chen, Z.; Shah Jahan, M.; Mao, P.; Wang, M.; Liu, X.; Guo, S. Functional growth, photosynthesis and nutritional property analyses of lettuce grown under different temperature and light intensity. J. Hortic. Sci. Biotechnol. 2021, 96, 53–61. [Google Scholar] [CrossRef]
  40. Zheng, Z.; Ma, Z.; Li, R.; Wei, H.; Chu, X.; Liu, H. Design method for improving illumination distribution uniformity of LED plant growth light source. In Proceedings of the 2021 18th China International Forum on Solid State Lighting & 2021 7th International Forum on Wide Bandgap Semiconductors (SSLChina: IFWS), Shenzhen, China, 6–8 December 2021; pp. 202–210. [Google Scholar]
  41. Bai, J.; Li, X.; Hu, L.; Wei, Y.; Gao, T.; Xu, X.; Sun, X. Research on illumination uniformity in edible mushrooms incubator with genetic algorithm. Optik 2021, 239, 166862. [Google Scholar] [CrossRef]
  42. Cui, S.; Lv, H.; Wu, X.; Zhang, Y.; He, L. Optimization of plant light source based on simulated annealing particle swarm optimization algorithm. In Proceedings of the 2018 Chinese Control And Decision Conference (CCDC), Shenyang, China, 9–11 June 2018; pp. 700–703. [Google Scholar]
  43. Zhu, Z.; Ying, S.; Hu, H.; Tong, X.; Zheng, S. Study on illumination distribution and uniformity for LED plant light source array. Acta Agric. Zhejiangensis 2015, 27, 1489–1493. [Google Scholar]
  44. Yorifuji, R.; Obara, S.y. Economic design of artificial light plant factories based on the energy conversion efficiency of biomass. Appl. Energy 2022, 305, 117850. [Google Scholar] [CrossRef]
  45. Snaith, H.J. Present status and future prospects of perovskite photovoltaics. Nat. Mater. 2018, 17, 372–376. [Google Scholar] [CrossRef] [PubMed]
  46. Zhang, Y.; Xu, Y.; Zhou, X.; Guo, H.; Zhang, X.; Chen, H. Compressed air energy storage system with variable configuration for accommodating large-amplitude wind power fluctuation. Appl. Energy 2019, 239, 957–968. [Google Scholar] [CrossRef]
  47. Wei, L.; Yanming, W.; Yalin, X.; Zhijie, T.; Yanbing, Z. Key Technology of Water Electrolysis and Levelized Cost of Hydrogen Analysis under Carbon Neutral Vision. Trans. China Electrotech. Soc. 2022, 37, 2888–2896. [Google Scholar] [CrossRef]
  48. Chen, X.-l.; Yang, Q.-c. Effects of intermittent light exposure with red and blue light emitting diodes on growth and carbohydrate accumulation of lettuce. Sci. Hortic. 2018, 234, 220–226. [Google Scholar] [CrossRef]
  49. Filatov, D.; Vetchinnikov, A.; Olonina, S.; Olonin, I.Y. Intermittent LED lighting helps reduce energy costs when growing microgreens on vertical controlled environment farms. In Proceedings of the IOP Conference Series: Earth and Environmental Science; IOP Publishing Ltd.: Bristol, UK, 2022; p. 012096. [Google Scholar]
  50. Sivakumar, G.; Heo, J.; Kozai, T.; Paek, K. Effect of continuous or intermittent radiation on sweet potato plantlets in vitro. J. Hortic. Sci. Biotechnol. 2006, 81, 546–548. [Google Scholar] [CrossRef]
  51. Avgoustaki, D.D.; Bartzanas, T.; Xydis, G. Minimising the energy footprint of indoor food production while maintaining a high growth rate: Introducing disruptive cultivation protocols. Food Control. 2021, 130, 108290. [Google Scholar] [CrossRef]
Figure 1. Four T8LED full-spectrum plant grow light models and typography. Where a, b, c, and d, respectively, the first row of lights, the second row of lights, the third row of lights and the fourth row of lights.
Sustainability 14 14186 g001
Figure 2. Illumination test environment of two working conditions.
Sustainability 14 14186 g002
Figure 3. Schematic diagram of the environment inside the growing container. 1. air conditioner, 2. sensor, 3. reflector, 4. hydroponic tube, 5. water pipe, 6. router, 7. LED light, 8. seedling pot, 9. culture frame, 10. water tank, 11. seedling sponge, 12. container side panel.
Sustainability 14 14186 g003
Figure 4. Mean and significance analysis of LED illumination for the four rows of lights in Figure 1.
Sustainability 14 14186 g004
Figure 5. Comparison of simulated (S) and actual (M) illumination without a reflector. Numbers 1–8 represent rows 1–8, respectively.
Sustainability 14 14186 g005
Figure 6. Comparison of simulated (S) and actual (M) illumination with reflectors. Numbers 1–8 represent rows 1–8, respectively.
Sustainability 14 14186 g006
Figure 7. Illumination map of container standard layer with different growth heights.
Sustainability 14 14186 g007
Figure 8. U, u, and ε values at different irradiation heights.
Sustainability 14 14186 g008
Figure 9. Lighting electricity demand for different light intensities in a container.
Sustainability 14 14186 g009
Table 1. Grid irrelevance analysis.
No. of PixelsNumber of GridsEave (lx)
5025007103
10010,0007138
15022,5007150
Table 2. Optimum light intensity for some crops.
Crop NameLight Intensity (μmol m−2s−1)
Lettuce350 [30]
Kale250 [33]
Amaranth280 [35]
Basil100–300 [31]
Spinach200 [37]
Table 3. Selected leafy vegetable electricity costs.
Crop NameLight Intensity (μmol m−2s−1)Photoperiod (h·d−1)Maturity Days (d)Capacity
(kg·m−2)
Cost with Photovoltaics (Yuan·kg−1)Cost with Wind Power
(Yuan·kg−1)
Lettuce350 [30]16404.82.554.37
Kale250 [33]1690121.522.62
Amaranth280 [35]16302.33.035.18
Publisher’s Note: MDPI stays neutral with regard to jurisdictional claims in published maps and institutional affiliations.

