Article

Buffer Capacity of Steel Shed with Two Layer Absorbing System against the Impact of Rockfall Based on Coupled SPH-FEM Method

1
Guangdong Heli Civil Engineering Co., Ltd., Guangzhou 511400, China
2
Guangdong Communication Planning and Design Institute Group Co., Ltd., Guangzhou 510507, China
*
Author to whom correspondence should be addressed.
Sustainability 2022, 14(20), 13680; https://doi.org/10.3390/su142013680
Submission received: 14 September 2022 / Revised: 10 October 2022 / Accepted: 20 October 2022 / Published: 21 October 2022
(This article belongs to the Topic Natural Hazards and Disaster Risks Reduction)

Abstract

:
This study aimed to find the optimal thickness combination of the two-layered absorbing system combinated with an expanded polystyrene (EPS) cushion and a soil layer in a steel shed under dynamic loadings. The coupled Smooth Particle Hydrodynamic method (SPH) and Finite Element Method (FEM) were introduced to simulate the impact of the rockfall against the steel shed with a two-layer absorbing system. By comparing the numerical results with test data, the coupled numerical model was well validated. Through the verified numerical model, a series of numerical experiments were carried out to find the optimal combination for the two-layered absorbing system. The values of the EPS layer thickness as a percentage of the total thickness were set as 0% (P1), 20% (P2), 40% (P3), 60% (P4), 80% (P5), and 100% (P6). The results show that the coupled FEM–SPH method was an effective method to simulate rockfall impacting the steel rock shed; P4 (0.6 m thickness EPS cushion and 0.9 m thickness soil layer) was the most efficient combination, which can significantly reduce the structural displacement response by 43%. A two-layered absorbing system can effectively absorb about 90% of the total energy. The obtained results yield scientifically sound guidelines for further research on the design of steel sheds against rockfall.

1. Introduction

Rockfall hazards are natural disasters in mountainous areas. It poses a serious threat to engineering structures such as highways, railways, bridges, buildings, etc., and the huge impact force of falling rocks will destroy these structures [1,2]. There are mainly two protective structures used to reduce this hazard: passive ones and active ones. Because it is difficult to judge the potential source area of rocks, it is difficult to implement the active ones, and engineers usually choose the passive ones. Steel rock sheds are regarded as passive protective structures. Compared with reinforced concrete sheds, they have unique advantages such as low dead weight and fast construction speed and are widely used to prevent rocks from falling [3,4]. Most steel rock sheds are made of a steel column, steel beam, steel roof slab, and a buffer layer on top of the steel roof slab [5]. The buffer layer can effectively dissipate the rockfall impact energy, so as to reduce the maximum impact on the steel shed [6,7,8].
Conventionally, sand and soil, which are relatively cheap, are used as a cushion material; however, this kind of cushion has numerous disadvantages. The sand layer has to be very thick to form enough resistance capacity, which in turn makes the shed too much dead weight. Sheds also need massive foundations to support the heavy sands, which are impractical in narrow mountainous areas. In addition, the removal of fallen rocks and the replacement of cushion materials are difficult. In recent years, a two-layered absorbing system combinated with an expanded polystyrene (EPS) cushion and a soil layer has been designed. It was found that the two-layered absorbing system provides better anti-impact effects and, at the same time, it makes the structure dead-weight small. However, the percentage of the thickness of the EPS layer to the total thickness of the two-layered absorbing system is rarely studied, which leads to a poor buffering effect of the system in practical engineering [6,9]. Therefore, in order to provide some helpful guidelines for designing a two-layered absorbing system in steel sheds for the risk mitigation of rockfall, it is urgently required to optimize the two-layered absorbing system.
In recent years, a series of experimental studies have been conducted in the field of rock shed protection. Schellenberg et al. introduced various types of protective cushions to search for better absorbing effects [10]. Calvetti et al. conducted a series of physical experiments to study the shock absorption effects of soil stratum, including the effect of various parameters such as falling height, block mass, and cushion thickness [11]. Bhatti et al. performed a real-scale experiment of rockfall impacting a reinforced concrete shed to study the dynamic responses [1]. Wu et al. developed a physical experiment of rockfall impacting a steel rock shed with a two-layered absorbing system [12]. The above studies are of positive significance in resisting rockfall impact. However, these studies are mainly focused on a single buffer layer, and there are few studies on the optimization thickness combination of a two-layered absorbing system. To date, in engineering practice, several empirical methods have been proposed to estimate the rockfall impact force, such as the Chinese, Swiss, and Japanese design codes [13,14,15]. He et al. proposed the calculation formula of impact forces based on the elastoplastic collision theory and the Hertz contact theory [16]. Yu et al. also established an impact force model [17]. The kinetic energy of the rock block, the impact angle of the block, and the modulus of elasticity of the rock were analyzed using the Buckingham theorem. Their results show that the buffer layer had a significant effect on the magnitude of the impact force. These methods are simple to use for a single buffer layer. However, these methods are not applicable to the combined absorbing system [12].
Because of its economy and maturity, the numerical method has gradually become the main research method for this kind of problem. In the present study, the numerical methods for analyzing the combined absorbing system are mainly as follows: (1) FEM (Finite Element Method); Wu et al. carried out numerical simulations to compare the impact forces obtained by the single soil layer and the two-layered absorbing system [12]. Ouyang analyzed the effects of various factors such as cushion strength and the thickness of the soil cushion on the impact force [6]. However, the FEM simulation of the soil layer is prone to grid distortion, which leads to a rough result. (2) DEM (Discrete Element Method); Zhang et al. employed a DEM model to study the energy propagation during rockfall impact on a granular material [18]. Shen investigated the various rock shape’s effects on the response of block impacts against a buffer layer [19]. However, it is difficult to calibrate particle material parameters with DEM [20]. Moreover, the soil layer consists of an enormous number of fine particles, and the computer operation efficiency will be reduced. These numerical studies are useful for understanding the mechanical mechanism of steel sheds impacted by rockfall. However, these methods are not suitable for simulating steel sheds with buffer layers impacted by rockfall. Moreover, it is still difficult to quantitatively conclude the dynamic response of the combined absorbing system under rockfall impact.
Above all, the current research shows that the two-layered absorbing system has a significant influence on the response of the steel shed, but quantitative studies of the optimal thickness combination of the two-layered absorbing system combinated with EPS cushion and soil layer are lacking. So, it is urgently required to study the optimal thickness combination of the two-layered absorbing system based on a more robust numerical tool.
Smoothed particle hydrodynamics (SPH) is a convenient way to describe the particle physics features and capture the sup-large deformation of the soil layer [20,21]. For the finite element simulation of the steel column, steel beam, and steel slab, its algorithm is mature, which can ensure sufficient accuracy. The coupled FEM–SPH approach can combine the advantages of SPH for simulating the sup-large deformation of soil and FEM for solving structural dynamics [20,22].
In this study, the coupled FEM–SPH method is used to find the optimal thickness combination between EPS and the soil layer under dynamic loadings. The content of this study is outlined as follows: In Section 2, a coupled SPH–FEM method in the LS-DYNA platform is introduced. In Section 3, a typical experiment of steel shed impacted by rockfall is described. The coupled FEM–SPH model can successfully reproduce the scale experiment. Section 4 conducts a series of numerical tests to find the optimal thickness combination for the two-layered absorbing system. Section 5 summarizes several conclusions.

2. Simulation Approaches

2.1. Brief SPH Description

The basic idea of the SPH method is to use a group of arbitrarily distributed particles to provide accurate and stable numerical solutions for the partial differential equations, which carry field variables such as density, mass, and stress tensor [23]. The SPH method can describe the mechanical state of the entire system by tracking the mechanical properties of each particle at any moment. The governing equations can be converted to the SPH form in two steps, including kernel approximation and particle approximation. In this way, the field variables can be recommended [23]:
f ( r i ) = Ω f ( r ) W ( r r , h ) d r
where f(r) is a function of the particle position vector r, r is a neighboring particle position vector in Ω , Ω is the support area of a particle with position vector r, and W is the smoothing kernel function. In this study, the cubic B-spline function is selected as the smoothing kernel function [24]:
W ( q , h ) = α D { 1 3 q 2 2 + 3 q 3 4 ; 0 q < 1 1 4 ( 2 q ) 3 ; 1 q < 2 0 ; q 2
where q is the normalized distance between particles r and r , q = | r r | / h , and h is the smoothing length defining the size of the influence area of W.  α D is the normalization factor; in three-dimensional space, α D = 10 / ( 7 π h 2 ) .
The particle approximation discretizes the continuous form of the SPH kernel approximation into the sum of adjacent particles by evaluating the field variables of the particles within the domain of influence as follows [24]:
f ( r i ) = m j ρ j j = 1 N f ( r j ) W ( r i r j , h )
where N is the total number of particles within the influence domain of the particle at point r, ρ j is the density of neighboring particles, and m j is the mass of the neighboring particles.
The governing equations for dynamic fluid flows can be written as a set of partial differential equations [24]:
{ d ρ i d t = m i j = 1 N v i j · i W i j d v i d t = j = 1 N m j ( p i ρ j 2 + p j ρ j 2 ) i W i j + F i e x t e r n a l / m i
where W i j is the influence area of particle i with respect to particle j. v i j is the velocity vector of particle i with respect to particle j. F i e x t e r n a l are external forces [25].

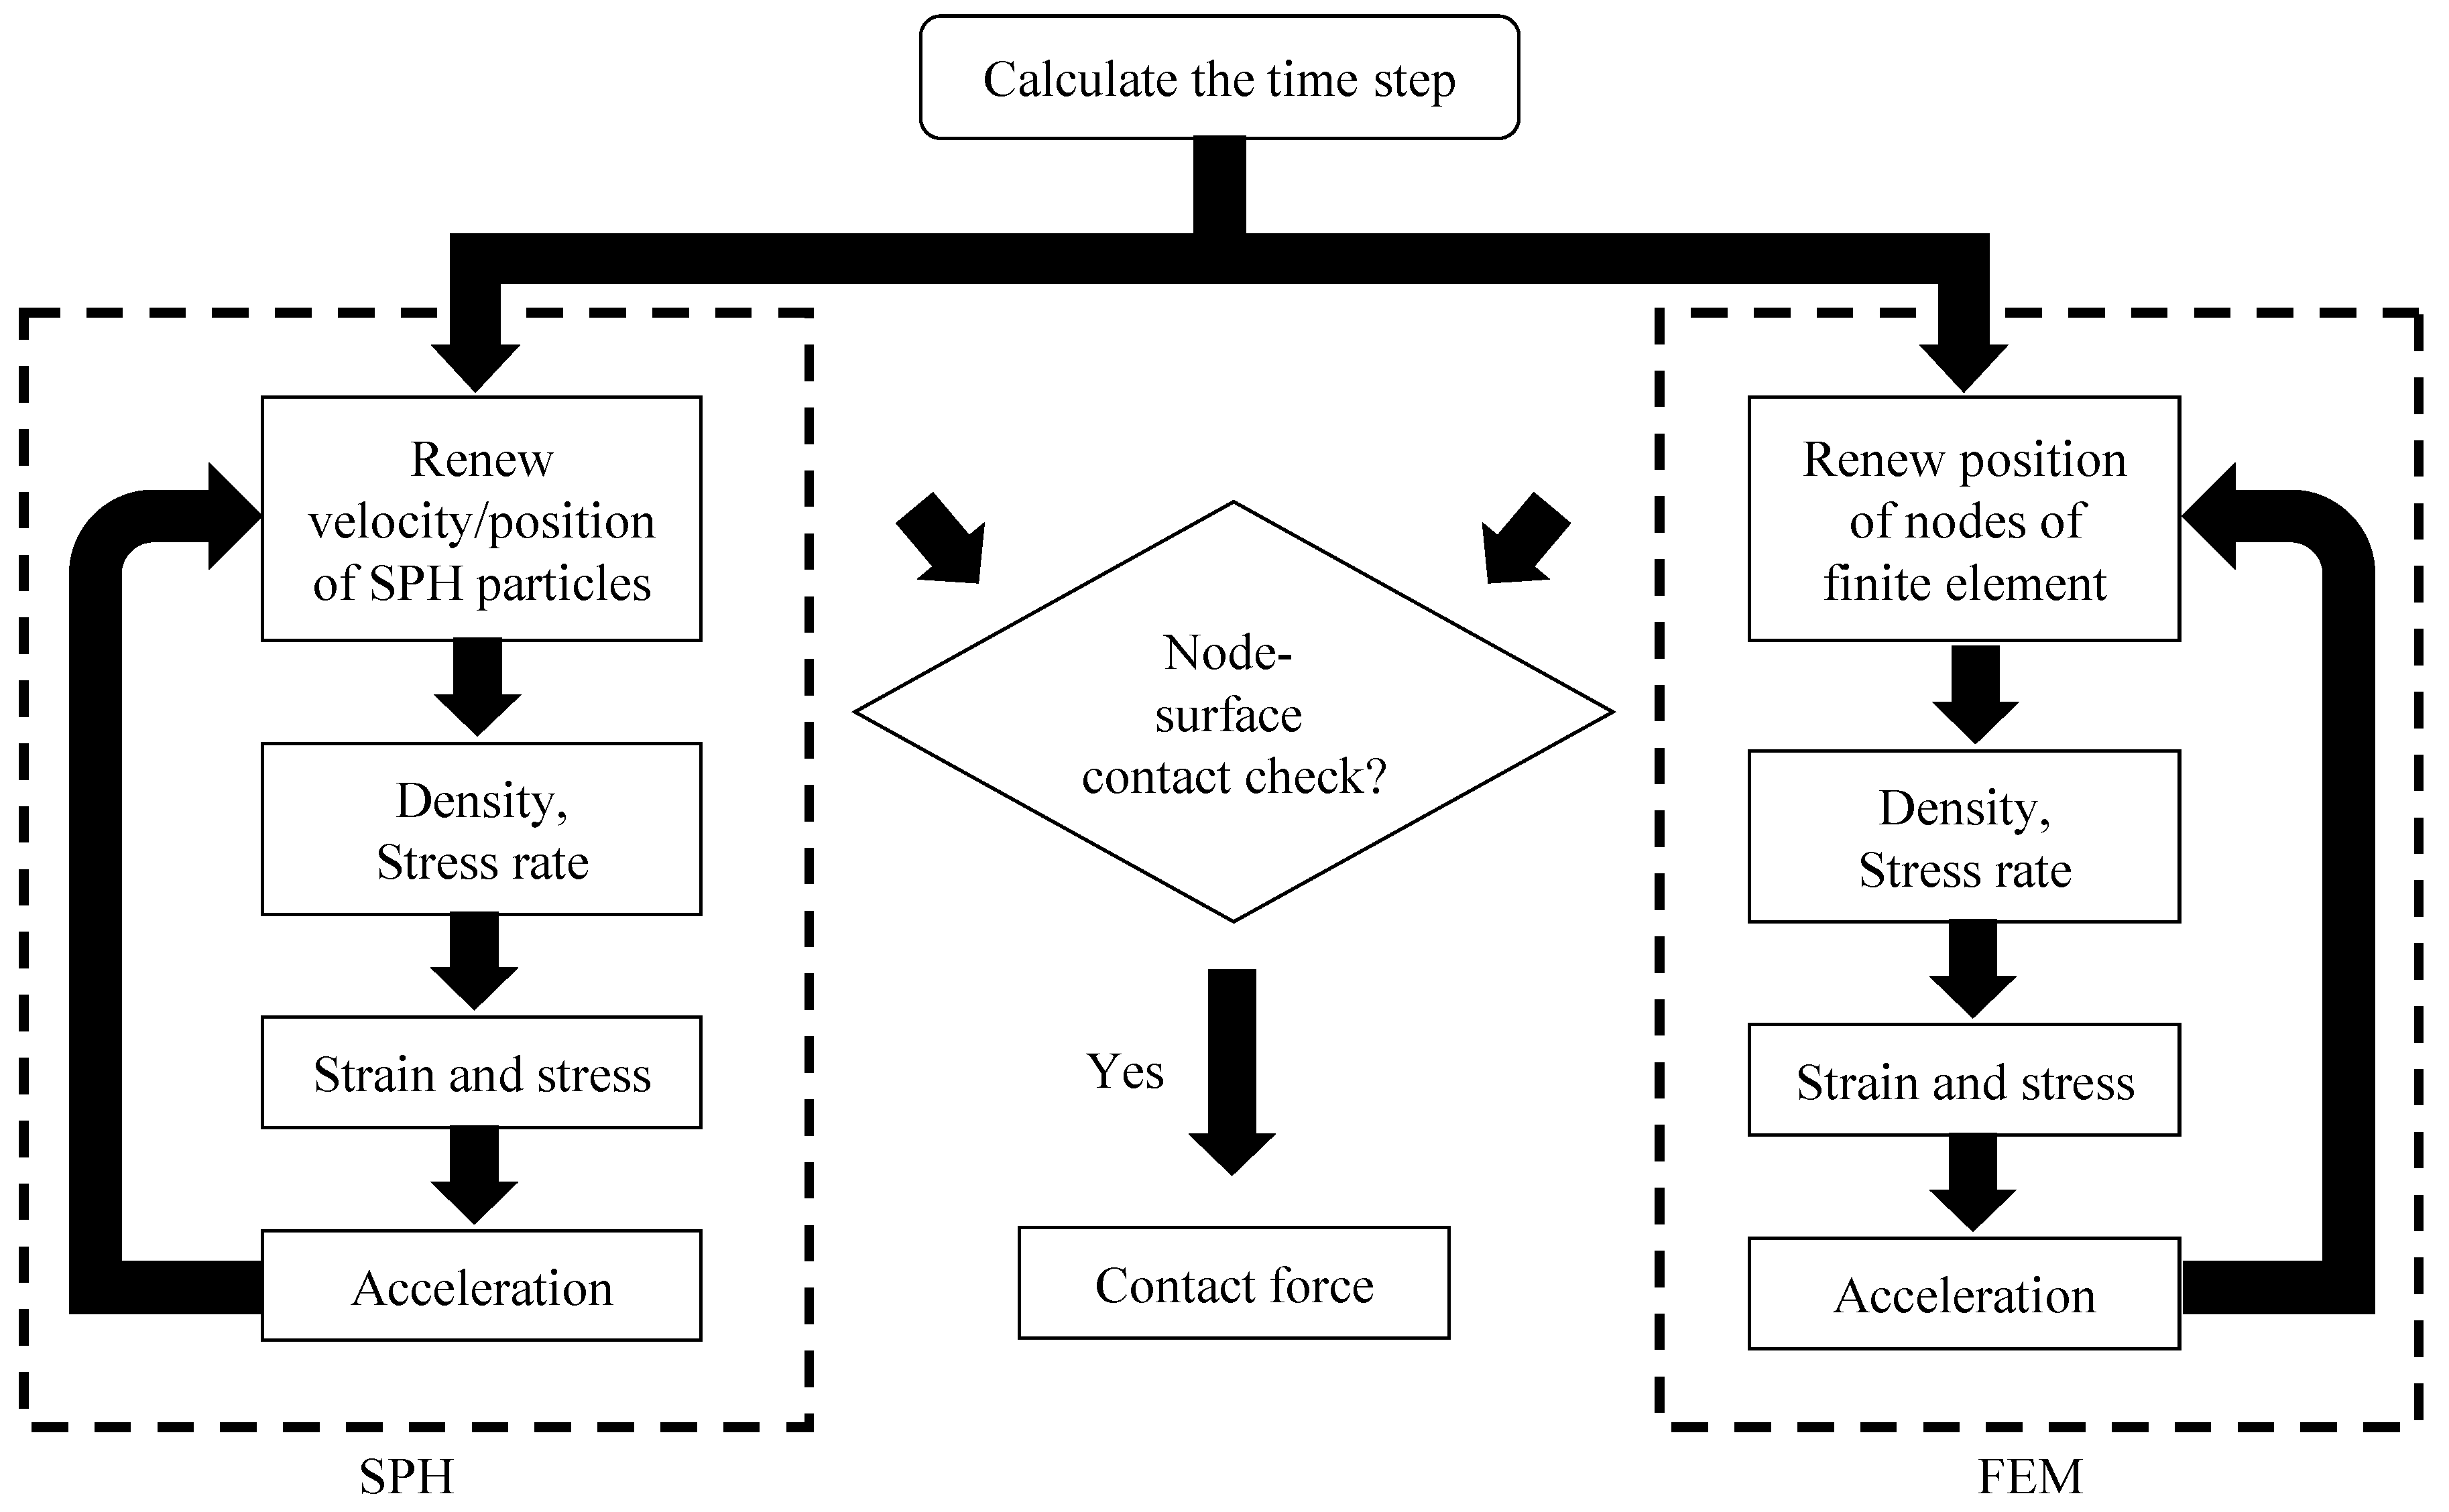
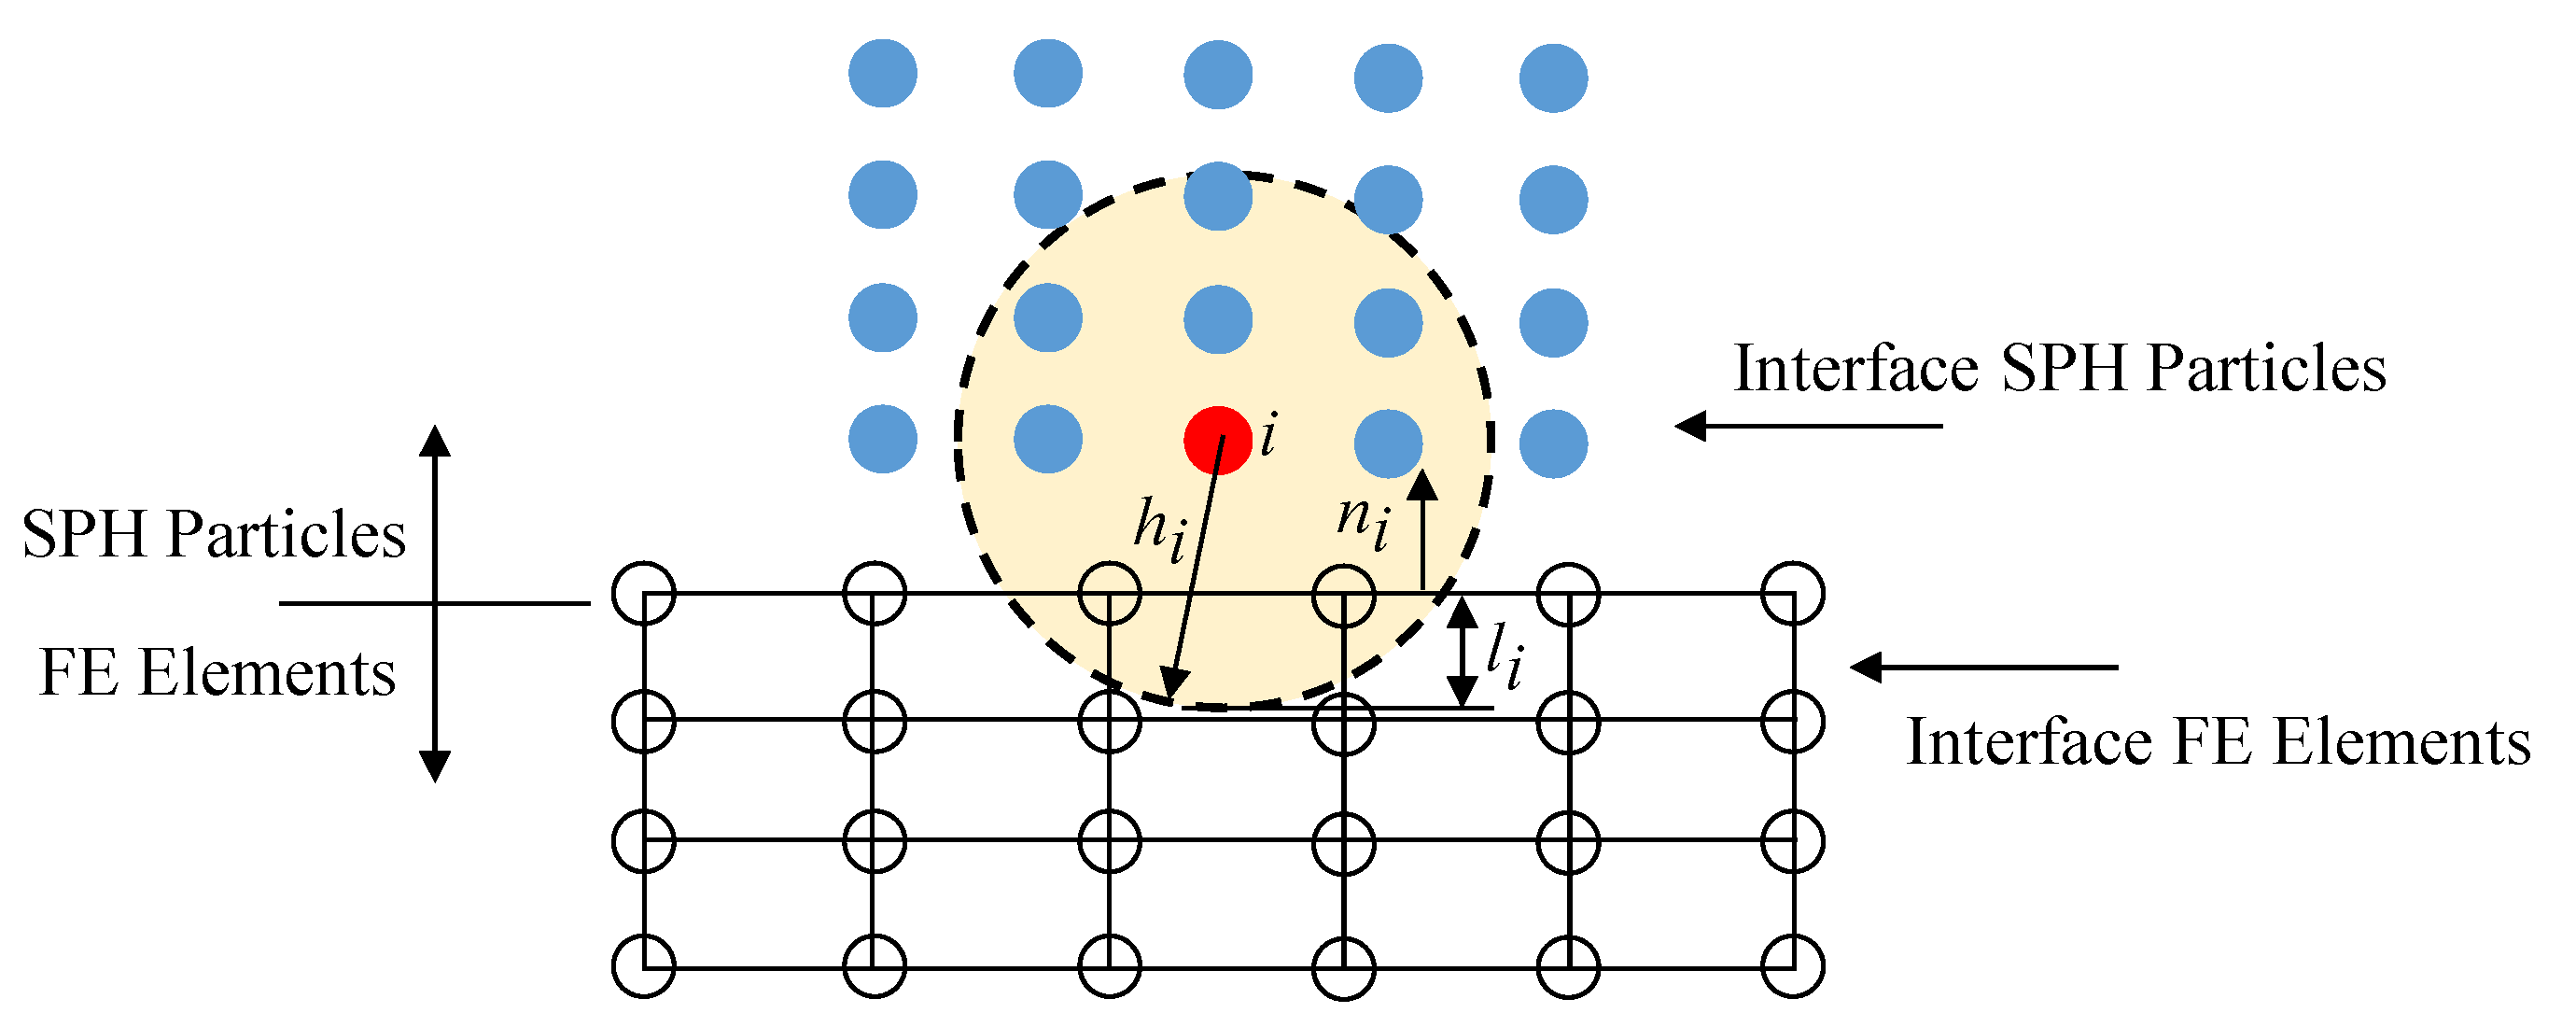
2.2. Coupled SPH-FEM Algorithm

The key problem of the coupled FEM–SPH method is dealing with the interface between FEM elements and SPH particles. The contact form is a node-surface contact, and the tangential impact force is obtained through the friction law. The normal impact force is obtained through the penalty contact algorithm [24]. The flowchart of the coupled SPH–FEM method is shown in Figure 1. At the beginning of every time step, it is determined whether any SPH particles have penetrated the FEM surfaces. If no penetration occurs, no processing is required, and these systems work as two separate processes. Otherwise, as shown in Figure 2, a contact force is generated between the SPH particles that meet the penetration conditions, and the parameters of the FEM elements and SPH particles will be updated [22].
The normal contact force f n is calculated as follows [22]:
f n = ( k n δ + c n δ ˙ ) n
where δ , c n , δ ˙ , k n , and n are the normal overlap, the normal damping coefficient, the relative normal velocity, the normal spring stiffness, and the unit normal displacement vector, respectively.
The tangential contact force f t is calculated as follows [26,27]:
f t = { ( k t δ t + c t δ ˙ t ) ; if | f n | μ > | k t δ t + c t δ ˙ t | ( k t δ t + c t δ ˙ t ) | k t δ t + c t δ ˙ t | | f n | μ ; otherwise
where k t , δ t , μ and c t are the tangential spring stiffness, the incremental tangential displacement, the friction coefficient, and the tangential damping coefficient, respectively. In this paper, both c n and c t are set as 0 [26].
k n and k t are calculated as follows [27]:
k n = k t = k 1 K s 2 V
where k1 is a penalty scale factor and is set as 0.1 [26], s is the segment area, K is the bulk modulus, and V is the element volume.
Figure 1. Flowchart of the coupled SPH–FEM method [27].
Sustainability 14 13680 g001
Figure 2. The finite elements in contact with the SPH particles.
Sustainability 14 13680 g002

3. Verification of Coupled SPH-FEM Model

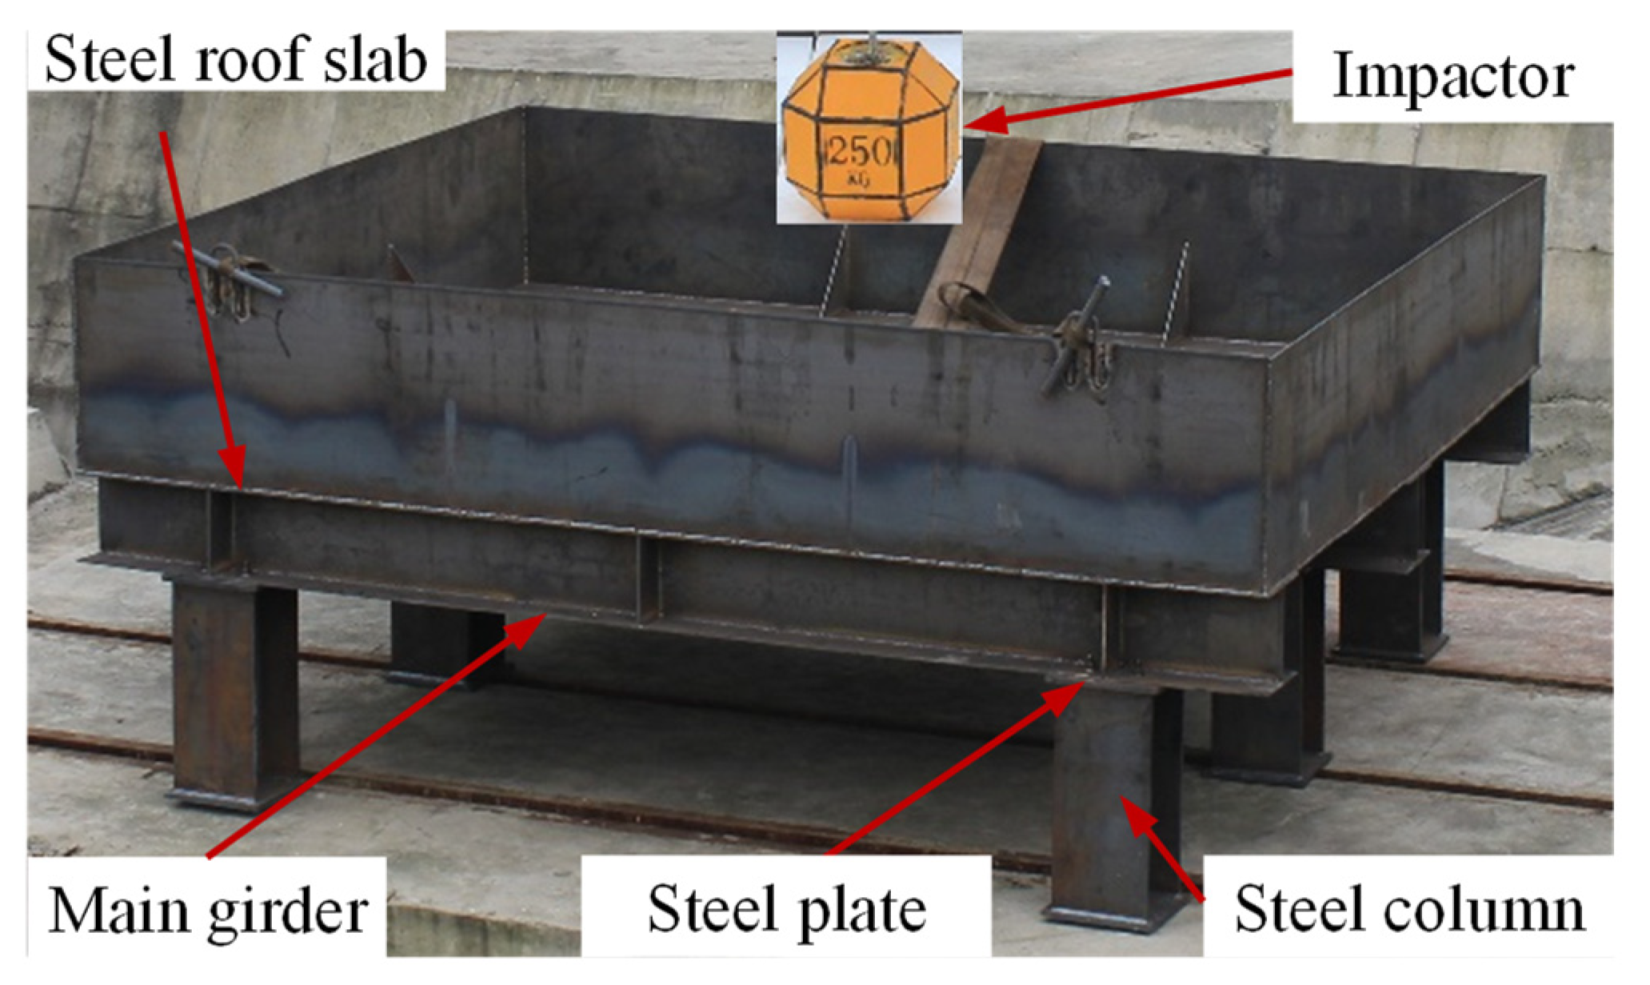
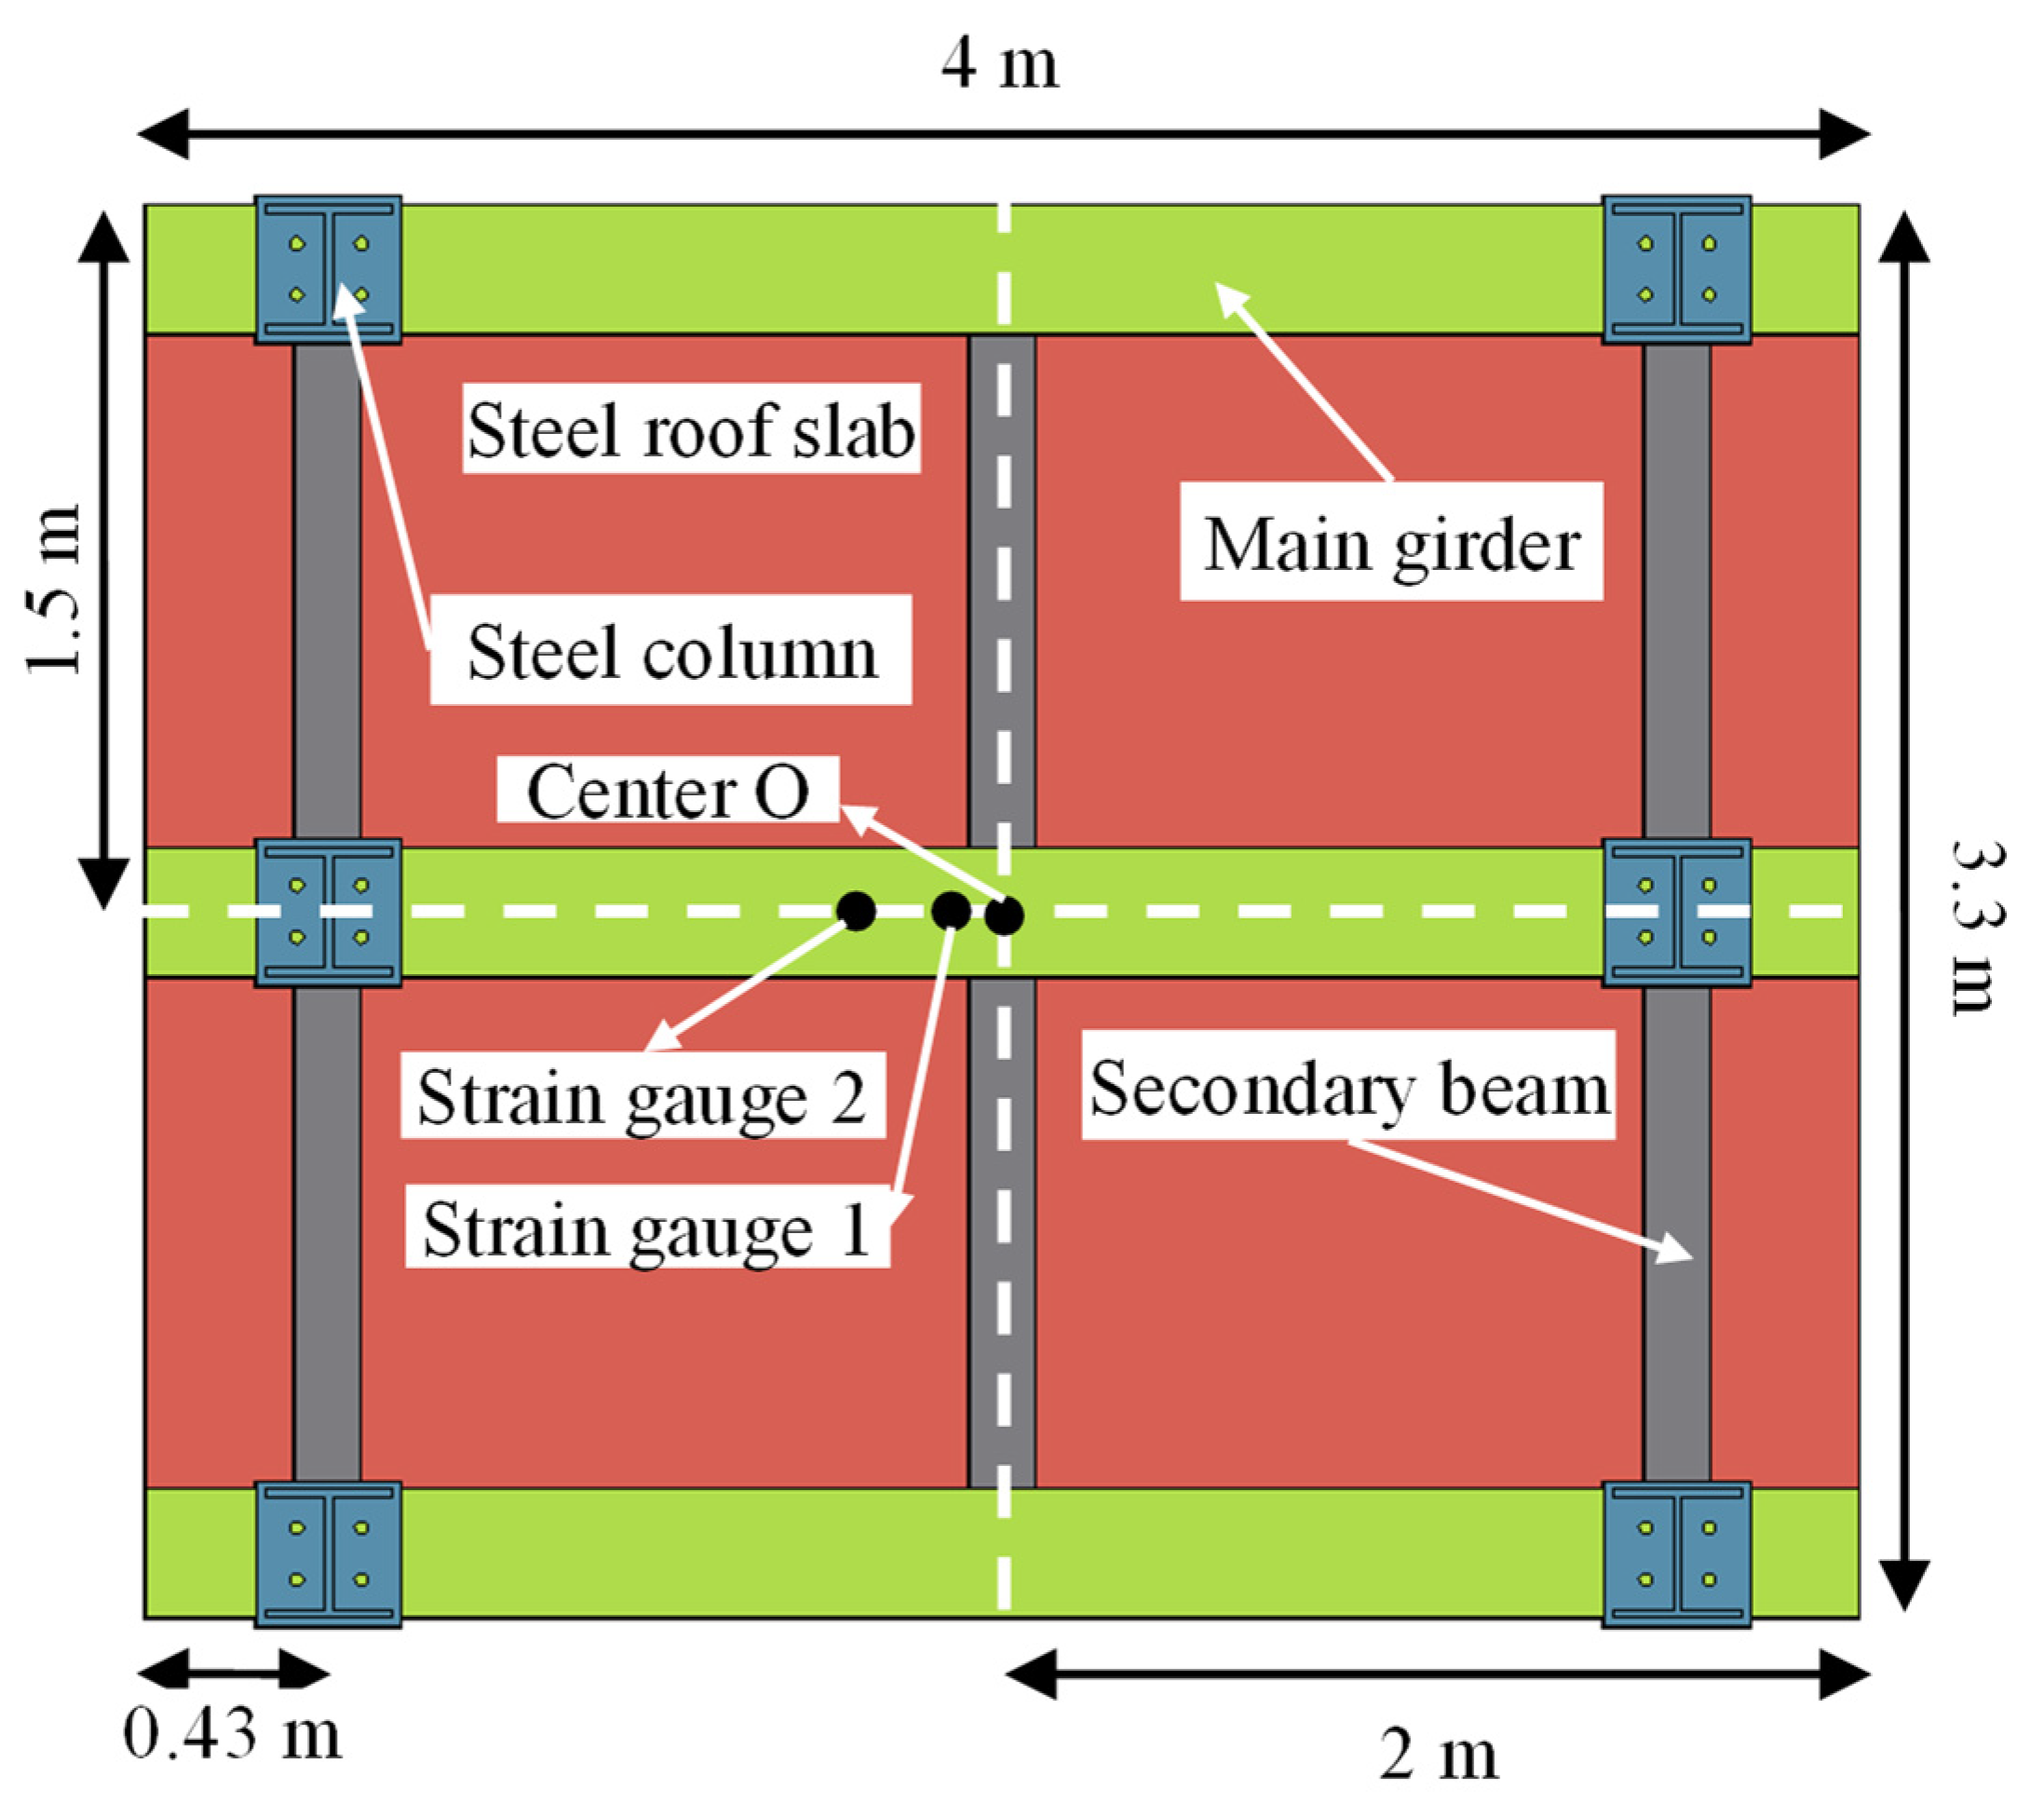
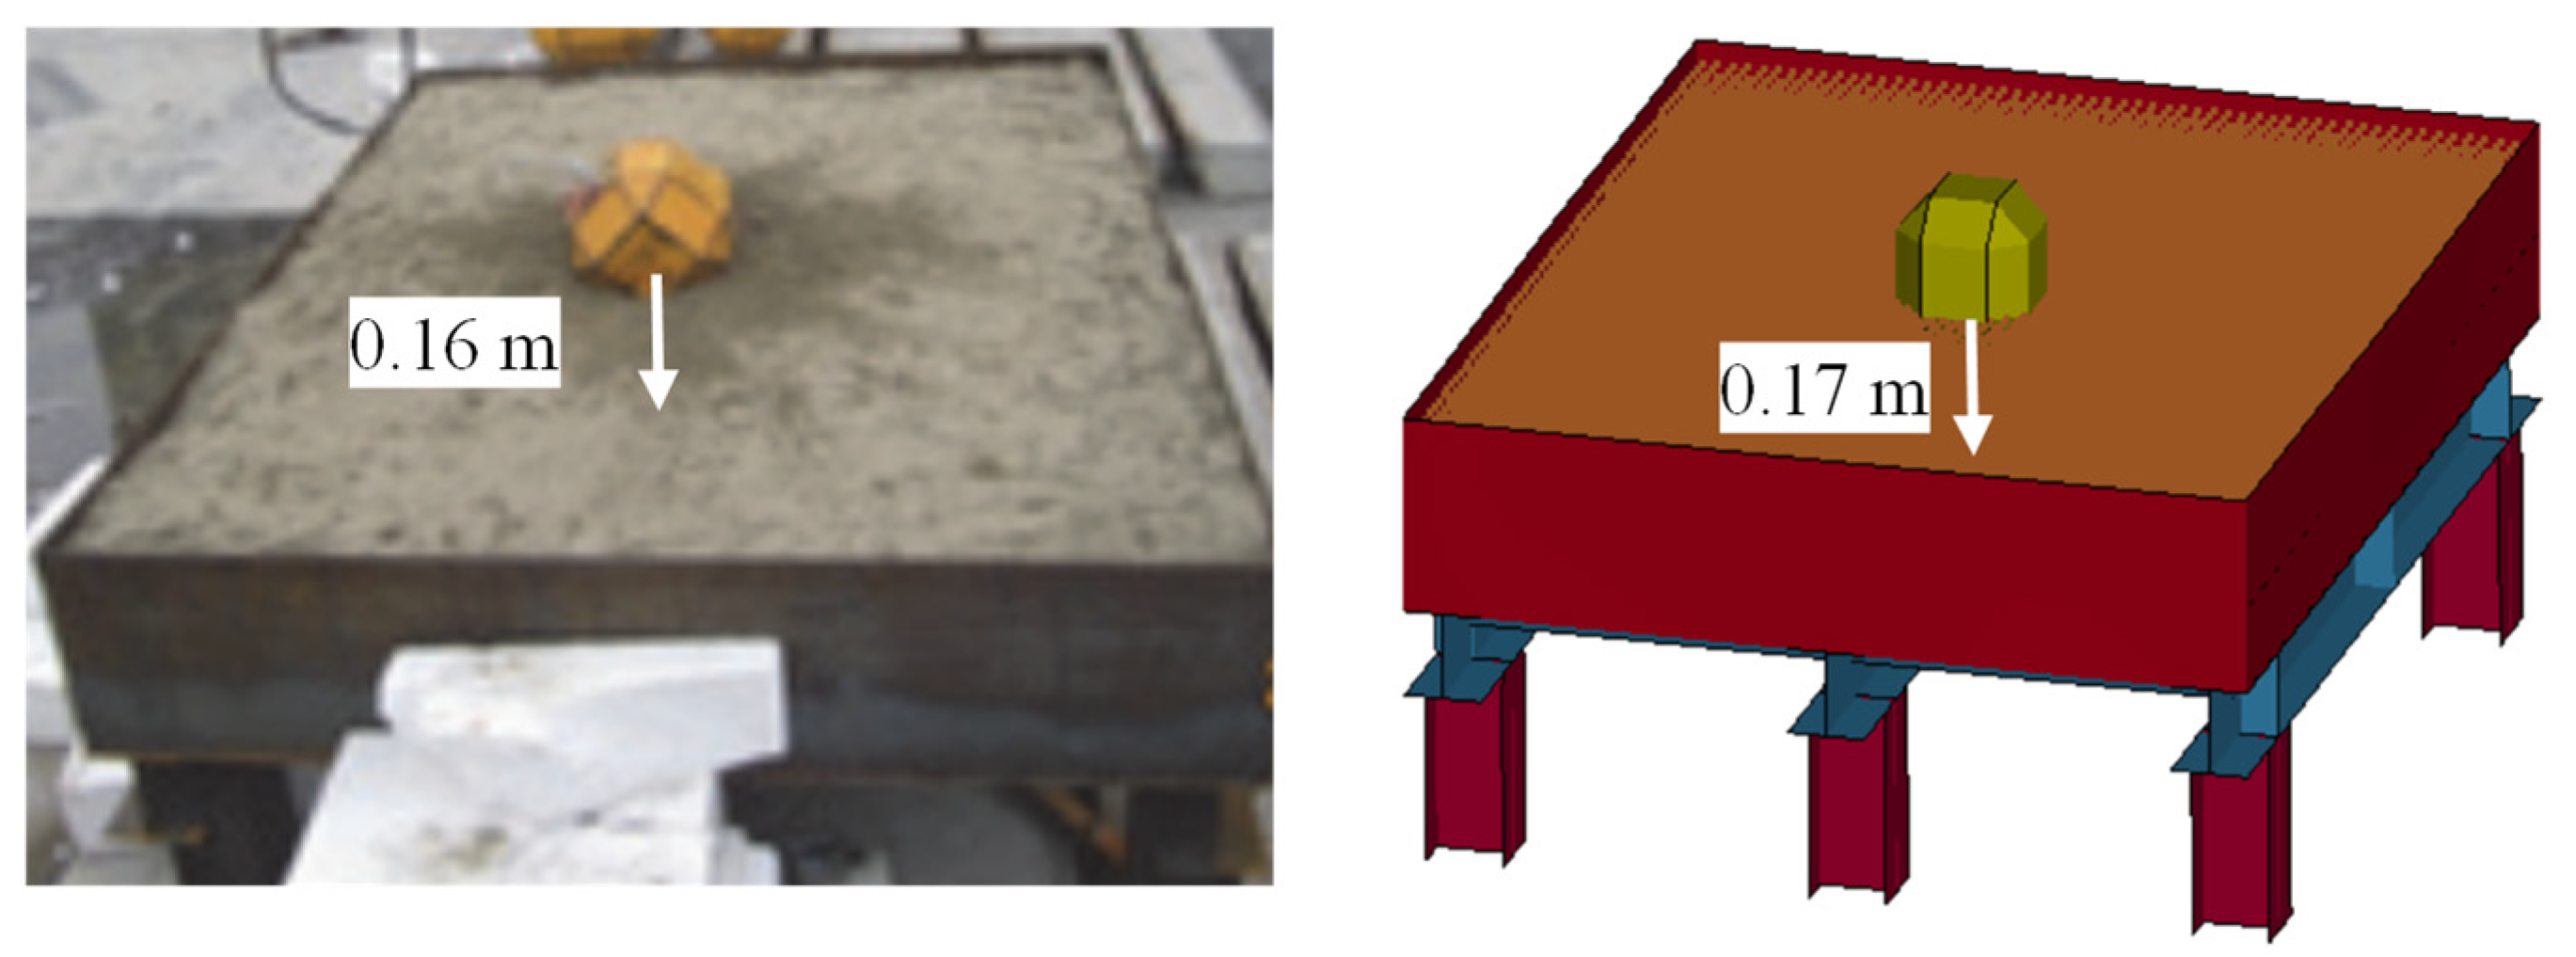
3.1. Experimental Overview

The test shed structure is shown in Figure 3. The shed structure model consisted of a steel column, main girder, secondary beam, steel roof slab, and the two-layered absorbing system. The two-layered absorbing system consisted of EPS (30 cm thickness) and sand (40 cm thickness), in which EPS was laid under the sand. Specifications and material parameters of test shed components were shown in Table 1 [12]. The bottom of the steel column with a height of 0.7 m was fixed on the ground, and the top of the steel column was welded with a steel plate. The steel plate was connected with the lower flange of the main girder by bolts, the secondary beam was welded with the main girder, and the main girder was connected with the steel roof slab by welding. The absorbing material was replaced after each impact test. The impactor was a concrete polyhedral block [28]. The axial strain of the main girder and the secondary beam was measured to reflect the dynamic response of the shed under the impactor impact. As shown in Figure 4, the strain gauges 1 and 2 were attached to the lower flange of the main girder, 0.09 m and 0.17 m away from the center of the shed, respectively [12].
In the experiment, the impact test was conducted in accordance with the European code [28]. The impactor was a concrete polyhedral block with a mass of 0.25 t confined by steel plates, and the impact position of the impactor was the center position of the roof slab of the shed [12]. Through the gantry crane, the impactor was raised to the heights of 3 m (7.5 kJ impact energy), 6 m (15 kJ impact energy), and 8 m (20 kJ impact energy), respectively. A high-speed camera was placed right ahead of the test model to record the process of impacting with a frequency of 500 Hz. Through a dynamic acquisition system, the time-strain curves of beams were measured to obtain the dynamic response, with the acquisition frequency of 1000 Hz [12].

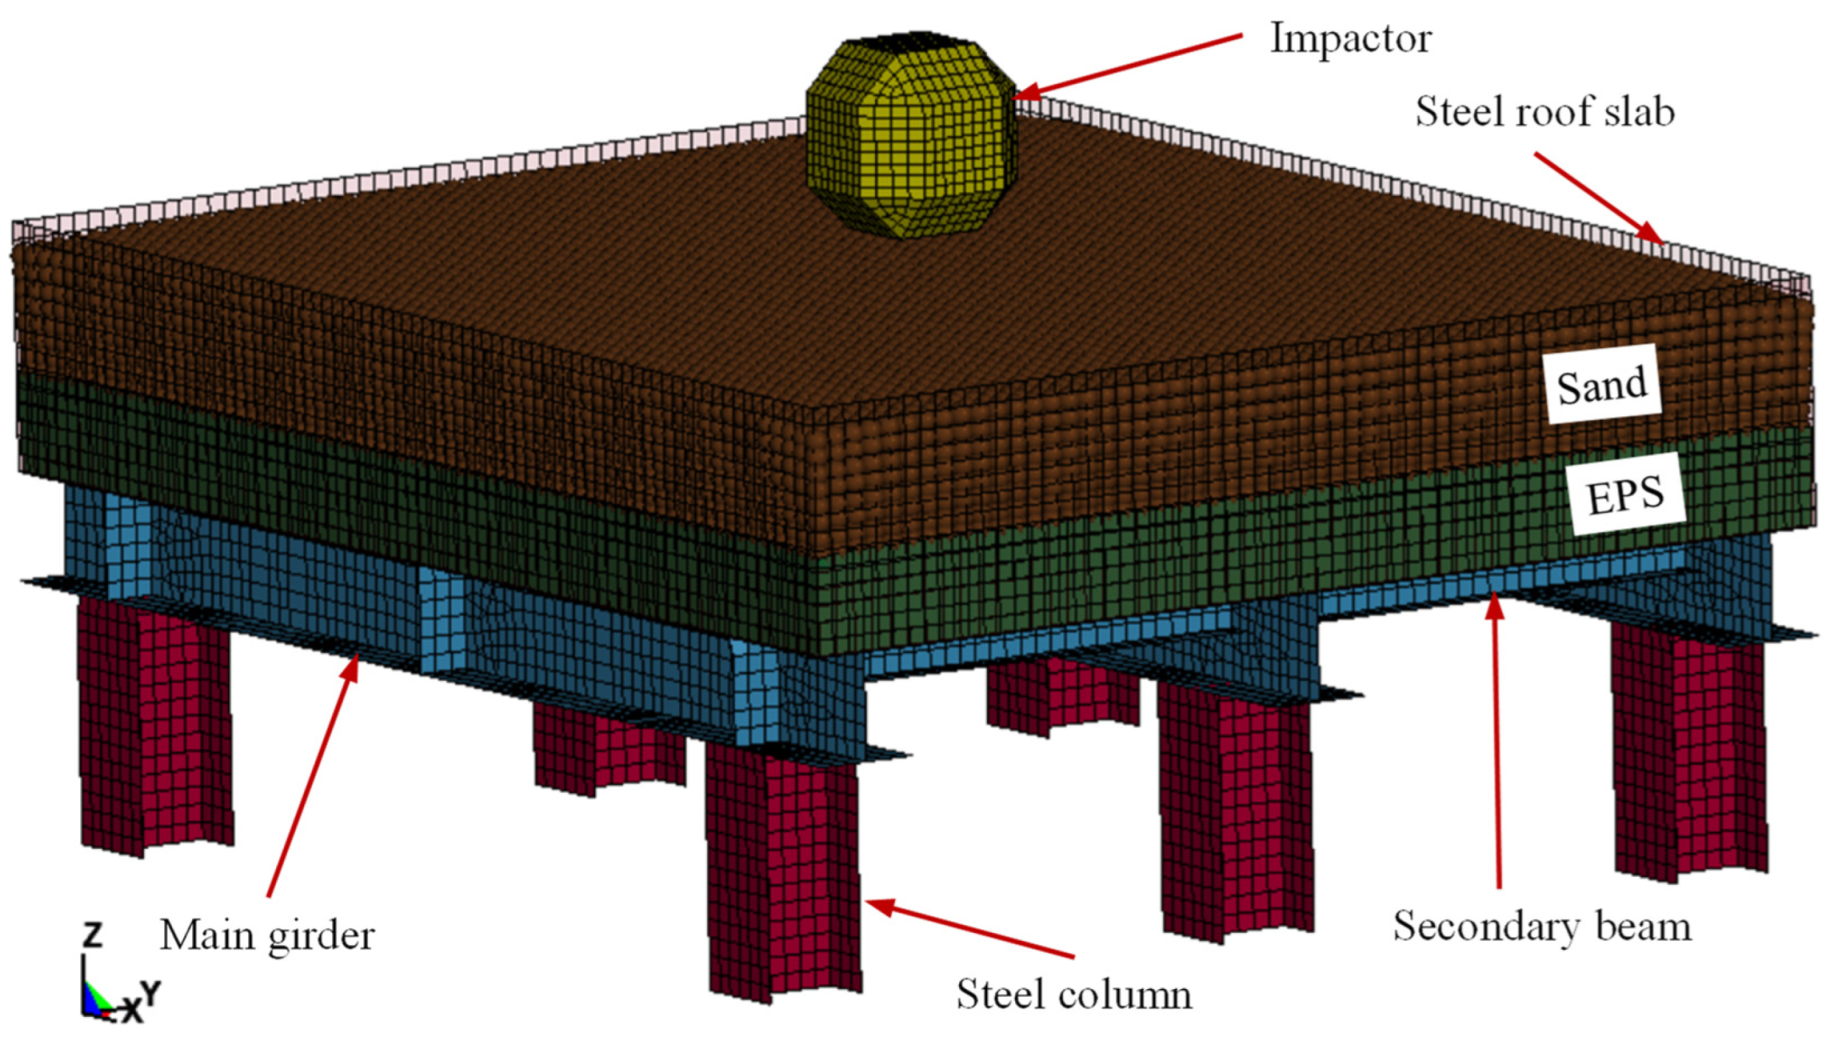
3.2. Numerical Model

3.2.1. Numerical Model Description

The calculation model is shown in Figure 5. The steel column, main girder, secondary beam, and steel roof slab adopted shell elements with the complete integration of three/four nodes, and the mesh size is 0.05 m. The EPS and impactor adopted solid elements with the complete integration of six nodes, and the mesh sizes are 0.06 m and 0.04 m, respectively. Due to the direct impact of the impactor, the sand cushion will experience a large deformation, which can easily cause mesh distortion and lead to the instability of the calculation [20,27]. Therefore, SPH simulation is adopted for sand, and the spacing between the adjacent SPH particles is about 0.05 m.

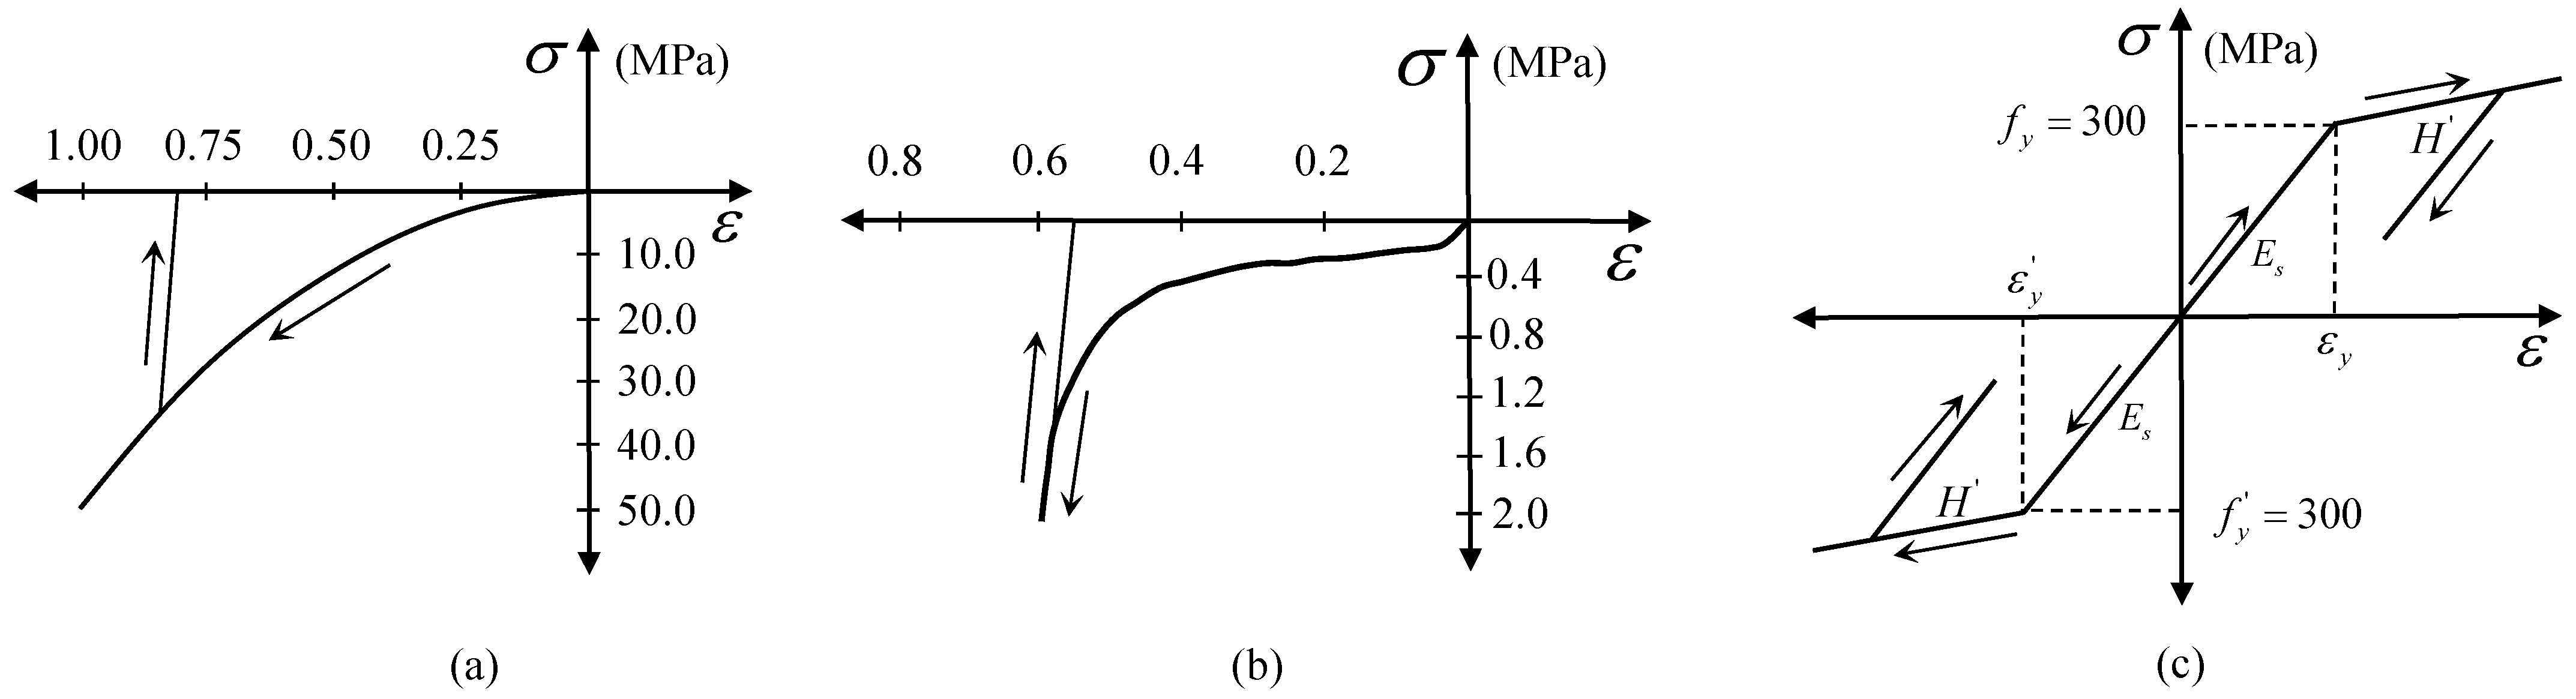
3.2.2. Constitutive Material Models

The properties of materials are shown in Table 2. Figure 6 shows the stress–strain relations for sand, EPS, and steel material. The constitutive models are briefly outlined below.
Sand cushion. Figure 6a shows the constitutive model for the sand. The stress–strain relationship is described in the following expression [1]:
σ s a n d = 50 ε s a n d 2
where σsand is the stress and εsand is the volumetric strain. LS-DYNA material model MAT_CRUSHABLE_FOAM is used, which has a good simulation effect [1,20].
EPS. As shown in Figure 6b, under a uniaxial compression test, the EPS material will experience three stages: the linear elasticity stage, the yield stage characterized by platform stress, and the compaction stage where stress rapidly increases with strain [29]. MAT_CRUSHABLE_FOAM was also selected as the calculation model to simulate the mechanical properties of the EPS material during the impact process [29].
Steel. As shown in Figure 6c, for the steel column, main girder, secondary beam, and steel roof slab, an elastoplastic model is used, and the plastic hardening modulus H’ is set to 1% of elastic modulus Es [1,20].
Impactor. A rigid material model (*MAT_RIGID in LS-DYNA) can be used to simulate some small deformation structures that do not require excessive attention, which can reduce computer time [27].

3.2.3. Boundary Conditions

The bottom of the steel column is constrained by three translational degrees of freedom [12]. The steel roof slab and main girder/secondary beam, steel column, and main girder are restricted by welding (Contact_Spotweld in LS-DYNA) [12]. Erosion contact is defined between the impactor and sand SPH particles (Contact_Eroding_Nodes_To_Surface in LS-DYNA), and the friction coefficient is set at 0.4 [30]. The interface between EPS and sand SPH particles is defined as the node-to-surface contact (Contact_Automatic_Nodes_To_Surface in LS-DYNA), and the friction coefficient is set as 0.4 [30]. The EPS finite element and the steel roof slab element adopt surface-to-surface contact (Contact_Automatic_Surface_To_Surface in LS-DYNA), and the friction coefficient is set at 0.3 [12].
Before the impact, gravity is applied to the entire shed structure [20]. The impact case with an impact height of 8 m is simulated. The impact time is defined as 200 ms when the impactor starts timing when it comes into contact with the sand [24]. During the impact process, the automatic time step is used. It means that the program automatically calculates the limit value of the time step. In addition, a viscous damping constant of 0.005 is considered, which is used for the lowest natural vibration mode [1].
The simulations are conducted on a 64-bit assembled Desktop with an Intel Core i7-10700K 2.9 GHz processor and 8 GB of Kingston DDR4 RAM (random access memory) bank. Run time refers to the real-world time, which is calculated from the onset of analysis to its end. In this numerical model, the run time is about 3 h.

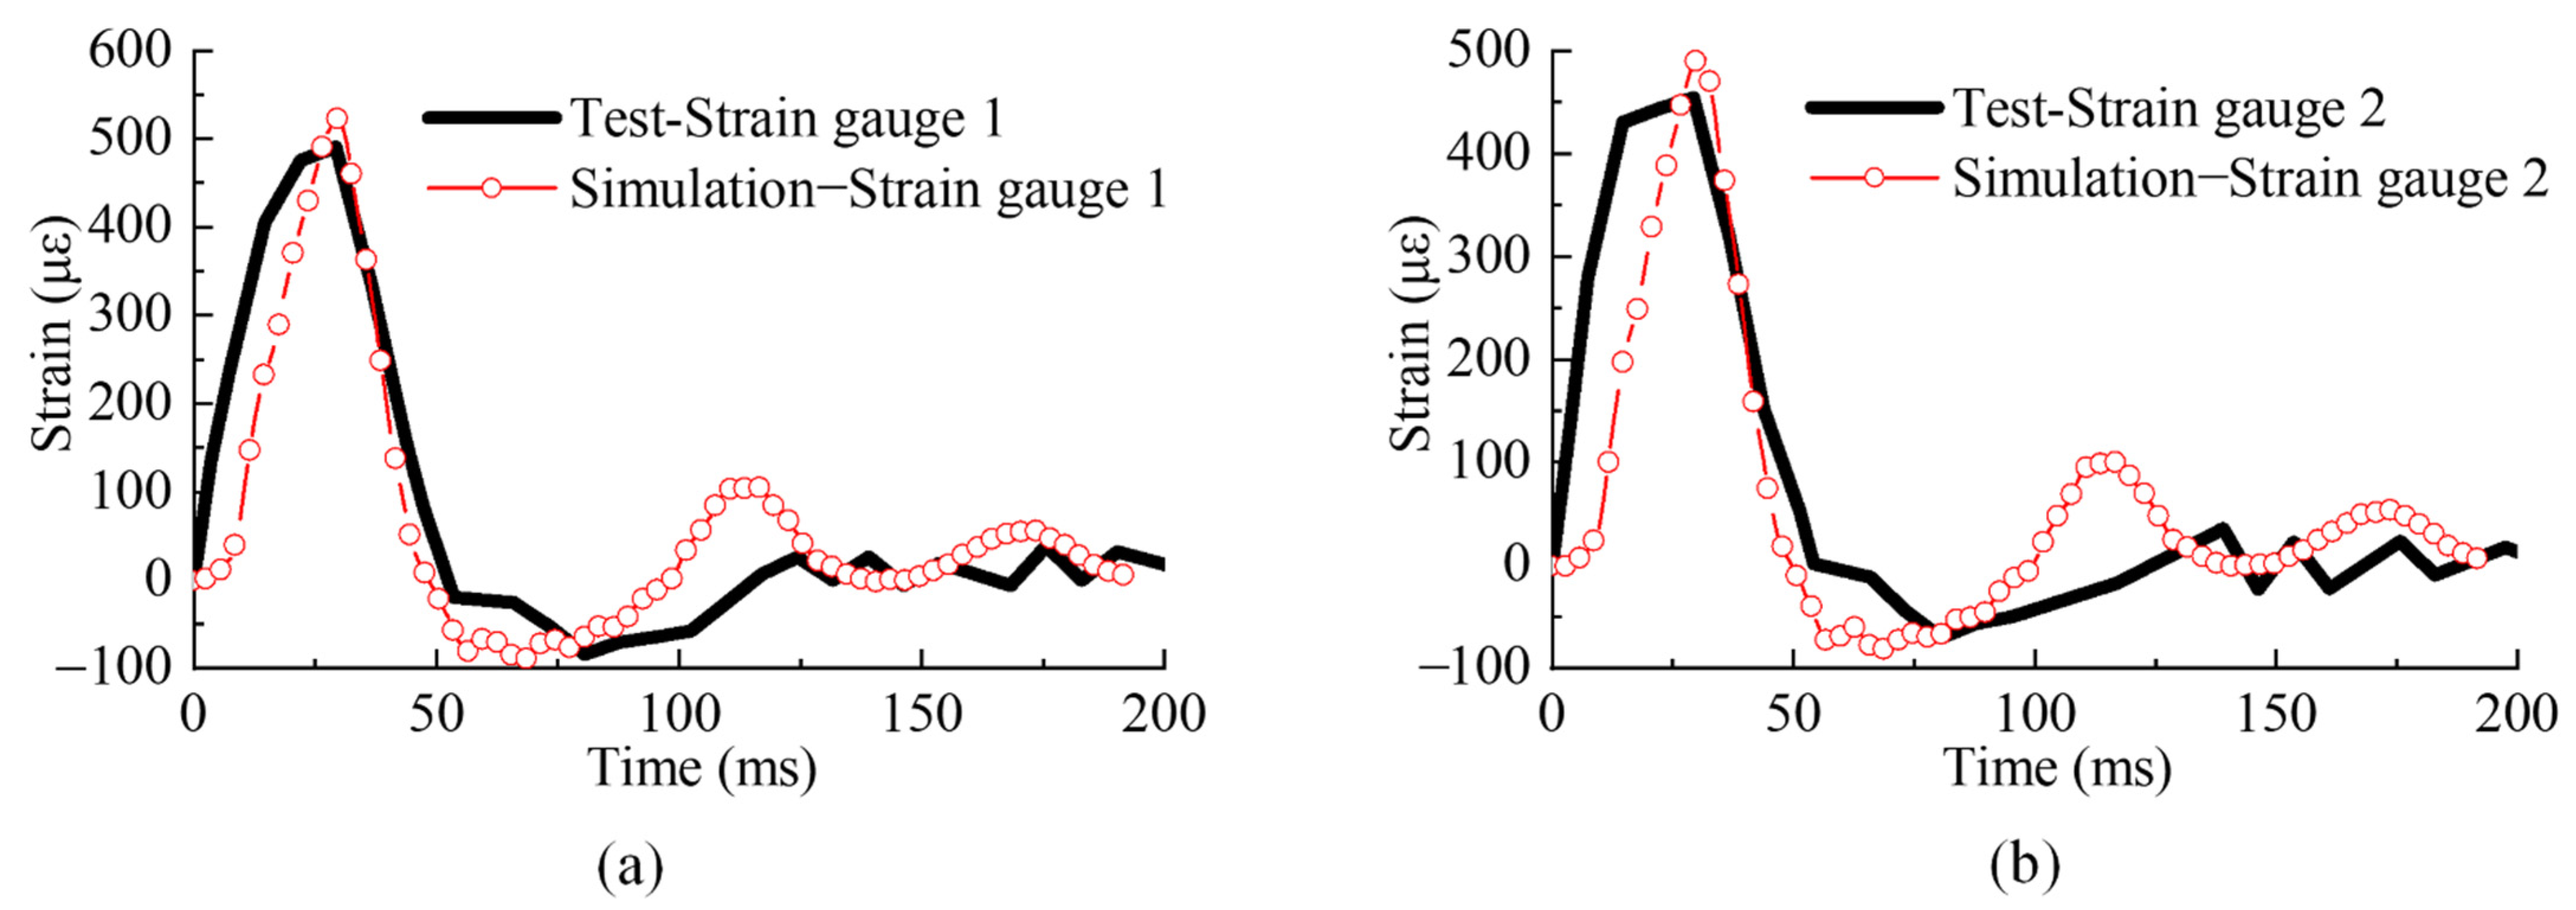
3.3. Verification of Accuracy of Numerical Analysis

The numerical analysis results for time histories of strain at the main girder and secondary beam are compared with the steel shed test. From Figure 7, the waveforms of the test curve and simulation curve are very similar. The maximum strain of the lower flange of the main girder is only 520 με, indicating that the main girder is still in the elastic stage (the elastic limit strain is 1500 με), and it still has a large residual bearing capacity. Near the impact point of the impactor, the maximum strain of the main girder is much greater than that of the secondary beam.
A more detailed comparison is shown in Table 3. It can be seen from Table 3 that the maximum error of the maximum strain in the numerical simulation and test is only 9.0%, and the maximum error of the minimum strain is 12.2%. In this study, the time frame between the 1st strain being 0 and the 2nd strain being 0 is denoted as a wave crest propagation period. It can be seen from the table that the maximum error of the wave crest propagation period of the numerical simulation and test is only −8.3%. The six groups of key data are compared, of which the error of only one group is greater than 10%, but less than 13%.
The final penetration of the impactor into the sand cushion is shown in Figure 8. The penetration depth in the experiment is 0.16 m [12], while that in the simulation is 0.17 m. The error of the penetration depth between the experiment and the simulation is 6.25%.
Through the above comparison, the numerical model can be used for subsequent dynamic analysis.

4. Numerical Simulation of Steel Shed under Block Impact

Based on the above-validated simulation model, extensive numerical simulations are performed to investigate the dynamic response of steel sheds considering the effects of the different combined absorbing systems. The impact process, mid-span displacements of the steel shed, and the energy dissipation mechanism are summarized and discussed.

4.1. Computational Cases

Based on the statistical results [20], the average impact velocity of 90% of falling rockfalls is 25 m/s. Therefore, the impact velocity of the rockfall is set as 25 m/s. The mass of the rockfall is set to 0.75 t in the design energy level (elastic limit). It is stipulated that the thickness of the backfill soil laid on the roof plate of the shed should not be less than 1.5 m [30], so the thickness of the two-layered absorbing system in the model is set as 1.5 m. The thickness of EPS is set as 0% (P1), 20% (P2), 40% (P3), 60% (P4), 80% (P5), and 100% (P6) of the total thickness of the two-layered absorbing system, respectively.

4.2. Results and Discussion

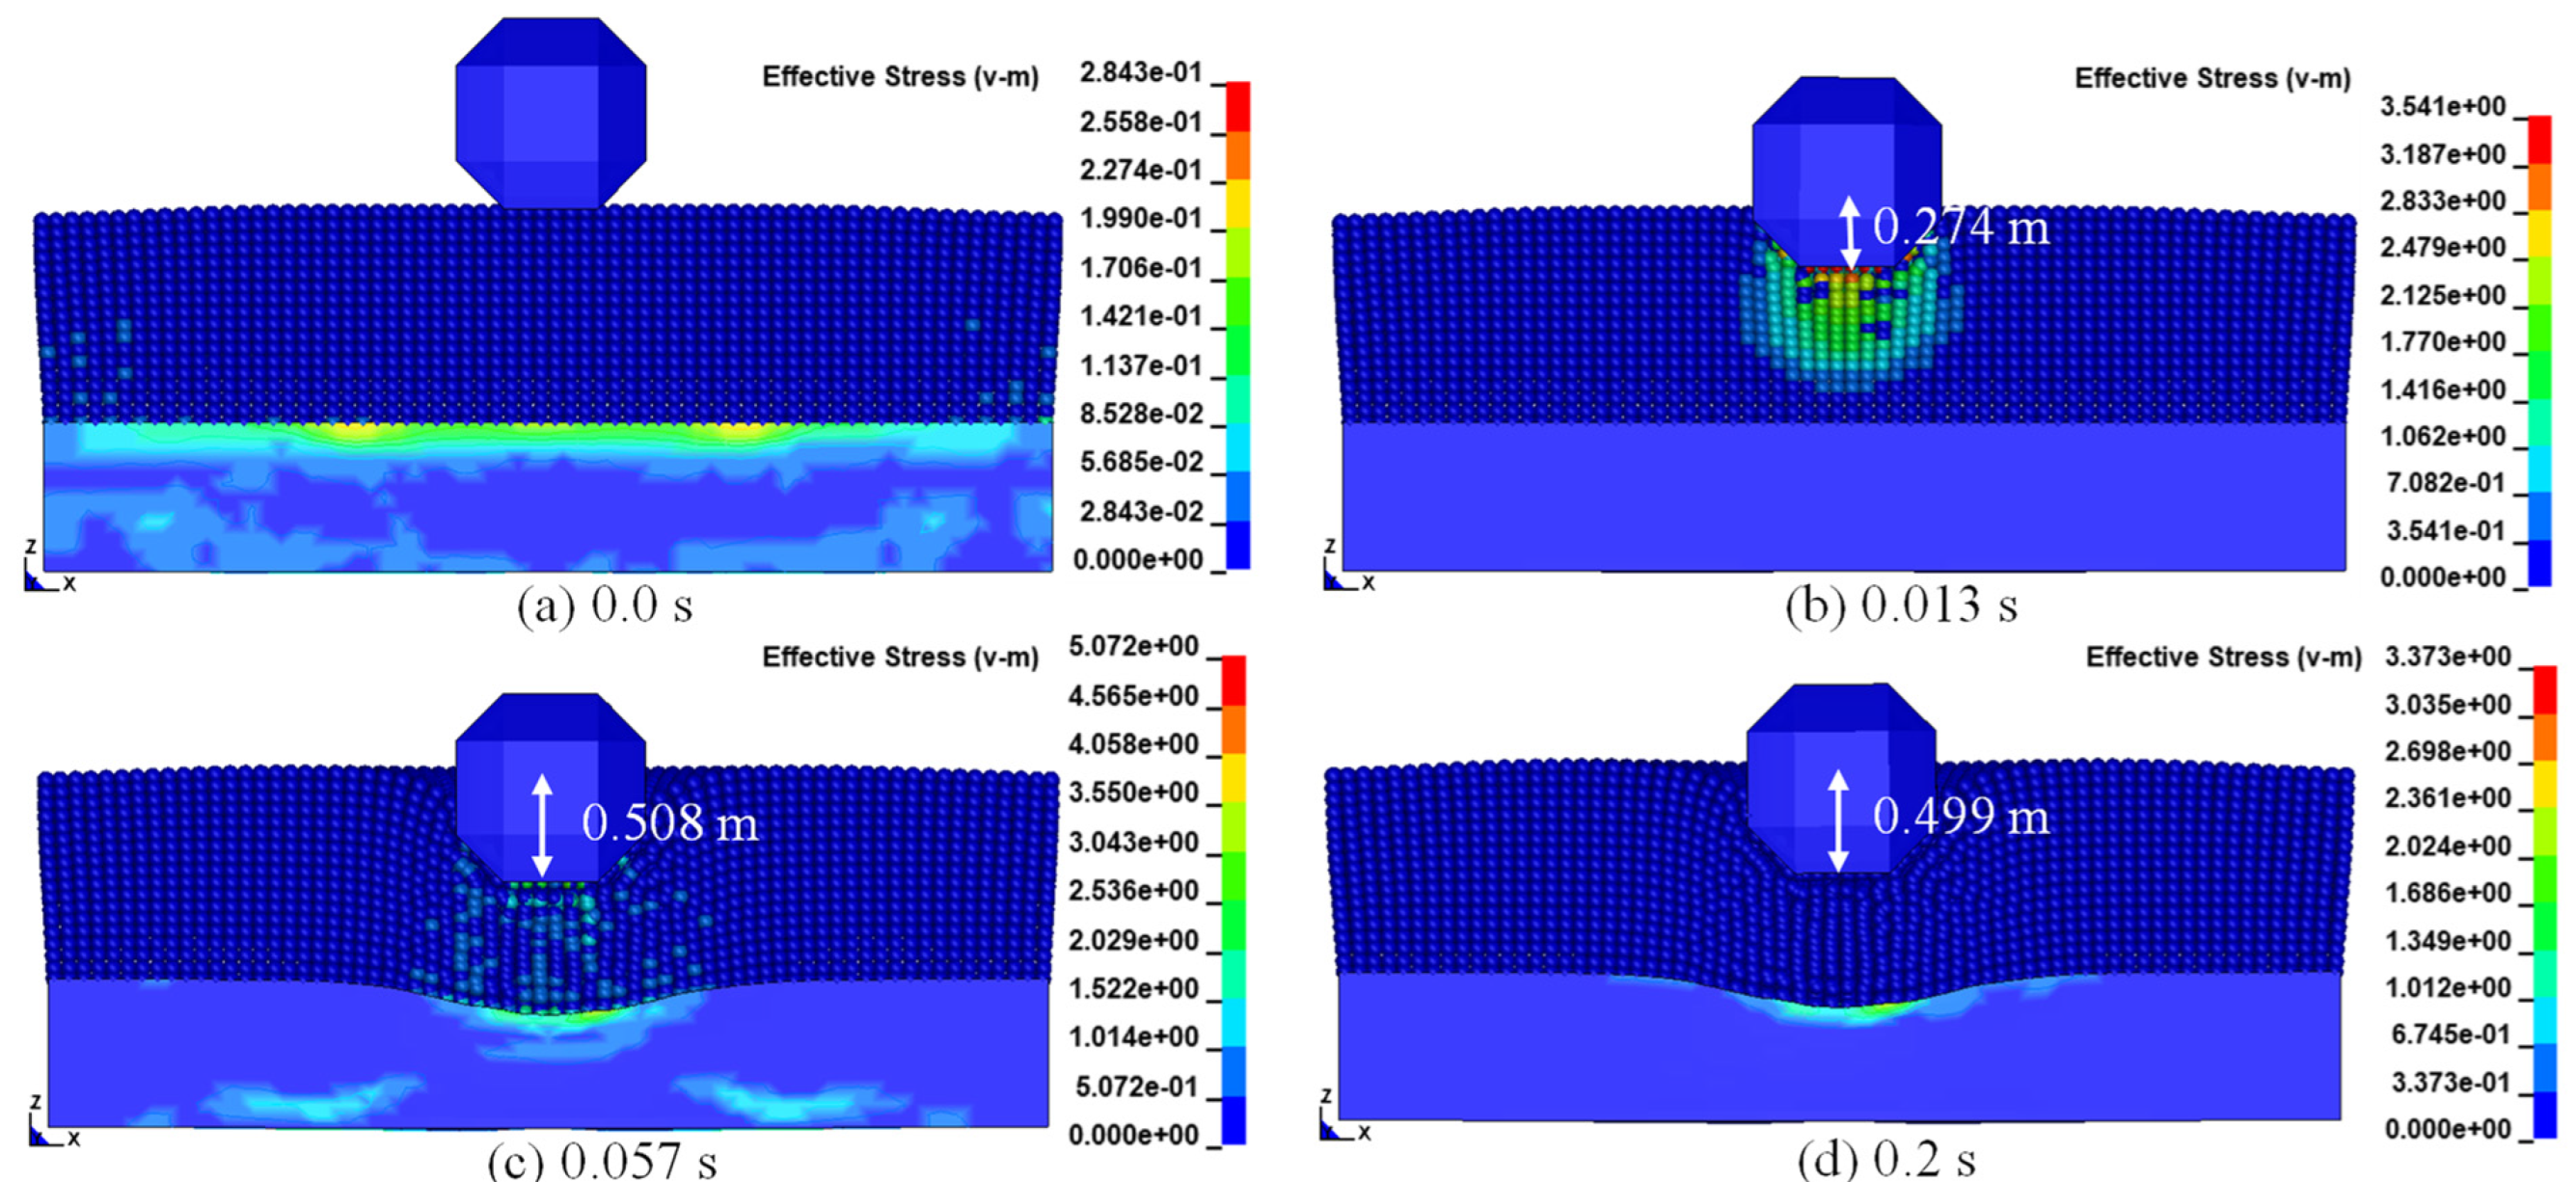
4.2.1. Impact Process

Figure 9 illustrates the dynamic impact process of a 0.75 t impactor (EPS thickness = 40% of the total thickness of the buffer layer). As shown in Figure 9a, when t = 0.0 s, the impactor begins to invade the sand cushion. As shown in Figure 9b, when t = 0.013 s, it can be observed that the stress wave propagates radially downward from the impact point in the sand cushion. As shown in Figure 9c, when t = 0.057 s, the vertical displacement of the impactor reaches a maximum value of 0.508 m. During the transmission of the stress wave, the elastic modulus of the material changes from large to small in the propagation medium, and the maximum stress is located in the contact zone between the EPS and the sand cushion, with a value of 5.07 MPa. As shown in Figure 9d, when t = 0.2 s, the impact process of the block tends to be static, and the vertical block displacement is 0.499 m. Finally, a bowl-shaped pit forms in the sand layer. Due to the distributed stress acting on the EPS cushion, a small sag deformation appears in the EPS cushion.

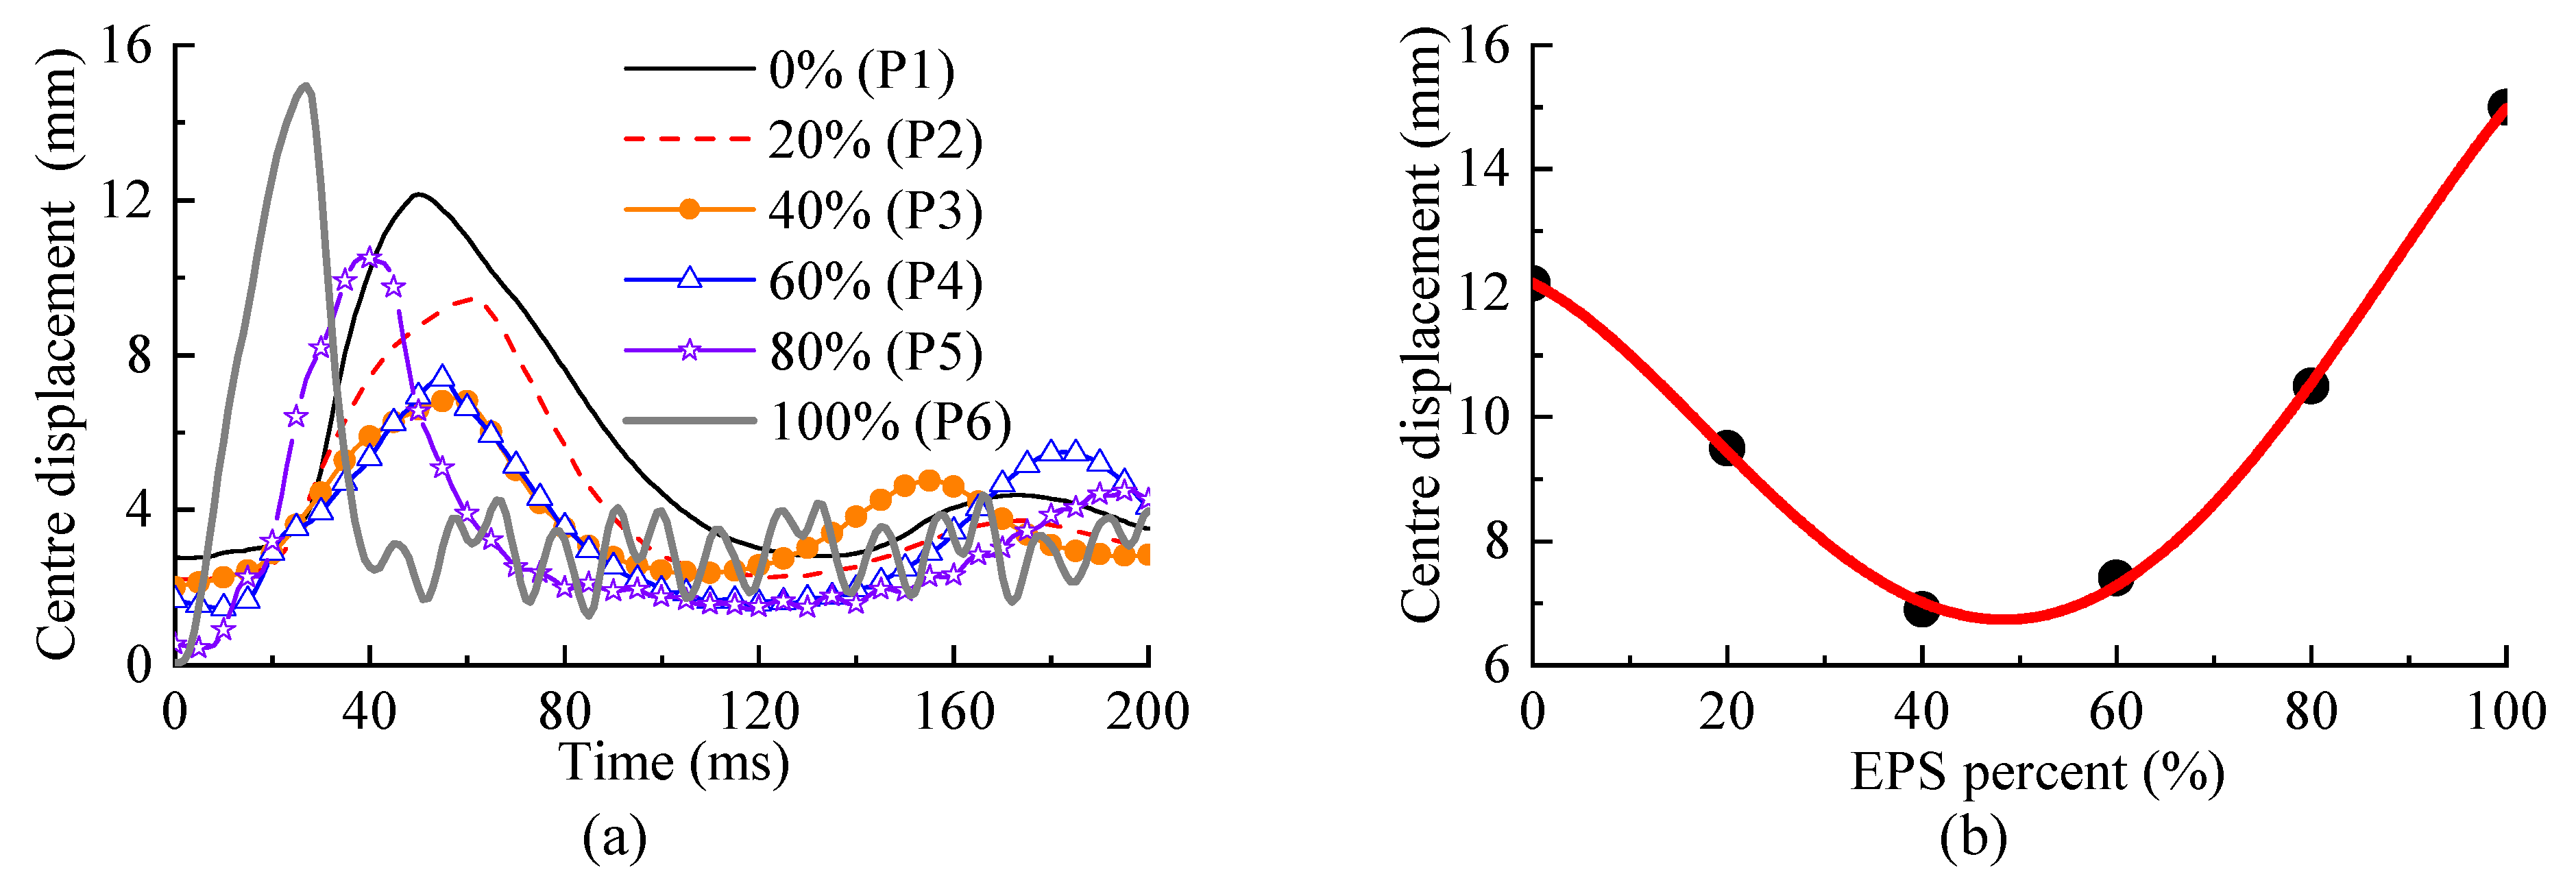
4.2.2. Center Displacement of Main Girder

Figure 10 shows the center displacement of the main girder of the steel shed. The center displacement of the main girder is mainly generated by two parts, one is the deadweight of the buffer layer, and the other is the impact force. As shown in Figure 10a, when t = 0, the center displacement of the main girder is not 0, which is mainly caused by the dead weight of the buffer layer. With the increase of time, the center displacement of the main girder in each case increases first and then decreases.
As shown in Figure 10b, with the increase in EPS thickness, the center displacement of the main girder first decreases and then increases, and when EPS thickness is 40% of the buffer layer thickness, the center displacement of main girder reaches the minimum (6.9 mm). Compared with the single sand cushion, the combined cushion with an EPS thickness of 0.6 m reduces the structural displacement response by 43%. The larger the thickness of the sand cushion is, the smaller the impact force will be, but the corresponding dead weight of the cushion will also increase. When the thickness of the sand cushion is 60% of the buffer layer, the adverse impact reaction to the structure will be minimized.

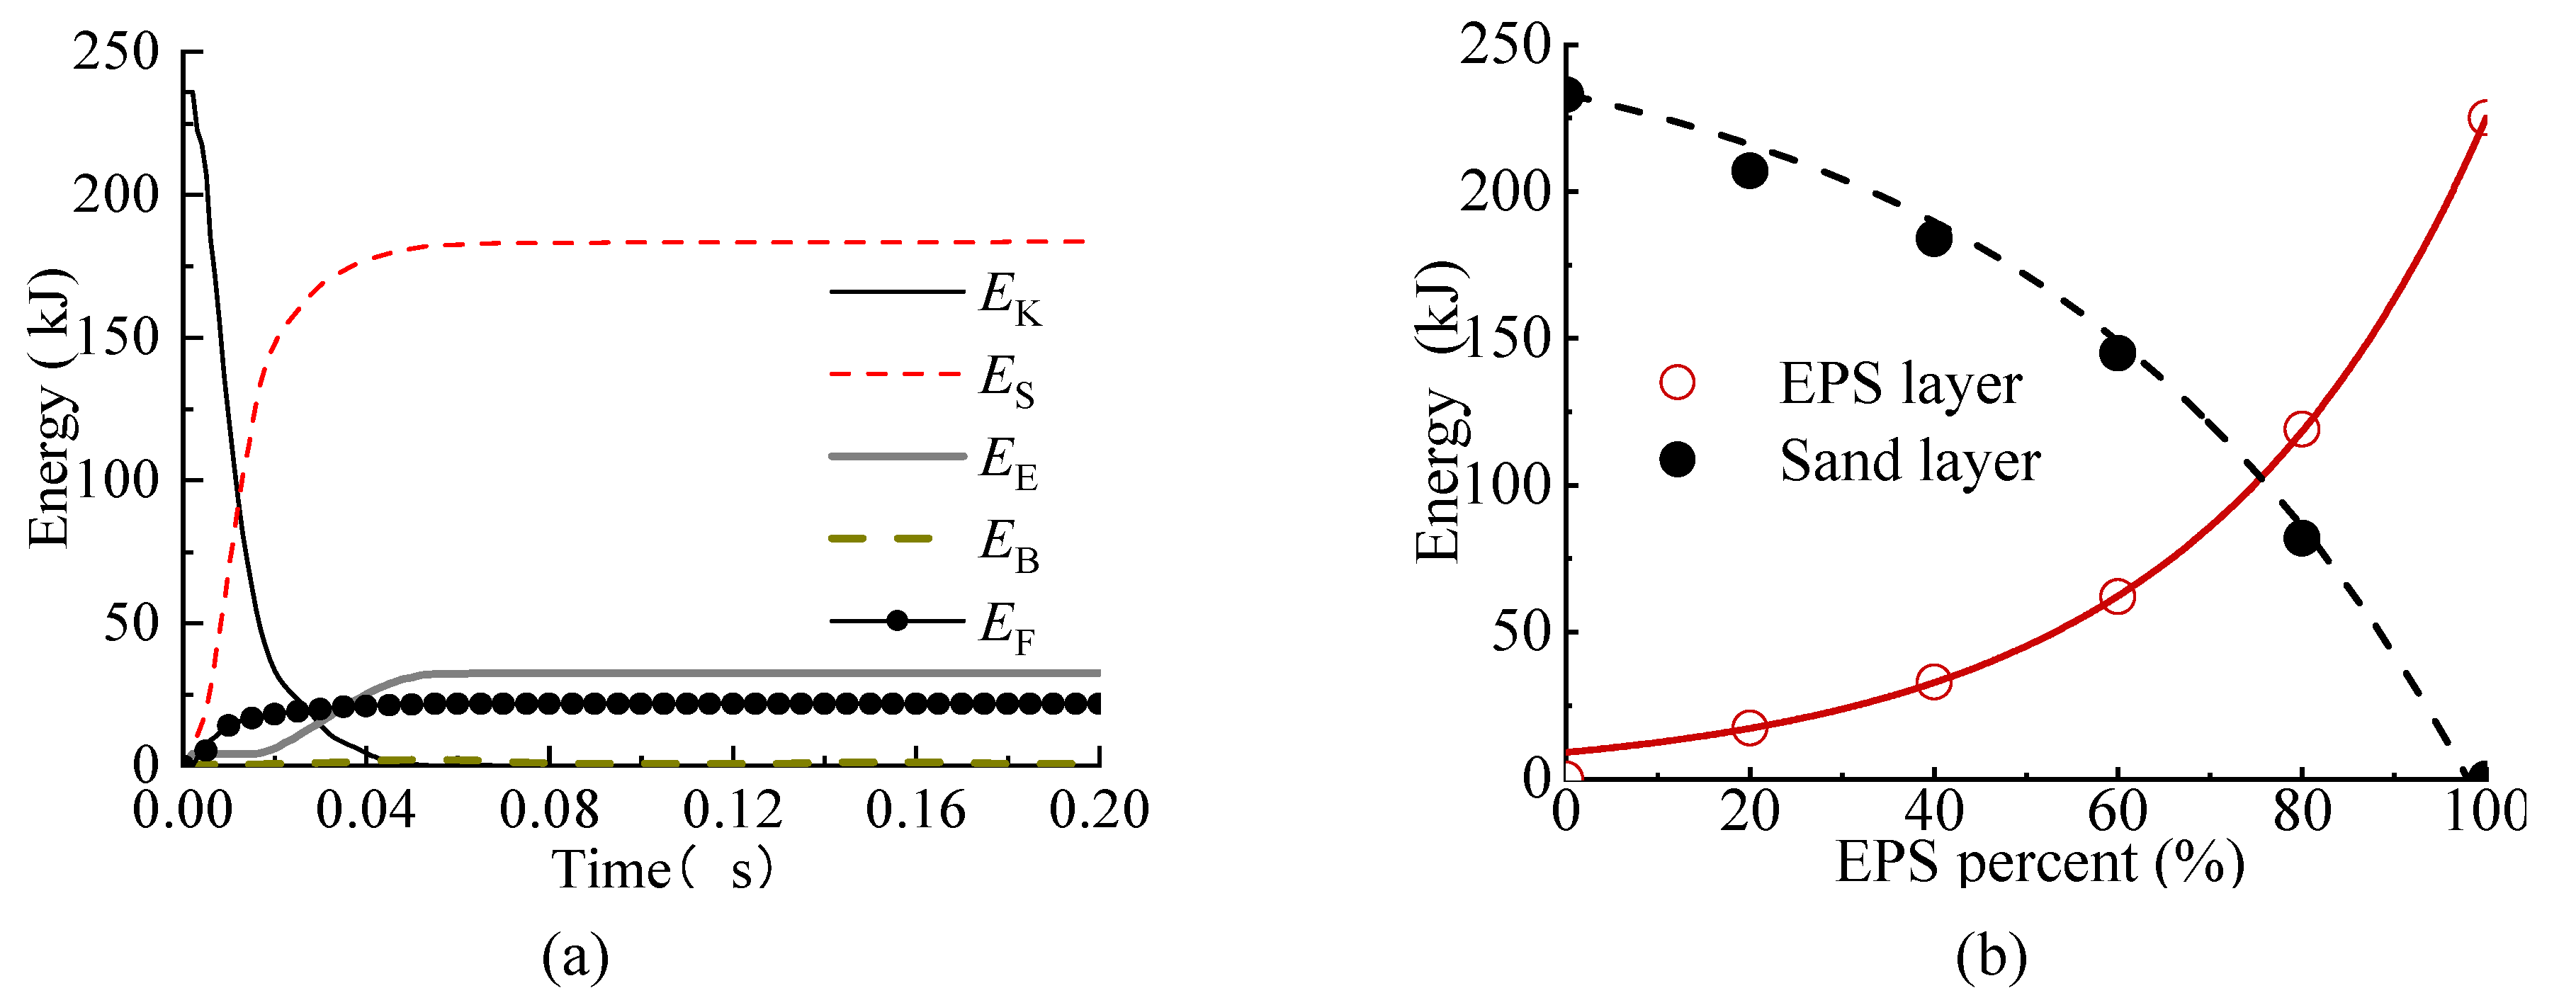
4.2.3. Steel Shed Energy Dissipation

Upon impact, the total energy (ET) of the block is mainly converted into residual block kinetic energy (EK), the internal energy of the EPS layer (EE), the internal energy of the sand layer (ES), the internal energy of the steel components (EB), and the friction energy (EF). The total energy (ET) is defined as:
E T = E 0 + M 0 g h 0
where M0 is the mass of the block, h0 is the final vertical displacement of the block, and E0 is the initial kinetic energy of the block.
Take a P3 case as an example (EPS thickness = 40% of the total thickness of the buffer layer). The evolution of all of the energy components is shown in Figure 11a. Upon impact, EK decreases rapidly, and the sand cushion dissipates a large part of the EK, accounting for about 76.3% of the EK. The EPS layer also dissipates about 13.7% of the EK. There is almost no dissipative impact energy in the steel components. The two-layered buffer layer consumes 90% of the total energy. In addition, according to statistics, the percentage of two-layered buffer layer energy consumption in total energy under six cases is 91.4% (P1), 90.1% (P2), 90% (P3), 88.8% (P4), 88.5% (P5), and 88.2% (P6) respectively, which indicates that the two-layered buffer layer is very effective in protecting the steel shed structure.
Figure 11b also shows the effect of the EPS thickness on the energy consumption of the two-layered absorbing system. With the increase of EPS thickness, the energy consumption of the EPS layer increases, and the rate of the increase of energy consumption increases as the EPS thickness increases. In addition, it can be seen that the energy dissipation effect of the sand buffer layer is better than that of the EPS buffer layer with the same thickness, and the key role of EPS is to reduce dead weight.
The coefficient of restitution (COR) is also an indicator of the material energy dissipation capacity [8]. The COR is calculated from the impact and rebound velocities using COR = Vi/Vre, where Vi is the impact velocity of the falling rock at the moment of contact with the cushion, and Vre is the rebound velocity [8]. Table 4 shows COR in some cases. As can be seen from Table 4, the simulation in this study is consistent with the test, and the maximum error between the simulation and the test is 5%. The energy dissipation capacity of the pure EPS foam layer is the worst, while the energy dissipation capacity of the pure soil layer is the strongest.

5. Conclusions

This paper aimed to quantitatively find the optimal thickness combination between EPS and soil layer under dynamic loadings. In order to solve the difficulty of the super large deformation of the two-layered absorbing system with the finite element method, the coupled Smooth Particle Hydrodynamic method (SPH) and the Finite Element Method (FEM) are introduced. SPH particles were used to simulate the soil layer which experienced a super large deformation. A numerical model for a steel shed impacted by a block was established and validated. The conclusions are drawn as follows:
The stress wave propagates radially downward into the cushion layer and then the steel structure during the block impact. With the increase of EPS thickness, the center displacement of the main girder first decreases and then increases, and when EPS thickness is 40% of the buffer layer thickness, the center displacement of the main girder reaches the minimum. Compared with the single sand cushion, the combined cushion with an EPS thickness of 0.6 m reduces the structural displacement response by 43%.
The two-layered buffer layer consumes about 90% of the total energy, which indicates that the two-layered buffer layer is very effective in protecting the steel shed. The energy dissipation effect of the sand buffer layer is better than that of the EPS buffer layer with the same thickness, and the key role of EPS is to reduce dead weight.
In engineering design, the optimal combination of more different buffer layers can be investigated and simulated.

Author Contributions

Conceptualization, C.L. and H.L.; methodology, C.L.; software, C.L.; validation, C.L., and H.L.; formal analysis, C.L.; investigation, C.L.; resources, C.L.; data curation, C.L.; writing—original draft preparation, H.L.; writing—review and editing, C.L.; visualization, C.L.; supervision, C.L.; project administration, C.L.; funding acquisition, C.L. All authors have read and agreed to the published version of the manuscript.

Funding

This research was supported by the China Postdoctoral Science Foundation under Grant No. 2021M690742.

Institutional Review Board Statement

Not applicable.

Informed Consent Statement

Not applicable.

Data Availability Statement

Publicly available datasets were analyzed in this study.

Conflicts of Interest

The authors declare there are no competing interests.

References

  1. Bhatti, A.Q.; Khatoon, S.; Mehmood, A.; Dastgir, A.; Kishi, N. Numerical study for impact resistant design of full scale arch type reinforced concrete structures under falling weight impact test. J. Vib. Control 2011, 18, 1275–1283. [Google Scholar] [CrossRef]
  2. Ferrari, F.; Giacomini, A.; Thoeni, K. Qualitative rockfall hazard assessment: A comprehensive review of current practices. Rock Mech. Rock. Eng. 2016, 49, 2865–2922. [Google Scholar] [CrossRef]
  3. Kawahara, S.; Muro, T. Effects of dry density and thickness of sandy soil on impact response due to rockfall. J. Terramech. 2006, 43, 329–340. [Google Scholar] [CrossRef]
  4. Mommessin, M.; Perrotin, P.; Ma, Y. Actions of snow avalanches on a protection gallery. Cold Reg. Sci. Technol. 2012, 83, 20–29. [Google Scholar] [CrossRef]
  5. Kishi, N.; Konno, H. Numerical analysis model for three layer absorbing system under falling weight impact loading. JSCE J. Struct. Eng. 2003, 49, 1323–1332. [Google Scholar]
  6. Ouyang, C.; Liu, Y.; Wang, D.; He, S. Dynamic Analysis of Rockfall Impacts on Geogrid Reinforced Soil and EPS Absorption Cushions. KSCE J. Civ. Eng. 2019, 23, 37–45. [Google Scholar] [CrossRef]
  7. Zhong, H.; Lyu, L.; Yu, Z.; Liu, C. Study on mechanical behavior of rockfall impacts on a shed slab based on experiment and SPH–FEM coupled method. Structures 2021, 33, 1283–1298. [Google Scholar] [CrossRef]
  8. Yan, S.; Wang, Y.; Wang, D.; He, S. Application of EPS geofoam in rockfall galleries: Insights from large-scale experiments and FDEM simulations. Geotext. Geomembr. 2022, 50, 677–693. [Google Scholar] [CrossRef]
  9. Wu, Y.; He, S.M.; Li, X.P.; Wang, D.P. Dynamic response and optimization of an inclined steel rock shed by the graded energy dissipating method. J. Mt. Sci. 2019, 16, 141–155. [Google Scholar] [CrossRef]
  10. Schellenberg, K.; Volkwein, A.; Roth, A.; Vogel, T. Rockfall-falling weight tests on galleries with special cushion layers. In Proceedings of the 3rd International Conference on Protection of Structures Against Hazards, Venice, Italy, 28–29 September 2006. [Google Scholar]
  11. Calvetti, F. Rockfall shelters covered by granular layers: Experiments and design approach. Eur. J. Environ. Civ. Eng. 2011, 15, 73–100. [Google Scholar] [CrossRef]
  12. Wu, J.N. Seismic Vulnerability Analysis for Bridge Network and Algorithm Improvement; Southwest Jiaotong University: Chengdu, China, 2018. (In Chinese) [Google Scholar]
  13. Ministry of Transport of the People’s Republic of China. Specifications for Design of Highway Subgrades, (JTJ013-95); Ministry of Transport of the People’s Republic of China: Beijing, China, 2015. (In Chinese)
  14. Labiouse, V.; Descoeudres, F.; Montani, S. Experimental study of rock sheds impacted by rock blocks. Struct. Eng. Int. 1996, 6, 171–176. [Google Scholar] [CrossRef]
  15. Japan Road Association. Manual for Anti-Impact Structures Against Falling Rocks; Japan Road Association: Tokyo, Japan, 2000. [Google Scholar]
  16. He, S.; Liu, W.; Li, X. Prediction of impact force of debris flows based on distribution and size of particles. Environ. Earth Sci. 2016, 75, 298. [Google Scholar] [CrossRef]
  17. Yu, B.; Yi, W.; Zhao, H. Experimental study on the maximum impact force by rock fall. Landslides 2018, 15, 233–242. [Google Scholar] [CrossRef]
  18. Zhang, L.; Lambert, S.; Nicot, F. Discrete dynamic modelling of the mechanical behaviour of a granular soil. Int. J. Impact Eng. 2017, 103, 76–89. [Google Scholar] [CrossRef]
  19. Shen, W.; Zhao, T.; Dai, F.; Jiang, M.; Zhou, G.G. DEM analyses of rock block shape effect on the response of rockfall impact against a soil buffering layer. Eng. Geol. 2019, 249, 60–70. [Google Scholar] [CrossRef]
  20. Liu, C.; Phuong, N.; Zhao, S.C. Dynamic response of RC sheds against the impact of rock block with different shapes and angles. Can. J. Civ. Eng. 2022, 49. [Google Scholar] [CrossRef]
  21. Bui, H.H.; Fukagawa, R.; Sako, K.; Ohno, S. Lagrangian meshfree particles method (SPH) for large deformation and failure flows of geomaterial using elastic–plastic soil constitutive model. Int. J. Numer. Anal. Methods Geomech. 2008, 32, 1537–1570. [Google Scholar] [CrossRef]
  22. Liang, S.; Chen, Z. SPH-FEM coupled simulation of SSI for conducting seismic analysis on a rectangular underground structure. Bull. Earthq. Eng. 2019, 17, 159–180. [Google Scholar] [CrossRef]
  23. Lucy, L.B. A numerical approach to the testing of fusion processes. Astron. J. 1977, 82, 1013–1024. [Google Scholar] [CrossRef]
  24. Hallquist, J.O. LS-DYNA Theory Manual; Livermore Software Technology Corporation (LSTC): Livermore, CA, USA, 2017. [Google Scholar]
  25. Xu, J.X.; Wang, J. Interaction methods for the SPH parts (multiphase flows, solid bodies) in LS-DYNA®. In Proceedings of the 13th International LS-DYNA Users Conference, Detroit, MI, USA, 8–10 June 2014; pp. 1–12. [Google Scholar]
  26. Feng, S.J.; Gao, H.Y.; Gao, L.; Zhang, L.M.; Chen, H.X. Numerical modeling of interactions between a flow slide and buildings considering the destruction process. Landslides 2019, 16, 1903–1919. [Google Scholar] [CrossRef]
  27. Liu, C.; Yu, Z.X.; Zhao, S.C. A coupled SPH-DEM-FEM model for fluid-particle-structure interaction and a case study of Wenjia gully debris flow impact estimation. Landslides 2021, 18, 2403–2425. [Google Scholar] [CrossRef]
  28. EOTA. ETAG 027–Guideline for the European Technical Approval of Falling Rock Protection Kits; Tech. Rep.; European Organization for Technical Approvals: Brussels, Belgium, 2008. [Google Scholar]
  29. Wang, Z.L.; Zhu, B. Experimental Study on impact compression and energy absorbing property of expanded polystyrene foam. J. Build. Mater. 2013, 16, 630–636. (In Chinese) [Google Scholar]
  30. Li, L.P. Research on Energy Dissipative Mechanism of Cushion Material on Shed under Rockfall Impact; Sichuan University: Chengdu, China, 2015. (In Chinese) [Google Scholar]
Figure 3. Test model of steel shed structure.
Sustainability 14 13680 g003
Figure 4. Bottom view of the steel shed and arrangement of the strain measuring points.
Sustainability 14 13680 g004
Figure 5. Numerical model of steel shed structure.
Sustainability 14 13680 g005
Figure 6. Constitutive model curve of material: (a) sand; (b) EPS; (c) steel.
Sustainability 14 13680 g006
Figure 7. Comparison of the strain time history: (a) strain gauge 1; (b) strain gauge 2.
Sustainability 14 13680 g007
Figure 8. The final penetration of the impactor into the sand cushion.
Sustainability 14 13680 g008
Figure 9. Dynamic impact process of a 0.75 t impactor (EPS thickness = 40% of the total thickness of the buffer layer) (stress unit: MPa): (a) t = 0.0 s; (b) t = 0.013 s; (c) t = 0.057 s; (d) t = 0.2 s.
Sustainability 14 13680 g009
Figure 10. Center displacement of main girder of steel shed: (a) center displacement time history; (b) maximum center displacement under each case.
Sustainability 14 13680 g010
Figure 11. Evolution of the energy of steel shed: (a) evolution of the energy of P3 case (EPS thickness = 40% of the total thickness of the buffer layer); (b) energy consumption of the buffer layer.
Sustainability 14 13680 g011
Table 1. Main component specifications.
Component NameSpecificationsMaterials
Steel columnHW300 × 300 × 20 × 20Q345
Main girderHW300 × 300 × 6 × 6Q345
Secondary beamHW150 × 150 × 6 × 6Q345
Steel roof slab6 mm thicknessQ345
Two-layered absorbing system30 cm thickness EPS + 40 cm thickness sandEPS + Sand
ImpactorStandardized test blockConcrete + Cladding steel plates
Table 2. Material parameters for simulation.
MaterialDensity (kg/m3)Elasticity Modulus (Pa)Poisson RatioReference
Sand200010.0 × 1090.060[1]
EPS220.0069 × 1090.12[29]
Steel7850200.0 × 1090.300[20]
Impactor251530.0 × 1090.300[27]
Table 3. Comparison of strain obtained from the experiment and simulation.
Strain GaugeMaximum Strain
(με)
Minimum Strain
(με)
Wave crest Propagation Period
(ms)
TestSimulationErrorTestSimulationErrorTestSimulationError
1490.6522.96.6%−81.1−88.18.6%54.249.7−8.3%
2456.5497.89.0%−70.3−78.912.2%52.548.5−7.6%
Table 4. COR in some cases.
CaseThickness Ratio of EPSCORError
TestSimulation
P100 [8]00
P610.42 [8]0.45%
Publisher’s Note: MDPI stays neutral with regard to jurisdictional claims in published maps and institutional affiliations.

