Article

Using CFD to Simulate the Concentration of Polluting and Harmful Gases in the Roadway of Non-Metallic Mines Reveals Its Migration Law

School of Environment and Resources, Xiangtan University, Xiangtan 411105, China
*
Author to whom correspondence should be addressed.
Sustainability 2022, 14(20), 13349; https://doi.org/10.3390/su142013349
Submission received: 21 September 2022 / Revised: 12 October 2022 / Accepted: 14 October 2022 / Published: 17 October 2022

Abstract

:
The green and pollution-free mining of resources has always been a research field that people have focused on. In the process of mining resources, the production of CO, SO2 and other pollutants directly affects the health of miners and the atmospheric environment in the mining area. Therefore, it is particularly important to deal with and control the polluting gases generated by mining. Taking the underground roadway of a coal mine in Hengdong City, Hunan Province, as the research object, we studied the migration law of pollutant gas there. Comsol software was used to determine the changing state of pollutant gas migration in the roadway, and a simulation model of the wind field and the pollutant concentration field in the roadway under turbulent conditions was established. The results showed that, when the air flow moved to the front face of the roadway, it generated backflow to form a counterclockwise-rotating air flow vortex. Here, the air flow stagnated, hindering the diffusion of pollutants. The gas moved with the air flow in the roadway, and the flow’s velocity decreased in the middle of the roadway, causing pollutants to accumulate. The whole wind field tended to be stable at a plane 25 m from the roadway’s outlet. This indicates that the middle part of the roadway is the place where the polluted gas accumulates, and it is of representative significance to study the concentration of the polluted gas in the roadway in this section.

1. Introduction

In recent years, the development of the economy and society has led to a continuous improvement in the degree of mechanization of mining and a continuous increase in mining intensity [1,2]. The open-pit mining method, among the common mining methods, destroys the surface soil and the ecological balance of animals and plants, and the damage to the surrounding natural environment is direct and obvious. By comparison, underground mining of ores causes less damage to the surrounding natural environment [3,4,5,6]. However, the pollution caused by ventilation in underground mines is still unavoidable [2]. Dust and fugitive dust generated by the operation of large-scale machinery and blasting operations generate a large number of gaseous pollutants such as carbon monoxide, nitrogen oxides and sulfur dioxide, and a range of pollution problems. When the pollutant concentration reaches a certain level, it directly damages the normal physiological function of underground workers [7,8,9,10]. The pollutants generated from underground operations are physically transported along the mine’s ventilation network to reduce the harmful concentrations. At the same time, the closure and excavation of some working roadways force the ventilation network’s structure to change, causing ventilation defects, which make the accumulation of local polluting gases reach harmful concentrations, endangering the health of operators [11,12,13,14]. For example, the Doyon Westwood mine in Abitiby, Quebec, has sulfide pollution problems, while the Pulang copper mine in Yunnan has carbon monoxide pollution problems [14,15].
At present, the research on toxic gases in coal mines mainly focuses on the amount of indicator gas generated by the spontaneous combustion of coal. Through analysis of the change trend in the concentration of several special gas products generated by the spontaneous combustion and oxidation of coal, it is possible to determine whether there is likely to be a spontaneous combustion disaster in coal mines [16,17]. Metal mines generally pay attention to the migration laws and the treatment and disposal of the dust and toxic and harmful gases generated by blasting. The temporal and spatial evolution of the characteristics of CO gas in blasting smoke have been studied and analyzed under specific working conditions in order to reduce the number of pollutants at the source of blasting generated by different blasting methods [18,19]. Some non-uranium mines such as lead–zinc ore, tungsten ore and other non-ferrous metal ores are often contaminated by radioactive uranium, thorium and other nuclides, which will decay during the mining process, resulting in pollution by radioactive radon gas and occupational diseases such as lung cancer [20,21,22].
The internal structure of an underground mine is complex. In order to provide a suitable environment for workers to work, it is necessary to lay a ventilation pipe network to strengthen the capacity for ventilation [23]. However, the polluting gas generated by the blasting operation for tunnel excavation moves in the tunnel with the wind flow, which not only pollutes the surrounding environment but also endangers the health of workers [24]. Wang et al. studied the dust pollution generated by blasting and construction mining in open-pit coal mines, and summed up the corresponding accident prevention measures and optimal strategies for mine design [25]. Harris analyzed the CO generated by mine-blasting operations and showed that applying negative pressure to the borehole was the most effective method of removing CO from the surface and minimizing its accumulation and migration [26]. Rudakov et al. improved the filling of explosives and provided a method to reduce nitrogen oxide emissions by using highly active catalysts as a part of the molding and tamping process [27]. The results showed that using zinc carbonate (ZnCO3) as a filler reduced nitrogen oxide emissions by 40% without the addition of catalysts. Adhikari et al. studied the composition and retention characteristics of blasting flue gas, and proposed effective measures to ensure workers’ health as well as clean production in wells [28].
With the replacement of various CPUs and the rapid development of computer technology, the methods of computational fluid dynamics theory have been applied in various numerical simulation software packages, and the use of numerical simulation software to study fluid laws has become the mainstream today [29]. Feng et al. used Fluent software to simulate the diffusion behavior of harmful gases after tunnel blasting in a high-altitude environment, and revealed the dynamic law that the equivalent mass concentration of CO increases exponentially with an increase in altitude [30]. Xie et al. used the computational fluid dynamics (CFD) method to analyze the characteristics of the tunnel flow field and established a fluid model after blasting, as well as determining the area where personnel were more seriously exposed to dust [31]. Torno used the CFD method to establish a 4D dynamic model of flue gas, which accurately revealed the gas’s dilution behavior [32]. Sa et al. used Fluent software to simulate the change in the concentration of ventilation dust in the cavern stopes and the dust trajectory under different wind speeds within 20 min after blasting. The distribution law of the dust concentration in cavern stopes and the influence of the wind speed on dust were accurately revealed [33]. Huang et al. used the CFD method to study the characteristics of the temporal and spatial evolution of CO under different working conditions, and applied the Grey relational analysis method to study the correlation values of factors affecting the diffusion coefficient of CO in the roadway [34]. Xie et al. used CFD analysis to evaluate the optimal angle of air supply, which has practical significance for improving dust removal and reducing the energy consumption of ventilation [35]. Wang et al. used the CFD method to establish the evolution of the process of explosion-dust diffusing, which provided a theoretical basis for rationally arranging the production of deep-pit open-cast mines and avoiding air pollution [36]. Seung-Chul Lee et al. used CFD analysis to evaluate the ventilation characteristics of fans with different layout elevation angles and determined the optimal angle, which has practical significance for accelerating the diffusion rate of polluting gases [37]. Roberto Bubbico et al. used the CFD method to study the evolution process of gas caused by the release of toxic substances and established a turbulent flow model for the diffusion of toxic substances within 5 min of the start of the release of the toxic substances [38]. Ping Chang et al. used the CFD method to analyze the airflow characteristics of the working face and the distribution of DPM concentrations, and established the corresponding fluid model [39]. Menéndez et al. used a one-dimensional mathematical model and a three-dimensional CFD numerical simulation to determine the safe re-entry time after tunnel blasting, and used gas sensors to measure the consistency of the CFD and the three-dimensional numerical simulations [40].
At present, scholars have carried out much research on gas pollution in underground mine tunnels, but research on the concentration and migration law of polluting and harmful gases in specific nonmetallic mine tunnels needs to be deepened further. It is still effective and reliable to use numerical simulation software to study the concentration and migration law of polluting and harmful gases in roadways. Therefore, exploration of the migration law of gas concentration in the roadway can provide a scientific basis for the formulation of measures for the prevention and control of pollutant gas in the later stages and to ensure the health of operators [41].

2. Materials and Methods

2.1. Construction of a Numerical Simulation Model of Polluting Gas in the Roadway

As a branch of fluid mechanics, CFD is widely used in studies into the transport of polluting and harmful gases. The toxic gases generated by mining operations flow in the tunnels and along the air passages in underground mines, causing the accumulation of polluting gases in abnormal ventilation areas. Because of the irregular distribution of underground roadways, the supporting ventilation system and the monitoring system are greatly affected by external conditions, and the gas accumulation phenomenon caused by them is difficult to detect initially. CFD can analyze and predict the pollution and harmful gases in the roadway through numerical simulations. The change in the flow field can accurately reveal the transport law of the polluting gas in the roadway [42]. COMSOL Multiphysics software was used to numerically simulate the polluting gas’s flow field in the actual roadway, to quickly and effectively obtain the change in the flow field’s status, to determine the area of gas accumulation, and provide scientific guidance for the subsequent prevention of pollution gas and for environmental protection [43].

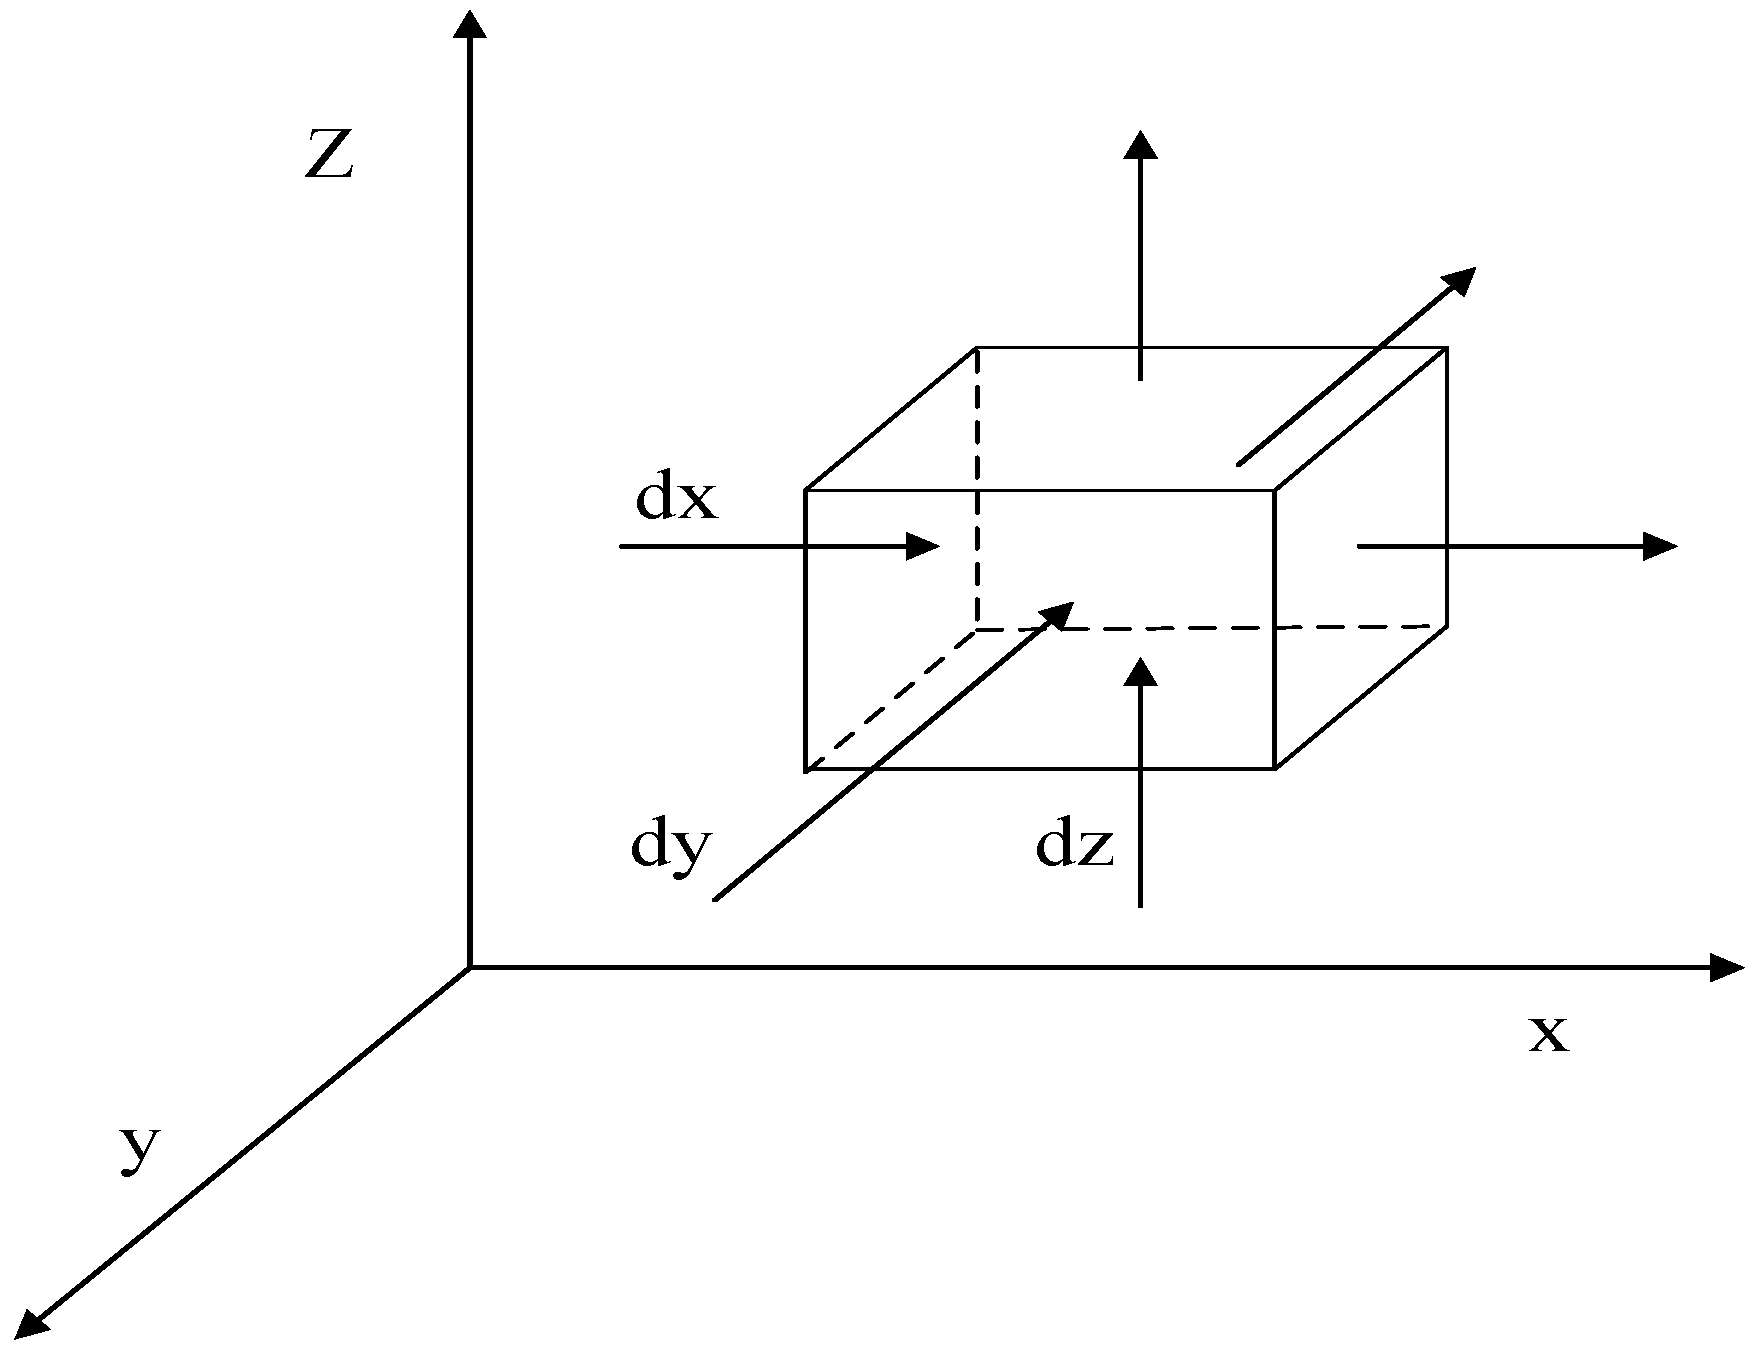
2.2. Concentration Diffusion Control Equation

The fluid flow in an underground mine tunnel obeys the Navier–Stokes equation, and must comply with the general laws of mechanical motion and the fluid mechanics laws of mass conservation, momentum conservation and energy conservation. The equation governing the concentration and diffusion is as follows [44].
(1) Continuity equation
d ρ dt + χ i ( ρ V i )
where ρ is the gas density, and Vi represents the velocity (Vx, Vy, Vz) in the directions of the coordinate axes x, y and z.
A fluid follows the law of conservation of mass during the process of flowing [45]. A representation of the gas micro-element in the Cartesian coordinate system is shown in Figure 1.
(2) Momentum conservation equation
The various forces exerted on the micro-element by the outside world act together on the movement of the micro-element, so that the micro-element changes with time. The equation for its conservation of momentum is expressed as:
( ρ V i ) t + ( ρ V i V j ) χ j = ρ χ i + χ j ( μ V i χ j ) + ( P P α ) G
where is represents the fluid’s dynamic viscosity, G represents gravitational acceleration, P represents the absolute pressure and P α represents the density of air.
(3) Energy conservation equation
The energy transfer in the process of the flow of polluting gas in the roadway follows the first law of thermodynamics, and its expression is as follows [46]:
( ρ Τ ) t + · ( ρ V ¯ Τ ) = · ( k C P grad T ) + S T
where Cp is the specific heat capacity, in J/(kg·°C); T is the temperature; k is the fluid heat transfer coefficient, in W/(m2·°C); and ST is the viscous dissipation term.
(4) Component equation
The diffusion of gas in the atmospheric environment needs to satisfy the law of conservation of the components’ mass, and the expression is as follows
( ρ C z ) t + ( ρ V ¯ C z ) = ( D z ( ρ c z ) ) + F z
where CZ is the concentration volume of the component Z; where is the mass concentration of the component Z, in g/m3; DZ is the diffusion coefficient of the component Z and Fz is the production rate of the chemical reaction, in g/(s·m3).
In addition, the Reynolds-averaged Navier–Stokes method was used to study the variation law of the pollutant gas’s flow field in the tunnel.

2.3. Construction of the Simulation Model

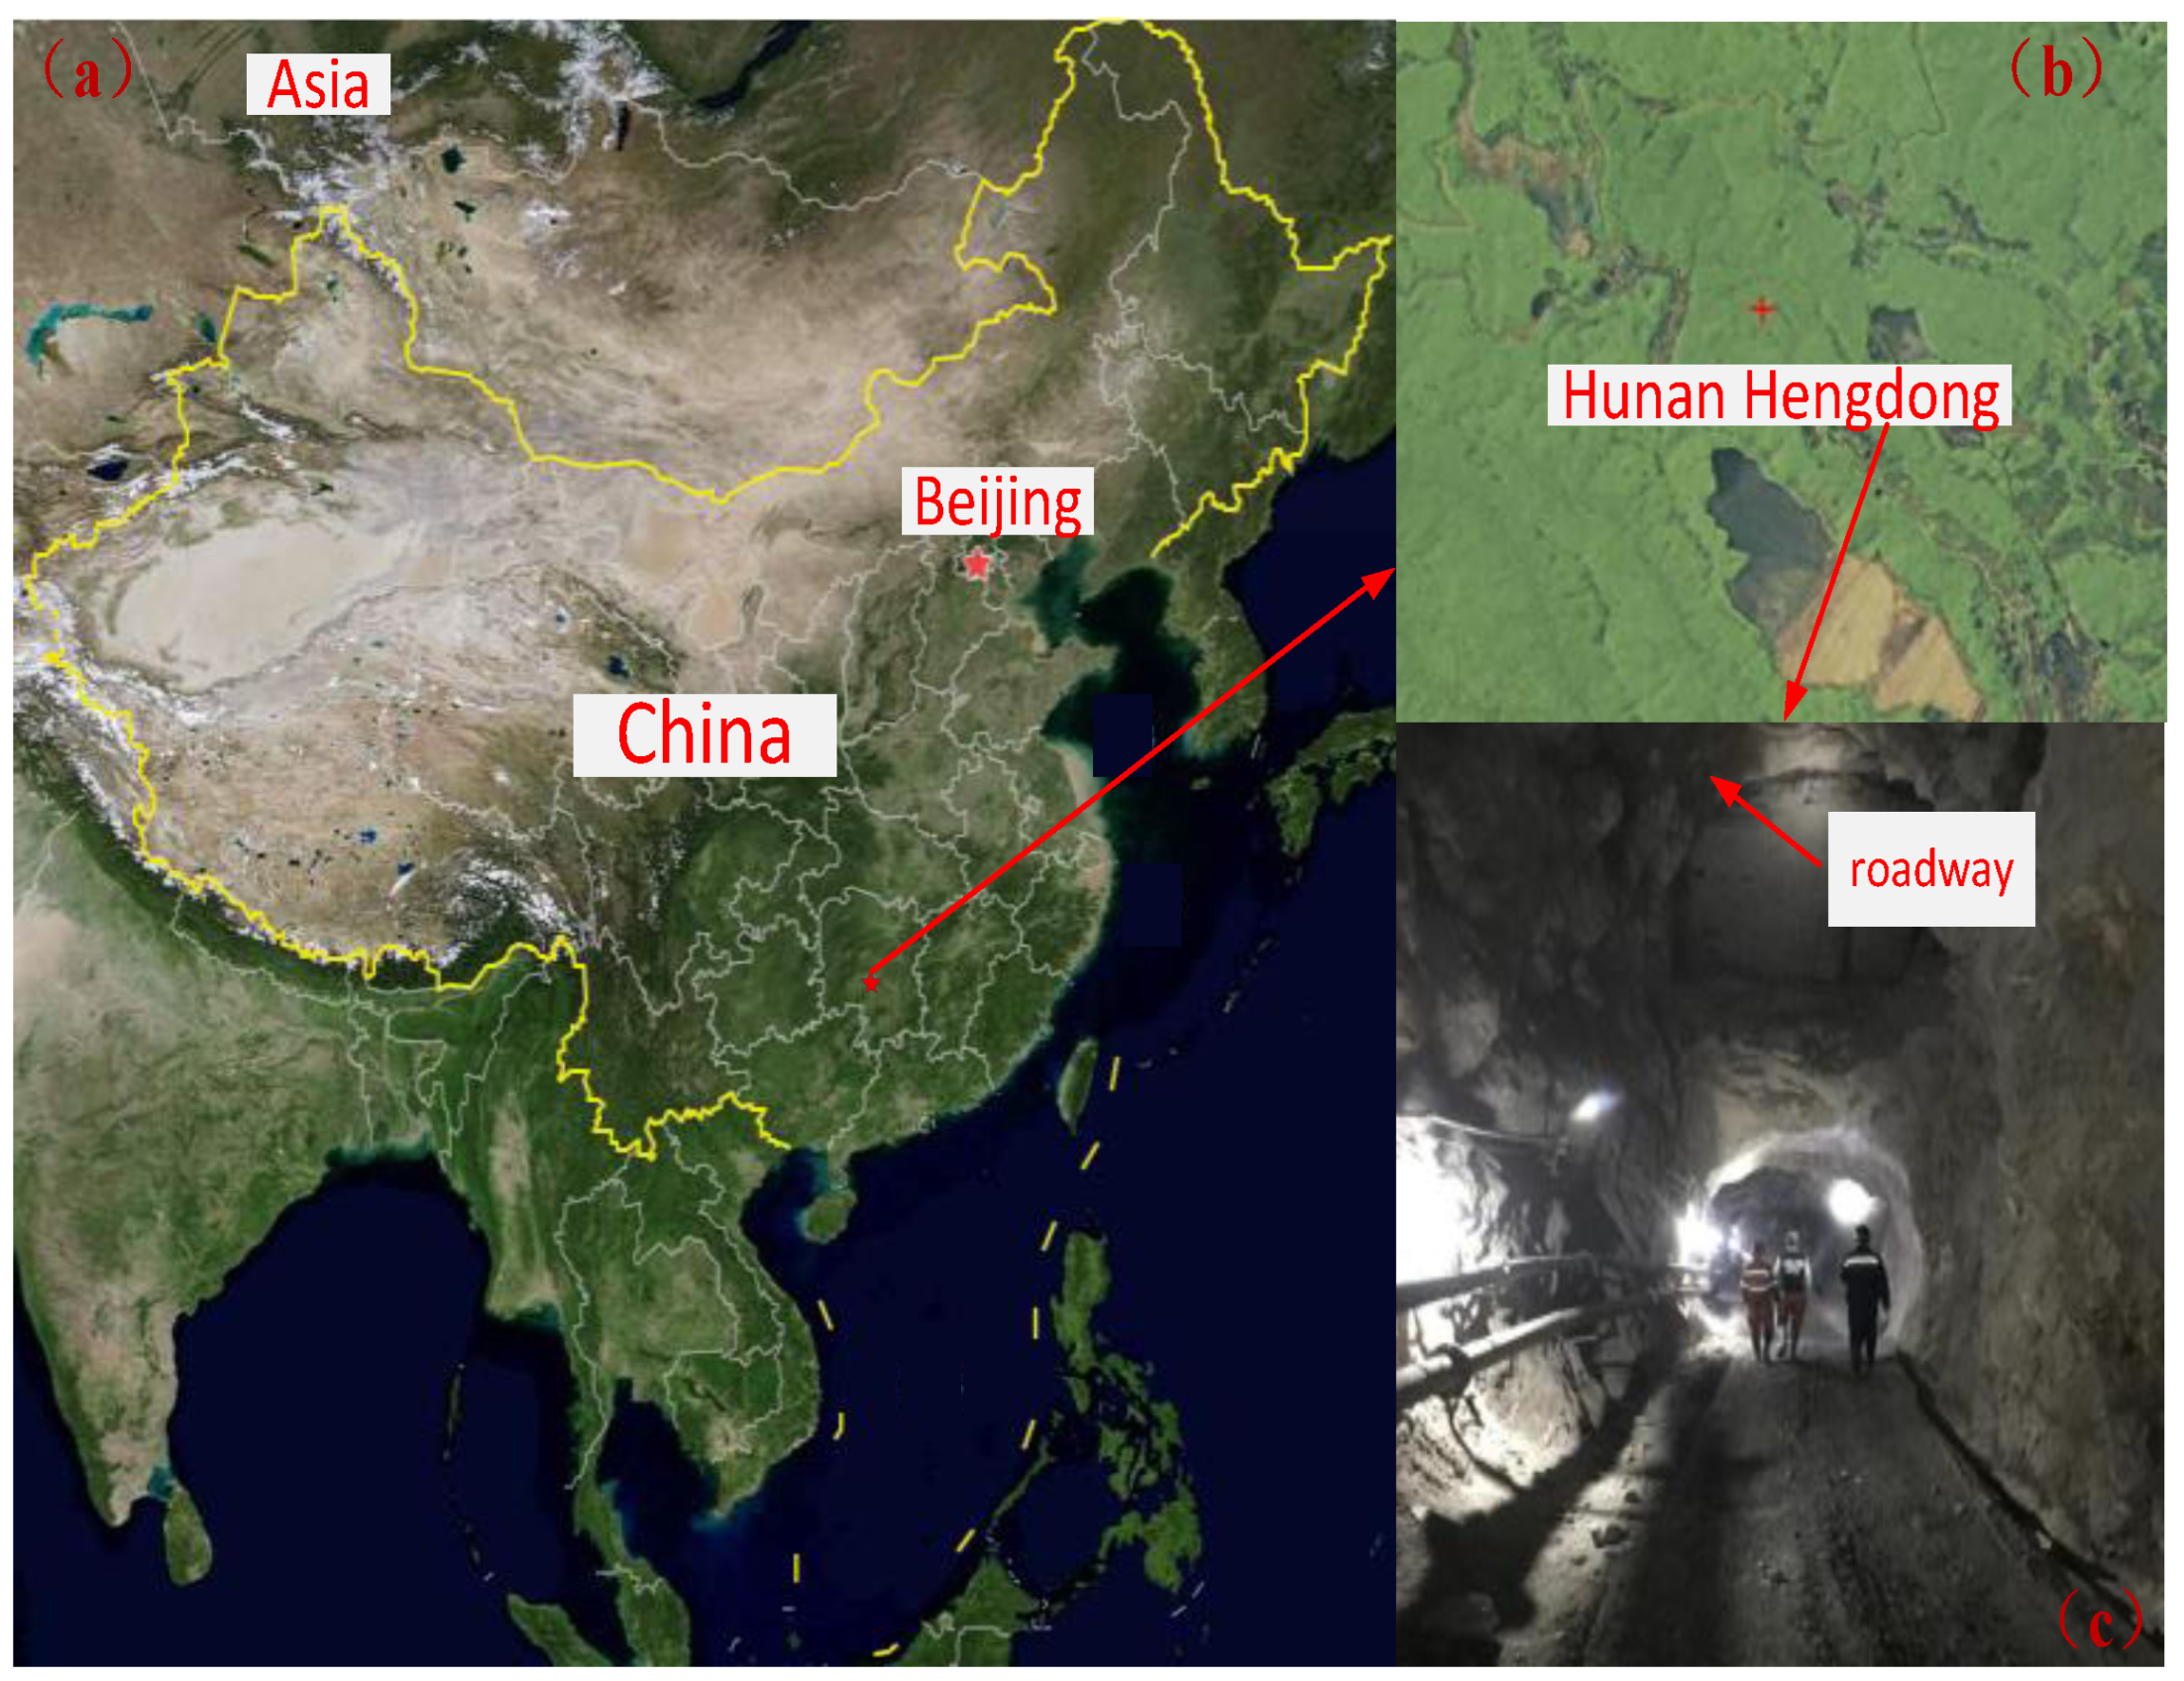
2.3.1. Model Site Selection and Construction of the Geometric Model

The mine under study is located near Xiaoshanchong, northeast of Hengdong County, Hengyang City, Hunan Province. The geographic coordinates have a longitude range of 113.073164° to 113.080134° and a latitude range of 27.139523° to 27.137665°. The location is shown in Figure 2. A certain roadway was selected as the research object. This roadway is a single-ended roadway. Because of the roadway’s structural characteristics, the airflow in the roadway is often unsmooth. When the concentration of CO, SO2 and other toxic polluting gases in the road is too high, additional means are needed to assist the diffusion of the polluting toxic gas in the roadway. Therefore, diffusion of the concentrations of polluting and harmful gas occurs in the exhaust air of the tunnel. In the area where the gas flow rate is abnormal and the gas accumulates in the tunnel, there is also an excessively high concentration of polluting gases, which has a significant impact on the health of the operators and the tunnel environment.
The selected roadway is 40 m below the ground surface. Roadway L09 was selected as the simulation object; the size of its cross-section is 4 m × 3.2 m, its area is about 11.2 m2 and the total length of the roadway is 45 m. This section has the characteristics of a narrow roadway, with a long excavation length and a low ventilation pressure. In order to better simulate the flow law of the polluting gas generated by blasting, the assumptions of the simulation were as follows. (1) The air in the roadway before the blasting operation was ignored. (2) The gas generated by the blasting was a three-dimensional incompressible gas. (3) The temperature in the roadway was constant. (4) The influence of other equipment on ventilation was ignored. (5) The flexible fireproof material of the ventilation equipment was simplified, the equipment’s radius was 0.4 m, the inlet’s wind speed was 10 m/s and the distance from the tunnel face was 12 m. (6) The modeled outlet was set as a free outlet boundary condition, where the outlet’s pressure was 1 atm, the roughness constant was 0.7, and the roughness of particle height was 0.3. (7) The fan blew air to this roadway from the fresh air flow, bringing out the residual polluting poisonous gas.
Based on these basic conditions, a geometric model (shown in Figure 3) was established. The fluid properties were determined according to the actual field conditions and theoretical calculations.

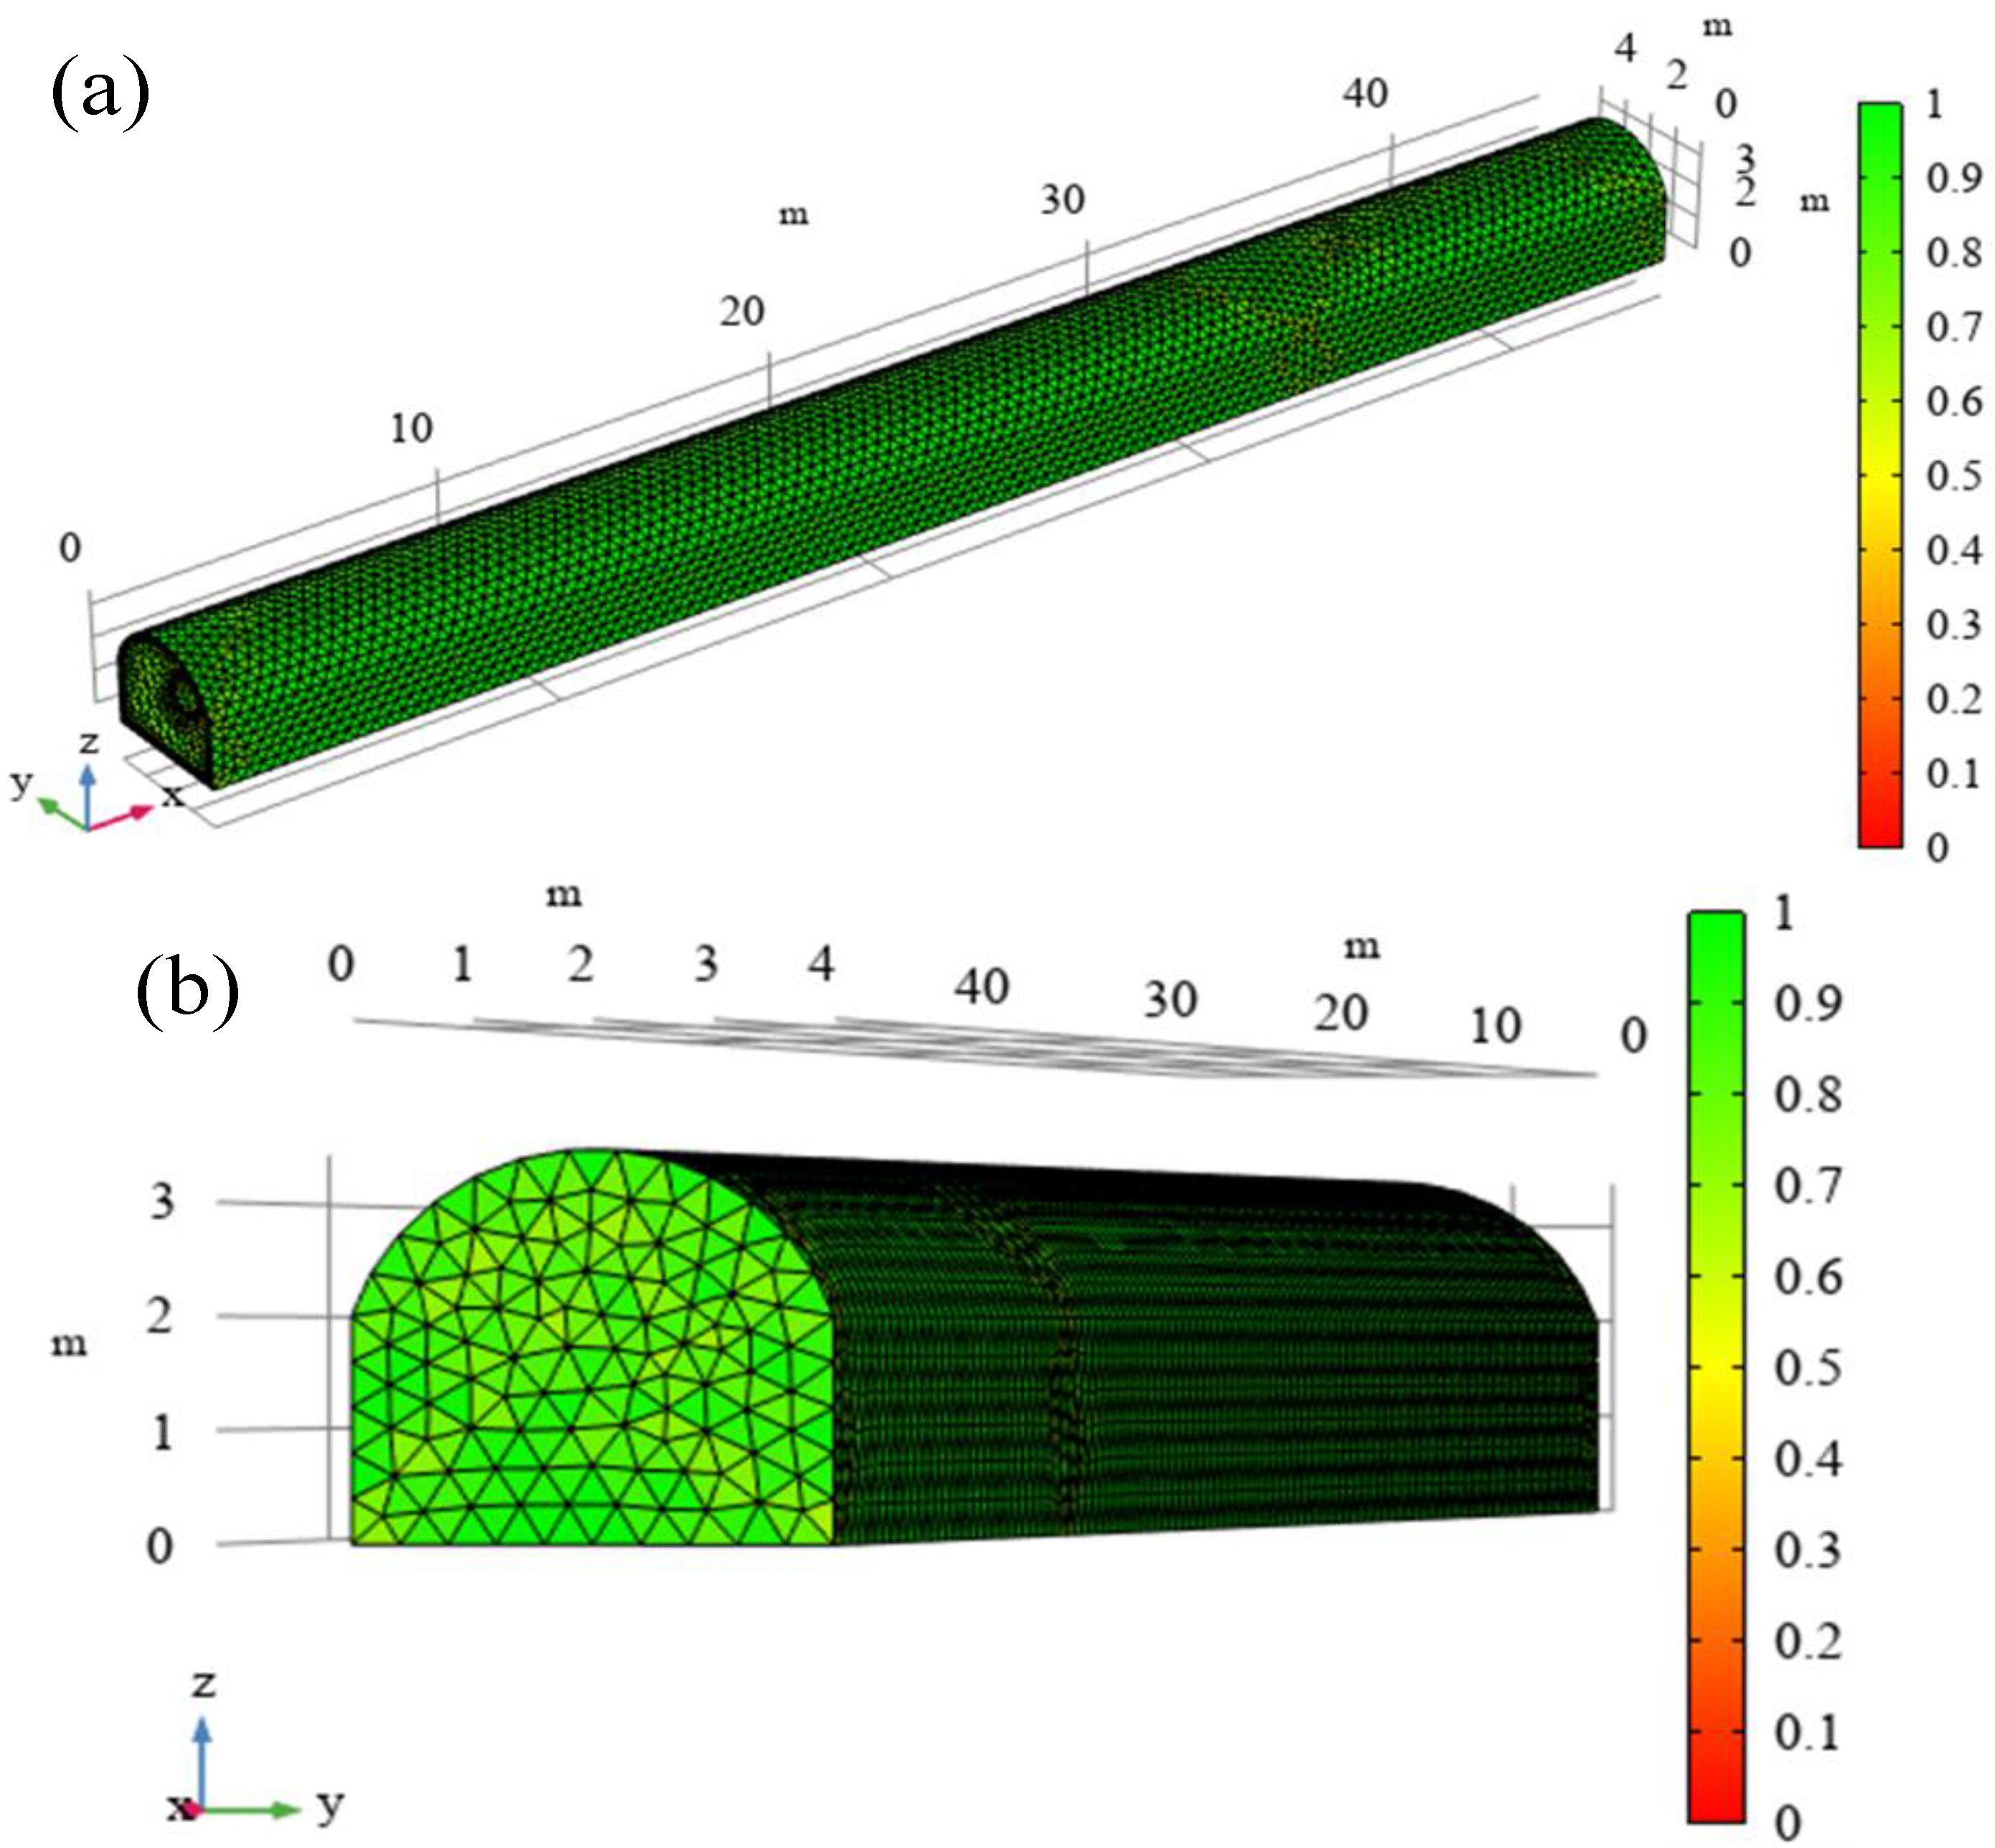
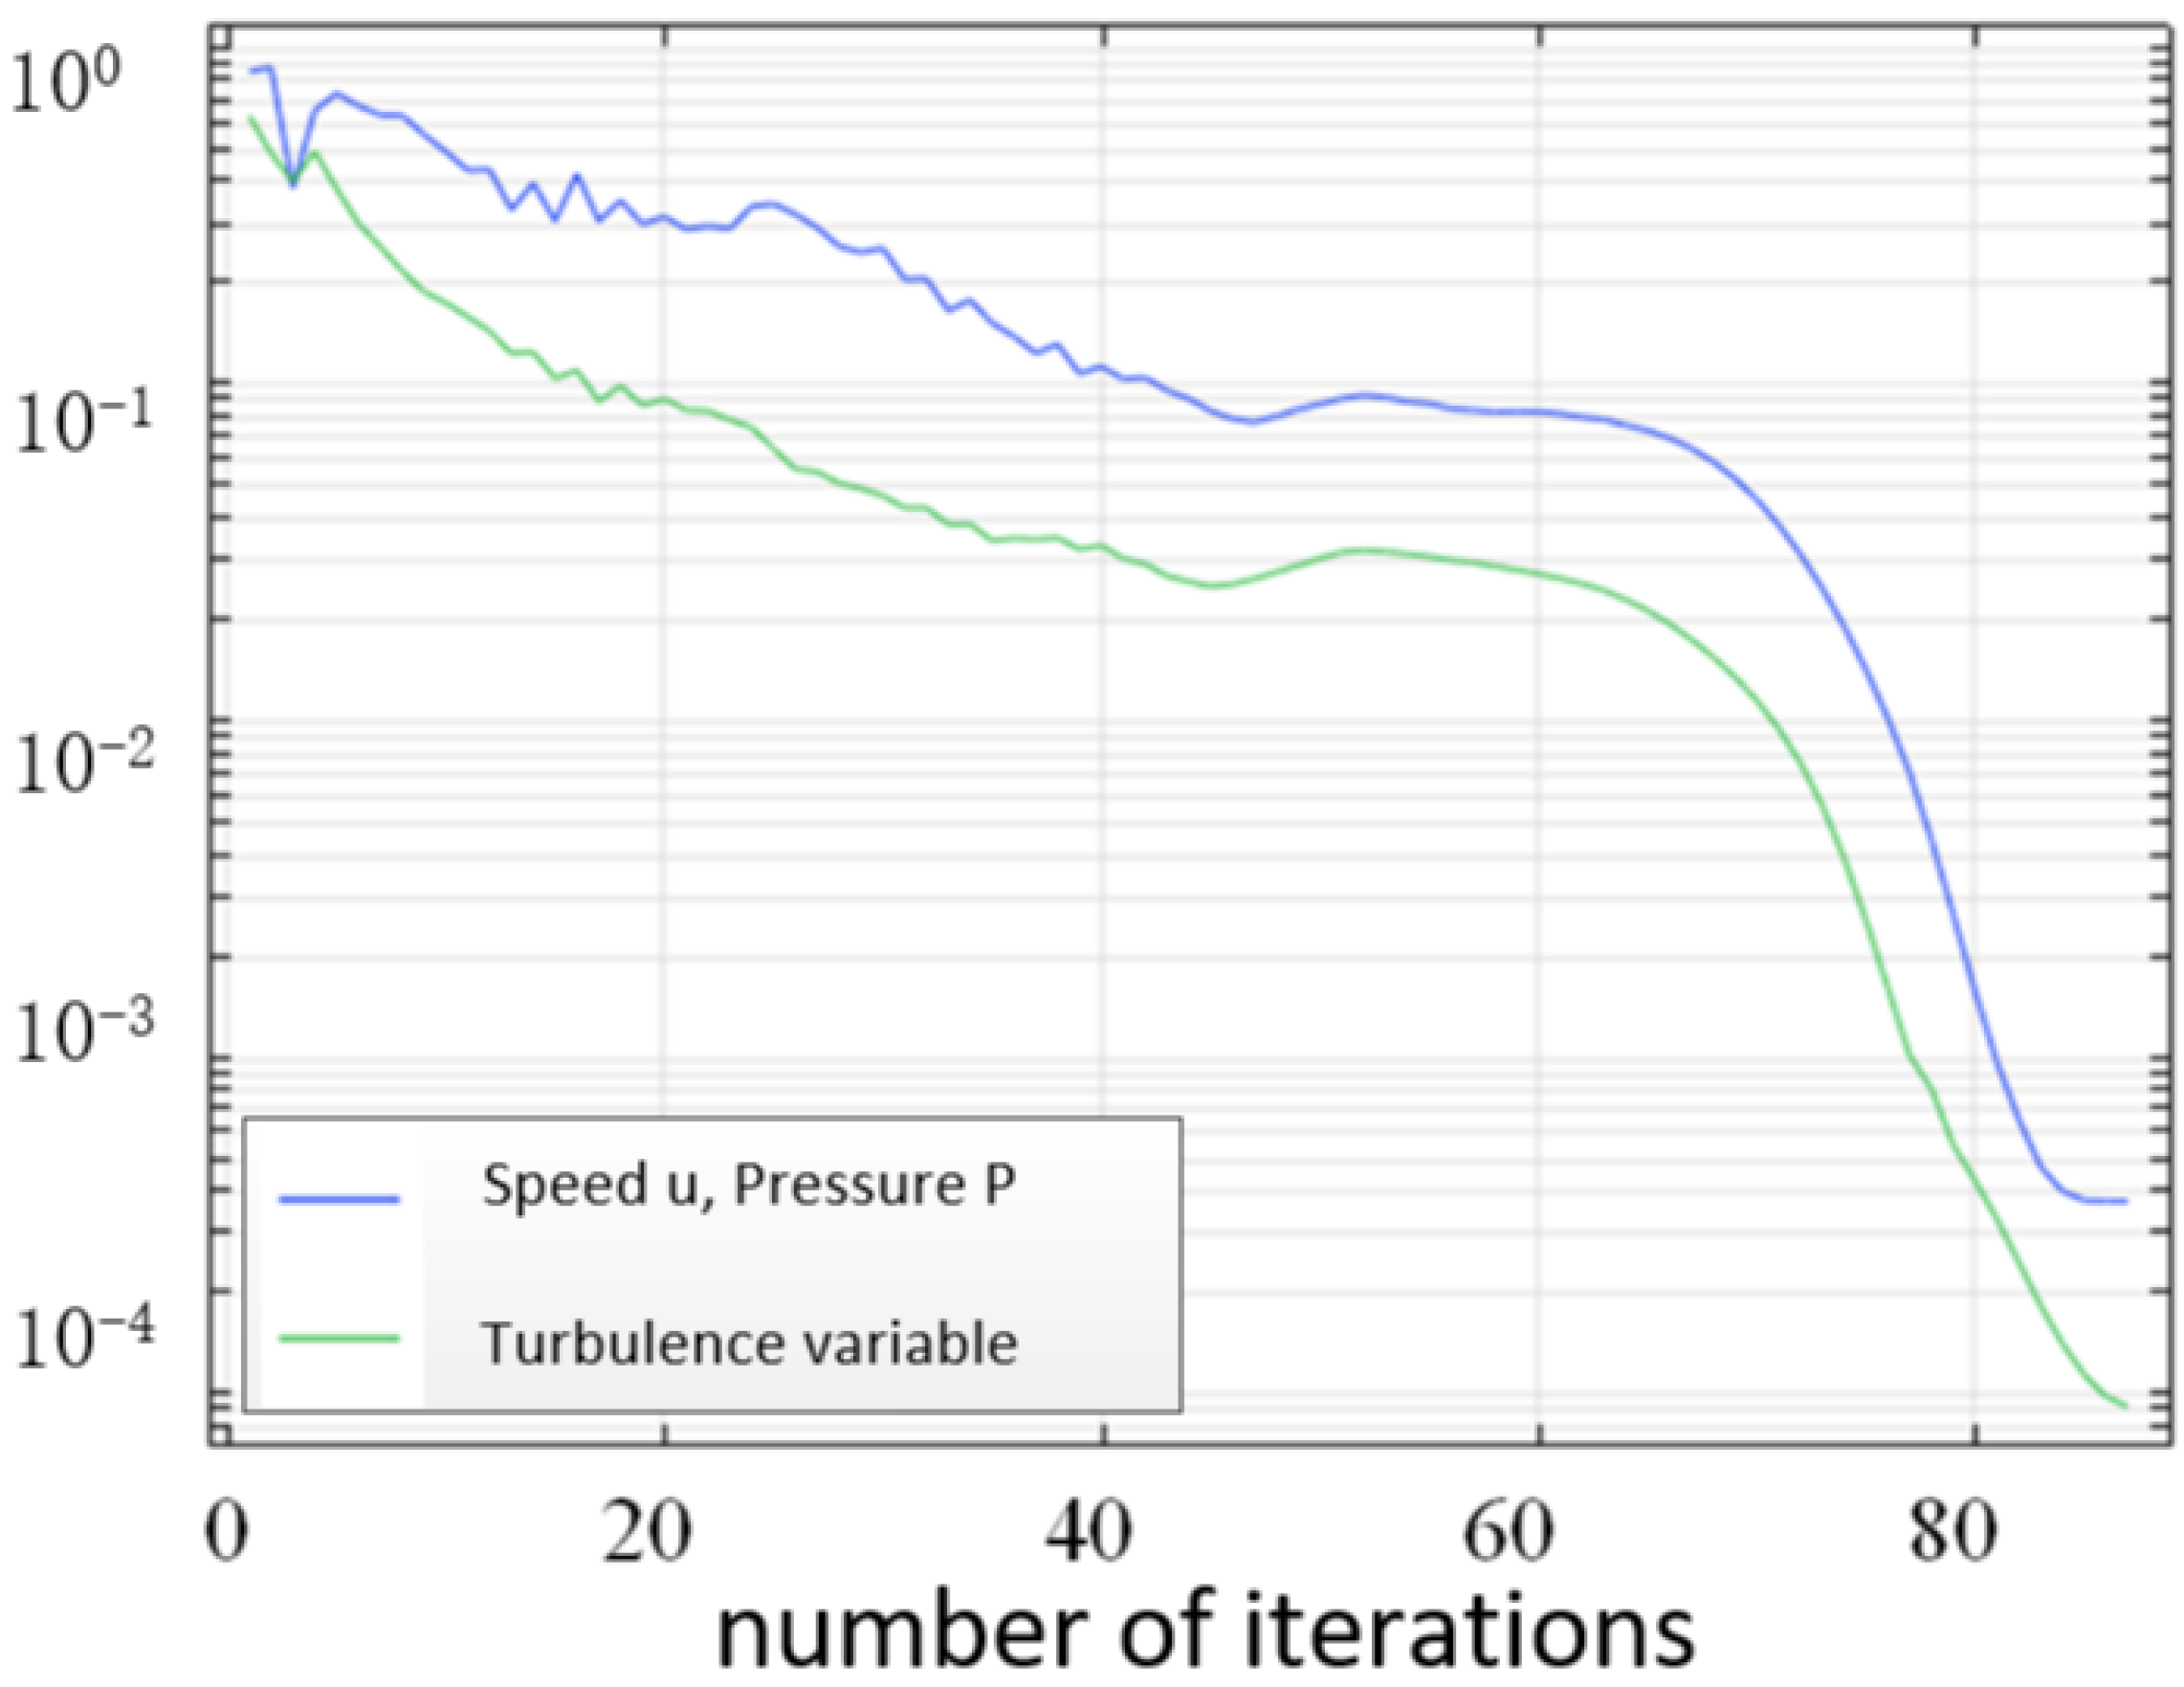
2.3.2. Grid Generation and Verification of Iterative Convergence

The geometric model was meshed by using construction mesh technology. The total number of elements was 140,999, and the minimum element quality was 0.05924. The grid was surrounded by fixed boundaries, and the entrance and exit were free-exit boundary conditions. The results of the mesh division are shown in Figure 4.
By setting the wind speed at the inlet of the ventilation pipe in the model to 10 m/s, the pressure outlet conditions, the boundary conditions and the movement of polluting gas in the roadway were analyzed. After setting the relevant physical parameters of the flow field, CFD software was used to start the iterative calculation. A diagram of the iterative convergence is shown in Figure 5. This study compared and analyzed the four convergence standards of 100, 10−1, 10−2, 10−3 and 10−4. It can be seen that the convergence standards of 100 to 10−2 differed greatly and did not represent convergence. The difference between the results of the 10−3 and 10−4 convergence standards was small;therefore, the simulated convergence criterion was 10−4. Each time step in the diagram awas in a convergence state. The solver reached the given convergence standard after 85 iterations, which indicates that the numerical simulation was effective.
The actual wind speed and temperature data were monitored by three detectors arranged at 30 m and 15 m along the X axis of the roadway at an interval of 1 min.

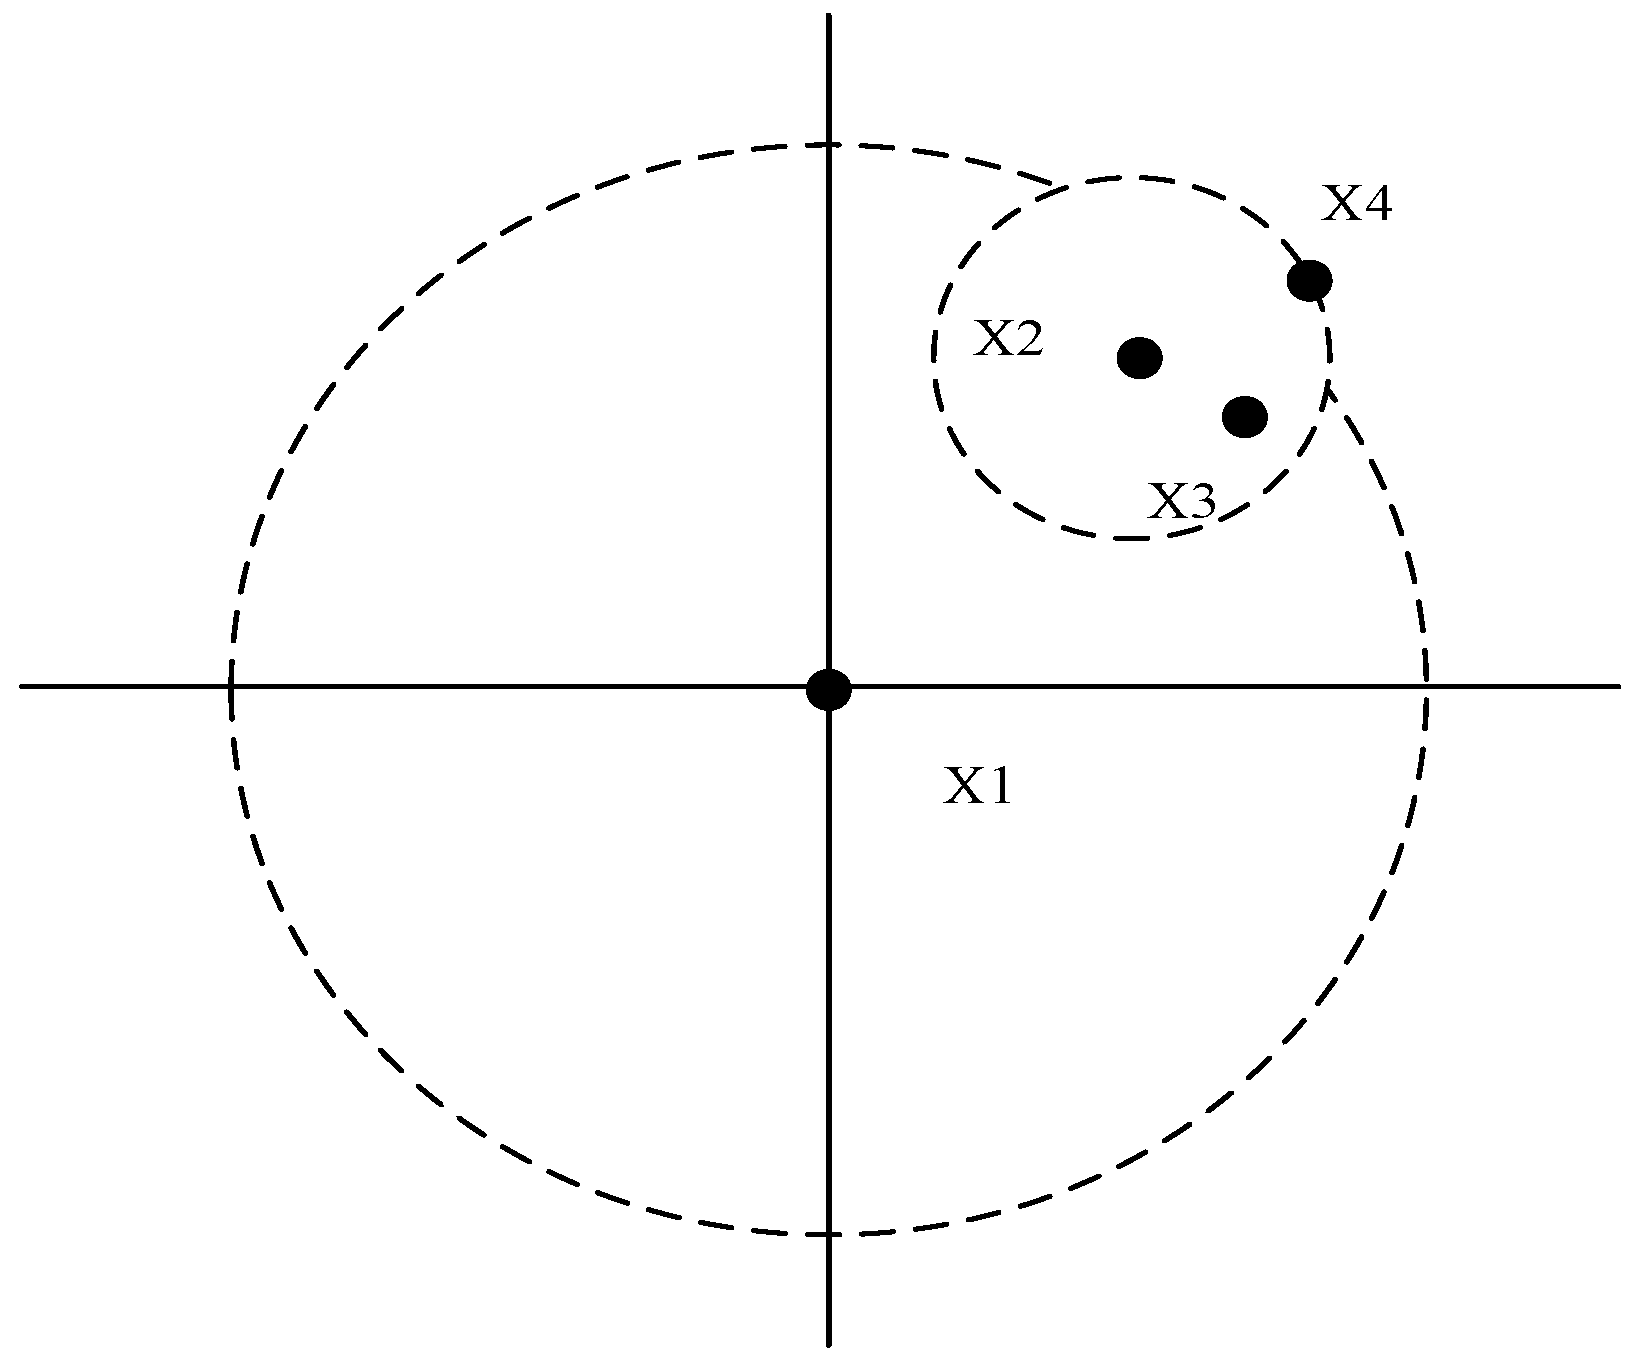
2.4. Setting of the Detection Points

According to the actual physical parameters of the roadway, two detection sections were selected as the data collection, which were located in the middle and last two sections of the roadway, with a distance of 15 m and a total of 6 detection points, surfaced. We used CAD software to generate the positions in the roadway corresponding to each detection point. The first detection section was 15 m away from the tunnel face, as shown in Figure 6. The test results are shown in Table 1.

2.5. Data Collection and Processing

Due to the complex construction environment on site, the detection data were affected by environmental restrictions and human factors. The internal storage function of the portable gas detector was used to save the detection data, import them into the computer through the data cable and then clean the data in the dataset. The outlier detection method based on the local outlier factor (LOF) algorithm was used to detect the abnormal values of the acquired historical downhole gas concentrations. If an abnormal value was detected, the average value of the three concentration data points before the abnormal value was used to replace the abnormal value, as shown in Figure 7.
The local outlier factor of the data (P) was determined by calculating the local reachable density of the P for the historical gas concentration data obtained by the LOF algorithm. When the local outlier factor was less than or equal to 1, the point P was not an abnormal point in the neighborhood or even a reunion point. When this ratio was greater than 1, the distance between point P and the points in its neighborhood was large, and P may be an abnormal point. When calculating the local reachable density of data point P, we first determined the k-th distance of P, where the k-th distance was the distance from the data point farthest from P to P in P’s k-neighborhood. The k-neighborhood of point P was determined by the following definitions:
  • There are at least k points O’ excluding P in the set, with the result that the distance from O’ to P is less than or equal to the kth distance of P.
  • There are at most k − 1 points O’ in the set excluding the point P, with the result that the distance from O’ to P is smaller than the kth distance of P.
For example, in the example shown in Figure 7, k = 2 for the point X(1), and the two closest points to it are the point X(1) and the point X(4); in other words, the 2-neighborhood of X(1) includes point X(1) and point X(4).
We then determined the reachable distance between each data point O and P in the k-neighborhood of P, where the reachable distance between O and P was the maximum of the distance between O and P and the kth distance of P. After that, the local reachability density of P could be determined according to the following Formula (5):
Ι rd k ( P ) = 1 O N k ( P ) d k ( P , O ) / | N k ( P ) |
where Irdk(P) represents the local reachability density of P, Nk(P) represents the k-neighborhood of P and the reachable distance between O and P. If P and the points in the neighborhood are of the same class, the reachable distance is more likely to be smaller, resulting in a larger local reachability density. If both P and the points in the neighborhood are far away, the reachable distance may be large, and the local reachable density will be small. When the local outlier factor of the data is determined according to the local reachability density, the local outlier factor of the data can be calculated according to the following Formula (6):
L O F k ( P ) = O N k ( P ) I rd k ( O ) I rd k ( P ) | N k ( P ) |

3. Results and Discussion

3.1. Variation Law of the Wind Field under Specific Conditions

We selected the three-direction section of the diagram of the results of the simulation model, in which the Z-axis direction was selected as a plane with a height of 2.2 m, and the Y-axis direction was selected as a plane with a width of 2 m, as shown in Figure 8. We selected planes with lengths of 10 m, 20 m, 30 m, 35 m and 40 m in the X-axis direction to analyze the distribution of the wind flow field in the roadway, as shown in Figure 9.
It can be seen from the cross-sections of the air flow field inside the roadway in Figure 8 and Figure 9 that the air duct transmitted the flow of fresh air to the front section of the roadway at a speed of 10 m/s, and the wind speed was the highest at the exit. When the length was 10 to 30 m, the wind speed at the lower right-hand side of the roadway was high. The airflow moved forward along the roadway wall, the flow distance of the affected area increased and expanded continuously, and the wind speed also decreased gradually. When the airflow moved to the front face of the roadway, it quickly generated a backflow phenomenon, forming an anticlockwise airflow vortex. The wind flow in the vortex was stagnant. When the polluting gas molecules were in the range of the vortex, they rotated with the wind field, which was not conducive to the diffusion of pollutants, and the polluting gas accumulated easily. It can be seen that the wind speed was the greatest within 5–15 m of the front section of the roadway and gradually decreased after that. The whole wind field tended to be stable in the section 25 m away from the roadway’s exit. The measured wind speed in Table 1 was close to the results of the simulation, which proves that the simulation’s results are reliable and can be used as a conclusion.

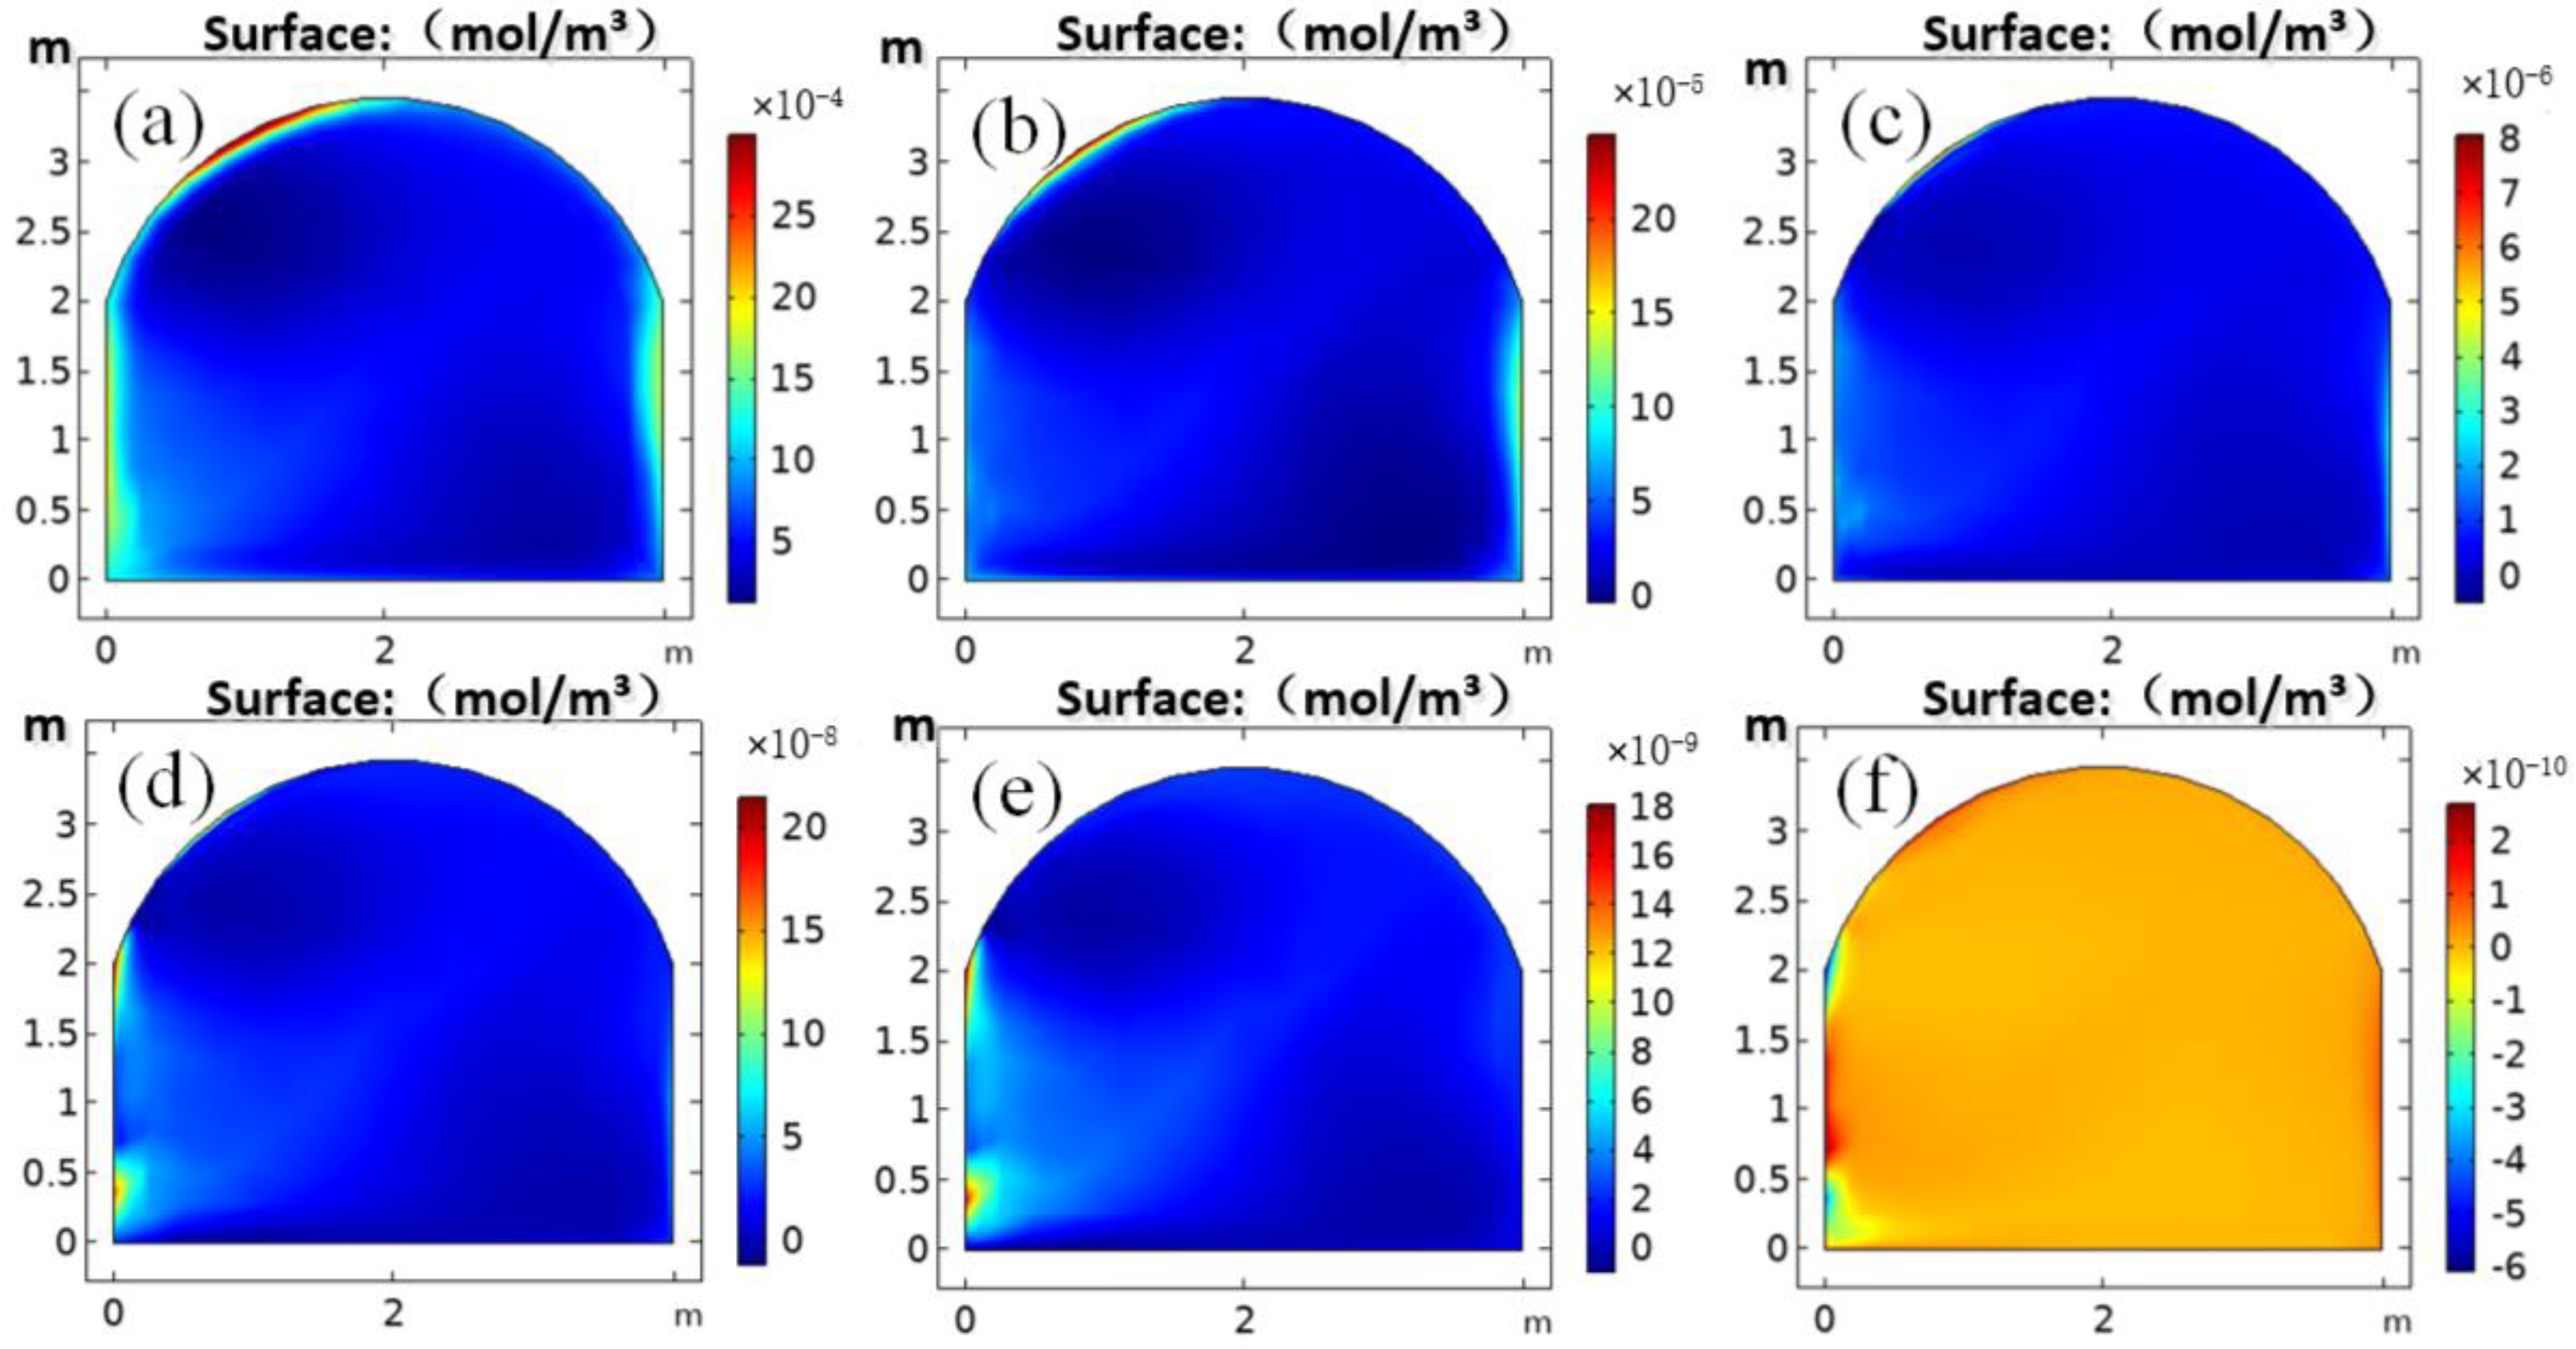
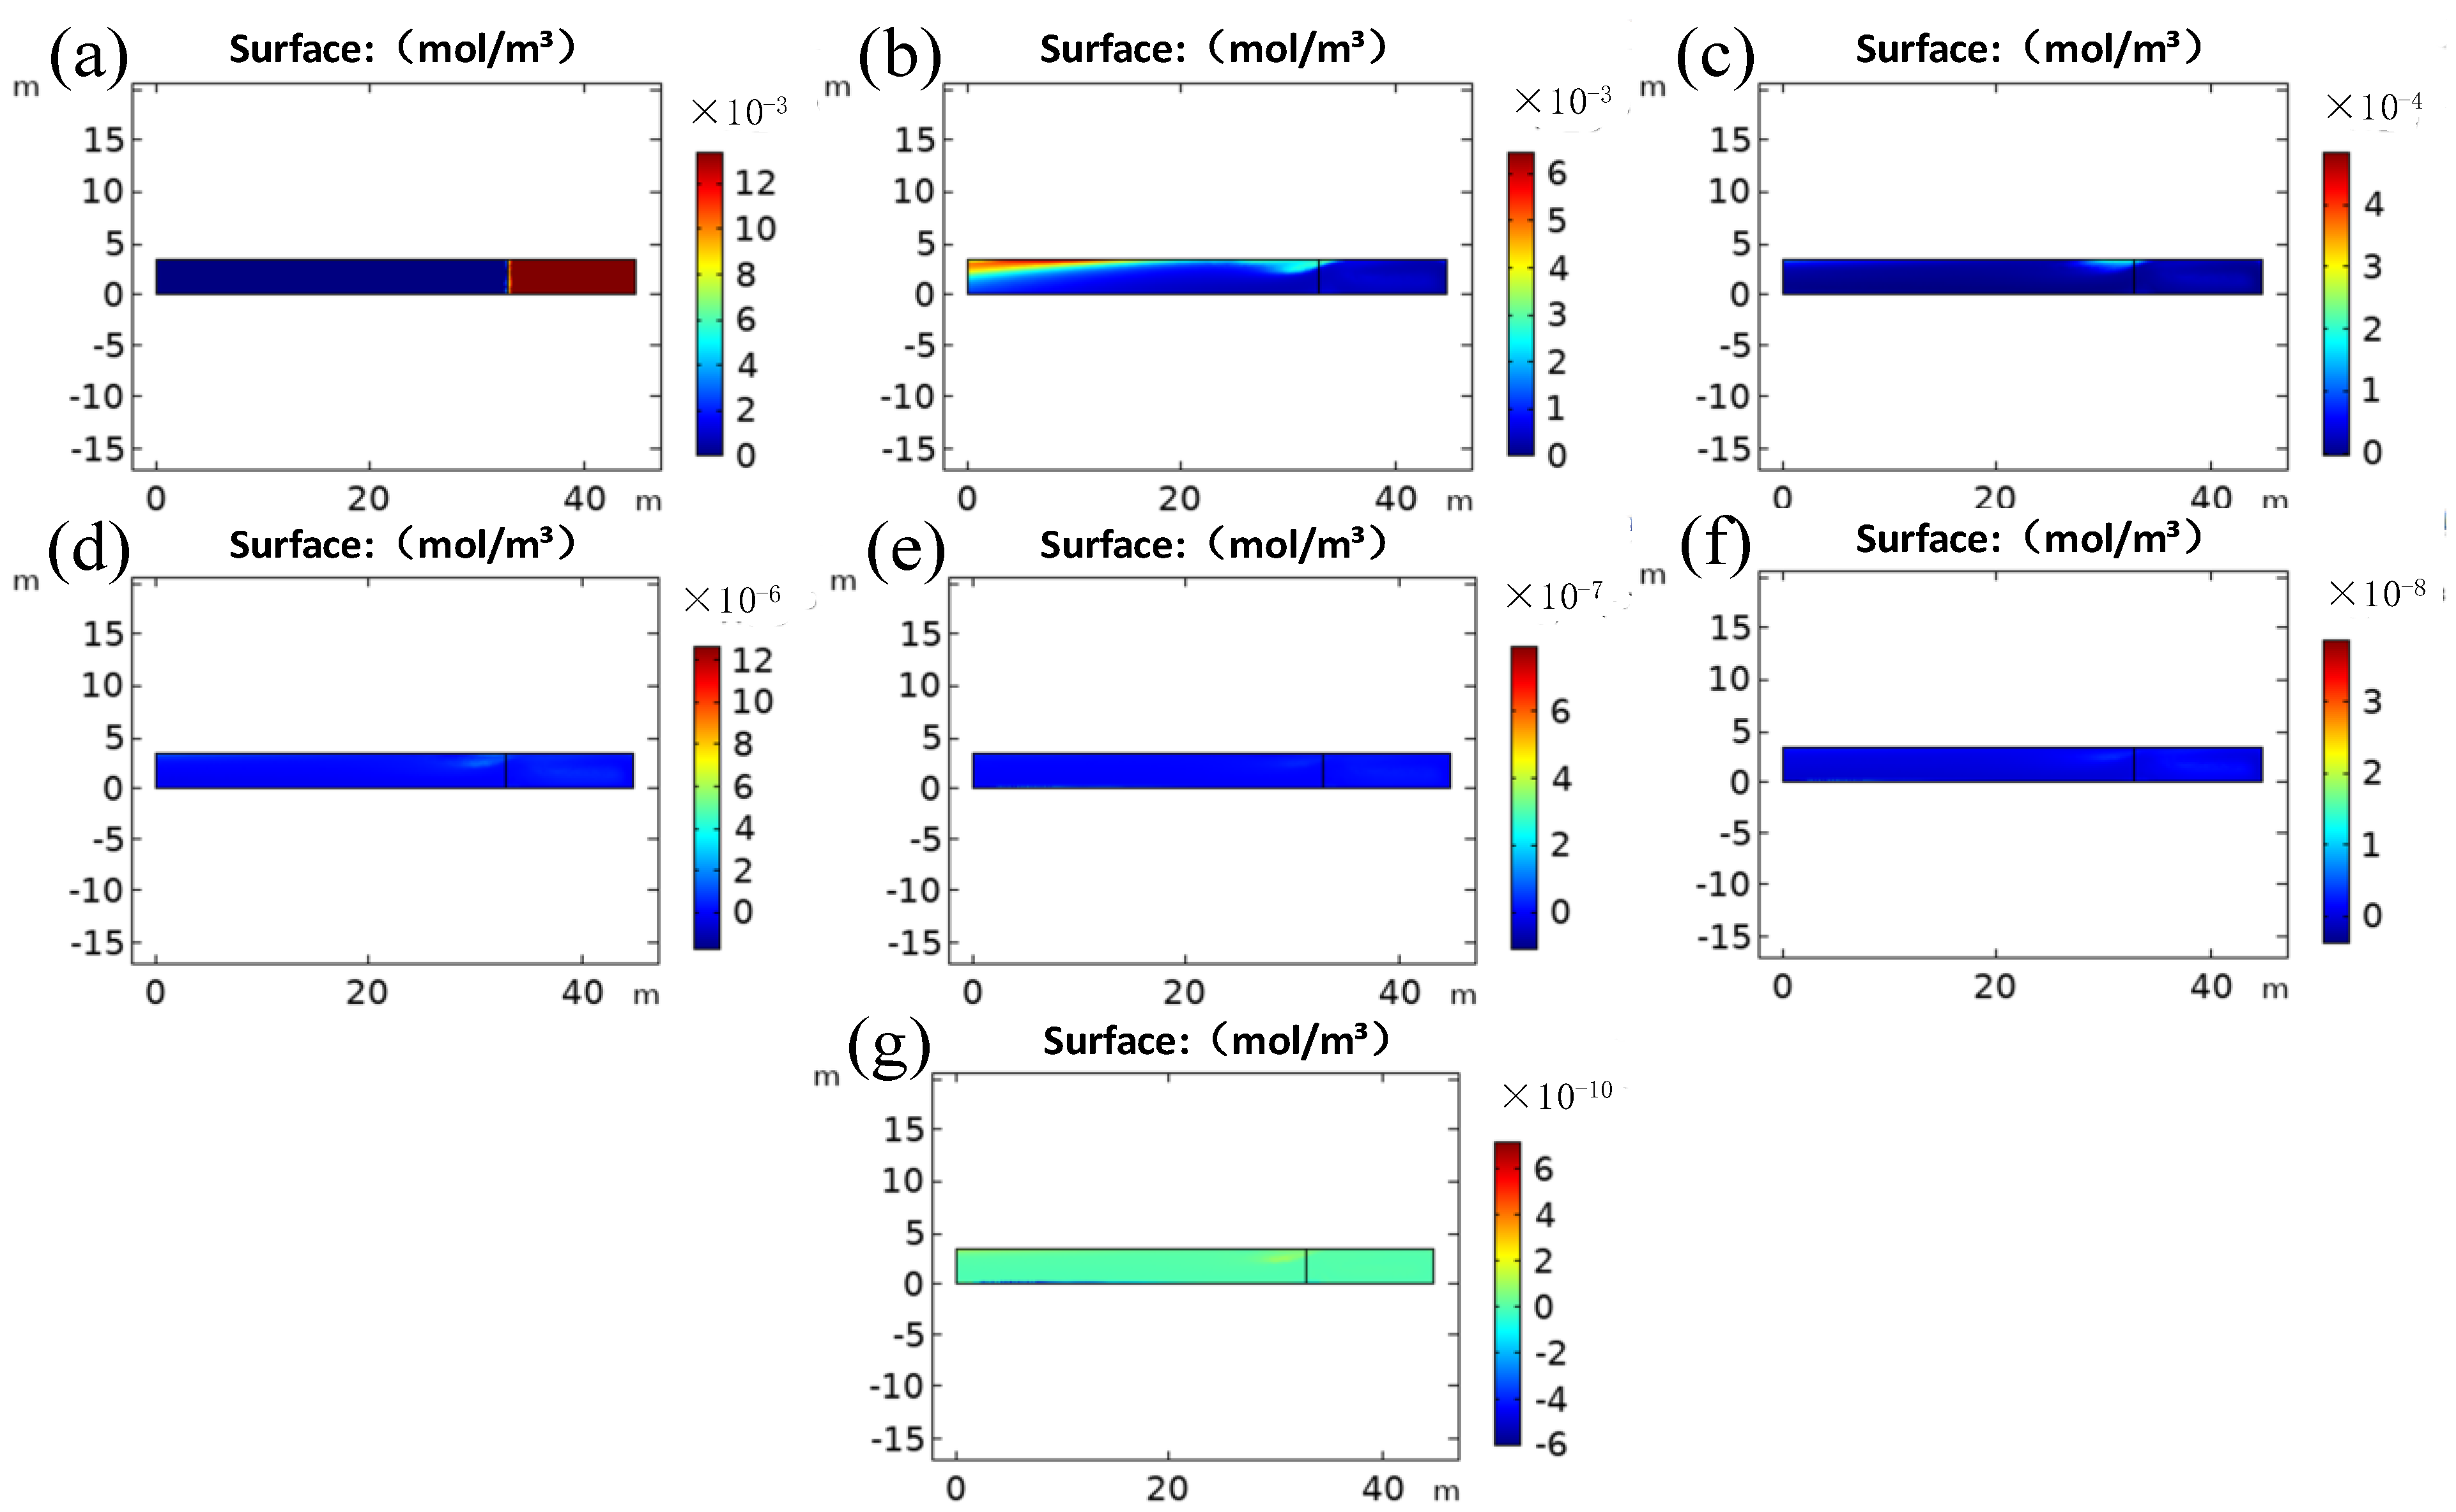
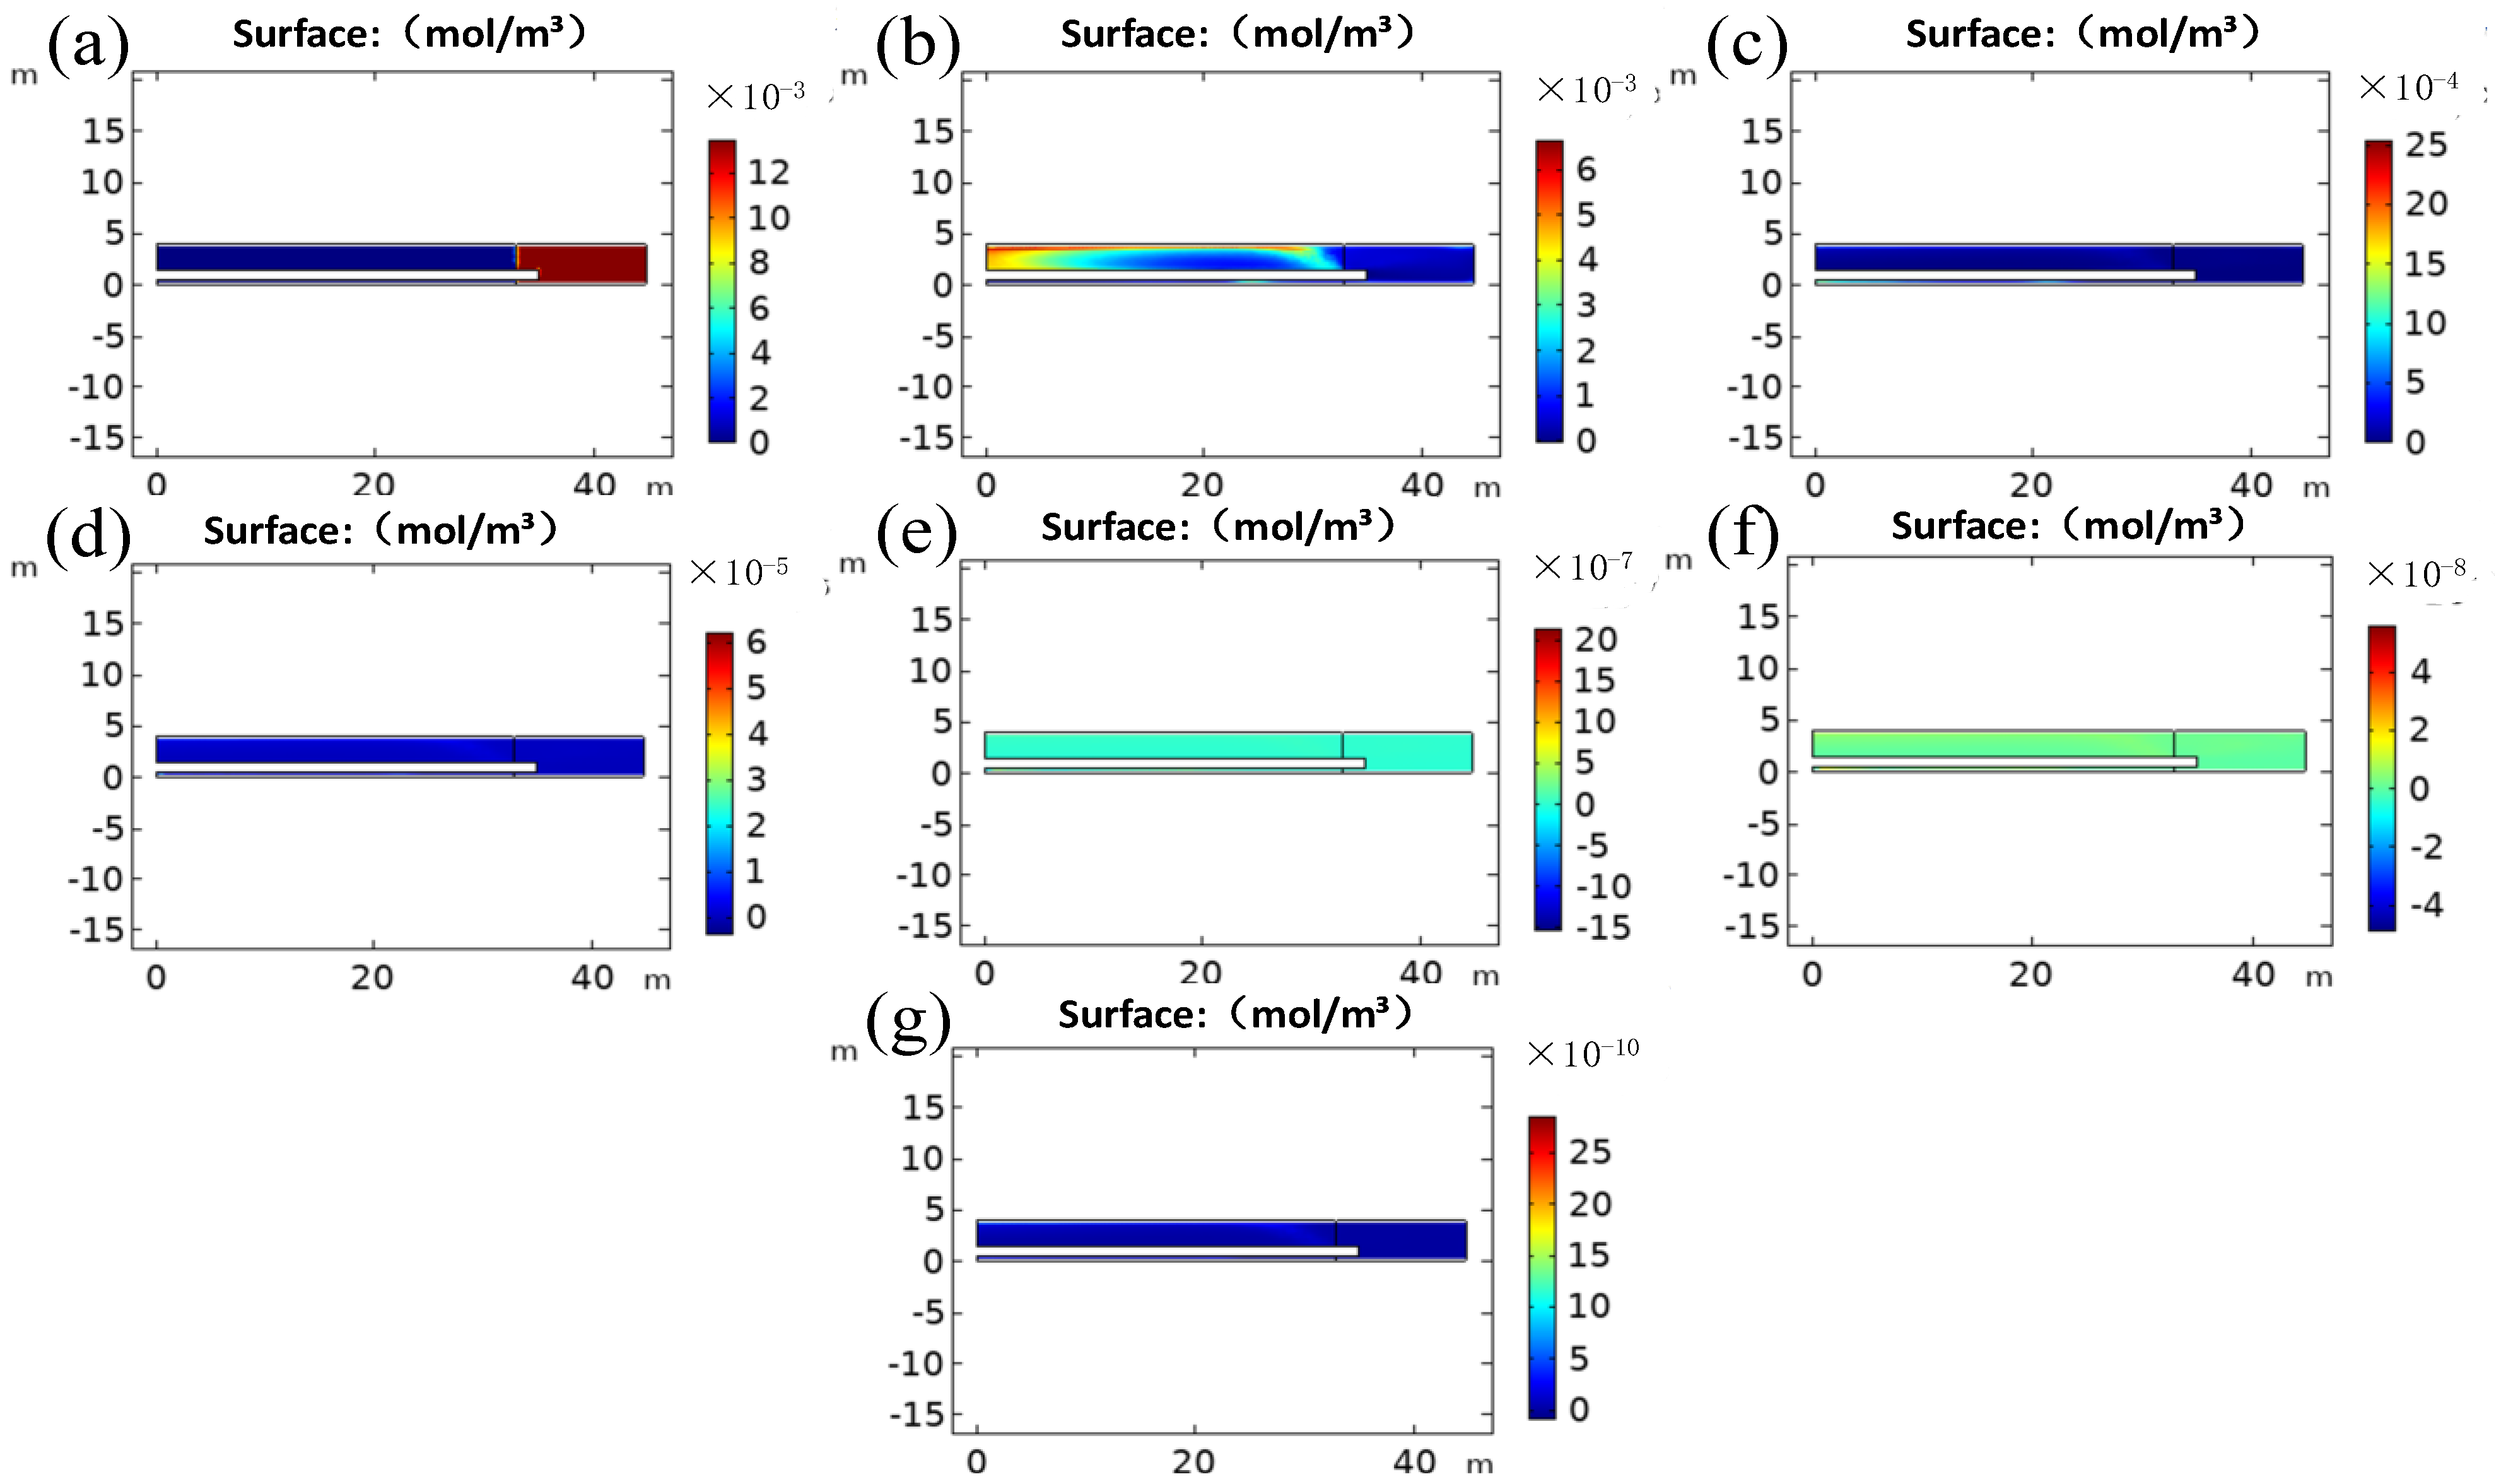
3.2. Change Law of Polluting Gas under the Action of the Wind Field

After the simulation calculation was completed and the conclusions drawn from the simulation were verified to be reliable, the migration law of the polluting gas in the roadway under the action of the wind field was studied. The carbon monoxide gas component was added to the simulation for transient research. Lines 1, 5, 10 and 15 are shown in Figure 10. The concentration field was the lowest at 15 min. It can be seen that the pollutant gas was reduced by the air flow of the roadway, and the pollutant gas was essentially discharged 15 min later. Because of the eddy current in the wind field, the pollutants in the left- and right-hand corners of the roadway were not easily spread, and the flow of the pollutant gas in the 25 m plane tended to be stable.
In order to analyze the change in the concentration of the polluting gas in the section, it was necessary to study the distribution of the concentration of each section of the roadway. The distribution of concentration at 1, 3, 6, 9, 12, and 15 min in a plane with a length of 40 m was selected, as shown in Figure 11. The overall concentration of polluting gas in this section was low at 12 to 15 min, and the concentration of polluting gas increased significantly after 15 min. The concentration of pollutant gas at the top of the section was the highest, followed by the two sides. The concentration of the pollutant gas at the top and the two sides of the section was always higher than that in the middle, and the concentration of pollutant gas in the middle was the lowest.
The distribution of concentration at 0, 1, 3, 6, 9, 12 and 15 min in the plane with a width of 2 m is shown in Figure 12. The concentration of polluting gas in the upper part of this section was the highest compared with other parts, and the concentration changed significantly in the first 3 min. The concentration of polluting gas in the upper part of this section was clearly higher than that in other parts at 0–20 m. The concentration of polluting gas in the upper part of this section was still the highest at 20–40 m, and the difference was smaller than that at 0–20 m. As the time increased, the overall concentration of pollutant gas decreased and the difference in the local concentration decreased.
The distribution of concentration at 0, 1, 3, 6, 9, 12 and 15 min in the plane with a height of 2 m is shown in Figure 13. The concentration of pollutant gas generally decreased. The concentration of polluting gas at the inlet and upper part of this section was relatively high. Similarly, the concentration changed significantly in the first three minutes. The concentration field at 25 m tended to be stable. The concentration of polluting gas decreased with time. After 15 min, the concentration could be ignored, and the polluting gas had largely emptied.
On the basis of the distribution of concentration shown in Figure 10, Figure 11, Figure 12 and Figure 13, it can be seen that the concentration of carbon monoxide moved with the ventilation, and the highest concentration of polluting gas appeared in the upper part of the roadway. Turbulence in the concentration field at the length of 40 m made it difficult for pollutants in the left- and right-hand corners of the roadway to diffuse and ventilate. The concentration field at a length of 25 m tended to be stable. This plane was selected as the detection surface for the concentration of polluting gases, and the concentration values of polluting gases on this plane were collected to provide an effective scientific basis for predicting the concentration of polluting gases in subsequent sections.
According to the actual parameters of the tunnel, the geometric model was established and the grid was divided. A numerical simulation of the wind field and pollutant concentration field in the tunnel in a turbulent state was conducted to establish a simulation model. The results showed that when the air flow moved to the front face of the tunnel, it produced a backflow to form an air flow vortex that rotated counterclockwise. When the carbon monoxide gas molecules were within the range of the turbulence, they moved irregularly with the wind field, which was not conducive to the diffusion of pollutants and was prone to the accumulation of polluting gases. The whole wind field tended to be stable at the plane 25 m from the tunnel’s outlet. Pollutant gas diffused and migrated under the action of the wind field. Because the wind speed at the vent pipe orifice was the greatest and was the first to contact the pollutant gas, the concentration of gas was initially diluted. Turbulence in the wind field made it difficult for pollutants in the left- and right-hand corners of the roadway to diffuse.
According to this study, the results of the numerical CFD simulation model established by using the gas flow field data of the tunnel could be improved in the future to improve the ventilation facilities in the tunnel, and the measure of adding ventilation pipes are also to be preferred.

4. Conclusions

This study simulated the concentration migration law of pollutants in the roadway. The main conclusions are as follows:
(1)
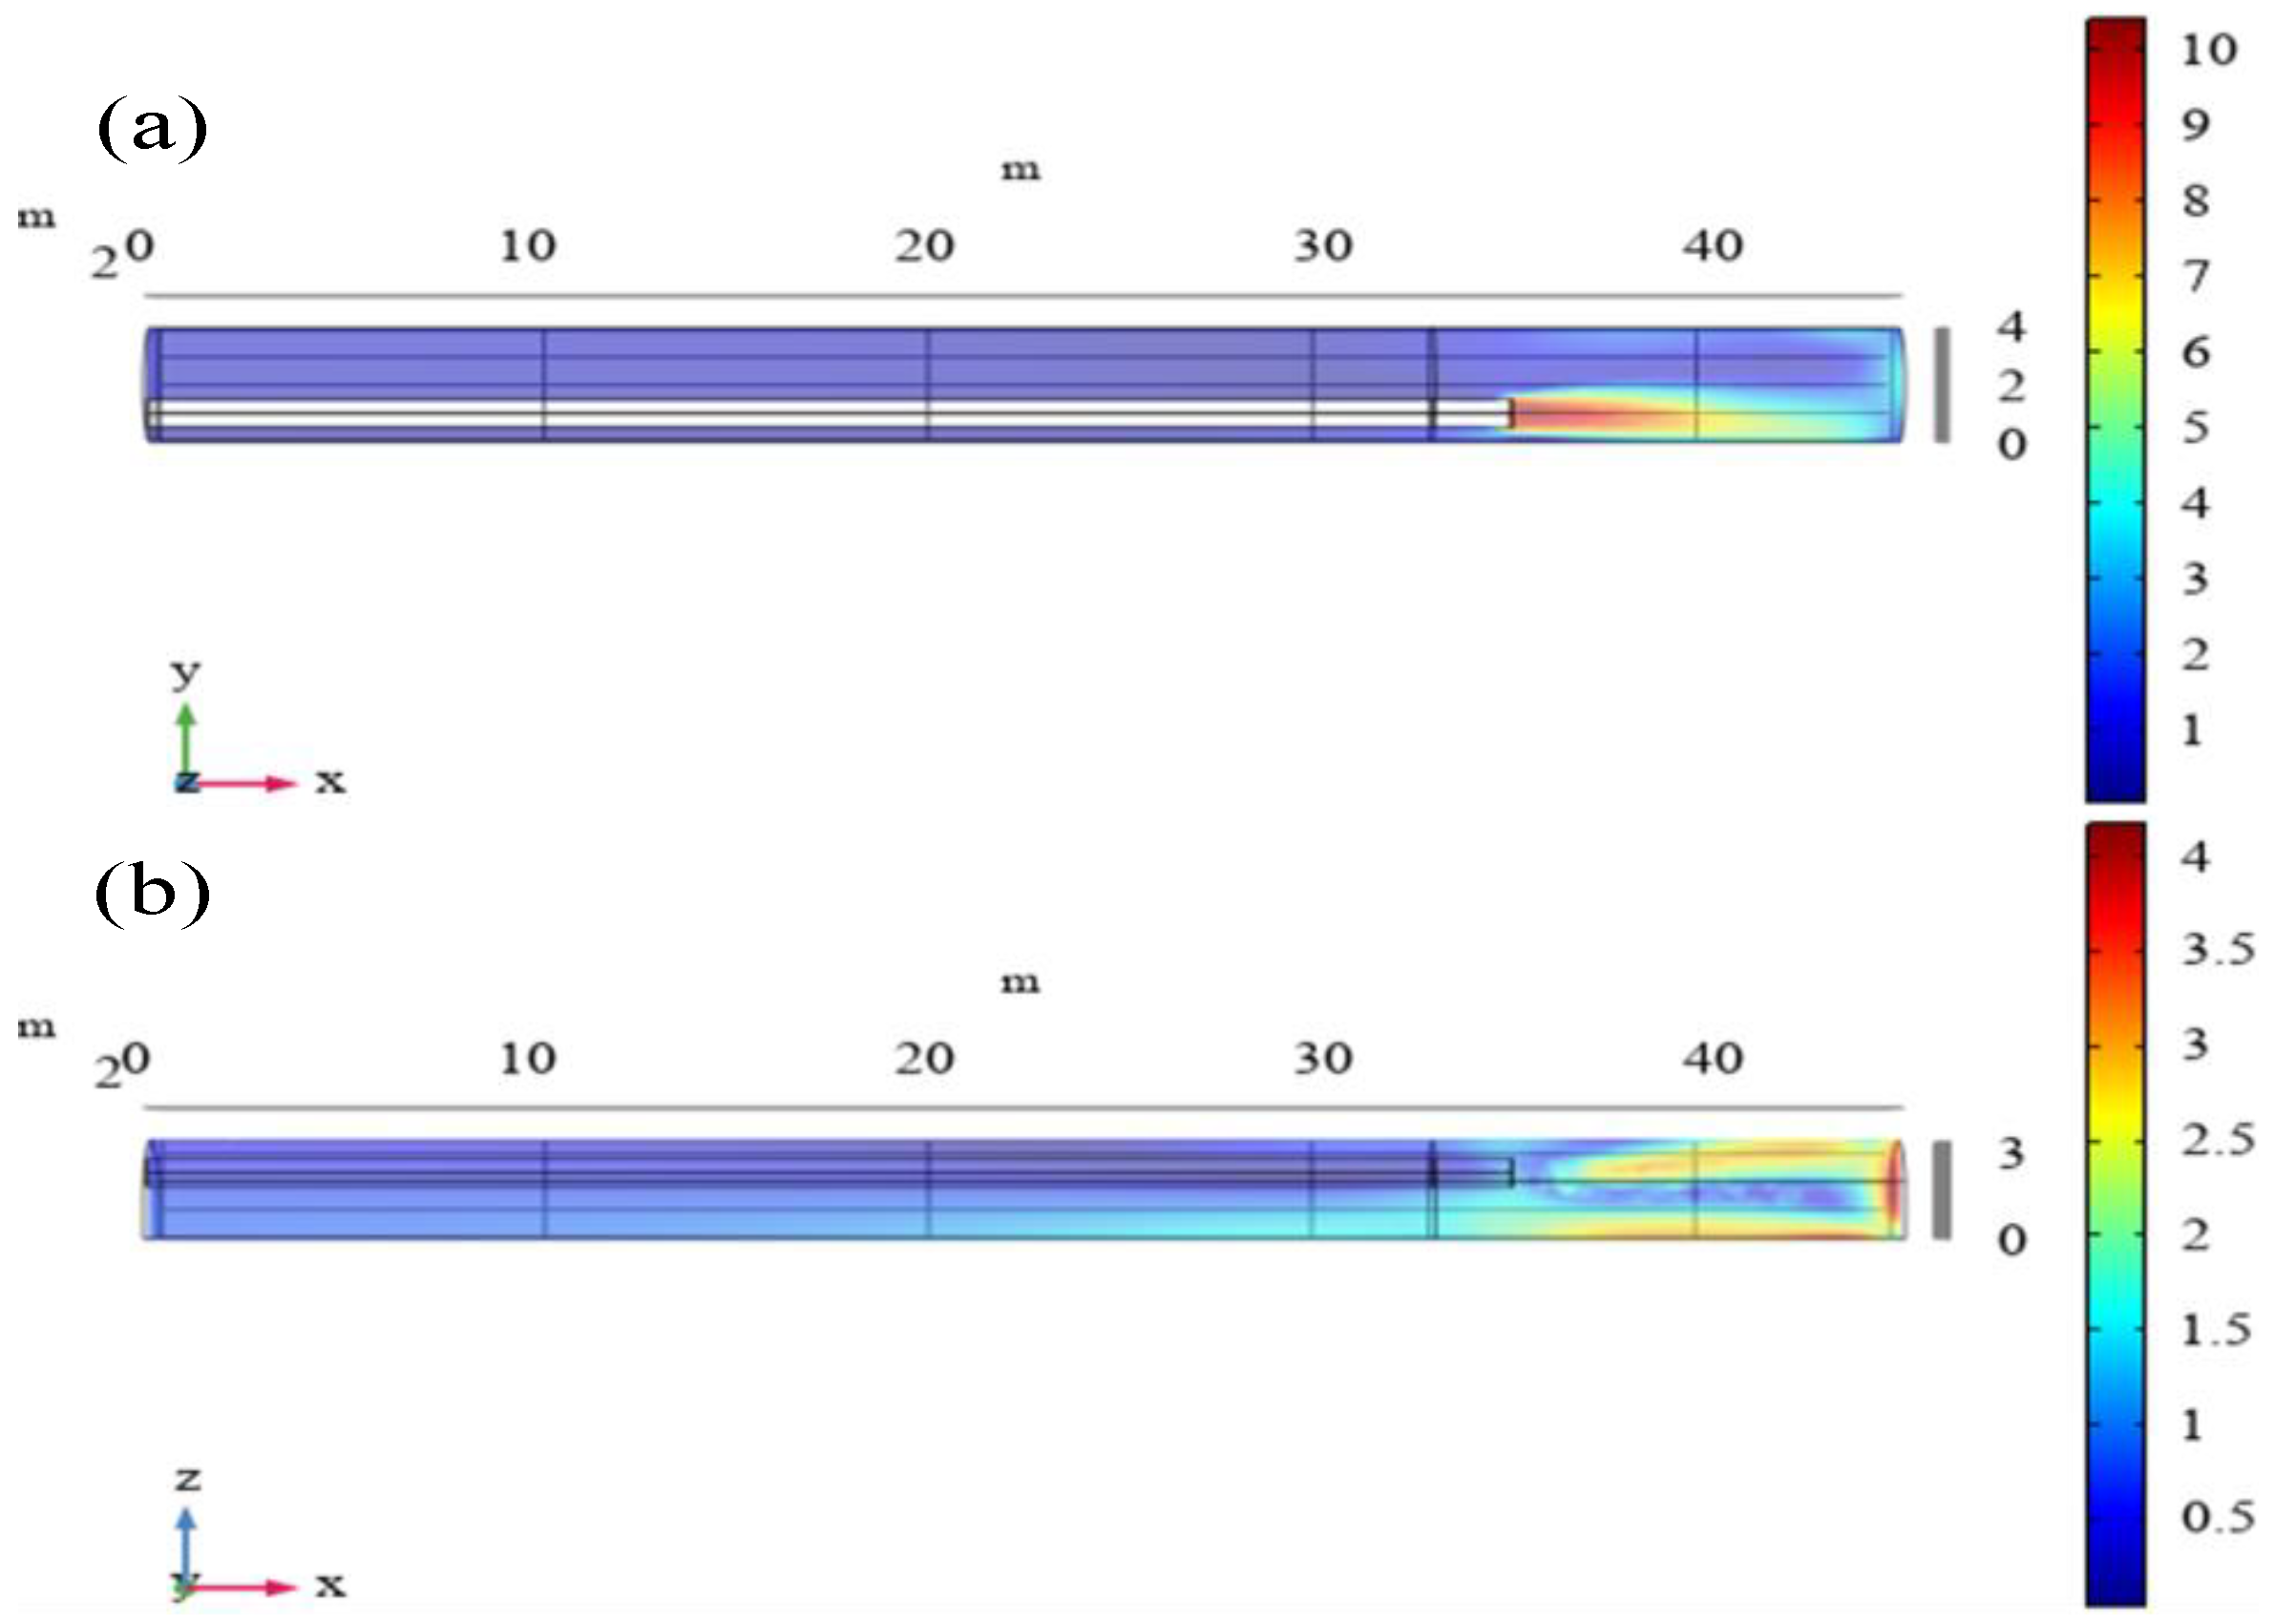
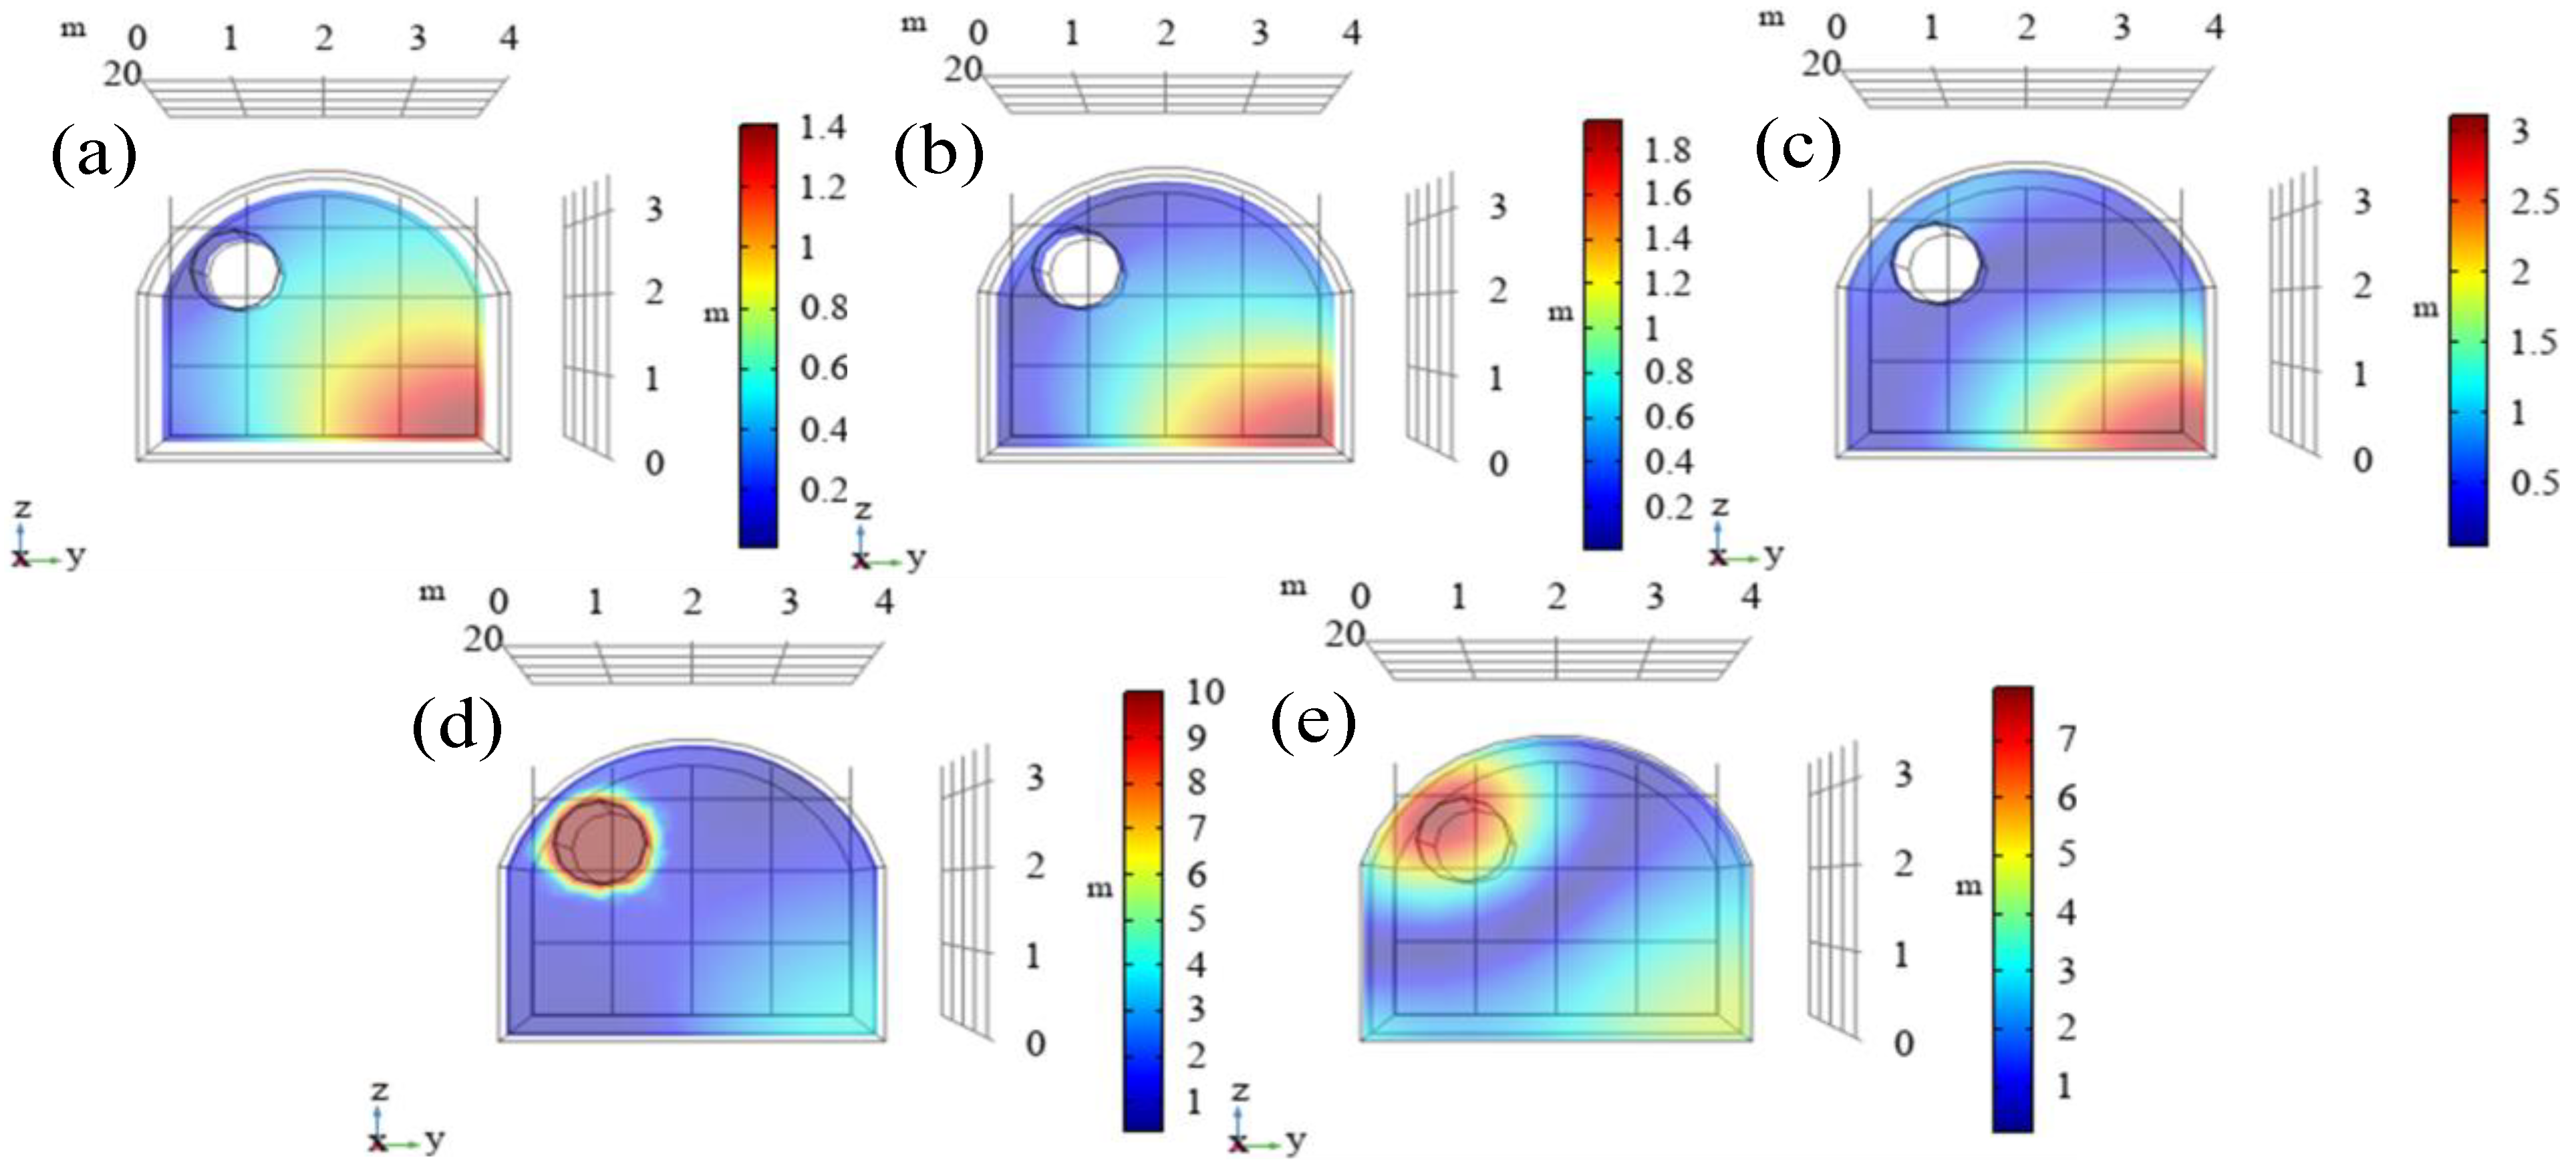
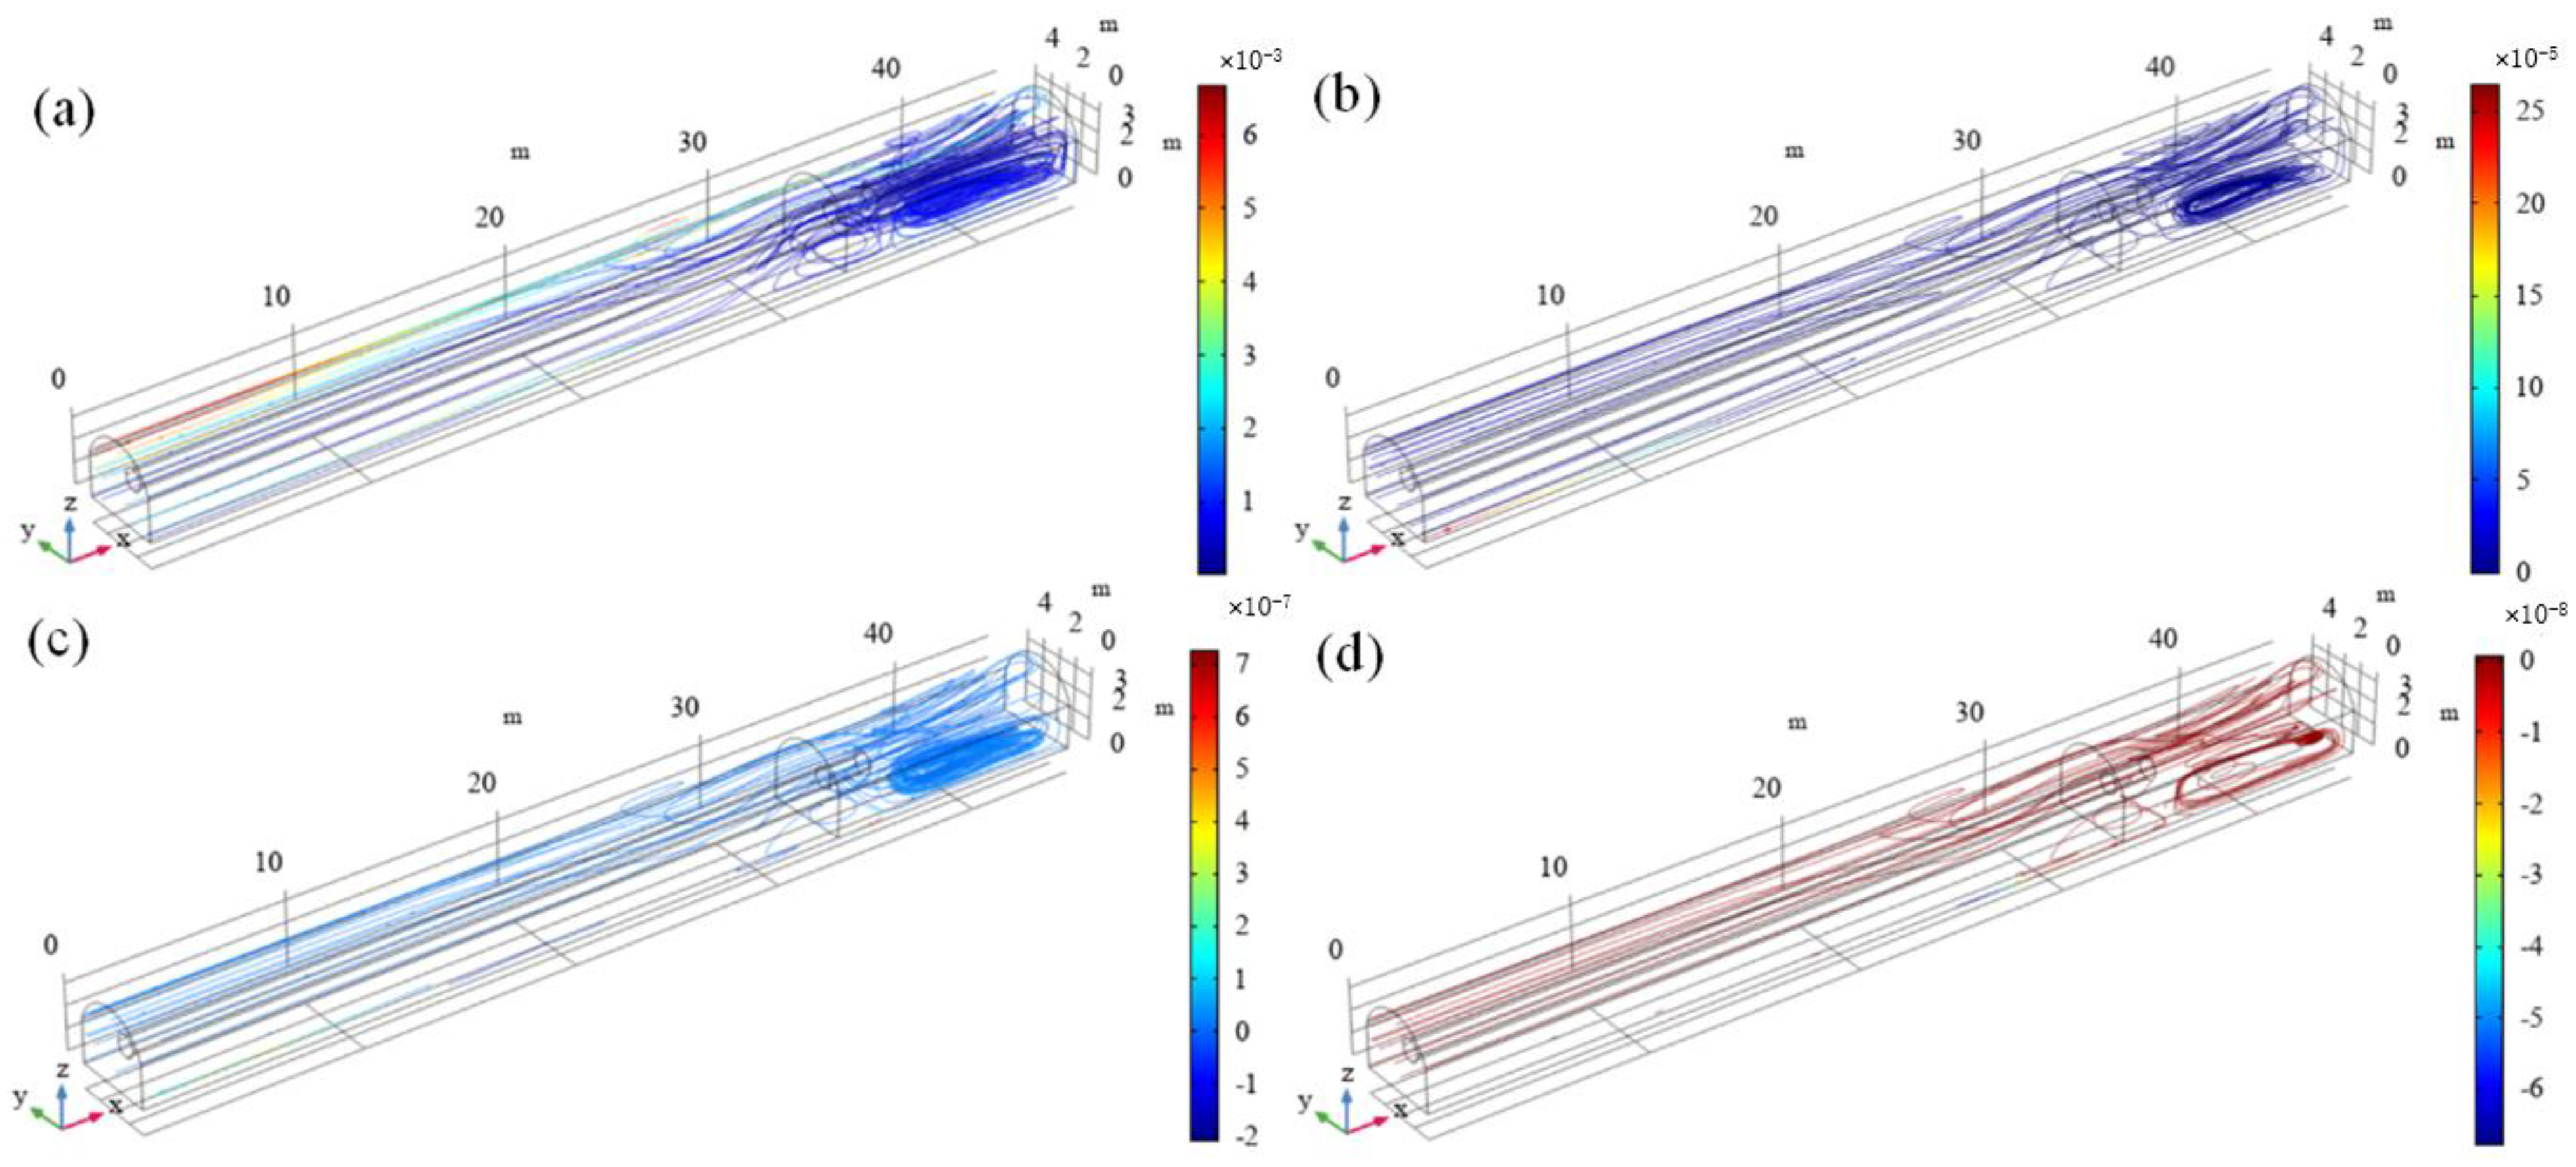
The simulated results of the wind field and pollutant concentration field in the actual roadway in a turbulence state produced by COMSOL software were as follows. When the air flow moved to the front face of the roadway, it was easy to generate a reverse flow to form an air flow vortex, where the air flow was stagnant. When the pollutant gas molecules came within range of the vortex, they rotated with the wind field, which was not conducive to the diffusion of pollutants, leading to the accumulation of pollutant gas. The whole wind field tended to be stable at the plane 25 m away from the tunnel’s outlet.
(2)
Polluted gas diffused and migrated under the action of the wind field. Because the wind speed at the vent pipe’s orifice was the greatest and was the first to contact the polluting gas, the concentration of gas was initially diluted. The eddy current in the wind field made it difficult for pollutants in the left- and right-hand corners of the roadway to diffuse. The concentration field at 25 m from the roadway’s outlet tended to be stable. This roadway section was representative.
(3)
Scientific methods revealed the migration law and changes in the concentration of the pollutant gas in the roadway. These will play a positive role in future scientific treatment of the accumulation of pollutant gas, the prevention and control of toxic gas in the roadway, and environmental protection.

Author Contributions

Conceptualization, C.X. and G.X.; methodology, C.X.; software, G.X.; validation, Z.C., C.X. and G.X.; formal analysis, C.X.; investigation, G.X.; resources, C.X.; data curation, G.X.; writing—original draft preparation, Z.C.; writing—review and editing, C.X.; visualization, Z.C.; supervision, G.X.; project administration, C.X.; funding acquisition, Z.C. All authors have read and agreed to the published version of the manuscript.

Funding

This research was funded by the Hunan Province Science Foundation, grant number “2021JJ30679”.

Institutional Review Board Statement

Not applicable.

Informed Consent Statement

Not applicable.

Data Availability Statement

Not applicable.

Conflicts of Interest

The authors declare no conflict of interest.

References

  1. MacNeil, J.A.L.; Dimitrakopoulos, R.G. A stochastic optimization formulation for the transition from open pit to underground mining. Optim. Eng. 2017, 18, 793–813. [Google Scholar] [CrossRef]
  2. Shriwas, M.; Pritchard, C. Ventilation Monitoring and Control in Mines. Min. Metall. Explor. 2020, 37, 1015–1021. [Google Scholar] [CrossRef]
  3. Chu, Z.; Dong, K.; Gao, P.; Wang, Y.; Sun, Q. Mine-oriented low-enthalpy geothermal exploitation: A review from spatio-temporal perspective. Energy Convers. Manag. 2021, 237, 114123. [Google Scholar] [CrossRef]
  4. Sadeghi, F.; Monjezi, M.; Jahed Armaghani, D. Evaluation and Optimization of Prediction of Toe that Arises from Mine Blasting Operation Using Various Soft Computing Techniques. Nat. Resour. Res. 2019, 29, 887–903. [Google Scholar] [CrossRef]
  5. Xie, C.; Nguyen, H.; Bui, X.N.; Nguyen, V.T.; Zhou, J. Predicting roof displacement of roadways in underground coal mines using adaptive neuro-fuzzy inference system optimized by various physics-based optimization algorithms. J. Rock Mech. Geotech. Eng. 2021, 13, 1452–1465. [Google Scholar] [CrossRef]
  6. Behraftar, S.; Hossaini, S.M.F.; Bakhtavar, E. MRPN technique for assessment of working risks in underground coal mines. J. Geol. Soc. India 2017, 90, 196–200. [Google Scholar] [CrossRef]
  7. Yan, F.; Li, Z.-J.; Dong, L.-J.; Huang, R.; Cao, R.-H.; Ge, J.; Xu, K.-L. Cloud model-clustering analysis based evaluation for ventilation system of underground metal mine in alpine region. J. Cent. South Univ. 2021, 28, 796–815. [Google Scholar] [CrossRef]
  8. Dudzińska, A. Sorption properties of hard coals with regard to gases present in the mine atmosphere. J. Earth Sci. 2017, 28, 124–130. [Google Scholar] [CrossRef]
  9. Cao, J.; Xie, C.; Hou, Z. Ecological evaluation of heavy metal pollution in the soil of Pb-Zn mines. Ecotoxicology 2022, 31, 259–270. [Google Scholar] [CrossRef] [PubMed]
  10. Liang, Y.; Zhang, J.; Wang, L.; Luo, H.; Ren, T. Forecasting spontaneous combustion of coal in underground coal mines by index gases: A review. J. Loss Prev. Process Ind. 2019, 57, 208–222. [Google Scholar] [CrossRef]
  11. Zhang, X.; Zou, J. Research on collaborative control technology of coal spontaneous combustion and gas coupling disaster in goaf based on dynamic isolation. Fuel 2022, 321, 124123. [Google Scholar] [CrossRef]
  12. Wang, K.; Jiang, S.; Ma, X.; Hu, L.; Wu, Z.; Shao, H.; Zhang, W.; Pei, X.; Wang, Y. An automatic approach for the control of the airflow volume and concentrations of hazardous gases in coal mine galleries. J. Loss Prev. Process Ind. 2016, 43, 676–687. [Google Scholar] [CrossRef]
  13. Xie, C.; Nguyen, H.; Choi, Y.; Armaghani, D.J. Optimized functional linked neural network for predicting diaphragm wall deflection induced by braced excavations in clays. Geosci. Front. 2022, 13, 101313. [Google Scholar] [CrossRef]
  14. Li, D.; Zhang, J.-F.; Wang, C.-W.; Jiang, F.-X. Propagation patterns of microseismic waves in rock strata during mining: An experimental study. Int. J. Miner. Metall. Mater. 2019, 26, 531–537. [Google Scholar] [CrossRef]
  15. Rey, N.J.; Demers, I.; Bussière, B.; Mbonimpa, M.; Gagnon, M. A geochemical evaluation of a monolayer cover with an elevated water table for the reclamation of the Doyon-Westwood tailings ponds, Canada. Environ. Earth Sci. 2020, 79, 58. [Google Scholar] [CrossRef]
  16. Bakhtavar, E.; Hosseini, S.; Hewage, K.; Sadiq, R. Air Pollution Risk Assessment Using a Hybrid Fuzzy Intelligent Probability-Based Approach: Mine Blasting Dust Impacts. Nat. Resour. Res. 2021, 30, 2607–2627. [Google Scholar] [CrossRef]
  17. Abdollahisharif, J.; Bakhtavar, E.; Nourizadeh, H. Green biocompatible approach to reduce the toxic gases and dust caused by the blasting in surface mining. Environ. Earth Sci. 2016, 75, 1–12. [Google Scholar] [CrossRef]
  18. Zhou, J.; Koopialipoor, M.; Murlidhar, B.R.; Fatemi, S.A.; Tahir, M.M.; Jahed Armaghani, D.; Li, C. Use of Intelligent Methods to Design Effective Pattern Parameters of Mine Blasting to Minimize Flyrock Distance. Nat. Resour. Res. 2019, 29, 625–639. [Google Scholar] [CrossRef]
  19. Kozan, E.; Liu, S.Q. An operational-level multi-stage mine production timetabling model for optimally synchronising drilling, blasting and excavating operations. Int. J. Min. Reclam. Environ. 2016, 31, 457–474. [Google Scholar] [CrossRef]
  20. Wang, F.; Ren, Q.; Chen, B.; Zou, P.; Peng, Z.; Hu, W.; Ma, Z. Numerical Investigation on Safe Mining of Residual Pillar in Goaf: A Case Study of Panlong Lead–Zinc Mine. Geotech. Geol. Eng. 2020, 38, 4269–4287. [Google Scholar] [CrossRef]
  21. Liu, G.; Niu, L.M.; Cao, X.B.; Liu, Y.Y.; Wu, X.Q.; Zhang, X.; Zhang, R.; Li, Y. Study of the occupational health risk of radon exposure in underground workers in a mine. J. Radiat. Res. Appl. Sci. 2022, 15, 1–4. [Google Scholar] [CrossRef]
  22. Pronost, G.; Ikeda, M.; Nakamura, T.; Sekiya, H.; Tasaka, S. Development of new radon monitoring systems in the Kamioka mine. Prog. Theor. Exp. Phys. 2018, 9, 093H01. [Google Scholar] [CrossRef]
  23. Szlązak, N.; Obracaj, D.; Korzec, M. Influence of applying additional forcing fans for the air disteibution in ventilation network. Manag. Syst. 2016, 23, 163–171. [Google Scholar]
  24. De Souza, E. Application of ventilation management programs for improved mine safety. Int. J. Min. Sci. Technol. 2017, 27, 647–650. [Google Scholar] [CrossRef]
  25. Wang, Y.; Du, C.; Xu, H. Key Factor Analysis and Model Establishment of Blasting Dust Diffusion in a Deep, Sunken Open-Pit Mine. ACS Omega 2021, 6, 448–455. [Google Scholar] [CrossRef]
  26. Harris, M.L.; Mainiero, R.J. Monitoring and removal of CO in blasting operations. Saf. Sci. 2008, 46, 1393–1405. [Google Scholar] [CrossRef]
  27. Rudakov, M.; Babkin, R.; Medova, E. Improvement of Working Conditions of Mining Workers by Reducing Nitrogen Oxide Emissions during Blasting Operations. Appl. Sci. 2021, 11, 9969. [Google Scholar] [CrossRef]
  28. Adhikari, A.; Jayaraman Sridharan, S.; Tukkaraja, P.; Sasmito, A.; Vytla, S. The Effect of Trapped Fumes on Clearance Time in Underground Development Blasting. Min. Metall. Explor. 2022, 39, 1811–1820. [Google Scholar] [CrossRef]
  29. Prakash, S.A.; Hariharan, C.; Arivazhagan, R.; Sheeja, R.; Raj, V.A.A.; Velraj, R. Review on numerical algorithms for melting and solidification studies and their implementation in general purpose computational fluid dynamic software. J. Energy Storage 2021, 36, 102341. [Google Scholar] [CrossRef]
  30. Feng, X.; Jiang, Z.; Zhang, G.; Luo, X.; Zeng, F. Study on CO diffusion law and concentration distribution function under ventilation after blasting in high-altitude tunnel. J. Wind. Eng. Ind. Aerodyn. 2022, 220, 104871. [Google Scholar] [CrossRef]
  31. Xie, Z.; Xiao, Y.; Jiang, C.; Ren, Z.; Li, X.; Yu, K. Numerical study on fine dust pollution characteristics under various ventilation time in metro tunnel after blasting. Build. Environ. 2021, 204, 108111. [Google Scholar] [CrossRef]
  32. Torno, S.; Toraño, J. On the prediction of toxic fumes from underground blasting operations and dilution ventilation. Conventional and numerical models. Tunn. Undergr. Space Technol. 2020, 96, 103194. [Google Scholar] [CrossRef]
  33. Sa, Z.; Li, F.; Qin, B.; Pan, X. Numerical simulation study of dust concentration distribution regularity in cavern stope. Saf. Sci. 2012, 50, 857–860. [Google Scholar] [CrossRef]
  34. Huang, R.; Shen, X.; Wang, B.; Liao, X. Migration characteristics of CO under forced ventilation after excavation roadway blasting: A case study in a plateau mine. J. Clean. Prod. 2020, 267, 122094. [Google Scholar] [CrossRef]
  35. Xie, Z.; Xiao, Y.; Zhao, Q.; Lin, J. Transient analysis of dust exposure under different supply airflow angle in a blasting tunnel based on CFD. Energy Rep. 2022, 8, 45–52. [Google Scholar] [CrossRef]
  36. Wang, Z.; Zhou, W.; Jiskani, I.M.; Luo, H.; Ao, Z.; Mvula, E.M. Annual dust pollution characteristics and its prevention and control for environmental protection in surface mines. Sci. Total Environ. 2022, 825, 153949. [Google Scholar] [CrossRef]
  37. Lee, S.-C.; Lee, S.; Lee, J. CFD analysis on ventilation characteristics of jet fan with different pitch angle. KSCE J. Civ. Eng. 2014, 18, 812–818. [Google Scholar] [CrossRef]
  38. Bubbico, R.; Mazzarotta, B.; Verdone, N. CFD analysis of the dispersion of toxic materials in road tunnels. J. Loss Prev. Process Ind. 2014, 28, 47–59. [Google Scholar] [CrossRef]
  39. Chang, P.; Xu, G.; Zhou, F.; Mullins, B.; Abishek, S.; Chalmers, D. Minimizing DPM pollution in an underground mine by optimizing auxiliary ventilation systems using CFD. Tunn. Undergr. Space Technol. Inc. Trenchless Technol. Res. 2019, 87, 112–121. [Google Scholar] [CrossRef]
  40. Menendez, J.; Merle, N.; Fernandez-Oro, J.M.; Galdo, M.; de Prado, L.A.; Loredo, J.; Bernardo-Sanchez, A. Concentration, Propagation and Dilution of Toxic Gases in Underground Excavations under Different Ventilation Modes. Int. J. Environ. Res. Public Health 2022, 19, 7092. [Google Scholar] [CrossRef]
  41. Cui, P.; Yao, B.; Liu, Y.; Wei, J.; Wen, Z.; Li, H. A New Width Measurement Method of the Stress Relief Zone on Roadway Surrounding Rocks. Geofluids 2019, 2019, 1–12. [Google Scholar] [CrossRef]
  42. Nie, W.; Liu, X.; Liu, C.; Guo, L.; Hua, Y. Prediction of dispersion behavior of typical exhaust pollutants from hydraulic support transporters based on numerical simulation. Environ. Sci. Pollut. Res. Int. 2022, 29, 38110–38125. [Google Scholar] [CrossRef] [PubMed]
  43. Xu, C.; Han, L. Quality evaluation method of water isolating curtain in roadway of Gushan Iron Mine and its application. Arab. J. Geosci. 2021, 14, 1–10. [Google Scholar] [CrossRef]
  44. Houda, S.; Belarbi, R.; Zemmouri, N. A CFD Comsol model for simulating complex urban flow. Energy Procedia 2017, 139, 373–378. [Google Scholar] [CrossRef]
  45. Zhou, Y.; Yang, D.; Tang, M. Multiple hydraulic fractures growth from a highly deviated well: A XFEM study. J. Pet. Sci. Eng. 2022, 208, 109709. [Google Scholar] [CrossRef]
  46. Guo, Y.; Wang, M. Thermodynamic analysis of gas flow and heat transfer in microchannels. Int. J. Heat Mass Transf. 2016, 103, 773–782. [Google Scholar] [CrossRef]
Figure 1. Cartesian coordinate diagram of gas transport at a unit point.
Sustainability 14 13349 g001
Figure 2. Location of the study site within China (a) and within Hengdong (b). Image of the roadway (c).
Sustainability 14 13349 g002
Figure 3. Diagram of the 3D geometric model diagram (a) and X-axial geometry diagram (b) of the roadway.
Sustainability 14 13349 g003
Figure 4. Diagram of the 3D roadway grid (a) and the side view of the grid (b).
Sustainability 14 13349 g004
Figure 5. Convergence diagram produced by COMSOL software.
Sustainability 14 13349 g005
Figure 6. Locations of the detection points in the roadway (a) and image of a monitoring point (b).
Sustainability 14 13349 g006
Figure 7. The k distance diagram of the LOF algorithm.
Sustainability 14 13349 g007
Figure 8. The height of the wind speed plane is 2.2 m (a) and the width of the wind speed plane is 2 m (b).
Sustainability 14 13349 g008
Figure 9. Planar wind speed diagrams for lengths of (a) 10 m, (b) 20 m, (c) 30 m, (d) 35 m and (e) 40 m.
Sustainability 14 13349 g009
Figure 10. Streamlines of the concentration field at (a) 1, (b) 5, (c) 10 and (d) 15 min.
Sustainability 14 13349 g010
Figure 11. Distribution of the concentration at 1 (a), 3 (b), 6 (c), 9 (d), 12 (e) and 15 (f) min in a plane with a length of 40 m.
Sustainability 14 13349 g011
Figure 12. Distribution map of concentration in a plane with a width of 2 m at (a) 0, (b) 1, (c) 3, (d) 6, (e) 9, (f) 12 and (g) 15 min.
Sustainability 14 13349 g012
Figure 13. Distribution map of concentration in a plane with a height of 2.5 m at (a) 0, (b) 1, (c) 3, (d) 6, (e) 9, (f) 12 and (g) 15 min.
Sustainability 14 13349 g013
Table 1. Wind speed and wind temperature data measured in the roadway.
DataWind SpeedWind Temperature
Serial Number
10.700.800.810.850.710.790.830.830.8719.3
0.830.790.850.830.800.860.840.850.80
20.941.031.121.201.181.211.301.251.2119.3
1.221.281.251.301.261.231.231.211.23
31.201.211.251.221.221.311.211.331.3119.0
1.301.211.271.361.341.311.281.331.39
1′0.430.490.490.460.450.450.470.460.4520.4
0.440.400.420.450.460.510.520.530.52
2′0.660.640.630.640.650.630.650.630.6620.2
0.660.650.610.620.610.660.690.670.65
3′1.050.980.550.490.530.500.500.520.5519.8
1.100.460.410.480.470.490.460.530.46
Publisher’s Note: MDPI stays neutral with regard to jurisdictional claims in published maps and institutional affiliations.

