Article

Destruction Characteristics and Control Countermeasure of Shaft Surrounding Rock Mass in Complex Geological Environment

Deep Mining Laboratory of Shandong Gold Group Co., Ltd., Laizhou 261442, China
*
Author to whom correspondence should be addressed.
Sustainability 2022, 14(20), 13329; https://doi.org/10.3390/su142013329
Submission received: 30 August 2022 / Revised: 29 September 2022 / Accepted: 11 October 2022 / Published: 17 October 2022

Abstract

:
Increasing construction depth, changeable failure formations, and redistributed stress conditions inevitably make the mechanical response of mining shaft rock mass complicated. The design method and construction technology of deep shaft need to be perfected urgently. We studied the stability and control method of a main shaft from −930 m located in a deep gold mine. It is concluded that the surrounding rock of the shaft faces conditions including non-high-stressed, high-stressed, and possible instabilities. The failure types include structural plane-controlled failure, deep stress induced failure, rock burst, low confining pressure shear failure, spalling, and frequent conversion of multiple failure. The damages of the surrounding rock mass at −930~−1500 m displayed “ear-shaped” damage, with damage ranges of less than 2.5 m. The shaft temporary reinforcement adopted bolt mResh beam support, in which the length of the bolt was 2.5~3 m, and the row spacing was 1.5 m. The steel type and diameter were determined by the on-site bolt pull test. This temporary support countermeasure plays an important role in preventing shaft deformation and is worth promoting in similar mines.

1. Introduction

The utilization of deep mineral resources has become an inevitable trend in the development of the world’s mining industry [1,2]. In order to mine deep mineral resources safely and efficiently, it is necessary to dig a deep shaft from the surface to the deep ore body [3,4]. At present, there are more than 200 mines with a depth of more than 1000 m in the world; some deep mining shafts have been constructed close to 3000 m [5,6]. The South Deep Mine in South Africa built a 2995 m ventilation shaft [7,8]. The depth of the #10 shaft of Resolution Copper Mine in the United States is 2117 m [9,10]. The depth of the #4 shaft of Lucky Friday zinc mine in the United States is 2922 m [11,12]. The depth of the shaft bottom of the Kidd Creek Mine in Canada is 3014 m [13,14].
With the improvement of deep mineral resource exploration technology, there are more deep vertical shafts being constructed in China’s underground mines [15]. The number of shafts with a depth of more than 1000 m exceeds 30, and most of them are within 1200 m [16,17]. For example, the main shaft of Angang Gongchangling Iron Mine has a depth of 1022 m, the depth of the new auxiliary shaft of the Chengchao Iron Mine of Wuhan Iron and Steel Co., Ltd. is 1135 m, the main shaft of Tongling Nonferrous Dongguashan Copper Mine is 1125 m, the depth of the mixing shaft in the Dongfeng mine field of Linglong Gold Mine is 1018 m, and the depth of the mixed shaft of Jinchuan Longshou Mine is 1083 m [18,19,20]. It can be seen from the above statistics that the construction depth of vertical shafts in China will reach the range of 1500~2000 m in the next 5~10 years.
The shaft is the throat of the underground mine production system. It is the major infrastructure project for underground mine construction. From the 1980s to the present, more than 200 shafts have been deformed and damaged. Many shafts have been damaged and repaired many times, and they are still unable to maintain stability [21,22,23]. The direct economic loss caused by the damage and repair of shafts is more than hundreds of millions of USD. Compared with shallow-buried shafts, the geological conditions and stress states of deep shafts are obviously different. Especially under the action of strong excavation and unloading, the force state of the deep shaft is more complicated: (1) The surrounding rock mass of the shaft is under the combined action of complex factors, including the plateau rock mass stress, the high-water pressure, the strong excavation unloading, the high rock mass temperature, and the vibration load [24,25]. (2) Under the comprehensive actions of high stress and strong excavation unloading, the risk of rock burst in the surrounding rock mass of the deep shaft seriously increases [26]. (3) In order to meet the requirements of ventilation and lifting capacity, a large-section shaft structure is adopted.
With the increase of the construction depth of the shaft, the changeable rock mass formations and stress conditions inevitably make the mechanical response of the shaft more complicated. Whether it is the increase of ground pressure or the deterioration of the geological environment, the safety of the shaft is continuously threatened. At the same time, large dynamic loads, such as blasting from a distance or activation of local faults, may cause large ground vibrations at the shaft or even the failure of shaft support [27,28]. The design method and construction technology of deep shaft engineering need to be changed urgently. For this purpose, firstly, we investigated the geology and physical–mechanical properties of the rock. Secondly, we analyzed the in situ stress distribution and the stress redistribution after the excavation of the shaft. Thirdly, the corresponding support and control strategies were analyzed, and the support parameters were optimized to control the deformation of surrounding rock.

2. Geological Background and Engineering Overview

2.1. Geology and Faults

The main fault in the shaft area is located in the middle section of the Longkou-Laizhou S-shaped fault structure, with a control length of about 2100 m. The fracture width of the fault structure is about 200–420 m, and the overall strike is 40°, inclined to the northwest, with a dip angle of 20–35°. A continuous and stable main fracture surface developed in the center of the main fault, marked by gray-black fault gouge with a thickness of about 5–20 cm. The degree of rock mass fragmentation along the two sides of the main fault surface is gradually weaker.

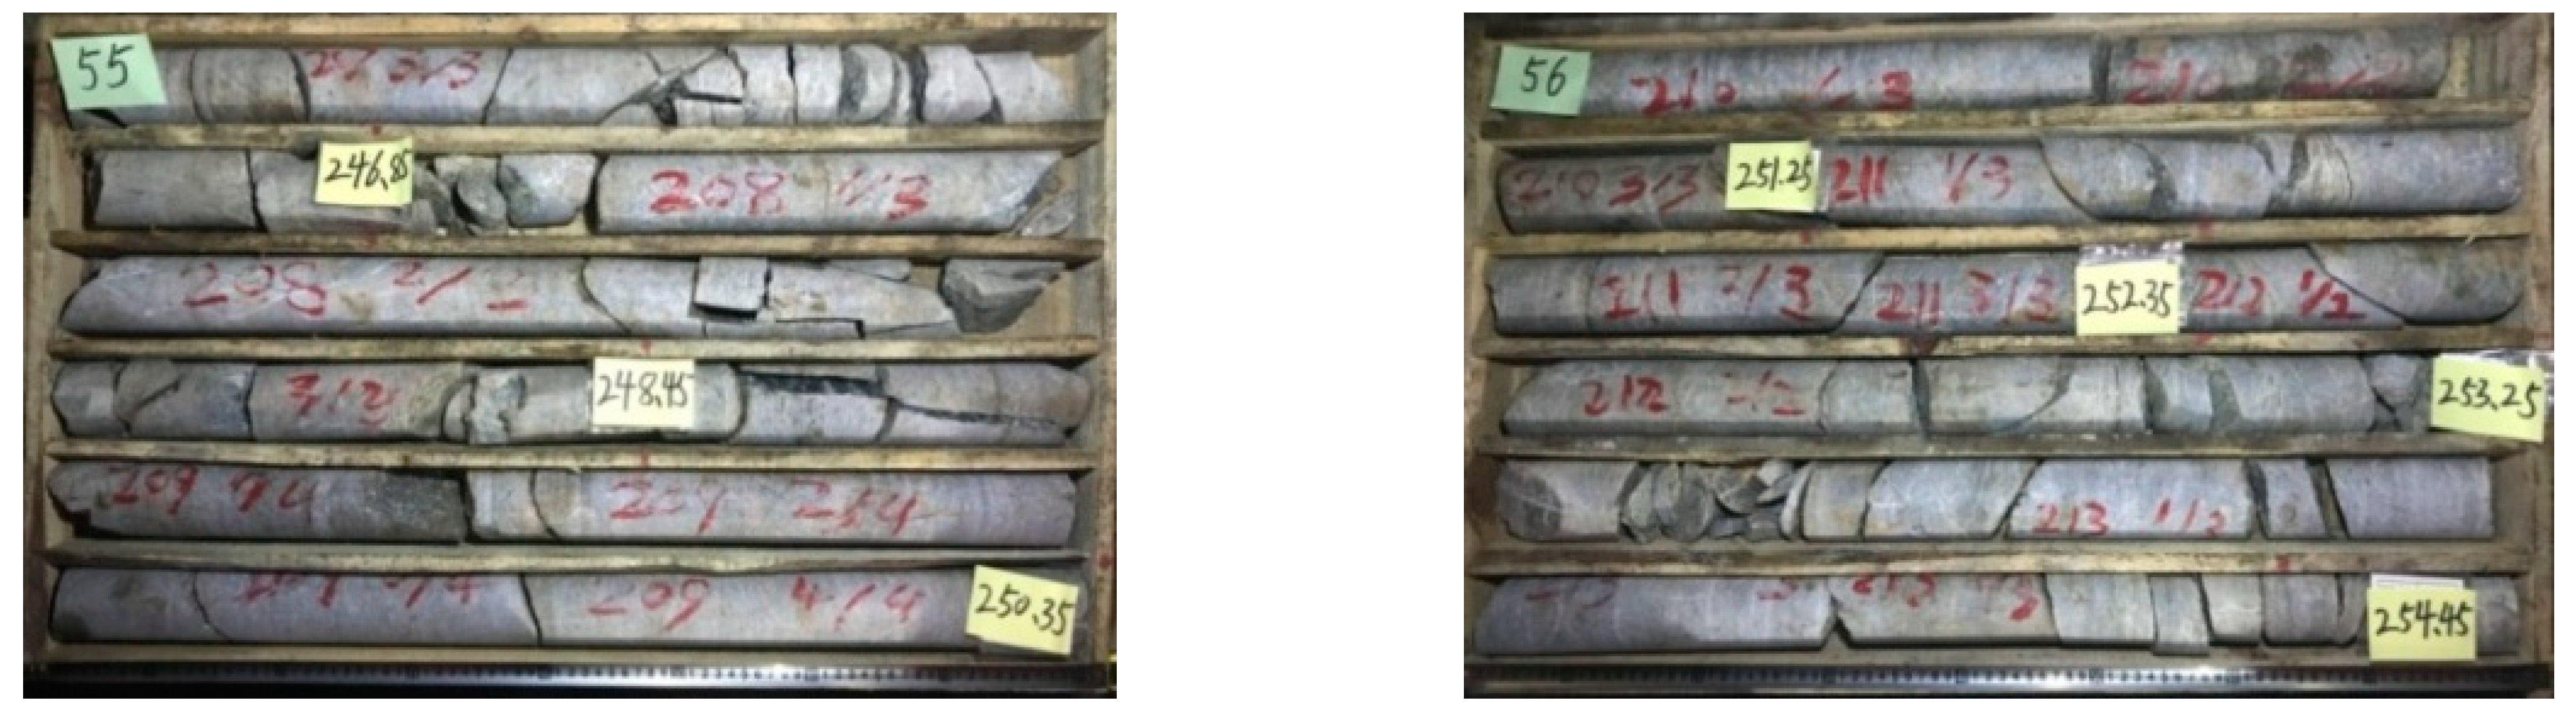
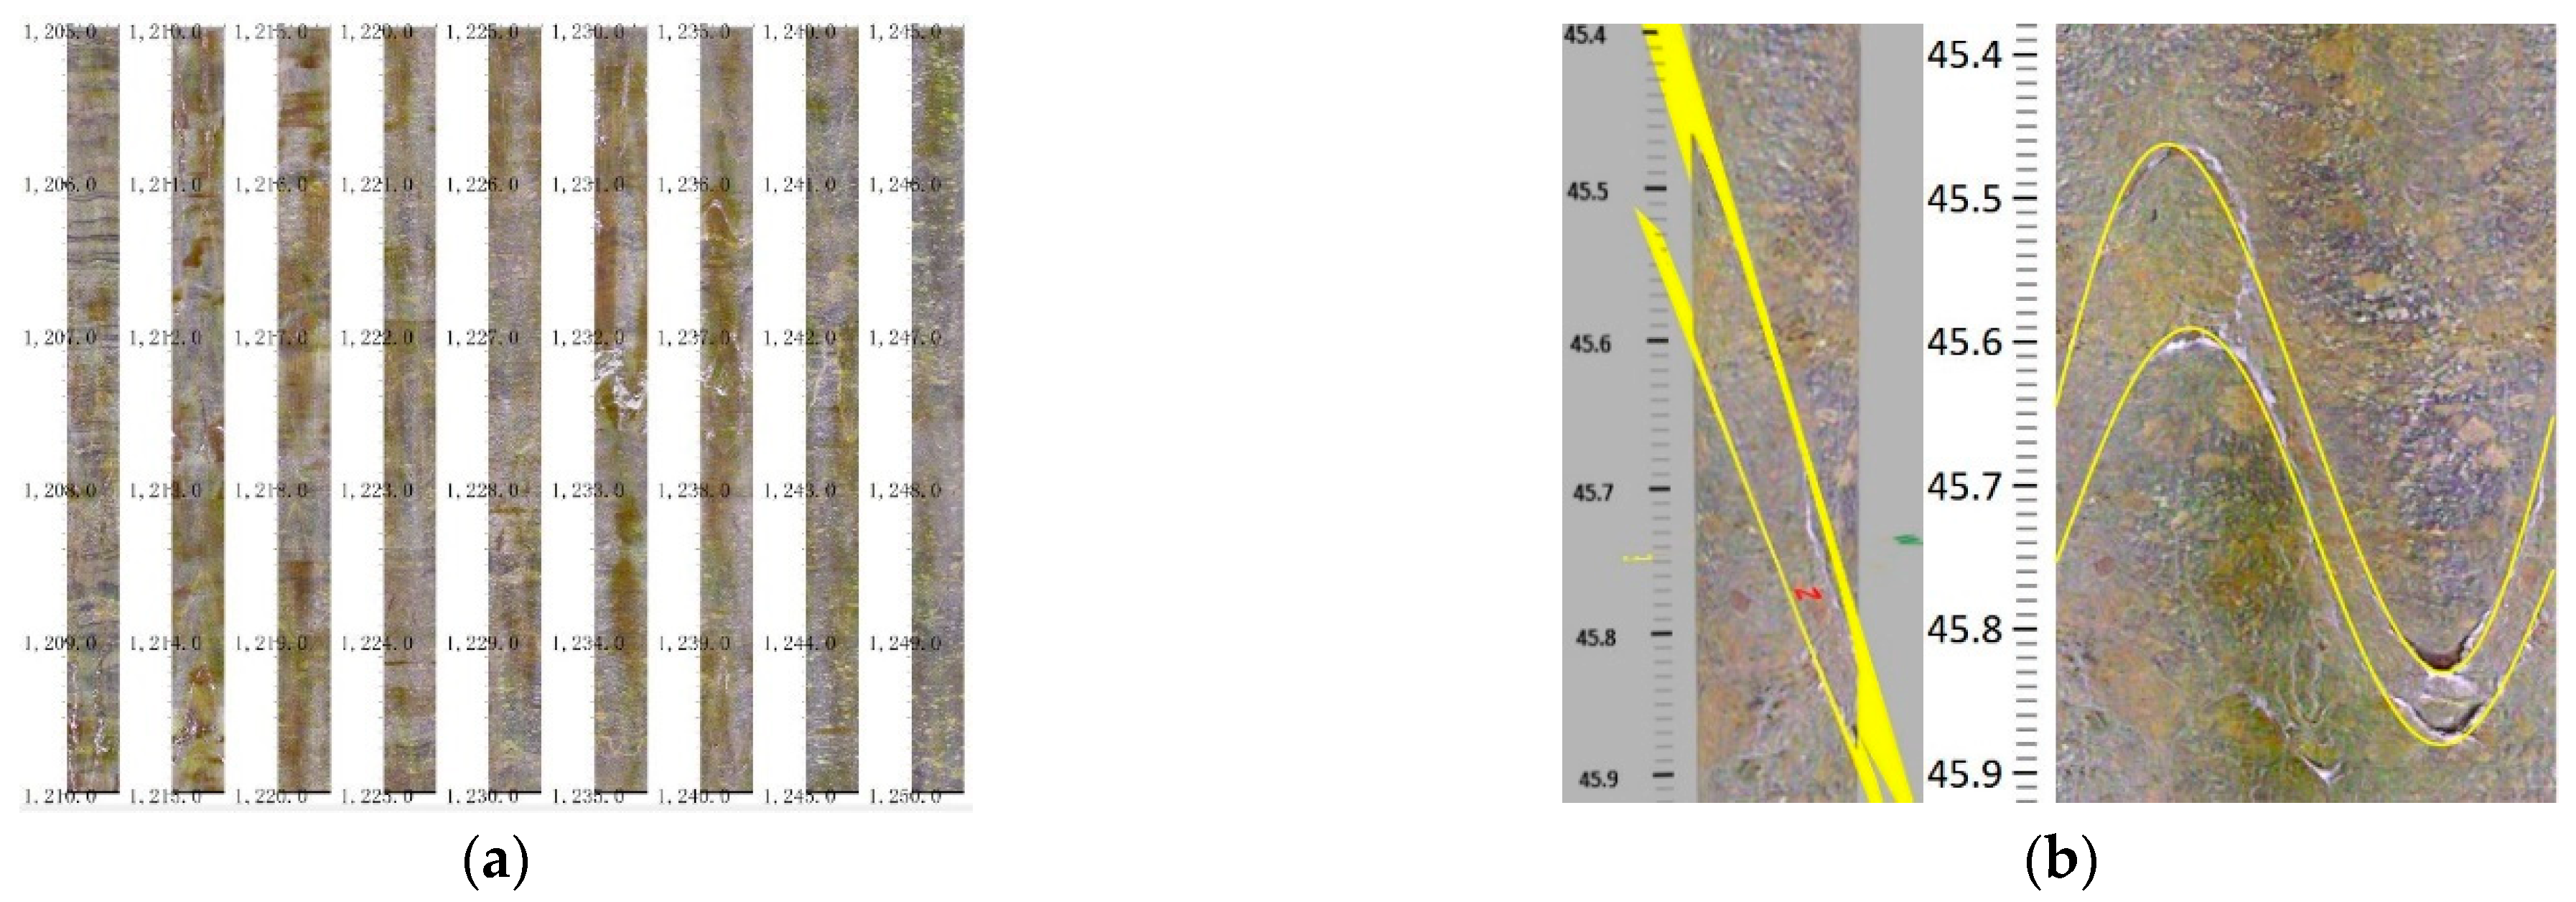
2.2. Rock Mass Quality

Combined with the on-site core survey (Figure 1), it was determined that the surrounding rock mass of the main shaft within the depth range of −930~−1280 m is free of fragmentation. The structural surface is closed without filling, and the particle boundary on the core surface is in close contact. It was comprehensively judged that the surrounding rock mass of the shaft in this depth range is un-weathered. Combining the scoring method of RMR, the rating of rock mass is shown in Table 1. The UCS was obtained on MTS815 in our laboratory, which is a fully integrated high-force test system optimized for carefully controlled characterization of brittle materials. In total, 200 specimens sampled at different depths were used.
We used the GD3Q-GA borehole TV to collect borehole image information (Figure 2a) and used Dips software to process the image information, divide the joint fissures (Figure 2b), and finally obtain the joint occurrence information. The statistical results are listed in Table 2.

2.3. Engineering Overview

The net diameter of the main shaft is 6.7 m with elevation wellhead at +32.9 m. The elevation of the bottom of the well is −1488.1 m, and the depth of the wellbore is 1527 m. The content of the project mainly includes the excavation of the shaft, the development of horizontal road ports, the arrangement of cables, etc. The construction process is shown in Figure 3.

3. Destruction Characteristics

The mechanical response of the surrounding rock mass of the shaft during the construction mainly refers to the redistribution of the in situ stress and the deformation after excavation. In order to obtain the distribution of in situ stress in the +32~−1495 m depth range of the Gold Mine, the distribution law of in situ stress at different depths suitable for different regions in China was obtained by fitting the test results of in situ stress at different depths in different regions. The analysis and control of the stability of the new main shaft of the mine and its surrounding rock provide data support. The principal stress distribution equation can be obtained:
σ H = 0.035 h + 5.231 σ h = 0.021 h + 0.636 σ v = 0.027 h
The in situ stress redistribution of the surrounding rock mass includes the transverse section of the unsupported rock mass, and the stress near the working face of the longitudinal section. The deformation characteristics mainly refer to the radial convergence of the surrounding rock of the shaft. Grasping the stress and deformation characteristics of the surrounding rock mass after excavation can provide important basis for the stability control [29,30].

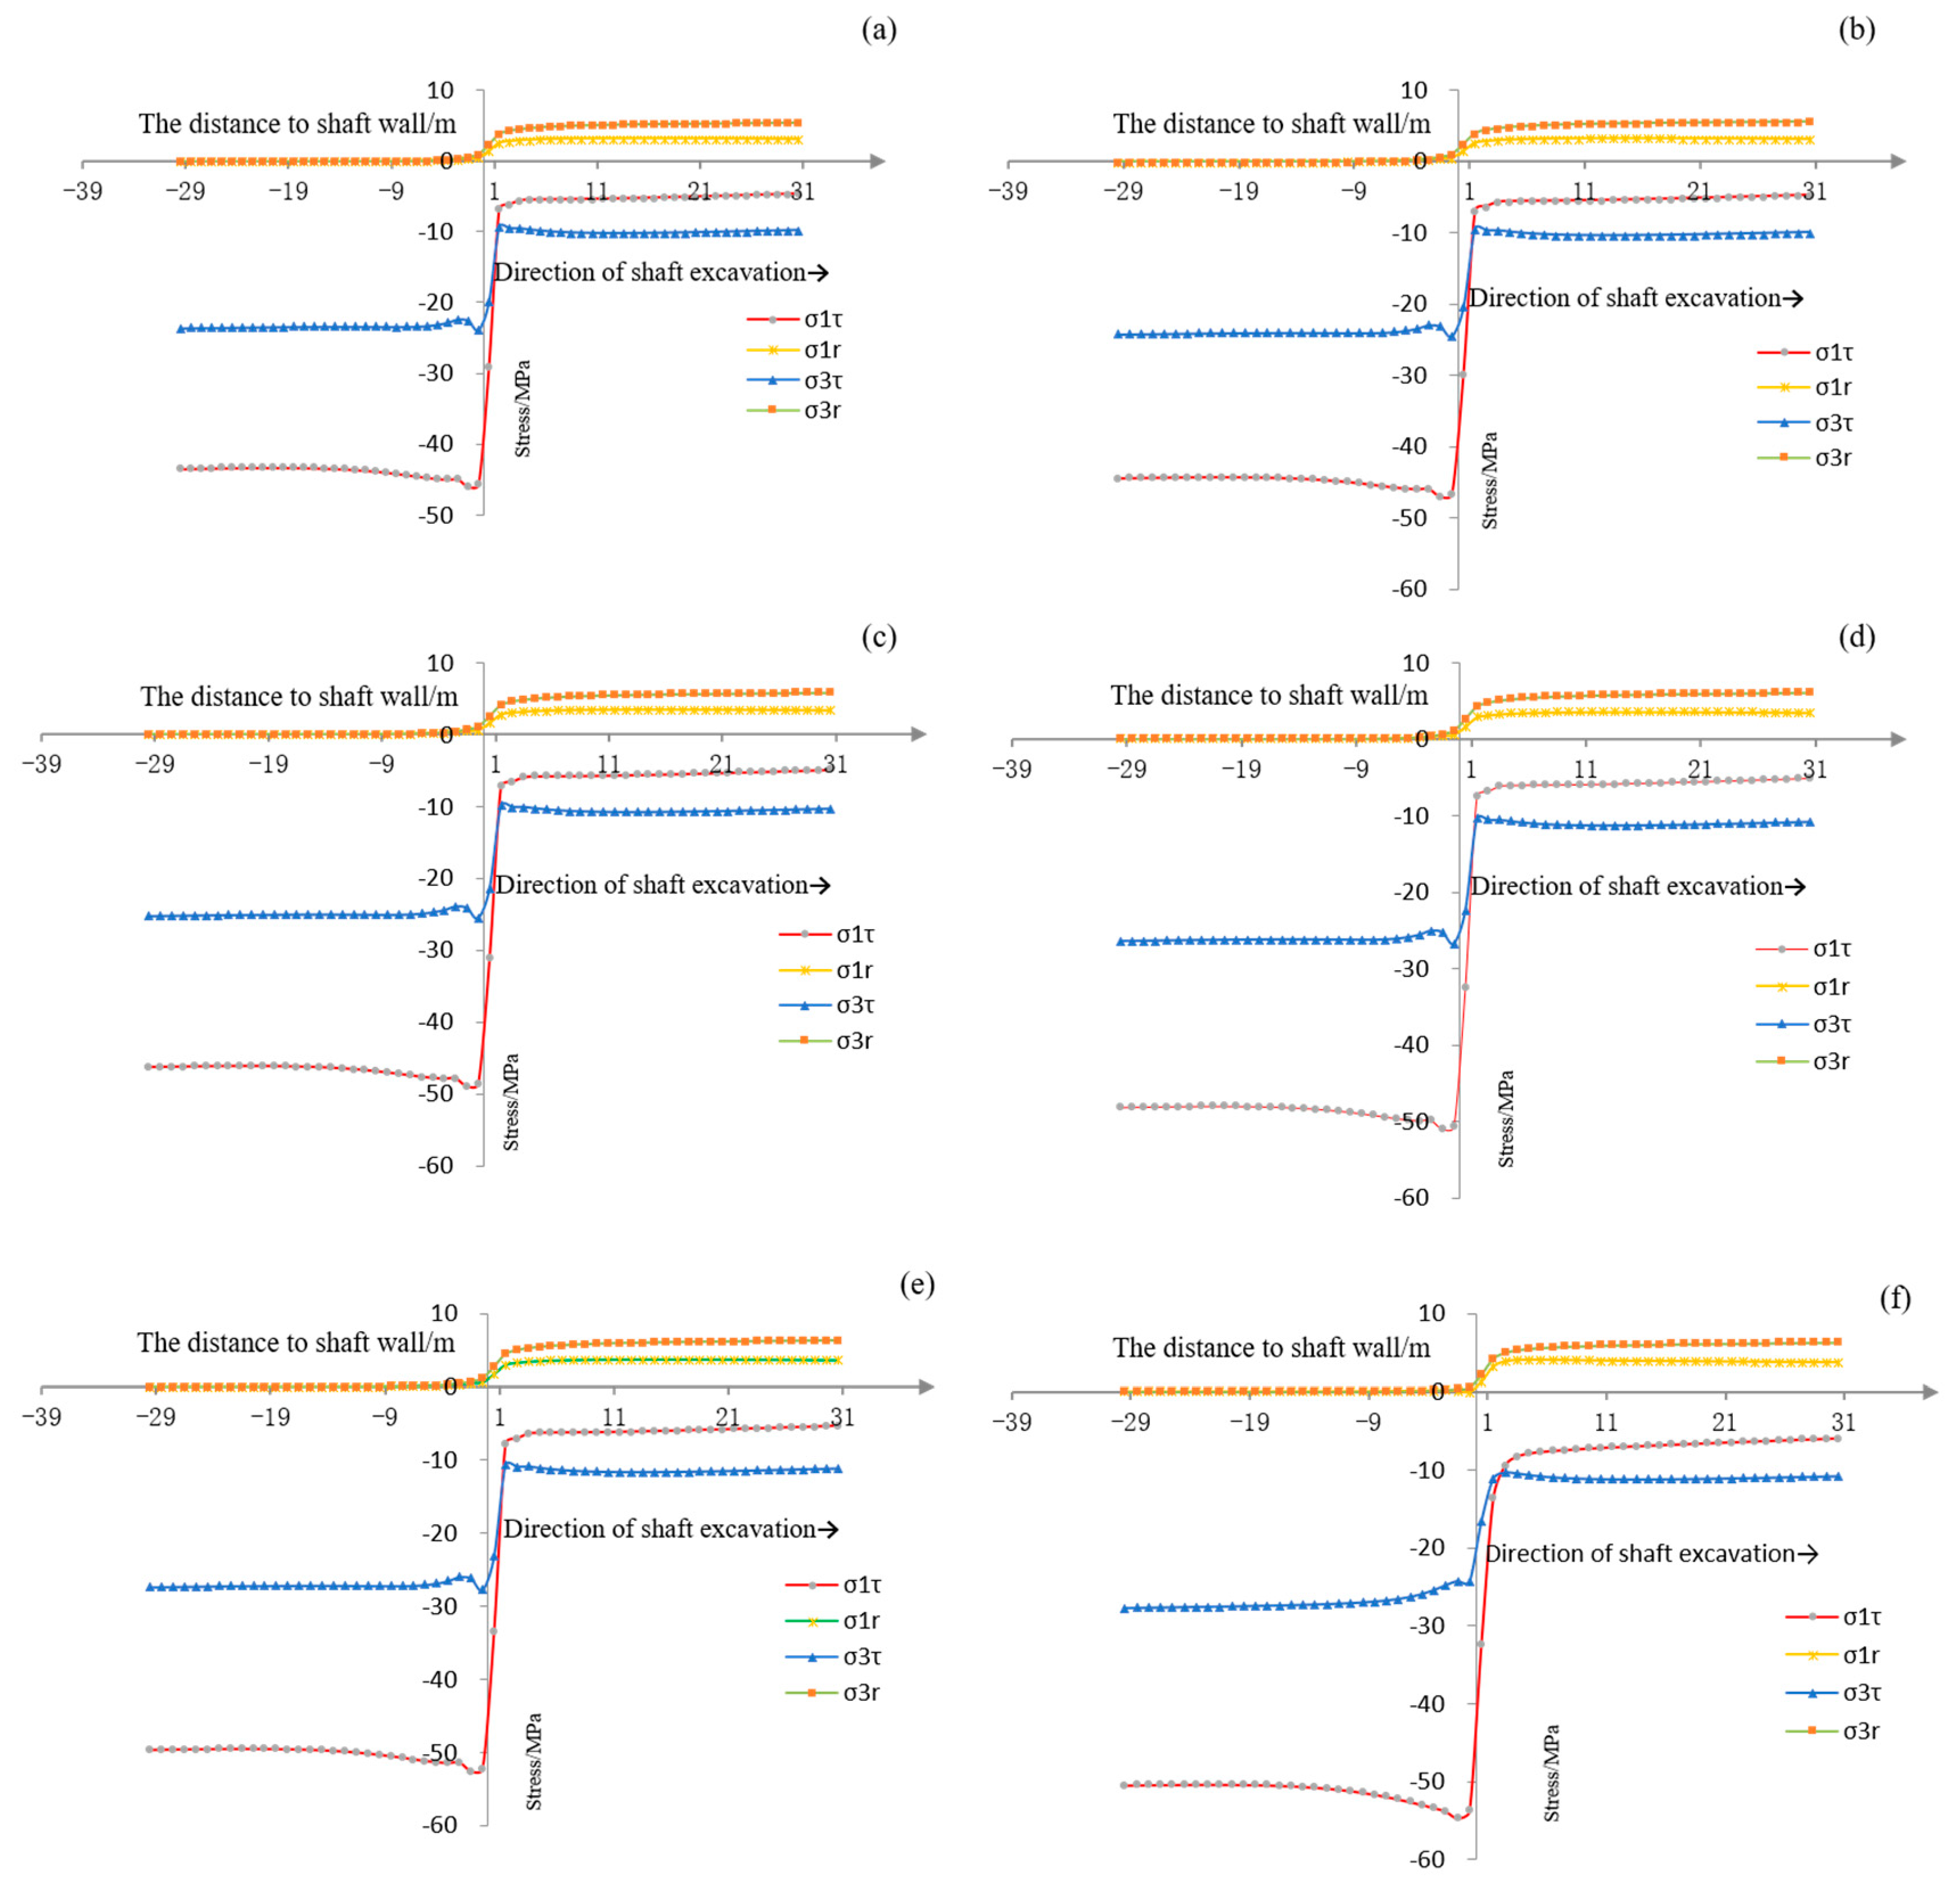
3.1. Stress Distribution in Cross Section and Longitudinal Section

Here we use PHASE2 for a numerical simulation analysis of the cross-section stress distribution. PHASE2 is a 2-dimensional plastic finite element program for calculating stresses and displacements around underground openings, which can be used to solve a wide range of mining and civil engineering problems, including plane strain, elastic or plastic materials, staged excavations, support (bolts/shotcrete) design, jointed rock, groundwater, etc. It is a numerical method for solving partial differential equations in two or three space variables. To solve a problem, a large system is subdivided into smaller, simpler parts that are called finite elements. This is achieved by a particular space discretization in the space dimensions, which is implemented by the construction of a mesh of the object: the numerical domain for the solution, which has a finite number of points. PHASE2 has been widely used in geotechnical and mining engineering as a tool for the design and the analysis of tunnel and surface excavation, as well as ore extraction and supports. Several applications have been reported in the area of slope stability analysis. Its potential applications in most areas in geotechnical engineering increase with the passage of time and the accumulation of users’ experience.
The simulation in our study was carried out by the ideal elastoplastic constitutive model in the Phase2 plane strain model. The boundary of the model adopts displacement constraints in the X and Y directions with a triangular mesh. When the restrain option is used to apply zero X-displacement boundary conditions, the nodes will be free to move in the Y direction only, and the X displacement will be fixed at zero throughout the analysis. When the restrain option is used to apply zero Y-displacement boundary conditions, the nodes will be free to move in the X direction only, and the Y displacement will be fixed at zero throughout the analysis. The number of mesh elements was 5769, and the number of nodes was 2961. The maximum horizontal principal stress was applied in the X direction, and the minimum horizontal principal stress was applied in the Y direction. According to the rock physical and mechanical parameters provided by Yang (2016) [31], we used the elastoplastic constitutive model and the Mohr–Coulomb yield criterion. The stress distribution of the transverse section of the wellbore at different depths after excavation was obtained and is shown in Figure 4 and Figure 5. The plastic zone radius of the shaft surrounding rock determined by the stress distribution at different depths is shown in Table 3.

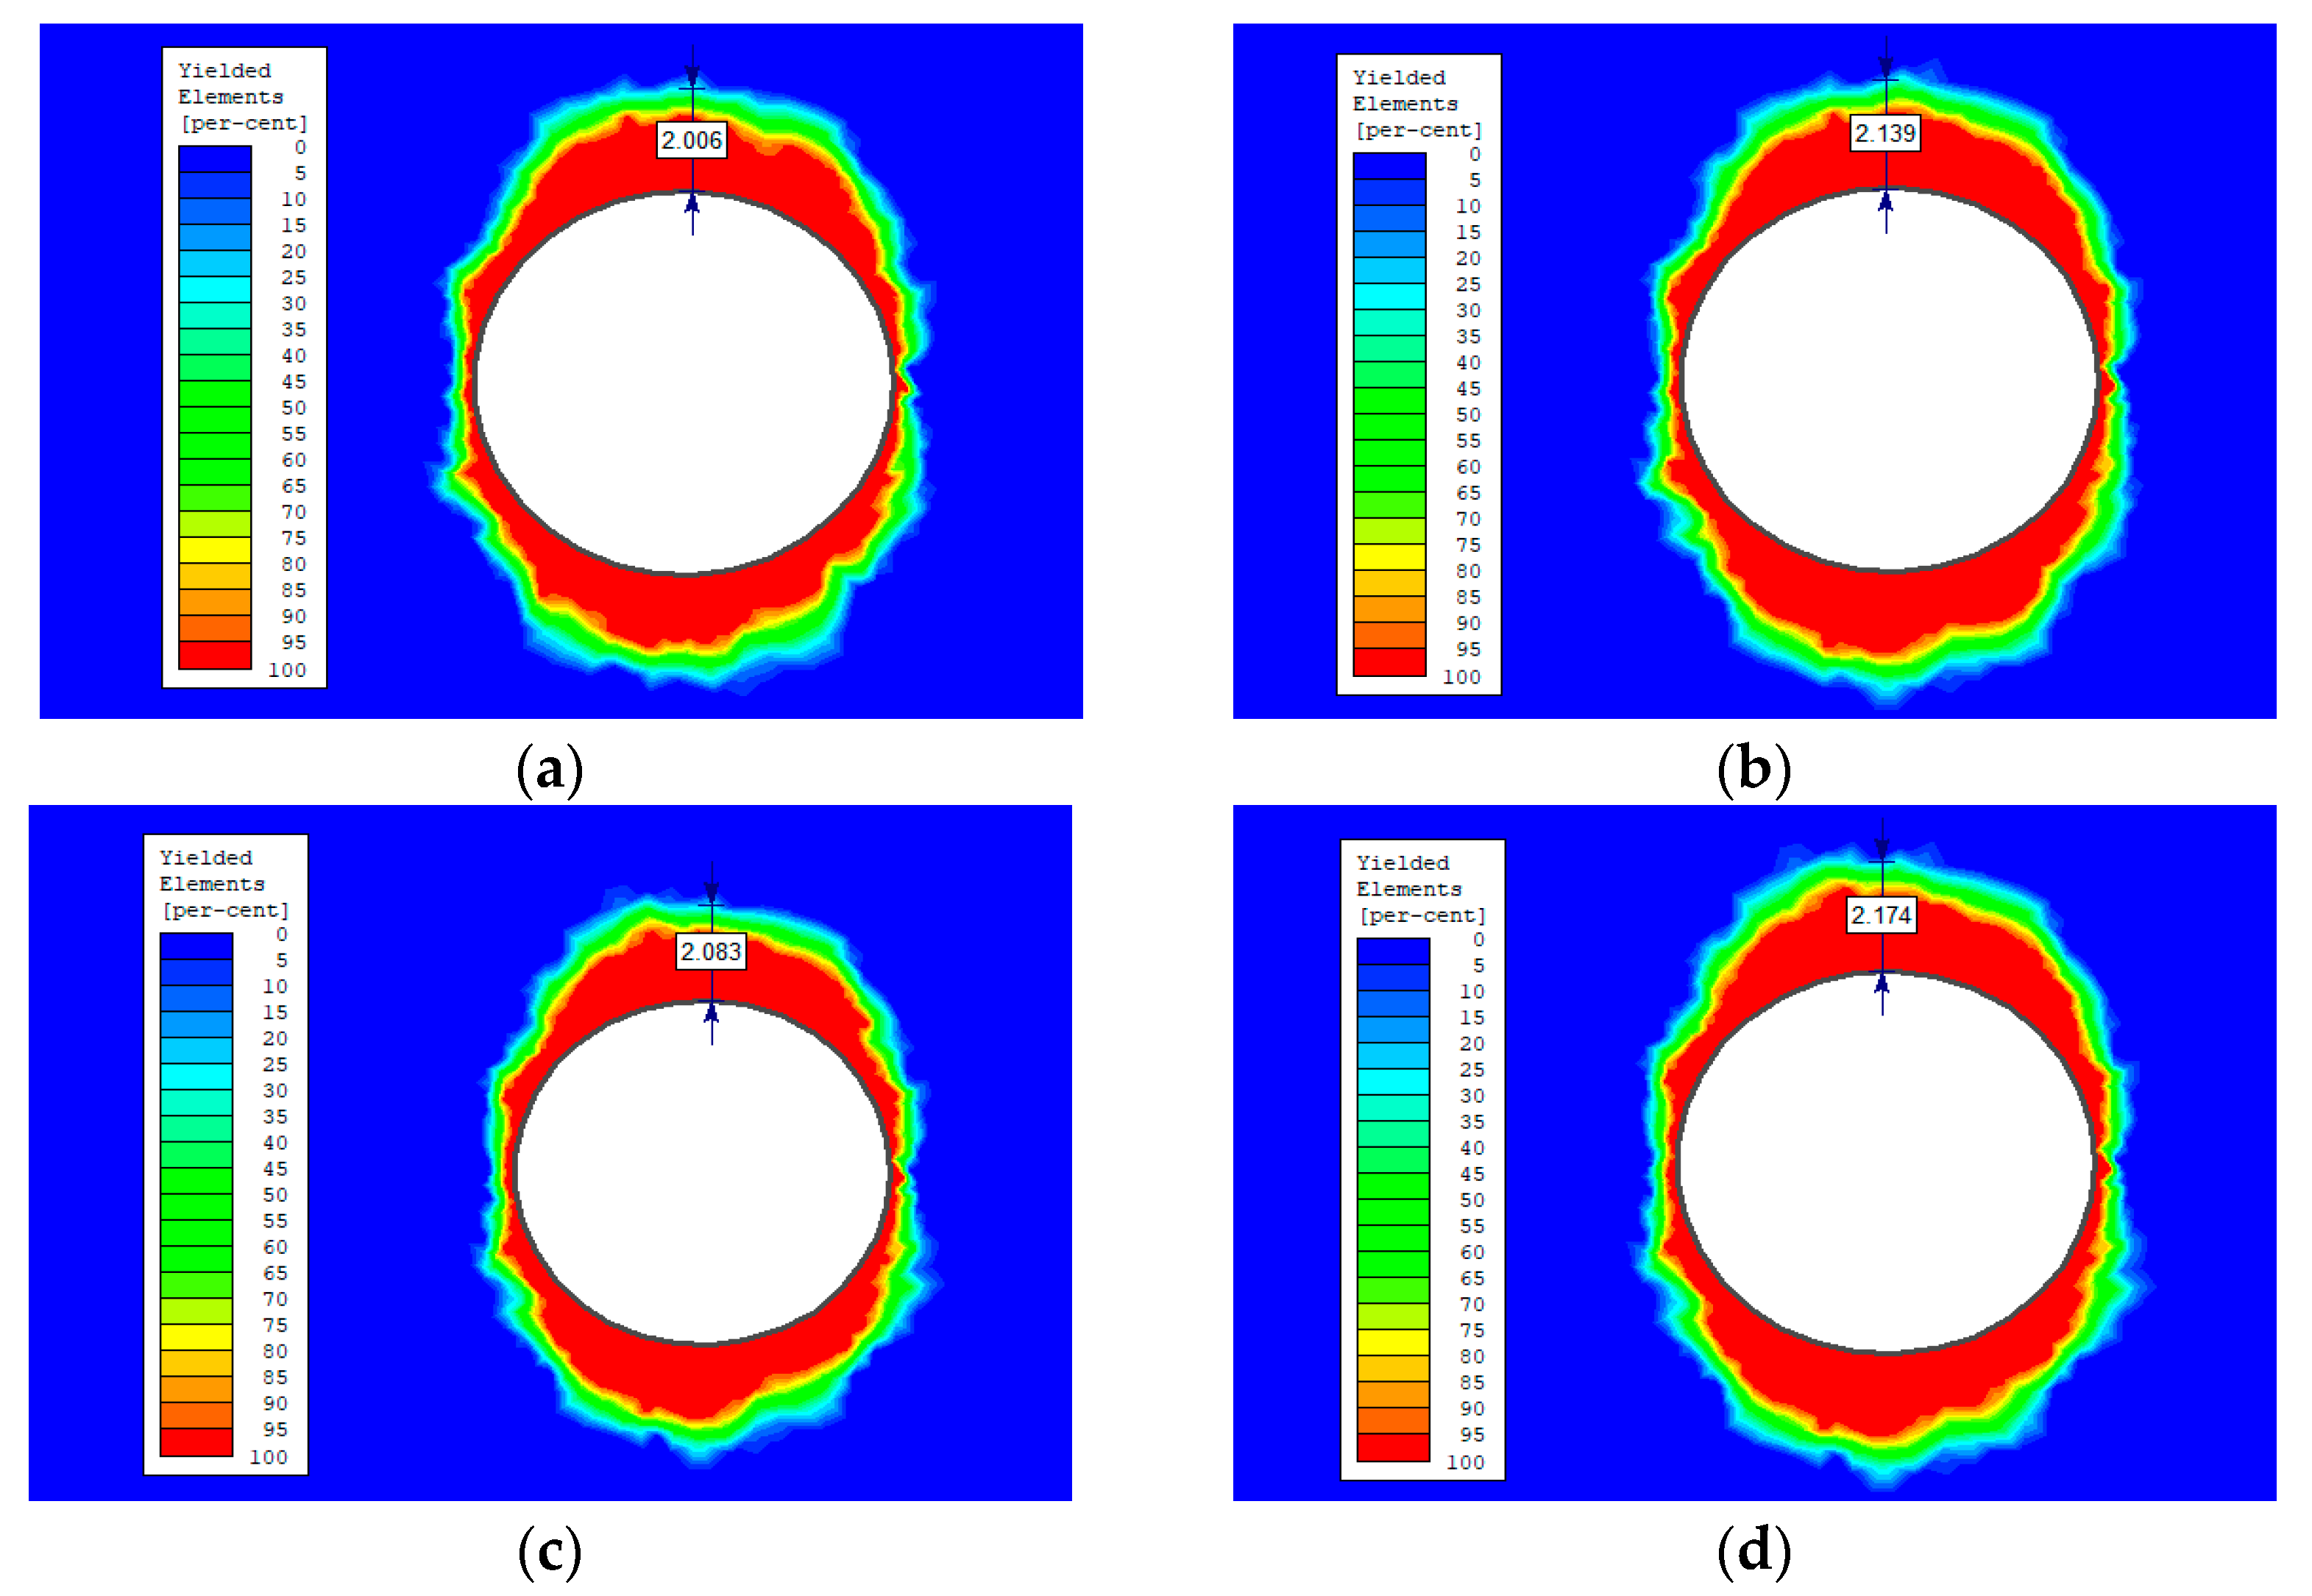
3.2. Deformation Characteristics of Shaft Surrounding Rock Mass

There are three modes of the shaft surrounding rock mass failure, in the forms of ear-shape, elliptical-shape, and butterfly-shape. We determined the damage range and form of the surrounding rock mass by numerical simulation. The distribution morphology and range of the damage zone at different depths are shown in Figure 6. It can be seen that the radius of the plastic zone gradually increases with the increasing of depth. When the depth is −930~−1073 m, the radius of the plastic zone is less than 2 m, and the maximum value is 2.48 m, which appears at −1310~−1450 m. The range of the plastic zone is smaller than the length of the general anchor bolt, and the range of the plastic zone can be controlled by bolt support.

4. Control Strategy

The ground motion represented by the peak ground velocity (PGV) has been accepted as the most representative parameter to define the dynamic load in rock mass supporting design. In the absence of in site measurements, a seismological method provides an alternative for calculating the scale of the dynamic loads. Since the method takes the seismic source and the wave travel into consideration, the accuracy of calculated values is within the acceptable limits for engineering practice [32]. In this study, the rock mass control design is given by the theories which considers elastoplastic mechanics and follows the assumptions of “continuous, uniform and isotropic”. The influence of joints on support design is mainly reflected in the calculation of rock mass strength reduction using rock mass classification. The influence of relatively large geological structures or nearby projects on the support design is mainly reflected in the temporal and spatial distribution of regional secondary stresses, while geological structures such as faults and fracture zones, cannot be reflected in the design of the shaft support. In this part, through numerical simulation, we designed the limit depth (−1250~−1271 m) support strategy. Numerical models were carried out for ideal surrounding rock mass without rock structure surface and surrounding rock with rock structure surface. Combined with the rock mass parameters of the new main shaft, the horizontal in situ stress was calculated to verify the feasibility of the shaft support design (Figure 7).
The bolt parameters given in Figure 7 are 2.5 m in length, 1.5 m in row spacing. The bolts are HRB500 steel type with 22 mm diameter. After the bolt is installed, the pressure of the shaft surrounding rock mass is unloaded by stress splitting, and then 400 mm concrete (C25) lining is applied. The simulation result was calculated and is shown in Figure 8.
According to the simulation results of bolt support in Figure 8, the length of the bolt is 2.5 m, and the radii of the plastic zone obtained by the simulation are 1.78 m and 1.84 m, respectively, which are smaller than the design length of bolt support and meet the requirements of bolt support for the surrounding rock of the shaft. It is found that the design concept of traditional shallow-buried shaft support—“improving the strength of concrete and increasing the thickness of concrete lining to control the stress”—is not feasible in the design of a deep shaft support.
The temporary support of the surrounding rock of the new main shaft in the range of −930~−1271 m is designed as anchor mesh beam support. The length of the anchor rod is 2.5 m, and the spacing between rows is 1.5 m. The steel type and diameter of the anchor rod were selected by the on-site anchor rod pull test, and the anchor rod support parameters have been verified to be reasonable. The support design for the surrounding rock of the shaft in the range of −930~−1271 m is 400 mm C25 concrete, and its safety factor is greater than 2.5, which meets the design expectations. The design parameters of support in the range of −930~−1271 m can be extended to the level of −1494.10 m after the bolt length is increased to 3 m.

5. Conclusions

The increasing construction depth and the redistributed stress conditions make the mechanical responses of mining shafts complicated. We studied the stability and control method of a main shaft from −930 m located in a deep gold mine. Results show that the damages of the surrounding rock mass at −930~−1500 m displayed “ear-shaped” damage, with damage ranges of less than 2.5 m. The shaft adopted bolt mesh beam support as temporary reinforcement, in which the length of the bolt is 2.5~3 m, and the row spacing is 1.5 m. The main conclusions are as follows:
(1)
The type of surrounding rock of the new main shaft (−930~−1271 m) including non-high-stressed (stable rock), high-stressed (unsqueezed rock, spall, or rock burst), and possible instability failure.
(2)
The failure types including structural plane-controlled failure, deep stress induced failure, rock burst, low confining pressure shear failure, spalling, and frequent conversion of multiple failure.
(3)
The damage of the surrounding rock mass of the shaft at −930~−1500 m is “ear-shaped” damage, and the damage range is less than 2.5 m.
(4)
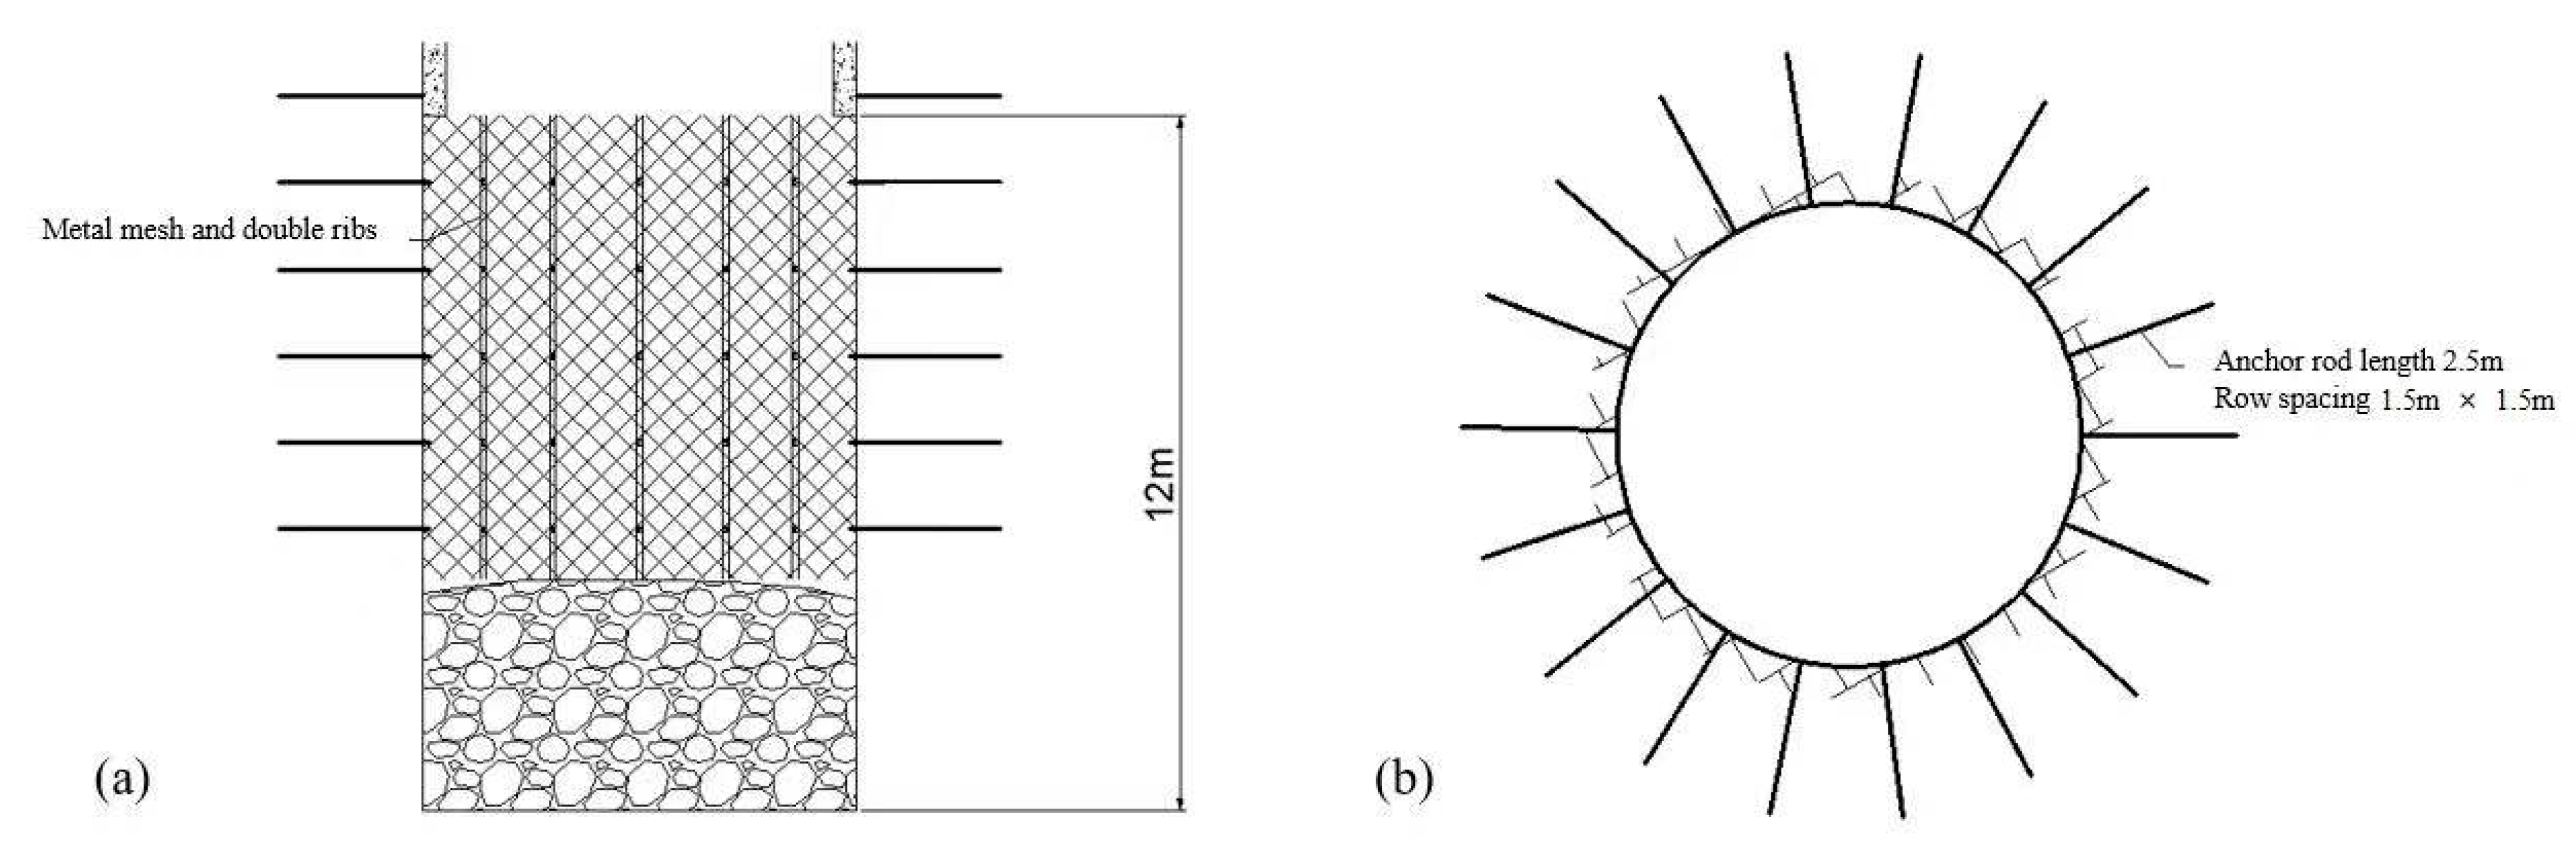
The new main shaft adopted bolt mesh beam support as temporary support where the length of the bolt is 2.5~3 m and the row spacing is 1.5 m. The steel type and diameter are determined by the on-site bolt pull test.
(5)
The above-mentioned temporary support structure can be installed after the shaft is excavated, and the thickness of the concrete support is determined to be 400 mm.
(6)
The method in this study not only ensures the smooth construction of the mine shaft, but also provides significance reference for construction of similar mine shafts.

Author Contributions

Conceptualization, X.W., X.L. and M.J.; Data curation, X.W.; Formal analysis, G.L.; Funding acquisition, Z.L.; Methodology, Z.L. and G.L.; Resources, Y.F.; Supervision, Y.F.; Visualization, L.C.; Writing—original draft, X.W.; Writing—review & editing, Z.L., Y.F. and L.C. All authors have read and agreed to the published version of the manuscript.

Funding

This research was funded by a major scientific and technological innovation project in Shandong Province [Research and Engineering Demonstration of Key Technologies and Equipment Integration for Intelligent Mining of Deep Metal Mines] grant number [2019SDZY05].

Institutional Review Board Statement

Not applicable.

Informed Consent Statement

Not applicable.

Data Availability Statement

The data used to support the findings of this study are included within the article.

Conflicts of Interest

The authors declare that they have no known competing financial interest or personal relationship that could have appeared to influence the work reported in this paper.

References

  1. Petersen, S.; Krätschell, A.; Augustin, N.; Jamieson, J.; Hein, J.R.; Hannington, M.D. News from the seabed–Geological characteristics and resource potential of deep-sea mineral resources. Mar. Policy 2016, 70, 175–187. [Google Scholar] [CrossRef]
  2. Xie, H.; Ju, Y.; Gao, F.; Gao, M.; Zhang, R. Groundbreaking theoretical and technical conceptualization of fluidized mining of deep underground solid mineral resources. Tunn. Undergr. Space Technol. 2017, 67, 68–70. [Google Scholar] [CrossRef]
  3. Liu, J.H.; Jiang, F.X.; Wang, N.G.; Li, Z.S.; Zhang, Z.G. Research on reasonable width of segment pillar of fully mechanized caving face in extra-thick coal seam of deep shaft. Chin. J. Rock Mech. Eng. 2012, 31, 921–927. [Google Scholar]
  4. Walton, G.; Kim, E.; Sinha, S.; Sturgis, G.; Berberick, D. Investigation of shaft stability and anisotropic deformation in a deep shaft in Idaho, United States. Int. J. Rock Mech. Min. Sci. 2018, 105, 160–171. [Google Scholar] [CrossRef]
  5. Sun, Q.; Ma, F.; Guo, J.; Li, G.; Feng, X. Deformation Failure Mechanism of Deep Vertical Shaft in Jinchuan Mining Area. Sustainability 2020, 12, 2226. [Google Scholar] [CrossRef] [Green Version]
  6. Savić, D.; Tumara, M.; Petrović, M. Importance of Geotechnical Investigation for Design and Construction of Shafts over 1000 m Deep. World J. Eng. Technol. 2021, 9, 250–267. [Google Scholar] [CrossRef]
  7. Manzi, M.S.; Cooper, G.R.; Malehmir, A.; Durrheim, R.J. Improved structural interpretation of legacy 3D seismic data from Karee platinum mine (South Africa) through the application of novel seismic attributes. Geophys. Prospect. 2020, 68, 145–163. [Google Scholar] [CrossRef]
  8. Minnaar, A. Water pollution and contamination from gold mines: Acid mine drainage in Gauteng province, South Africa. In Water, Governance, and Crime Issues; Springer: Berlin/Heidelberg, Germany, 2020; pp. 193–219. [Google Scholar] [CrossRef]
  9. Wang, T.; Berrill, P.; Zimmerman, J.B.; Hertwich, E.G. Copper Recycling Flow Model for the United States Economy: Impact of Scrap Quality on Potential Energy Benefit. Environ. Sci. Technol. 2021, 55, 5485–5495. [Google Scholar] [CrossRef]
  10. Goldberg, D.L.; Anenberg, S.C.; Kerr, G.H.; Mohegh, A.; Lu, Z.; Streets, D.G. Tropomi NO2 in the United States: A detailed look at the annual averages, weekly cycles, effects of temperature and correlation with surface NO2 concentrations. Earth’s Future 2021, 9, e2020EF001665. [Google Scholar] [CrossRef]
  11. Ma, T.-H.; Tang, C.-A.; Liu, F.; Zhang, S.-C.; Feng, Z.-Q. Microseismic monitoring, analysis and early warning of rockburst. Geomatics, Nat. Hazards Risk 2021, 12, 2956–2983. [Google Scholar] [CrossRef]
  12. Bullock, R.L. Trends in non-coal underground mining technology at the close of the millennium. In Mining in the New Millennium Challenges and Opportunities; CRC Press: Boca Raton, FL, USA, 2020; pp. 127–144. [Google Scholar]
  13. Lollar, B.S.; Heuer, V.B.; McDermott, J.; Tille, S.; Warr, O.; Moran, J.J.; Hinrichs, K.U. A window into the abiotic carbon cycle–acetate and formate in fracture waters in 2.7 billion year-old host rocks of the Canadian Shield. Geochim. Et Cosmochim. Acta 2021, 294, 295–314. [Google Scholar] [CrossRef]
  14. Wilpiszeski, R.L.; Lollar, B.S.; Warr, O.; House, C.H. In Situ Growth of Halophilic Bacteria in Saline Fracture Fluids from 2.4 km below Surface in the Deep Canadian Shield. Life 2020, 10, 307. [Google Scholar] [CrossRef] [PubMed]
  15. Liu, Q.; Dou, F.; Meng, X. Building risk precontrol management systems for safety in China’s underground coal mines. Resour. Policy 2020, 64, 101631. [Google Scholar] [CrossRef]
  16. Gao, J.; Guan, C.; Zhang, B. China’s CH4 emissions from coal mining: A review of current bottom-up inventories. Sci. Total Environ. 2020, 725, 138295. [Google Scholar] [CrossRef] [PubMed]
  17. Liu, Y.; Zhang, C.; Huang, Y.; Xiao, Z.; Han, Y.; Ren, G. Climate Impact of China’s Promotion of the Filling Mining Method: Bottom-Up Estimation of Greenhouse Gas Emissions in Underground Metal Mines. Energies 2021, 14, 3273. [Google Scholar] [CrossRef]
  18. Zhang, C.; Wang, F.; Bai, Q. Underground space utilization of coalmines in China: A review of underground water reservoir construction. Tunn. Undergr. Space Technol. 2020, 107, 103657. [Google Scholar] [CrossRef]
  19. Dong, S.; Wang, H.; Guo, X.; Zhou, Z. Characteristics of Water Hazards in China’s Coal Mines: A Review. Mine Water Environ. 2021, 40, 325–333. [Google Scholar] [CrossRef]
  20. Zhou, A.; Hu, J.; Wang, K. Carbon emission assessment and control measures for coal mining in China. Environ. Earth Sci. 2020, 79, 461. [Google Scholar] [CrossRef]
  21. Czaja, P.; Kamiński, P.; Dyczko, A. Polish Experiences in Handling Water Hazards during Mine Shaft Sinking. In Mining Techniques—Past, Present and Future; Intech Open: London, UK, 2021. [Google Scholar]
  22. Golafshan, R.; Dascaliuc, C.; Jacobs, G.; Roth, D.; Berroth, J.; Neumann, S. Damage diagnosis of cardan shafts in mobile mining machines using vibration analysis. In IOP Conference Series: Materials Science and Engineering; IOP Publishing: Bristol, UK, 2021; Volume 1097, p. 012019. [Google Scholar]
  23. Seifoori, S.; Parrany, A.M.; Khodayari, M. A high-cycle fatigue failure analysis for the turbocharger shaft of BELAZ 75131 mining dump truck. Eng. Fail. Anal. 2020, 116, 104752. [Google Scholar] [CrossRef]
  24. Warchala, E.; Szostak-Chrzanowski, A. An analysis on the effect of crosscuts within shaft protective pillars on deformations of the surrounding rock mass deformations. Min. Sci. 2020, 27, 253–265. [Google Scholar]
  25. Pradani, D.I. The Effect of Stress Distribution Around the Decline Shaft on The Support System Stability in Underground Mining. J. Earth Mar. Technol. (JEMT) 2021, 1, 21–28. [Google Scholar] [CrossRef]
  26. Zhou, K.; Dou, L.; Gong, S.; Li, J.; Zhang, J.; Cao, J. Study of Rock Burst Risk Evolution in Front of Deep Longwall Panel Based on Passive Seismic Velocity Tomography. Geofluids 2020, 2020, 8888413. [Google Scholar] [CrossRef]
  27. Ma, J.; Dong, l.; Zhao, g.; Li, X. Discrimination of seismic sources in an underground mine using full waveform inversion. Int. Rock Mech. Min. Sci. 2018, 106, 213–222. [Google Scholar] [CrossRef]
  28. Ma, J.; Dong, L.; Zhao, G.; Li, X. Focal Mechanism of Mining-Induced Seismicity in Fault Zones: A Case Study of Yongshaba Mine in China. Rock Mech. Rock Eng. 2019, 52, 3341–3352. [Google Scholar] [CrossRef]
  29. Xie, C.; Nguyen, H.; Bui, X.N.; Nguyen, V.T.; Zhou, J. Predicting roof displacement of roadways in underground coal mines using adaptive neuro-fuzzy inference system optimized by various physics-based optimization algorithms. J. Rock Mech. Geotech. Eng. 2021, 13, 1452–1465. [Google Scholar] [CrossRef]
  30. Xie, C.; Nguyen, H.; Choi, Y.; Armaghani, D.J. Optimized functional linked neural network for predicting diaphragm wall deflection induced by braced excavations in clays. Geosci. Front. 2022, 13, 101313. [Google Scholar] [CrossRef]
  31. Yang, L.-Q.; Deng, J.; Wang, Z.-L.; Guo, L.-N.; Li, R.-H.; Groves, D.I.; Danyushevsky, L.V.; Zhang, C.; Zheng, X.-L.; Zhao, H. Relationships Between Gold and Pyrite at the Xincheng Gold Deposit, Jiaodong Peninsula, China: Implications for Gold Source and Deposition in a Brittle Epizonal Environment. Econ. Geol. 2016, 111, 105–126. [Google Scholar] [CrossRef] [Green Version]
  32. Ma, J.; Dong, L.; Zhao, G.; Li, X. Qualitative Method and Case Study for Ground Vibration of Tunnels Induced by Fault-Slip in Underground Mine. Rock Mech. Rock Eng. 2018, 52, 1887–1901. [Google Scholar] [CrossRef]
Figure 1. On-site rock core surface conditions.
Sustainability 14 13329 g001
Figure 2. Part of the borehole inspection image (a) and joint fissures (b).
Sustainability 14 13329 g002
Figure 3. Cycle diagram of shaft digging and masonry operation.
Sustainability 14 13329 g003
Figure 4. The stress redistribution of the cross-section of the surrounding rock mass of the shaft at different depths: (a) −1050.0~−1073.0 m, (b) −1073.0~−1102.0 m, (c) −1102.0~−1153 m, (d) −1153.0~−1207 m, (e) −1207.0~−1250.0 m, (f) −1250.0~−1271.0 m.
Sustainability 14 13329 g004
Figure 5. Stress distribution in longitudinal section of surrounding rock of wellbore at different depths: (a) −1050.0~−1073.0 m, (b) −1073.0~−1102.0 m, (c) −1102.0~−1153 m, (d) −1153.0~−1207 m, (e) −1207.0~−1250.0 m, (f) −1250.0~−1271.0 m.
Sustainability 14 13329 g005
Figure 6. Distribution of plastic zone in surrounding rock mass of shaft at different depths. (a) −1102~−1153 m; (b) −1153~−1207 m; (c) −1207~−1250 m; (d) −1250~−1271 m.
Sustainability 14 13329 g006
Figure 7. Schematic diagram of the −930~−1500 m support design of the new main shaft: (a) Schematic diagram of longitudinal section. (b) Schematic diagram of transverse section.
Sustainability 14 13329 g007
Figure 8. The simulation results of bolt support for the surrounding rock of the shaft: (a) Simulation results of bolt support without structural surface. (b) Simulation results of bolt support with structural surfaces.
Sustainability 14 13329 g008
Table 1. RMR rock mass classification results.
LocationUCS/MPaRQDJoint
Spacing
Joint
Condition
WaterTotal ScoreClassification Quality
−930.0~−972.0102.51710251574IIgood
−972.0~−987.0102.51710251574IIgood
−987.0~−1050.0102.51310251570IIgood
−1050.0~−1073.0102.51310251570IIgood
−1073.0~−1102.0102.5138251568IIgood
−1102.0~−1153.0102.51710251574IIgood
−1153.0~−1207.0102.5178251572IIgood
−1207.0~−1250.0102.51710251574IIgood
−1250.0~−1271.0102.51310251570IIgood
Table 2. Statistics of joints in surrounding rock mass of wellbore at different depths.
LocationsJointsLocationsJoints
−972.00~
−987.00 m
Sustainability 14 13329 i001−1102.00~
−1153.00 m
Sustainability 14 13329 i002
−987.00~
−1050.00 m
Sustainability 14 13329 i003−1153.00~
−1207.00 m
Sustainability 14 13329 i004
−1050.00~
−1073.00 m
Sustainability 14 13329 i005−1207.00~
−1250.00 m
Sustainability 14 13329 i006
−1073.00~
−1102.00 m
Sustainability 14 13329 i007−1250.00~
−1271.00 m
Sustainability 14 13329 i008
Table 3. The radius of the failure zone determined by the stress distribution of the shaft.
Depth/m−930.0~−987.0−987.0~−1050.0−1050.0~−1073.0−1073.0~−1102.0−1102.0~−1153−1153.0~−1207−1207.0~−1250.0−1250.0~−1271.0
Plastic radius/m3.95.25.26.15.65.25.25.6
Publisher’s Note: MDPI stays neutral with regard to jurisdictional claims in published maps and institutional affiliations.

