Article

Challenging Examples of the Wise Use of Computer Tools for the Sustainability of Knowledge and Developing Active and Innovative Methods in STEAM and Mathematics Education

1
Faculty of Materials Science and Engineering, University of Miskolc, 3515 Miskolc, Hungary
2
Department of Mathematics & Actuarial Science, Faculty of Economic Informatics, University of Economics in Bratislava, Dolnozemska Cesta 1, 852 35 Bratislava, Slovakia
3
Faculty of Economics and Law, George Emil Palade University of Medicine, Pharmacy, Science, and Technology of Targu Mures, 540566 Târgu Mureș, Romania
4
Faculty of Education, Comenius University in Bratislava, Racianska 59, 813 34 Bratislava, Slovakia
*
Author to whom correspondence should be addressed.
Sustainability 2022, 14(20), 12991; https://doi.org/10.3390/su142012991
Submission received: 27 July 2022 / Revised: 27 September 2022 / Accepted: 28 September 2022 / Published: 11 October 2022

Abstract

:
The rapid changes in information and communication technology (ICT), the increasing availability of processing power, and the complexity of mathematical software demand a radical re-thinking of science, technology, engineering, arts, and mathematics (STEAM), as well as mathematics education. In the transition to technology-based classrooms, the constant use of educational software is a requirement for sustainable STEAM and mathematics education. This software supports a collaborative and actionable learning environment, develops 21st-century skills, and promotes the adoption of active and innovative methodologies. This paper focuses on learning and teaching mathematics and analyzes the role and utility of ICT tools in education as computer algebra systems (CAS) and dynamic geometry systems (DGS) in implementing active and innovative teaching methodologies related to sustainable STEAM education. Likewise, it highlights the necessity for learners to have extensive knowledge of mathematical theory, an essential asset to ensure the reliable and effective use of mathematical software. Through a practical experiment, this study aims to highlight that a mixed teaching method can significantly improve the sustainability of math knowledge. It provides various solid examples of CAS and DGS applications to emphasize its usage rooted in a mathematical background to enable learners to identify when the computer solution is unreliable. The study highlights that the proper use of CAS and DGS is an efficient method of deepening our understanding of mathematical notions and solving tasks in STEAM subjects and real-life applications. This paper’s goal is to direct our attention to the proper and intelligent use of computer tools, especially symbolic calculators, such as CAS and DGS, without providing an in-depth analysis of the challenges of these technologies. The outcomes of the paper should offer educators and learners new elements of active strategies and innovative learning models that can be immediately applied in education.

1. Introduction

Education in the 21st century must be focused towards developing learners’ creativity and innovativeness to teach them how to be more entrepreneurial and face the challenges of a rapidly changing world. These areas received limited attention in 20th-century education, which consisted of educational practices that are outdated need to be revised. As Yong recalled, “The system results in a population with similar skills in a narrow spectrum of talents” [1]. Education is the main driver of development, and it is still challenging to reform 20th-century education to provide the best teaching possible for a new generation. Nevertheless, as Stephen Sterling argues, in a rapidly changing world, formal education “largely remains part of the problem of unsustainability” [2]. This anticipates the concept of ‘Sustainable Education’, which “offers the possibility of education that is appropriate and responsive to the new systemic conditions of uncertainty and complexity that reflected in the headlines every day; one that nurtures the increasingly important qualities of adaptability, creativity, self-reliance, hope and resilience in learners” [2].
Technological advances are encouraging changes in 21st-century teaching. The widespread use of ICT tools modifies the structure, format, and running of teaching and learning at all levels of school education. This learning process can be recorded and archived through teaching platforms and reused for further analysis to improve teaching and find optimal methods to solve problems during learning. Computer tools and mathematical software give new dimensions to teaching methodologies, opening up new innovative ways for introducing and applying pedagogical methods [3,4,5]. The rethinking of education in the digital era is today’s main challenge. Policymakers, professionals, and the whole of society are engaged in finding answers to the most pressing questions such as: What is the role of education? How can education give learners the adequate skills to succeed in a rapidly changing digital world? How can new and traditional teaching methodologies work together in the 21st-century education system to develop skills that make young professionals succeed in the workforce? [6,7].
The COVID-19 pandemic accelerated the technologization of many industries and has brought significant educational changes [8], which were created under the intense time pressure of the “new normal.” The different ways of integrating information and communication technologies (ICTs) in the curriculum exemplify how education has adapted to the “new normal” in all parts of the world [9,10]. According to Yong Zhao, “the pandemic has created a unique opportunity for educational changes that have been proposed before COVID-19 but were never fully realized” [11].
Education improved with technology, and this process is irreversible. However, not all students will have equal access to technology in the future; therefore, the problem of a digital divide persists [12]. Teaching in the 21st century needs to be different from the 20th- or 19th-century tutoring. The 21st-century population lives in a globalized, rapidly changing, chaotic, and less controllable world. Education is responsible for preparing the next generation to thrive in such an environment by equipping them with the necessary skills and abilities to understand problems, make decisions, learn from mistakes, and grow personally and professionally. Generation Alpha (those born after 2010) [13] already grow up in a Web 4.0 environment. They begin to use technology from their early childhood; therefore, acquiring new skills and broadening their knowledge through ICT constitutes a powerful tool that is easier for them to understand and adopt. Nevertheless, it is essential to highlight that computer tools can only be efficient when under human control.
It is widely accepted that integrating ICTs in the curriculum has many advantages: new innovative teaching and learning methods can be implemented; educators can employ a wide variety of learning styles to identify the best combination to meet the student’s individual needs; in the technology-based classroom, learners are active participants and teachers are more equipped with different teaching tools [14]. According to [15], ICT tools offer a new means of communication, which is the basis of the educational process, allowing teachers to individually communicate with every student and students with each other, thus enabling a differentiated approach. Therefore, it can be stated that the introduction and usage of ICT in the curriculum revolutionizes education and helps transform the teaching-learning process toward the development of sustainable education [16,17,18]. However, there are large obstacles to achieving this: finding ways to incorporate ICT tools in the curriculum, teachers’ preparedness, the development of digital skills, and students’ access. Furthermore, it is very important to educate preservice teachers to acquire the relevant skills and competencies needed to teach generation alpha. According to [19], “educators are powerful change agents who can deliver the educational response needed to achieve the Sustainable Development Goals (SDGs). Their knowledge and competencies are essential for restructuring educational processes and educational institutions towards sustainability”.
For the sustainable development of STEAM (Science, Technology, Engineering, Arts and Mathematics) and mathematics education, emerging technologies, especially the use of symbolic calculators as computer tools (SCCT), present a great tool and opportunity to implement active and innovative teaching methodologies [20]. In this paper, under the SCCT framework, we will consider computer algebra systems (CAS) and dynamic geometry systems (DGS). The general term of computer algebra (CA) and separately CAS or DGS will be used when a difference must be emphasized. SCCT offers new directions in teaching and learning mathematics by offering a visualization of basic notions in mathematics and science and challenging users to solve complex mathematical problems. CA develops critical thinking and problem-solving skills by helping the user to understand and interpret unique theoretical examples [21,22]. Nevertheless, the successful utilization of CA and CAS in complex problems requires a solid theoretical understanding. According to Buchberger, “in the application of mathematics to itself, there lies an enormous driving force, which has reached a new dimension, especially through new mathematical software systems, and there is an unprecedented dynamism in mathematical research, education, and applications“, and the “computational mathematics is one of the technologies, if not the key technology, of today’s information society“ [23].
In addition to the benefits of using math software, downsides and dangers must also be considered. It is essential to identify factors and define the criteria used to determine the effectiveness of these tools [24]. The paper of [25] reveals the side effects of education policies and practices and stresses the importance of considering them in the same way as medical products, which are required to disclose both their intended outcomes and known side effects.
The present paper points to the possible ‘side effects’ of CAS usage. In this respect, this paper warns that the simulations and results provided by SCCT must be looked at with a solid mathematical theory background to avoid any ‘side effect,’ the misleading interpretation. Only an extensive knowledge of mathematics can lead the user to the correct interpretation of the offered solutions. It is also crucial to know the barriers to the utilized SCCT in order to drive the development of critical thinking and problem-solving skills. At the same time, this can lead to incorrect decisions and solutions if the person who uses this method does not possess sufficient theoretical math knowledge. Moreover, teachers must have control over technology in this case. A theoretical background and knowledge are required to control and interpret the results obtained by CAS and DGS. The user has to decide whether to accept or reject the results provided by the computer and validate them against real-life conditions.
The present paper focuses on some unique aspects of teaching and learning mathematics. It analyzes the role and utility of using ICT tools and CAS/DGS toward implementing active and innovative teaching methodologies for sustainable STEAM education. Furthermore, it highlights the requirements for using these tools effectively. It provides concrete examples of CAS/DGS usage to highlight the importance of having a solid theoretical math background to detect when a computer solution is unreliable. This paper aims to demonstrate through a practical experiment that a mixed teaching method can significantly improve mathematical knowledge.
The paper’s goal is to direct attention to the proper and intelligent use of these technologies and the importance and possibility of renewing the mathematics curriculum and teaching methods to follow rapid changes in the available ICT tools. The conclusions of this study provide educators and learners with new elements of active strategies and innovative learning models to be applied during the education process.
The paper is based on quantitative research led by the following questions: What are the most efficient, active, and innovative teaching and learning methods that ensure a higher level of mathematics learner comprehension? What is the most effective way of introducing CAS and DGS in mathematics teaching? What are the advantages of introducing CAS and DGS in math education to develop 21st-century skills? Is using CAS/DGS in teaching and learning correlated with learners’ mathematical knowledge and skills?
The paper also contains an integrative literature review to analyze the theoretical background and study recent research results. Furthermore, this literature review helps validate the accuracy of the obtained results in the context of the research questions.
The primary keywords used during this research are ICT use and CA use in math teaching, challenges, and failures, the effective use of CAS and DGS, mixed teaching methods, the effectiveness of math teaching, math curricula in the 21st-century, learning strategies and models, 21st-century skills, math computation and real-life confrontation, CAS/DGS use and the development of reliable knowledge in math, sustainable STEAM education, innovative and active teaching, and learning methods.
This article is organized as follows: Section 2 describes a practical experiment on the mathematics learning process with or without computer tools; Section 3 presents a short overview of computer tools used in STEAM education and why these tools are used; Section 4 introduces relevant methodological examples in graphing functions, with a comparative discussion of some possible failures and challenges in different CAS and DGS. Lastly, Section 5 presents our conclusions and further research possibilities.

2. Math Learning Process—With or without ICT Tools?—Practical Experiment

2.1. Materials and Methods

The goals of the experiment (presented below) were to study the utility of computer tools in math education, to analyze the need to redefine the didactical aspects of teaching in the 21st century, and to evaluate the necessity of identifying the most efficient, effective math teaching methods in the context of the new paradigm [26]. Our research question is: What are the most efficient, active, and innovative teaching and learning methods that ensure a higher level of mathematics learner comprehension? Is it the theoretical method—the classical teaching method (teacher-centered method/traditional method) or exclusively teaching through new technology, using computer tools—the innovative method (learner-child-centered method/laboratory method), or a combination of the two?
This section presents the main conclusions and methodological outcomes of the experiment.

2.1.1. Procedure and Sampling, Tools

For this extensive pedagogical research, the authors conducted a study at the University of Economics in Bratislava, a public institution of higher education in Slovakia. Forty-seven bachelor’s level 1st year students participated in the study. The experiment focused on the most challenging teaching topic, as confirmed by students: graphing functions of one real variable and their transformations. To accomplish the primary research goal (to assess the impact of math software on the understanding of math concepts), a comparison between traditional teaching methods and teaching using ICT tools, the MS Excel environment, was used. A didactical software was created—Elem_F_Grapher (programmed and developed by Zsolt Simonka), Figure 1—which allows graphs of all elementary functions and their transformations to be interactively drawn (off-line function grapher). The program creates an internet-independent and syntax-free technological environment for graphing functions.
The MS Excel environment was chosen predominantly due to its accessibility for each student, whether at the university or home, and because all users had the basic skills required to use it [27,28].

2.1.2. Sample Description

The experiment itself was carried out in the first semester with a sample of 3 first-year student groups using the test–retest method. Non-probability sampling (non-random selection) was used to ensure that students with different high school backgrounds were equally represented in the test groups, guaranteeing the equivalence of groups. Test–retest is a method of repeating a test after a specific time with the same participants [29]. It is considered “One of the most suitable methods for researching the effectiveness of the educational process” [30]. The test–retest method is considered of high reliability [31].
The socio-demographic variables of the participants in relation to their university were as follows: the first group was called the control group (ContGr) and consisted of 16 students of the Faculty of Business Management. The second group was called experimental group 1 (ExpGr1) and consisted of 18 students of the Faculty of Business. The third group was called experimental group 2 (ExpGr2) and consisted of 13 students from the Faculty of Economics. The students were not acquainted with the goal of the experiment in order to not influence their behavior.

2.1.3. Procedure

A procedure was designed to help identify the most efficient teaching method between only traditional teaching, only computer tools, and a combination of traditional and computer tools as measured through the level of students’ knowledge in graph functions before and after teaching.
In the first seminar, with the topic of the recapitulation of high school knowledge regarding functions, the knowledge level of all students in all three groups was tested by having them individually complete identical tests (Appendix A). Then, the completed tests from all students were collected and evaluated. The data obtained were named Test results 1. Next week, during the second seminar, different teaching methodologies were applied for each of the three groups. In the control group (ContGr), teaching was carried out using a classical method without the use of computer tools. Transformations of the linear, quadratic, power, square root, and rational graph functions were shown to students by manually building the graphs on the blackboard. At the end of the seminar, students were told that they needed to practice function graphing in preparation for the next seminar. In experimental group 1 (ExpGr1), teaching was carried out using computer tools only, without the classical method. A demo version of the program Elem_F_Grapher was distributed so that each student in group 1 could individually practice graphing functions on their computer in preparation for the next seminar. In experimental group 2 (ExpGr2), teaching was carried out using a combination of the classical teaching method applied to control and ICT tool-based teaching applied to group 1. A laptop/computer and video projector with a brief presentation of the program Elem_F_Grapher (used with experimental group 1) was used. Next, a demo version of the program was distributed for individual use. The experiment continued in the next math seminar, during the third week, where students from all three groups had to repeat the same test that was used in the first seminar (Appendix A). The completed test data (called Test results 2) were collected, analyzed, and evaluated. In each group, Test results 2 were separately compared with Test results 1 in order to identify the improvement in the level of students’ knowledge of function graphing.

2.1.4. Data Analysis

The completed tests by the students in the first seminar form the data, called Test results 1, and show the level of the students’ knowledge acquired in high school. The relationship between the Test results 1 and the mathematical entry exam results of the students participating in the experiment was checked. The calculated Pearson correlation coefficient, r = 0.8782 , confirmed a high validity.
The second round of test, named Test results 2, contains the data used to evaluate the efficiency of the used teaching methods. The students’ results and the data of Test results 1 and Test results 2 were separately compared in case of each group, measuring the level of knowledge progress of groups. A quantitative analysis is presented in Section 2.2.

2.2. Results

A quantitative analysis was conducted using the data of Test results 1 and Test results 2, and average group scores and average relative success rates were calculated. The maximum score that can be achieved by students is 16. Table 1 and Appendix B contains the average group scores noted by x ¯ and x ¯ .
To determine the winning teaching methodology, the relative improvement in the level of knowledge was compared as measured via Test results 1 and 2. As each of the three groups had a different average score in Test results 1, an analysis needed to be conducted to assess the improvement based on relative changes in the average scores ( Δ p ¯ ) of Test results 1 and 2. The following formula was used:
Δ p ¯ = x ¯ x ¯ x m a x 100 % ,
where x m a x = 16 is the maximum achievable score of the math test (Appendix A). The results are shown in Figure 2.
The data show that only providing access to ICT tools (a specialized math software in our case) for individual use is not sufficient for improving students’ knowledge levels, as stated by [32]. Moreover, based on the above quantitative analysis, it was concluded that the most efficient teaching and learning method was a mix of traditional and ICT tools, as applied to experimental group 2. This supports the innovativeness and the sustainability of the transfer of math knowledge. For the teacher, the relative success according to individual tasks (in this case, the relative change in success according to individual tasks) of the didactic test is also important.

3. Short Overview of Computer Tools used in STEAM Education

3.1. Reasoning for the Use of CAS and DGS

Based on the above quantitative analysis (Section 2), it was concluded that the most successful method of learning mathematics, the process to achieve sustainable knowledge, is to use a mix of traditional teaching methods and computer tools.
The rapid changes in ICT, the increase in the available computer power, and the complexity of mathematical software accessible to students demand a radical re-thinking of how topics in the curriculum should be presented and the impact that they have on the teaching of mathematics in STEAM education [33,34,35,36,37,38,39,40,41].
There are two connected but distinct issues related to the increased availability of computers and software, which are both of considerable importance to the mathematics curriculum. The first issue is that new, innovative approaches to teaching and learning are made possible. The second issue is that enormously sophisticated mathematical software is now commonly available, allowing problems of such size and complexity to be tackled, problems that have only become part of research in recent years. Students require a personal knowledge of mathematics to be able to use mathematical software reliably and effectively. Students must not simply learn the relevant commands in the software package available to them. They must learn to discerningly use these packages, from a base of mathematical knowledge that will inform them when the computer solution may become unreliable.
According to Philip J. Davis: “In the hands of Newton and Leibnitz, calculus was a theory that involved geometrical figures. These formed a part of the reasoning. There followed thereupon a gradual decline of the image in mathematics in favor of the symbolic, and by the early 20th century, the image was all but dead. Why? Computer graphics has to some extent restored the image to its former prominence in mathematics and promises in the future to be an important but uneasy partner with the symbolic” [42].
CA System (such as Maple, Mathematica, Mathcad, Mathlab, Derive, Maxima, Reduce) is a software package “that facilitates symbolic mathematics. The core functionality is the manipulation of mathematical expressions in symbolic form” [43]. Dynamic Geometry Systems (DGS) (such as GeoGebra, Cabri, Cinderella, Geometer’s SketchPad) “or interactive geometry software”, “allows one to create and then manipulate geometric constructions, primarily in plane geometry” [43]. This software is based on programs using results of computer algebra and contains more or fewer possibilities for symbolic computations and graphing. CAS and DGS are compelling tools, but only to the extent that they are consciously used to correctly interpret the computer’s “responses” and consciously find the methods that are most appropriate for a specific task or technical application. Questions need to be asked “correctly” and “translated” to the language of mathematics to solve real-life tasks using a computer program or other technical questions. Furthermore, the results obtained need to be interpreted and “reversed” into real-life language or technical applications. The principle of white box mathematics means that computer algebra tools help those who use them not only to assist them in solving tasks but also to develop them further, raise new questions and, ultimately, reach a higher level of understanding and application in mathematics [23].
Equally, the variety of available software could be an obstacle for teachers or students when deciding on the right software to use for different educational scenarios. The availability of software (commercial software, such as Maple [44], Mathematica, Geometer’s SketchPad [45], or open-source software, such as Reduce, wxMaxima [46], GeoGebra [47]) might also be critical, especially for low-income countries. There are different ways to find more about computer tools, and this can be a good method for understanding the way that these tools function [34,36].

3.2. Short Overview of the Most Relevant Software Packages

The large variety of computer tools, CAS and DGS [48], can be analyzed and presented from different angles. It is essential to know details such as the operating systems and their support, the platforms these tools are available on, the language to implement them, their functionalities, and the main mathematical functions built in the software. Furthermore, it is important to know if the tools are commercial products. These tools make computations based on their programmed algorithms; therefore, the results must be analyzed in the context of mathematical or real-life problems in order to choose the solution that is suitable for the task in question. This analysis must rely on a solid mathematical background. Thus, the most crucial thing is to make the user aware that CAS data must be interpreted using mathematical knowledge.
The present paper contains examples of the comparative use of wxMaxima, GeoGebra, Maple, and Excel.
wxMaxima is an open-source mathematics software, and it is released and distributed under the terms of the GNU General Public License (GPL). This allows everyone to modify and distribute it, as long as its license remains unmodified. In this article, the term “wxMaxima” is used more often, but the terms “Maxima” and “wxMaxima” can be used interchangeably. “wxMaxima is a document-based interface for the CAS Maxima…provides menus and dialogs for many common maxima commands, autocompleting, inline plots, and simple simulations” [49]. A brief presentation on wxMaxima’s strengths and limitations through the use of examples was recently published; see [50]. GeoGebra for interactive geometry and algebra is globally quite well-known among mathematics educators. It is an open-source mathematics software. In the article by Kovacs et al. [51], examples of GeoGebra’s impact on different educational contexts are presented. Maple [52] is powerful math software that is easy to use and meets the requirements needed for STEAM education. It is one of the well-known commercial 3M mathematical software programs (Maple, Matlab, Mathematica); thus, one needs to purchase a license before using it. In [53], topics in education and different applications of Maple are presented. The well-known commercial spreadsheet program from Microsoft, MS Excel, was launched in 1985 and is widely available to students. When using MS Excel, the change in the content of one cell automatically leads to the recalculation of one or more cells based on a user-defined relationship. The user can activate its Tool packages, and the Solver package is successfully used in Operation research education for STEAM students. With the latest version of Excel 2019 and Excel365, it became the most flexible and most commonly used business application in the world due to its ability to adapt to almost any business process [54,55].

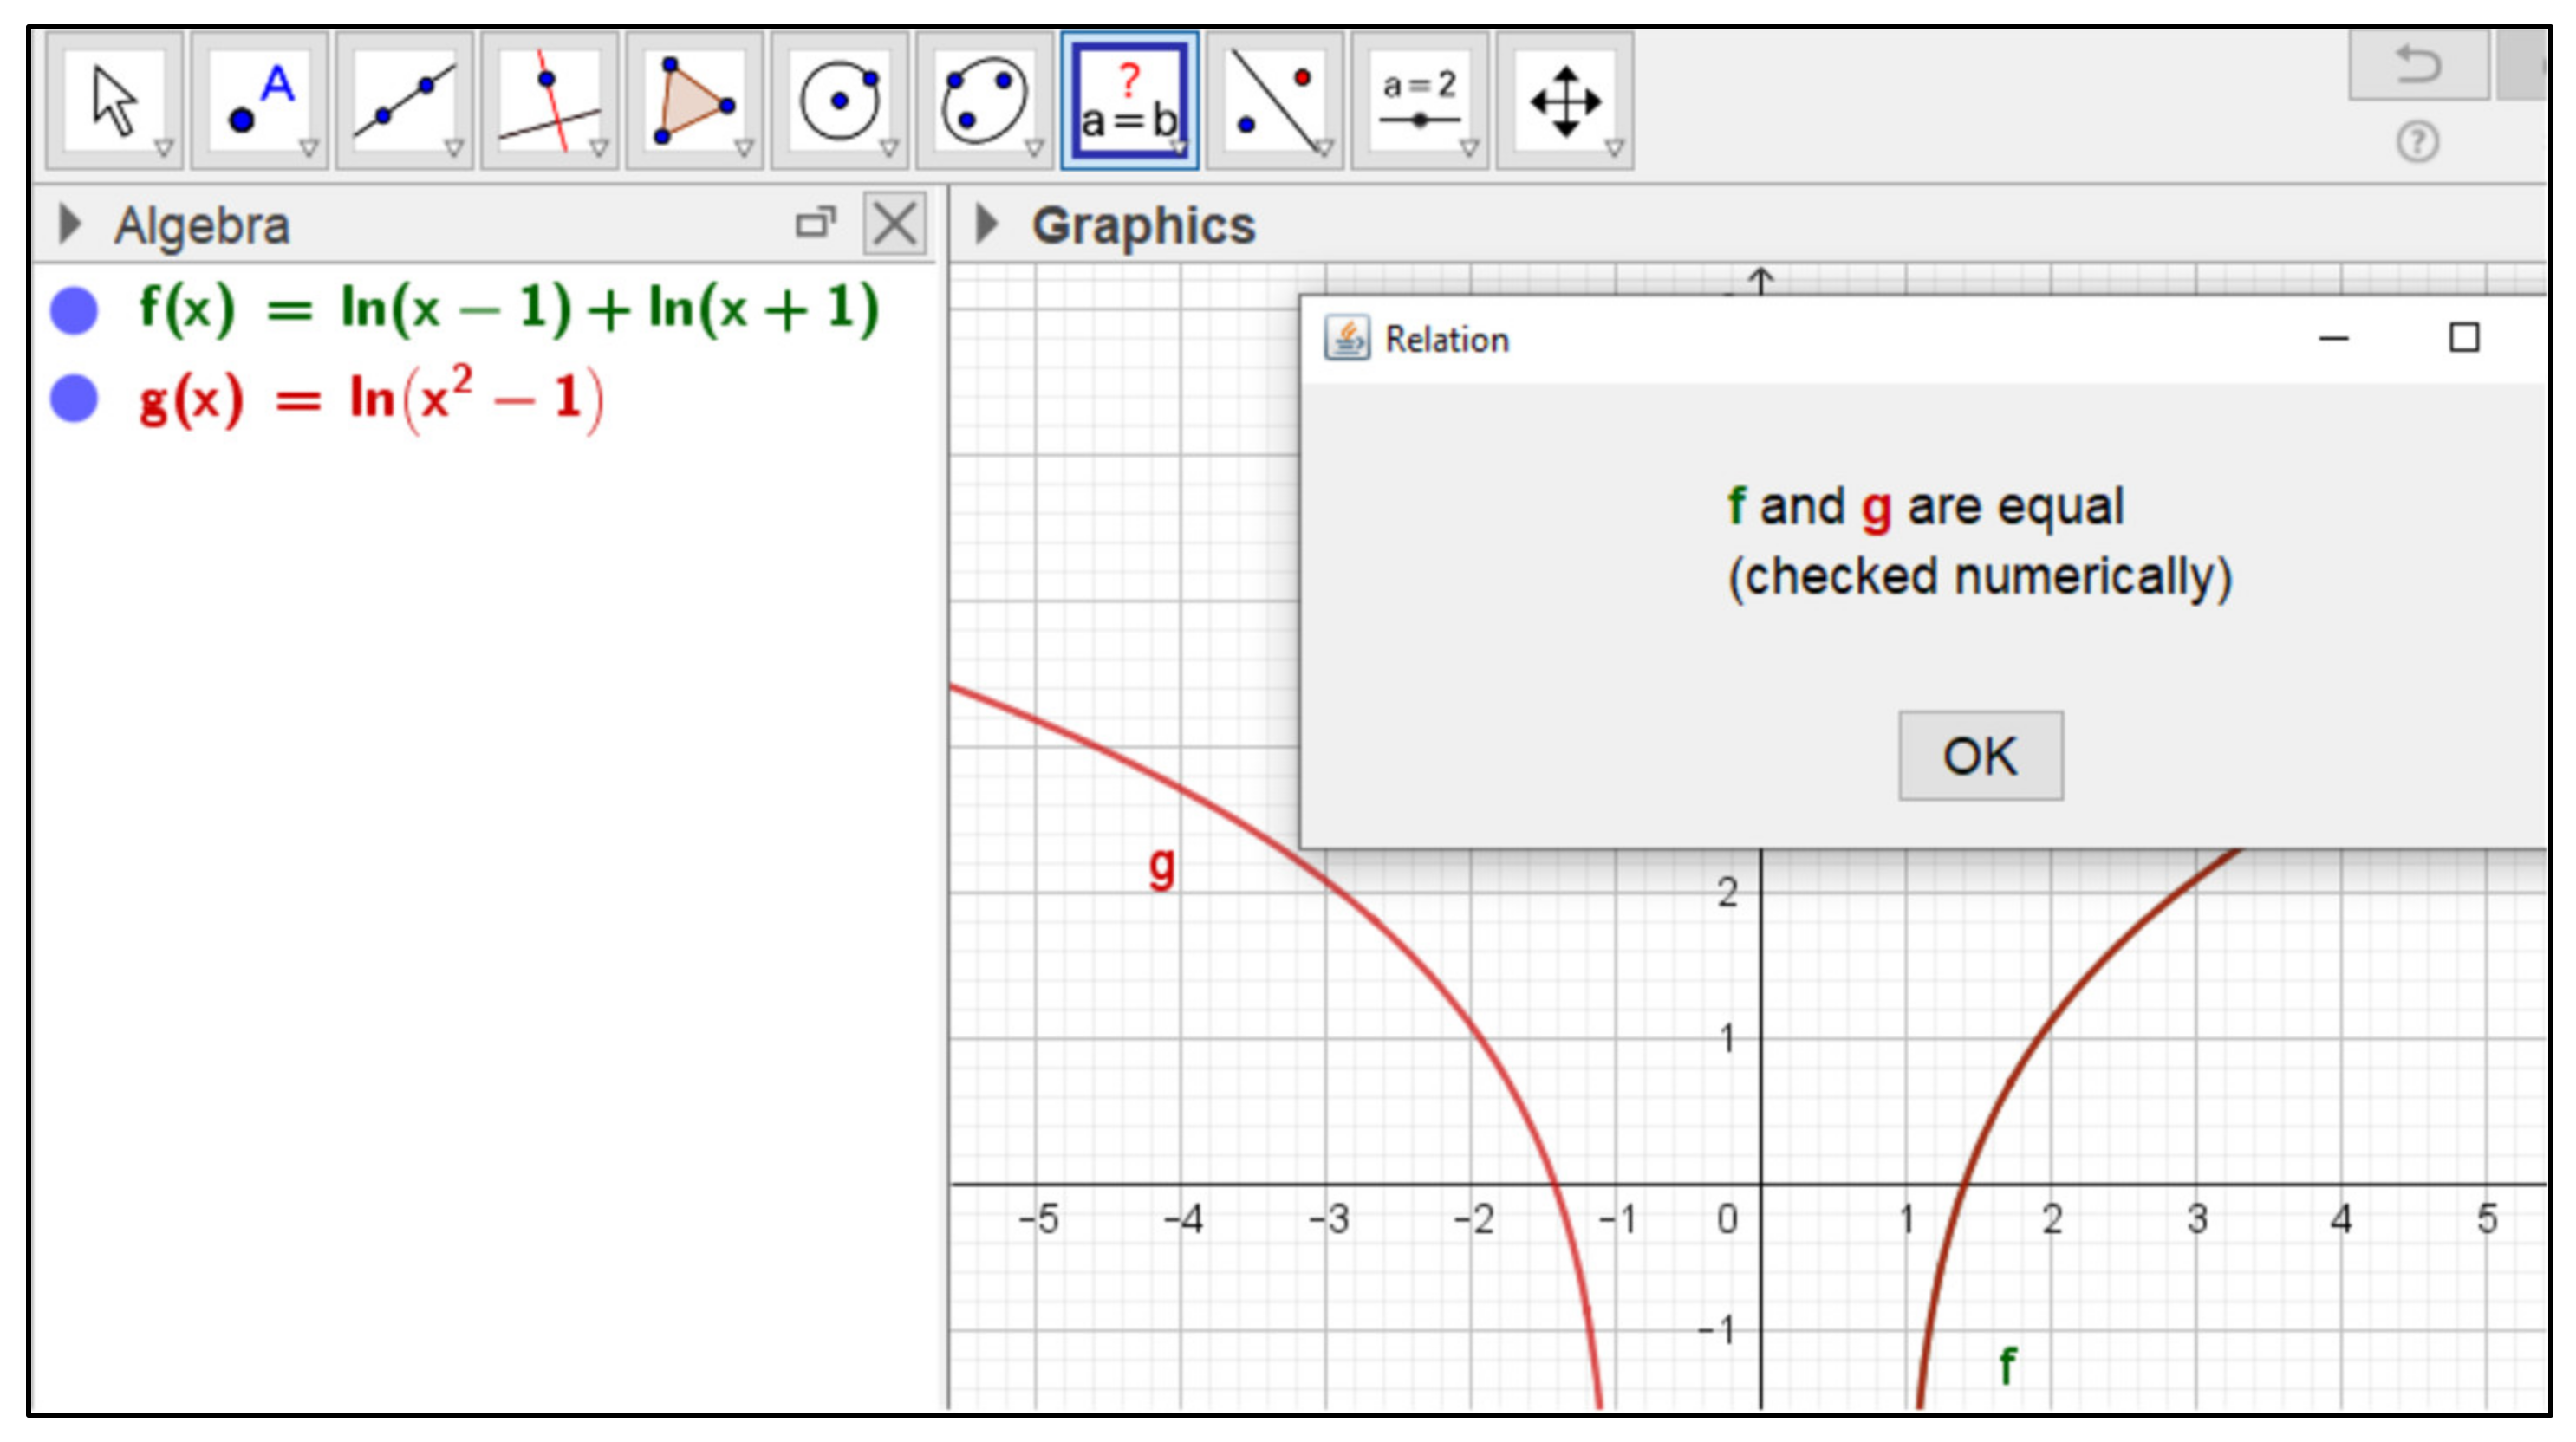
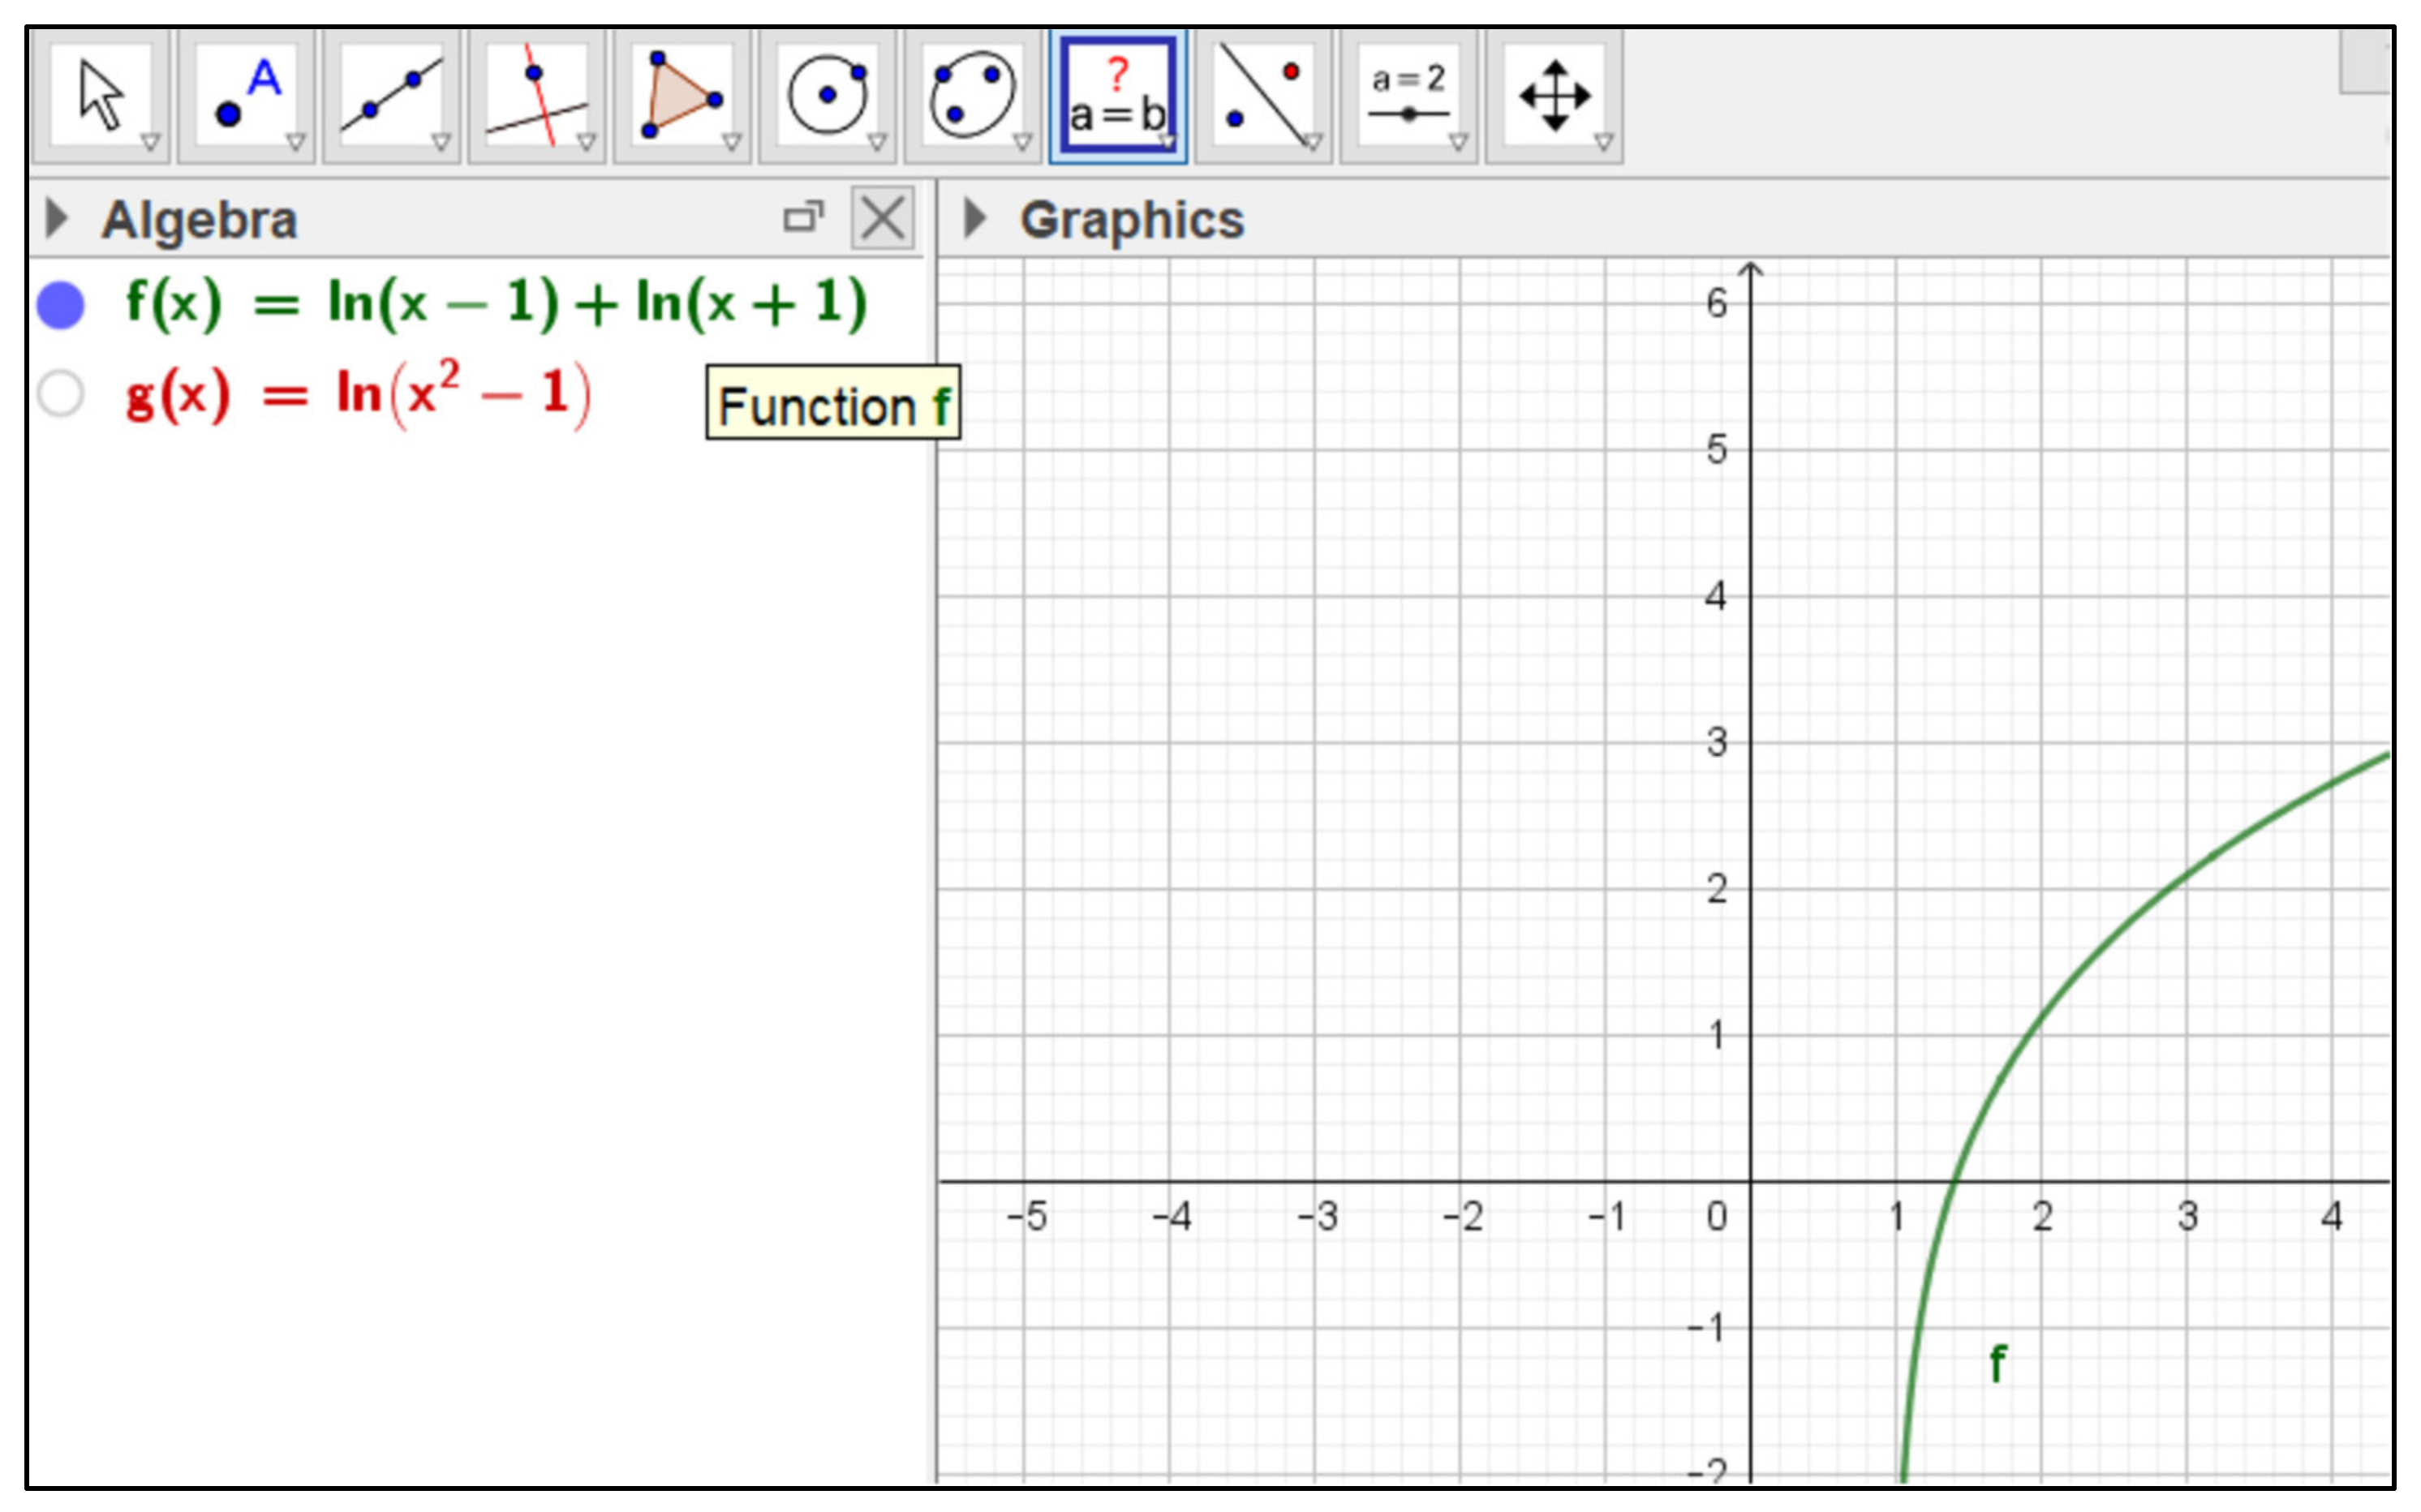
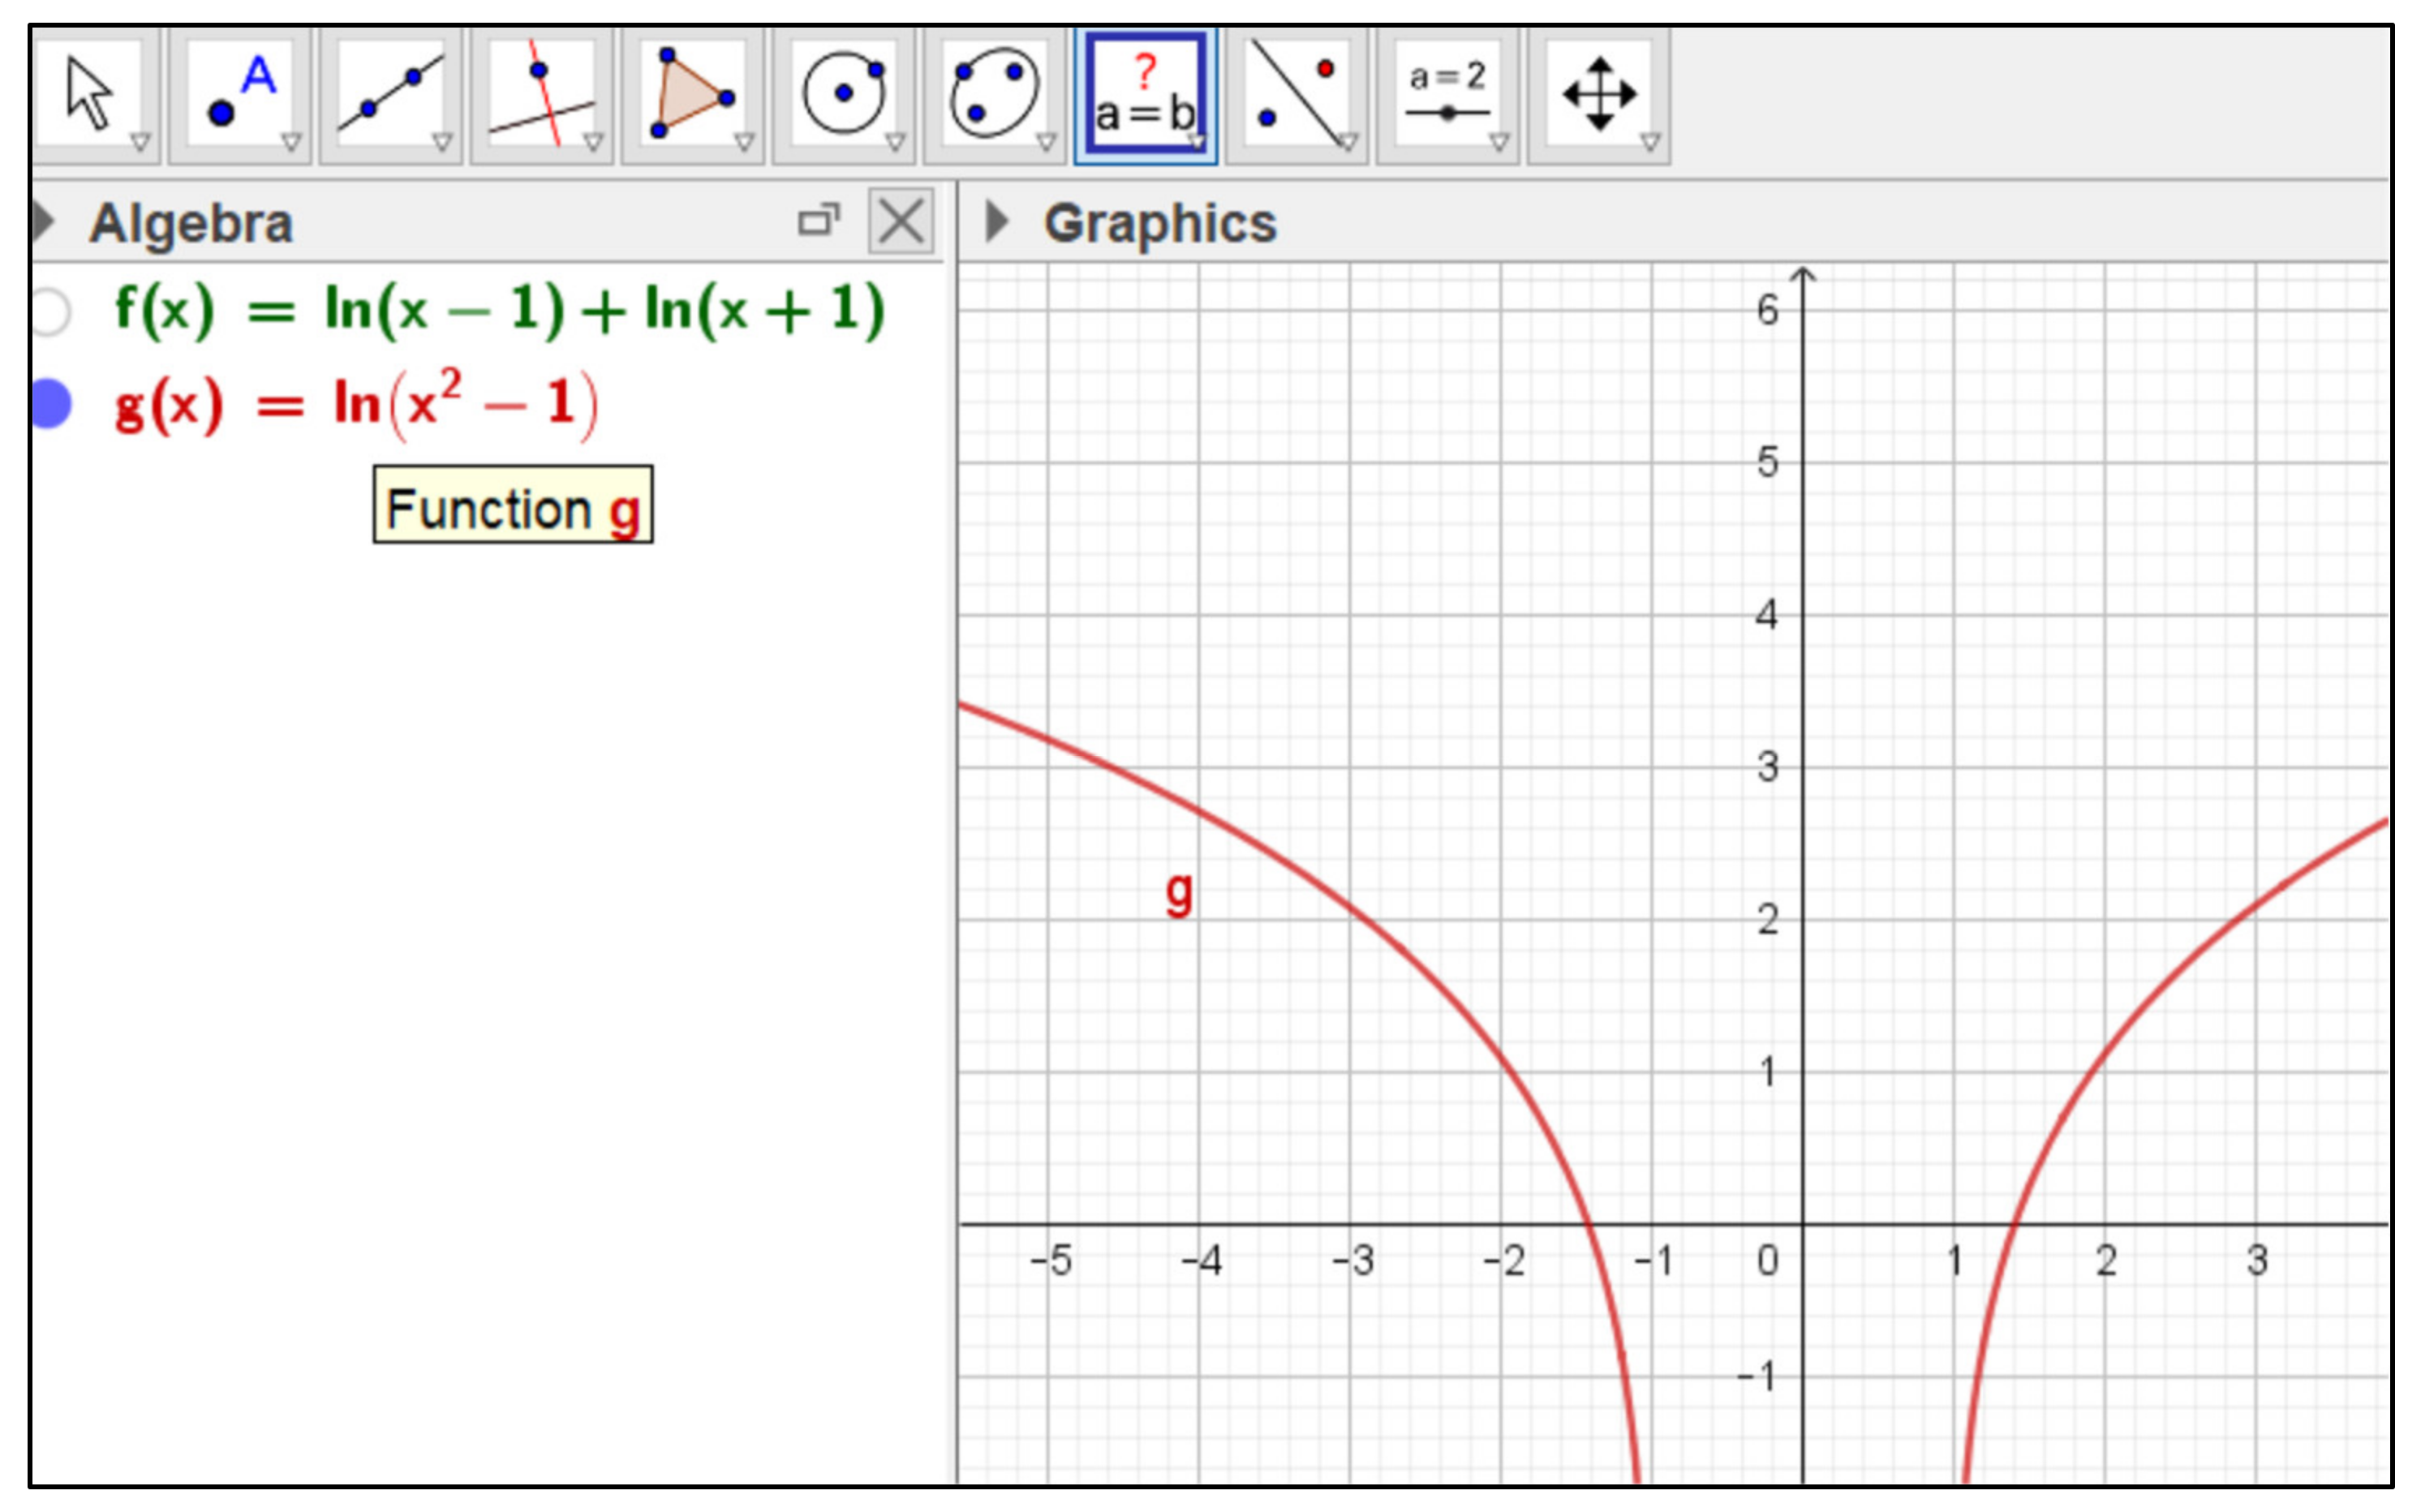
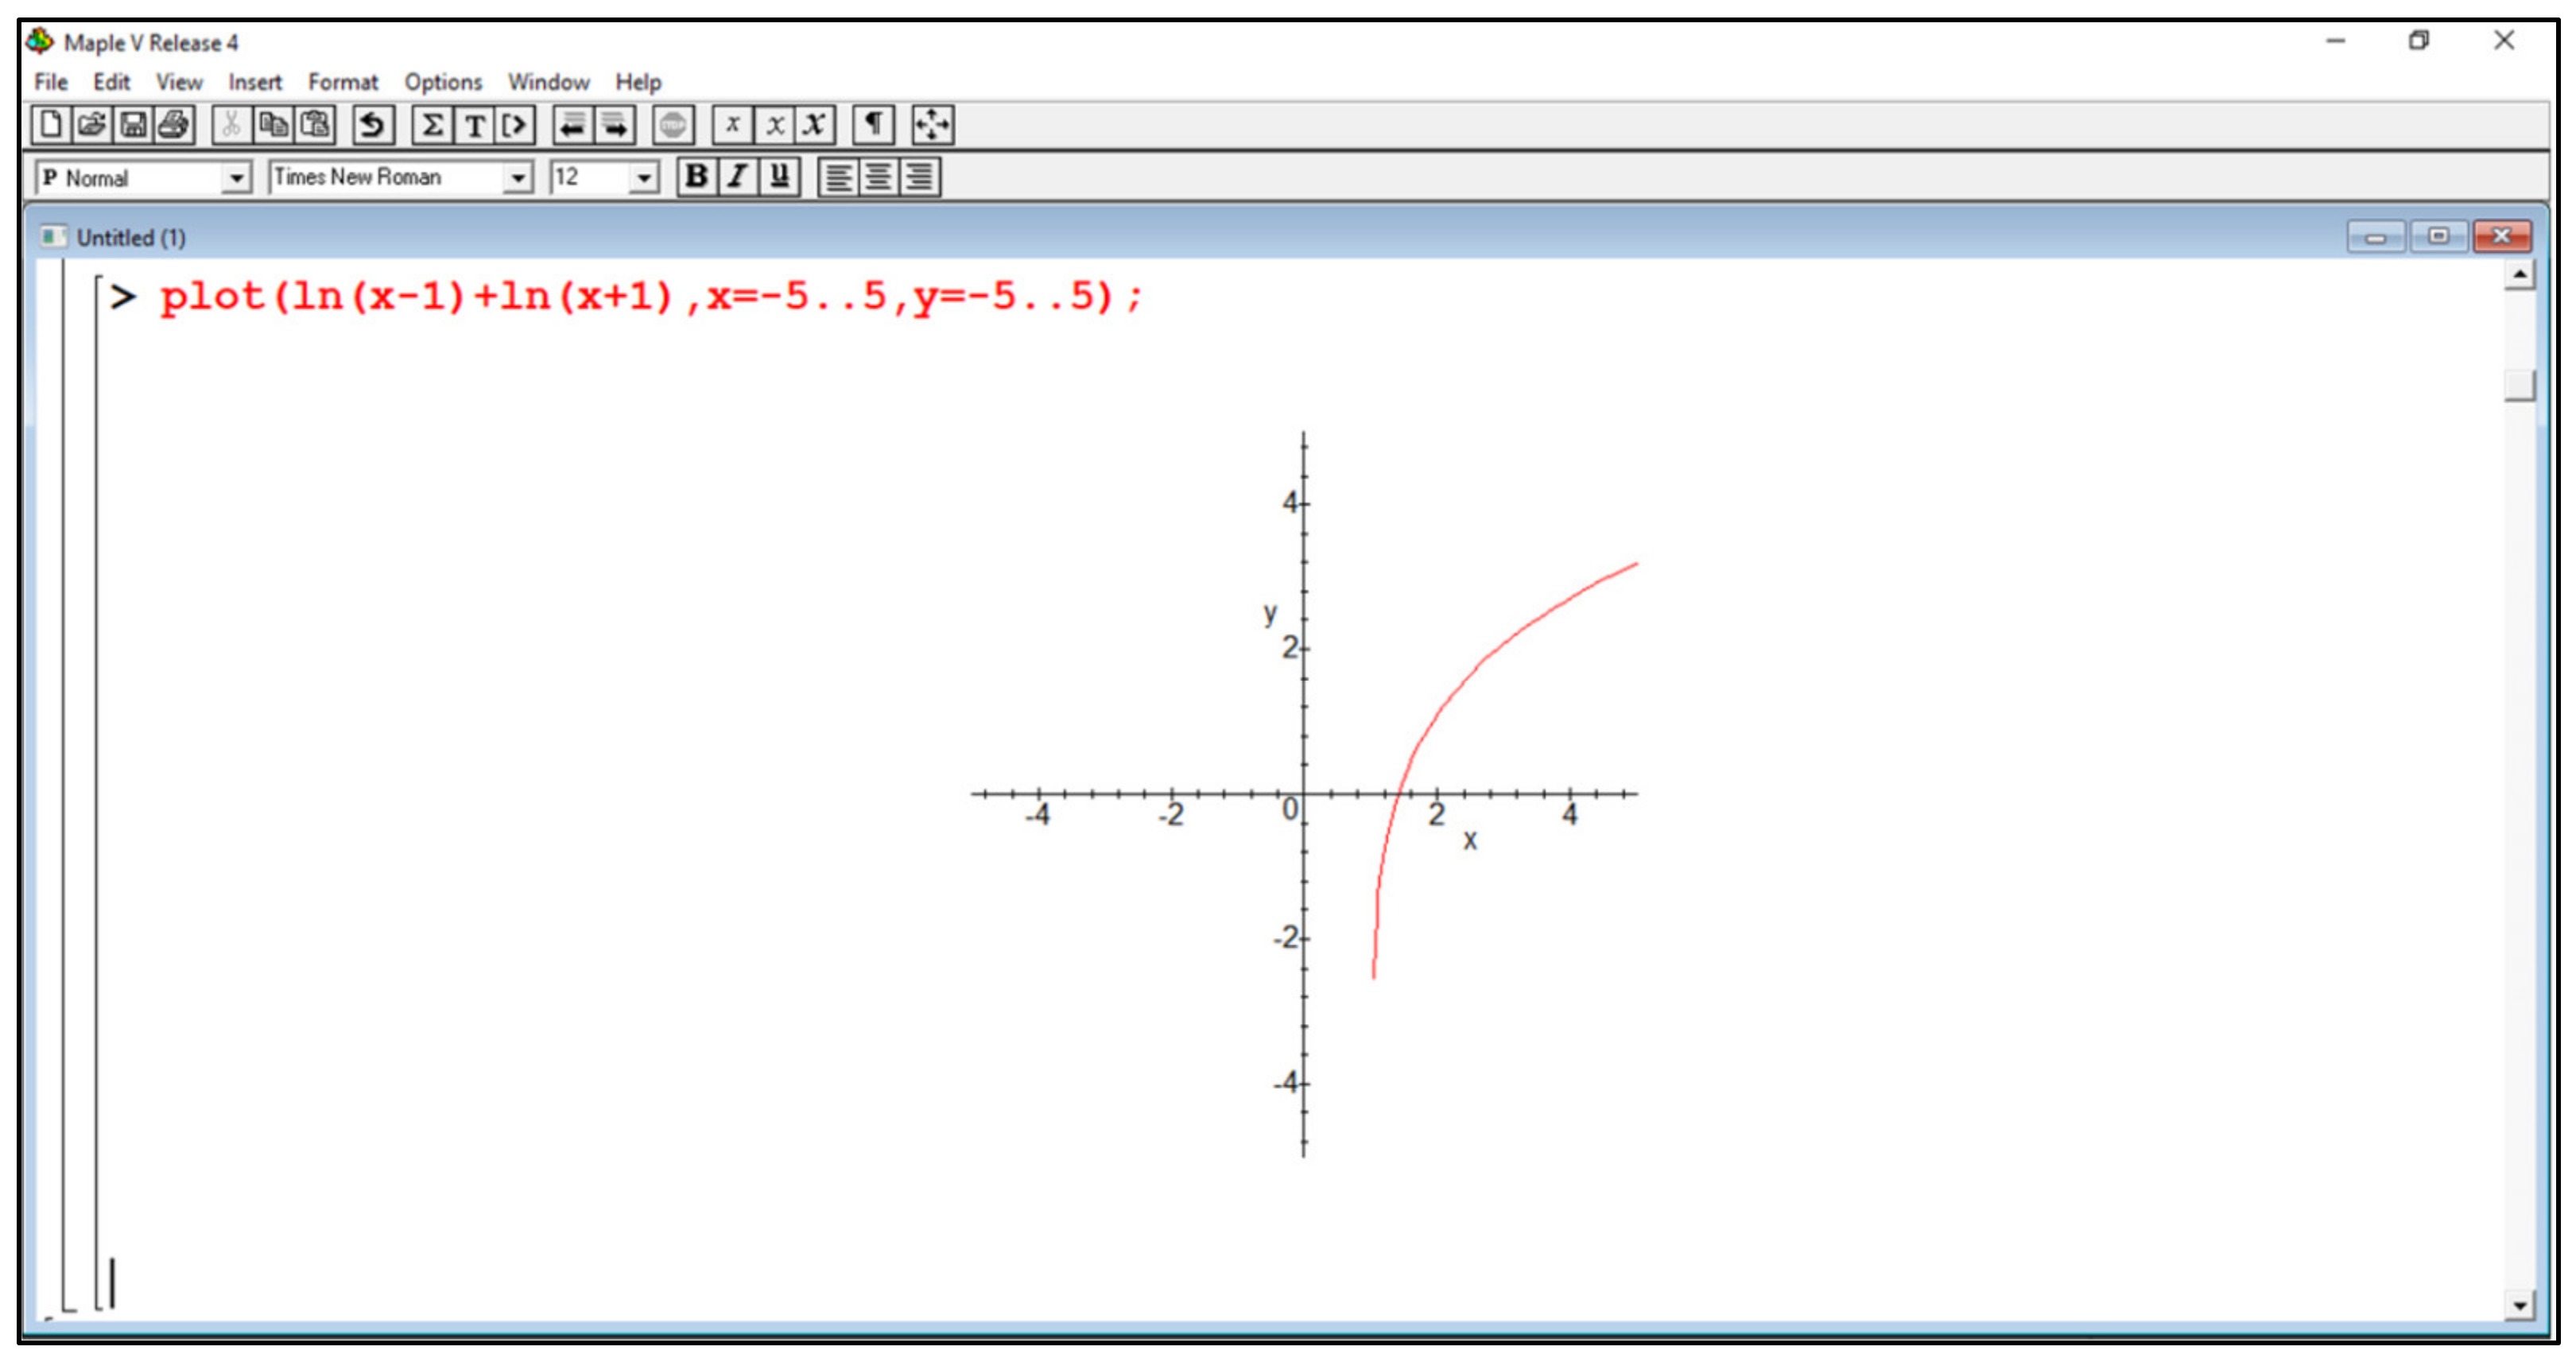
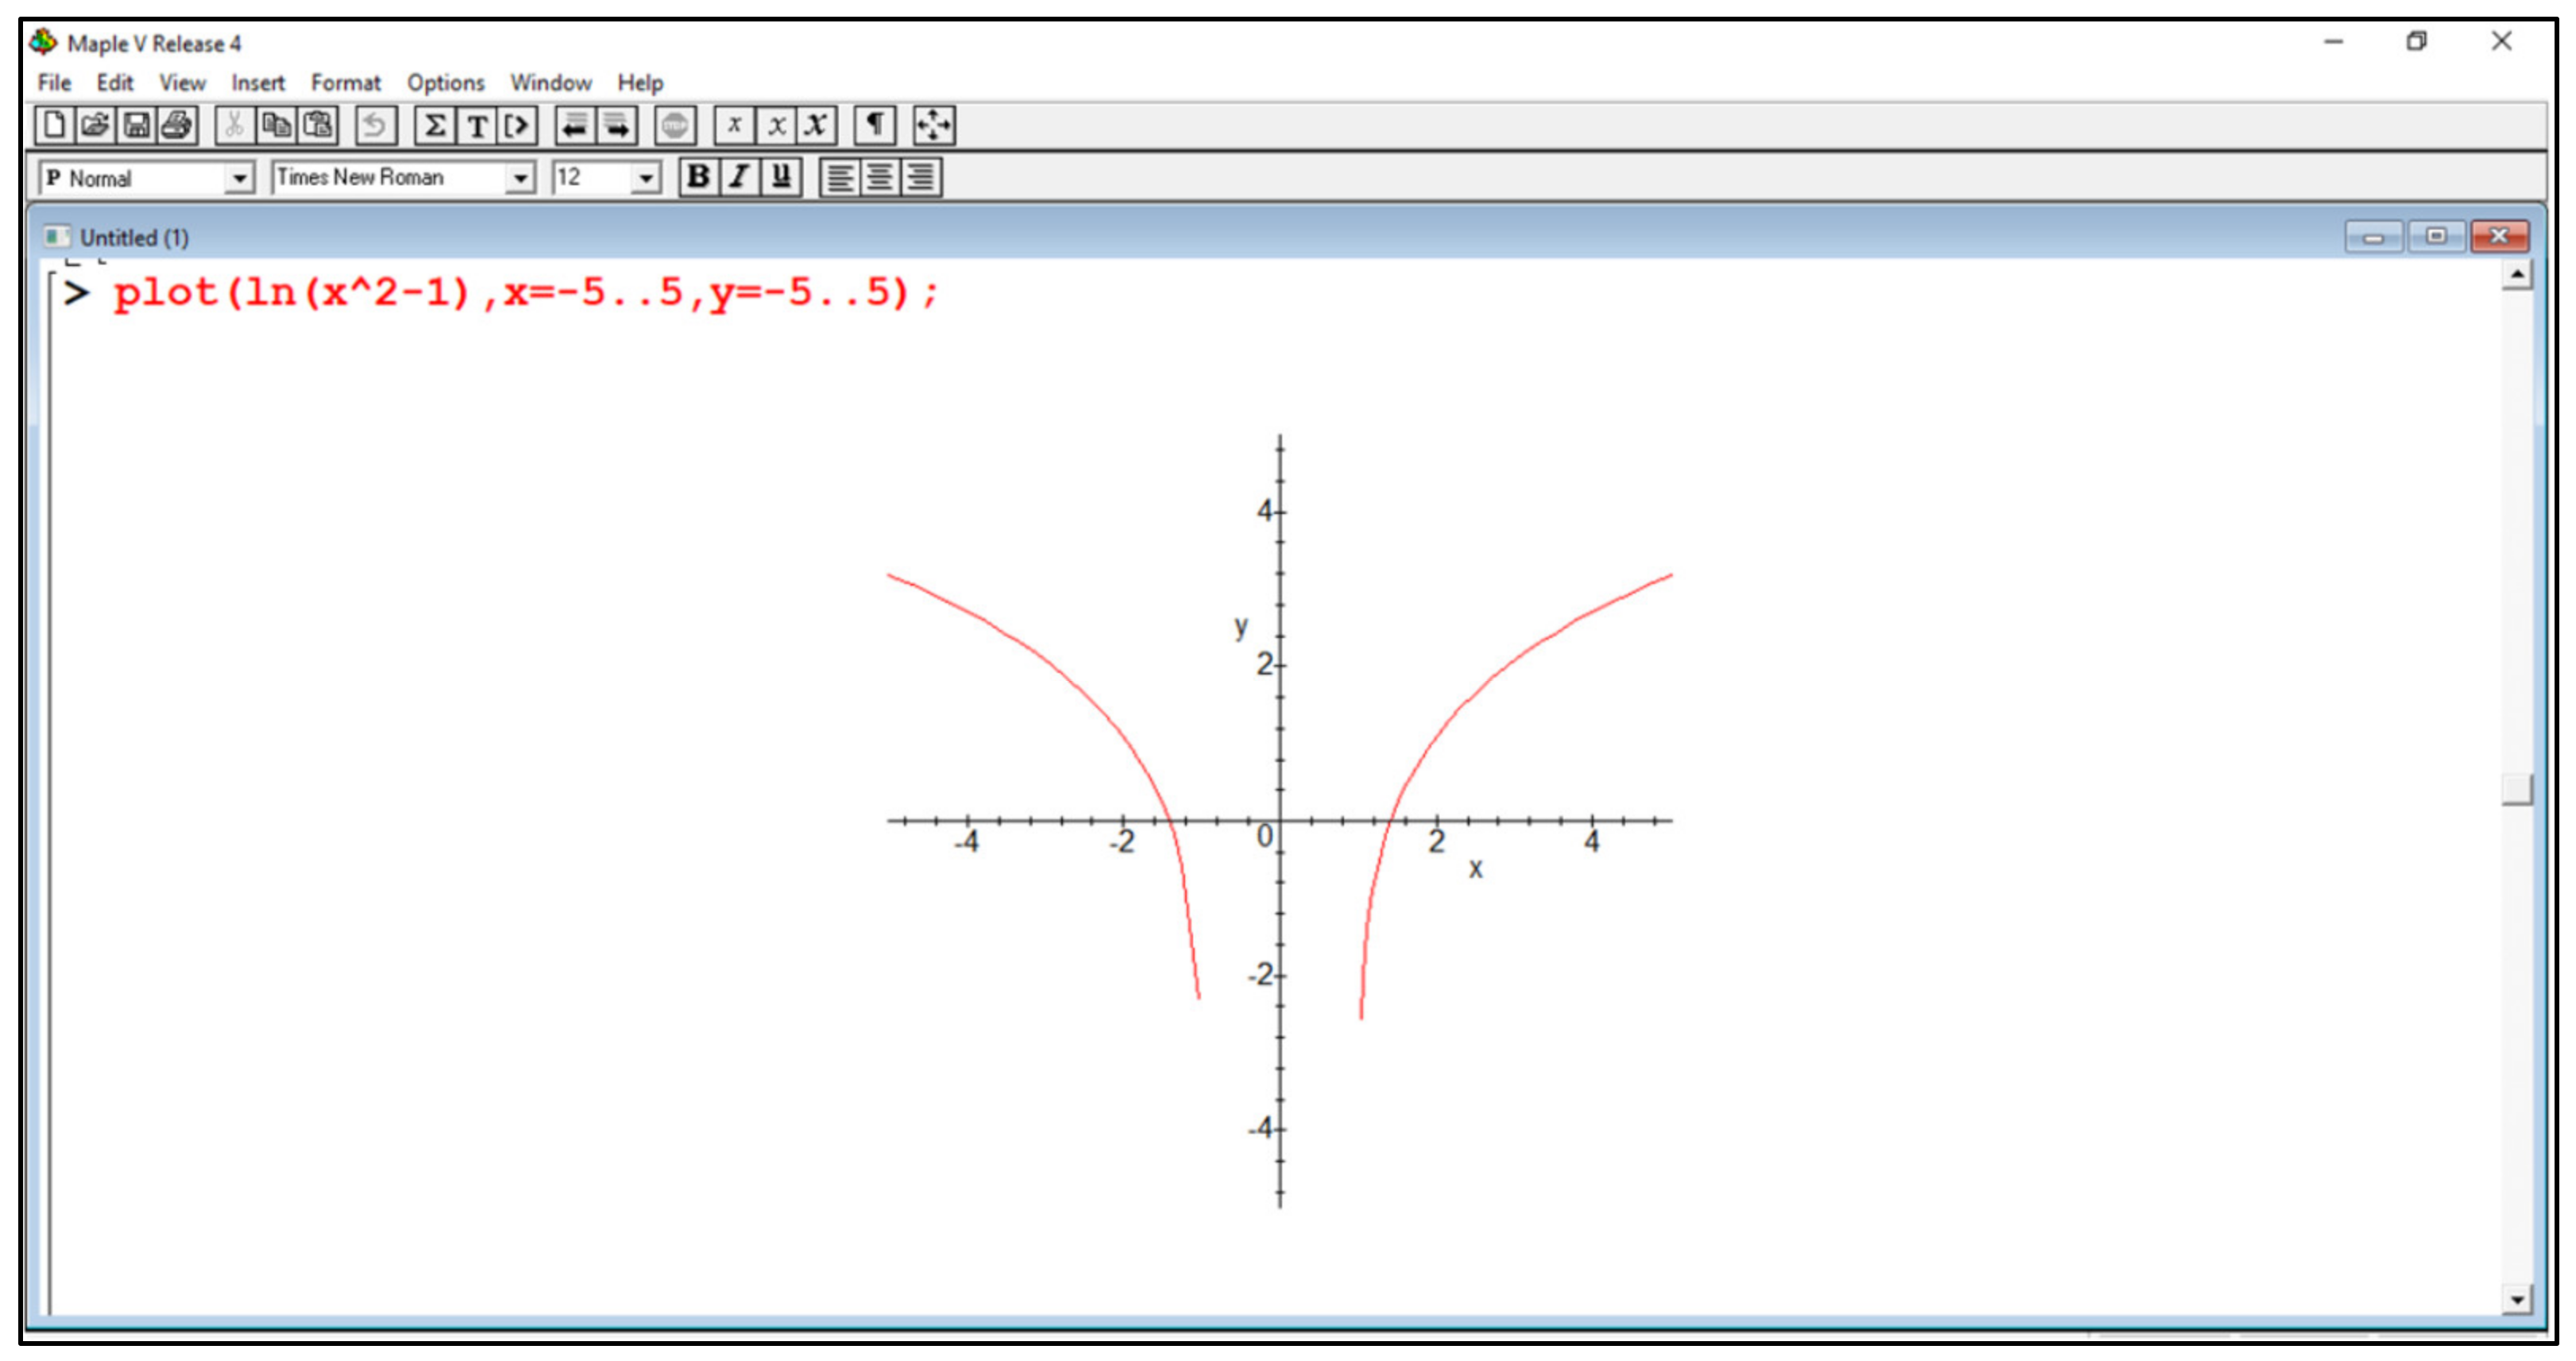
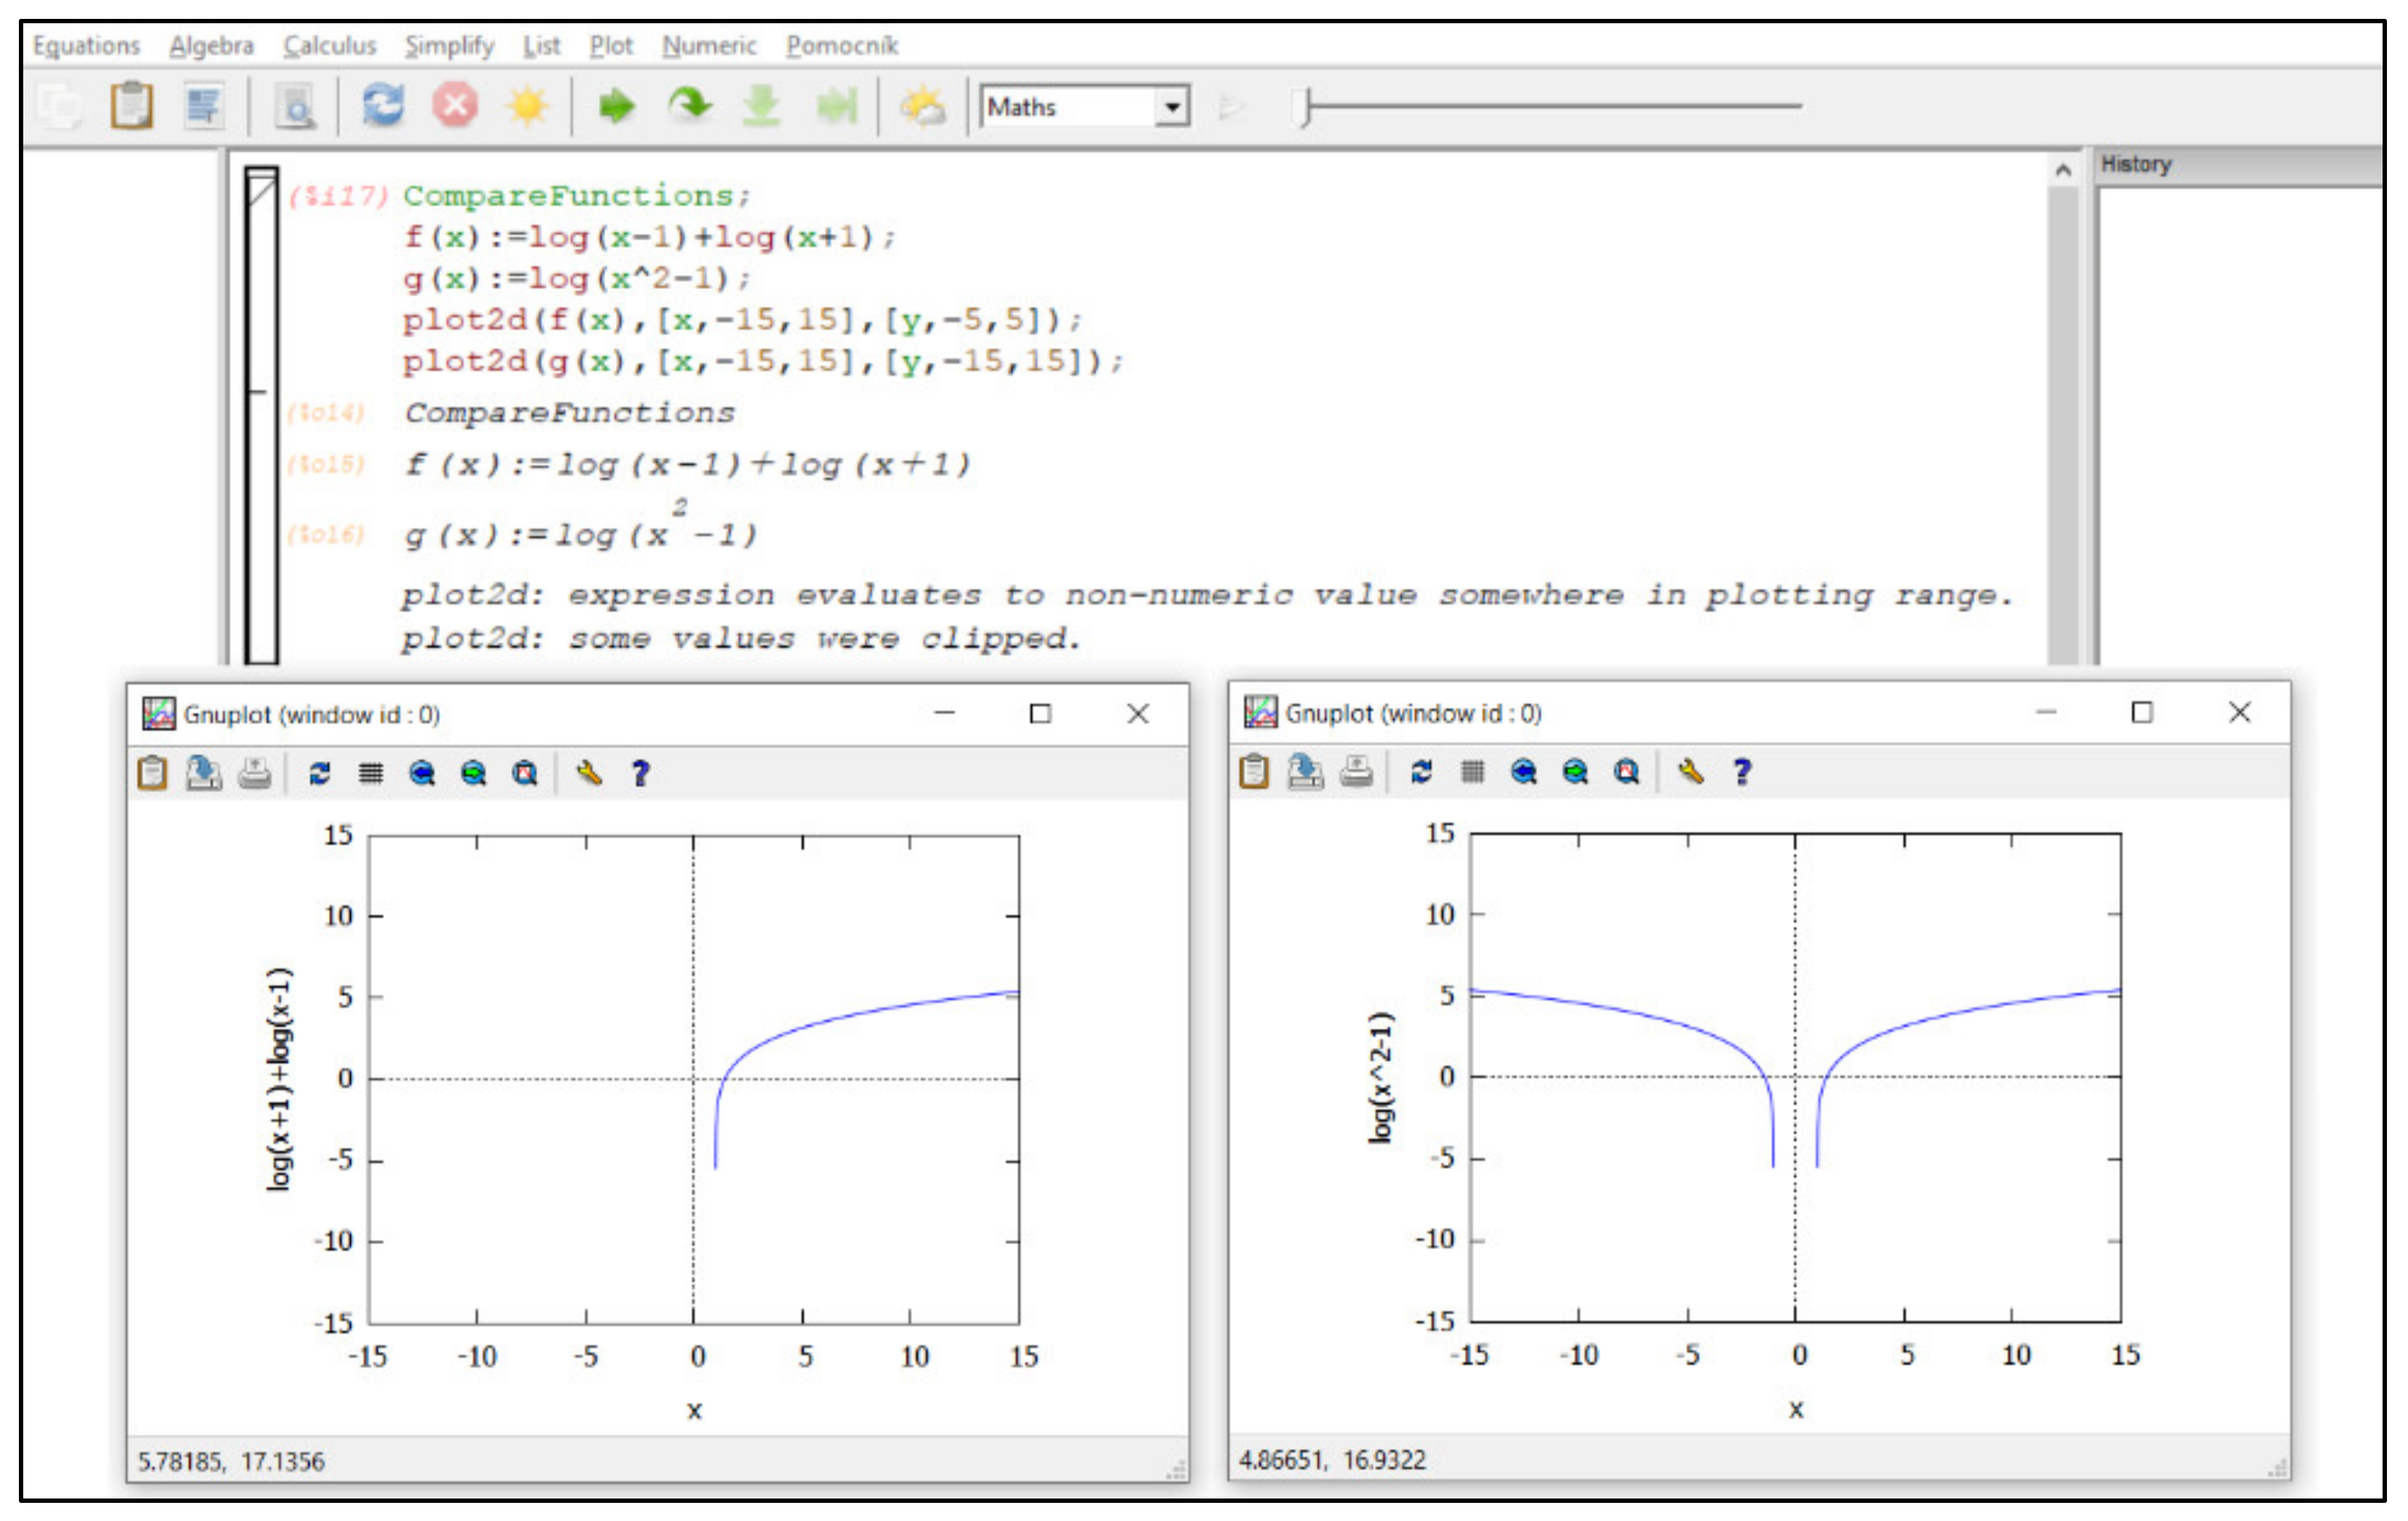
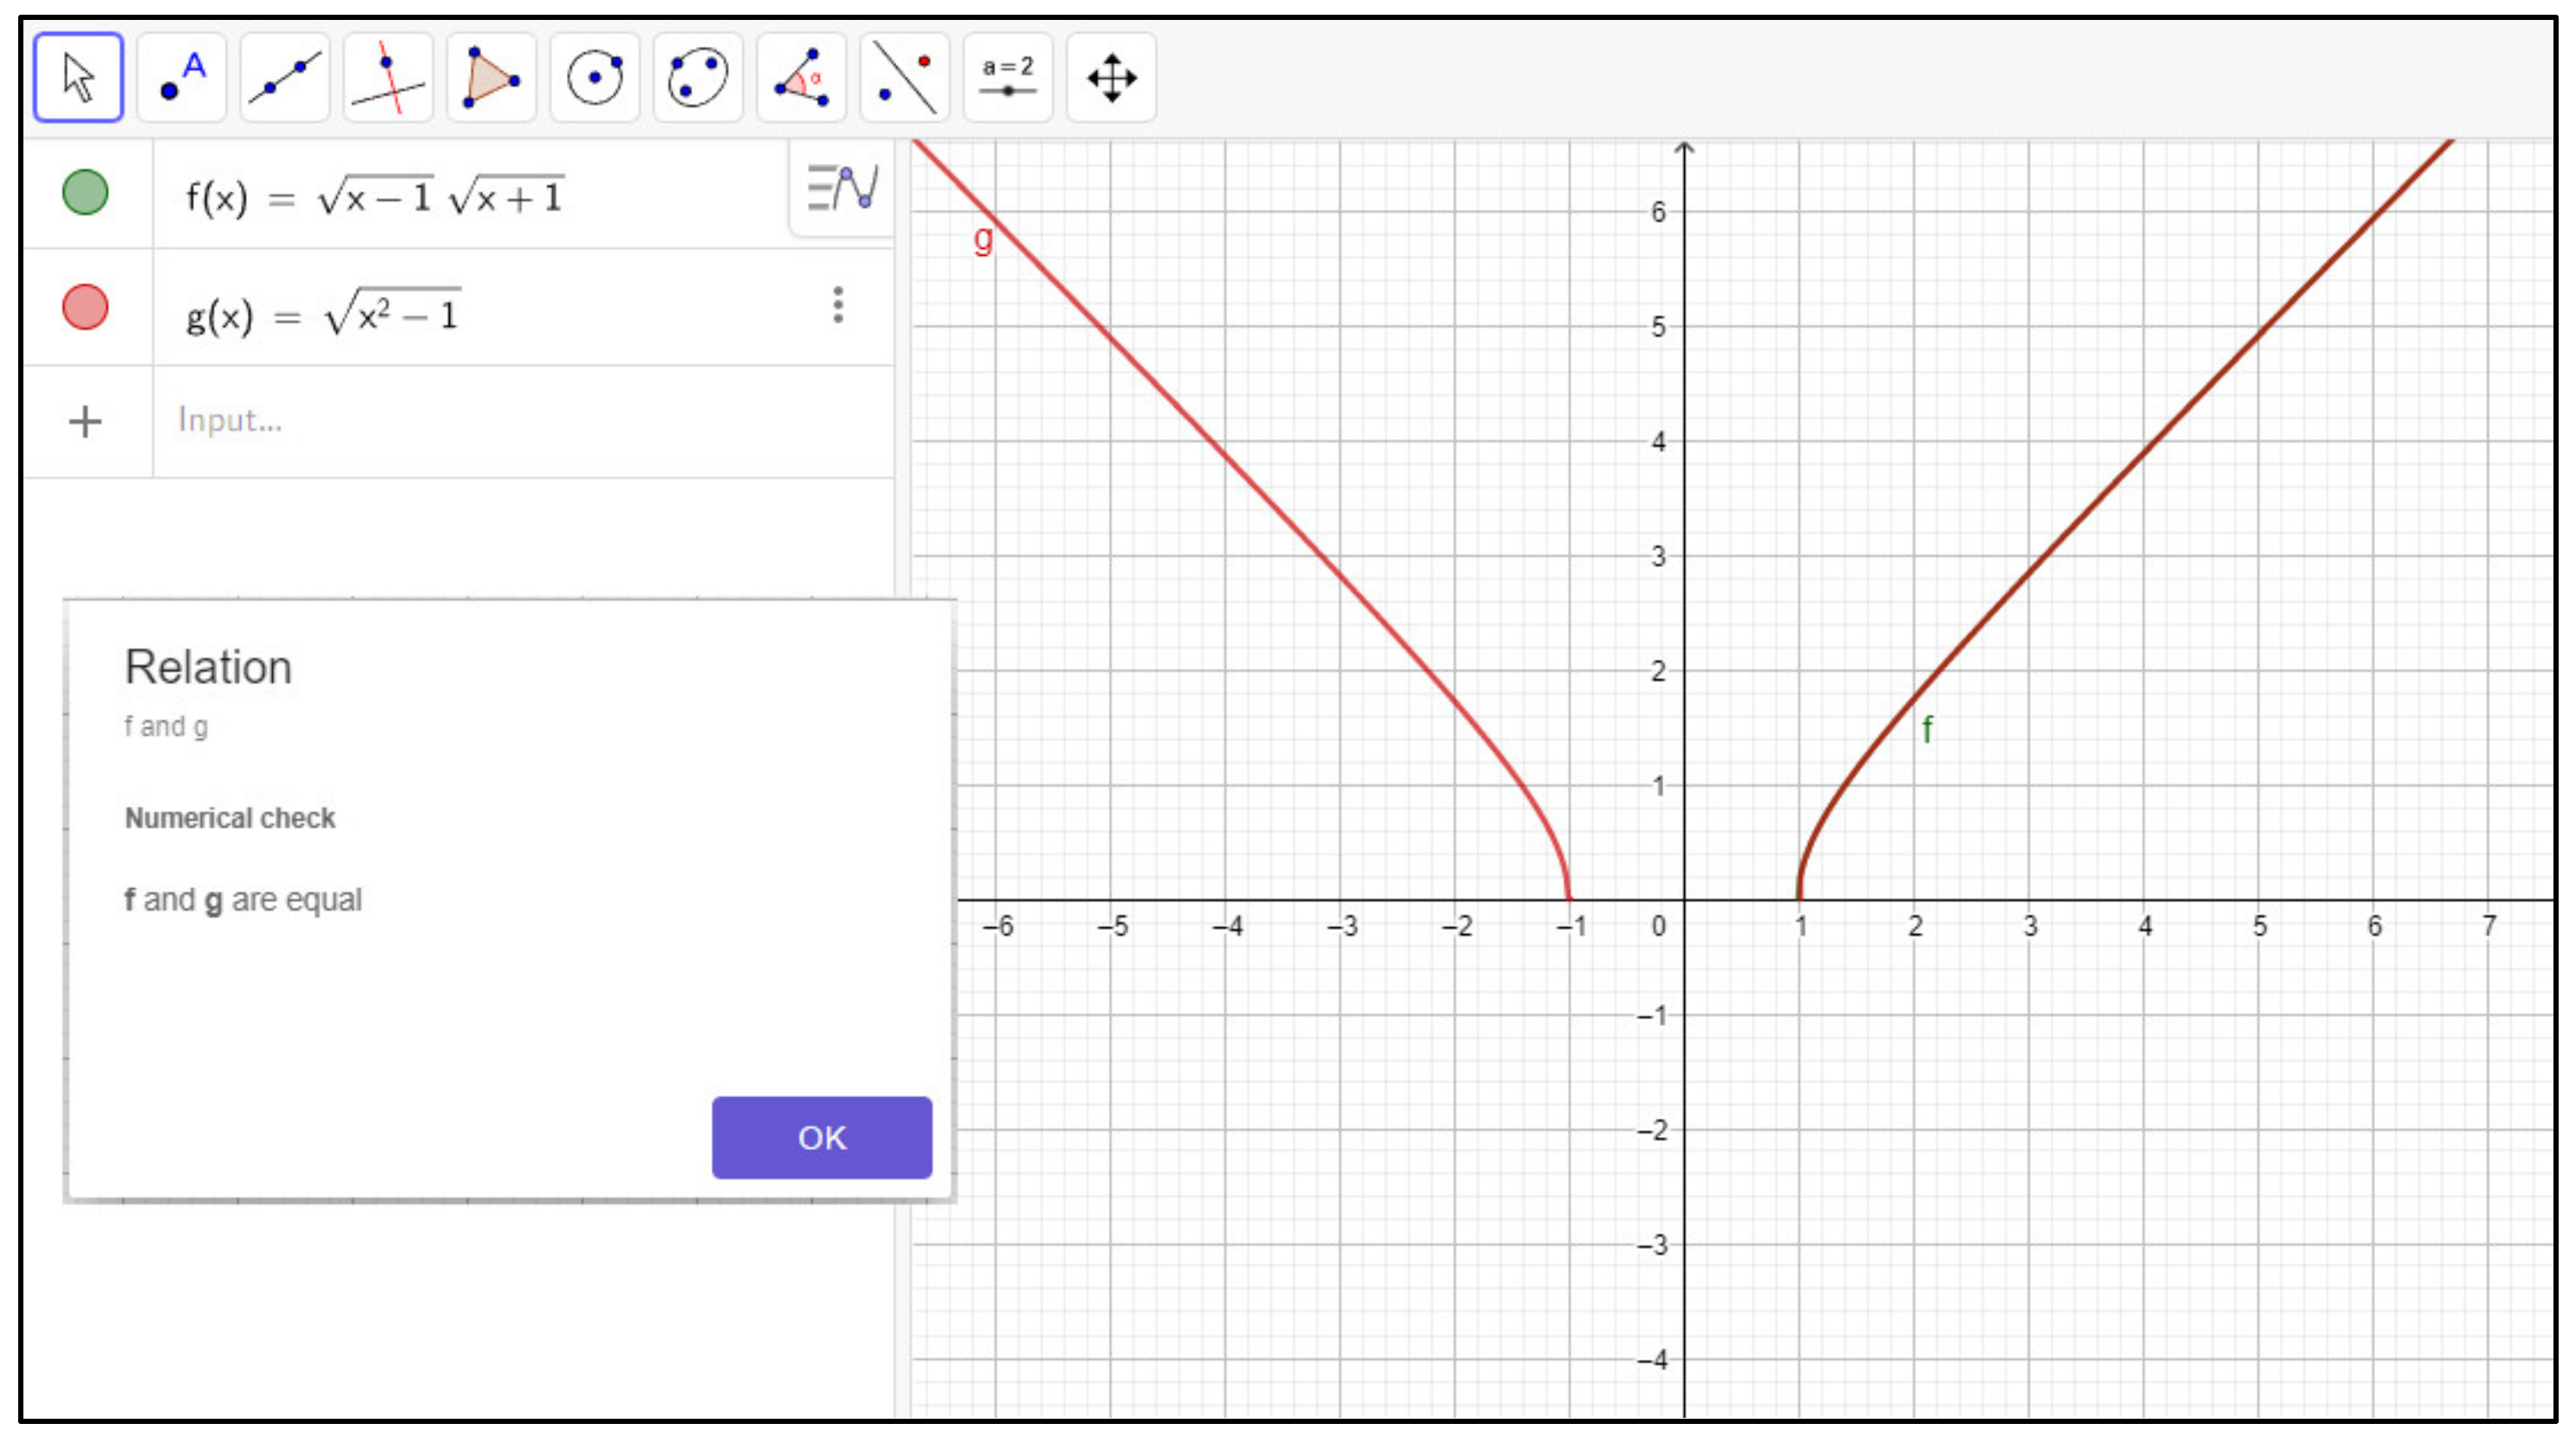
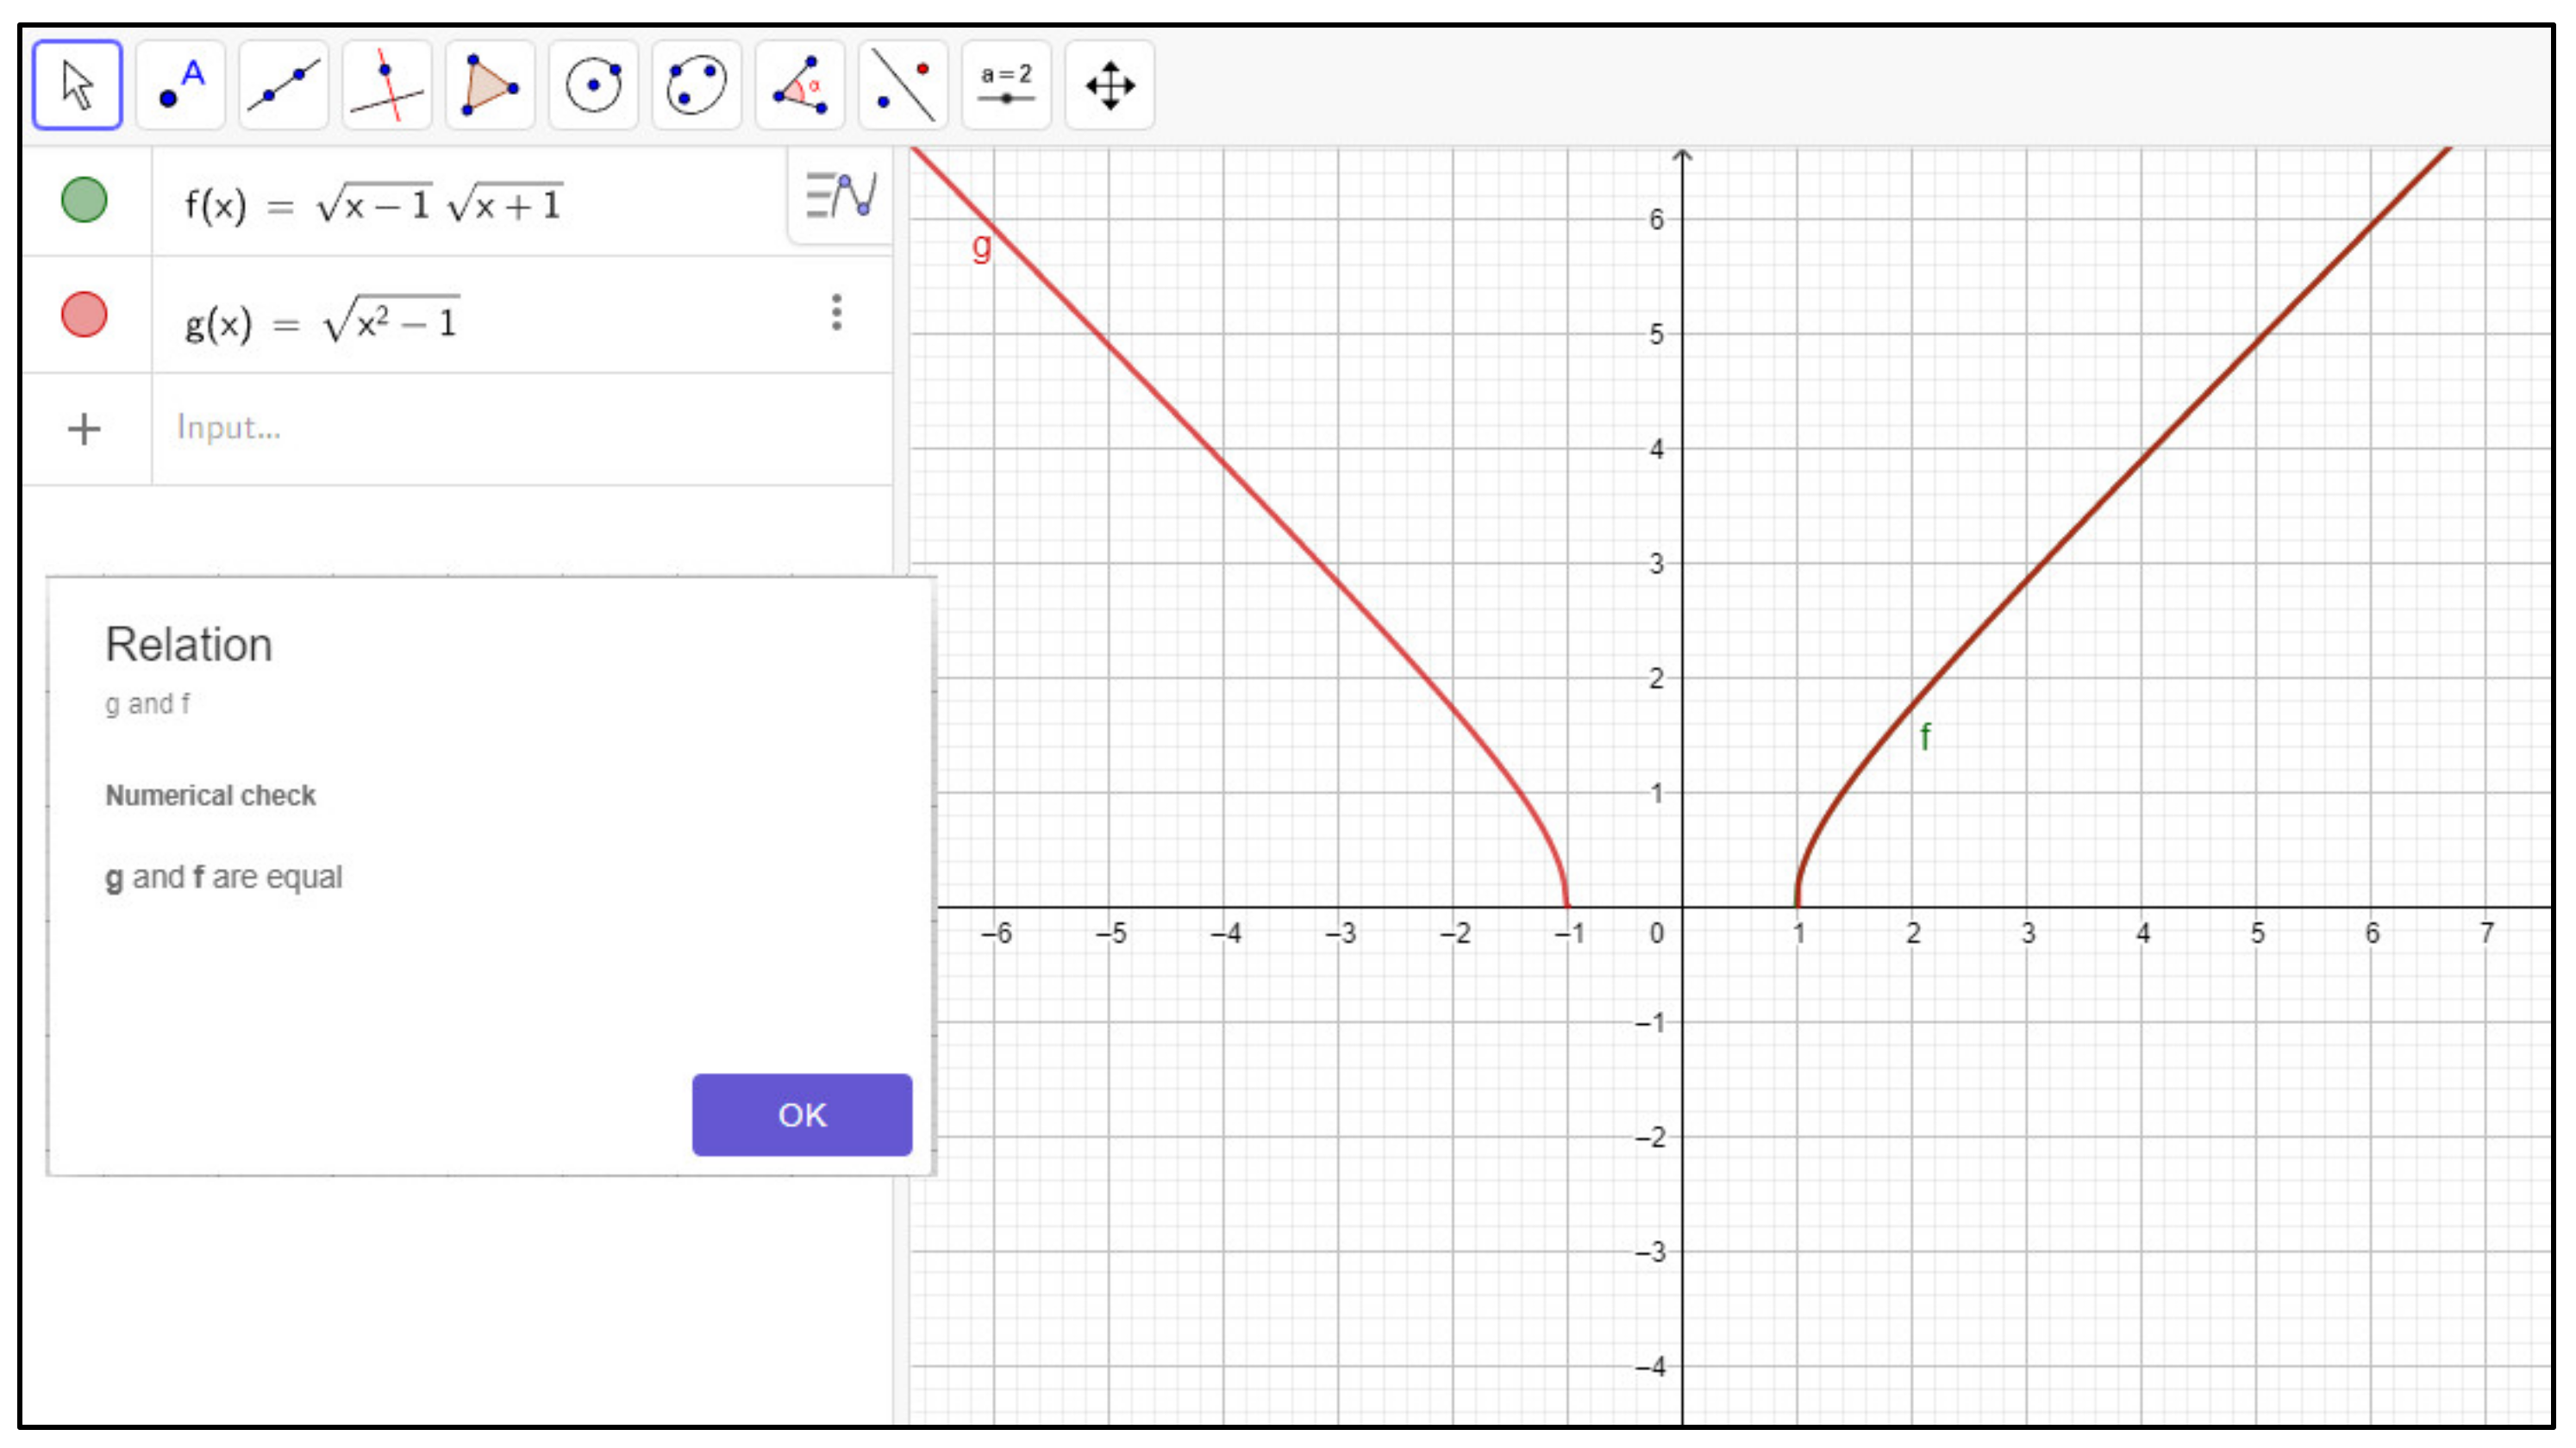
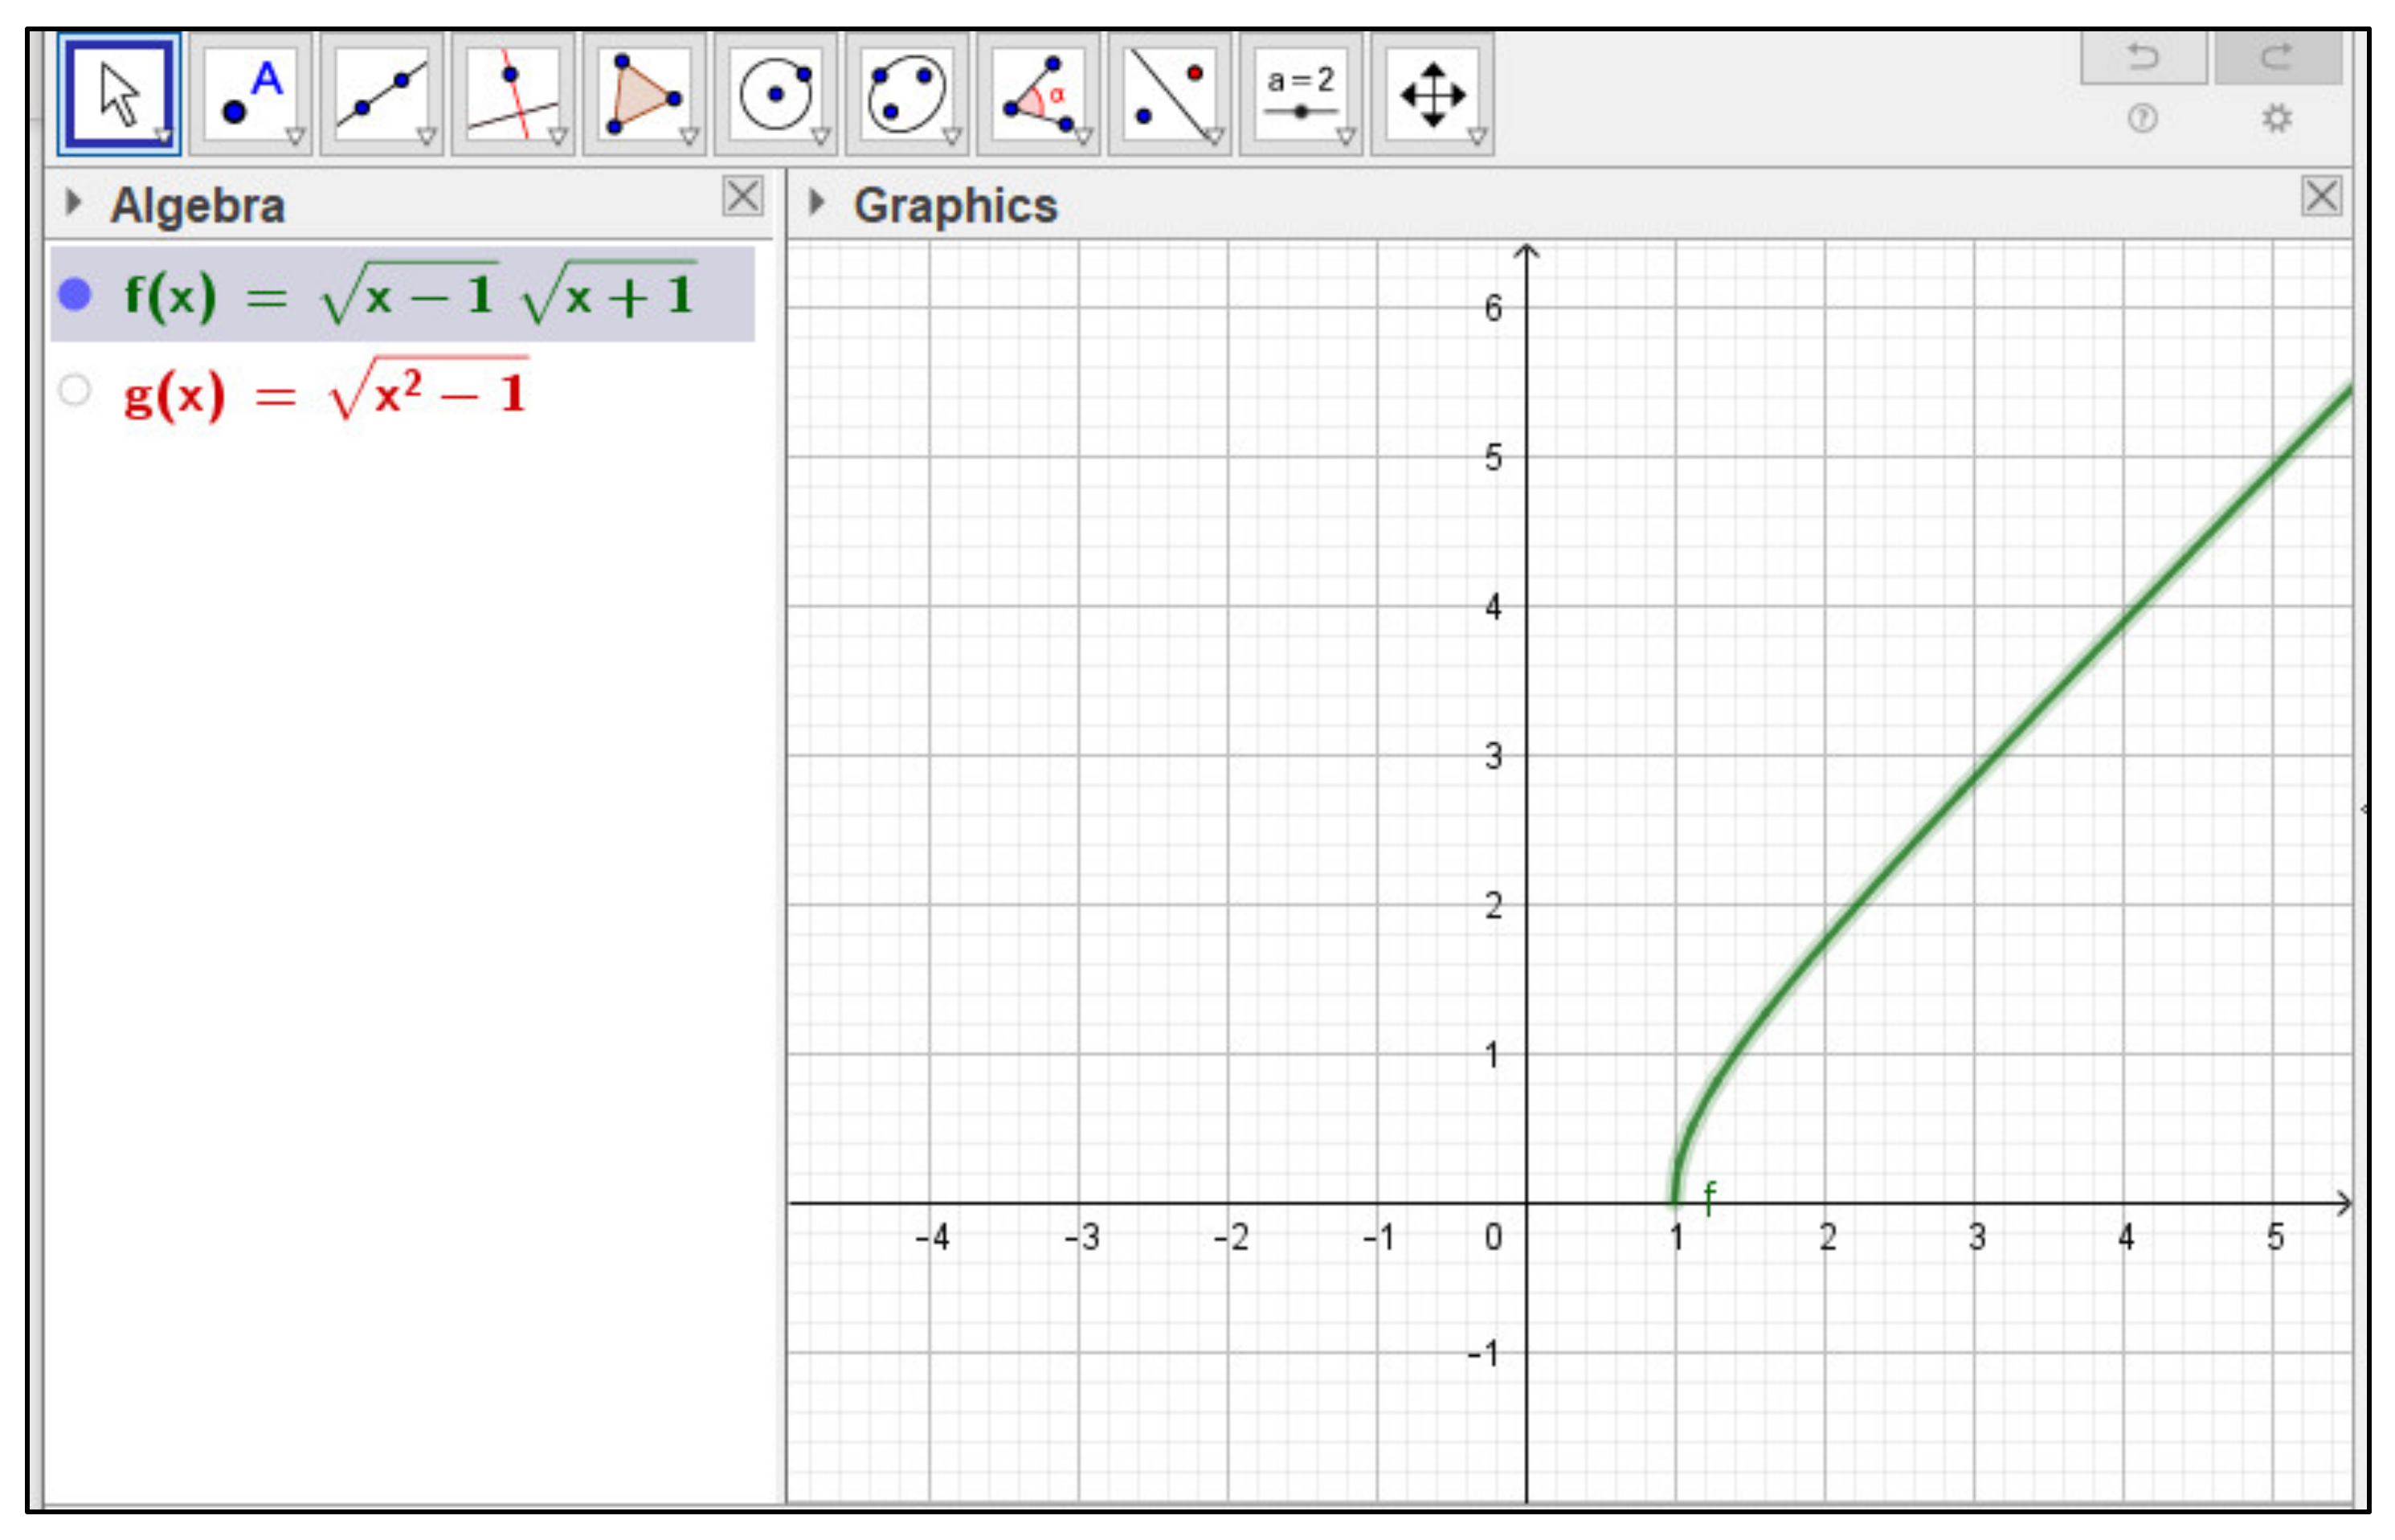
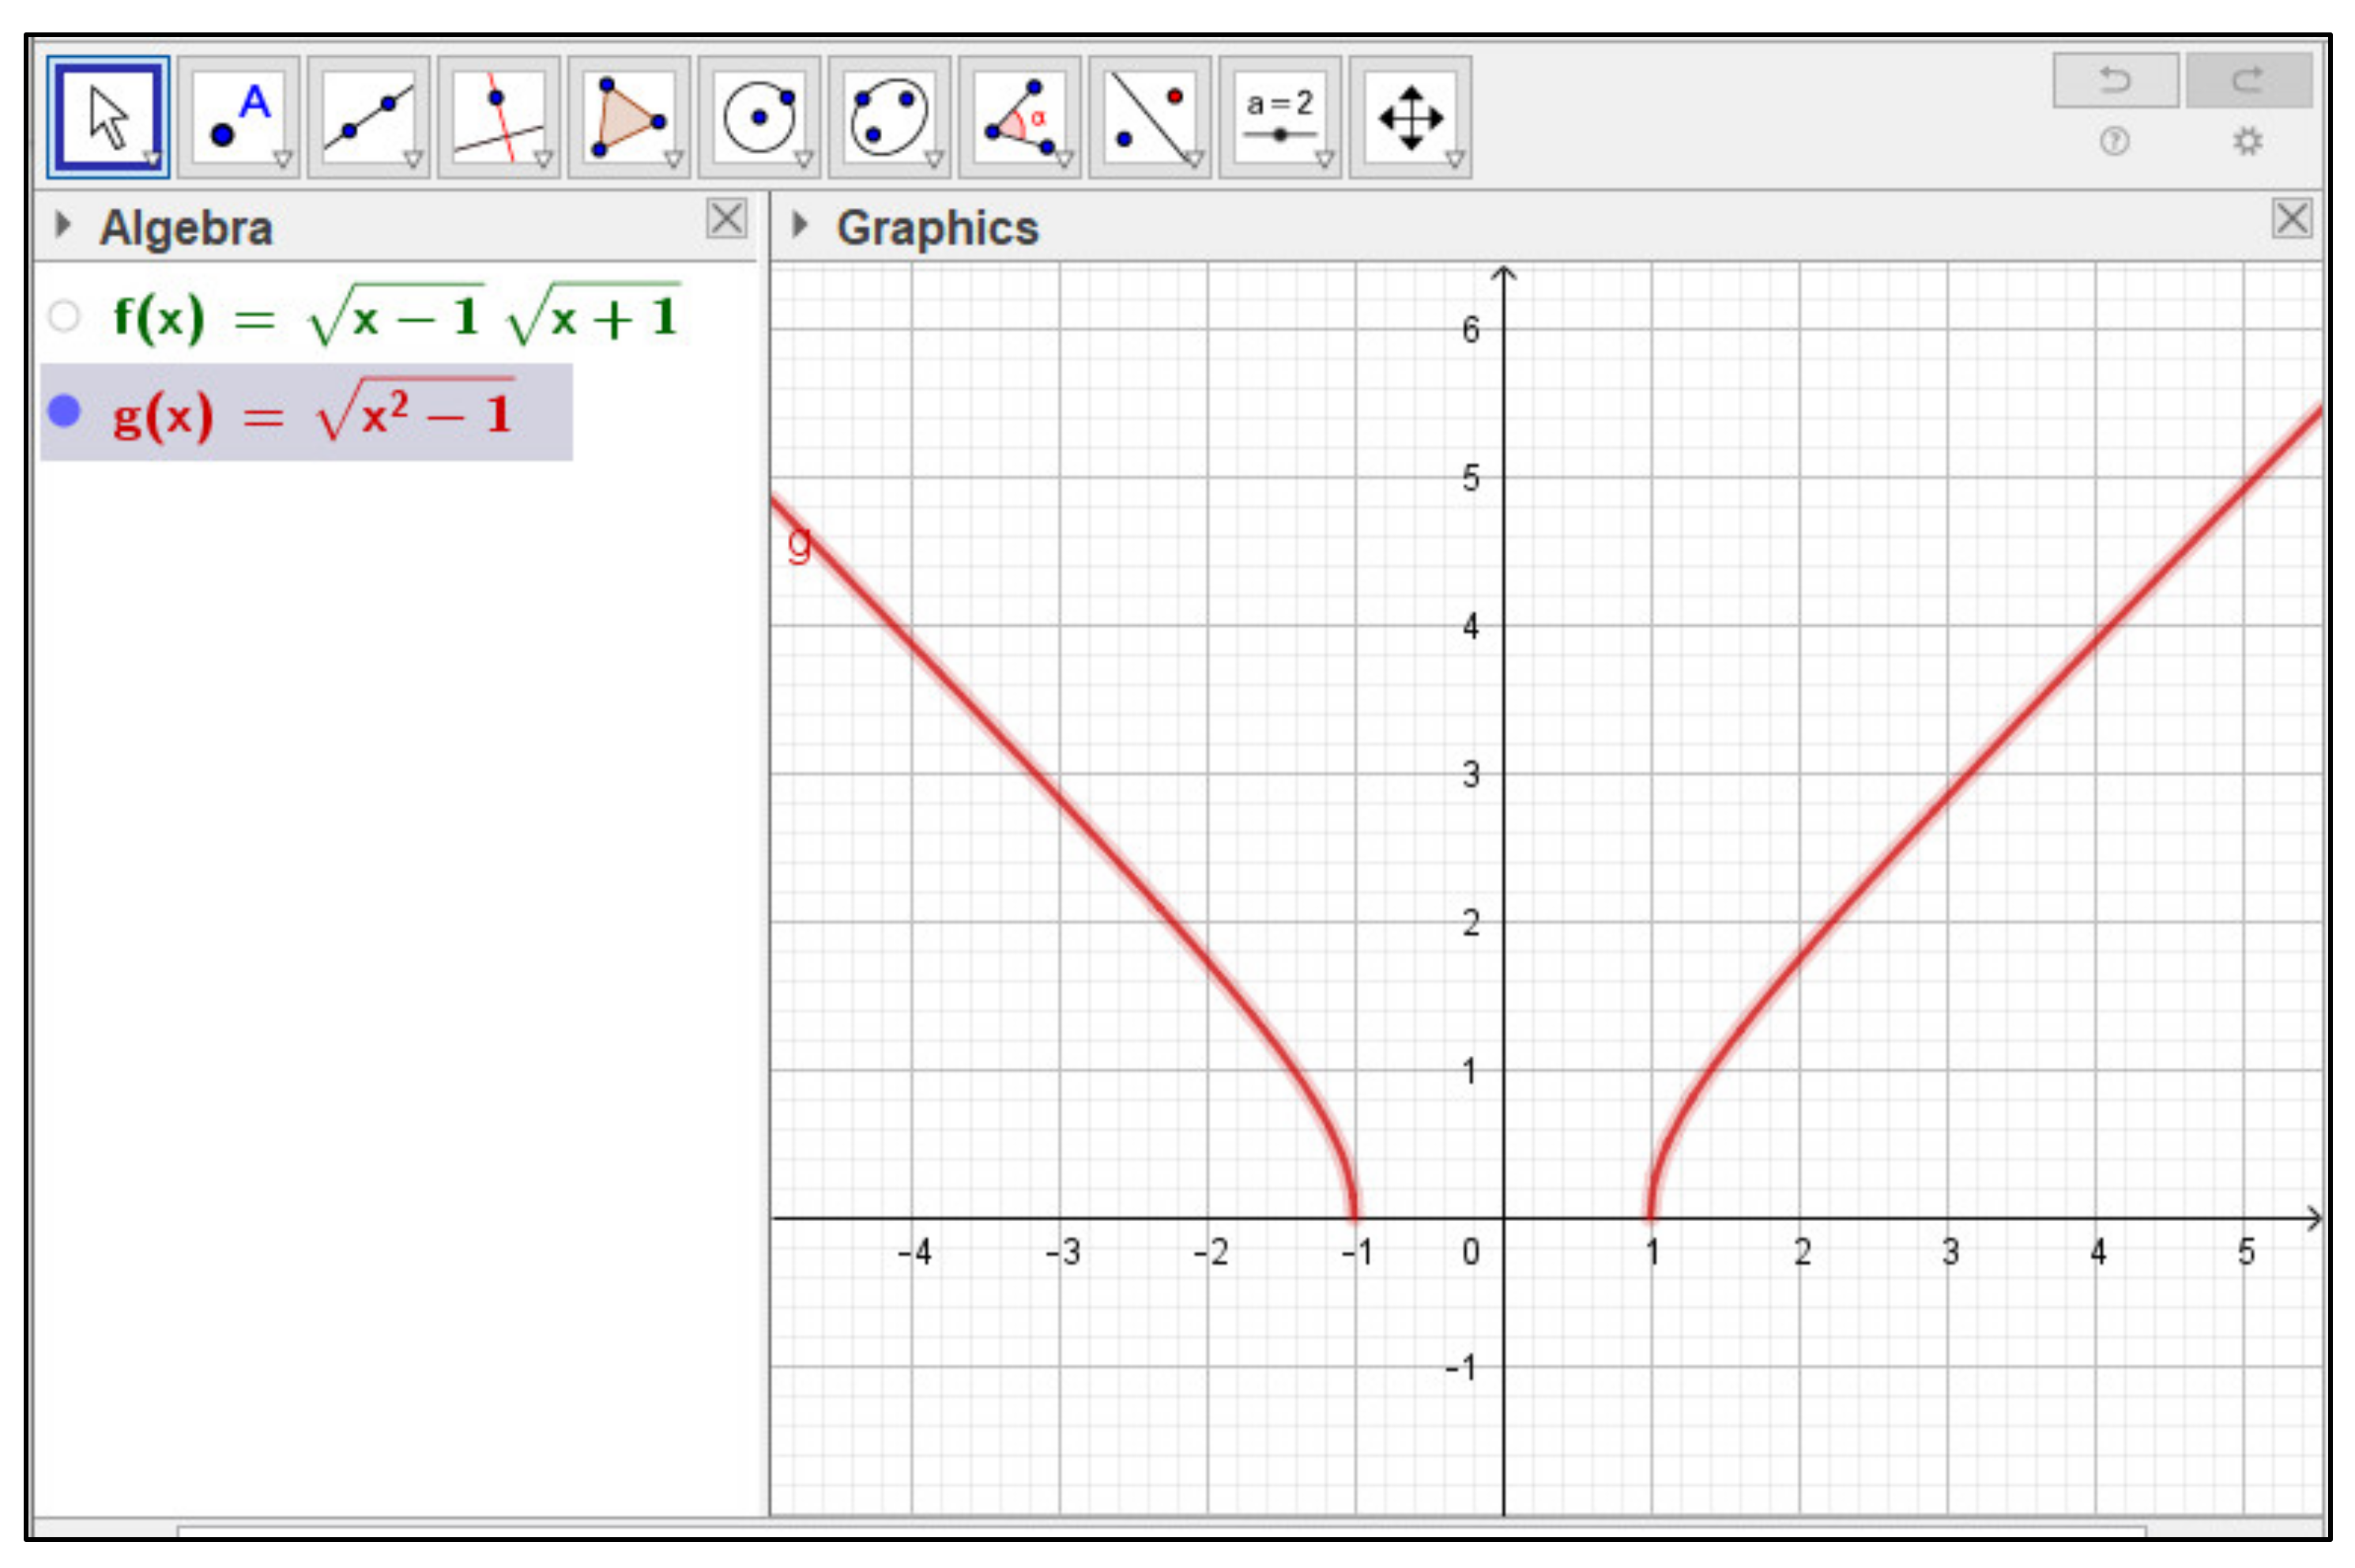
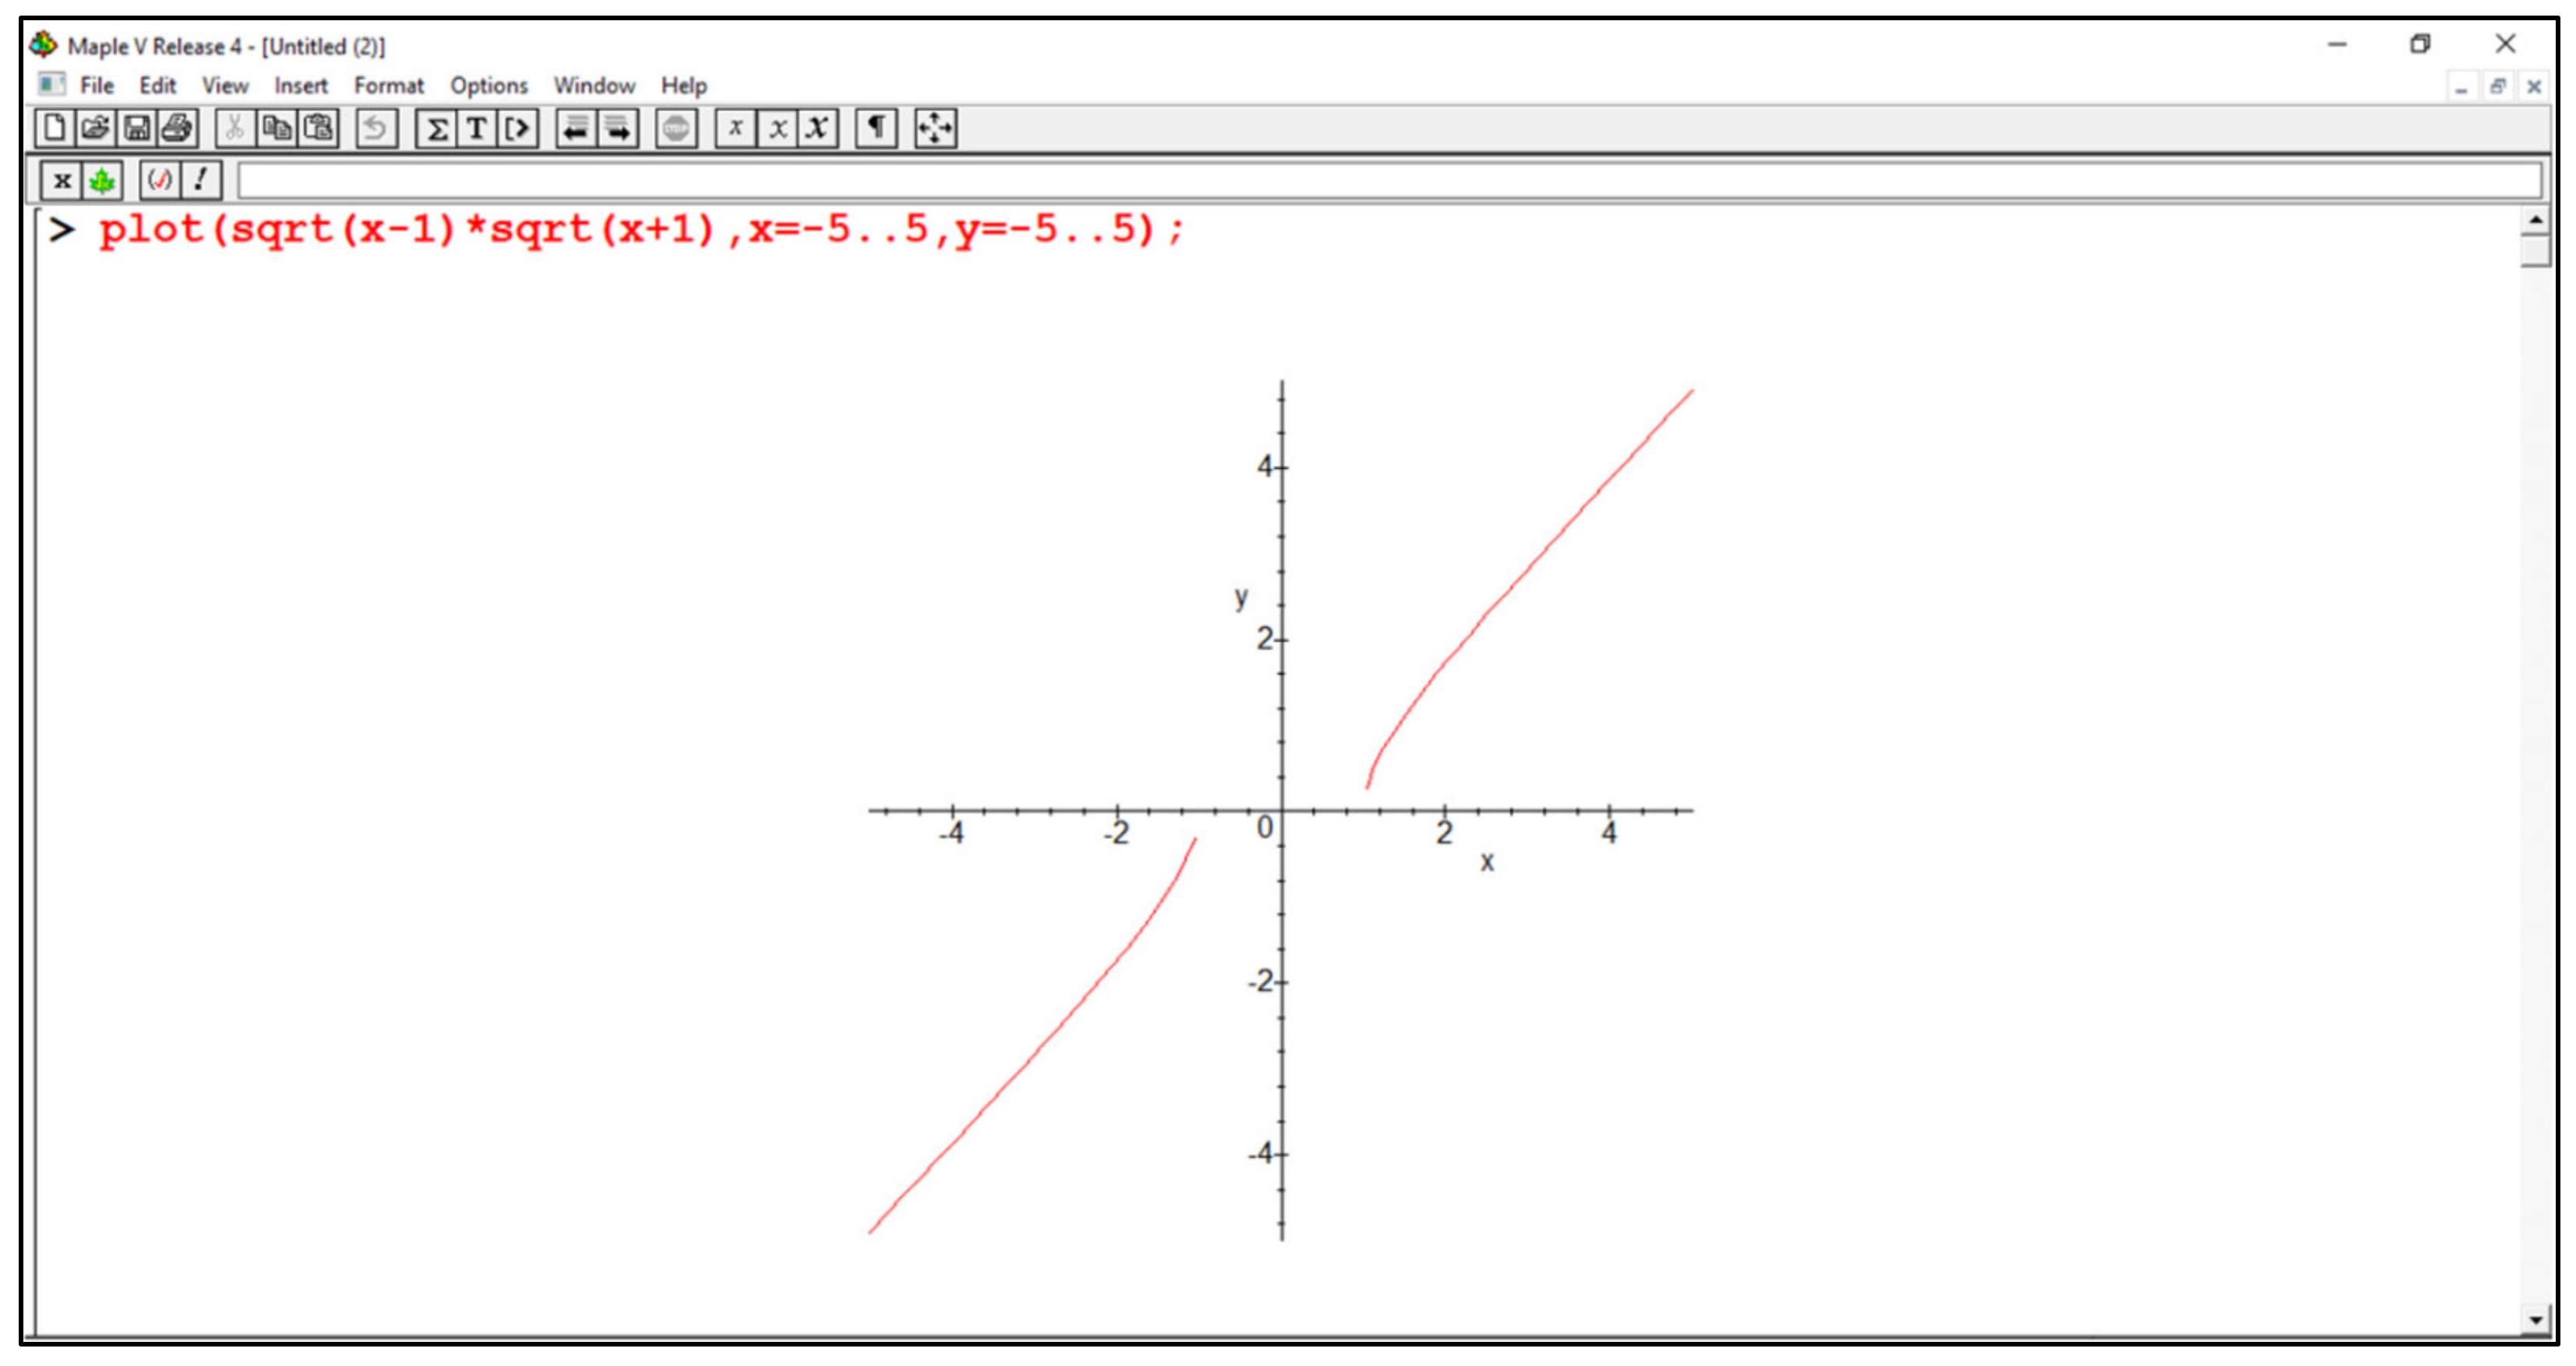
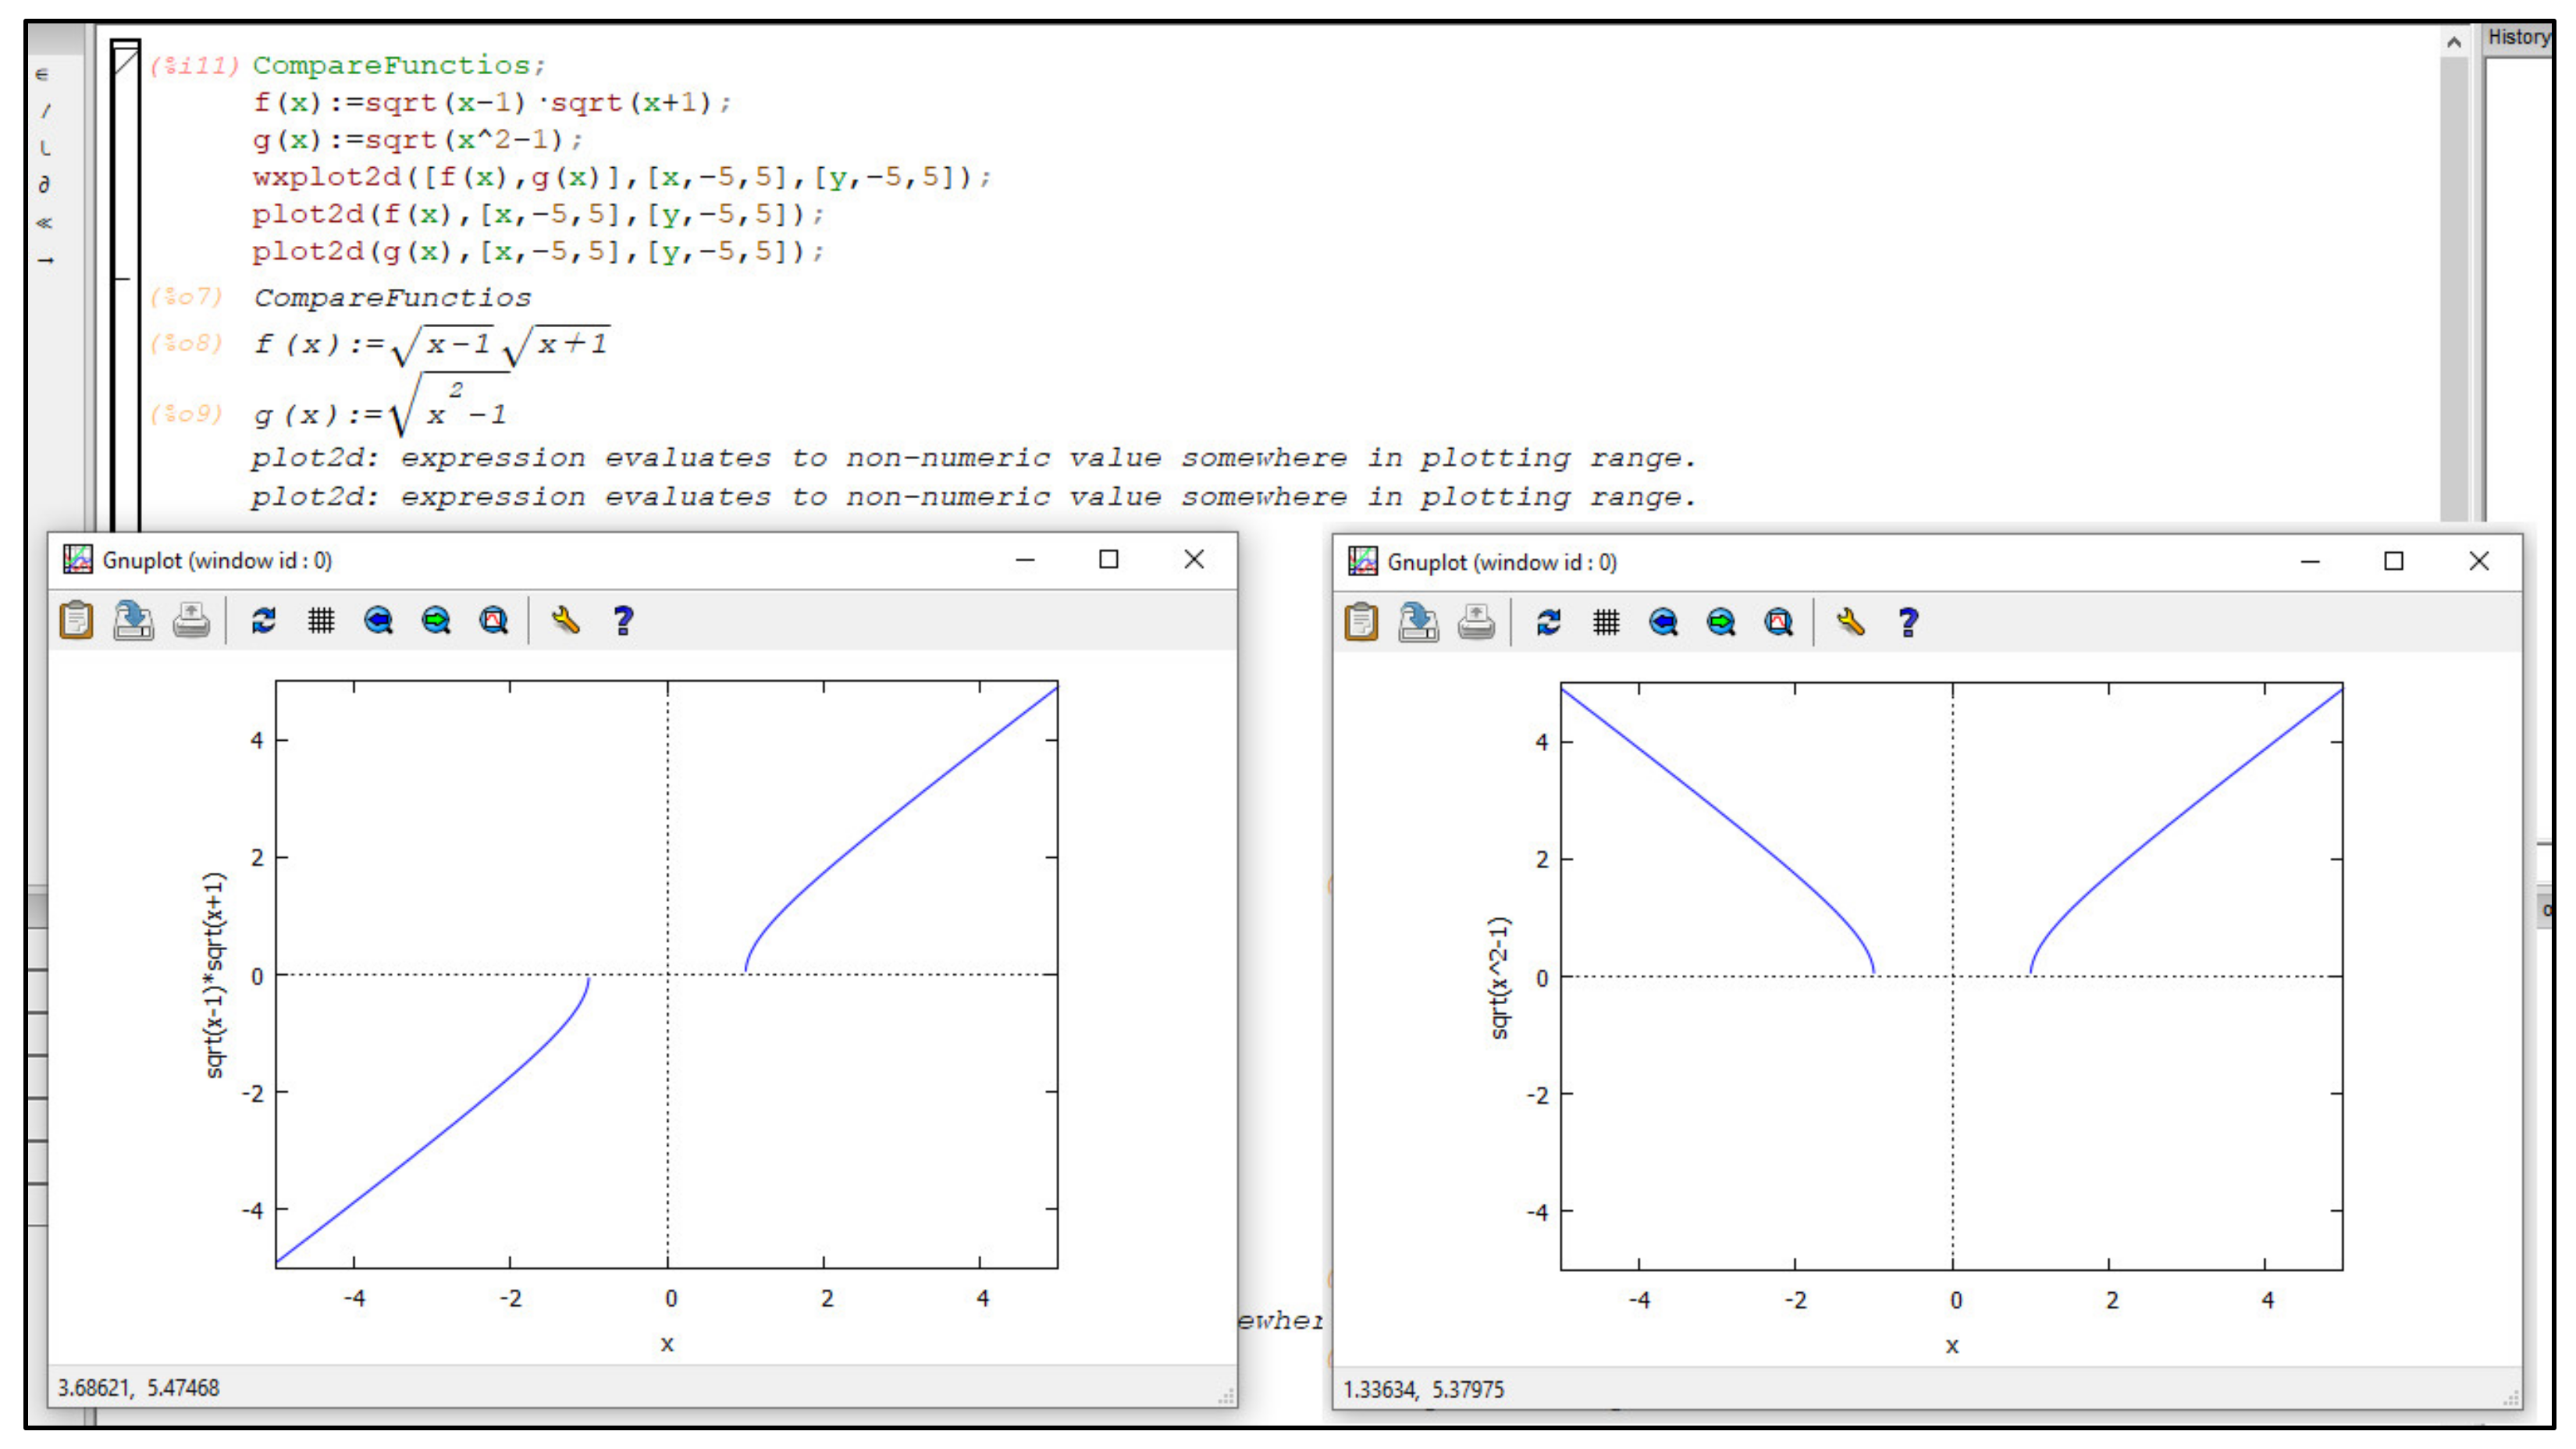
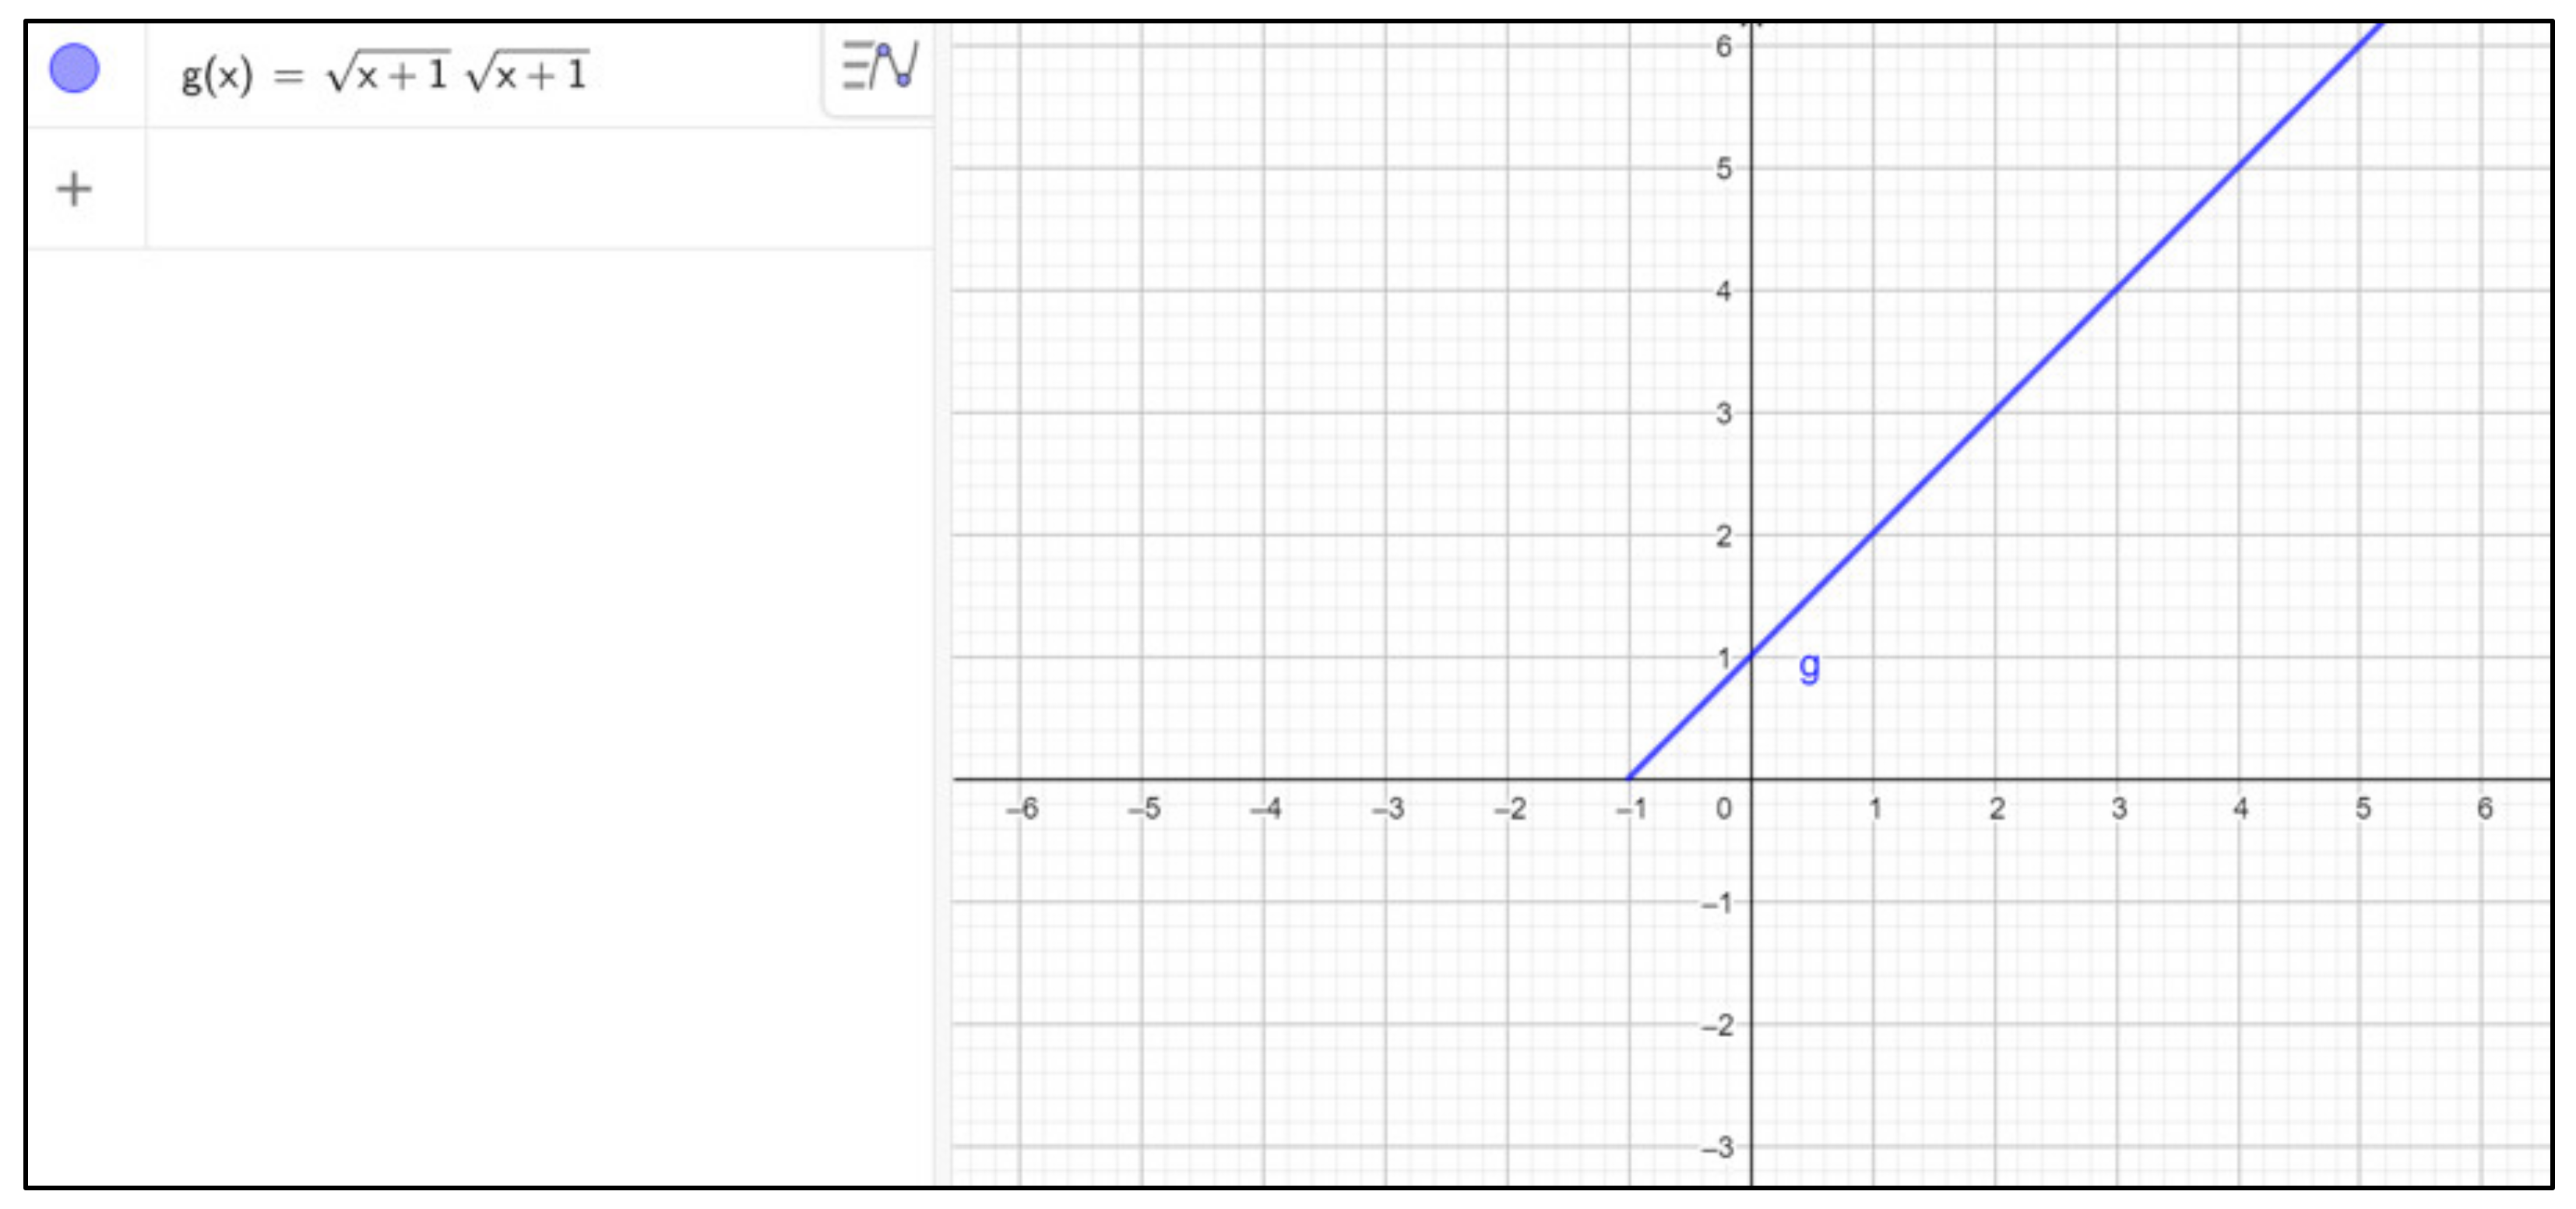
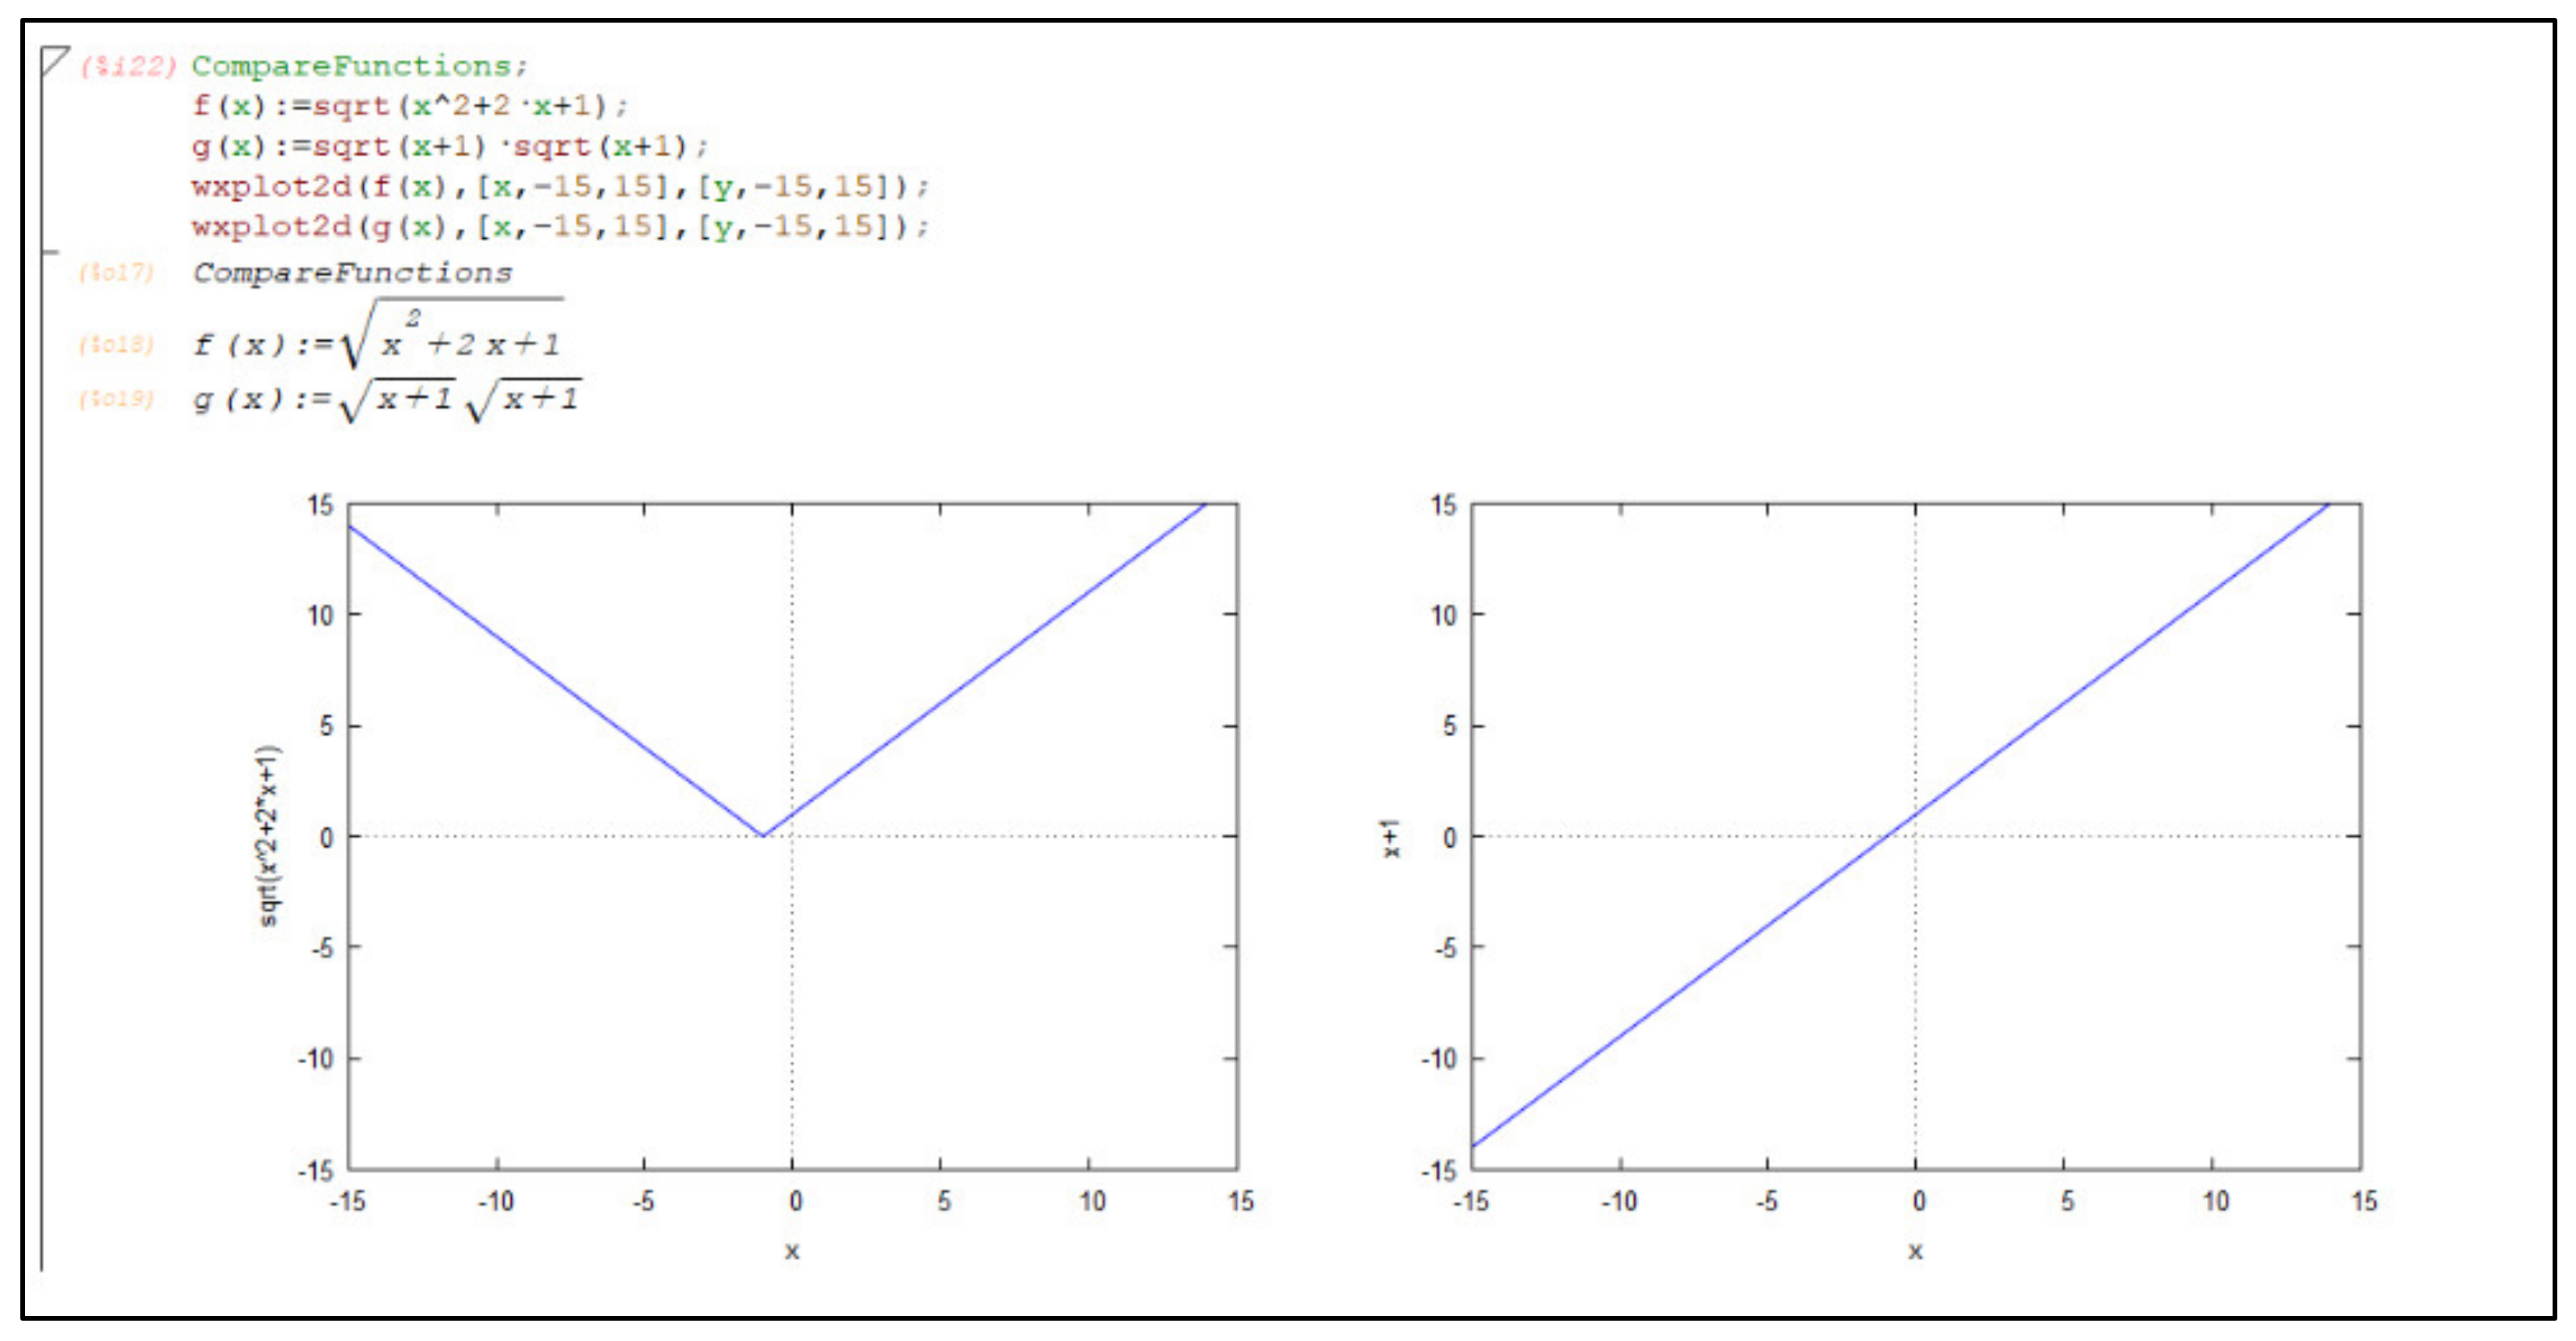
4. Challenging Examples in Graphing Functions: Comparative Discussion of Selected Failures in the Use of Different CAS and DGS

This section presents examples using symbolic calculators such as CAS and DGS, as well as MS Excel, highlighting the challenges of using these math software tools correctly and strategically. As the examples prove, these software tools support students’ creativity in visualization, using innovative methods, and presenting graphical schemas to solve real-life problems and tasks. Besides their benefits, this section covers the limitations of such tools for both students and teachers, helping to develop a suitable methodology and find the right use case to adopt them.

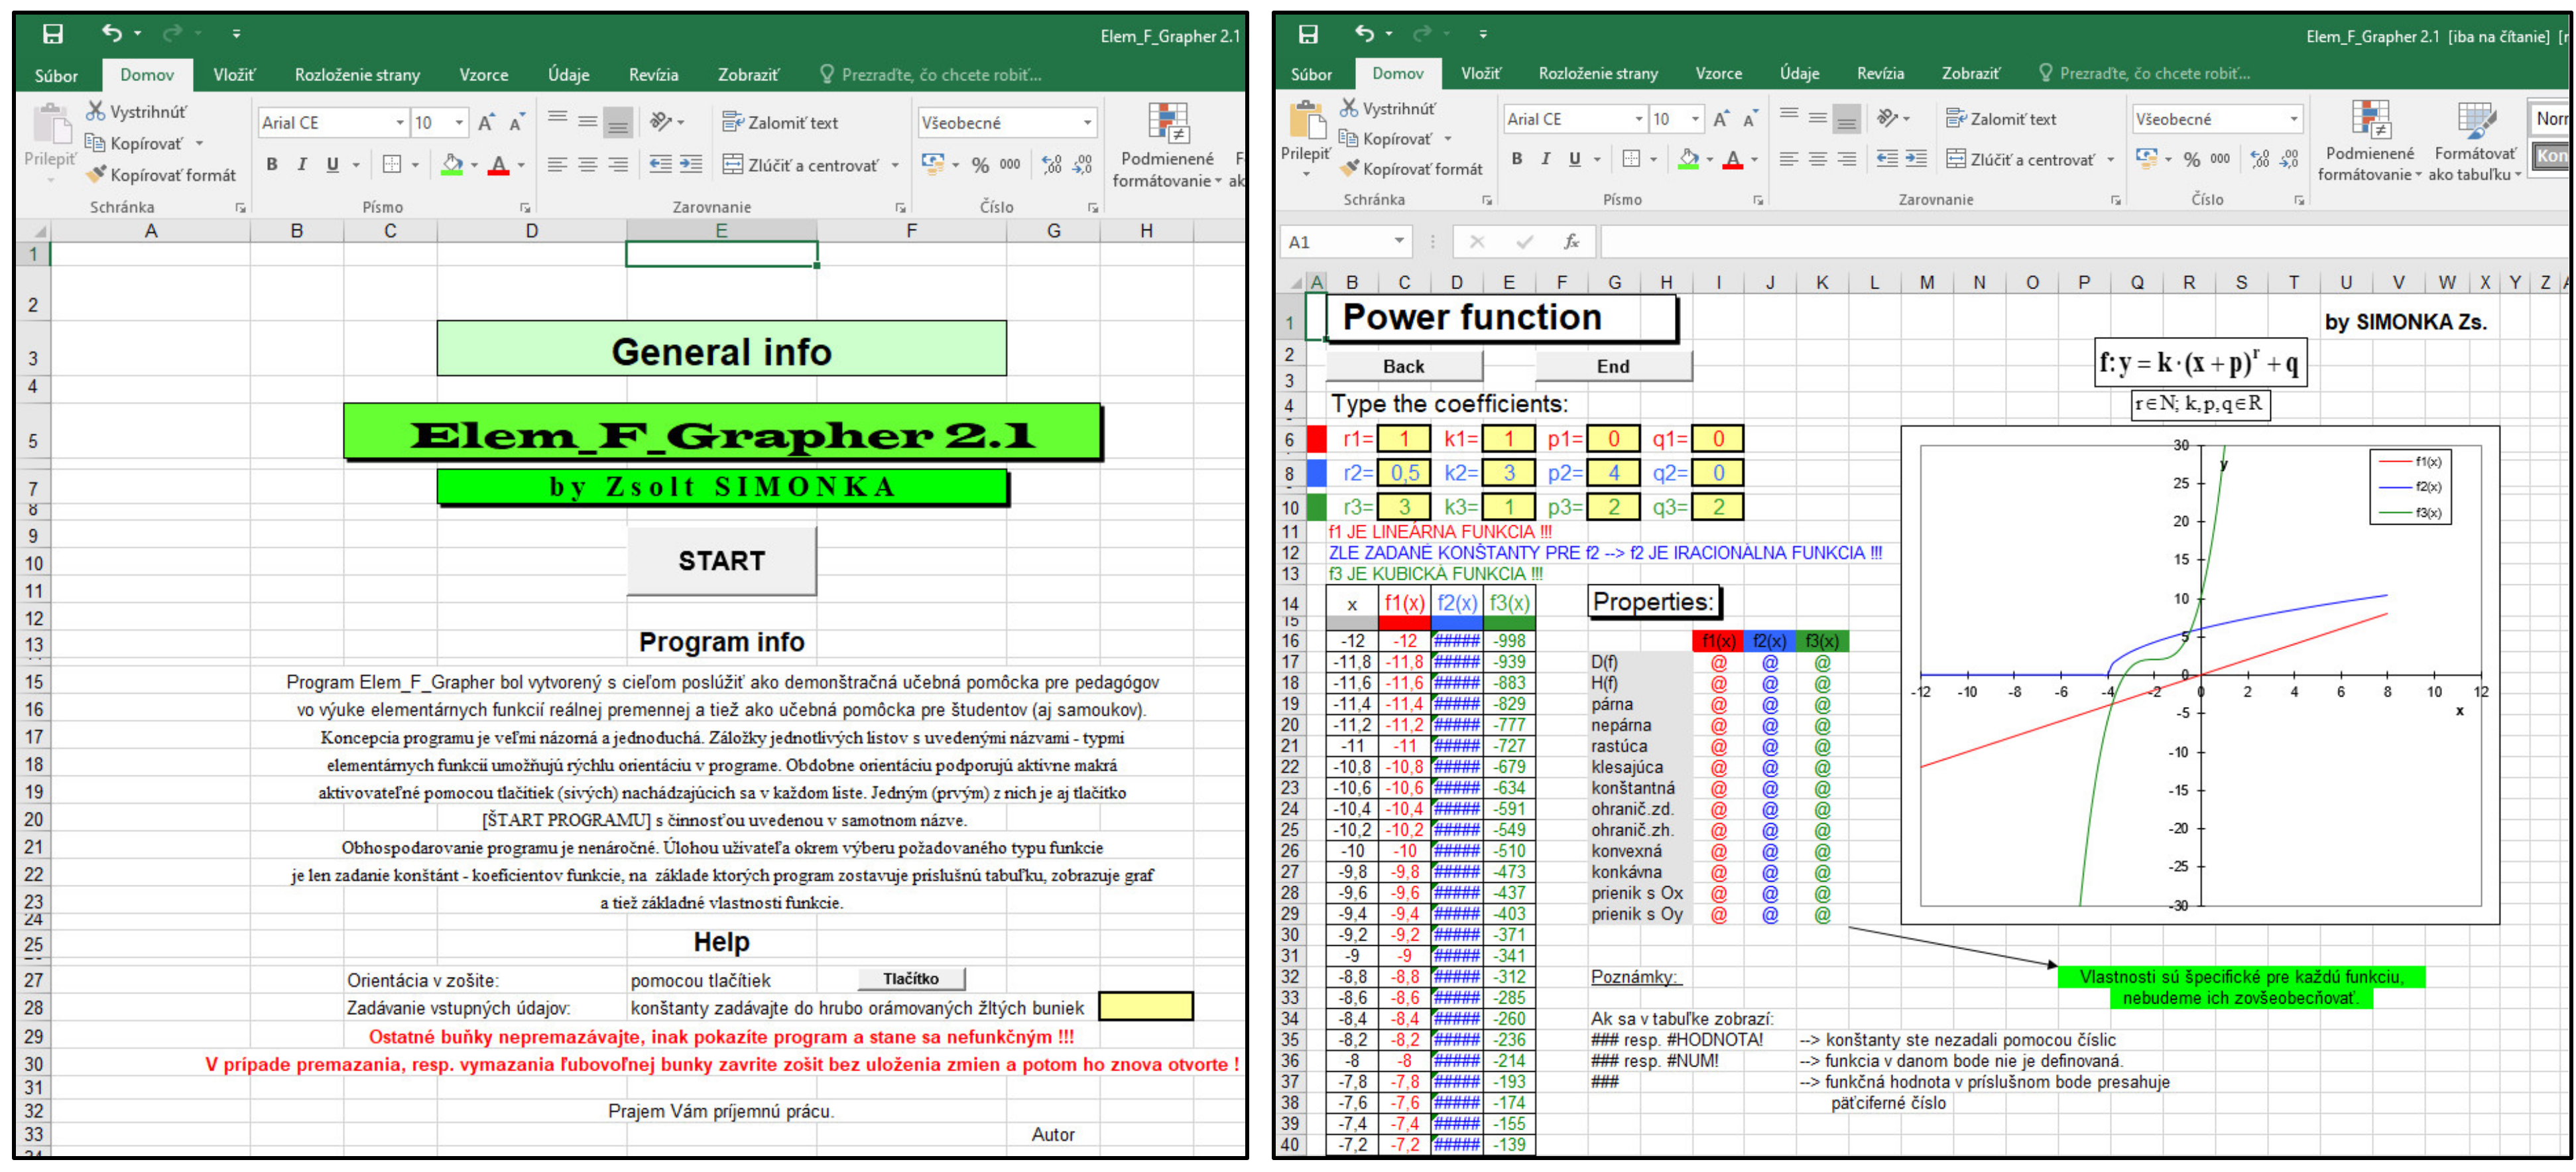
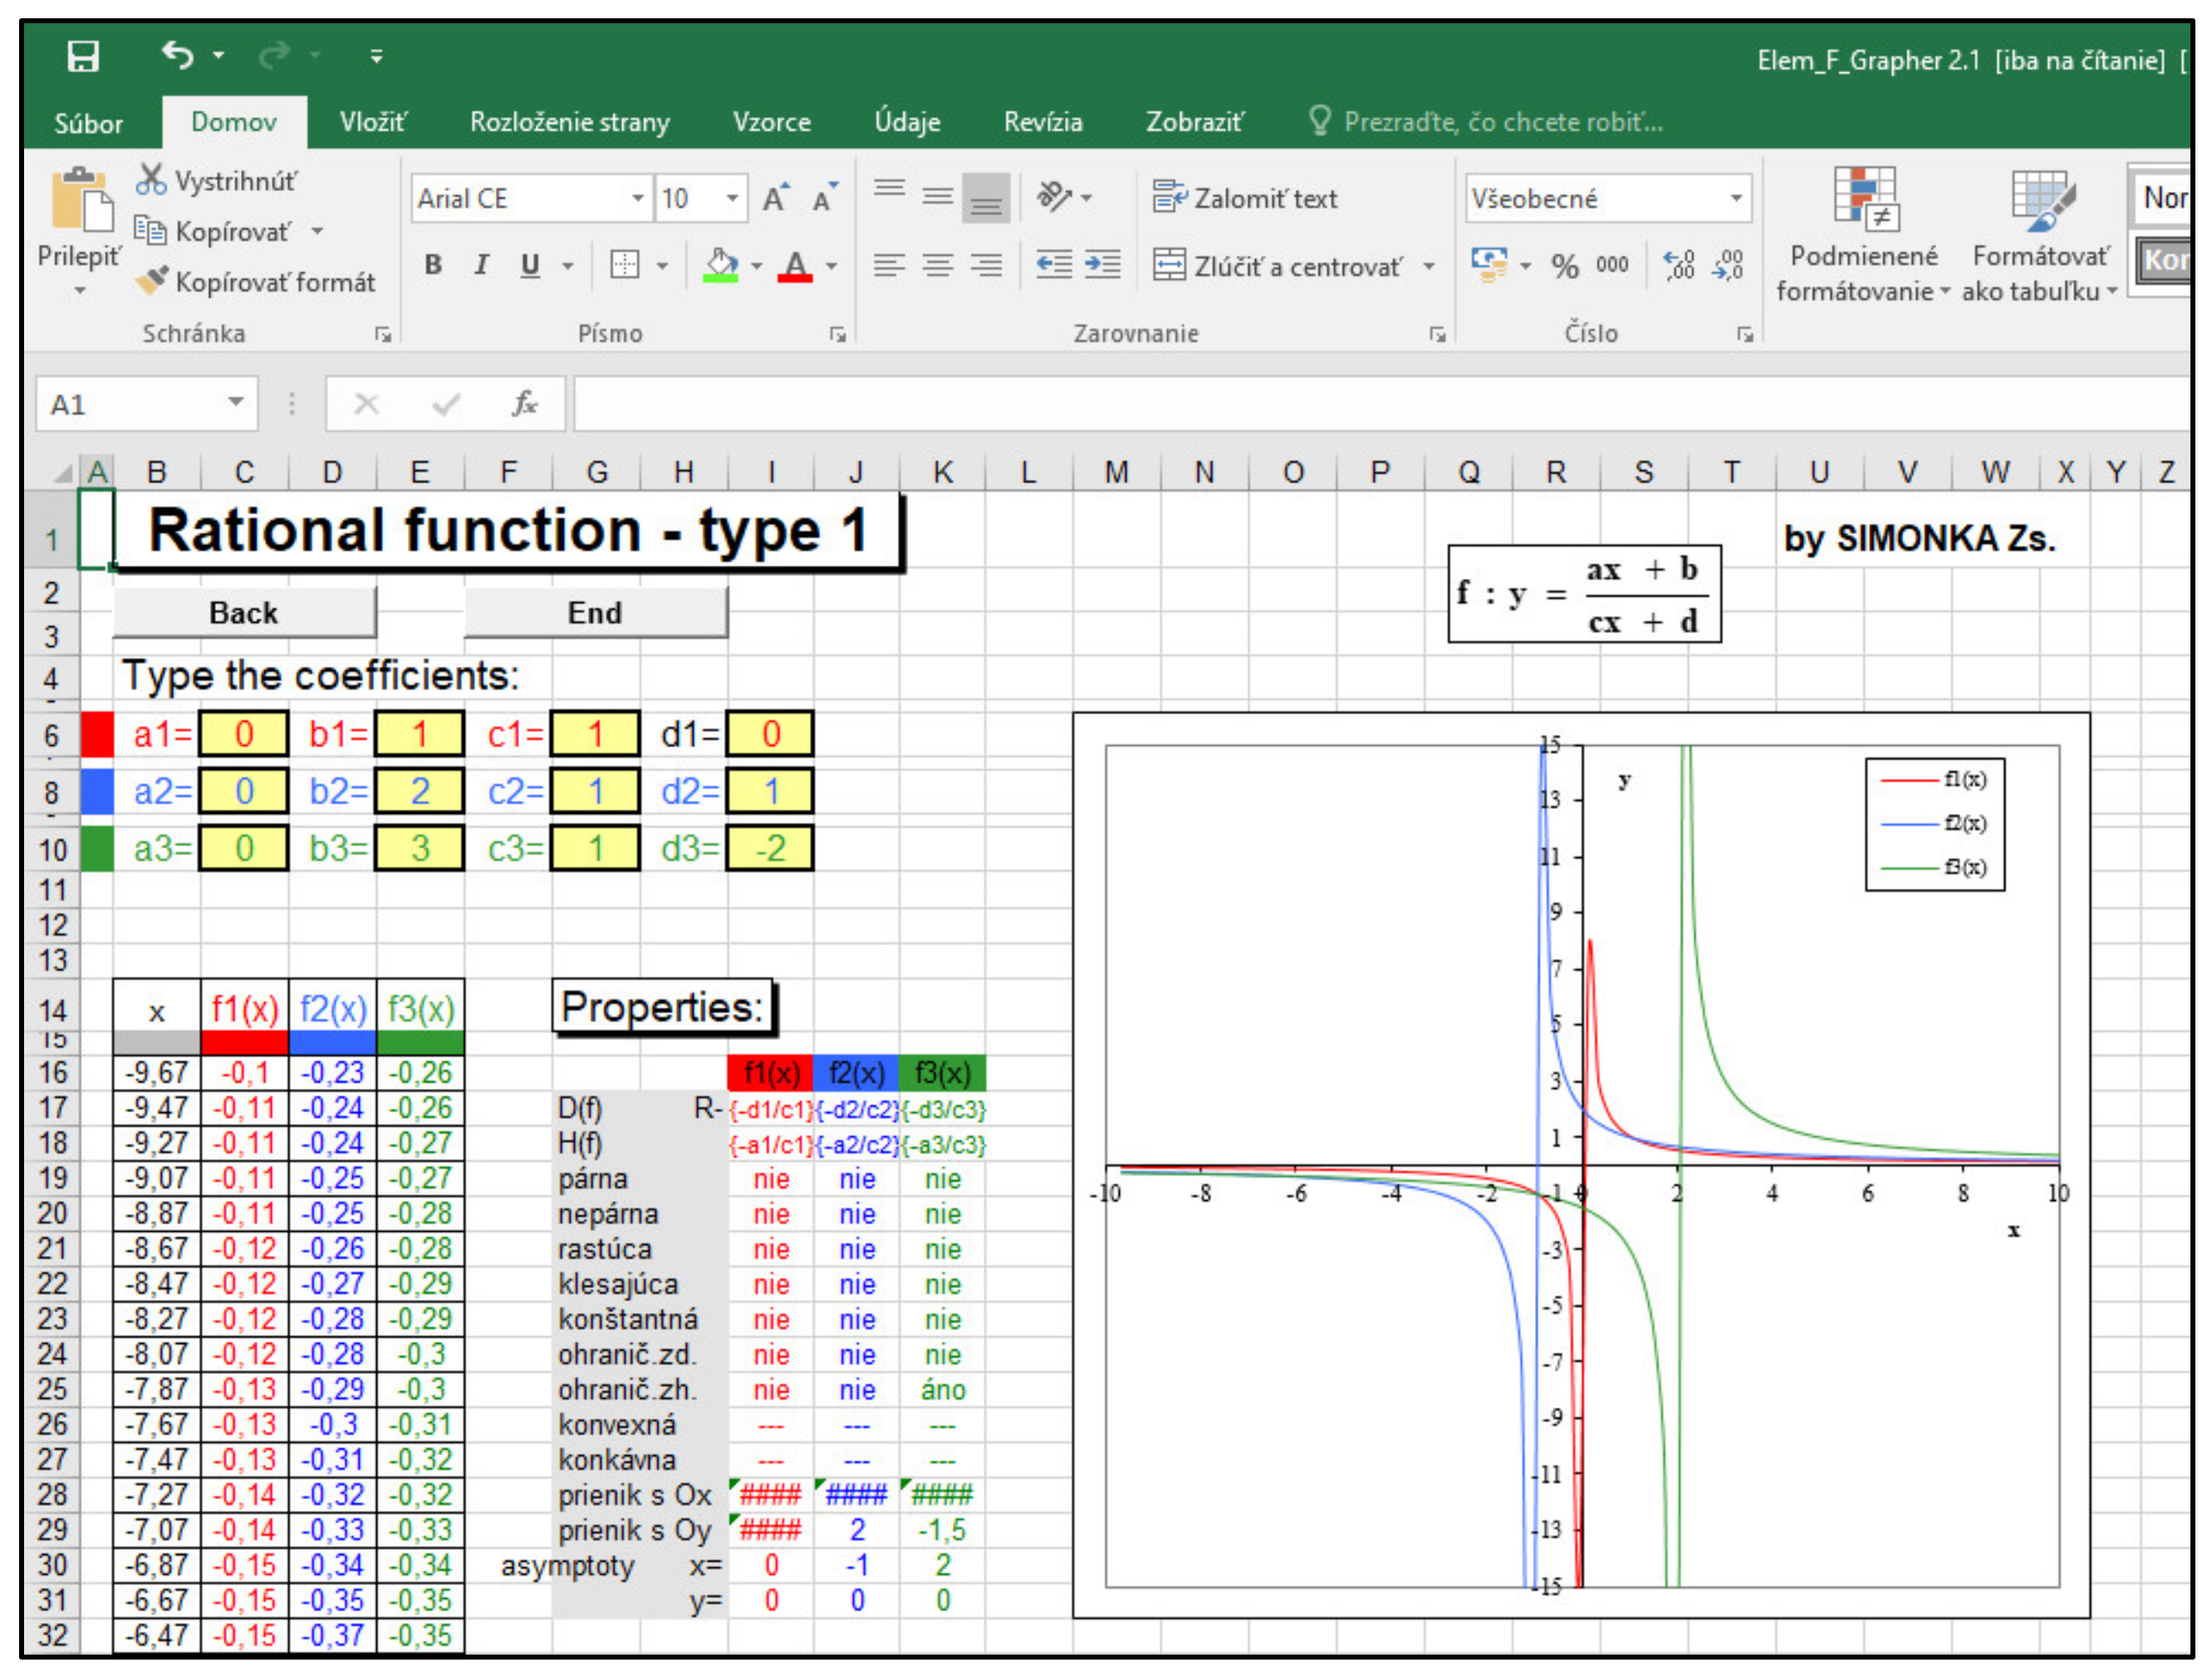
4.1. MS Excel Environment

Examples of incorrect graphical displays of the MS Excel (in which the program Elem_F_Grapher was created) may appear accidentally, namely at the points of discontinuity in the case of rational functions (see Figure 3: Rational functions in Elem_F_Grapher). It is important to emphasize the need for the active participation of the teacher and their ability to explain these phenomena to students (the software errors/failures) in a suitable way.

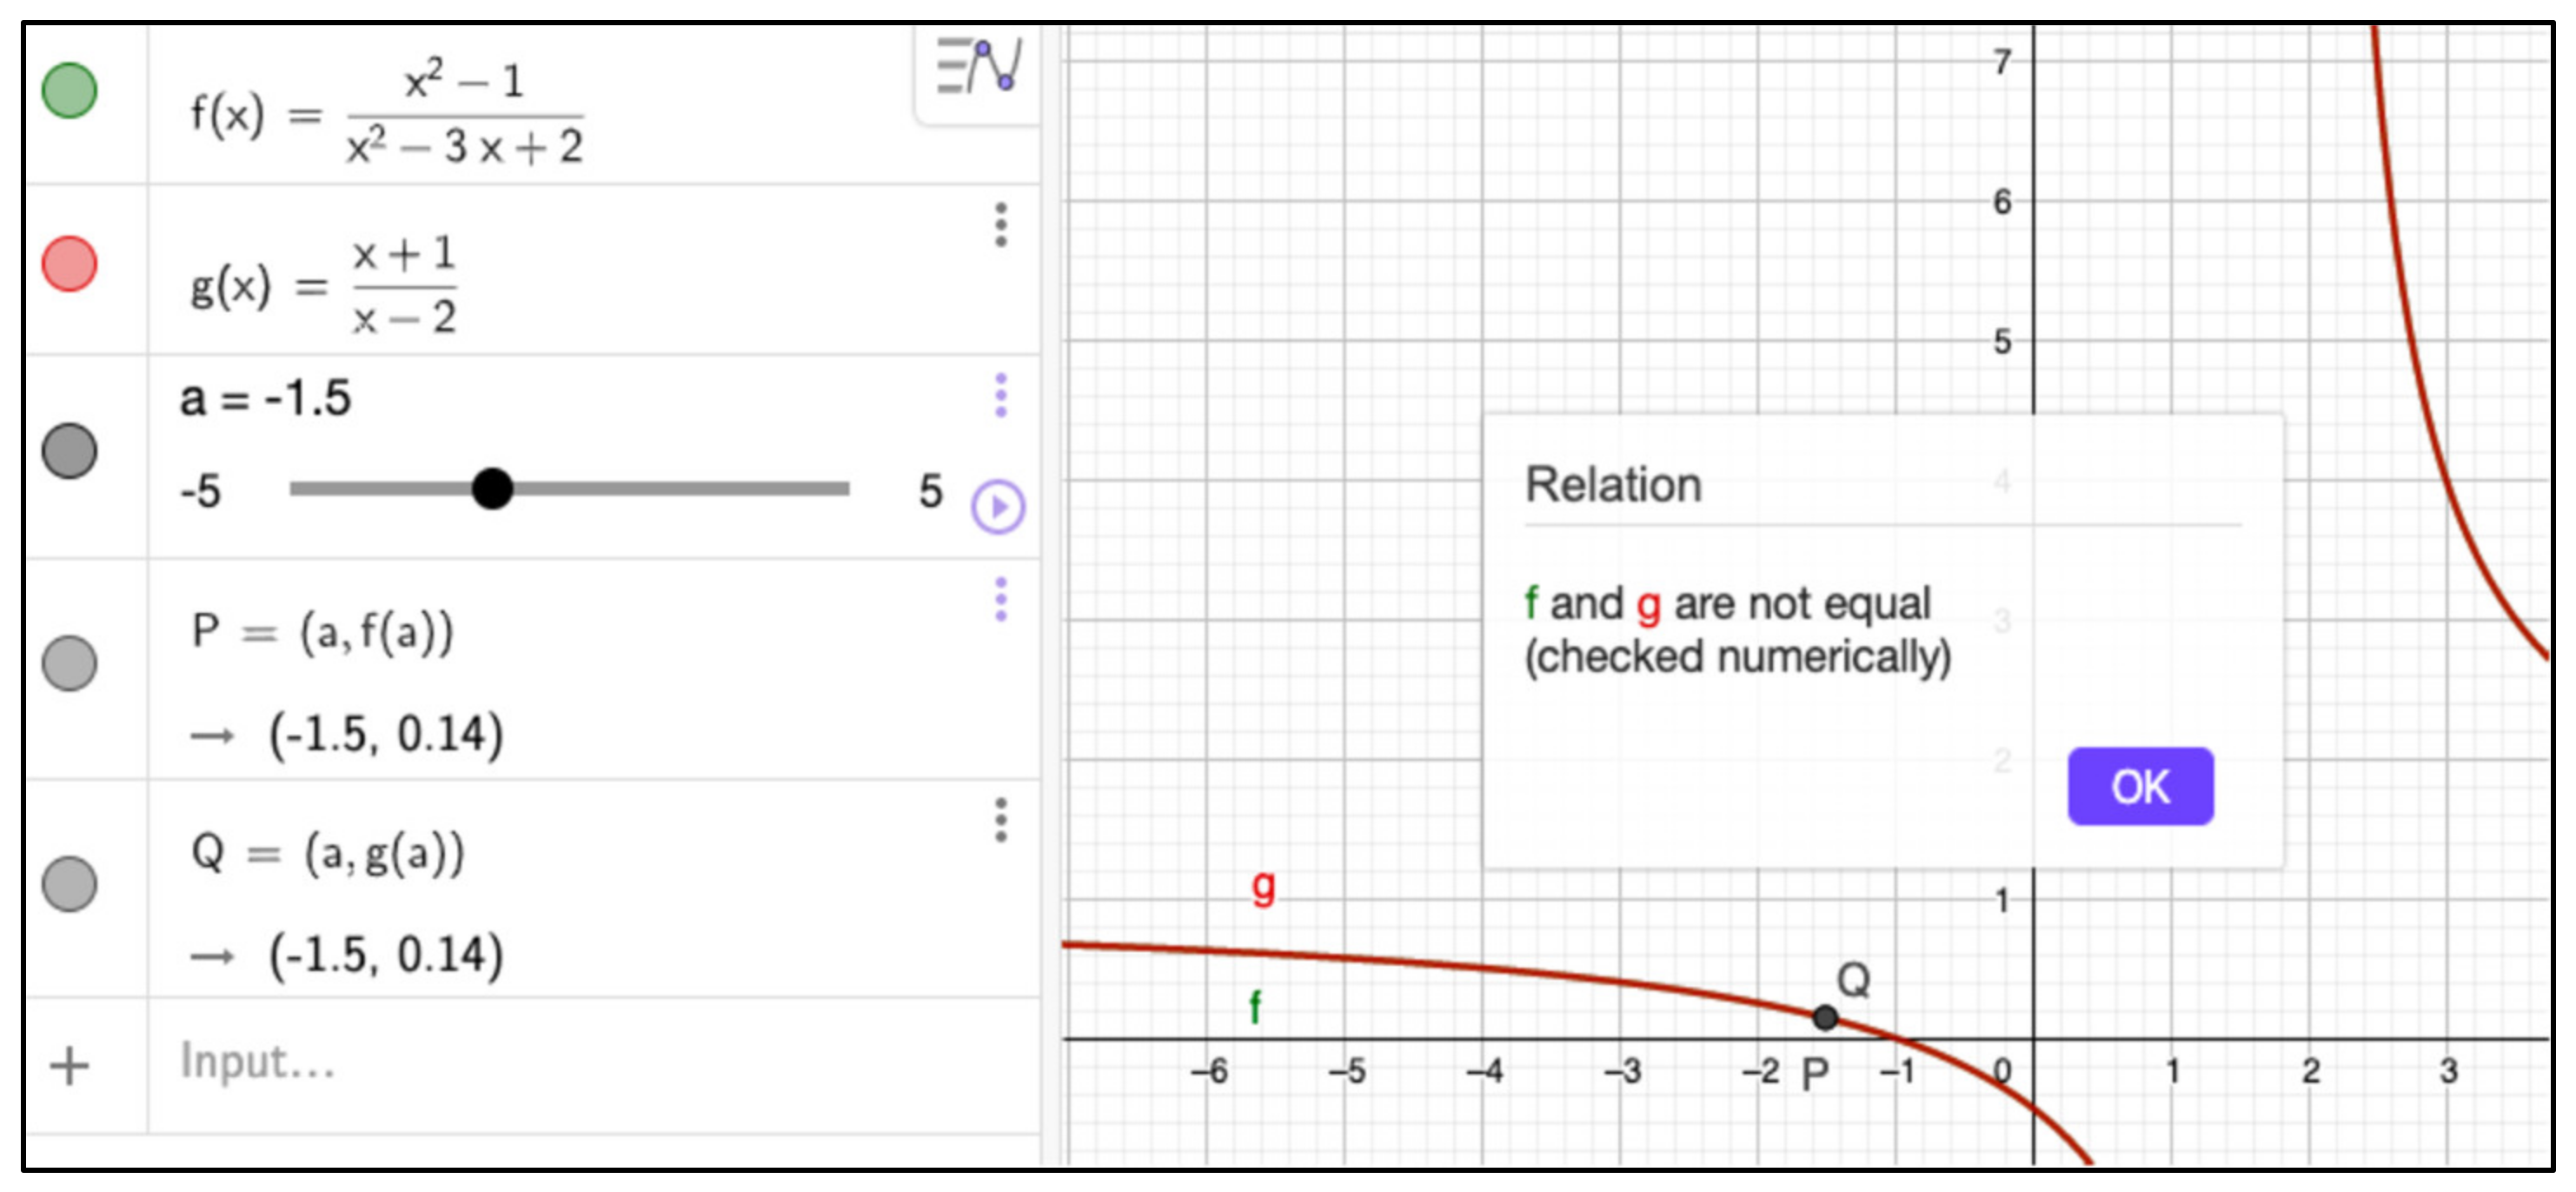
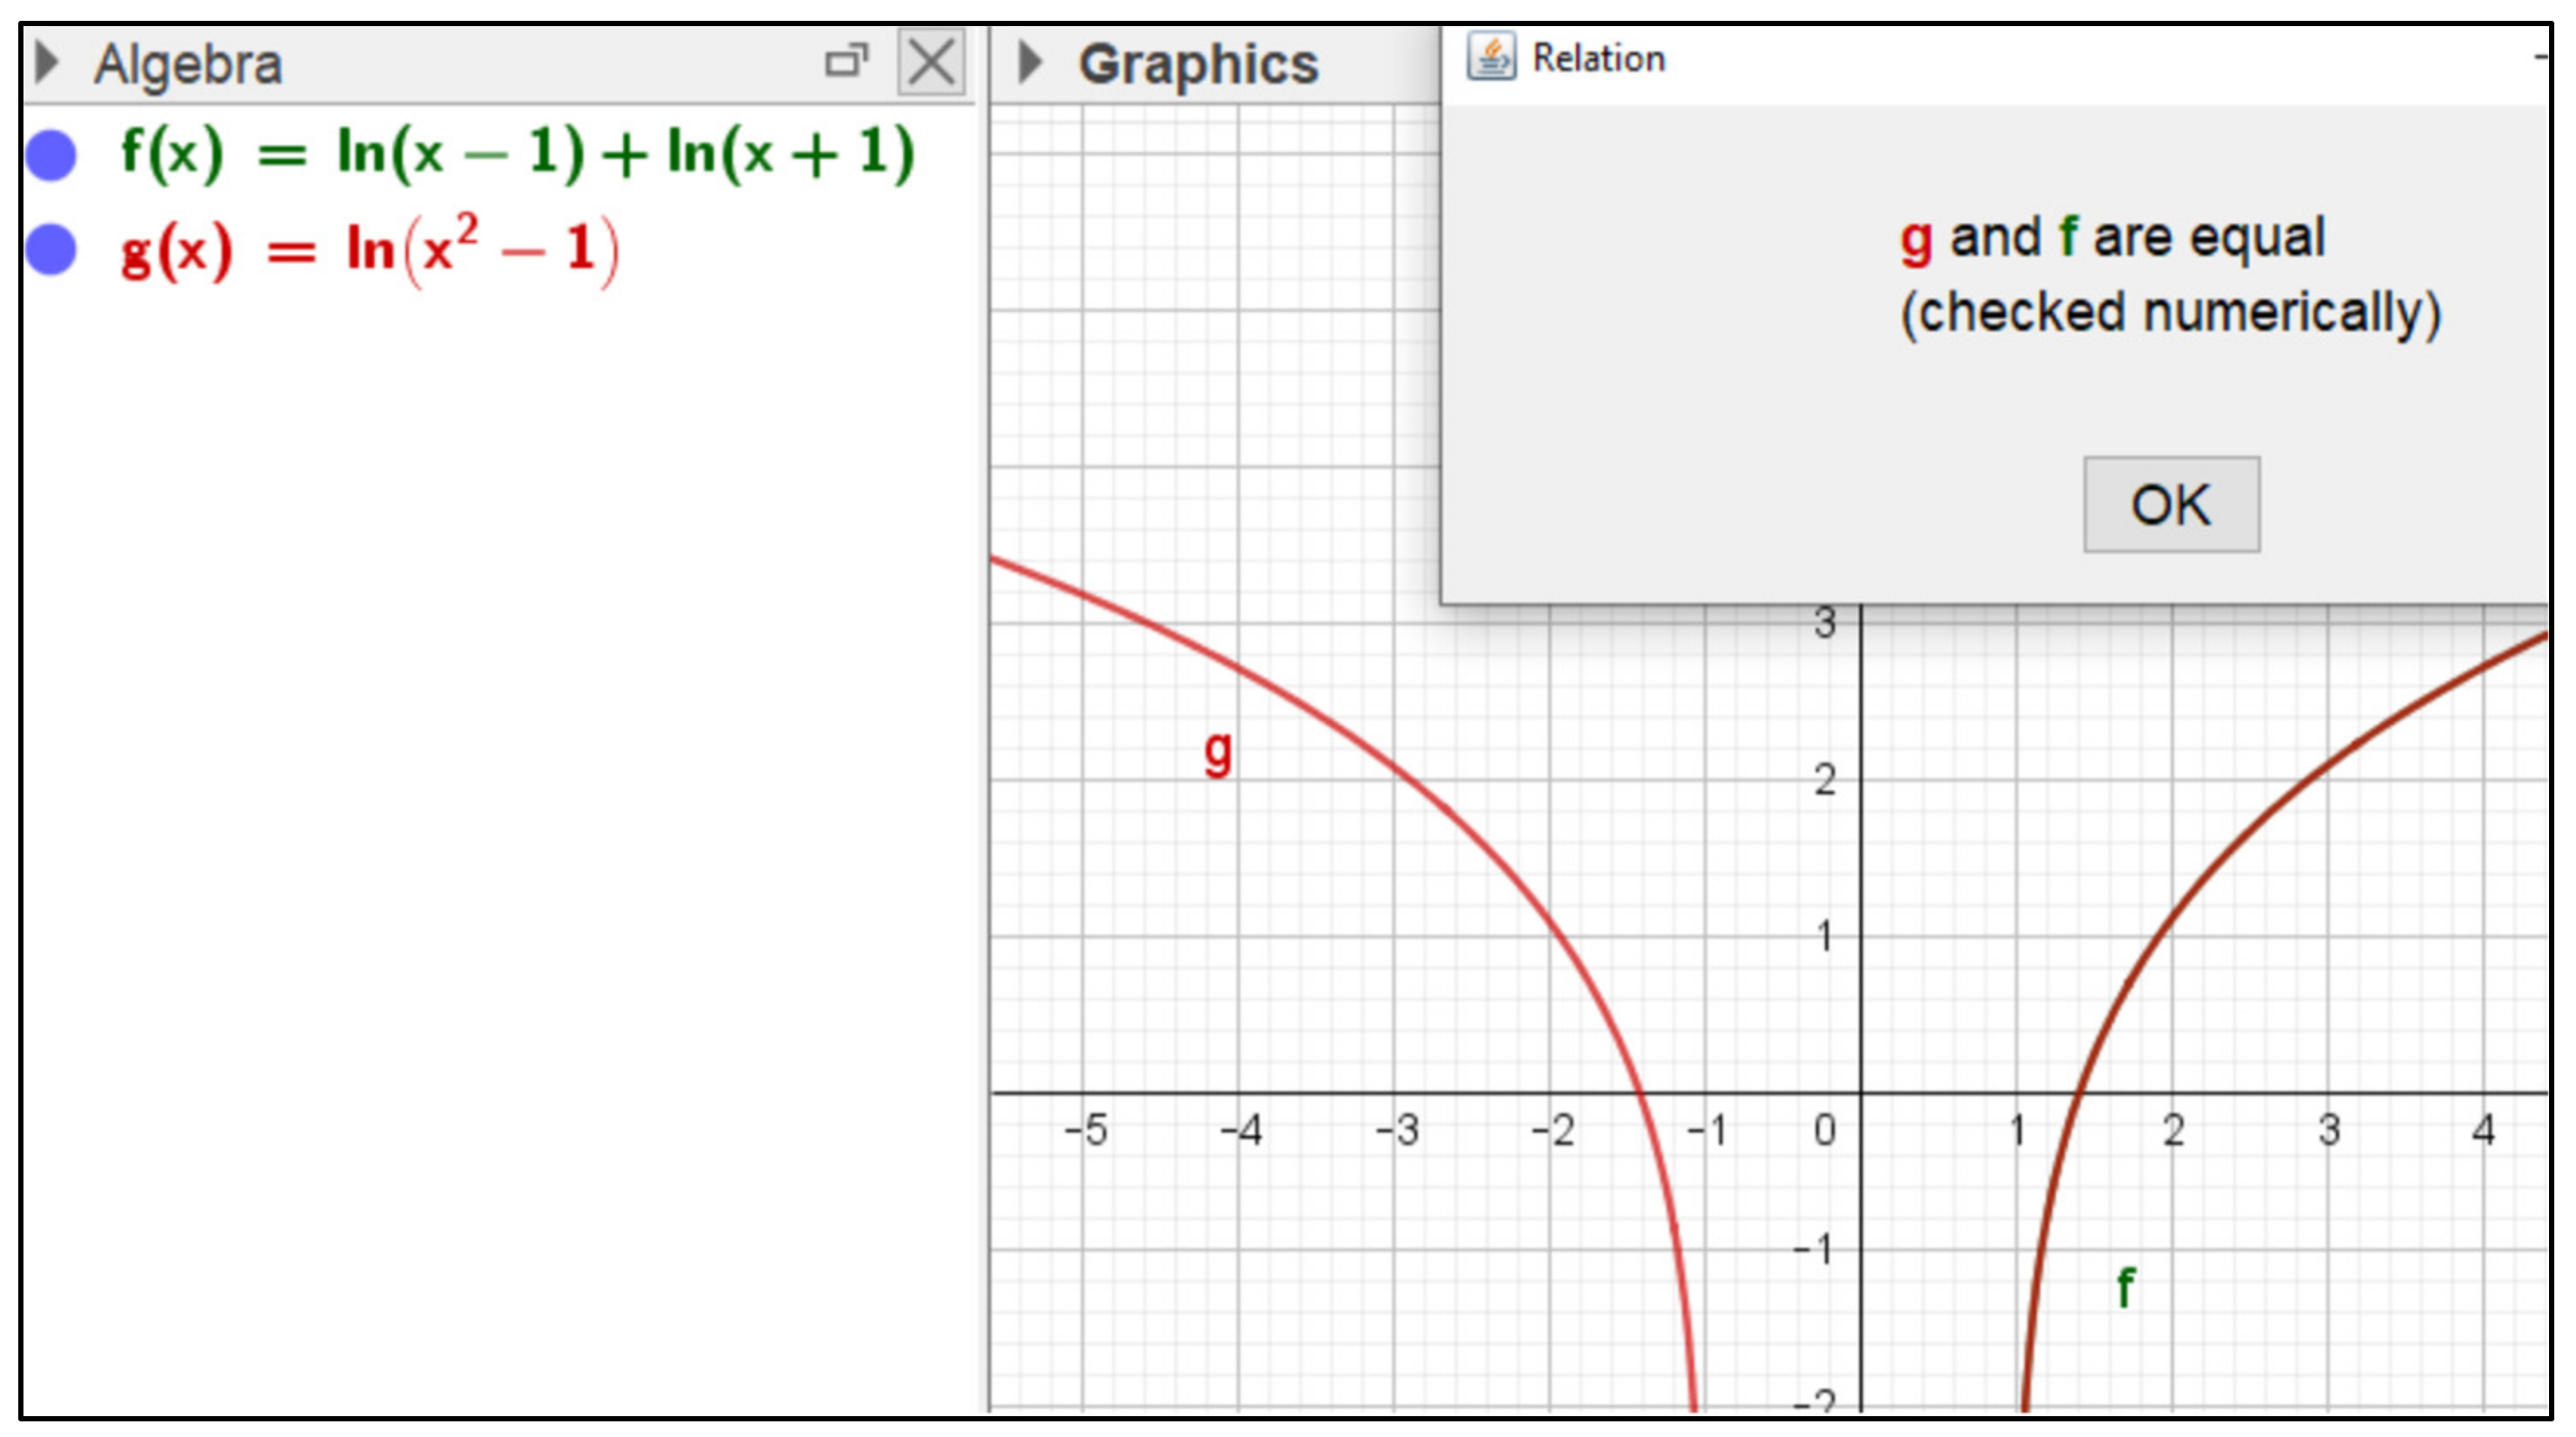
4.2. Computer Algebra Systems (CAS) and Dynamic Geometry Systems (DGS)

Failures may also appear when using CAS and DGS tools, and some examples are described in this section.
Example 1
Let us consider a frequent example in calculus—the computation of the following limit:
lim x 1 x 2 1 x 2 3 x + 2
Usually, the students are advised to consider the factorization of the numerator and the denominator and conclude by simplifying the fraction, as shown below:
x 2 1 x 2 3 x + 2 = ( x 1 ) ( x + 1 ) ( x 1 ) ( x 2 ) = x + 1 x 2
Now, the computation of the limit is reduced to obtain the limit by the value of the simplified fraction for x = 1:
lim x 1 x 2 1 x 2 3 x + 2 = lim x 1 x + 1 x 2 = 2
The question here is: are the two functions equal or not?
The use of CAS and DGS might help to find the right answer, but suddenly, as can be seen below, the computer gives “different” answers.
Let us consider the following functions, noted by f and g, and point out their domains:
f ( x ) = x 2 1 x 2 3 x + 2 , D o m ( f ) = ] , 1 [ ] 1 , 2 [ ] 2 , [ g ( x ) = x + 1 x 2 , D o m ( g ) = ] , 2 [ ] 2 , [
First, the GeoGebra program is used to look for the answer (Figure 4 and Figure 5).
Note here that the two “relations” from above differ only in the order; thus, normally, the answers should be the same. In addition, the mathematical reasoning is making a clear distinction between the two functions, as, by definition, the equality of two functions is true if their domains and codomains are the same, and the two functions have equal values for all the elements of the domain. In the above example the first condition fails, the domains differ. Most likely, the built-in command “relation between two objects” used by GeoGebra does not coincide with the content of the mathematical notion. Things might be more confusing in the following example with two logarithmic functions.
Example 2
Let us consider the following functions:
f ( x ) = ln ( x 1 ) + ln ( x + 1 ) , D o m ( f ) = ] 1 , [ g ( x ) = ln ( x 2 1 ) , D o m ( g ) = ] , 1 [ ] 1 , [
The GeoGebra gives a strange answer here, “the two function are equal” (Figure 6 and Figure 7) no matter of the order, but their graphs are represented differently of course (see Figure 8 and Figure 9), reflecting the difference between the domains.
In another type of failure, the GeoGebra answers that the two functions are equal, and this is true only at the intersection of the two domains for the interval ] 1 , [ . From a mathematical point of view, the two functions are different.
When the same GeoGebra draws a graph, the difference between the two functions can be visualized, as seen in the subsequent two figures (Figure 8 and Figure 9).
This difference is evident again from a mathematical point of view when considering the difference between the two domains. Even this example could offer an excellent opportunity for the teacher to argue for the importance of emphasizing the difference between the domains in case of the well-known algebraic relation, true only at the intersection of the two domains. The intersection of the two domains is in fact: D f D g = ] 1 , [ . Thus, the equality: ln ( x 1 ) + ln ( x + 1 ) = ln ( x 2 1 ) holds only for the interval ] 1 , [ , the intersection of the two domains. The function f ( x ) = ln ( x 1 ) + ln ( x + 1 ) has the domain D f = ] 1 , [ , while the function g ( x ) = ln ( x 2 1 ) has the domain D g = ] , 1 [ ] 1 , [ , thus D f D g . The intersection of the two domains is D f D g = ] 1 , [ ; thus, the above equality holds only for the interval ] 1 , [ . When checking the results with other computer tools, and graphing the above two functions, one obtains the same answers. Below, Figure 10, Figure 11 and Figure 12 show the respective graphs plotted in Maple and wxMaxima.
Example 3
The following example shows that some other confusing facts may appear in a similar case. If the same logic is repeated for another two functions, the same problem appears but in a different manner. Let us consider the following functions:
f ( x ) = x 1 x 1 , D o m ( f ) = [ 1 , [ g ( x ) = x 2 1 , D o m ( g ) = ] , 1 ] [ 1 , [
The GeoGebra gives a strange answer again here—“the two functions are equal” (Figure 13 and Figure 14)—no matter the order. However, when illustrated, their graphs are different, reflecting the difference between their domains (Figure 15 and Figure 16).
The GeoGebra graphs of the two functions reveal a similar difference as seen in the previous case:
Once again, it is crucial to emphasize the validity of the equality of the two irrational algebraic expressions. The algebraic equality x 1 x + 1 = x 2 1 is only true at the intersection of the two domains. The function f ( x ) = x 1 x + 1 has the domain D f = [ 1 , [ , while the function g ( x ) = x 2 1 the domain D g = ] , 1 ] [ 1 , [ , thus D f D g . The intersection of the two domains is D f D g = D f = [ 1 , [ ; thus, the above equality holds only for the interval [ 1 , [ .
Therefore, it is possible to verify this by plotting the two functions in Maple; however, a new challenge appears here, the two graphs not only differ in their domain, but Maple seems to tackle the function f in a different way to how GeoGebra does (Figure 17 and Figure 18).
What happened here? Maple graphing uses complex functions too, and this explains the difference of the two graphs, obtained first by GeoGebra only working with real functions (Figure 15 and Figure 16). However, Maple can also handle complex functions (Figure 17 and Figure 18), and the difference is clear when comparing Figure 15 and Figure 17.
Remark 1.
In the last two Maple graphs, the graph of the functions is apparently not touching the x-axes. The reason for this is that, in x = −1 and x = 1, the graphs have almost vertical tangents. The teacher could ask students to compute the derivatives and challenge them to analyze the case.
The wxMaxima graphing gives similar results to Maple, as shown in Figure 19.
Example 4
The phenomenon met in Example 3 can also be seen by the students in the case of the following well-known function. Let us consider the functions: f ( x ) = x 2 + 2 x + 1 and g ( x ) = x + 1 x + 1 , where D f = ] , [ and D g = [ 1 , [ .
A similar challenge can be formulated for the students when graphing these two functions (Figure 20, Figure 21 and Figure 22).
The differences are rooted in the way GeoGebra and wxMaxima/Maple are using real and complex numbers. GeoGebra only makes computations restricted to real numbers, while the computation with wxMaxima and Maple are using complex numbers by definition.
The above two examples show that the right CAS program for the given educational environment is needed. For secondary schools, the use of GeoGebra covers most of the content of their curricula. In contrast, for higher education (STEAM education), where complex functions are included in curricula, it is helpful to provide a detailed explanation of the differences between the graphs obtained using GeoGebra and Maple/wxMaxima.

5. Conclusions

Technology is prevalent in all areas of life, and the possibilities offered by Web 4.0 are gradually becoming a reality. It is widely accepted that the integration of information and communication technologies (ICTs) and the wide variety of digital tools available are causing changes in traditional education and accelerating its transformation. Education must keep up with this transformation; thus, its technologization is both essential and inevitable.
During the experiment (Section 2), the increase in group knowledge level was measured through participants’ individual progress. Based on the findings, the most significant improvement in knowledge, as shown in Figure 2, occurred when the mixed method was used (the case of experimental group 2).
Thus, the practical experiment shows that the winning methodology in teaching mathematics is a mix of traditional methods and the usage of computer tools/mathematical software. The experiment highlighted that giving only the computer tools for individual use is insufficient for improving students’ sustainable knowledge level, as also stated by [33].
The transition to technology-based classrooms and the constant use of educational software is a prerequisite for sustainable STEAM and mathematics education. This enables a collaborative learning environment, and the teacher must be able to use digital technologies to foster and enhance learners’ activities. Moreover, students can use digital technologies as part of collaborative assignments, improving communication, creativity, critical thinking, and collaborative knowledge-sharing [14]. According to [56], in the digital era, problem-solving using learners’ cognition is the only skill required for artificial intelligence (AI). These transition challenges demand expanding the already known and applied pedagogical methods and adopting new, active, and innovative methodologies.
As the presented examples in Section 4 show, using CAS and DGS, the visualization of functions becomes easier. A deeper understanding of concepts can also be achieved [57,58,59] using the “black box mathematics” [60] method, i.e., only focusing on the advantages of clickable mathematics and the so-called principle of “white box mathematics” [60] notions [61,62]. This powerful tool can be used to “walk around” the concepts to be learned and understood several times, seeking a more precise outline and a deeper understanding of them. This helps to comprehend the limits and possible contradictions of applying these concepts in theoretical and real-world practical problems.
The examples chosen in the paper are considered the most efficient examples for students according to authors’ teaching experience. Students’ attention can easily be directed toward the possible or real-life mistakes that can appear in software usage, motivating them to find their own examples, and thus ultimately mastering these computer tools.
The outcomes of Section 4 offer educators and learners new ideas and elements for innovative learning models that can be immediately applied in math teaching.
CAS and DGS are essential tools for teaching and learning mathematics, developing students’ math knowledge and performance, and increasing their analytical and critical thinking. It is a powerful and innovative tool for developing 21st-century skills. The CAS and DGS tools are useful not only in the education/teaching process (as observed during online teaching in the pandemic period), but they proved to be highly motivating and engaging for students. Among more skilled and qualified students, using these tools proved to be more stimulating, as they are more motivated to push the boundaries and constraints of the programs. The presented examples in this paper are significant for all users. They demonstrate the need for an enhanced, mathematical background knowledge in this case, in addition to adequate technical and user knowledge.

6. Limitations

The research was limited to one area of math, the graphing of functions, since it is one of the most critical and problematic issues faced by 1st year university students. From a critical point of view, the challenges were analyzed in this area to highlight the need for the proper and intelligent use of math software.

7. Future Research

The examples presented in Section 4 of this paper could serve as a starting point to deepen our understanding of the analysis of functions: the understanding of key notions and problems related to the computation of the limits of functions, studying continuous functions or points of discontinuity of functions, and studying graphing functions with two variables.

Author Contributions

Conceptualization, P.K., Z.S., Z.K.S., J.G., R.N.; methodology, P.K., Z.S., Z.K.S., J.G., R.N.; software, P.K., Z.S.,; validation, P.K., Z.S., Z.K.S.; formal analysis, Z.K.S., R.N.; investigation, P.K., Z.S., Z.K.S., J.G., R.N.; resources, P.K., Z.S., Z.K.S., J.G., R.N.; data curation, J.G., R.N.; writing—original draft preparation, P.K., Z.S., Z.K.S., J.G., R.N.; writing—review and editing, P.K., Z.K.S.; visualization, Z.K.S., Z.S., J.G.; supervision, P.K.; project administration, Z.K.S.; funding acquisition, P.K., Z.S., Z.K.S., J.G., R.N. All authors have read and agreed to the published version of the manuscript.

Funding

This research received no external funding.

Institutional Review Board Statement

Not applicable.

Informed Consent Statement

Not applicable.

Data Availability Statement

Not applicable.

Acknowledgments

Authors are grateful to the scientific and methodological support received from: grant KEGA 026UK-4/2022 “The concept of Constructionism and Augmented Reality in STEM Education (CEPENSAR), methodology research group in the Department of Applied Mathematical Studies (DAMS) of George Emil Palade University of Medicine, Pharmacy, Science, and Technology of Targu Mures. The authors of the paper wish to acknowledge the valuable remarks and support of partners of the CEEPUS Network CIII-HU-0028-15-2122.

Conflicts of Interest

The authors declare no conflict of interest.

Appendix A

Math test for 1st year study students.
Sustainability 14 12991 i001

Appendix B

The average score of groups based on data Test results 1 and Test results 2.
Sustainability 14 12991 i002

References

  1. Yong, Z. Who’s Afraid of the Big Bad Dragon? Jossey-Bass—A Wiley Brand: San Francisco, CA, USA, 2014. [Google Scholar]
  2. Sterling, S. Sustainable Education—Towards a Deep Learning Response to Unsustainability. Policy Pract. Dev. Educ. Rev. 2008, 6, 63–68. Available online: https://www.developmenteducationreview.com/sites/default/files/article-pdfs/sterling%20pers%201.pdf (accessed on 10 November 2021).
  3. Aldon, G.; Trgalová, J. (Eds.) Technology in Mathematics Teaching; Springer: Cham, Switzerland, 2019. [Google Scholar] [CrossRef]
  4. Monaghan, J.; Trouche, L. Mathematics Teachers and Digital Tools; Springer: Cham, Switzerland, 2016; Volume 110. [Google Scholar] [CrossRef]
  5. Ochkov, F.V.; Bogomolova, P.E. Teaching Mathematics with Mathematical Software. J. Humanist. Math. 2015, 5, 265–285. [Google Scholar] [CrossRef] [Green Version]
  6. Juan, C.C. The technology acceptance model in the Collaborative learning of Web 2.0, Web 3.0 and Web 4.0: Higher Education case study. WSEAS Trans. Environ. Dev. 2020, 16, 680–688. [Google Scholar] [CrossRef]
  7. Miri, B. Transition from traditional to ICT-enhanced learning environments in undergraduate chemistry courses. Comput. Educ. 2007, 48, 30–43. [Google Scholar] [CrossRef]
  8. Alabdulaziz, M. COVID-19 and the use of digital technology in mathematics education. Educ. Inf. Technol. 2021, 26, 7609–7633. [Google Scholar] [CrossRef]
  9. Carroll, N.; Conboy, K. Normalising the “new normal”: Changing tech-driven work practices under pandemic time pressure. Int. J. Inf. Manag. 2020, 55, 102186. [Google Scholar] [CrossRef]
  10. Pacheco, J.A. The “new normal” in education. Prospects 2021, 51, 3–14. [Google Scholar] [CrossRef]
  11. Zhao, Y.; Watterston, J. The changes we need: Education post COVID-19. J. Educ. Chang. 2021, 22, 3–12. [Google Scholar] [CrossRef]
  12. OECD. OECD Digital Education Outlook 2021: Pushing the Frontiers with Artificial Intelligence, Blockchain and Robots; OECD Publishing: Paris, France, 2021. [Google Scholar] [CrossRef]
  13. Jha, A.K. Understanding Generation Alpha; OSFPreprints: Charlottesville, VA, USA, 2020; pp. 1–12. [Google Scholar] [CrossRef]
  14. Punie, Y. European Framework for the Digital Competence of Educators: DigCompEdu; Redecker, C., Ed.; Publications Office of the European Union: Luxembourg, 2017. [Google Scholar] [CrossRef]
  15. Klement, M.; Dostál, J.; Kubrický, J.; Bártek, K. ICT versus teachers: Adoration or resistence? [ICT Nástroje a Učitelé: Adorace, či Rezistence?]; Univerzita Palackého v Olomouci: Olomouc, Czech Republic, 2017. [Google Scholar] [CrossRef]
  16. Lavicza, Z.; Weinhandl, R.; Prodromou, T.; Anđić, B.; Lieban, D.; Hohenwarter, M.; Fenyvesi, K.; Brownell, C.; Diego-Mantecón, J.M. Developing and Evaluating Educational Innovations for STEAM Education in Rapidly Changing Digital Technology Environments. Sustainability 2022, 14, 723. [Google Scholar] [CrossRef]
  17. Drijvers, P. Digital Technology in Mathematics Education: Why It Works (or Doesn’t). 2013. Available online: https://files.eric.ed.gov/fulltext/EJ1054923.pdf (accessed on 1 May 2022).
  18. Hillmayra, D.; Ziernwalda, L.; Reinholda, F.; Hoferb, I.S.; Reiss, M.K. The potential of digital tools to enhance mathematics and science learning in secondary schools: A context-specific meta-analysis. Comput. Educ. 2020, 153, 103897. [Google Scholar] [CrossRef]
  19. UNESCO. Education for Sustainable Development Goals. Learning Objectives; UNESCO Digital Library: Paris, France, 2022; Available online: https://unesdoc.unesco.org/ark:/48223/pf0000247444 (accessed on 18 April 2022).
  20. Artigue, M. Learning Mathematics in a CAS Environment: The Genesis of a Reflection about Instrumentation and the Dialectics between Technical and Conceptual Work. Int. J. Comput. Math. Learn. 2002, 7, 245–274. [Google Scholar] [CrossRef]
  21. Guin, D.; Ruthven, K.; Trouche, L. (Eds.) The Didactical Challenge of Symbolic Calculators, 1st ed.; Springer: New York, NY, USA, 2005. [Google Scholar] [CrossRef] [Green Version]
  22. Hutkemri, Z.; Sharifah, N.A. The Effectiveness of the GeoGebra Software: The Intermediary Role of Procedural Knowledge on Students’ Conceptual Knowledge and Their Achievement in Mathematics. EURASIA J. Math. Sci. Technol. Educ. 2017, 13, 2155–2180. [Google Scholar] [CrossRef]
  23. Buchberger, B. Computer Algebra: The End of Mathematics? ACM SIGSAM Bull. 2002, 36, 3–9. [Google Scholar] [CrossRef]
  24. Devlin, K. Teaching mathematics as a way of thinking—Not calculating. Eest. Haridusteaduste Ajak. 2021, 9, 33–59. [Google Scholar] [CrossRef]
  25. Zhao, Y. What Works May Hurt—Side Effects in Education; Teachers College Press: New York, NY, USA, 2018. [Google Scholar]
  26. Hervey, S. What Is Effective Teaching of Mathematics? 2013. Available online: https://www.generationready.com/our-services/mathematics-2/ (accessed on 2 December 2021).
  27. Körtesi, P.; Desislava, G. Development of Mathematical Skills with Commonly Used Computer Software. In Proceedings of the MultiScience—XXIX microCAD International Multidisciplinary Scientific Conference, Miskolc, Hungary, 9–10 April 2015; pp. 1–9. [Google Scholar] [CrossRef]
  28. Mucha, V.; Páleš, M. Visualization and presentation of actuarial demography data with dynamic elements using Microsoft Excel 2013. In Proceedings of the 10th International Scientific Conference, Bratislava, Slovakia, 12–13 November 2015. [Google Scholar]
  29. Lapitka, M. Tvorba a Použitie Didaktických Testov (The Creation and the Usage of the Didactical Tests); Štátny Pedagogický Ústav. (The State Pedagogical Institute): Bratislava, Slovakia, 1996. [Google Scholar]
  30. Kulik, J.A.; Bangert, R.L.; Williams, G.W. Effects of computer-based teaching on secondary school students. J. Educ. Psychol. 1983, 75, 19–26. [Google Scholar] [CrossRef]
  31. Middleton, F. Reliability vs. Validity in Research|Difference, Types and Examples. 2019. Available online: https://www.scribbr.com/methodology/reliability-vs-validity/ (accessed on 6 September 2022).
  32. Felician, D.; Torres, L.; Santín, D. One Laptop per Child? Using Production Frontiers for Evaluating the Escuela2.0 Program in Spain. Mathematics 2021, 9, 2600. [Google Scholar] [CrossRef]
  33. Trouche, L. Integrating Tools as an Ordinary Component of the Curriculum in Mathematics Education. In Tools and Mathematics; Springer: Cham, Switzerland, 2016; Volume 110, pp. 267–303. [Google Scholar] [CrossRef]
  34. Lavicza, Z. Examining the use of Computer Algebra Systems in university-level mathematics teaching. J. Comput. Math. Sci. Teach. 2009, 28, 99–111. Available online: https://www.learntechlib.org/primary/p/30303/ (accessed on 14 July 2022).
  35. Simonka, Z. Implementation of ICT in teacher training in the world and in Slovakia. Ekon. Inform. 2008, 6. Available online: https://fhi.euba.sk/en/51-science-and-research/scientific-journals/economics-and-informatics (accessed on 16 February 2022). ISSN 1336-3514.
  36. Buteau, C.; Jarvis, D.; Lavicza, Z. On the Integration of Computer Algebra Systems (CAS) by Canadian Mathematicians: Results of a National Survey. Can. J. Sci. Math. Technol. Educ. 2014, 14, 35–57. [Google Scholar] [CrossRef]
  37. Fenyvesi, K.; Koskimaa, R.; Lavicza, Z. Experiential Education of Mathematics: Art and Games for Digital Natives. Kasvatus 2015, 9, 107–134. Available online: http://www.kasvatus-ja-aika.fi/dokumentit/fenyvesial__0804151248.pdf (accessed on 14 July 2022).
  38. Adelabu, F.; Makgato, M.; Ramaligela, M. The Importance of Dynamic Geometry Computer Software on Learners’ Performance in Geometry. Electron. J. e-Learn. 2019, 17, 52–63. Available online: https://files.eric.ed.gov/fulltext/EJ1216699.pdf (accessed on 10 July 2022).
  39. İbili, E. The Use of Dynamic Geometry Software from a Pedagogical Perspective: Current Status and Future Prospects. J. Comput. Educ. Res. 2019, 7, 337–355. [Google Scholar] [CrossRef]
  40. Lavicza, Z.; Prodromou, T.; Fenyvesi, K.; Hohenwarter, M.; Juhos, I.; Koren, B. Integrating STEM-related Technologies into Mathematics Education at Large Scale. Int. J. Technol. Math. Educ. 2020, 27, 3–12. [Google Scholar] [CrossRef]
  41. Rutherford, T.; Allison, S.L.; Arena, S.L.; Schenke, K. Impact on mathematics self-beliefs from a mastery-based mathematics software. J. Res. Technol. Educ. 2020, 52, 79–94. [Google Scholar] [CrossRef]
  42. Davis, J.P. The Decline, Fall, and Current Resurgence of Visual Geometry. History of Mathematics & Teaching of Mathematics; University of Miskolc: Miskolc, Hungary, 2004; Available online: https://www.uni-miskolc.hu/hmtm/abstracts.html (accessed on 5 March 2022).
  43. Braman, J.; Vincenti, G.; Trajkovski, G. Handbook of Research on Computational Arts and Creative Informatics; Information Science Reference (an imprint of IGI Global): Hershey, PA, USA, 2009. [Google Scholar] [CrossRef]
  44. Petrášková, V.; Rosa, P. Using Maple Cloud Computing in Financial Education of Pre-service Teachers. Math. Comput. Sci. 2019, 13, 237–245. [Google Scholar] [CrossRef]
  45. Nanteni, G.; Leong, K.E. The Effect of Dynamic Geometry Software Geometer’s Sketchpad on Students’ Achievement in Topic Circle among Form Two Students. Malays. Online J. Educ. Technol. 2020, 8, 58–68. [Google Scholar] [CrossRef]
  46. Fedriani, E.; Moyano, R. Using Maxima in the Mathematics Classroom. Int. J. Technol. Math. Educ. 2011, 18, 171–176. Available online: https://www.semanticscholar.org/paper/Using-Maxima-in-the-Mathematics-Classroom-Fedriani-Moyano/ead206114e9f66d93e82249ee6855fbc486eb2a2 (accessed on 5 March 2022).
  47. Sagesse, M.U.; Maniraho, J.F.; Michael, T. GeoGebra integration and effectiveness in the teaching and learning of mathematics in secondary schools: A review of literature. Afr. J. Educ. Stud. Math. Sci. 2020, 16, 1–13. [Google Scholar] [CrossRef]
  48. Hohenwarter, J.; Hohenwarter, M.; Lavicza, Z. Evaluating Difficulty Levels of Dynamic Geometry Software Tools to Enhance Teachers’ Professional Development. Int. J. Technol. Math. Educ. 2010, 17, 127–134. Available online: https://www.semanticscholar.org/paper/Evaluating-Difficulty-Levels-of-Dynamic-Geometry-to-Hohenwarter-Hohenwarter/093dc16d839f35151701ea3594d765ab59131a7c (accessed on 5 March 2022).
  49. Maxima. 2022. Available online: https://wxmaxima-developers.github.io/wxmaxima/ (accessed on 14 July 2022).
  50. Karjanto, N.; Husain, H. Not Another Computer Algebra System: Highlighting wxMaxima in Calculus. Mathematics 2021, 9, 1317. [Google Scholar] [CrossRef]
  51. Kovacs, Z.; Recio, T.; Velez, M.P. GeoGebra Discovery in Context. Electron. Proc. Theor. Comput. Sci. 2021, 352, 141–147. [Google Scholar] [CrossRef]
  52. Maple. 2022. Available online: https://www.maplesoft.com/ (accessed on 5 March 2022).
  53. Robert, M.; Jürgen, G.; Ilias, S.K. Maple in Mathematics Education and Research; Springer: Cham, Switzerland, 2021; Volume 1414. [Google Scholar] [CrossRef]
  54. Dostál, J. MS Excel pro učitele. In MS Excel for Teachers; Palacký University of Olomouc: Olomouc, Czech Republic, 2009. [Google Scholar]
  55. Microsoft-Excel. 2022. Available online: https://www.britannica.com/technology/Microsoft-Excel (accessed on 12 April 2022).
  56. UNESCO. Human Learning in the Digital Era. 2019. Available online: https://unesdoc.unesco.org/ark:/48223/pf0000367761.locale=en (accessed on 2 May 2022).
  57. Wester, J.M. Computer Algebra Systems: A Practical Guide, 1st ed.; Wiley: Hoboken, NJ, USA, 2000. [Google Scholar]
  58. Chan, K.; Leung, S. Dynamic Geometry Software Improves Mathematical Achievement: Systematic Review and Meta-Analysis. J. Educ. Comput. Res. 2014, 51, 311–325. [Google Scholar] [CrossRef]
  59. Tola, B.B.; France, M. The effect of GeoGebra on STEM students learning trigonometric functions. Cogent Educ. 2022, 9, 1–18. [Google Scholar] [CrossRef]
  60. Buchberger, B. Should students learn integration rules? ACM SIGSAM Bull. 1990, 24, 10–17. [Google Scholar] [CrossRef]
  61. Cunska, A.; Savicka, I. Use of ICT teaching-learning methods make school math blossom. Procedia-Soc. Behav. Sci. 2012, 69, 1481–1488. [Google Scholar] [CrossRef]
  62. Simonka, Z. Graphing of elementary functions and their transformations using ICT (projects and studies in the world). In Proceedings of the APLIMAT 2008—7th International Conference on Applied Mathematics, Department of Mathematics, Faculty of Mechanical Engineering STU, Bratislava, Slovakia, 5–8 February 2008. [Google Scholar]
Figure 1. Elem_F_Grapher—the main window and the power functions.
Sustainability 14 12991 g001
Figure 2. The change in average relative success rates in each group. Own calculations.
Sustainability 14 12991 g002
Figure 3. Rational functions in Elem_F_Grapher.
Sustainability 14 12991 g003
Figure 4. GeoGebra answer 1: “g and f are equal”.
Sustainability 14 12991 g004
Figure 5. GeoGebra answer 2: “f and g are not equal”.
Sustainability 14 12991 g005
Figure 6. GeoGebra answer 1 for logarithms: “g and f are equal”.
Sustainability 14 12991 g006
Figure 7. GeoGebra answer 2 for logarithms: “f and g are equal”.
Sustainability 14 12991 g007
Figure 8. GeoGebra graph for function f.
Sustainability 14 12991 g008
Figure 9. GeoGebra graph for function g.
Sustainability 14 12991 g009
Figure 10. Maple graph for f ( x ) = ln ( x 1 ) + ln ( x + 1 ) .
Sustainability 14 12991 g010
Figure 11. Maple graph for g ( x ) = ln ( x 2 1 ) .
Sustainability 14 12991 g011
Figure 12. wxMaxima graphs for f ( x ) = ln ( x 1 ) + ln ( x + 1 ) and g ( x ) = ln ( x 2 1 ) .
Sustainability 14 12991 g012
Figure 13. GeoGebra answer 1 for irrational functions “f and g are equal”.
Sustainability 14 12991 g013
Figure 14. GeoGebra answer 2 for irrational functions “g and f are equal”.
Sustainability 14 12991 g014
Figure 15. GeoGebra graph of function f ( x ) = x 1 x + 1 .
Sustainability 14 12991 g015
Figure 16. GeoGebra graph of function g ( x ) = x 2 1 .
Sustainability 14 12991 g016
Figure 17. Maple graph of function f ( x ) = x 1 x + 1 .
Sustainability 14 12991 g017
Figure 18. Maple graph of function g ( x ) = x 2 1 .
Sustainability 14 12991 g018
Figure 19. wxMaxima graphs for f ( x ) = x 1 x + 1 and g ( x ) = x 2 1 .
Sustainability 14 12991 g019
Figure 20. GeoGebra graph of function f ( x ) = x 2 + 2 x + 1 .
Sustainability 14 12991 g020
Figure 21. GeoGebra graph of function g ( x ) = x + 1 x + 1 .
Sustainability 14 12991 g021
Figure 22. wxMaxima graphs for f ( x ) = x 2 + 2 x + 1 and g ( x ) = x + 1 x + 1 .
Sustainability 14 12991 g022
Table 1. The average scores. Own calculation.
TEST RESULTS 1TEST RESULTS 2
Control Group
(ContGr)
x ¯ ContGr = ContGr x i n ContGr = 4.375 x ¯ ContGr = ContGr x i n ContGr = 10.0625
Experimental Group 1
(ExpGr1)
x ¯ ExpGr 1 = ExpGr 1 x i n ExpGr 1 = 7.0 5 ¯ x ¯ ExpGr 1 = ExpGr 1 x i n ExpGr 1 = 11.7 2 ¯
Experimental Group 2
(ExpGr2)
x ¯   ExpGr 2 = ExpGr 2 x i n ExpGr 2 = 5.154 x ¯   ExpGr 2 = ExpGr 2 x i n ExpGr 2 = 11.46
Publisher’s Note: MDPI stays neutral with regard to jurisdictional claims in published maps and institutional affiliations.

