Article

Parametric-Based Multi-Objective Optimization Workflow: Daylight and Energy Performance Study of Hospital Building in Algeria

by
Soumaya Besbas
1,*,
Francesco Nocera
2,*,
Noureddine Zemmouri
1,
Mohamed Amine Khadraoui
3 and
Asma Besbas
4
1
Laboratory of Design and Modeling of Architectural Forms and Ambiances (LACOMOFA), Department of Architecture, Mohamed Khider University, Biskra 07000, Algeria
2
Department of Civil Engineering and Architecture, University of Catania, Via Santa Sofia, 64, 95123 Catania, Italy
3
Laboratory of Construction Engineering and Architecture (LGCA), Abderrahmane Mira University, Bejaia 06000, Algeria
4
Laboratory of Smart Computing (LINFI), Mohamed Khider University, Biskra 07000, Algeria
*
Authors to whom correspondence should be addressed.
Sustainability 2022, 14(19), 12652; https://doi.org/10.3390/su141912652
Submission received: 13 August 2022 / Revised: 30 September 2022 / Accepted: 2 October 2022 / Published: 5 October 2022
(This article belongs to the Topic Built Environment and Human Comfort)

Abstract

:
Daylight is an important factor that significantly contributes to patients’ healing, with a reduction in the length of stay in the hospital. It can strongly affect energy consumption negatively or positively through lighting control strategies. Therefore, the case of healthcare buildings is very particular and sensitive, especially under extreme climate conditions as in hot and arid regions. The present study aims to determine a balance between daylight use and energy consumption through a parametric-based optimization of the external shading system in a typical hospital room in Biskra. This paper demonstrates how the implementation of parametric design with evolutionary algorithms is considered a reliable strategy to reach optimum solutions in building performance problems. The daylight performance is investigated based on multi-objective optimization to minimize the Energy Use Intensity “EUI”, while maximizing Spatial Daylight Autonomy “sDA” and Useful Daylight Illuminance “UDI”. A simulation model was developed via Grasshopper, which was employed with the use of Ladybug, Honeybee, and Octopus plug-ins. The results revealed that the adaptive facade system can improve indoor daylight levels and energy performance simultaneously compared to the conventional shading system. The presented framework may be used as a reference model, which can enhance opportunities to solve complex design problems in the early design stages and suggest recommendations for sustainable building design.

1. Introduction

Hospital rooms are sensitive areas for research in buildings’ environmental design, whether it be through patient observation and treatment or from the perspective of building studies. Daylight and an outside view allow the patients to heal significantly, decreasing both pain and the length of stay in hospitals. Few studies deal with the performance of daylight related to the thought behind architectural components in healthcare facilities. Indoor environments in healthcare buildings are particularly critical for patients’ well-being. Generally, the windows of patient rooms in hospitals have the same size and volume of space regardless of the orientation and daylighting conditions [1]. Daylight performance in buildings attempts to optimize the indoor environment, which provides comfortable and attractive conditions with greater productivity, exploring whether the external facade devices are designed correctly for optimal daylighting performance, especially in this typical study corpus “patient rooms” [2,3]. Numerous research studies have correlated the relationship between medical errors and adequate light levels. Appropriate daylight is important not only for the health of patients, but also for the staff in healthcare settings [4,5,6].
Building energy consumption around the world has increased dramatically in recent decades, and it is continually increasing according to researchers’ expectations [7,8]. Given the world’s energy crisis and climate change, the development of high-performance buildings and sustainable design has become a hot research topic. The principal goal is to reduce energy consumption while maintaining occupant satisfaction and well-being in indoor environments [8,9]. To assess the energy performance of buildings, the measured building metrics must be compared to certain reference values. The Energy Use Intensity (EUI) is one of these normalized metrics; it is the energy per square foot per year and is calculated by dividing the building’s total energy consumption in the year by its total floor area [7,8,9,10]. A reduced EUI indicates that the building is performing better, and several internal and external factors affect the energy consumption of buildings such as weather data, schedules, and several types of buildings, which often have a higher EUI than others [8].
In building problems, designers are confronted with multiple conflicting objectives, such as minimizing energy demand while maximizing daylight availability or thermal comfort in buildings. Genetic algorithms have often been used for architectural targets to solve this problem. Moreover, it is possible to simulate many possible outcomes more effectively and thus makes using parametric design in architecture easier than before [11]. GAs are computational models based on the theory of evolution, which starts with a population of possible solutions often based on a random selection of the chosen parameters. To pass to the next generation of solutions, each individual solution needs to succeed and determines how likely it is to be used to create offspring of the current generation [8,9,10,11,12].
Recent studies have focused on the parametric optimization approach of daylight and energy performance in different building types [13,14,15,16,17,18]. These studies suggest the use of this approach through optimization algorithms and simulation for seeking the optimum building schemes to change design parameters. Briefly, the findings from these studies showed that the effect of daylight, besides reducing artificial lighting consumption, is influenced by outdoor and indoor design parameters. Compared to other building types, there are few studies on the optimization approach of healthcare facilities. Ahmed Sherif et al. [19] conducted a study on the potential of using parametric workflows in the patient room case study. It focuses on optimizing the geometry of the external facade of the patient room to control solar penetration, thus improving the daylight performance of the angle and position of the window. Wagdy and Shalaby [20] conducted another study based on a parametric study, which tested the external and internal reflectors, as well as the ceiling geometry. This framework combined daylight simulation with a genetic algorithm to determine the best reflector configurations for suitable daylight performance in Cairo. Hinkle et al. [21] and Esteghamati et al. [22] carried out a study on the design exploration of building façades to optimize the energy demand use. These studies suggest solving complex design challenges by considering a large number of alternatives in the early design stage.
Southern Algeria is a region characterized by a hot and dry climate, where the circumstances are difficult with a special type of weather, which is sunny and clear sky most of the year, with rare rainfalls, desert winds, and extremely low humidity. The high temperature presented a challenge to the designers due to the high levels of solar radiation. In the summertime period, the highest temperature exceeds 40 °C in this region. Due to the overall cooling energy demands, this leads to significant energy use in buildings. Heat gain through openings constitutes a substantial factor of the cooling load, contributing significantly to energy demand [23]. In this context, hospital buildings have the largest EUI compared to other building types. In Algeria, there is a lack of studies related to architectural attempts to control indoor daylighting and energy performance in healthcare facilities. Hence, it is necessary to resolve problems of dissatisfaction with indoor environments in these crucial buildings, and this study proposes more sustainable patient room designs that suit the special conditions of such hot and dry locations.
The ultimate aim of this study is to develop a parametric workflow based on a multi-objective algorithm approach for an evaluation of building daylight and energy. Research on health buildings’ performance optimization early in the design process is still insufficient, and there is an important lack of recommendations and climate design guidelines for health buildings. Daylight is a crucial element because of its variations during the day and year, which is often neglected in health building designs. However, this concept is more complex and requires exceptional research. This study in particular is conducted at a hospital in patient rooms, as this is a critical case that needs specific research. Secondly, this case study takes place in a hot and arid region where solar radiation causes excessive overheating, glare, and discomfort. Lastly, the aim of this study is to reach optimal solutions by integrating genetic algorithms and parametric workflow to find a healthier daylight level in patient rooms, with optimum facade devices to avoid excessive heat gain and glare, while also minimizing energy demand and maximizing daylight availability. The study will attempt to clarify the approach of simulation-based optimization algorithms to evaluate daylight performance in patient rooms with Grasshopper and Rhino software, which is used to facilitate energy optimization of similar existing projects, as well as improve the adequacy of the parametric approach in the early design stage.

2. Methodology

The study is divided into three principal parts: The experimental design (in situ measurements), building performance simulation and validation (comparison with the base case model), and parametric based-optimization. The first step of the study involved a detailed field of measurements that were taken in the case study hospital rooms (described in Section 2.1). These relevant data were then used to validate the simulation model and were compared with the base case model (detailed in Section 2.3). Finally, the genetic algorithms optimization step was performed via Ladybug and Honeybee Grasshopper plugins, which constitute commonly accepted building simulation software [24]. Octopus was another plugin used in Grasshopper to apply evolutionary algorithm problem-solving in parametric design, which allows designers to reach many solutions and produce a variety of optimal trade-off solutions for each goal. According to A.M.Y. Toutou [15], a Pareto front is a tool that represents all alternatives in one single diagram, and the best solutions will be produced through an objective function. The optimization process details are described below in Section 2.4, with the results and discussion presented in Section 3.
In this paper, the Climate-Based Daylight Modelling (CBDM) metrics used were Spatial Daylight Autonomy (sDA), Useful Daylight Illuminance (UDI), and Energy Use Intensity (EUI), which were defined as three objectives necessary to improve the energy and daylighting performance of a hospital room model. To incorporate these building performance metrics into the validation and optimization steps, the time-varying illuminance distribution was evaluated through a field of measurements after the definition of the geometrical characteristics of the hospital room case study [25].

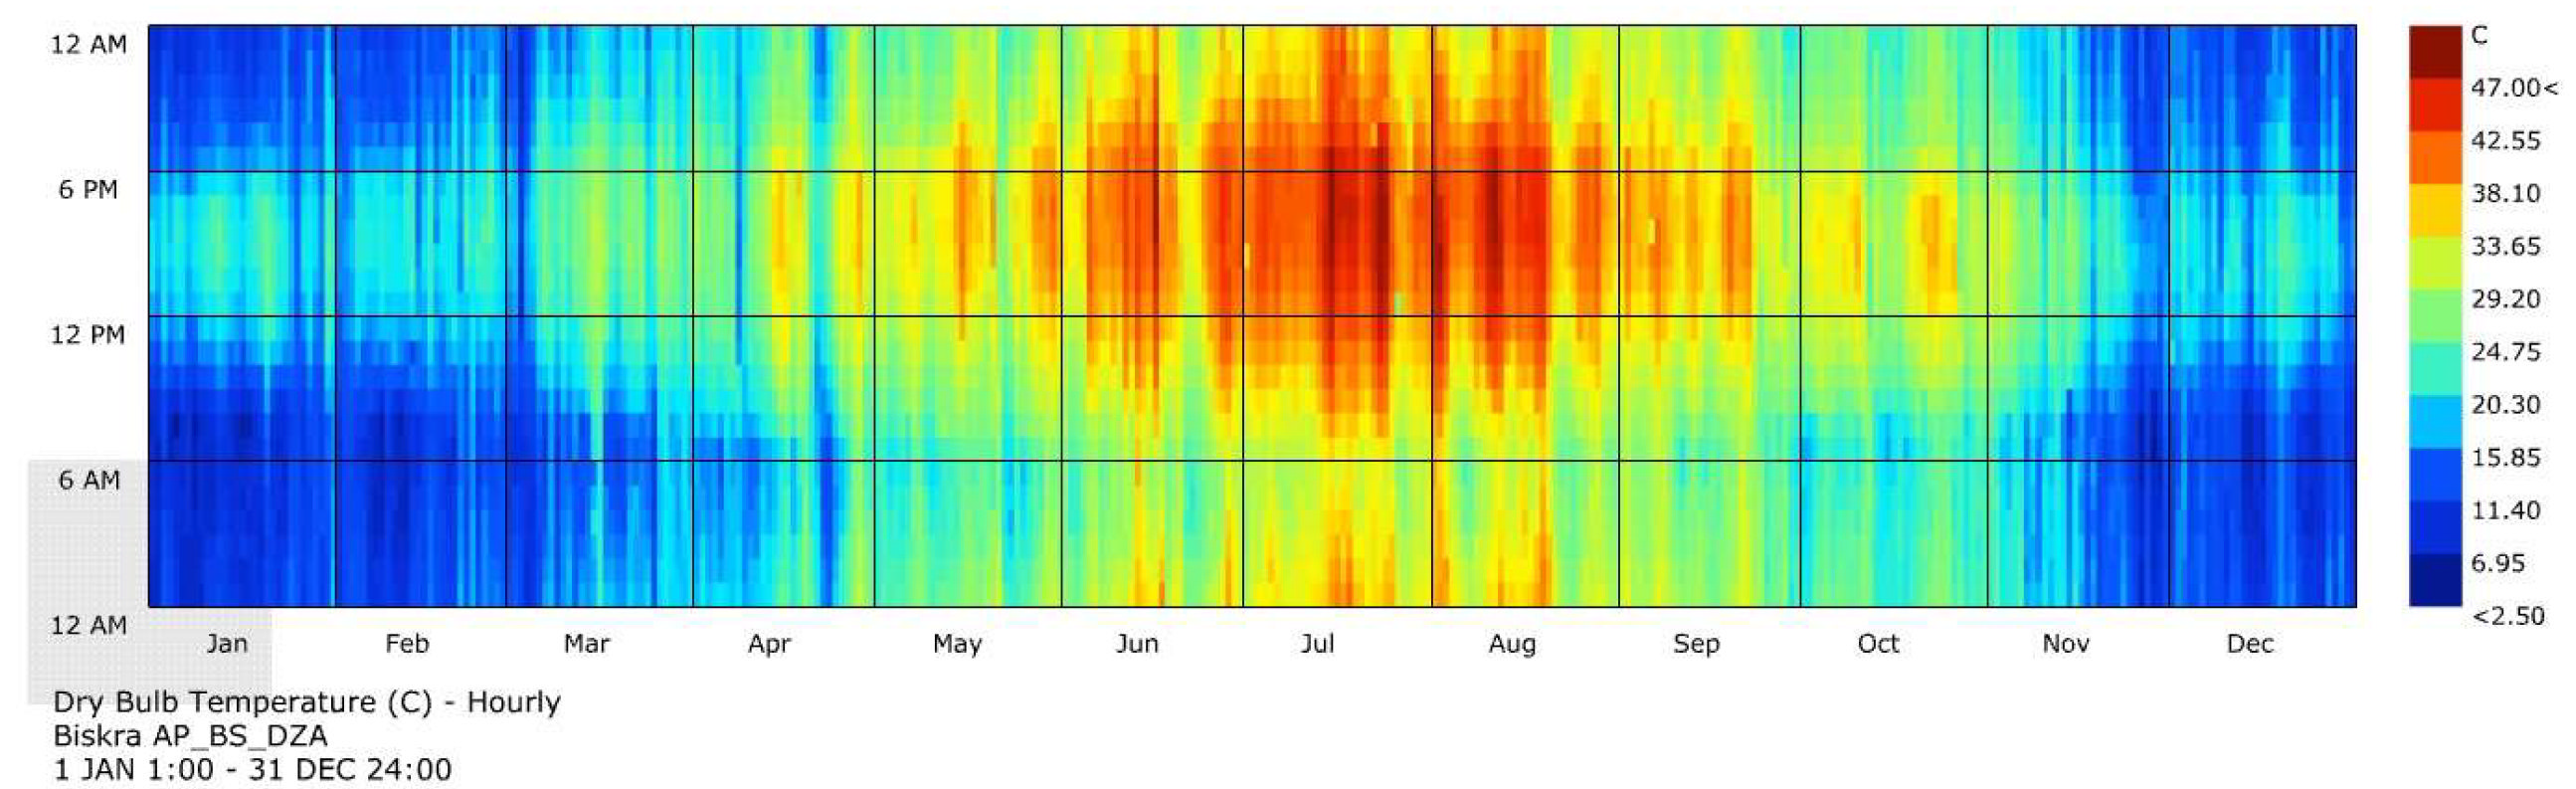
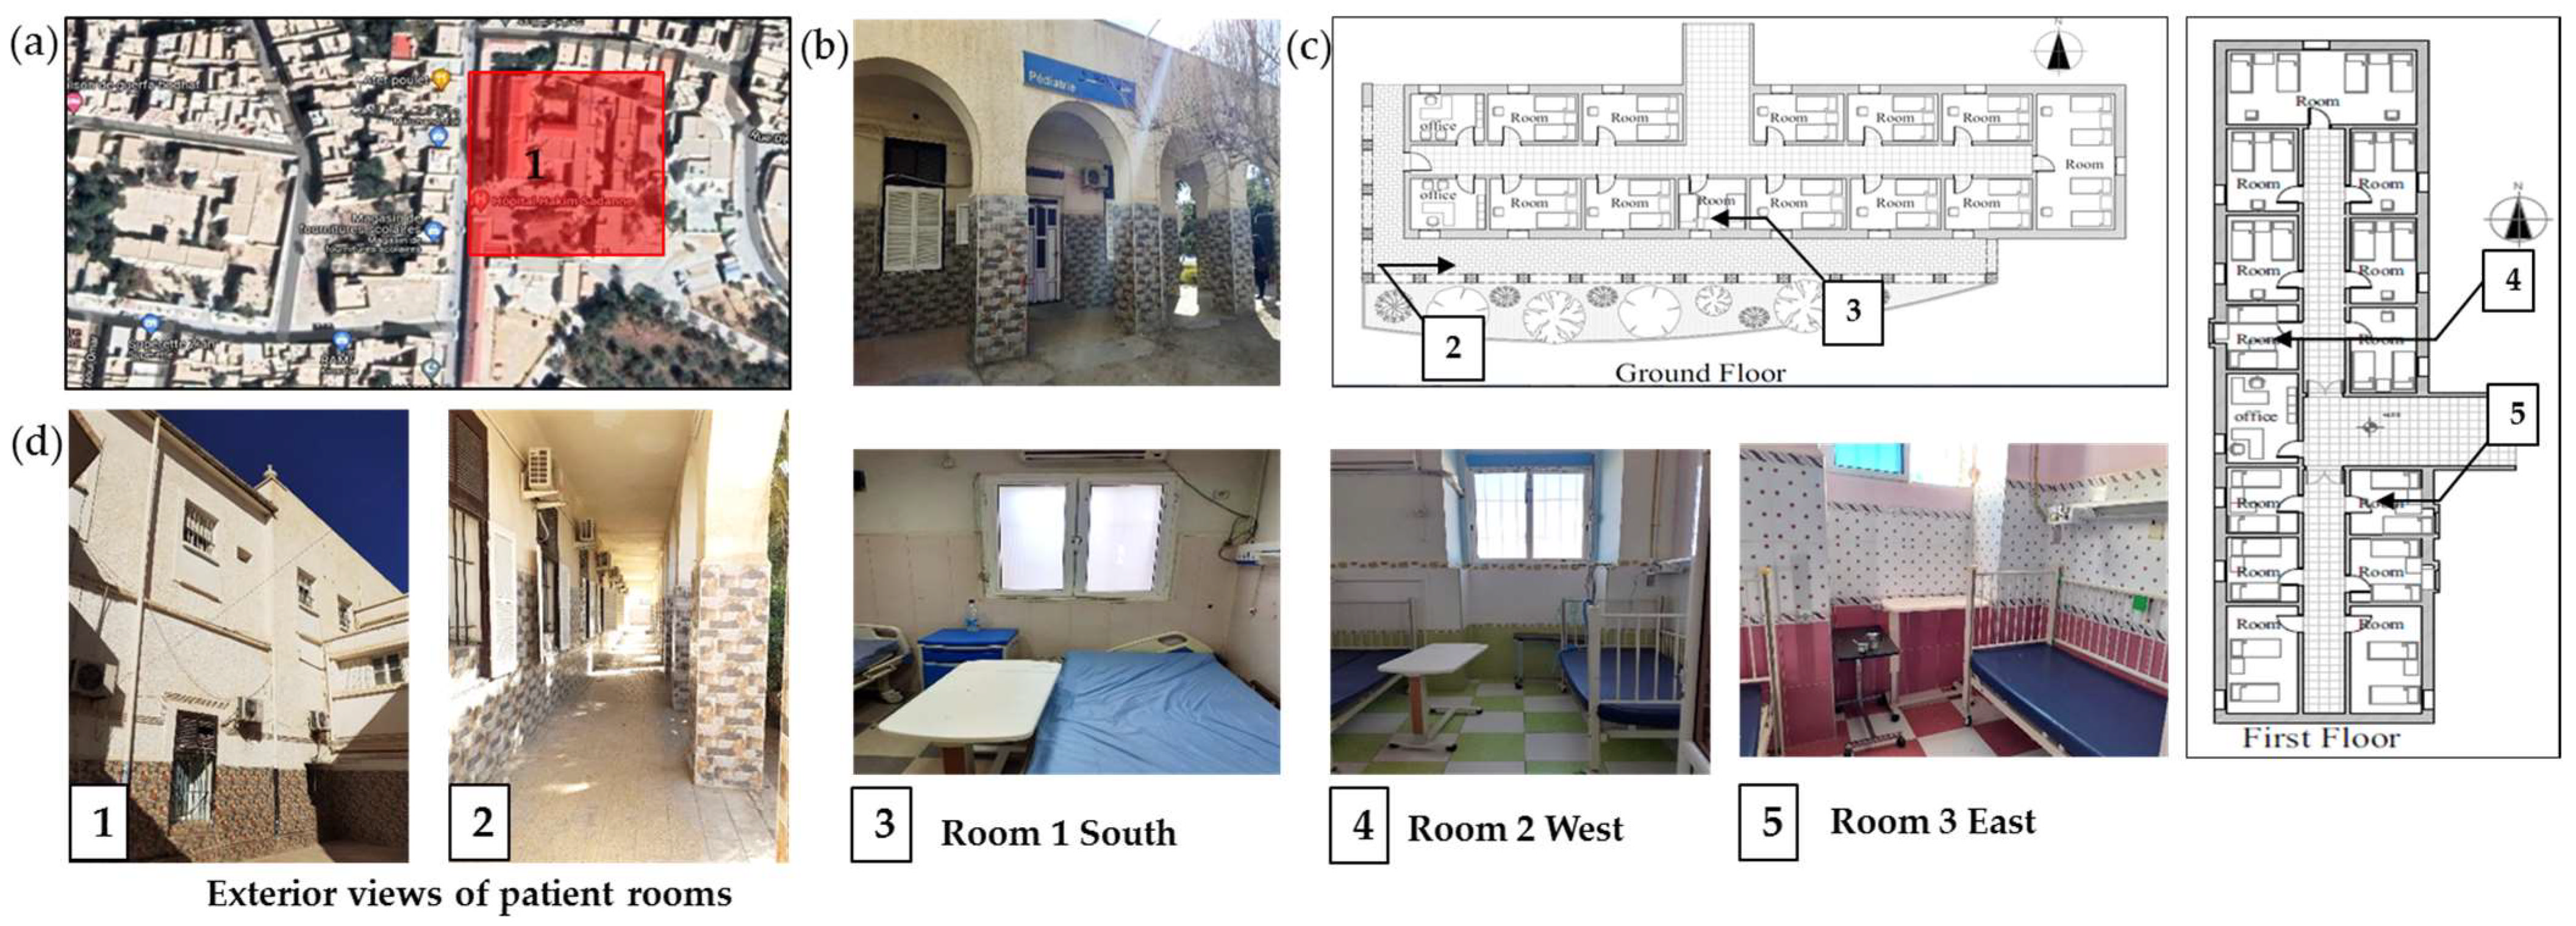
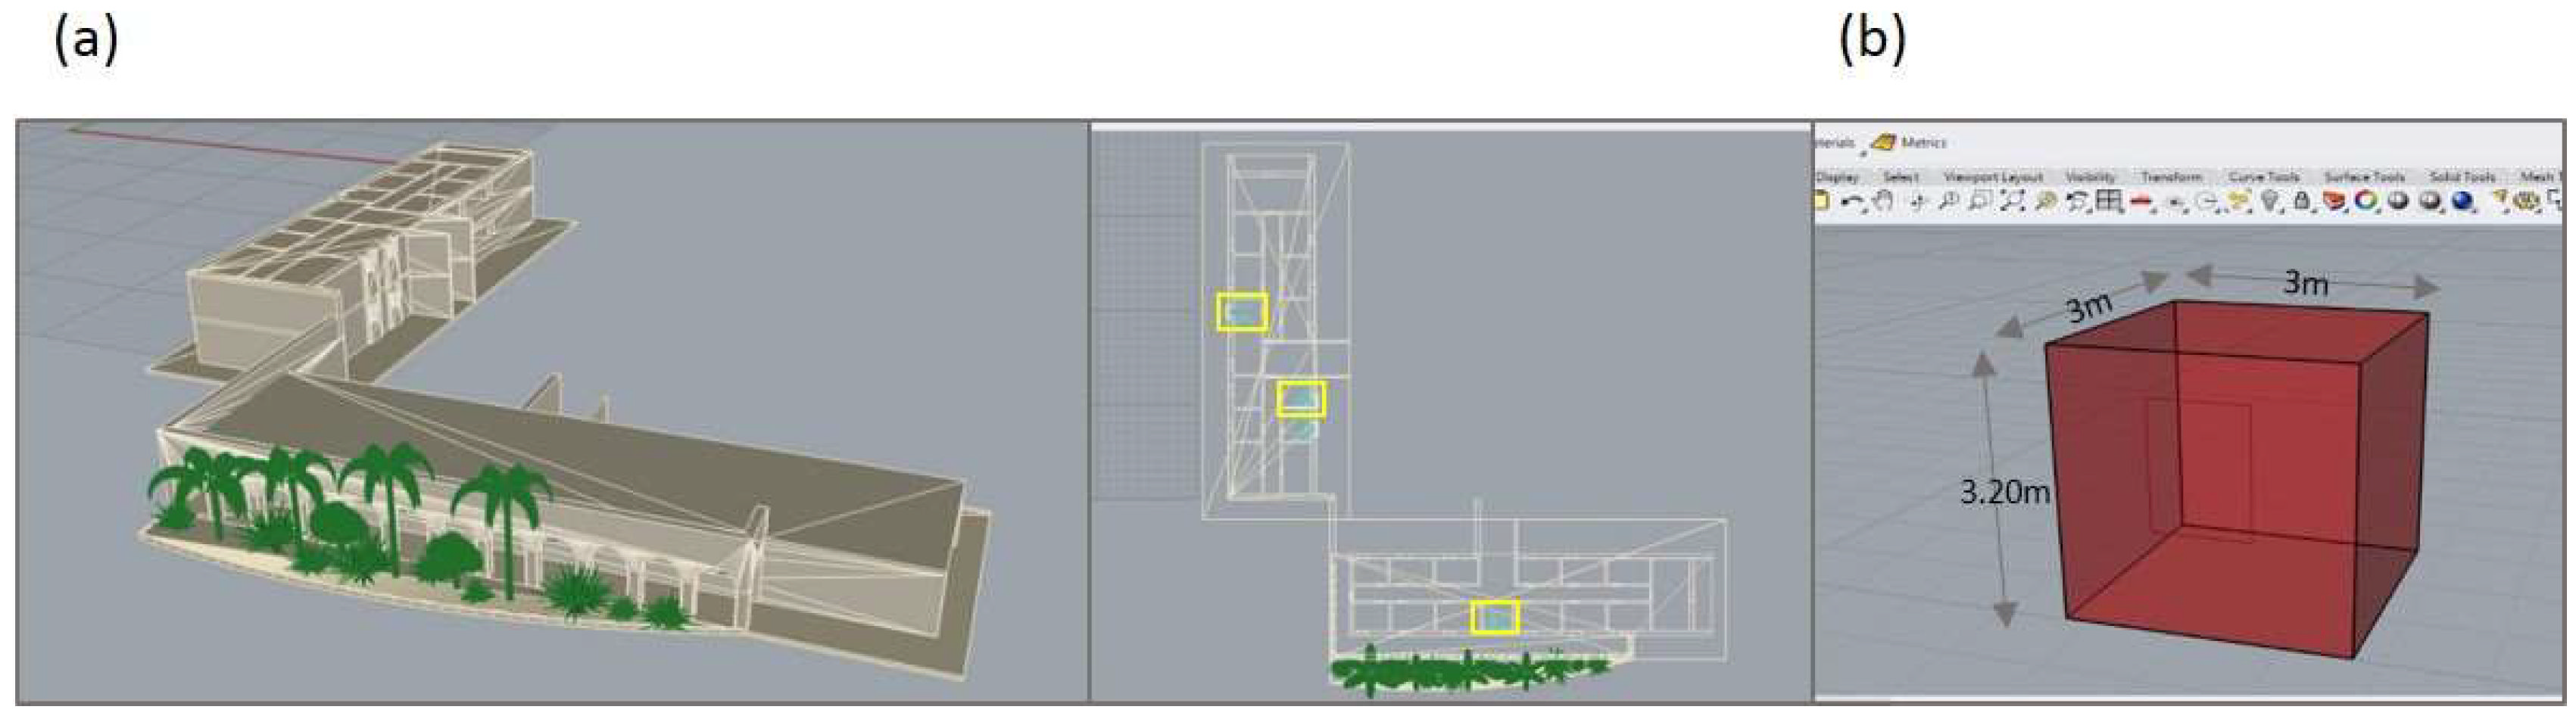
2.1. Case Study Description and the Experimental Campaign

2.1.1. Case Study Description

The case study is a patient room in the pediatric ward at Hakim Saadan Hospital located in the city of Biskra. This city is situated in the southeast of Algeria. Its coordinates are 34°51′N 5°44′ E/34.850° N 5.733° E. It is defined by hot and dry weather with significant temperature variations between day and night and between summer and winter. According to the International Köppen climate classification, geographically, Biskra is part of the BWh zone. In this location, where clear-sky and arid conditions with intense sunshine dominate over the year, there is very low humidity due to rare precipitation [26].
The weather dataset file of Biskra city was extracted from the Climate One Building website (epw) [27]. As seen in Figure 1, the average summer temperature in Biskra city reaches over 40 °C in July, making it the hottest month, with nighttime temperatures falling to approximately 20 °C [23,28]. The average temperature in winter is between 8 °C and 15 °C in January (the coldest month). There is unified daylight dispersion and extreme heat gain in hot climates, where buildings are directly exposed to solar radiation (Figure 2). This may cause visual discomfort and excessive heat gain, as is the case of Biskra city.

2.1.2. Building Case Study Description

Hakim Saadane hospital is located in the Northeast part of Biskra city, as seen in Figure 3. It is a Public Hospital Establishment (EPH), which consists of six wards. The hospital is an old building, characterized by 0.50 m thick walls and built with alveolar terracotta bricks as detailed below in Table 1 and Table 2 (which describe the building construction materials of the hospital). The selected patient rooms for the study are located in the Pediatric Ward, which has a rectangular plan with two floors: The ground floor is distributed on the East/West axis and the first floor is spread over the North/South axis. The first selected room is situated on the ground floor, which has a single opening side with one window in the south, covering 10% of the room facade area, without solar protection. The other two rooms selected for measurements are located on the first floor; however, their orientation varies from the first patient room, with East and West opening orientations.

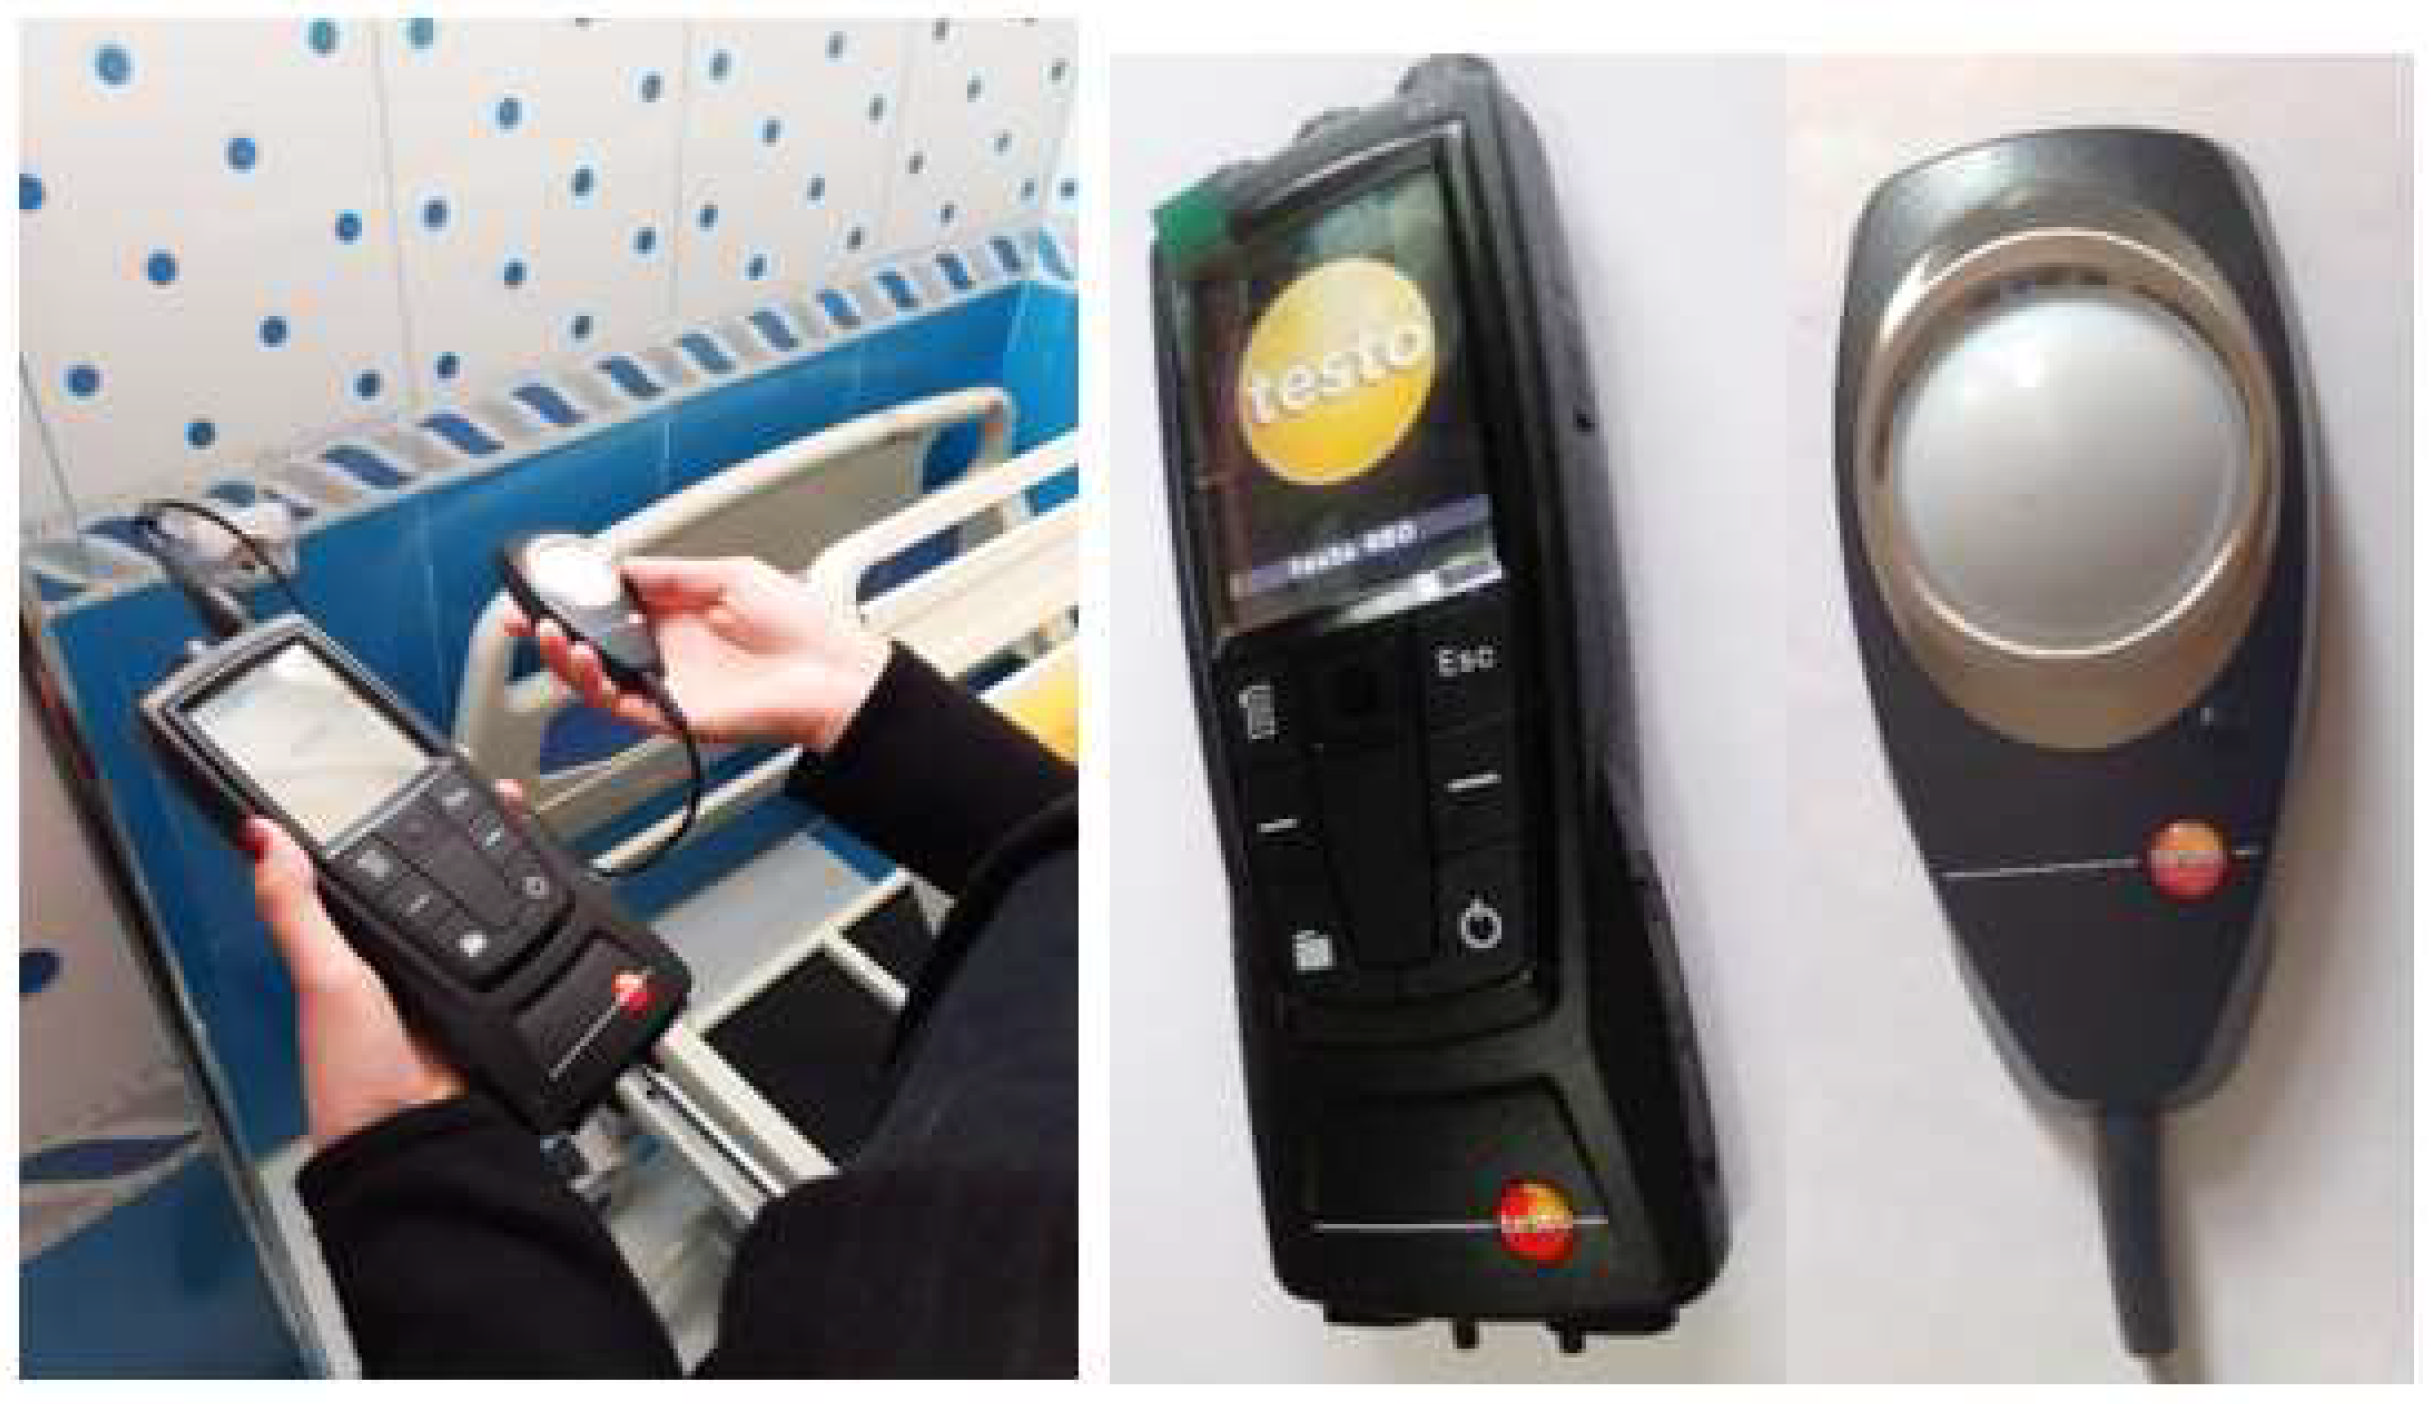
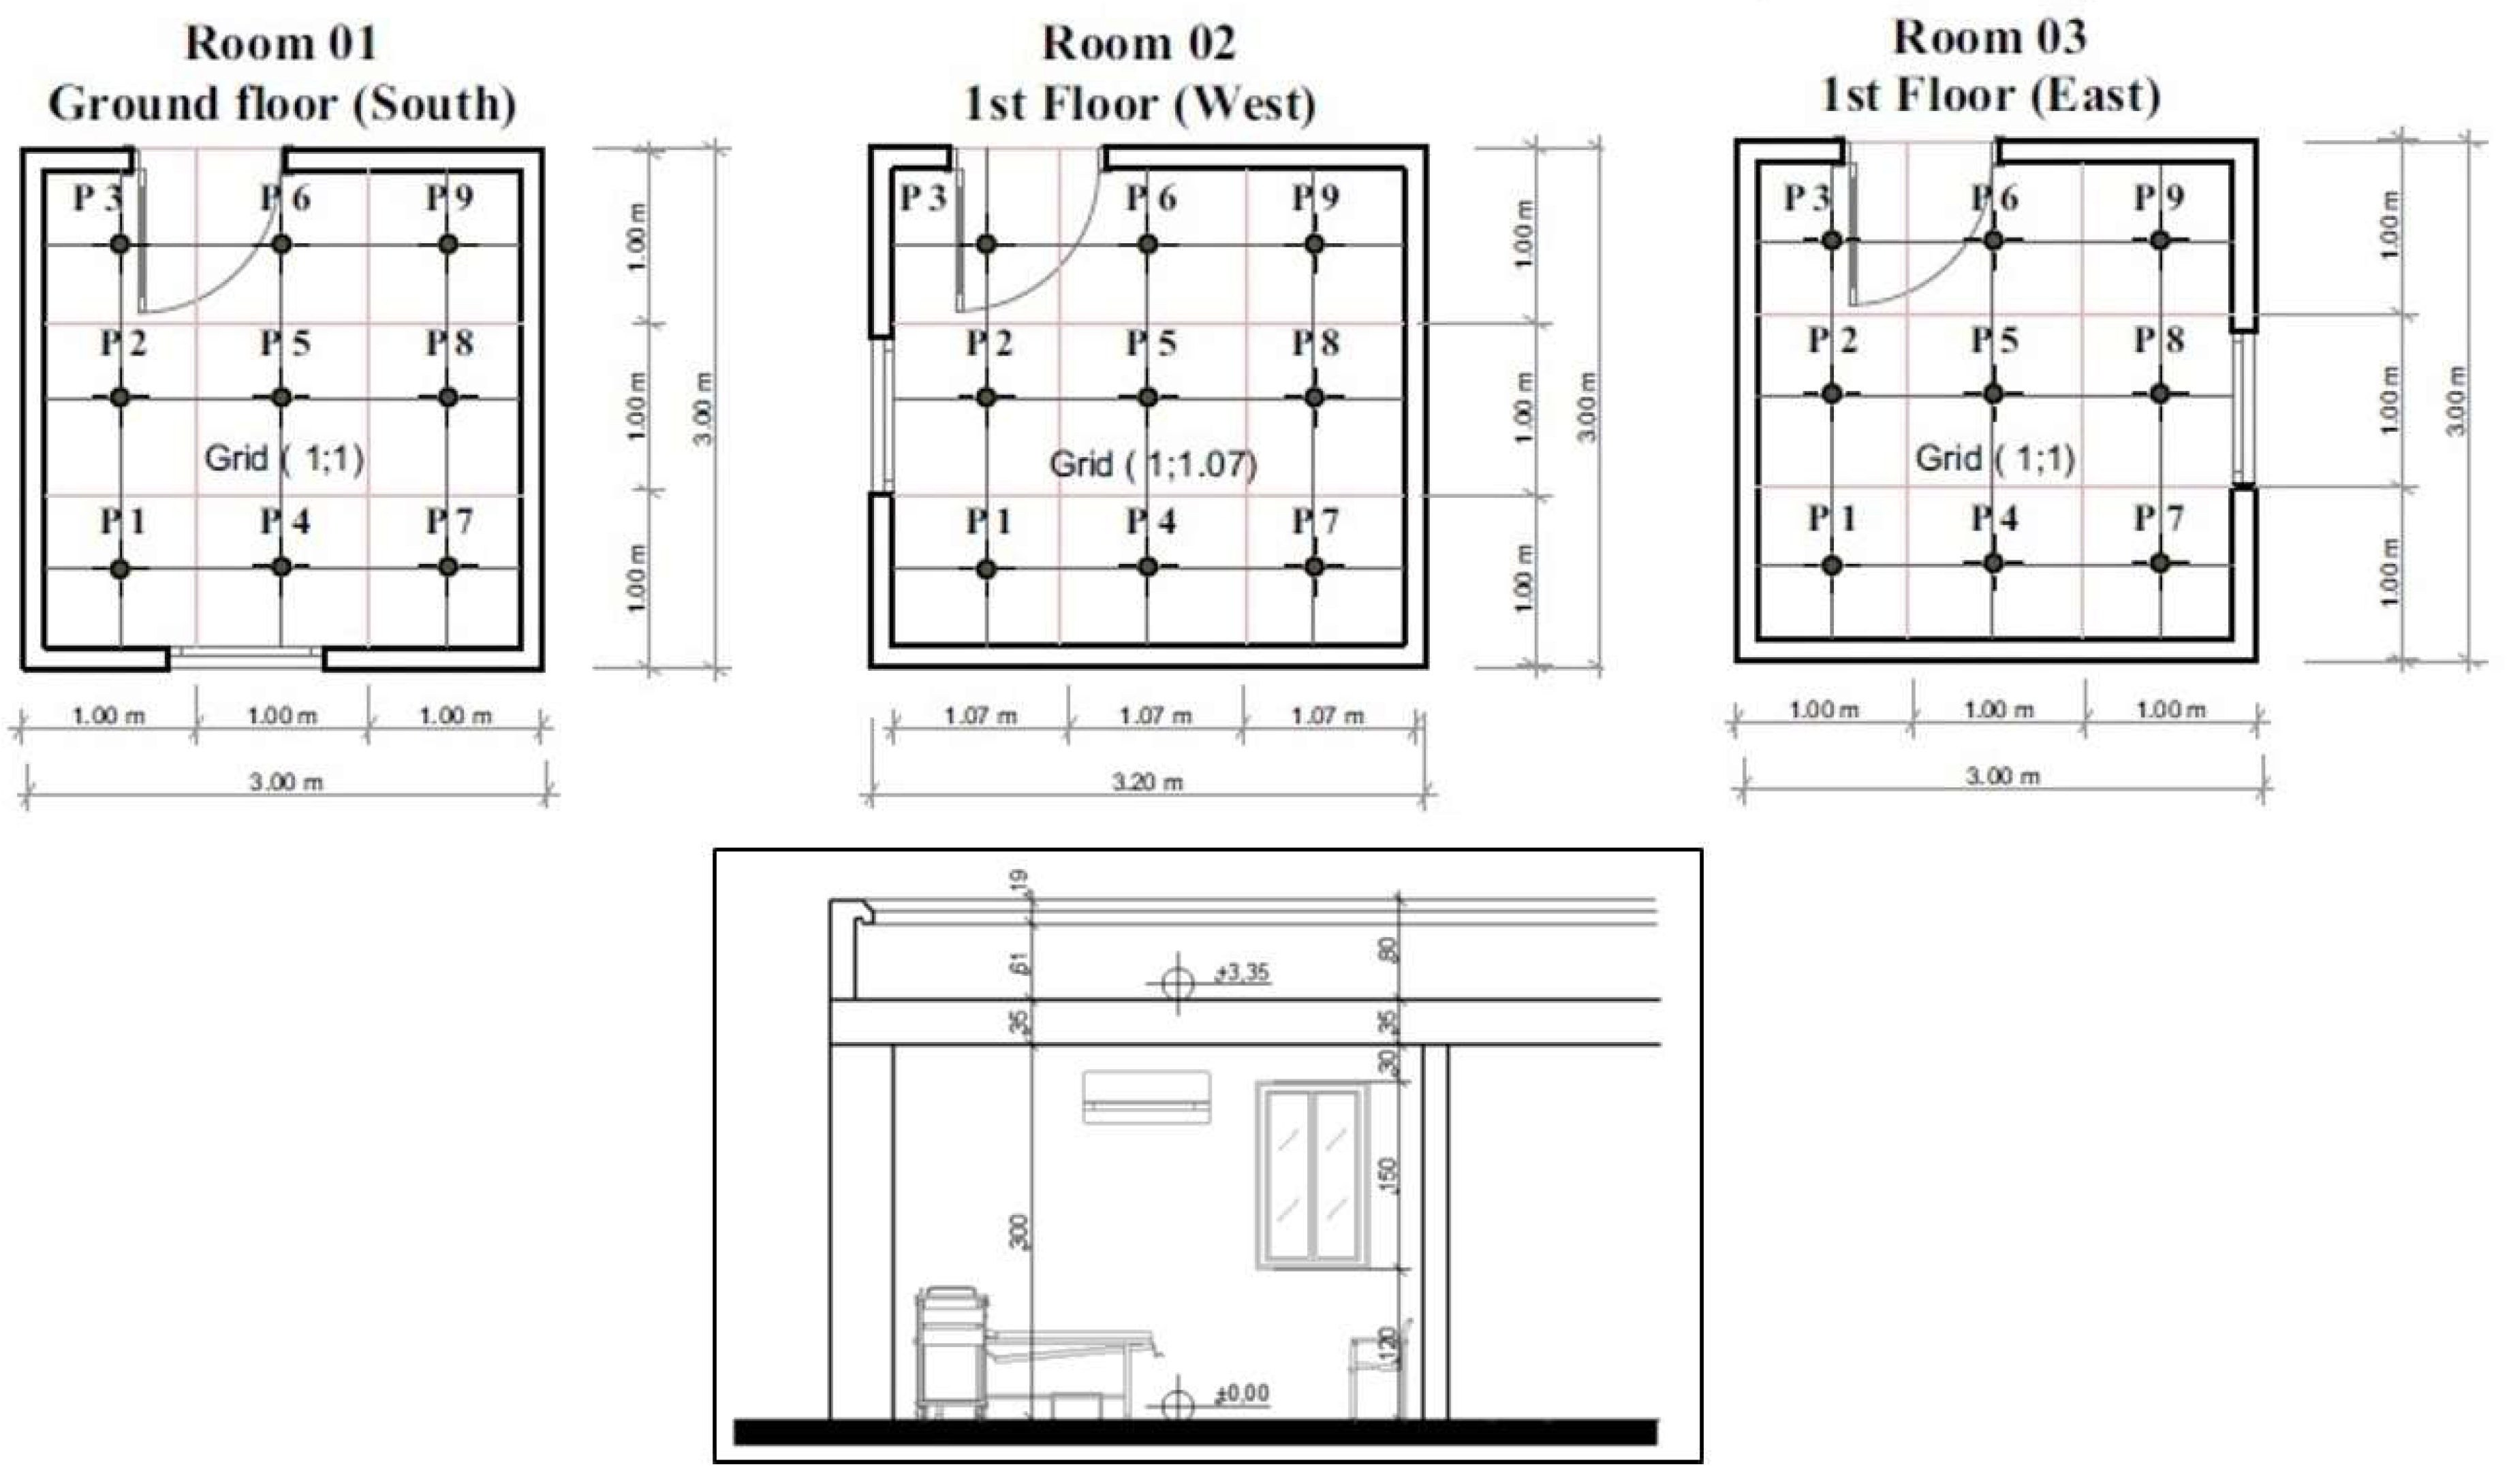
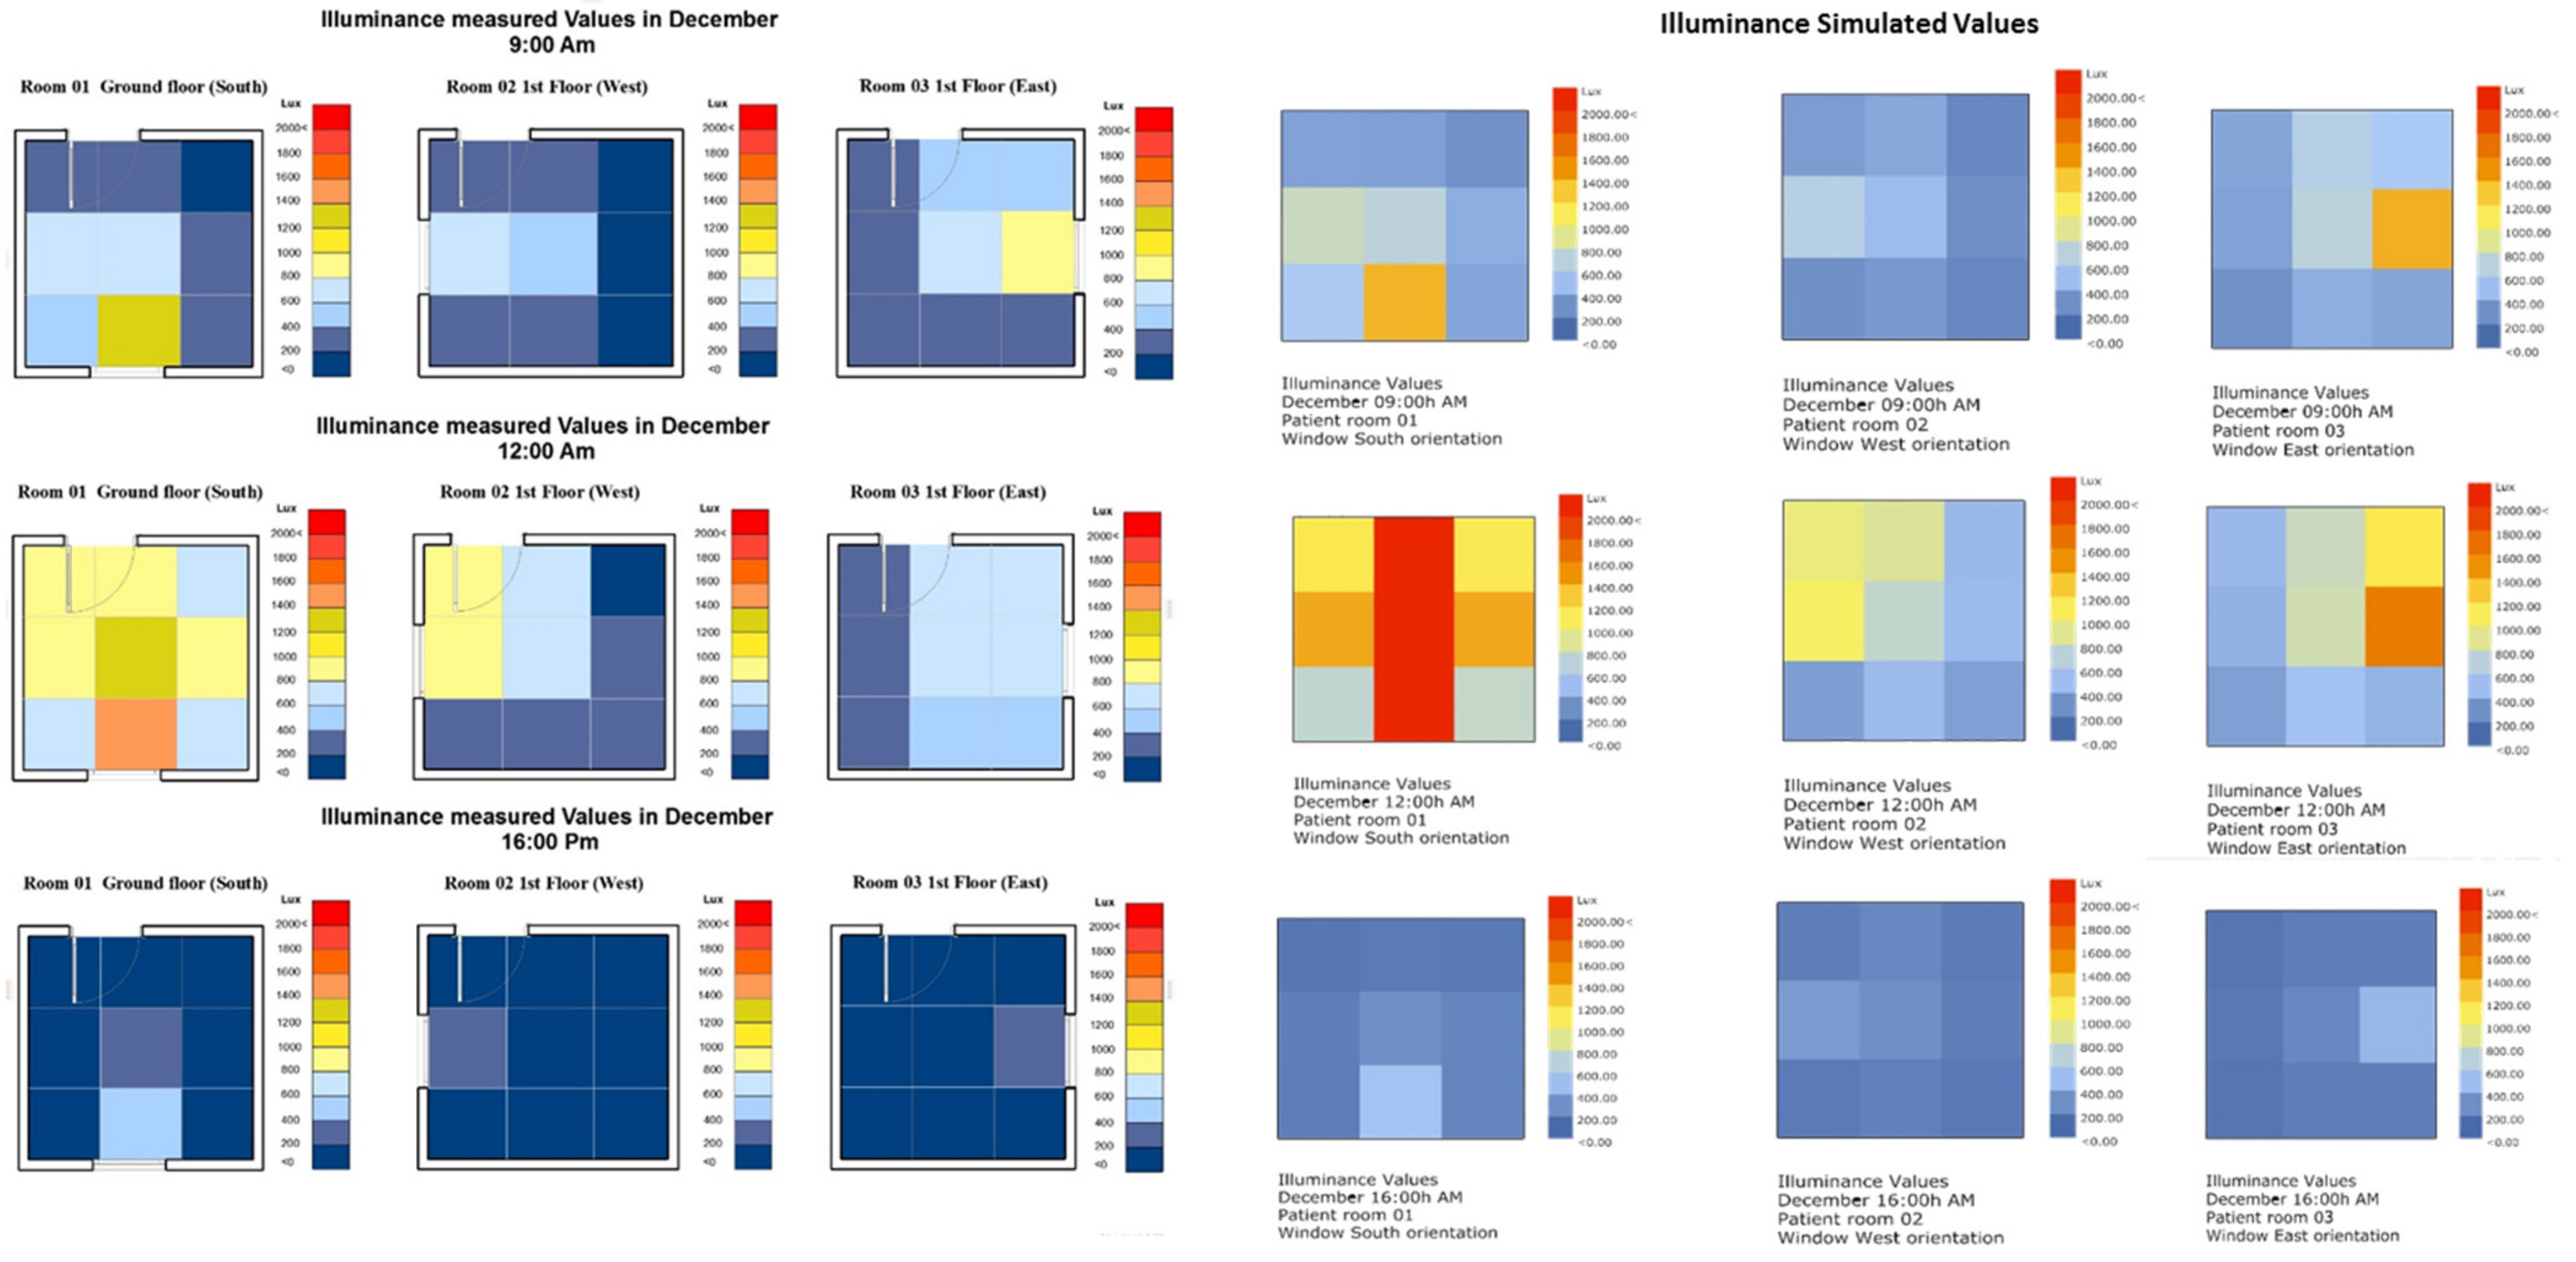
2.2. In Situ Measurement Protocol

In the measurements, samples of the hospital rooms of each orientation were taken in the Pediatric Ward. The measurements were defined depending on their configuration and location in order to collect data for validation to verify and compare the daylight simulation performance of the base case model and the simulated values. As shown in Figure 4, the internal illuminance levels in the patient rooms were measured in a grid (1.0 m by 1.0 m) of nine reference points, with each point located in the center of each square in the room at a height of 0.85 m. The illumination levels were assessed in the center of each square in the selected room. The instrument used to measure the indoor illuminance was the Testo 480 Probe Lux (accuracy: ±5% ±10 d) (Figure 5). The on-site measurements occurred on one day in December and one day in June (winter and summer period in 2020) between 08:00 and 16:00. According to the CIE standards, the sky conditions on these selected days of measurement were clear and sunny [29,30].

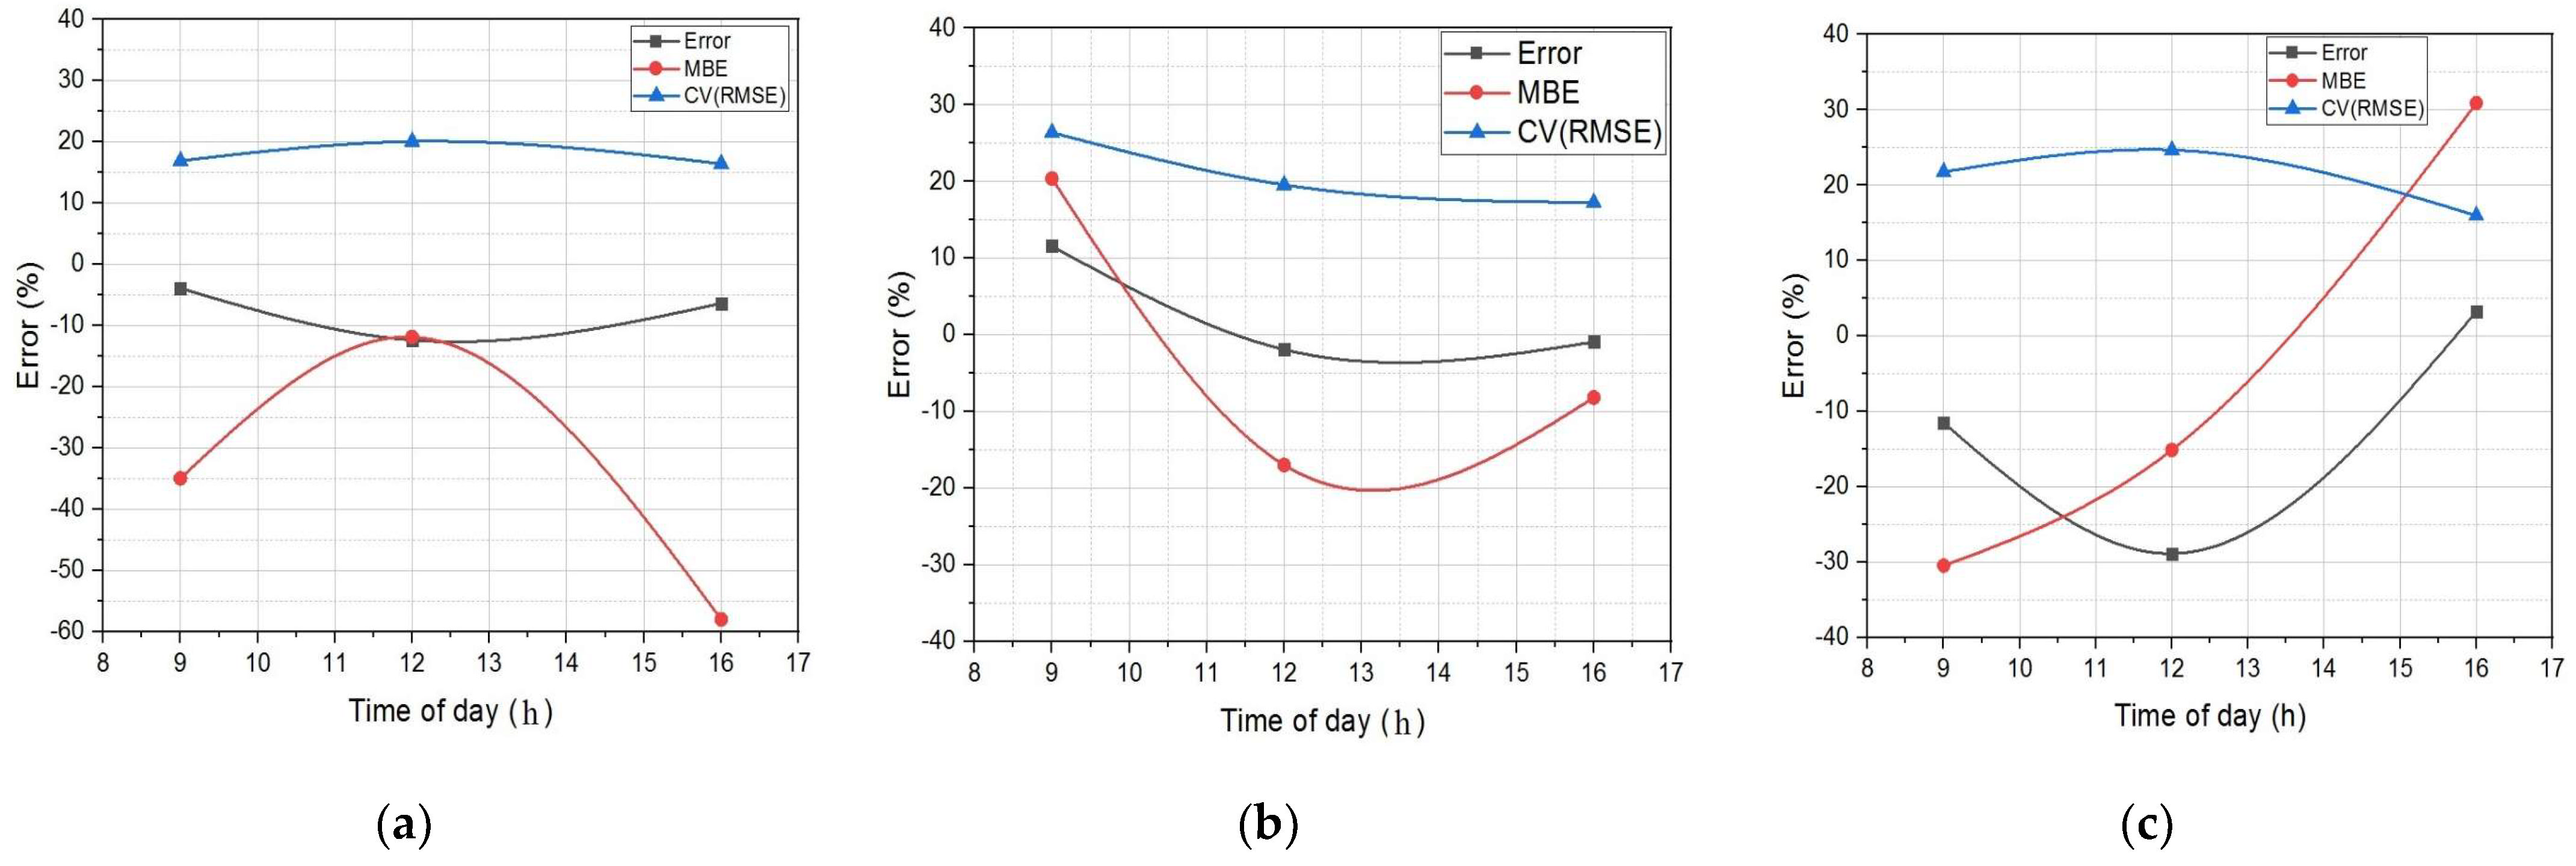
2.3. Model Validation

The parametric modeling of the geometry shape design was conducted using tools for this part, which were Rhino and Grasshopper software, via integration with some plugins, namely Ladybug and Honeybee, with a set of integrated software, such as OpenStudio, EnergyPlus, Radiance, Daysim, used for daylighting and energy simulation. As shown in Figure 6, the first case study block presents the whole mass of the Pediatric Ward geometry in the hospital. Due to the simulation time and difficulties, a single-zone room sample with dimensions of 3.0 m × 3.0 m × 3.20 m (length × depth × height) was chosen for the simulation. The 3D model was developed in Rhinoceros according to the existing material characteristics of a building. Then, the EnergyPlus materials of the existing base case were defined to adjust the basic parameters in Grasshopper. The exterior wall was composed of alveolar bricks and windows with single glazing without shading devices, and Table 3 summarizes the physic-optical properties of the materials in the patient room; these values are used as the input for the simulations.
The validation part is a fundamental step to determine the precision of the simulation results, especially when dealing with daylighting performance simulation, due to the difficulties of prediction accuracy. For daylight validation, there are a few documents in the procedure to follow, which makes it difficult to determine the accuracy of errors, and there is not a specific standard established by researchers. However, it is necessary to refer to the recommendations of recent studies recognized worldwide that followed the same approach in validation-related work [25]. The graph in Figure 7 describes the comparison of illuminance measured and simulated values across the work plane. Firstly, to compare the measurement data and the simulation results, it is necessary to calculate the relative error (RE), which is used to evaluate the error accuracy and was calculated as:
R E = M i S i M i × 100 %
As shown in Table 4, the Mi is the measured illuminance value and Si is the corresponding simulated illuminance value for each measurement point [25,29]. A percentage of error less than 5% is necessary for energy and thermal validation [31,32]; however, for daylight validation, previous studies have shown that 20–30% relative error in daylight simulation results has been considered acceptable [33]. Table 4 describes the relative error values for most of the measurement and simulated illuminance values, which were less than 20% in this study. The errors were thus considered acceptable according to the recommendations of recent studies.
For further comparison between the measured and simulated results, one more error calculation was carried out, namely, the statistical mean bias error (MBE) (1) and the coefficient of variation root mean squared error CV (RMSE) (2) as mentioned in the ASHRAE 14-2014 guideline [34,35,36]. The MBE and CV (RMSE) are two statistical indices that define the similarity or difference between two values, which were used in this study for illuminance comparisons of the measured and simulated data [33].
M B E = i = 1 n M i S i i = 1 n M i × 100 %
where Mi is the measured value and Si is the simulated value at time interval I. n is the total number of values used for the calculation and ȳ is the mean value of measured data.
According to Reinhart and Breton [35], if MBE is less than 15% and RMSE is less than 35%, the results obtained are considered accurate. However, A. McNeil and E.S. Lee [36] reported absolute values of MBE below 13% and RMSE below 23%. Reinhart and Anderson [33] found that MBE ranged between 8 and 17%, while RSME ranged from 24 to 40%. In another study, Reinhart and Walkenhorst [37] found the MBE and the CV (RMSE) were 20% and 32%, respectively. As shown in Figure 8, the obtained values for MBE and CV (RMSE) in this study were −34.90% and 17.84%, respectively, in the first patient room, −15.18% and 21.08% in the second patient room, and −25.48% and 20.81% in the third patient room. Therefore, in all cases, absolute MBE and RMSE were in the range of previous studies’ values. These results show that the simulation method can accurately generate a realistic model and is thus valid. Finally, without further calibration, the validation step for the December period produced acceptable results for this model. This allows the use of optimized indoor daylight performance strategies in terms of illuminance, which reaches the recommended values.

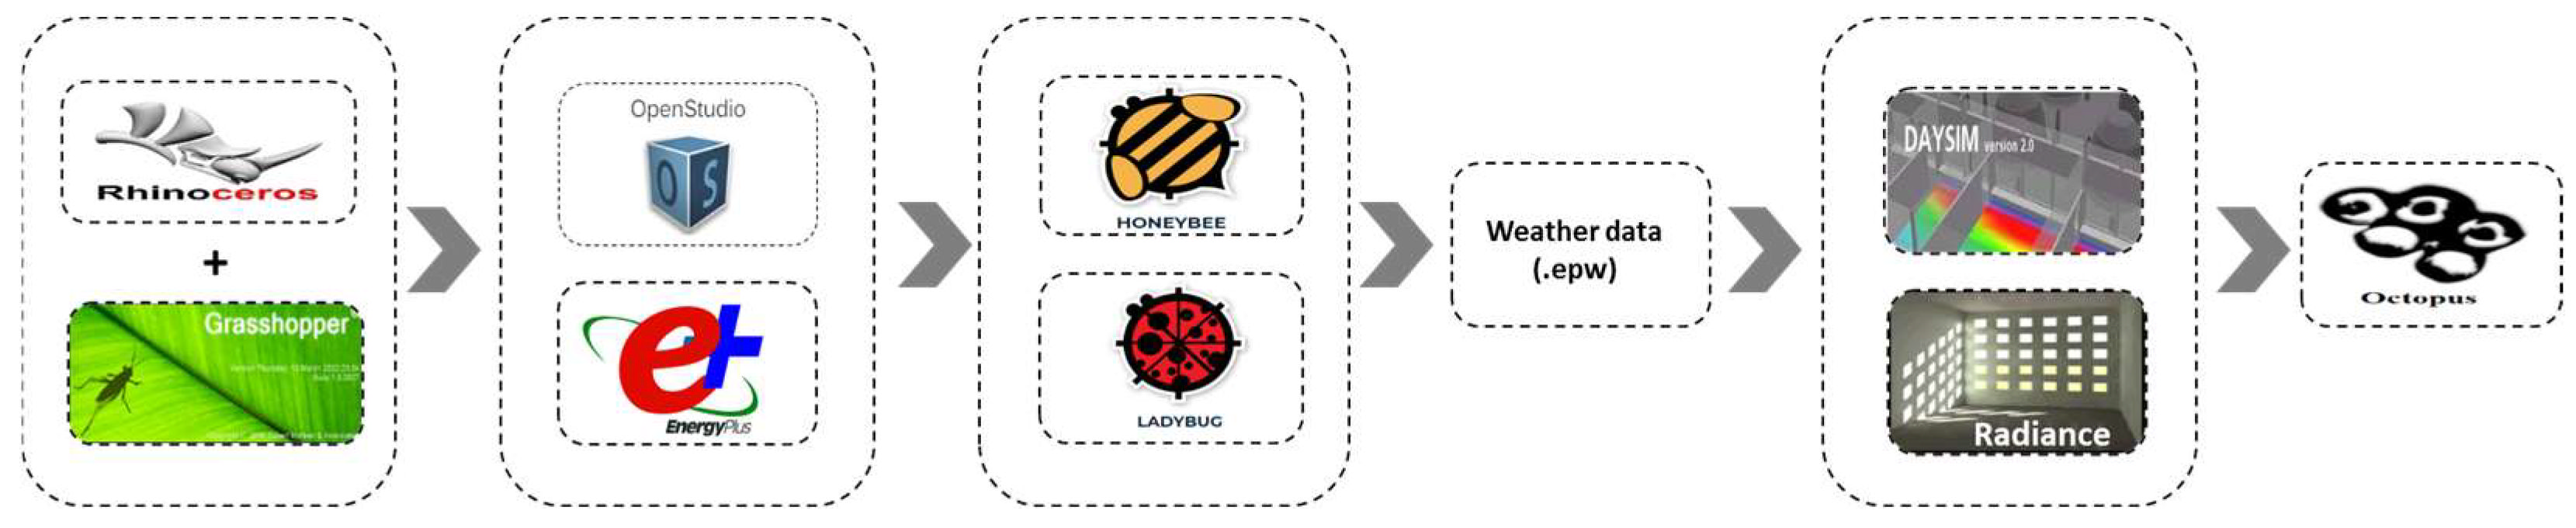
2.4. Multi-Objective Optimization

2.4.1. Design Process Based on Optimization Algorithm

The optimization objectives in this study were to minimize the Energy Use Intensity (EUI) and achieve maximum spatial daylight autonomy (sDA) and Useful Daylight luminance (UDI). Figure 9 describes the algorithmic design process of software and plug-ins coupled in the workflow; it was developed in Rhino/Grasshopper with the integration of plugins to fulfill the objectives of this study. Rhino was used as modeling tool and Grasshopper as a parametric design tool for daylight analysis and energy performance applications. Furthermore, Honeybee and Ladybug were utilized as the main environmental plug-ins to obtain energy and daylight simulation feedback. Moreover, optimization was carried out using a multi-objective tool to find the best design schemes, namely the Octopus plugin. In Figure 10, the workflow described above illustrates the overall process of the simulation framework. The Energy and Daylight Simulation module was performed and is detailed below with the inputs coupled in this design. The EUI, sDA, and UDI objectives of the samples were obtained in the module with the Octopus plugin using the Pareto optimality theory with an evolutionary algorithm, which was used to acquire the optimal schemes and parameters and output from the workflow design module.

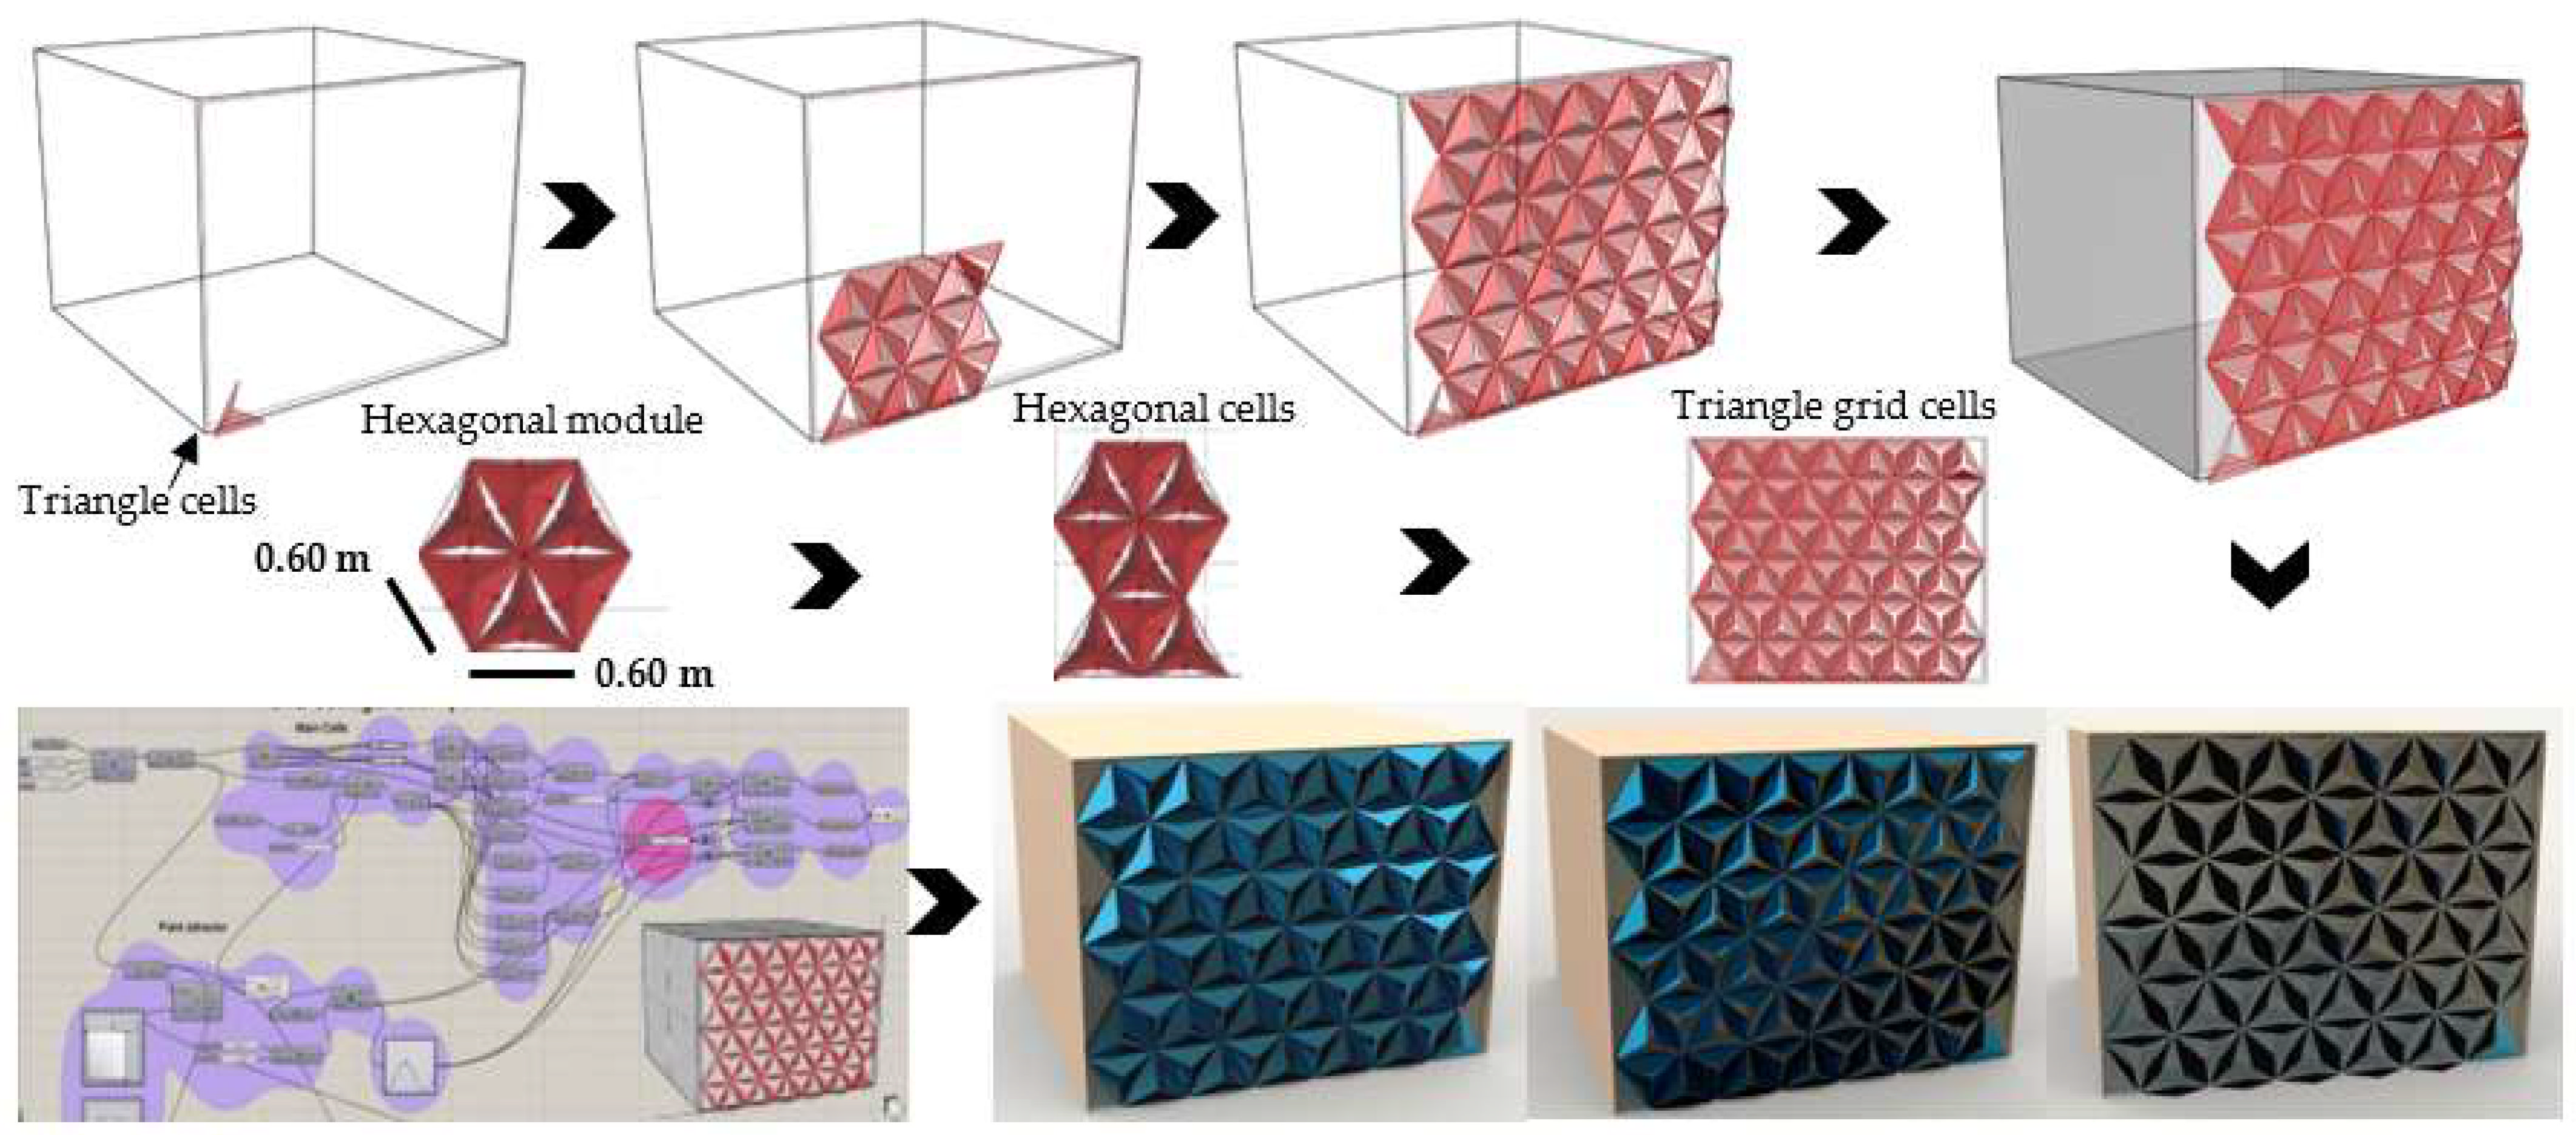
2.4.2. The Parametric Optimized Configuration

Focusing on the characteristics of the existing patient room in the Pediatric Ward, a Kinetic configuration (a generative performing facade design) was modeled with Rhinoceros 3D modeling software. To solve the visual discomfort problems, this was implemented in the South orientation where light values higher than the values recommended by the three room cases of field measurements exist. This means that the patients in the south-facing rooms are more exposed to excessive light and glare. Thus, consideration must be given to the impact of facade design features, including sun-shading devices, which should be required in patients’ rooms to prevent glare and provide patients with adequate visual comfort. Figure 11 describes the development of the facade geometry to reproduce various kinetic configuration states between the unresponsive and adaptive states on three reacting steps. It shows the responsive modules rotating from angles of 0° to 90°. The modules have an adaptive behavior, which allows all of the hexagonal cells on each symmetrical axis to rotate regarding the sun’s position with a parametric algorithm. The aim of this configuration is to acquire a strategy for a responsive shading device for patient rooms, which was applied to a completely glazed southern facing room (WWR: 90%) and can be applied in different building orientations. The kinetic facade design solution can ensure sufficient indoor daylight without glare and discomfort. This “smart” facade automates the modules to rotate with the sun’s position and create shade.

2.4.3. Parameters Adjusted during the Optimization Process

After the configuration load and schedule variables were assigned, the optional combination of parameters was adjusted during the optimization process. As seen in Table 5, the parameters used in the optimization process were chosen for their potential to develop a building performance simulation. Consequently, as there were manual adjustments of these parameters detailed below, a multi-objective optimization process was performed using the Octopus plug-in integrating these variables, which were divided into two categories:
  • The fixed adjusting parameters: The glazing ratio, glass-type material, wall construction materials, and external kinetic module material.
  • The adaptive adjusting parameters: The module’s rotating angle and width, the module’s distance to glass, and the sun’s position angle axis depending on day, month, and hour inputs.

3. Results and Discussion

3.1. Base Case Building Simulation

Regarding the analysis of DF, the results show that most of the Daylight Factor values in the patient room with the south-facing orientation are above 1% (the minimum recommended level in a patient room) [6,38]. These values occur particularly in the points located in front of the window (see Figure 12) due to the visual discomfort caused by the absence of shading devices, therefore the excessive daylight and solar irradiation can be controlled to lower than 1% with a shading devices system [39,40].
After the determination of the optimization objectives (sDA, UDI, EUI), and once the simulation model had been validated, a base case analysis was carried out. The results illustrate that the average value of sDA, which defines how much daylight of 300 lux is received by the indoor environment during more than half of its occupied hours (300 lux/50%), is 44.3% [41,42]. This value was likely attained because there are no shading devices located in the southern elevation. According to Ahmed Sherif et al. [19], the sDA percentage should occur in approximately 75% of the total room area. Therefore, the component used in sDA calculations is the window resource, which lets the majority of direct and reflected sunlight pass into the room. With regard to UDI, which aims to determine the percentage of the annual number of hours when illuminance is at a precise point, it is reached by daylight within an acceptable range, as well as the total number of occupied hours [43,44]. For patient rooms, the recommended UDI metric is between 100 and 300 lux; according to the recommendations, the maximum lighting level is 300 lux; for this case, the average UDI is 35.2% [45]. There is unequal distribution, and 70% of the surface of the plane surface in the room acquires less than 30% UDI, whereas the areas closest to the windows acquire UDI at levels of over 100%. Finally, regarding the EUI metric, the results show that 158.1 Kwh/m2/year is the annual average of Energy Use Intensity consumption for heating and cooling of the base case model. Compared to the other metrics, the energy simulation achieved reasonable results due to the medium WWR ratio in the southern elevation and the fact that a lower EUI indicates better energy efficiency. Thus, the next step of the optimized model will be to minimize the EUI values.

3.2. Optimized Model Simulation

3.2.1. The Objective Function

A multi-objective optimization framework was conducted to analytically assess different building design parameters, using Spatial Daylight Autonomy (sDA), Useful Daylight Illuminance (UDI) and Energy Intensity Use (EUI) as the main objectives of daylight and energy performance. The objective function is used to represent any optimization problem, which was calculated from the Pareto Front diagram performed using Octopus. According to Konis et al. [38], the following fitness function, shown in Equation (3), was used to precisely reach the optimum solutions in the Pareto front scheme, while in this case, the SDA, UDI, and EUI are the objectives of this research. The two first objectives should be maximized and the second one should be minimized.
y = s D A i s D A min C 1 1 E U I i E U Imin C 2 + U D I i U D Imin C 3
where I is the result of iteration, min is the minimum value of the optimization set, and max is the maximum value of the optimization set.
C1 = 100 ÷ (sDAmax − sDAmin); C2 = 100 ÷ (EUImax − EUImin); C3 = 100 ÷ (UDImax − UDImin)
In this study, the values of the objective function were calculated for some solutions in the Pareto front diagram, as shown in Table 6 (Section 3.2.2), which represent the optimum solutions for the performance of daylighting and energy performance. The results of C1, C2, and C3 are C1 = 2.60, C2 = 30.10, and C3 = 7.27, respectively.

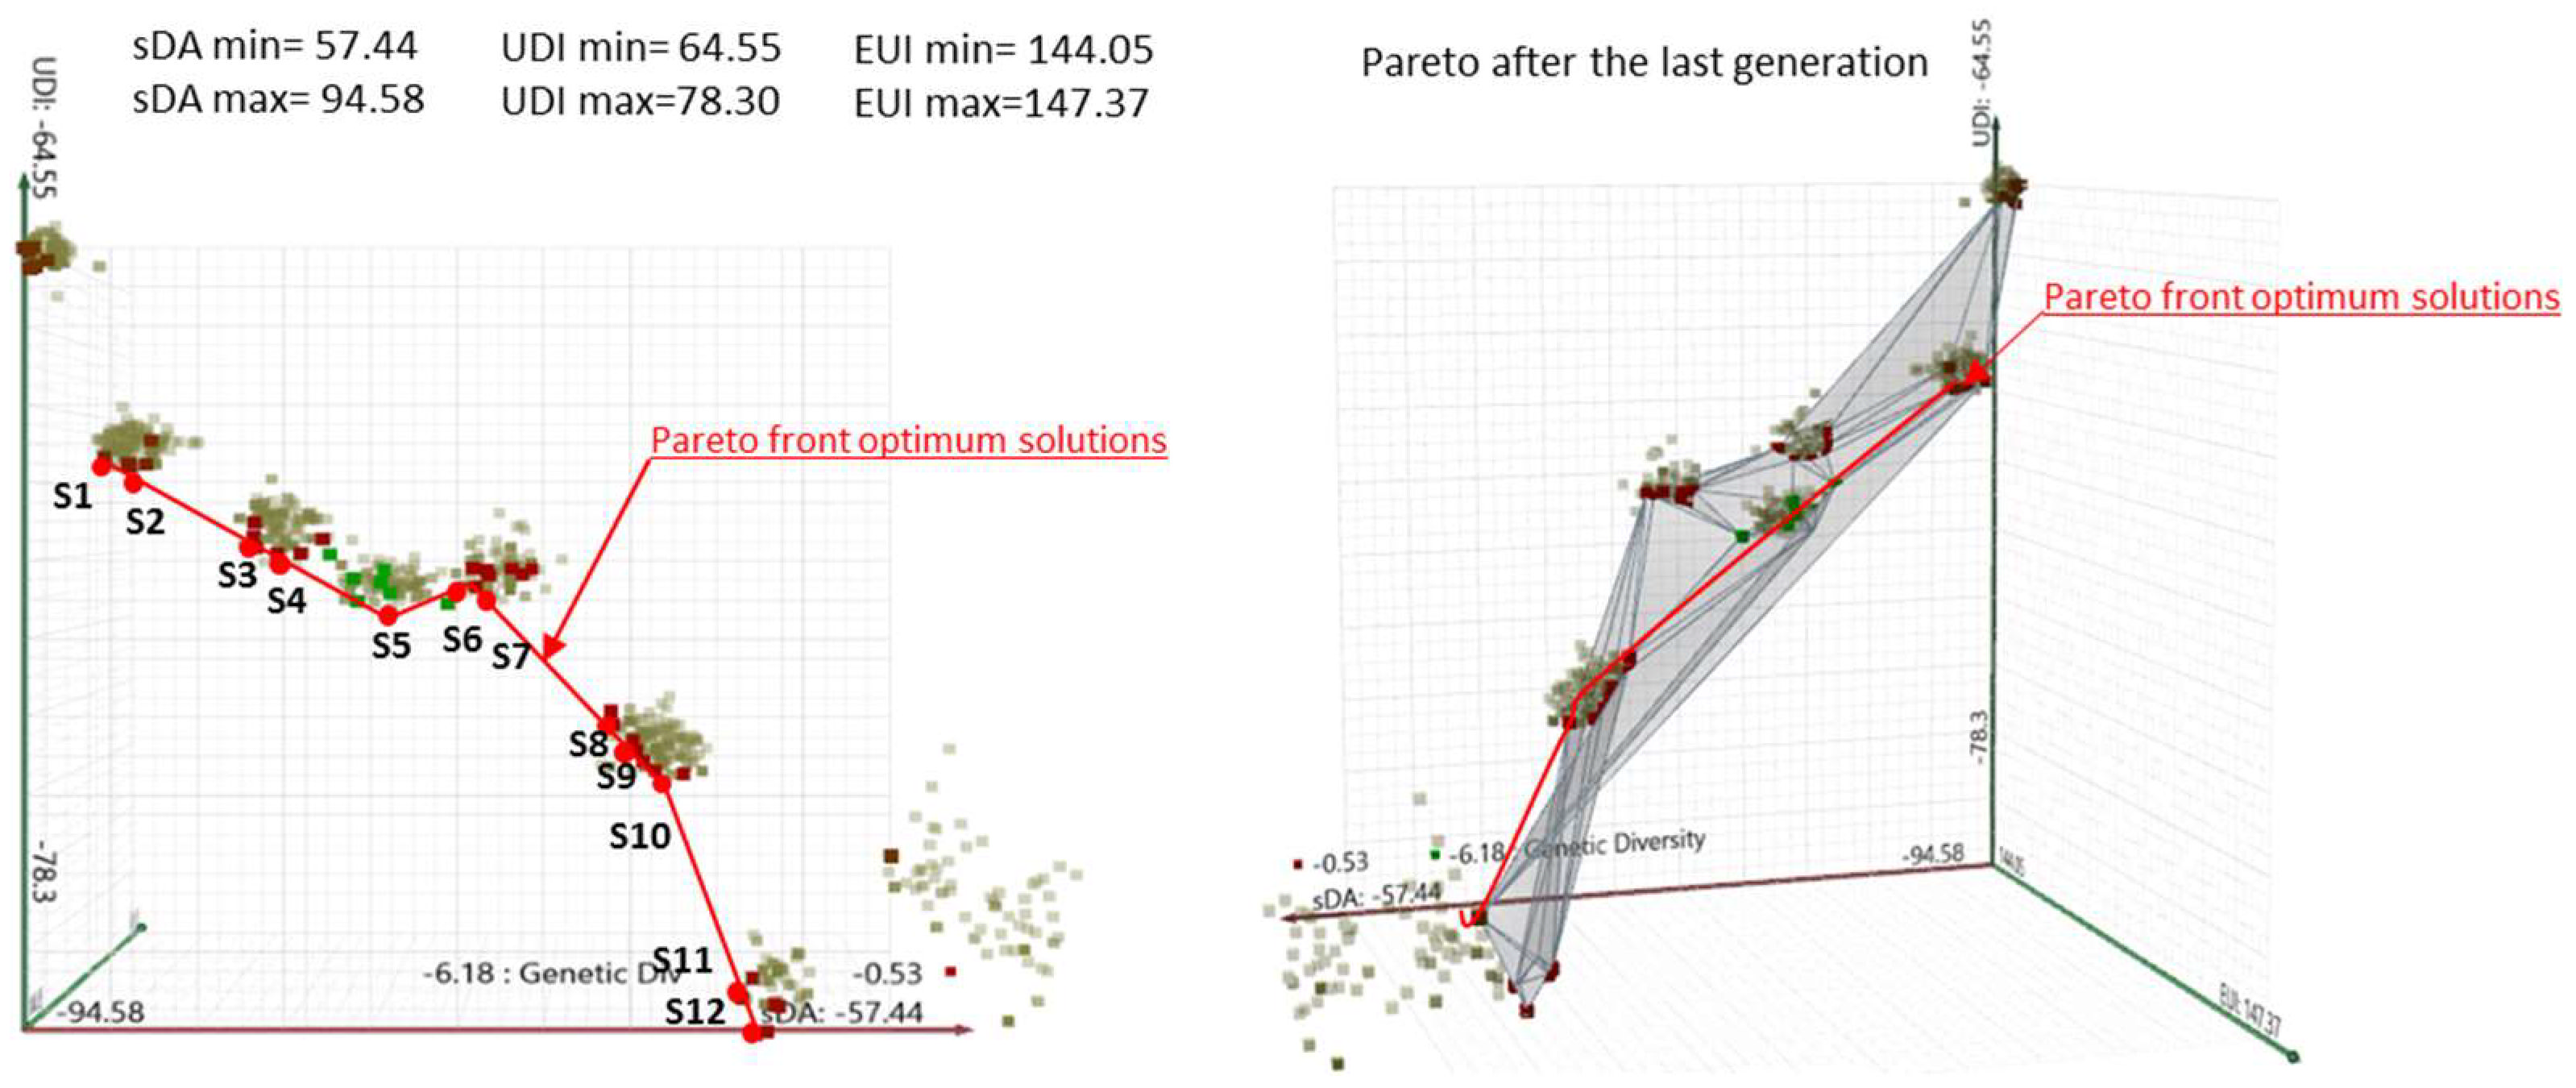
3.2.2. Pareto Front Scheme and Optimal Solutions

Pareto optimization is defined according to Yuan Fang [8] and is a solution to determine the trade-off front among each objective, also known as the Pareto front diagram [39]. In the Pareto optimization approach, to seek the best-qualified Pareto for analysis, there are many generations of genomes (Solutions) that should be generated. In this study, as shown in Figure 13, there are 15 generations produced; every generation contained 50 fitter genomes than the previous ones. As seen in Figure 13, it can be noted that there is an improvement in each generation compared to the previous one. The improvement occurs for the values of sDA, UDI, and EUI, therefore, the objective function will also be increased. The objective fitness function values (Y value) for the optimum solutions for the 15 generations in descending order are 99.6, 99.5, 97.6, 94.5, 94.2, 92.6, 90.8, 87.8, 69.4, 62.8, 51.5, and 50.6, respectively. Regarding the maximum value of sDA and UDI, in the first generation, it was 73.38 and 70.11, respectively, and it increased significantly to 94.58 and 78.30 in the last generation. However, for the minimum value of EUI, in the first generation, it was 158.2 Kwh/m2/year, while it reached up to 144.05 Kwh/m2/year in the last generation as the optimum value of energy consumption.
After the optimization search of 15 generations, the Pareto front chart (see Figure 14) showed a tendency of convergence among the 50 non-dominated solutions in the last generation of Pareto. The figure shows 3D scatter, with sDA on the x-axis, UDI on the y-axis, and EUI on the z-axis. Transparency squares in the Pareto diagram represent older generations, and when the squares become darker, the number of iterations increases. The solutions shown in red squares are non-dominated and indicate the optimal solutions, while squares in green are dominated solutions [15,17]. The best solutions can be found in squares nearest to the center. The genetic algorithm optimization process shows significant benefits in multi-objective problem solving. Thus, the non-dominated solutions with higher sDA and UDI values indicate a tendency to increase and a tendency to decrease EUI results. This illustrates that the objective of this Pareto chart is to seek well-balanced design options that maximize daylight performance and minimize energy cost. As shown in Table 6, a number of solutions have been selected from the closest non-dominated solutions that represent various optimized cases. All of these solutions of the Pareto optimal front and their objective fitness function are calculated and listed below with all parameters and simulation results.

3.3. The Comparative Analysis Findings

To further understand the comparison between the objective value distribution of the base case model and that of the non-dominated solutions (Table 6), a box plot is displayed in Figure 15. The sDA and UDI values (unit: %) of the base case model remained stable at the corresponding values of 44.3 and 35.2, respectively. However, for the sDA and UDI results of non-dominated solutions, they were distributed across the range of 68.0 to 94.3%, with a median value of 84.7% for sDA values, and 64.9 to 73.2% with a median of 69.9% for UDI values. The EUI values (unit: Kwh/m2/year) of the base case model remained static at 158.1. The EUI values of non-dominated solutions were evenly distributed across a range of 144.0 to 145.4 Kwh/m2/year, with a median of 144.7 Kwh/m2/year. The results revealed that the achievement of non-dominated solutions was better compared to the original design, which confirms that the proposed approach was highly effective and reliable. Through the evaluation of a typical patient room that was modeled based on the original model characteristics, the results showed low levels of daylight throughout the day, making the room highly reliant on artificial lighting and preventing hospitalized patients from benefiting from daylight. However, the results from the optimization model showed an improvement in the performance of the dynamic facade compared to the existing case study with an increase in sDA and UDI and lower energy consumption. These findings illustrate how this dynamic shading system, when combined with other parameters such as efficient glazing and wall construction materials, can enhance the daylight availability of indoor environments in such a hot and dry region.

3.4. The Absolute Optimum Solution

The relative optimal solution (the best fit) was selected from the non-dominated solution set, which achieved high performance and tradeoffs among the three objectives and achieved the highest fitness function score [15]. As shown in Table 6, the highest fitness function reached was 99.6 (solution 7). During the last generation, it produced great improvements for sDA, UDI, and EUI. sDA and UDI achieved values of 83.7 and 69.9%, respectively, which is lower than the optimum daylighting solution values. Meanwhile, the energy use intensity has a lower value with 144.0 Kwh/m2/year in the optimum values of EUI. As seen in Figure 16, daylighting is analyzed in three different parametric modules from unresponsive and responsive positions, which depend on the solar angle and orientation parameters. The results indicate that the attached kinetic configuration can reduce direct sunlight more than a non-shaded facade during occupied hours, while maintaining the required level of indoor daylight above 50% across the work plane. This means that the daylighting performance for patients is very suitable, especially because this mechanism can be controlled automatically depending on the sun’s angle and orientations. This means the parametric configuration can be used to generate patient room designs that are effective and provide sufficient and comfortable daylighting.

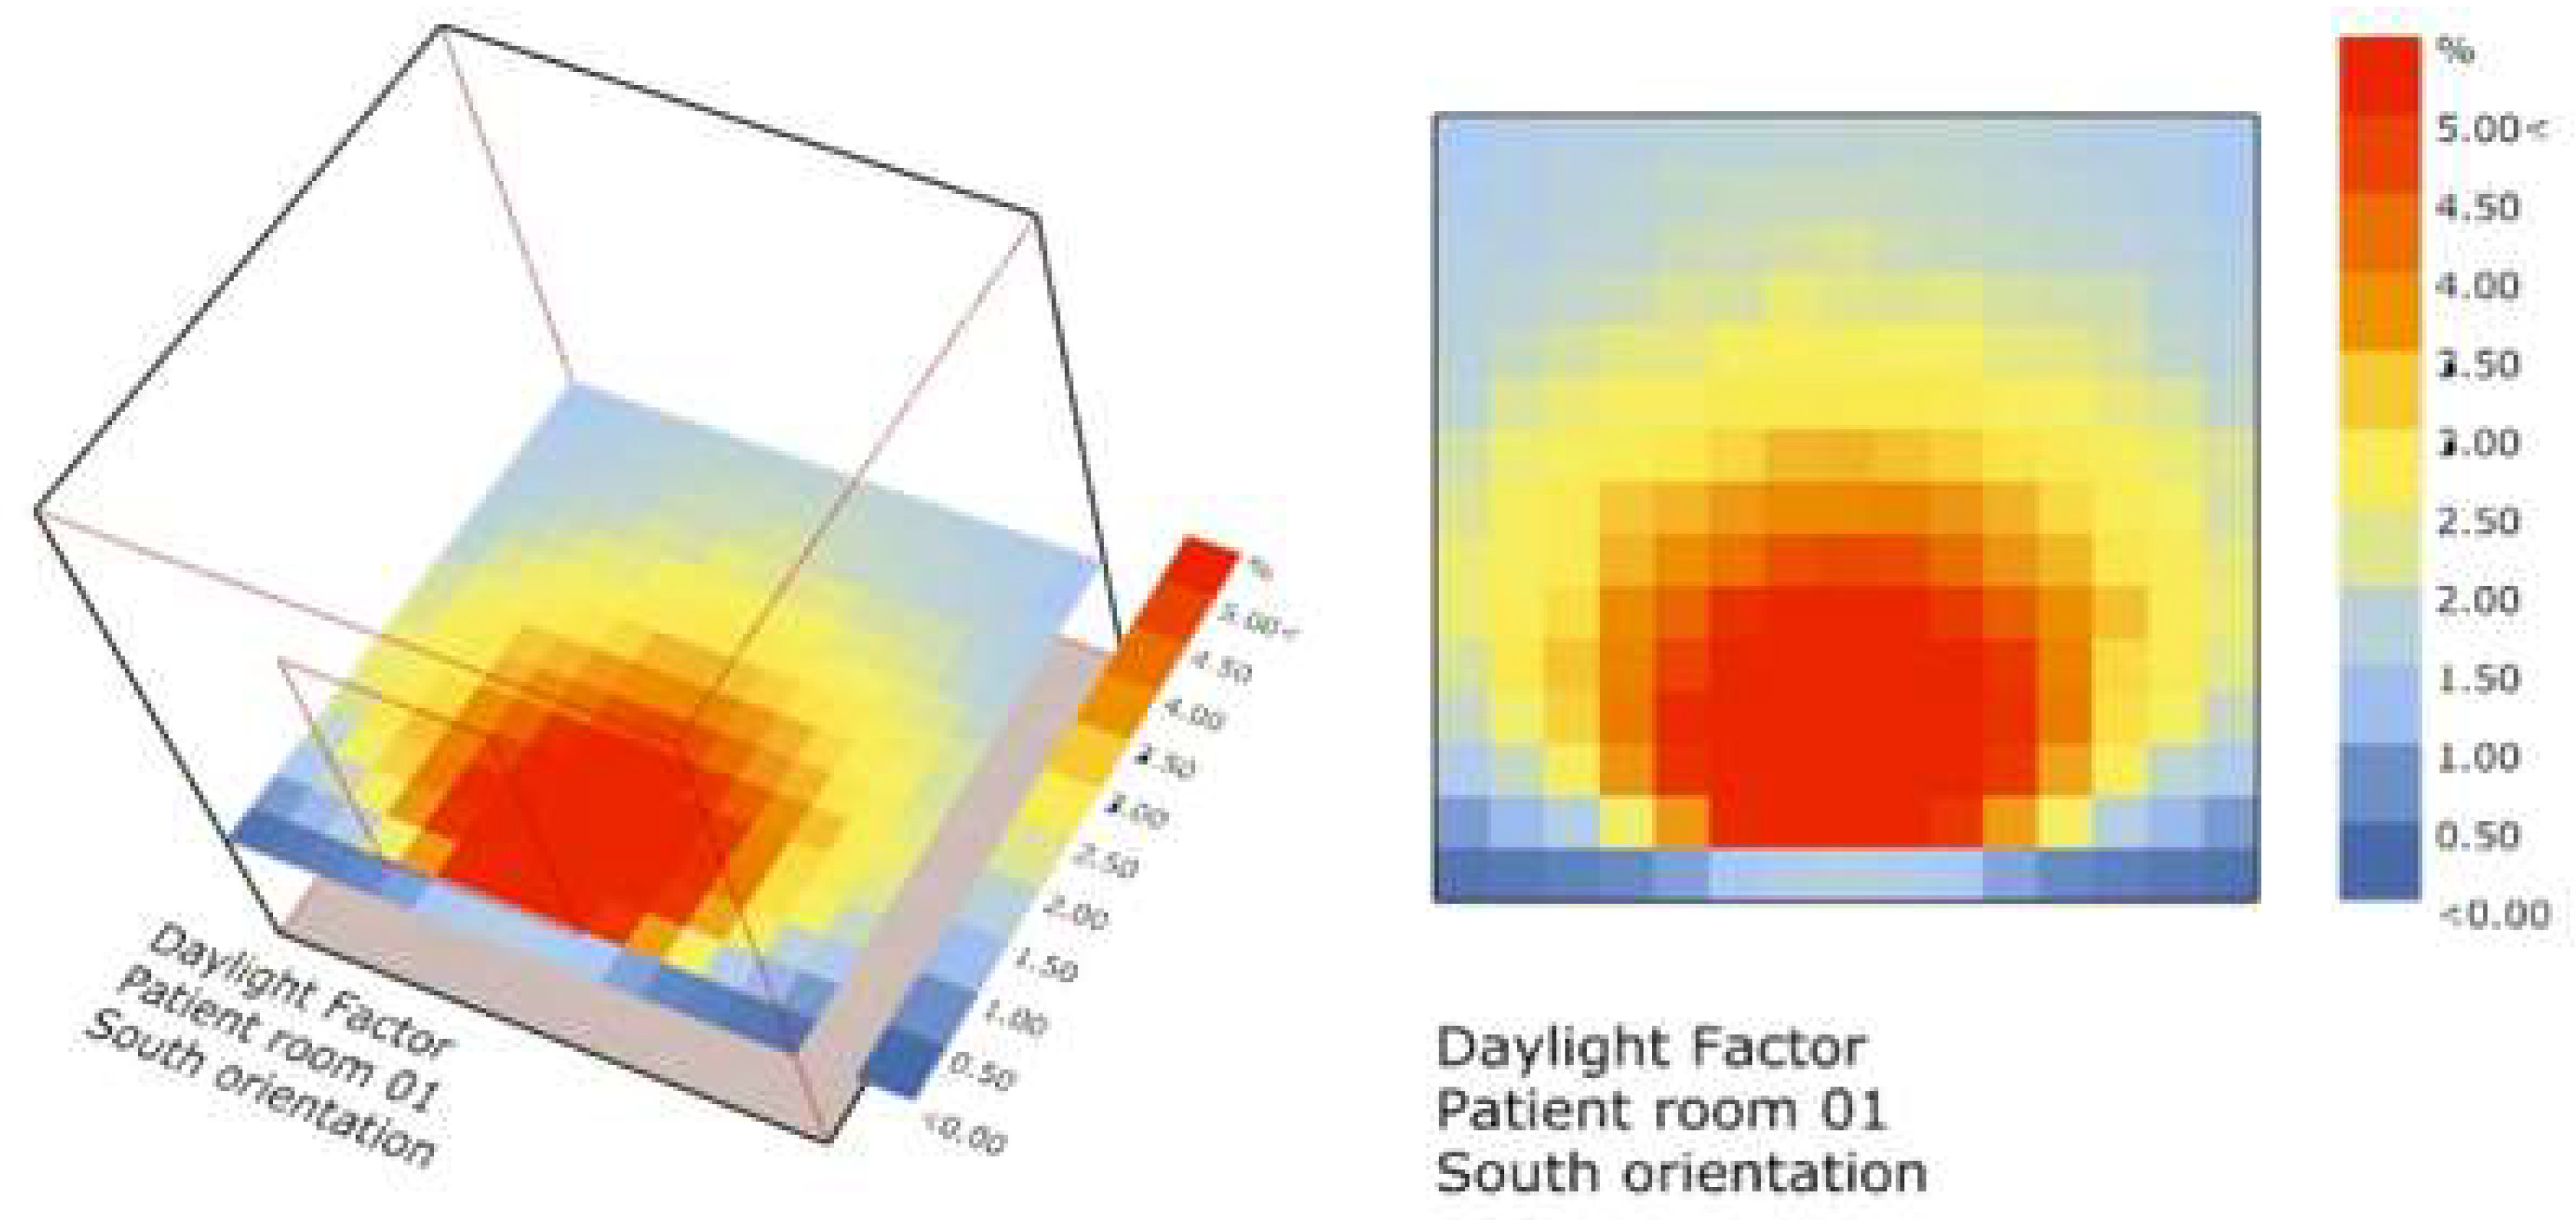
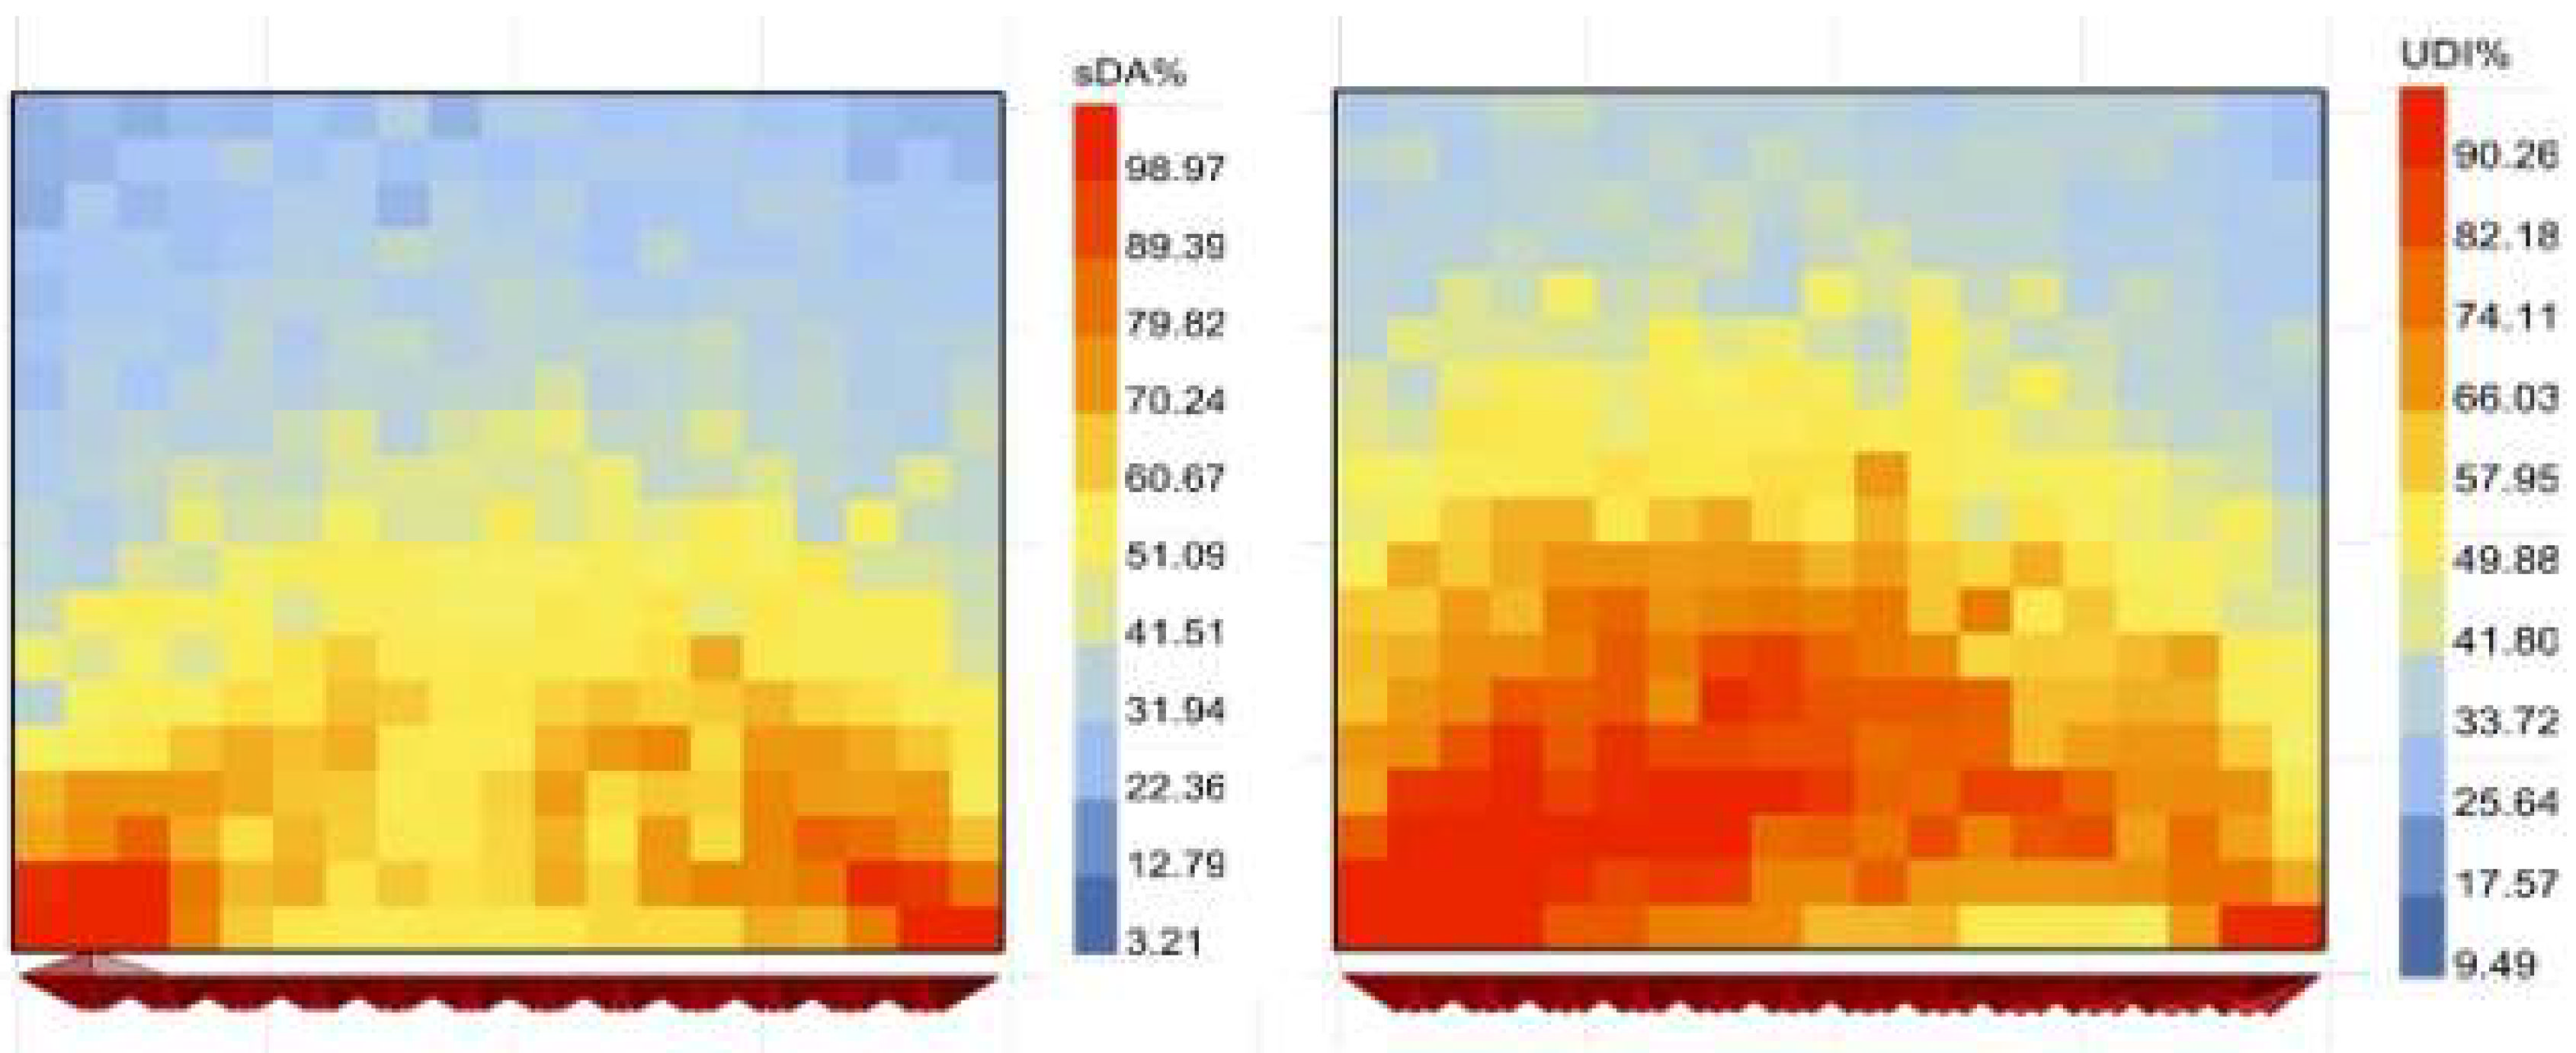
3.4.1. Daylighting Optimum Solution

Figure 17 describes the distribution of the spatial daylight autonomy and useful daylight illuminance in the patient room after the optimization process, with a considerable improvement of sDA (300 Lux/50%) and UDI (100–300 lux) in the room. The optimum solution in daylighting performance reached the highest value in the selected number of optimum solutions; it achieved 94.5% for sDA average and 78.3% for UDI. In comparison to the base case, these high values of SDA and UDI were achieved because of the integration of the double-glazing low-E and the shading device configuration with a uniform distribution of values. The results showed an increased daylight distribution in the case study, and approximately 80% of the patient room surface achieved between 80% and 100% values of UDI, which indicates an important improvement in daylight levels in the room.

3.4.2. Energy Optimum Solution

As shown in Figure 18, the distribution of EUI over the year illustrates that the highest energy consumption during the year occurs in June, July, and August, because of the high temperatures in this hot and arid climate, which requires the use of cooling systems. However, compared to the base case model, EUI decreased successfully with the optimization model, from 158.1 Kwh/m2/year to 144.0 Kwh/m2/year, which shows a 14.1% improvement in the EUI value.

4. Conclusions

From the analysis results, this paper has demonstrated that parametric workflow and genetic algorithm optimization can be used effectively to generate an innovative facade design of patient rooms that shows enhanced daylight performance in the early scheme design stage.
First, this study assessed the quality of indoor daylight in a typical case study of a patient room in the Pediatrics Ward of Hakim Saadan Hospital in Algeria. The results showed that the interior daylight performances in south-, east-, and west-facing patient rooms are superior to the recommended values during the morning, particularly in the areas nearest to windows. However, in the afternoon, the average illuminance levels are under the recommended values in the depth of the room during summer (June measurements) compared to winter, when there are higher levels due to the hot and arid climate. Meanwhile, the results of the winter season (December measurements) illustrate low levels of daylight during occupied hours, which cause the patient rooms to consume high amounts of artificial light and prevent the patients from benefitting from daylight. This means that the south- and west-facing patient rooms in the Pediatric Ward have an excessive illuminance level due to the exposure to visual discomfort and glare, which can negatively affect patient health and cause exhausting conditions.
Second, to improve daylight performance while reducing energy consumption, this study conducted a multi-objective optimization model using Grasshopper and Rhinoceros software to identify a great number of unique designs of shading devices that lead to the maximization of daylighting performance and minimization of energy cost. The major findings from this optimization process compared to the base case model revealed that the performance of a dynamic facade system improved the conditions compared to options without shading systems. It showed an increase in sDA and UDI, whilst minimizing EUI and maintaining satisfaction in a glare-free, indoor daylight environment for patients. The genetic algorithm approach used in this workflow gradually improved daylighting performance during the optimization process through 15 generations. By the end of the optimization process, 50 non-dominated solutions were defined, which included the selected optimum solutions that all met the targeted criteria.
The study revealed how the integration and implementation of parametric analysis with evolutionary algorithms can be considered a reliable strategy to reach optimum solutions in building environmental performance problems for designers.
Finally, the limitations include that this study only optimized a single patient room for a specific case study. The optimization application prospect in buildings still needs to be further improved. Future studies can examine a diverse range of optimization criteria by combining thermal and energy indicators with visual comfort ones. Despite limitations, this approach showed the potential to respond to changes with design alternatives and include facade design solutions, leading to a substantial daylight performance improvement. This is particularly important when dealing with this crucial case study in the patient room sample where the physical environment has a great impact on patients’ health and productivity. Therefore, improving patient health should be involved in all features of building design.

Author Contributions

Conceptualization, S.B.; methodology, S.B., M.A.K., N.Z. and F.N.; software, S.B., M.A.K. and A.B.; validation, S.B., A.B., M.A.K. and F.N.; formal analysis, S.B.; investigation, S.B. and M.A.K.; resources, S.B., M.A.K., N.Z. and F.N.; data curation, S.B. and M.A.K.; writing—original draft preparation, S.B.; writing—review and editing, S.B., M.A.K., N.Z. and F.N.; visualization, S.B. and A.B; supervision, M.A.K., N.Z. and F.N.; project administration, S.B. All authors have read and agreed to the published version of the manuscript.

Funding

This research received no external funding.

Institutional Review Board Statement

Not applicable.

Informed Consent Statement

Not applicable.

Data Availability Statement

The data presented in this article can be obtained from the corresponding author upon request.

Acknowledgments

The authors gratefully acknowledge the support of both the Laboratory of design and modeling of architectural forms and ambiances (LACOMOFA) and Mohamed Khider University (for instruments of measurements and software). They would also like to acknowledge the staff of Hakim Sadaan Hospital for being very cooperative during the on-site measurements.

Conflicts of Interest

The authors declare no conflict of interest.

References

  1. Joon, H.C. Study of the Relationship between Indoor Daylight Environments and Patients Average Length of Stay (ALOS) in Healthcare Facilities. Ph.D. Dissertation, Texas A&M University, College Station, TX, USA, 2005. [Google Scholar]
  2. Alzoubi, H.; Al-Rqaibat, S.; Bataineh, R.F. Pre-versus post-occupancy evaluation of daylight quality in hospitals. Build. Environ. 2010, 45, 2652–2665. [Google Scholar] [CrossRef]
  3. Sherif, A.; Sabry, H.; Wagdy, A.; Arafa, R. Daylighting in hospital patient rooms: Parametric workflow and genetic algorithms for an optimum façade design. In Proceedings of the 14th Conference of International Building Performance Simulation Association, Hyderabad, India, 7–9 December 2015. [Google Scholar]
  4. Dickerman, K.; Barach, P. Designing the Built Environment for a Culture and System of Patient Safety—A Conceptual, New Design Process, 2nd ed.; Agency for Healthcare Research and Quality: Rockville, MD, USA, 2008; pp. 1–11. Available online: https://pubmed.ncbi.nlm.nih.gov/21249898/ (accessed on 4 February 2022).
  5. Joseph, A. The impact of light on outcomes in healthcare settings. Cent. Health Des. 2006, 2, 1–12. Available online: http://www.healthdesign.org/sites/default/files/CHDIssuePaper2.pdf (accessed on 15 January 2022).
  6. Alzoubi, H.; Al-Rqaibat, S. The effect of hospital design on indoor daylight quality in children section in King Abdullah University Hospital, Jordan. Sustain. Cities Soc. 2015, 14, 449–455. [Google Scholar] [CrossRef]
  7. Energy Star. Available online: https://www.energystar.gov/buildings/benchmark/understand_metrics/what_eui (accessed on 13 January 2022).
  8. Yang, F. Optimization of Daylighting and Energy Performance Using Parametric Design, Simulation Modeling, and Genetic Algorithms. Ph.D. Dissertation, Faculty of North Carolina State University, Raleigh, NC, USA, 2017. [Google Scholar]
  9. Nocera, F.; Gagliano, A.; Detommaso, M. Energy performance of cross-laminated timber panel (X-Lam) buildings: A case study. Math. Model. Eng. Problems. 2018, 5, 175–182. [Google Scholar] [CrossRef] [Green Version]
  10. Borgstein, E.; Lamberts, R.; Hensen, J. Evaluating energy performance in non-domestic buildings. Energy Build. 2016, 128, 734–755. [Google Scholar] [CrossRef]
  11. Niclas, N.R. Using genetic algorithms in parametric building facade design to create different atmospheres. Ph.D. Dissertation, Aalborg University, Aalborg, Denmark, 28 May 2019. [Google Scholar]
  12. MathWorks. Available online: https://www.mathworks.com/discovery/genetic-algorithm.html (accessed on 9 January 2022).
  13. Zhang, J.; Liu, N.; Wang, S. A parametric approach for performance optimization of residential building design in Beijing. Build. Simul. 2019, 13, 223–235. [Google Scholar] [CrossRef]
  14. Hong, X.; Shi, F.; Wang, S.; Yang, X.; Yang, Y. Multi-objective optimization of thermochromic glazing based on daylight and energy performance evaluation. Build. Simul. 2021, 14, 1685–1695. [Google Scholar] [CrossRef]
  15. Toutou, A.M.Y. Parametric approach for multi-objective optimization for daylighting and energy consumption in early stage design of office tower in new administrative capital city of Egypt. In The Academic Research Community Publication; IEREK: London, UK, 2019; Volume 3, pp. 1–13. [Google Scholar] [CrossRef]
  16. Toutou, A.M.Y.; Fikry, M.; Mohamed, W. The parametric based optimization framework daylighting and energy performance in residential buildings in hot arid zone. Alex. Eng. J. 2018, 57, 3595–3608. [Google Scholar] [CrossRef]
  17. Sun, C.; Liu, Q.; Han, Y. Many-Objective Optimization Design of a Public Building for Energy, Daylighting and Cost Performance Improvement. Appl. Sci. 2020, 10, 2435. [Google Scholar] [CrossRef] [Green Version]
  18. Zhang, A.; Bokel, R.; Dobbelsteen, A.V.D.; Sun, Y.; Huang, Q.; Zhang, Q. Optimization of thermal and daylight performance of school buildings based on a multi-objective genetic algorithm in the cold climate of China. Energy Build. 2017, 139, 371–384. [Google Scholar] [CrossRef]
  19. Sherif, A.; Sabry, A.; Wagdy, I.; Mashaly, I.; Arafa, R. Shaping the slats of hospital patient room window blinds for daylighting and external view under desert clear skies. Sol. Energy 2016, 133, 1–13. [Google Scholar] [CrossRef]
  20. Wagdy, A.; Shalaby, M. Optimizing the external and internal reflectors and ceiling geometry for a deep side-lit space: Using validated daylight simulation with genetic optimization algorithm in Cairo. In Proceedings of the Sustainable Building Conference SB13, Cairo, Egypt, 6 November 2013. [Google Scholar]
  21. Hinkle, L.E.; Wang, J.; Brown, N.C. Quantifying potential dynamic façade energy savings in early design using constrained optimization, Building, and Environment. Build. Environ. 2022, 221, 109265. [Google Scholar] [CrossRef]
  22. Esteghamati, N.Z.; Sharifnia, H.; Ton, D.; Asiatico, P.; Reichard, G.; Flint, M.M. Sustainable early design exploration of mid-rise office buildings with different subsystems using comparative life cycle assessment. J. Build. Eng. 2022, 48, 104004. [Google Scholar] [CrossRef]
  23. Gut, P.; Ackerknecht, D. Climate Responsive Buildings: Appropriate Building Construction in Tropical and Subtropical Regions, 1st ed.; SKAT, Université de Californie: Berkeley, CA, USA, 1993; pp. 193–216. [Google Scholar]
  24. Roudsari, M.S.; Sarith, S. Automating radiance workflows with Python. In Proceedings of the 15th of the Radiance Workshop, Padua, Italy, 29–31 August 2016. [Google Scholar]
  25. Nocera, F.; Lo Faro, A.; Costanzo, V.; Raciti, C. Daylight Performance of Classrooms in a Mediterranean School Heritage Building. Sustainability 2018, 10, 3705. [Google Scholar] [CrossRef] [Green Version]
  26. Khadraoui, M.A.; Sriti, L. The effect of cool paints and surface properties of the facade on the thermal and energy efficiency of buildings in a hot and arid climate. J. Mater. Eng. Struct. 2019, 6, 127–140. Available online: https://revue.ummto.dz//index.php/JMES/article/view/1828 (accessed on 22 October 2021).
  27. Meteonorm, V.8. Available online: https://meteonorm.com/en/meteonorm-version-8 (accessed on 2 March 2021).
  28. Chen, Y.; Liu, J.; Pei, J.; Cao, X.; Chen, Q.; Jiang, Y. Experimental and simulation study on the performance of daylighting in an industrial building and its energy saving potential. Energy Build. 2014, 73, 184–191. [Google Scholar] [CrossRef]
  29. Costanzo, V.; Nocera, F.; Evola, G.; Buratti, C.; Lo Faro, A.; Marletta, L.; Domenighini, P. Optical characterization of historical colored stained glasses in winter gardens and their modeling in daylight availability simulations. Sol. Energy 2022, 243, 22–34. [Google Scholar] [CrossRef]
  30. Lo Verso, V.R.M.; Giuliani, F.; Caffaro, F.; Basile, F.; Peron, F.; Dalla Mora, T.; Bellia, L.; Fragliasso, F.; Beccali, M.; Bonomolo, M.; et al. Questionnaires and simulations to assess daylighting in Italian university classrooms for IEQ and energy issues. Energy Build. 2021, 252, 111433. [Google Scholar] [CrossRef]
  31. Maile, T.; Bazjanac, V.; Fischer, M. A method to compare simulated and measured data to assess building energy performance. Build. Environ. 2012, 56, 241–251. [Google Scholar] [CrossRef]
  32. Reinhart, C.F.; Andersen, M. Development and validation of a Radiance model for a translucent panel. Energy Build. 2006, 38, 890–904. [Google Scholar] [CrossRef]
  33. Ruiz, G.; Bandera, C. Validation of Calibrated Energy Models: Common Errors. Energies 2017, 10, 1587. [Google Scholar] [CrossRef]
  34. Reinhart, C.F.; Breton, P.F. Experimental Validation of Autodesk 3ds Max Design 2009 and Daysim 3.0. J. Illum. Eng. Soc. 2009, 6, 7–35. [Google Scholar] [CrossRef]
  35. Tregenza, P.R. Uncertainty in daylight calculations. Light. Res. Technol. 2016, 49, 829–844. [Google Scholar] [CrossRef]
  36. McNeil, A.; Lee, E.S. A validation of the Radiance three-phase simulation method for modeling annual daylight performance of optically complex fenestration. J. Build. Perform. Simul. 2012, 6, 24–37. [Google Scholar] [CrossRef]
  37. Reinhart, C.F.; Walkenhorst, O. Validation of dynamic RADIANCE-based daylight simulations for a test office with external blinds. Energy Build. 2001, 33, 683–697. [Google Scholar] [CrossRef]
  38. Konis, K.; Games, A.; Kensek, K. Passive performance and building form: An optimization framework for early-stage design support. Sol. Energy 2016, 125, 161–179. [Google Scholar] [CrossRef]
  39. Thomas, R. Environmental Design an Introduction for Architects and Engineers, 3rd ed.; Routledge: London, UK, 2005; pp. 96–113. [Google Scholar]
  40. Andersen, P.A.; Duer, L.; Goldberg, P.; Roy, N. Daylight, Energy and Indoor Climate—Basic Book, 3rd ed.; VELUX: Horsholm, Denmark, 2014; pp. 14–23. [Google Scholar]
  41. Pellegrino, A.; Cammarano, S.; Lo Verso, V.R.M.; Corrado, V. Impact of daylighting on total energy use in offices of varying architectural features in Italy: Results from a parametric study. Build. Environ. 2017, 113, 151–162. [Google Scholar] [CrossRef]
  42. Tabadkani, A.; Banihashemi, S.; Hosseini, M.R. Daylighting and visual comfort of oriental sun responsive skins: A parametric analysis. Build. Simul. 2018, 11, 663–676. [Google Scholar] [CrossRef]
  43. Nabil, A.; Mardaljevic, J. Useful daylight illuminance: A new paradigm for assessing daylight in buildings. Light. Res. Technol. 2005, 37, 41–57. [Google Scholar] [CrossRef]
  44. Mardaljevic, J.; School of Civil and Building Engineering, Loughborough University, Loughborough, UK. Personal communication, 2015.
  45. Mardaljevic, J. Daylight, Indoor Illumination, and Human Behavior. In Encyclopedia of Sustainability Science and Technology; Meyers, R.A., Ed.; Springer: New York, NY, USA, 2012; pp. 2804–2846. [Google Scholar]
Figure 1. Dry bulb temperature of Biskra city in Algeria.
Sustainability 14 12652 g001
Figure 2. Direct and diffuse normal radiation (KWh/m2) of Biskra city in Algeria.
Sustainability 14 12652 g002
Figure 3. Illustration of Hakim Saadan Hospital. (a) The location of the hospital; (b) a daytime photo of the hospital (Pediatric ward); (c) floorplans of the pediatric ward; (d) photos of patient rooms, interior and exterior.
Sustainability 14 12652 g003
Figure 4. Illuminance meter instrument (Testo 480 Probe Lux).
Sustainability 14 12652 g004
Figure 5. The plan (top) and section of patient rooms and placement of the reference points.
Sustainability 14 12652 g005
Figure 6. (a) Base case modeling design and situation of studied patient rooms in perspective and top views in Rhino; (b) patient room model parameters in Rhino.
Sustainability 14 12652 g006
Figure 7. Comparison of measured and simulated illuminance levels in the patient room cases.
Sustainability 14 12652 g007
Figure 8. Distribution of the relative error (RE), MBE, and CV (RMSE) for the three patient room cases: (a) Room 1; (b) Room 2; (c) Room 3.
Sustainability 14 12652 g008
Figure 9. Algorithmic design process of software and plug-ins coupled in the workflow.
Sustainability 14 12652 g009
Figure 10. Algorithmic workflow design with Grasshopper Energy and Daylighting Simulation modules.
Sustainability 14 12652 g010
Figure 11. Parametric modelling facade development, kinetic configuration render in Rhino-grasshopper software.
Sustainability 14 12652 g011
Figure 12. Daylight simulation of the base case patient room.
Sustainability 14 12652 g012
Figure 13. Pareto Front diagram of 15 Genomes generations produced in Octopus plugin Grasshopper software.
Sustainability 14 12652 g013
Figure 14. Development of optimum solutions in Pareto Front diagram after the last generation.
Sustainability 14 12652 g014
Figure 15. Box plot comparative analysis of the original design (base case model) and non-dominated solutions objectives: (a) Spatial Daylight Autonomy (sDA) values; (b) Useful Daylight Illuminance (UDI) values; (c) Energy Use Intensity (EUI) values.
Sustainability 14 12652 g015
Figure 16. Daylight performance simulation of the optimized configuration (Daylight factor).
Sustainability 14 12652 g016
Figure 17. Daylight optimum solution simulation of Kinetic configuration spatial daylight autonomy and Useful daylight illuminance (sDA, UDI).
Sustainability 14 12652 g017
Figure 18. Annual EUI Energy Use Intensity consumption for cooling and heating of the optimum solution (Source: Author using Ladybug tool).
Sustainability 14 12652 g018
Table 1. Building construction materials of the hospital Hakim Sadaan—external and internal wall (Source: DTR. Regulation Technical Document booklet Ministry of Housing, Algeria).
ParametersUnitExterior Plaster CoatingBrick25-AlveolarInterior Plaster Coating
Tm0.010.500.01
λW/(m·K)1.15330.310830.35111
External wallDkg/m317007201500
CJ/(kg·K)10007941000
U-value(W/m2-K)5.5970.4915.038
Tm0.010.180.01
λW/(m·K)1.351110.310830.35111
Internal wallDkg/m315007201500
CJ/(kg·K)10007941000
U-value(W/m2-K)5.0381.3355.038
Table 2. Building construction materials of the hospital Hakim Sadaan—floor and roof (Source: DTR. Regulation Technical Document booklet Ministry of Housing, Algeria).
ParametersUnitFloor Materials
Flooring Floating CALC1_T_N2
Slab
Roof Materials
Sealing Compression Steel Air Interior
Slab Cavity Plaster
Coating
Tm0.200.100.300.10.050.030.300.02
λW/(m·K)1.7141.7551.2301.751.75544.46.027e−20.351
Dkg/m323002300150023002300780011500
CJ/(kg·K)70092080092092051012271000
U-value(W/m2-K)3.4804.4062.0624.405.0385.850.1944.406
Table 3. Physic-optical properties of building materials used for the simulation model.
Rad Material Type
(Layers)
Reflectance/
Transmissivity *
White plaster0.80
Interior plaster0.80
Floor0.40
Ceiling0.80
Window wood0.25
Glass material (Single glazing) *0.90
* Transmissivity is only for Glass material.
Table 4. Measured and simulated illuminances calibration and Relative Error (RE) in December at 9:00 h, 12:00 h, and 16:00 h.
TimeRoomMeasured Average IlluminanceSimulated Average
Illuminance
Relative Error (RE)
Room 1475.33493.77−0.89
9:00hRoom 2314.33277.8811.59
Room 3428.22477.44−11.49
Room 1730820.22−12.36
12:00hRoom 2536.33546.55−1.91
Room 3505,44651.22−28.84
Room 1143.22152.33−6.36
16:00hRoom 2134.44135.66−0.91
Room 3132.66128.333.26
Table 5. Parameters integrated during the optimization process of the configuration model.
Decision VariablesSettingsRange
Glazing ratioDouble glazed low-E (vacuum)90°
Glass type materialDouble glazed low-E (vacuum)[0, 2] a
Wall’s materialsDouble red brick with Isolation1
Module Radiance Material[0, 1] b
The adaptive parametersModules rotating angle[0–90°]
Module distance to glass[1–50 cm]
Sun’s position angle[0–180°]
a 0: Double pane-low emissivity with 64%; 1: Double pane-clear with 80%; 2: Single pane clear with 86%.; b 0: Metal; 1: Plastic.
Table 6. Fitness function values and their characteristics of Pareto Front optimum Solutions.
YsDA%UDI%EUI KWH/m2/YearWall ConstructionGlass MaterialShading Device
Distance Angle
90.894.364.9144.3Double brick with air cavityDouble glazed low-E (vacuum)0.20−45°
87.894.364.9144.4Double brick with air cavityDouble glazed low-E (vacuum)0.20−45°
94.291.068.2144.7Double brick with air cavityDouble glazed low-E (vacuum)0.19−45°
94.591.168.2144.7Double brick with air cavityDouble glazed low-E (vacuum)0.19−45°
92.690.068.3144.6Double brick with air cavityDouble glazed low-E (vacuum)0.19−30°
99.584.769.6144.0Double brick with air cavityDouble glazed low-E (vacuum)0.16−30°
99.683.769.9144.0Double brick with air cavityDouble glazed low-E (vacuum)0.15−30°
97.690.670.5145.1Double brick with air cavityDouble glazed low-E (vacuum)0.18−30°
69.481.469.9145.1Double brick with air cavityDouble glazed low-E (vacuum)0.16−30°
62.876.370.8145.1Double brick with air cavityDouble glazed low-E (vacuum)0.14−25°
50.669.372.9145.4Double brick with air cavityDouble glazed low-E (vacuum)0.12−15°
51.568.073.5145.4Double brick with air cavityDouble glazed low-E (vacuum)0.10−15°
Publisher’s Note: MDPI stays neutral with regard to jurisdictional claims in published maps and institutional affiliations.

