
Exploring the Role of Communication Technologies, Governance, and Renewable Energy for Ecological Footprints in G11 Countries: Implications for Sustainable Development

 ,
,  ,
,  , ,
, ,  ,
,  and
and
Abstract
:1. Introduction
- What is the role of change in RE consumption in curbing ecological footprints (EF);
- Given the political instability in these countries, what is the role of governance towards EF;
- What are the econometric results of other factors towards EF?
Contribution of This Work
2. Literature Review
2.1. Renewable Energy and Ecological Footprints
2.2. Government Effectiveness and Ecological Footprints
2.3. GDP and Ecological Footprints
2.4. ICT and Ecological Footprints
2.5. The Gap in the Literature
3. Data Description and Methodology
3.1. Methodology
3.1.1. Cross-Sectional Dependence (CD) Test
3.1.2. Slope Homogeneity Test
3.1.3. Unit Root Test
3.1.4. Cointegration Test
3.1.5. Short- and Long-Run Analysis
3.1.6. Robustness Check Test
4. Results
5. Discussion
6. Conclusions and Policy Implications
Author Contributions
Funding
Institutional Review Board Statement
Informed Consent Statement
Data Availability Statement
Conflicts of Interest
References
- IEA World Energy Outlook 2020—Analysis—IEA. Available online: https://www.iea.org/reports/world-energy-outlook-2020 (accessed on 20 July 2022).
- Apergis, N.; Ozturk, I. Testing Environmental Kuznets Curve hypothesis in Asian countries. Ecol. Indic. 2015, 52, 16–22. [Google Scholar] [CrossRef]
- Arslan, H.M.; Khan, I.; Latif, M.I.; Komal, B.; Chen, S. Understanding the dynamics of natural resources rents, environmental sustainability, and sustainable economic growth: New insights from China. Environ. Sci. Pollut. Res. 2022, 29, 58746–58761. [Google Scholar] [CrossRef] [PubMed]
- Khan, I.; Hou, F. The Impact of Socio-economic and Environmental Sustainability on CO2 Emissions: A Novel Framework for Thirty IEA Countries. Soc. Indic. Res. 2021, 155, 1045–1076. [Google Scholar] [CrossRef]
- Olawuyi, D.S. Can MENA extractive industries support the global energy transition? Current opportunities and future directions. Extr. Ind. Soc. 2021, 8, 100685. [Google Scholar] [CrossRef]
- Mehmood, U. Contribution of renewable energy towards environmental quality: The role of education to achieve sustainable development goals in G11 countries. Renew. Energy 2021, 178, 600–607. [Google Scholar] [CrossRef]
- IPCC. Special Report on Climate Change and Land—IPCC Site. Available online: https://www.ipcc.ch/srccl/ (accessed on 21 July 2022).
- Sarkodie, S.A.; Strezov, V. Empirical study of the Environmental Kuznets curve and Environmental Sustainability curve hypothesis for Australia, China, Ghana and USA. J. Clean. Prod. 2018, 201, 98–110. [Google Scholar] [CrossRef]
- Destek, M.A.; Sarkodie, S.A. Investigation of environmental Kuznets curve for ecological footprint: The role of energy and financial development. Sci. Total Environ. 2019, 650, 2483–2489. [Google Scholar] [CrossRef] [PubMed]
- Wang, J.; Dong, K. What drives environmental degradation? Evidence from 14 Sub-Saharan African countries. Sci. Total Environ. 2019, 656, 165–173. [Google Scholar] [CrossRef]
- Aydin, C.; Esen, O.; Aydin, R. Is the ecological footprint related to the Kuznets curve a real process or rationalizing the ecological consequences of the affluence? Evidence from PSTR approach. Ecol. Indic. 2019, 98, 543–555. [Google Scholar] [CrossRef]
- Danish; Zhang, B.; Wang, B.; Wang, Z. Role of renewable energy and non-renewable energy consumption on EKC: Evidence from Pakistan. J. Clean. Prod. 2017, 156, 855–864. [Google Scholar] [CrossRef]
- Lin, W.; Li, Y.; Li, X.; Xu, D. The dynamic analysis and evaluation on tourist ecological footprint of city: Take Shanghai as an instance. Sustain. Cities Soc. 2018, 37, 541–549. [Google Scholar] [CrossRef]
- Ozcan, B.; Ulucak, R.; Dogan, E. Analyzing long lasting effects of environmental policies: Evidence from low, middle and high income economies. Sustain. Cities Soc. 2019, 44, 130–143. [Google Scholar] [CrossRef]
- Khan, M.K.; Teng, J.-Z.; Khan, M.I. Effect of energy consumption and economic growth on carbon dioxide emissions in Pakistan with dynamic ARDL simulations approach. Environ. Sci. Pollut. Res. 2019, 26, 23480–23490. [Google Scholar] [CrossRef] [PubMed]
- Khan, Y.; Bin, Q.; Hassan, T. The impact of climate changes on agriculture export trade in Pakistan: Evidence from time-series analysis. Growth Chang. 2019, 50, 1568–1589. [Google Scholar] [CrossRef]
- Khan, Z.; Ali, S.; Dong, K.; Li, R.Y.M. How does fiscal decentralization affect CO2 emissions? The roles of institutions and human capital. Energy Econ. 2021, 94, 105060. [Google Scholar] [CrossRef]
- Khan, Y.; ShuKai, C.; Hassan, T.; Kootwal, J.; Khan, M.N. The links between renewable energy, fossil energy, terrorism, economic growth and trade openness: The case of Pakistan. SN Bus. Econ. 2021, 1, 1–25. [Google Scholar] [CrossRef]
- Farhani, S.; Ozturk, I. Causal relationship between CO2 emissions, real GDP, energy consumption, financial development, trade openness, and urbanization in Tunisia. Environ. Sci. Pollut. Res. 2015, 22, 15663–15676. [Google Scholar] [CrossRef]
- Kaufmann, D.; Kraay, A.; Mastruzzi, M. Governance Matters IV: Governance Indicators For 1996–2004; World Bank: Washington, DC, USA, 2005. [Google Scholar] [CrossRef] [Green Version]
- Bouyghrissi, S.; Murshed, M.; Jindal, A.; Berjaoui, A.; Mahmood, H.; Khanniba, M. The importance of facilitating renewable energy transition for abating CO2 emissions in Morocco. Environ. Sci. Pollut. Res. 2022, 29, 20752–20767. [Google Scholar] [CrossRef]
- Zahoor, Z.; Latif, M.I.; Khan, I.; Hou, F. Abundance of natural resources and environmental sustainability: The roles of manufacturing value-added, urbanization, and permanent cropland. Environ. Sci. Pollut. Res. 2022, 1–14. [Google Scholar] [CrossRef]
- Zakari, A.; Tawiah, V.; Khan, I.; Alvarado, R.; Li, G. Ensuring sustainable consumption and production pattern in Africa: Evidence from green energy perspectives. Energy Policy 2022, 169, 113183. [Google Scholar] [CrossRef]
- Abbasi, K.R.; Hussain, K.; Redulescu, M.; Ozturk, I. Does natural resources depletion and economic growth achieve the carbon neutrality target of the UK? A way forward towards sustainable development. Resour. Policy 2021, 74, 102341. [Google Scholar] [CrossRef]
- Khan, Y.; Hassan, T.; Kirikkaleli, D.; Xiuqin, Z.; Shukai, C. The impact of economic policy uncertainty on carbon emissions: Evaluating the role of foreign capital investment and renewable energy in East Asian economies. Environ. Sci. Pollut. Res. 2022, 29, 18527–18545. [Google Scholar] [CrossRef] [PubMed]
- Liu, H.; Khan, I.; Zakari, A.; Alharthi, M. Roles of trilemma in the world energy sector and transition towards sustainable energy: A study of economic growth and the environment. Energy Policy 2022, 170, 113238. [Google Scholar] [CrossRef]
- Koondhar, M.A.; Shahbaz, M.; Ozturk, I.; Randhawa, A.A.; Kong, R. Revisiting the relationship between carbon emission, renewable energy consumption, forestry, and agricultural financial development for China. Environ. Sci. Pollut. Res. 2021, 28, 45459–45473. [Google Scholar] [CrossRef] [PubMed]
- Luqman, M.; Ahmad, N.; Bakhsh, K. Nuclear energy, renewable energy and economic growth in Pakistan: Evidence from non-linear autoregressive distributed lag model. Renew. Energy 2019, 139, 1299–1309. [Google Scholar] [CrossRef]
- Ben Jebli, M.; Ben Youssef, S. The role of renewable energy and agriculture in reducing CO2 emissions: Evidence for North Africa countries. Ecol. Indic. 2016, 74, 295–301. [Google Scholar] [CrossRef] [Green Version]
- Chishti, M.Z.; Ahmad, M.; Rehman, A.; Khan, M.K. Mitigations pathways towards sustainable development: Assessing the influence of fiscal and monetary policies on carbon emissions in BRICS economies. J. Clean. Prod. 2021, 292, 126035. [Google Scholar] [CrossRef]
- Fredriksson, P.G.; Svensson, J. Political instability, corruption and policy formation: The case of environmental policy. J. Public Econ. 2003, 87, 1383–1405. [Google Scholar] [CrossRef]
- Lv, Z. The Effect of Democracy on CO2 Emissions in Emerging Countries: Does the Level of Income Matter? Renew. Sustain. Energy Rev. 2017, 72, 900–906. [Google Scholar] [CrossRef]
- Povitkina, M. The limits of democracy in tackling climate change. Environ. Politics 2018, 27, 411–432. [Google Scholar] [CrossRef] [Green Version]
- Das Neves Almeida, T.A.; García-Sánchez, I.M. Sociopolitical and economic elements to explain the environmental performance of countries. Environ. Sci. Pollut. Res. 2016, 24, 3006–3026. [Google Scholar] [CrossRef] [PubMed]
- Krupa, J.; Galbraith, L.; Burch, S. Participatory and multi-level governance: Applications to Aboriginal renewable energy projects. Local Environ. 2015, 20, 81–101. [Google Scholar] [CrossRef]
- Hassan, T.; Song, H.; Kirikkaleli, D. International trade and consumption-based carbon emissions: Evaluating the role of composite risk for RCEP economies. Environ. Sci. Pollut. Res. 2022, 29, 3417–3437. [Google Scholar] [CrossRef] [PubMed]
- Mehmood, U. Renewable energy and foreign direct investment: Does the governance matter for CO2 emissions? Application of CS-ARDL. Environ. Sci. Pollut. Res. 2021, 29, 19816–19822. [Google Scholar] [CrossRef] [PubMed]
- Danish; Baloch, M.A.; Wang, B. Analyzing the role of governance in CO2 emissions mitigation: The BRICS experience. Struct. Chang. Econ. Dyn. 2019, 51, 119–125. [Google Scholar] [CrossRef]
- Liu, H.; Saleem, M.M.; Al-Faryan, M.A.S.; Khan, I.; Zafar, M.W. Impact of governance and globalization on natural resources volatility: The role of financial development in the Middle East North Africa countries. Resour. Policy 2022, 78, 102881. [Google Scholar] [CrossRef]
- Liu, H.; Alharthi, M.; Atil, A.; Zafar, M.W.; Khan, I. A non-linear analysis of the impacts of natural resources and education on environmental quality: Green energy and its role in the future. Resour. Policy 2022, 79, 102940. [Google Scholar] [CrossRef]
- Borhan, H.; Ahmed, E.M.; Hitam, M. The Impact of CO2 on Economic Growth in Asean 8. Procedia Soc. Behav. Sci. 2012, 35, 389–397. [Google Scholar] [CrossRef] [Green Version]
- Menyah, K.; Wolde-Rufael, Y. Energy consumption, pollutant emissions and economic growth in South Africa. Energy Econ. 2010, 32, 1374–1382. [Google Scholar] [CrossRef]
- Ghosh, S. Examining carbon emissions economic growth nexus for India: A multivariate cointegration approach. Energy Policy 2010, 38, 3008–3014. [Google Scholar] [CrossRef]
- Mrabet, Z.; Alsamara, M.; Jarallah, S.H. The impact of economic development on environmental degradation in Qatar. Environ. Ecol. Stat. 2017, 24, 7–38. [Google Scholar] [CrossRef]
- Odugbesan, J.A.; Adebayo, T.S. The symmetrical and asymmetrical effects of foreign direct investment and financial development on carbon emission: Evidence from Nigeria. SN Appl. Sci. 2020, 2, 1982. [Google Scholar] [CrossRef]
- Masih, A.M.M.; Masih, R. A multivariate cointegrated modelling approach in testing temporal causality between energy consumption, real income and prices with an application to two Asian LDCs. Appl. Econ. 1998, 30, 1287–1298. [Google Scholar] [CrossRef]
- Oh, W.; Lee, K. Causal relationship between energy consumption and GDP revisited: The case of Korea 1970–1999. Energy Econ. 2004, 26, 51–59. [Google Scholar] [CrossRef]
- Huang, B.-N.; Hwang, M.; Yang, C. Causal relationship between energy consumption and GDP growth revisited: A dynamic panel data approach. Ecol. Econ. 2008, 67, 41–54. [Google Scholar] [CrossRef]
- Ghali, K.H.; El-Sakka, M. Energy use and output growth in Canada: A multivariate cointegration analysis. Energy Econ. 2004, 26, 225–238. [Google Scholar] [CrossRef]
- Ahmed, F.; Naeem, M.; Iqbal, M. ICT and renewable energy: A way forward to the next generation telecom base stations. Telecommun. Syst. 2017, 64, 43–56. [Google Scholar] [CrossRef]
- Joseph, J. Worldwide Digital Population as of January 2021. Available online: https://datareportal.com/reports/digital-2021-global-overview-report (accessed on 25 July 2022).
- Khan, Y.; Oubaih, H.; Elgourrami, F.Z. The effect of renewable energy sources on carbon dioxide emissions: Evaluating the role of governance, and ICT in Morocco. Renew. Energy 2022, 190, 752–763. [Google Scholar] [CrossRef]
- Salahuddin, M.; Alam, K.; Ozturk, I. Is rapid growth in Internet usage environmentally sustainable for Australia? An empirical investigation. Environ. Sci. Pollut. Res. 2016, 23, 4700–4713. [Google Scholar] [CrossRef]
- Ozcan, B.; Apergis, N. The impact of internet use on air pollution: Evidence from emerging countries. Environ. Sci. Pollut. Res. 2018, 25, 4174–4189. [Google Scholar] [CrossRef]
- Al-Mulali, U.; Sheau-Ting, L.; Ozturk, I. The global move toward Internet shopping and its influence on pollution: An empirical analysis. Environ. Sci. Pollut. Res. 2015, 22, 9717–9727. [Google Scholar] [CrossRef] [PubMed]
- Romm, J. The internet and the new energy economy. Resour. Conserv. Recycl. 2002, 36, 197–210. [Google Scholar] [CrossRef]
- Pesaran, M.H. Testing Weak Cross-Sectional Dependence in Large Panels. Econ. Rev. 2015, 34, 1089–1117. [Google Scholar] [CrossRef] [Green Version]
- Pesaran, M.H.; Yamagata, T. Testing slope homogeneity in large panels. J. Econ. 2008, 142, 50–93. [Google Scholar] [CrossRef] [Green Version]
- Westerlund, J. New Simple Tests for Panel Cointegration. Econ. Rev. 2005, 24, 297–316. [Google Scholar] [CrossRef]
- Chudik, A.; Pesaran, M.H. Common correlated effects estimation of heterogeneous dynamic panel data models with weakly exogenous regressors. J. Econ. 2015, 188, 393–420. [Google Scholar] [CrossRef] [Green Version]
- Eberhardt, M.; Teal, F. The Magnitude of the Task Ahead: Macro Implications of Heterogeneous Technology. Rev. Income Wealth 2020, 66, 334–360. [Google Scholar] [CrossRef]
- Chien, F.; Anwar, A.; Hsu, C.-C.; Sharif, A.; Razzaq, A.; Sinha, A. The role of information and communication technology in encountering environmental degradation: Proposing an SDG framework for the BRICS countries. Technol. Soc. 2021, 65, 101587. [Google Scholar] [CrossRef]
- Zhang, C.; Khan, I.; Dagar, V.; Saeed, A.; Zafar, M.W. Environmental impact of information and communication technology: Unveiling the role of education in developing countries. Technol. Forecast. Soc. Chang. 2022, 178, 121570. [Google Scholar] [CrossRef]
- Appiah-Otoo, I.; Acheampong, A.O.; Song, N.; Chen, X. The impact of information and communication technology (ICT) on carbon dioxide emissions: Evidence from heterogeneous ICT countries. Energy Environ. 2022, 0958305X221118877. [Google Scholar] [CrossRef]
- Yu, X.; Ma, S.; Cheng, K.; Kyriakopoulos, G. An Evaluation System for Sustainable Urban Space Development Based in Green Urbanism Principles—A Case Study Based on the Qin-Ba Mountain Area in China. Sustainability 2020, 12, 5703. [Google Scholar] [CrossRef]
- Lee, C.-C. The causality relationship between energy consumption and GDP in G-11 countries revisited. Energy Policy 2006, 34, 1086–1093. [Google Scholar] [CrossRef]
- Tariq, S.; Mehmood, U.; Haq, Z.U.; Mariam, A. Exploring the existence of environmental Phillips curve in South Asian countries. Environ. Sci. Pollut. Res. 2022, 29, 35396–35407. [Google Scholar] [CrossRef] [PubMed]
- Naz, S.; Sultan, R.; Zaman, K.; Aldakhil, A.M.; Nassani, A.A.; Abro, M.M.Q. Moderating and mediating role of renewable energy consumption, FDI inflows, and economic growth on carbon dioxide emissions: Evidence from robust least square estimator. Environ. Sci. Pollut. Res. 2019, 26, 2806–2819. [Google Scholar] [CrossRef]
- Pata, U.K. Renewable energy consumption, urbanization, financial development, income and CO2 emissions in Turkey: Testing EKC hypothesis with structural breaks. J. Clean. Prod. 2018, 187, 770–779. [Google Scholar] [CrossRef]
- Sarkodie, S.A.; Adams, S. Renewable energy, nuclear energy, and environmental pollution: Accounting for political institutional quality in South Africa. Sci. Total Environ. 2018, 643, 1590–1601. [Google Scholar] [CrossRef]
- Mehmood, U.; Askari, M.U.; Saleem, M. The assessment of environmental sustainability: The role of research and development in ASEAN countries. Integr. Environ. Assess. Manag. 2021, 18, 1313–1320. [Google Scholar] [CrossRef]


| Abbreviations | |
|---|---|
| EF | Ecological footprints |
| CO2 | Carbon dioxide |
| ICT | Communication technologies |
| GDP | Gross Domestic Product |
| RE | Renewable Energy |
| GOV | Governance |
| DOLS | Dynamic ordinary least squares |
| CS-ARDL | Cross-sectional autoregressive distributed lag |
| FMOL | Fully modified ordinary least squares |
| EKC | Environmental Kuznets curve |
| GOV | government effectiveness |
| WDI | World Bank Indicator |
| CD | Cross-sectional dependence |
| ICRG | international country risk guide |
| CIPS | Cross-sectionally augmented Im-Pesaran-Shin |
| Parameters | Symbol | Unit | Source |
|---|---|---|---|
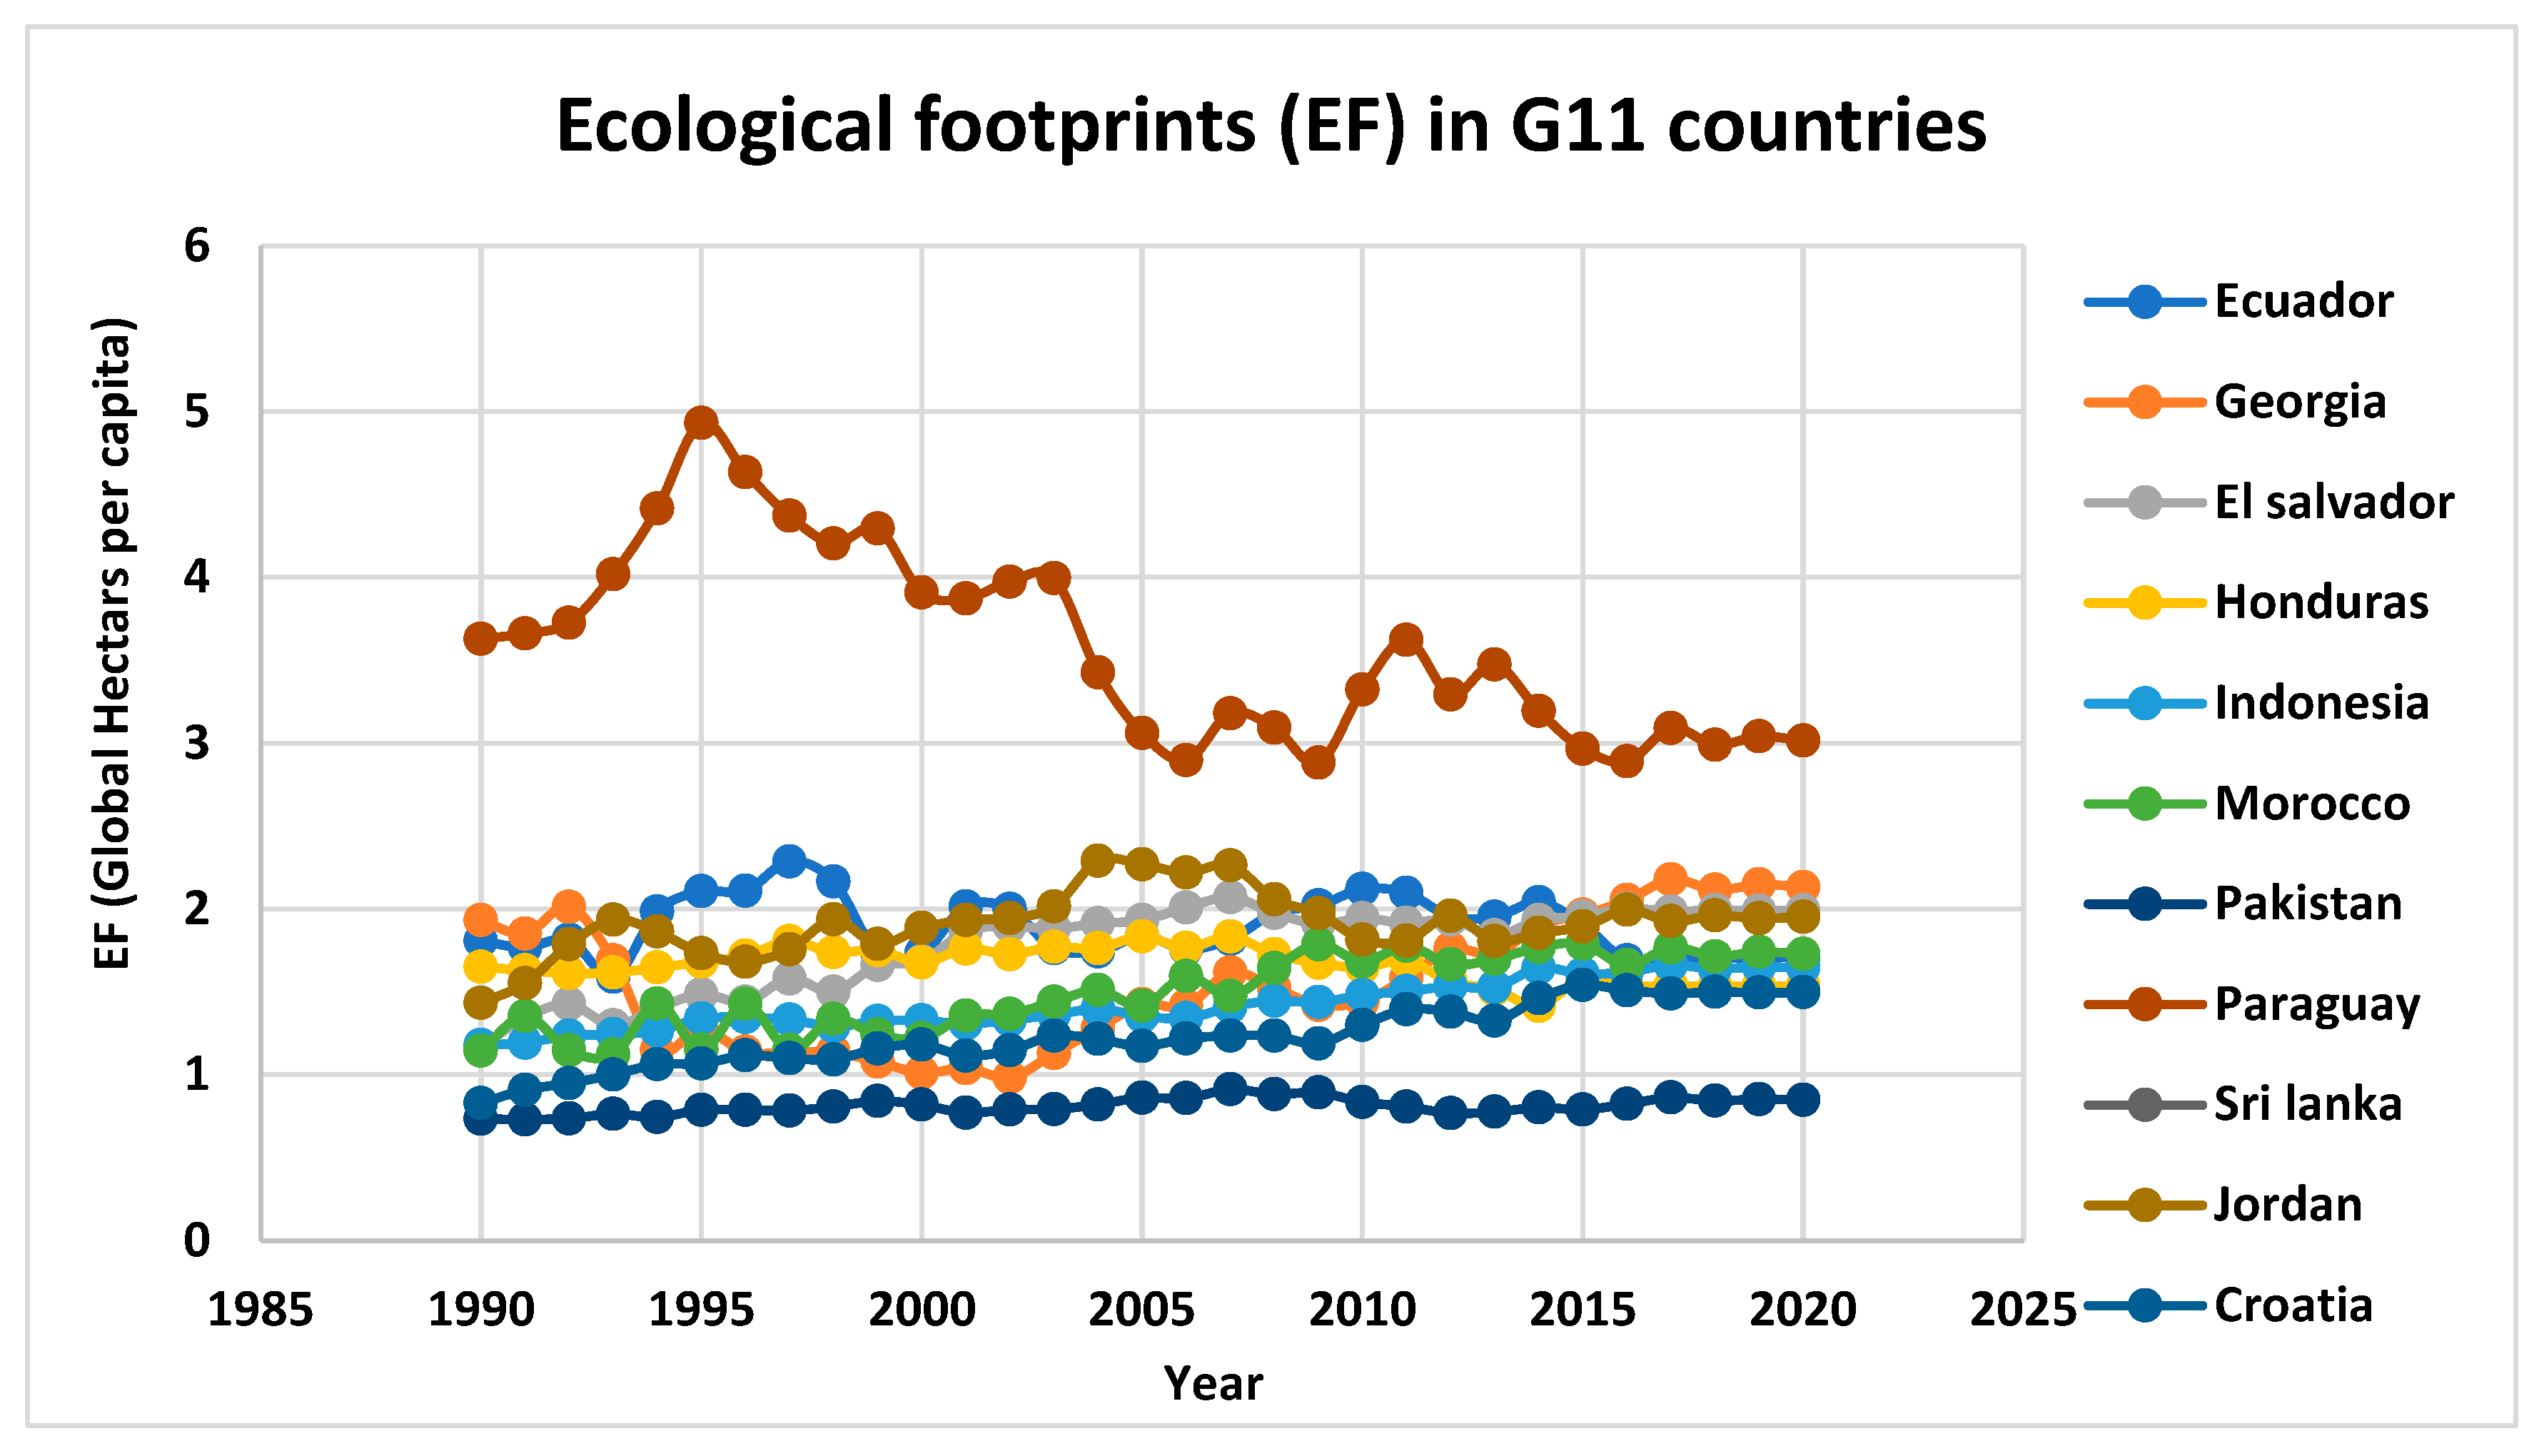
| Ecological footprints | EF | Global Hectars per capita | GFN |
| Communication technologies | ICT | Individuals using the internet (% of total population) | WDI |
| Gross Domestic Product | GDP | constant US dollars | WDI |
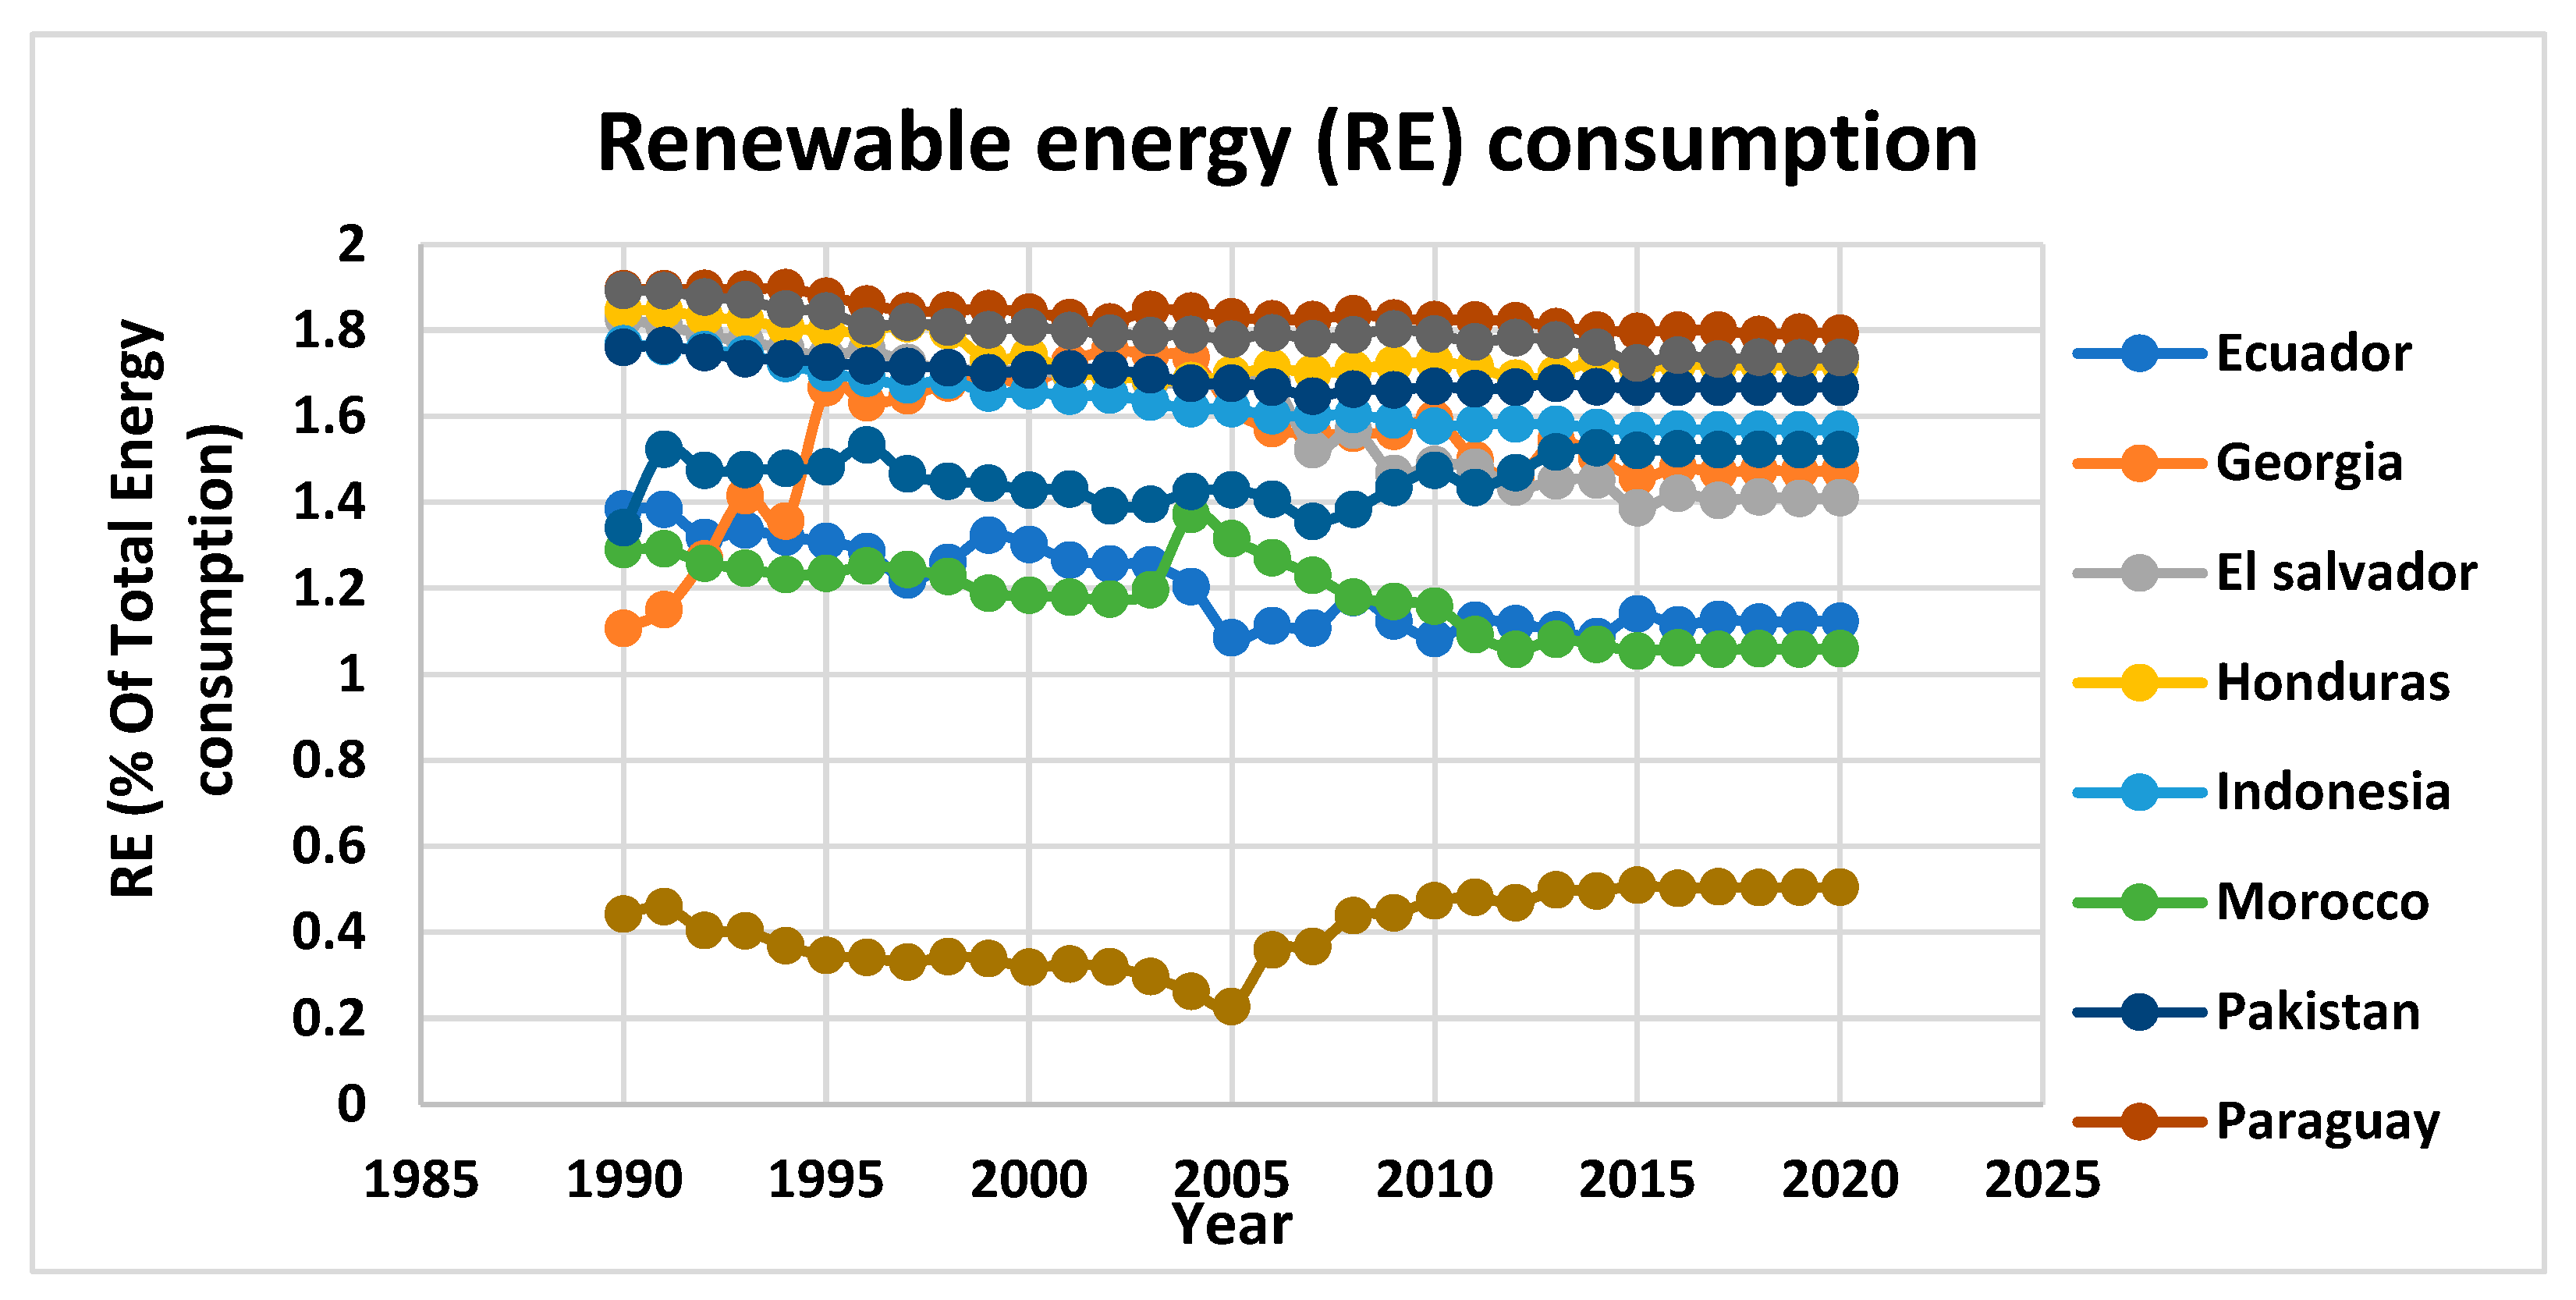
| Renewable Energy | RE | % Of Total Energy consumption | WDI |
| Governance | GOV | Government stability | ICRG |
| Median | Mean | Minimum | Maximum | Std. Dev. | |
|---|---|---|---|---|---|
| EF | 1.59 | 1.69 | 0.73 | 4.93 | 0.72 |
| GDP | 2979.01 | 3642.21 | 736.95 | 16,509.91 | 3084.79 |
| GE | 7.75 | 11.34 | 1.83 | 76.00 | 13.20 |
| ICT | 6.11 | 16.56 | 0.00 | 79.08 | 21.30 |
| RE | 39.94 | 38.43 | 1.69 | 79.15 | 21.17 |
| Variable | Test Statistics |
|---|---|
| EF | 23.63 *** |
| ICT | 37.30 *** |
| RE | 40.99 *** |
| GDP | 41.27 *** |
| GOV | 40.92 *** |
| Value | p Value | |
|---|---|---|
| Delta | 6.59 *** | 0.00 |
| adj | 7.29 *** | 0.00 |
| Variable | CADF Test | CIPS | ||
|---|---|---|---|---|
| I(0) | I(1) | I(0) | I(1) | |
| −2.47 | −4.43 *** | −2.79 ** | −5.57 *** | |
| −2.92 ** | −4.36 *** | −4.10 ** | −6.04 *** | |
| −2.02 | −4.04 *** | −2.14 | −5.58 *** | |
| −2.34 | −3.55 *** | −1.94 | −4.21 *** | |
| −2.75 ** | −4.27 *** | −2.97 *** | −5.55 *** | |
| Stat | Value | Z Value | p Value |
|---|---|---|---|
| Gt | −2.94 ** | −1.73 | 0.07 |
| Ga | −7.30 *** | 2.44 | 0.00 |
| Pt | −8.07 *** | −0.88 | 0.00 |
| Pa | −6.34 * | 1.29 | 0.09 |
| Short Run | Coefficient | ST Error | Prob |
|---|---|---|---|
| −0.10 ** | 0.02 | 0.00 | |
| −0.28 ** | 0.05 | 0.00 | |
| 0.70 ** | 0.04 | 0.00 | |
| −0.09 *** | 0.01 | 0.02 | |
| Long Run | |||
| −0.09 *** | 0.01 | 0.00 | |
| −0.12 *** | 0.07 | 0.06 | |
| 0.38 ** | 0.22 | 0.00 | |
| −0.05 ** | 0.01 | 0.00 | |
| ECM | −0.98 *** | 0.06 | 0.00 |
| Variables | AMG | FMOLS | DOLS | CCR |
|---|---|---|---|---|
| −0.04 ** | −0.03 ** | −0.05 *** | −0.01 *** | |
| −0.02 ** | −0.02 ** | −0.01 ** | −0.03 *** | |
| 0.45 *** | 0.07 ** | 0.21 ** | 0.08 ** | |
| −0.01 ** | −0.10 *** | −0.04 *** | −0.05 *** |
Publisher’s Note: MDPI stays neutral with regard to jurisdictional claims in published maps and institutional affiliations. |
© 2022 by the authors. Licensee MDPI, Basel, Switzerland. This article is an open access article distributed under the terms and conditions of the Creative Commons Attribution (CC BY) license (https://creativecommons.org/licenses/by/4.0/).
Share and Cite
Mehmood, U.; Agyekum, E.B.; Kotb, H.; Milyani, A.H.; Azhari, A.A.; Tariq, S.; Haq, Z.u.; Ullah, A.; Raza, K.; Velkin, V.I. Exploring the Role of Communication Technologies, Governance, and Renewable Energy for Ecological Footprints in G11 Countries: Implications for Sustainable Development. Sustainability 2022, 14, 12555. https://doi.org/10.3390/su141912555
Mehmood U, Agyekum EB, Kotb H, Milyani AH, Azhari AA, Tariq S, Haq Zu, Ullah A, Raza K, Velkin VI. Exploring the Role of Communication Technologies, Governance, and Renewable Energy for Ecological Footprints in G11 Countries: Implications for Sustainable Development. Sustainability. 2022; 14(19):12555. https://doi.org/10.3390/su141912555
Chicago/Turabian StyleMehmood, Usman, Ephraim Bonah Agyekum, Hossam Kotb, Ahmad H. Milyani, Abdullah Ahmed Azhari, Salman Tariq, Zia ul Haq, Arif Ullah, Kashif Raza, and Vladimir Ivanovich Velkin. 2022. "Exploring the Role of Communication Technologies, Governance, and Renewable Energy for Ecological Footprints in G11 Countries: Implications for Sustainable Development" Sustainability 14, no. 19: 12555. https://doi.org/10.3390/su141912555