

Reliability Analysis on Multiple Failure Modes of Underground Chambers Based on the Narrow Boundary Method

1
School of Resource Environment and Safety Engineering, Hunan University of Science and Technology, Xiangtan 411201, China
2
Work Safety Key Lab on Prevention and Control of Gas and Roof Disasters for Southern Coal Mines, Hunan Provincial Key Laboratory of Safe Mining Techniques of Coal Mines, Hunan University of Science and Technology, Xiangtan 411201, China
*
Authors to whom correspondence should be addressed.
Sustainability 2022, 14(19), 12045; https://doi.org/10.3390/su141912045
Submission received: 22 July 2022
/
Revised: 30 August 2022
/
Accepted: 8 September 2022
/
Published: 23 September 2022
(This article belongs to the Special Issue Mine Disasters Control and Synergetic Mining: Challenges to Mine Sustainability)
Abstract
:This paper proposes to study the stability of underground chambers while taking into account the nonlinear characteristics of geotechnical materials and pore water. According to the upper bound theorem of nonlinear limit analysis and the reliability theory, the failure mode and reliability model of underground chambers are established considering the pore water effect. The upper bound solution expression of the surrounding rock pressure in the underground chamber is deduced. The variation law of the surrounding rock pressure is analyzed under different parameters. At the same time, based on the narrow boundary method considering the correlation of multiple failure modes, the influence of different random parameters on the failure probability and reliability index of underground chambers is studied. The results show that the water-level line height, pore water pressure coefficient and Hoek-Brown failure criterion parameter have significant effects on the surrounding rock pressure and underground chamber reliability. In addition, the concept of the safety level is introduced, and the minimum-support force range of the underground chamber with safety level 1 is obtained under different random parameters. The research results can provide a theoretical basis and reference for the structural safety evaluation of underground chambers.
1. Introduction
With the large-scale utilization of ground space around the world, the original ground space has long been unable to meet development needs. The use of subterranean space and its development have reached the status of national development strategies [1,2], resulting in a large number of underground chamber projects. After the underground chamber is excavated, the original stress balance condition of the rock mass is broken, and the surrounding rock will redistribute the stress, causing various deformations and damages such as tension, compression and shearing of the surrounding rock [3,4]. Therefore, it is very important to maintain the stability of the underground chamber as the surrounding rock pressure of the chamber is studied under the limit state.
In order to ensure that performing the normal function of the underground chamber during the service cycle, it is necessary to clarify the ultimate load of the surrounding rock of the underground chamber, and a reliable channel for calculating the ultimate failure load of the surrounding rock of the chamber is provided by the limit analysis method [5,6,7,8,9]. The subsidence range of the overlying coal seam in the roadway under the influence of mining based on the key layer theory was predicted by Sun et al. [10], and the movement and failure laws of the coal seam were revealed. The upper bound theorem and H-B strength criterion were combined by Wang et al. [11], whose influence was studied on different parameters of the roof collapse range of rectangular chambers and circular chambers. The high-order element adaptive upper bound finite element method was constructed by Sun et al. [12], whose failure mode and upper bound solution of the tunnel were studied. Aimed at the deep chamber in unsaturated soil, the upper bound method and the nonlinear M-C failure criterion were combined by Zhao et al. [13], and the safety factor of a deep chamber was obtained. An improved failure mechanism of surrounding rock in underground chambers was constructed by Zhang et al. [14] under the kinematic theory of the upper bound theorem. Liu et al. [15] proposed the Baker failure criterion in the constructed underground chamber failure model, and the potential collapse range of the underground chamber was predicted. The two-dimensional finite multi-block translational failure model of loess tunnels was constructed for the pore water effect by Yu et al. [16], and the overall safety factor of tunnels and the corresponding slip surface were solved. Huang et al. [17] considered the influence of the hidden karst cave formed by groundwater erosion on the chamber, the two-dimensional collapse failure mechanism of underground chambers with the karst cave was established, and the roof failure shape and scope of underground chambers were studied to be induced by the hidden karst cave via the upper bound method.
None of the above research has considered the parameter randomness effect on the underground chamber stability, but the rock and soil parameter is often very random in practical engineering. Therefore, some scholars have merged the limit analysis method and reliability theory for the stability evaluation of underground chambers [18,19]. The random response surface method was applied to these velocity fields by Mollon et al. [20], and the failure probability was computed when the shield tunnel face was unstable. The randomness of rock and soil parameters was considered by Zhang et al. [21,22,23], and the optimal support force range of shield tunnel faces was obtained by the response surface method. The tunnel face failure mechanisms were constructed by Pan and Dias [24] via the upper bound method, and the failure probability variation of tunnel faces was studied under the influence of randomness and spatial variability. A stochastic limit method was proposed by Cheng et al. [25], and its influence on reliability and failure probability under different soil conditions was discussed through parameter analysis. The critical safety distance of double shallow buried tunnels was explored by Zhang et al. [26], and the safety factors of different safety distances for double shallow buried tunnels were analyzed by the reliability theory. The supporting effect and parameter uncertainty of the rock roadway support system were considered by Lü et al. [27], the rock roadway support system reliability with various failure modes through the response surface method. Luo and Li [28] combined with the upper bound method of nonlinear failure criteria, the effect of the different parameter variability on the failure probability of underground chambers by the response surface method.
The above studies rarely consider the nonlinear characteristics of geotechnical materials, pore water effects and parameter randomness at the same time, and it is difficult to accurately and comprehensively analyze the stability of underground chambers under natural geological conditions. In this paper, comprehensively considering the nonlinear failure characteristics of geotechnical materials and pore water effect, the surrounding rock pressure of underground chambers is calculated by the upper bound method of limit analysis, and the influence of various random parameters on the reliability of underground chambers is studied according to the narrow boundary method of the correlation of multiple failure modes. It is expected to give a new method for accurately analyzing the safety of surrounding rock in underground chambers.
2. Upper Bound Method under the Pore Water Pressure
To investigate the influence of pore water pressure on geotechnical engineering stability, Viratjandr and Michalowski [29] regarded pore water pressure as an external force load and introduced it into the upper bound calculation of limit analysis. Because of the simple calculation process and clear physical meaning of this method, this method has been widely used in the study of the pore water effect on the stability of geotechnical engineering. The work done by the pore water pressure mainly occurs on the soil mass skeleton and on the discontinuity of the failure body in the motion permitting velocity field. Since the failure mechanism is treated as a rigid body in the calculation, the pore water power Pu is as follows:
In the above formula, ui is the pore water pressure, vi is the velocity field at any point in the failure body, ni is the normal vector on the velocity discontinuity of the failure body and S is the boundaries of the failure body.
The upper bound theorem under the pore water pressure is as follows [30]:
In the preceding formula, is the stress tensor, is the surface force on the boundary, is the volume force, is the volumetric strain rate of the failure body and V is the failure body volume.
3. Hoek-Brown Failure Criterion
Hoek and Brown [31,32] obtained the final expression of the Hoek-Brown failure criterion through numerous rock mechanics experiments and field tests of rock mass, and after constant correction and improvement:
In the formula: σ1 and σ3 represent the maximum principal stress and the minimum principal stress when the rock mass is damaged, respectively, and σci represents the uniaxial compressive strength. mb, S and a are all dimensionless parameters. The three expressions are as follows:
In the above formula, mi is the rock mass constant, GSI is the geological strength index to characterize the structural integrity of rock mass and D is the disturbance factor. For the upper bound solution of underground chambers under the Hoek-Brown failure criterion, the “tangent method” should be used to obtain its supporting force, in which the relationship between ct and φt can be written as [33,34]:
In the preceding formula, the internal friction angle φt is optimized by the principle of minimum energy consumption when calculating the upper limit, and ct is obtained by Equation (7) after φt is determined.
4. Calculation of the Upper Bound Solution of Surrounding Rock Pressure
4.1. Failure Mode and Velocity Field
The failure mode of underground chambers proposed in reference [14] did not consider the comprehensive influence of pore water and nonlinear characteristics of geotechnical materials, and the results often had a certain deviation from the actual engineering. In order to overcome this shortcoming, the basic requirements of the upper bound theorem are combined in the paper. When considering the pore water effect and the nonlinearity of geotechnical materials, the failure mechanism consisting of “Downward sliding wedge-shaped collapse body + Rotating circular arc body with the vertex angle as the center of a circle + Three translational triangles” is established. As seen in Figure 1 below.
As in Figure 1a, since the failure mechanism is symmetrical about the center line, half of the destruction mechanism can be used for derivation and calculation. In all the calculation formulas below, γ represents the rock mass gravity, ct represents the rock mass cohesion, φt is the internal friction angle, l is the chamber width, h is the chamber height, z is the water level line height, q is the roof supporting force (the surrounding rock pressure), e is the two gangs supporting force and K represents the lateral pressure coefficient. α1, α2, α3 and α4 are angles.
4.2. Calculation Process
4.2.1. Calculation of Velocity Field in Underground Chamber Failure Mode
By analyzing the rotating circular arc body and the velocity vector connection between each failure block in Figure 1, it can be seen that:
4.2.2. External Power Calculation
In this paper, the external power is composed of three parts: gravity power, pore water power and support force power. According to the constructed failure mode of the underground chamber, let the and . From the geometric relationship, the boundary line length relationship of different failure blocks is as follows: , , , , , , and . Among them .
- Gravity power
The quadrilateral rigid block ABGO:
The triangular rigid block GCD:
The triangular rigid block GDE:
The triangular rigid block GEF:
- 2.
- Pore water power
According to Equation (1), all the work done by the pore water pressure occurs on the velocity discontinuity line. The total power of pore water pressure can be obtained by accumulating the pore water power on all velocity discontinuity lines.
(1) The length of each auxiliary line is calculated as follows:
(2) The power of pore water pressure on each velocity discontinuity line is as follows:
The power of pore water pressure in the discontinuity line AB as:
The power of pore water pressure in the discontinuity line BG as:
The power of pore water pressure in the discontinuity line CG as:
The power of pore water pressure in the discontinuity line BC as:
The power of pore water pressure in the discontinuity line CD as:
The power of pore water pressure in the discontinuity line DG as:
The power of pore water pressure in the discontinuity line DE as:
The power of pore water pressure in the discontinuity line GE as:
The power of pore water pressure in the discontinuity line EF as:
- 3.
- Support pressure power
In the above formula:
- 4.
- External total power
To sum up, the external total power Wext can be expressed as:
4.2.3. Internal Energy Dissipation Power
The energy dissipation power along the discontinuity line AB as:
The internal energy dissipation power in the discontinuity surface BC of the rotating circular arc body and the failure region as:
The energy dissipation power along the discontinuity line CD as:
The energy dissipation power along the discontinuity line GD as:
The energy dissipation power along the discontinuity line DE as:
The energy dissipation power along the discontinuity line GE as:
The energy dissipation power along the discontinuity line EF as:
To sum up, the internal energy dissipation total power Dint can be expressed as:
4.2.4. Calculation of Support Force
According to the virtual work principle, the analytical formula of the roof supporting force q (the surrounding rock pressure) can be expressed as:
4.3. Reliability Model
The failure of the roof or sidewall of the underground chamber is seen as the failure of the structural system of the underground chamber. A situation in which only one failure occurs between the roof or sidewall of the underground chamber is called a single failure mode. The situation in which the roof and sidewall failures of the underground chamber are considered at the same time is called multiple failure modes. When analyzing the structural system reliability of underground chambers, it is vital to clarify the limit states of different failure modes and the correlation between them. Hence, it is more scientific and logical to investigate the stability of the underground chambers by using the wide boundary method and narrow boundary method with multiple failure modes [35]. Meanwhile, compared with the wide boundary method and the narrow boundary method, because the correlation between failure modes was considered while considering the different failure modes of the chamber by the narrow boundary method, the results obtained are better than the wide boundary method [36]. Therefore, the reliability of the underground chamber was mainly studied based on the narrow boundary method of the correlation of multiple failure modes in the paper.
4.3.1. Limit State Equation
According to Equation (74) and , the expressions of e is:
Now it is assumed that the support pressure of the roof and sidewall of the underground chamber is σT, the functional functions of the roof and sidewall of the underground chamber are respectively:
In the above formula, and represent the functional functions, and X represents a random variable, namely
4.3.2. Reliability Model under Multiple Failure Modes
The reliability model of the underground chamber under multiple failure modes is:
The failure probability Pf of the underground chamber under multiple failure modes is:
The reliability index β of the underground chamber under multiple failure modes is:
5. Comparison with or without Pore Water
In order to study the influence of the pore water effect on surrounding rock pressure q in the failure mode of underground chambers constructed in this paper, the situations without pore water (ru = 0) and the situations with pore water (ru = 0.1–0.5) are compared and analyzed. Other parameters are: γ = 18–26 kN/m3, K = 1, l = 6 m, h = 5 m, GSI = 15, mi = 10, σci = 400 kPa, D = 0 and z = 60 m. The calculation results of surrounding rock pressure of underground chamber under different rock mass gravity and pore water effect are shown in Table 1, and the relevant data in Table 1 are drawn in Figure 3. As shown in Figure 3, the surrounding rock pressure q of the chamber increases nonlinearly with the increase in the pore water pressure coefficient ru. Based on the rock mass gravity γ = 24 kN/m3 as an example, the average difference between the surrounding rock pressure of the underground chamber calculated by considering pore water and the calculation result without pore water is 234.91 kPa, the average difference of surrounding rock pressure under different pore water pressure coefficients of other groups is both more than 200 kPa. The analysis shows that the existence of pore water will have a considerable impact on the surrounding rock pressure of the underground chamber.
6. Result Analysis
6.1. Underground Chamber Surrounding Rock Pressure without Considering Parameter Randomness
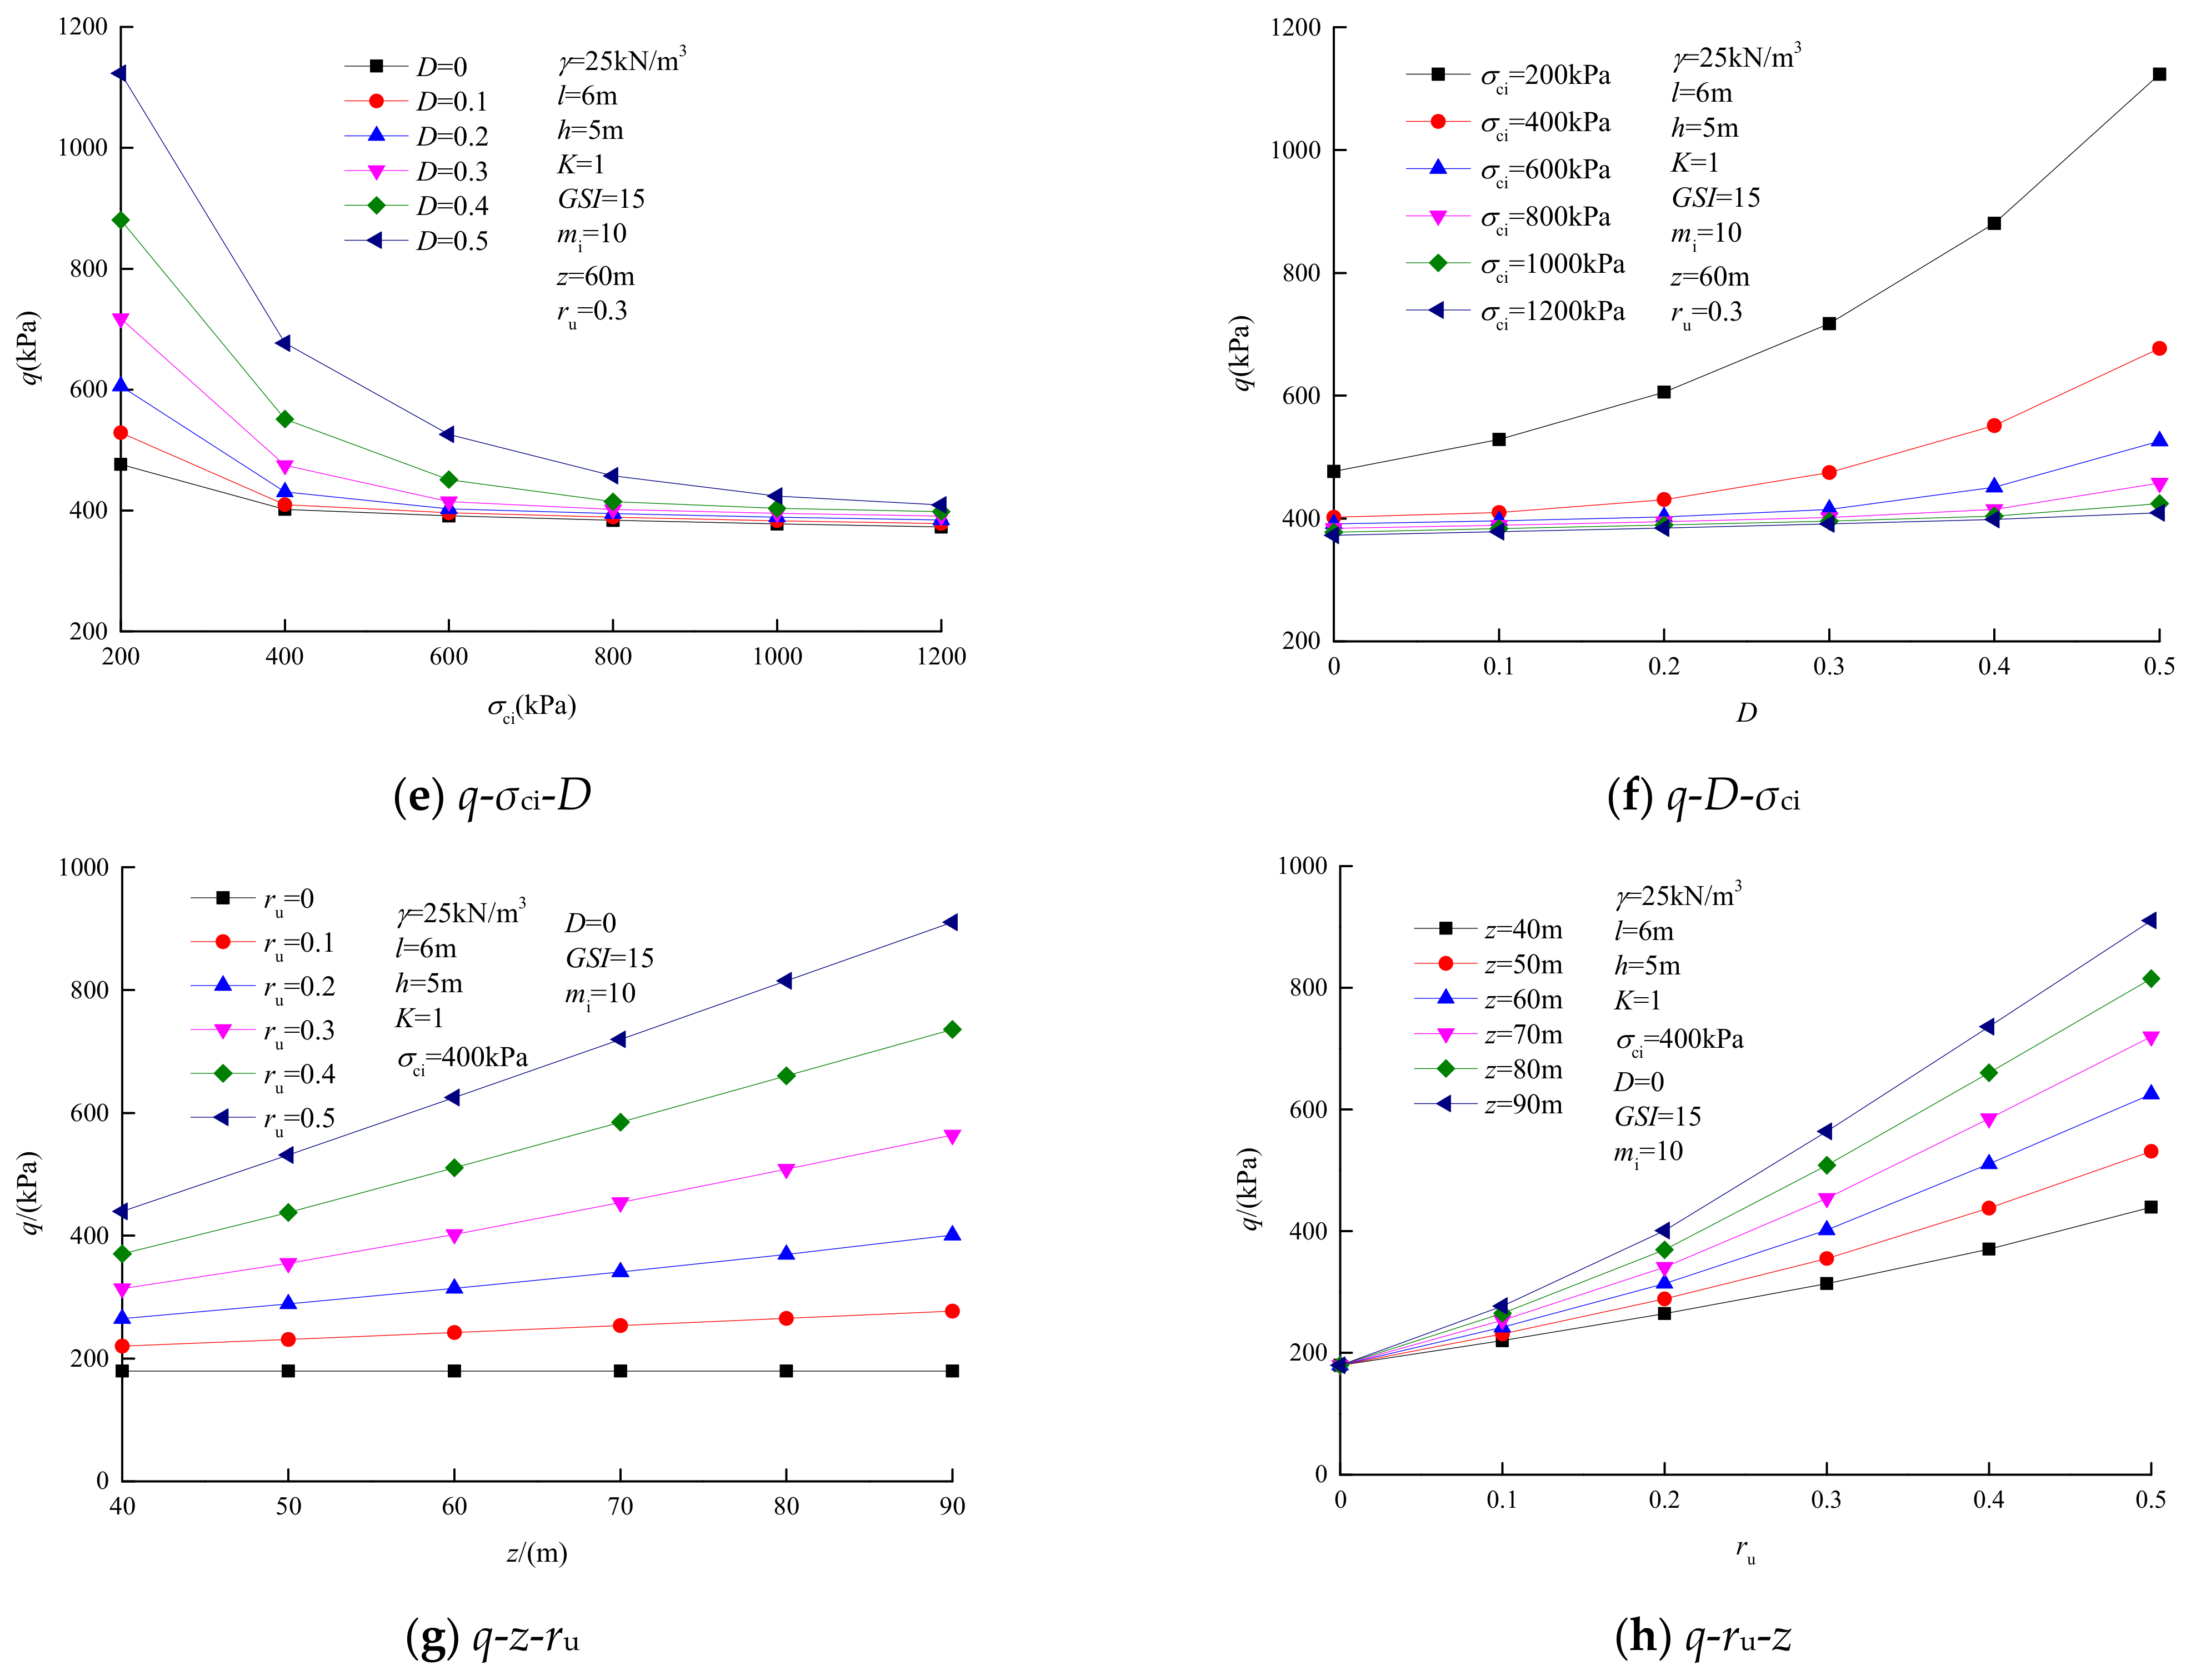
The surrounding rock pressure of underground chambers under the Hoek-Brown failure criterion and pore water was investigated without considering the randomness of parameters. Among them: γ = 18 kN/m3–26 kN/m3, K = 0.6–1.4, GSI = 10–35, mi = 5–30, σci = 200 kPa–1200 kPa, D = 0–0.5, ru = 0–0.5, z = 40 m–90 m and l × h = 6 m × 5 m. The calculation result of the surrounding rock pressure q of the underground chamber is shown in Figure 4 under various effect parameters.
When K is constant, the surrounding rock pressure q of the underground chamber increases with the increase in the rock mass gravity γ, as illustrated in Figure 4a. This indicates that we need to reinforce the support when excavating the chamber in the surrounding rock with a large weight to avoid the chamber collapsing. When the rock mass gravity γ is constant, as shown in Figure 4b, the roof pressure of the underground chamber nonlinearly decreases from steep to slow as the lateral pressure coefficient K increases. As shown in Figure 4c,d, as the geological strength index GSI and the rock mass constant mi increase, the surrounding rock pressure q of the underground chamber decreases in a nonlinear manner. Figure 4c shows that when the geological strength index GSI increases under a certain mi, the surrounding rock pressure of the chamber decreases significantly at first, then gradually. This is because when the GSI increases, the integrity of the rock mass improves, thereby reducing the support force necessary to maintain the stability of the chamber. Figure 4d analysis reveals that the overall changing trend is comparable to Figure 4c; when GSI is constant, as the rock mass constant mi increases, the surrounding rock pressure in the underground chamber decreases, so does its variation rate. This reflects that the rock mass constant mi represents the quality of the surrounding rock. When mi is small, the surrounding rock condition is poor but, as mi increases, the surrounding rock condition improves, the surrounding rock self-stability is enhanced, and the chamber surrounding rock pressure decreases significantly. When the disturbance factor D is constant, the surrounding rock pressure q decreases from sharp to sluggish as the uniaxial compressive strength σci increases, as shown in Figure 4e, and this tendency is more visible when the disturbance factor D is large. This shows that the surrounding rock with good compressive capacity has good bearing capacity and strong self-stability, and that the support force to maintain the chamber stability is more minimal. As shown in Figure 4f, when the uniaxial compressive strength σci remains unchanged, the surrounding rock pressure q of the chamber increases nonlinearly with the growth of the disturbance factor D. The negative impacts of blasting and other vibration loads on the underground chamber should be considered throughout the excavation and design of the chamber, and the supporting measures of the chamber should be improved. When ru ≠ 0, that is, when the pore water effect occurs, the surrounding rock pressure q increases with the uplift of water-level line height z, as shown in Figure 4g. When the water level line height z is constant, as shown in Figure 4h, the surrounding rock pressure q of the chamber increases nonlinearly with the increase in the ru. This suggests that the negative impact of pore water effect on the stability of surrounding rock should be considered emphatically for underground chambers excavated in water-rich layers.
6.2. Influence of Different Random Parameters on Underground Chamber Reliability
6.2.1. Random Variable Statistical Features
For further analysis, the reliability of underground chambers under the pore water effect on the basis of the surrounding rock pressure of underground chambers. The influence of parameter randomness is considered on the stability of underground chambers in this paper, and the failure probability Pf and reliability index β of underground chambers are analyzed based on the reliability theory by using the narrow boundary method with the correlation of multiple failure modes. When the randomness of rock parameters and supporting force have been studied, relevant scholars have determined the value range of the parameters and determined that their distribution pattern was the normal distribution [18,19,32]. Therefore, according to the existing results, it is assumed that the statistical features of the main parameters and support forces are shown in Table 2. The values of other relevant parameters are as follows: l = 6 m, h = 5 m and K = 1.
6.2.2. The Influence of Rock Mass Gravity
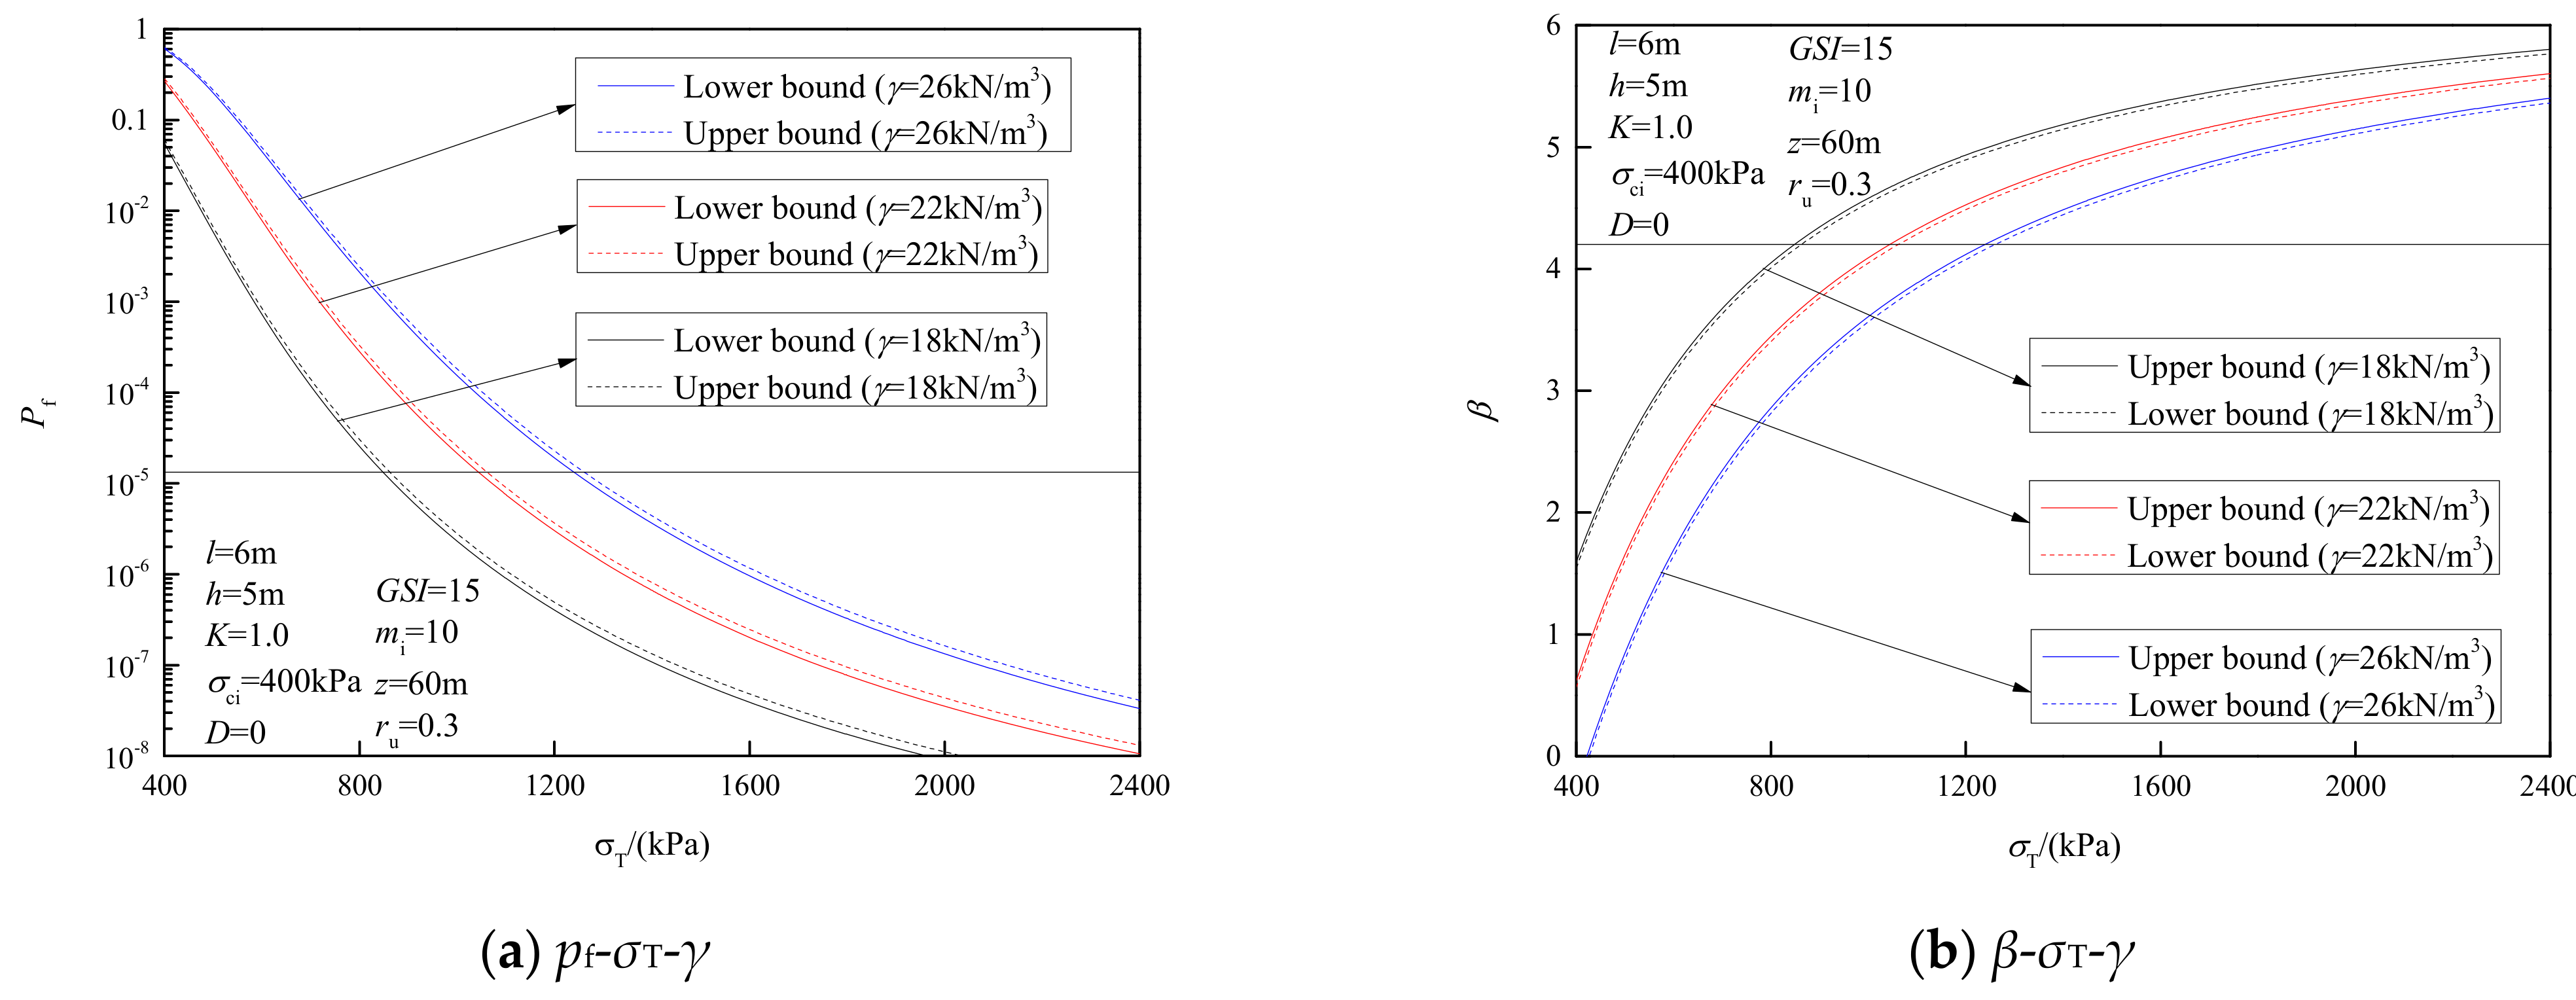
In order to examine the influence of rock mass gravity γ on the reliability of underground chambers, the failure probability Pf and reliability index β of underground chambers are calculated by using the narrow boundary method under different rock mass weights γ. Other relevant parameters are as follows: l = 6 m, h = 5 m, K = 1, GSI = 15, mi = 10, σci = 400 kPa, D = 0, z = 60 m and ru = 0.3. Figure 5 depicts the effect of varied rock mass gravity γ on the dependability of underground chambers. According to Figure 5, the failure probability Pf of underground chambers decreases nonlinearly from steep to slow as the mean value of support force σT increases, and the reliability index β increases nonlinearly. The failure probability Pf of underground chambers increases as the rock mass gravity γ increases for a certain mean value of support force, but the reliable index β decreases. Therefore, it is necessary to increase the support force to maintain the stability of the chamber for the underground chamber with heavy rock mass gravity. Meanwhile, the concept of the safety level of underground chambers is introduced in Figure 5. The failure probability Pf = 1.3 × 10⁻⁵ or the dependability index β = 4.2 when the safety level is 1. Since the results obtained by the narrow boundary method have upper and lower boundaries, the minimum support force range required to maintain the stability of underground chambers under the influence of different rock mass gravity γ when the safety level is 1 can be obtained, as shown in Table 3. This range of support forces can serve as a theoretical basis and reference for underground chamber design. Furthermore, when analyzing whether the case of parameter randomness is considered, taking the rock mass weight γ = 22 kN/m3 as an example, when the parameters randomness is not considered, the upper bound solution of the support force of underground chambers is 349 kPa. When the parameter randomness is considered, it can be seen from Figure 5 that the corresponding support force ranges are 460–466 kPa, 586–593 kPa, 718–728 kPa and 874–887 kPa when the failure probability Pf = 0.1, 0.01, 0.001 and 0.0001, respectively. And the failure probability Pf = 1.3 × 10⁻⁵, that is, when the safety level is 1, the support force range required to maintain the stability of underground chambers is 1043–1063 kPa. To sum up, the support force range obtained when the parameter randomness is considered, is significantly larger than the support force 349 kPa obtained by the fixed value method. This shows that even with a sufficient support force, the underground chamber engineering still has a high probability of instability. On the contrary, the underground chamber engineering with an insufficient supporting force may also be in a stable state. Therefore, considering the randomness of rock parameters and external loads, the reliability theory is used for analysis, in which the actual working state of underground chamber engineering could be more accurately reflected, thereby the instability risk of underground chamber engineering was effectively reduced by increasing the size of the supporting force.
6.2.3. The Influence of Hoek-Brown Criteria Parameters
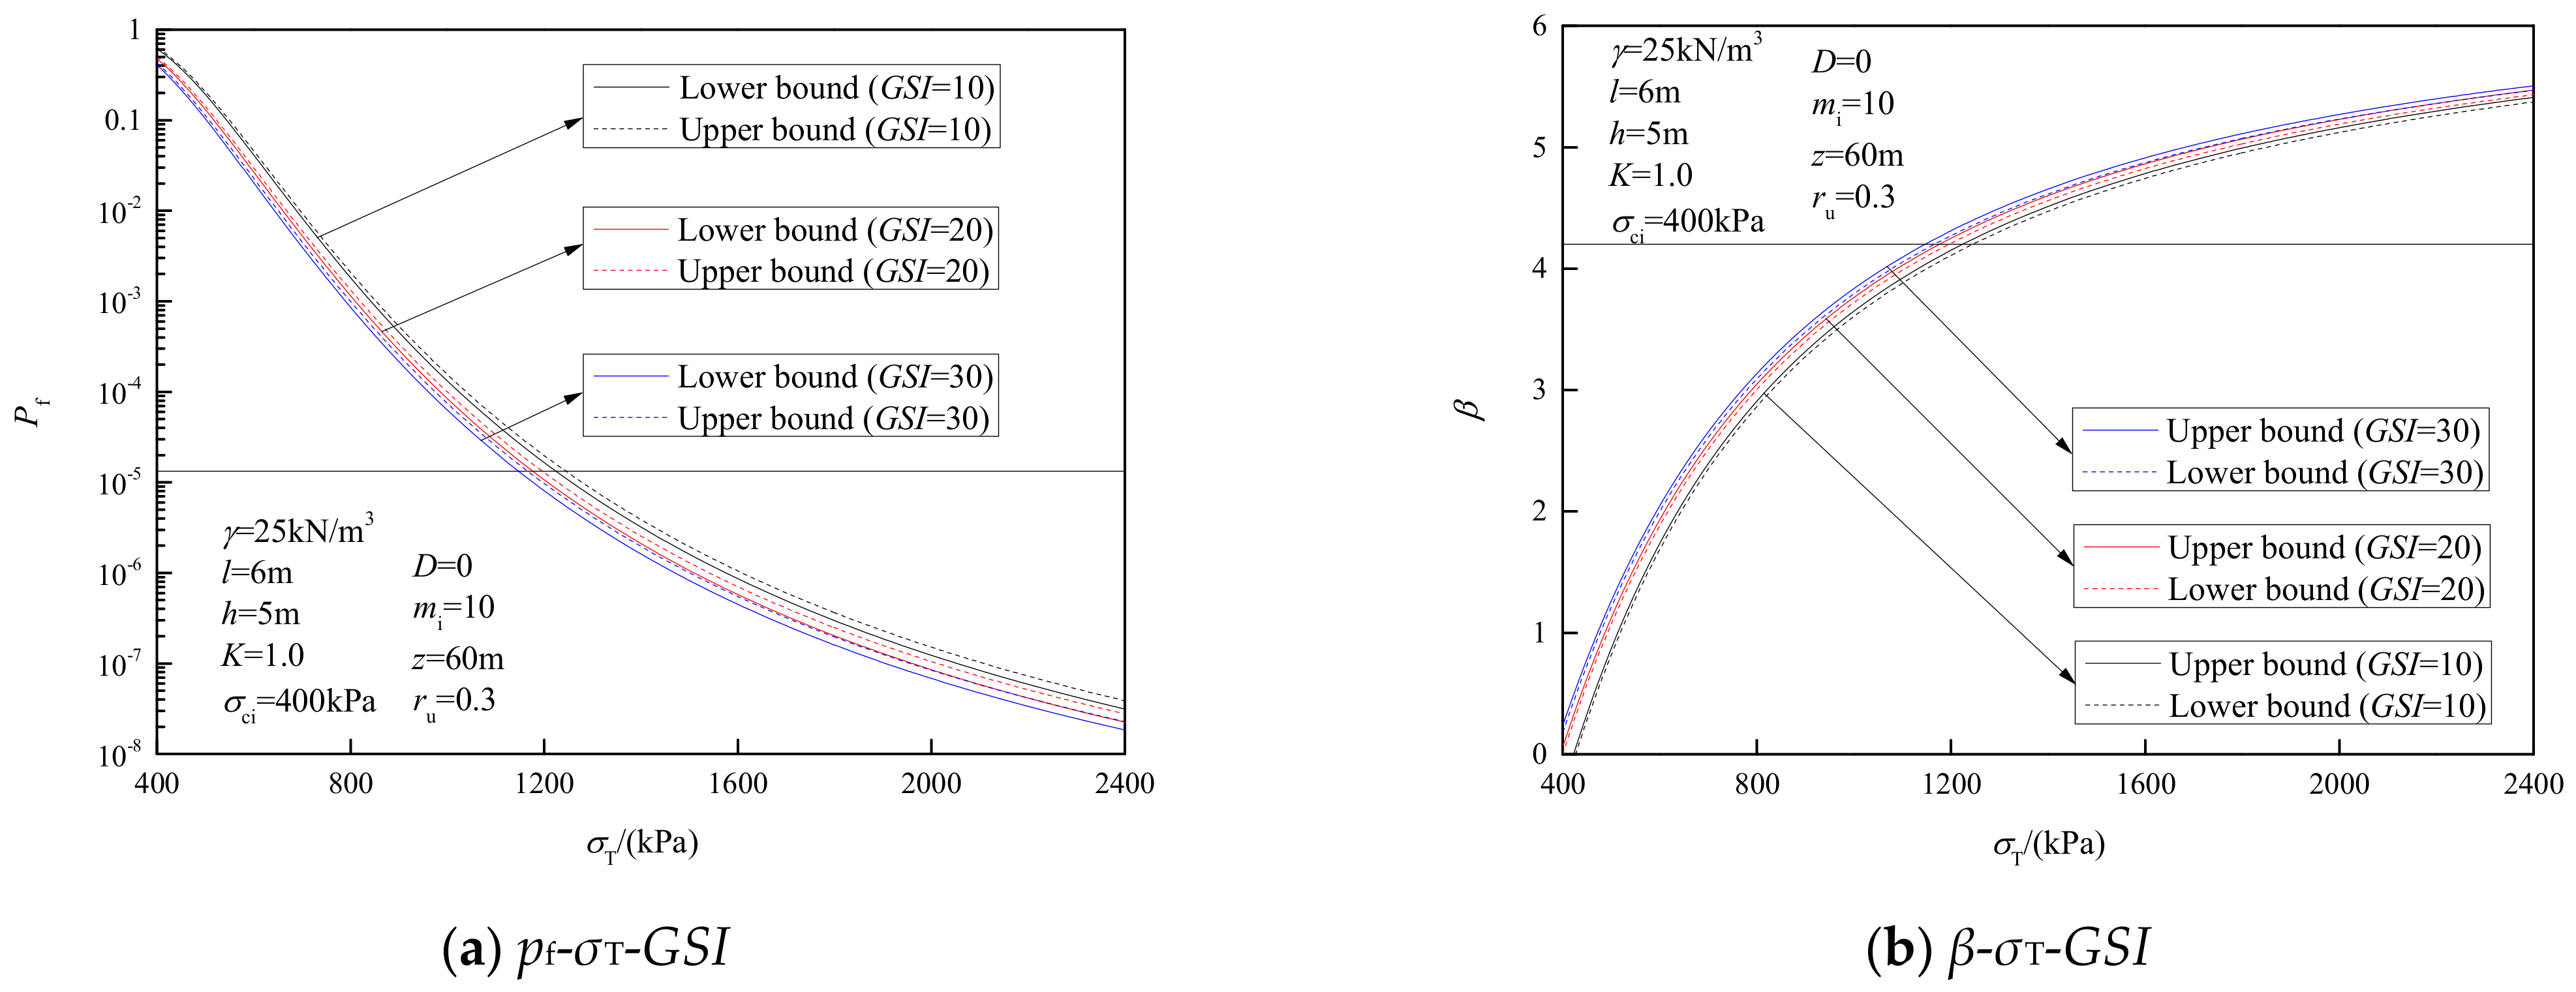
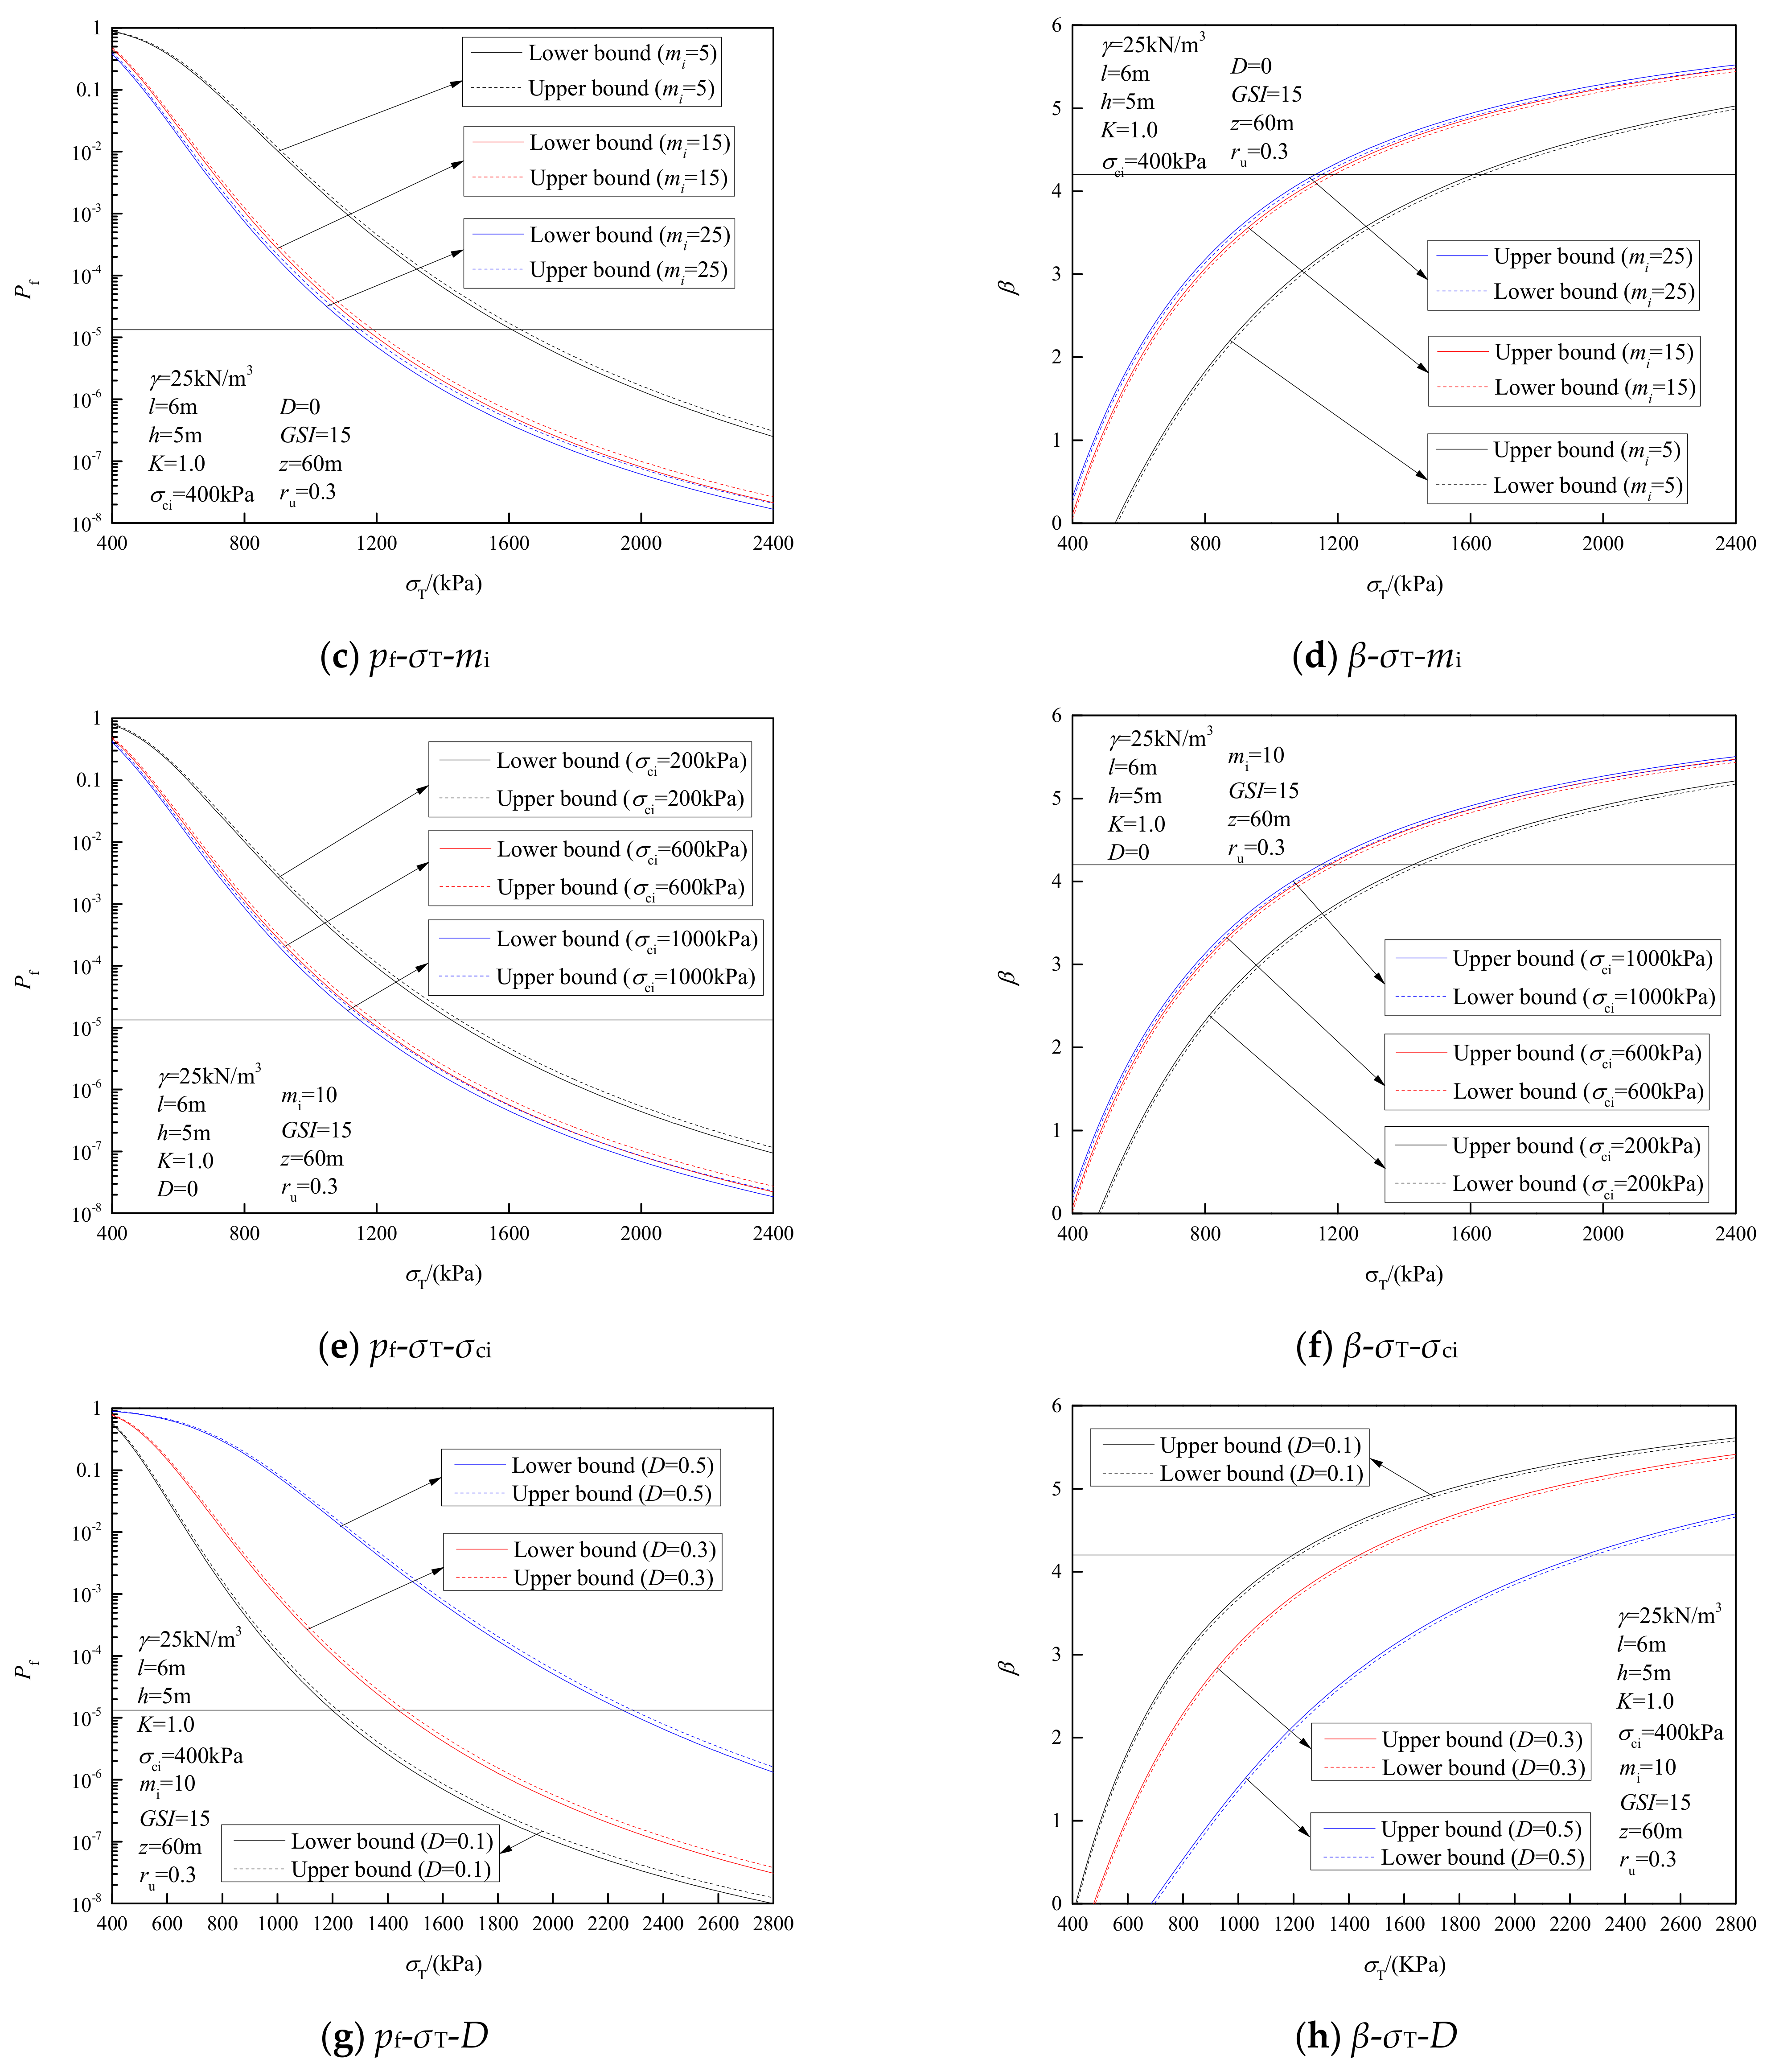
To investigate the influence of Hoek-Brown criterion parameters on the reliability of underground chambers, the failure probability Pf and reliability index β of underground chambers are calculated by using the narrow boundary method under different Hoek-Brown criterion parameters. Parameters such as GSI, mi, σci and D are assumed as random variables respectively. Other relevant parameters are: γ = 25 kN/m3, l = 6 m, h = 5 m, K = 1, z = 60 m and ru = 0.3. The effect of different Hoek-Brown criteria parameters on the underground chamber reliability is depicted in Figure 6. In Figure 6, the failure probability Pf of underground chambers decreases nonlinearly as the mean value of support force σT increases, and the reliability index β increases rapidly at first and subsequently slowly. From Figure 6a–f, it can be observed that for a certain mean value of support force, with the increase in GSI, mi and σci, the failure probability Pf of underground chambers decreases and the reliability index β increases. This is due to GSI, mi and σci increasing, which means that the surrounding rock of the underground chamber becomes better and the self-stability of the chamber is improved. From Figure 6g–h, when the mean value of support force remains unchanged, as the disturbance factor D increases, the failure probability Pf of underground chambers increases, and the reliability index β decreases. It implies that the excavation of underground chambers is more likely to be prone to instability failure under the environment with strong disturbance factors, thus should be avoided during the excavation of underground chambers big disturbance. Meanwhile, the concept of the safety level of underground chambers is introduced in Figure 6. The minimum support force range required to maintain the stability of underground chambers under different Hoek-Brown criterion parameters can be obtained when the safety level is 1 (Pf = 1.3 × 10⁻⁵ or β = 4.2), and the statistics are shown in Table 4.
6.2.4. The Influence of Pore Water
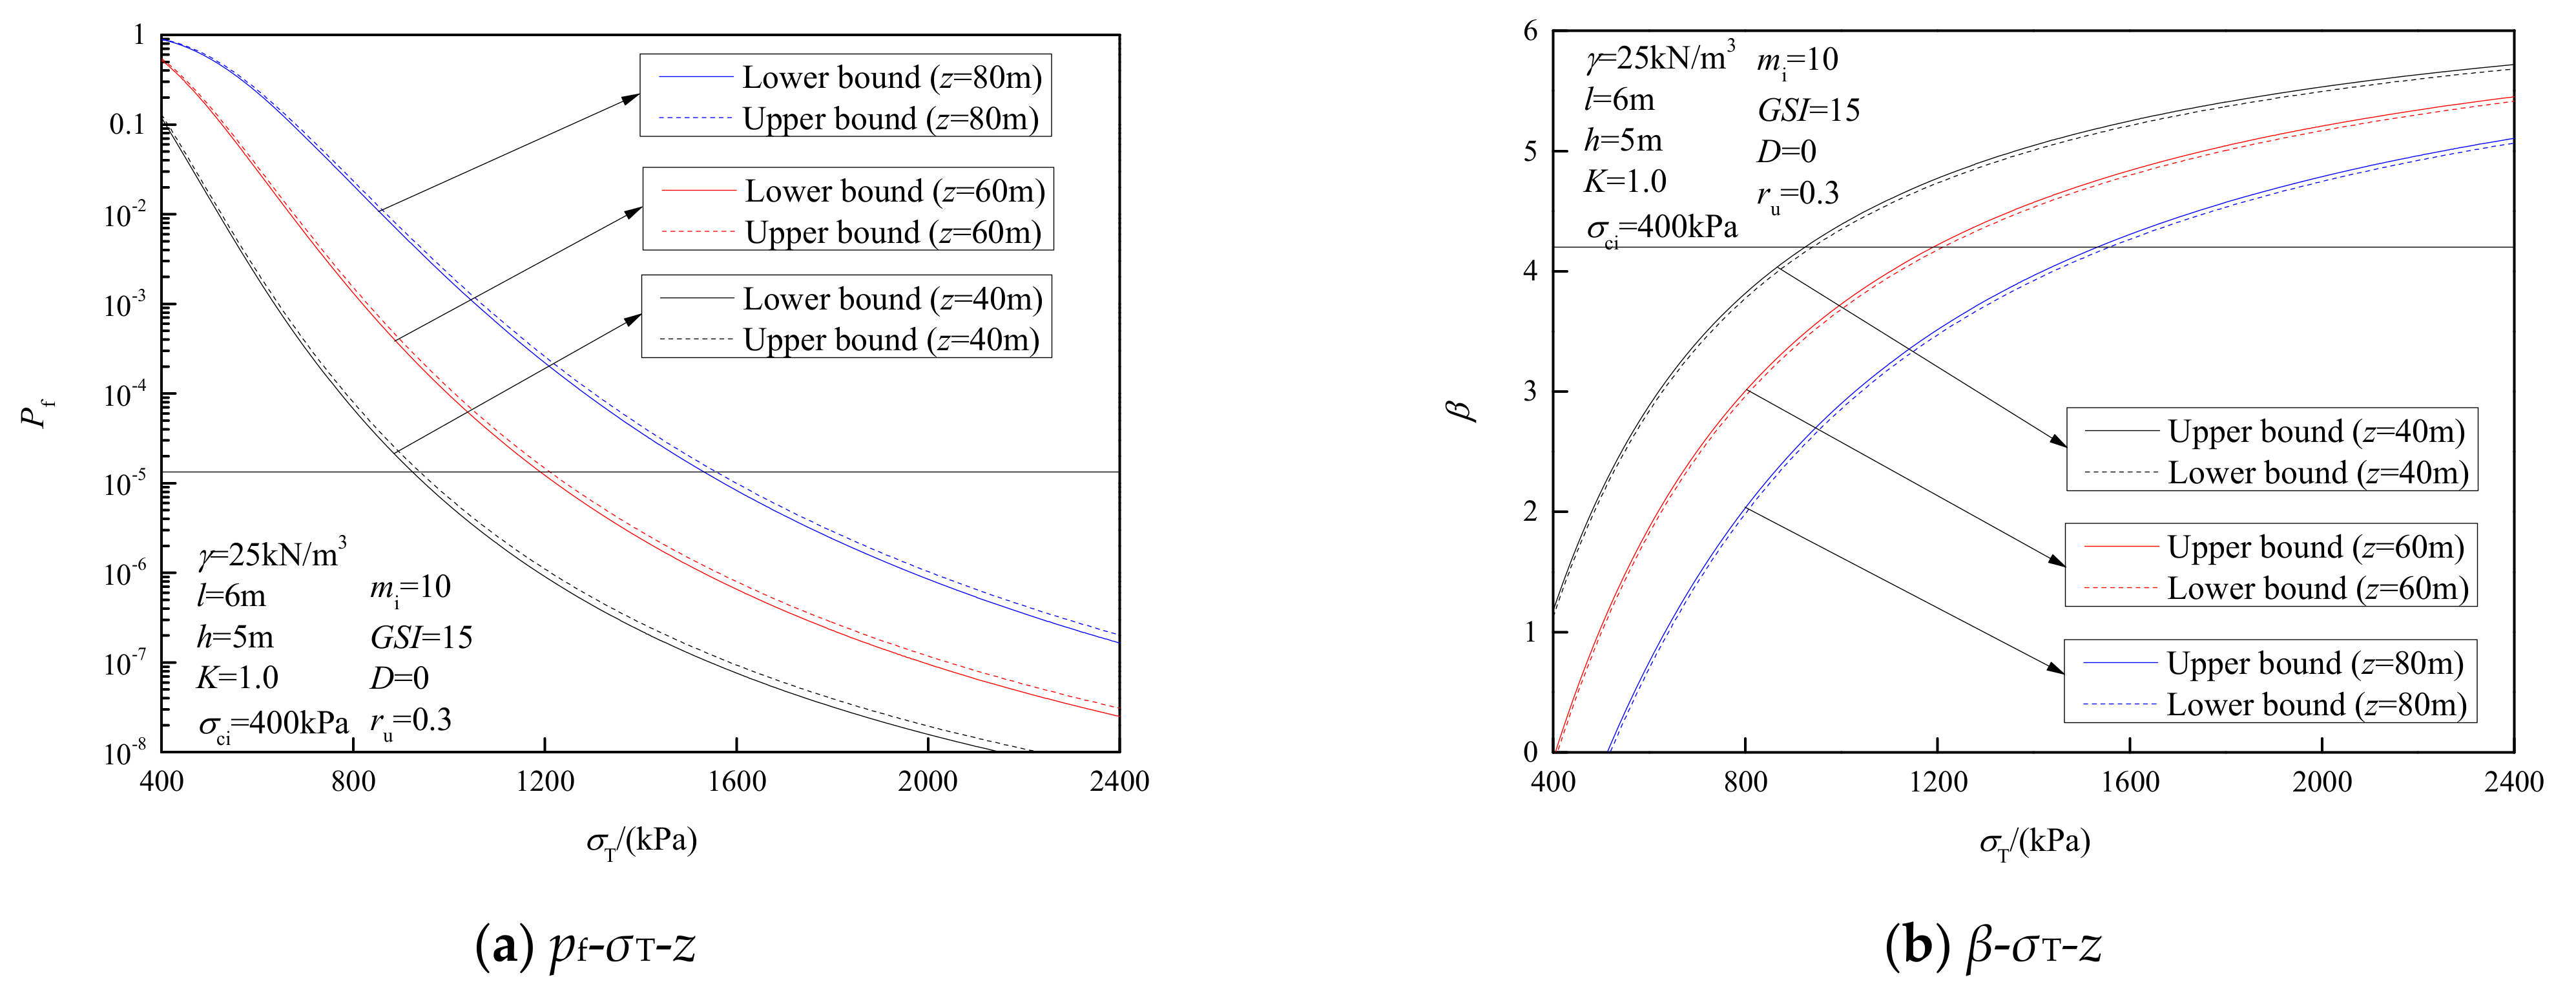
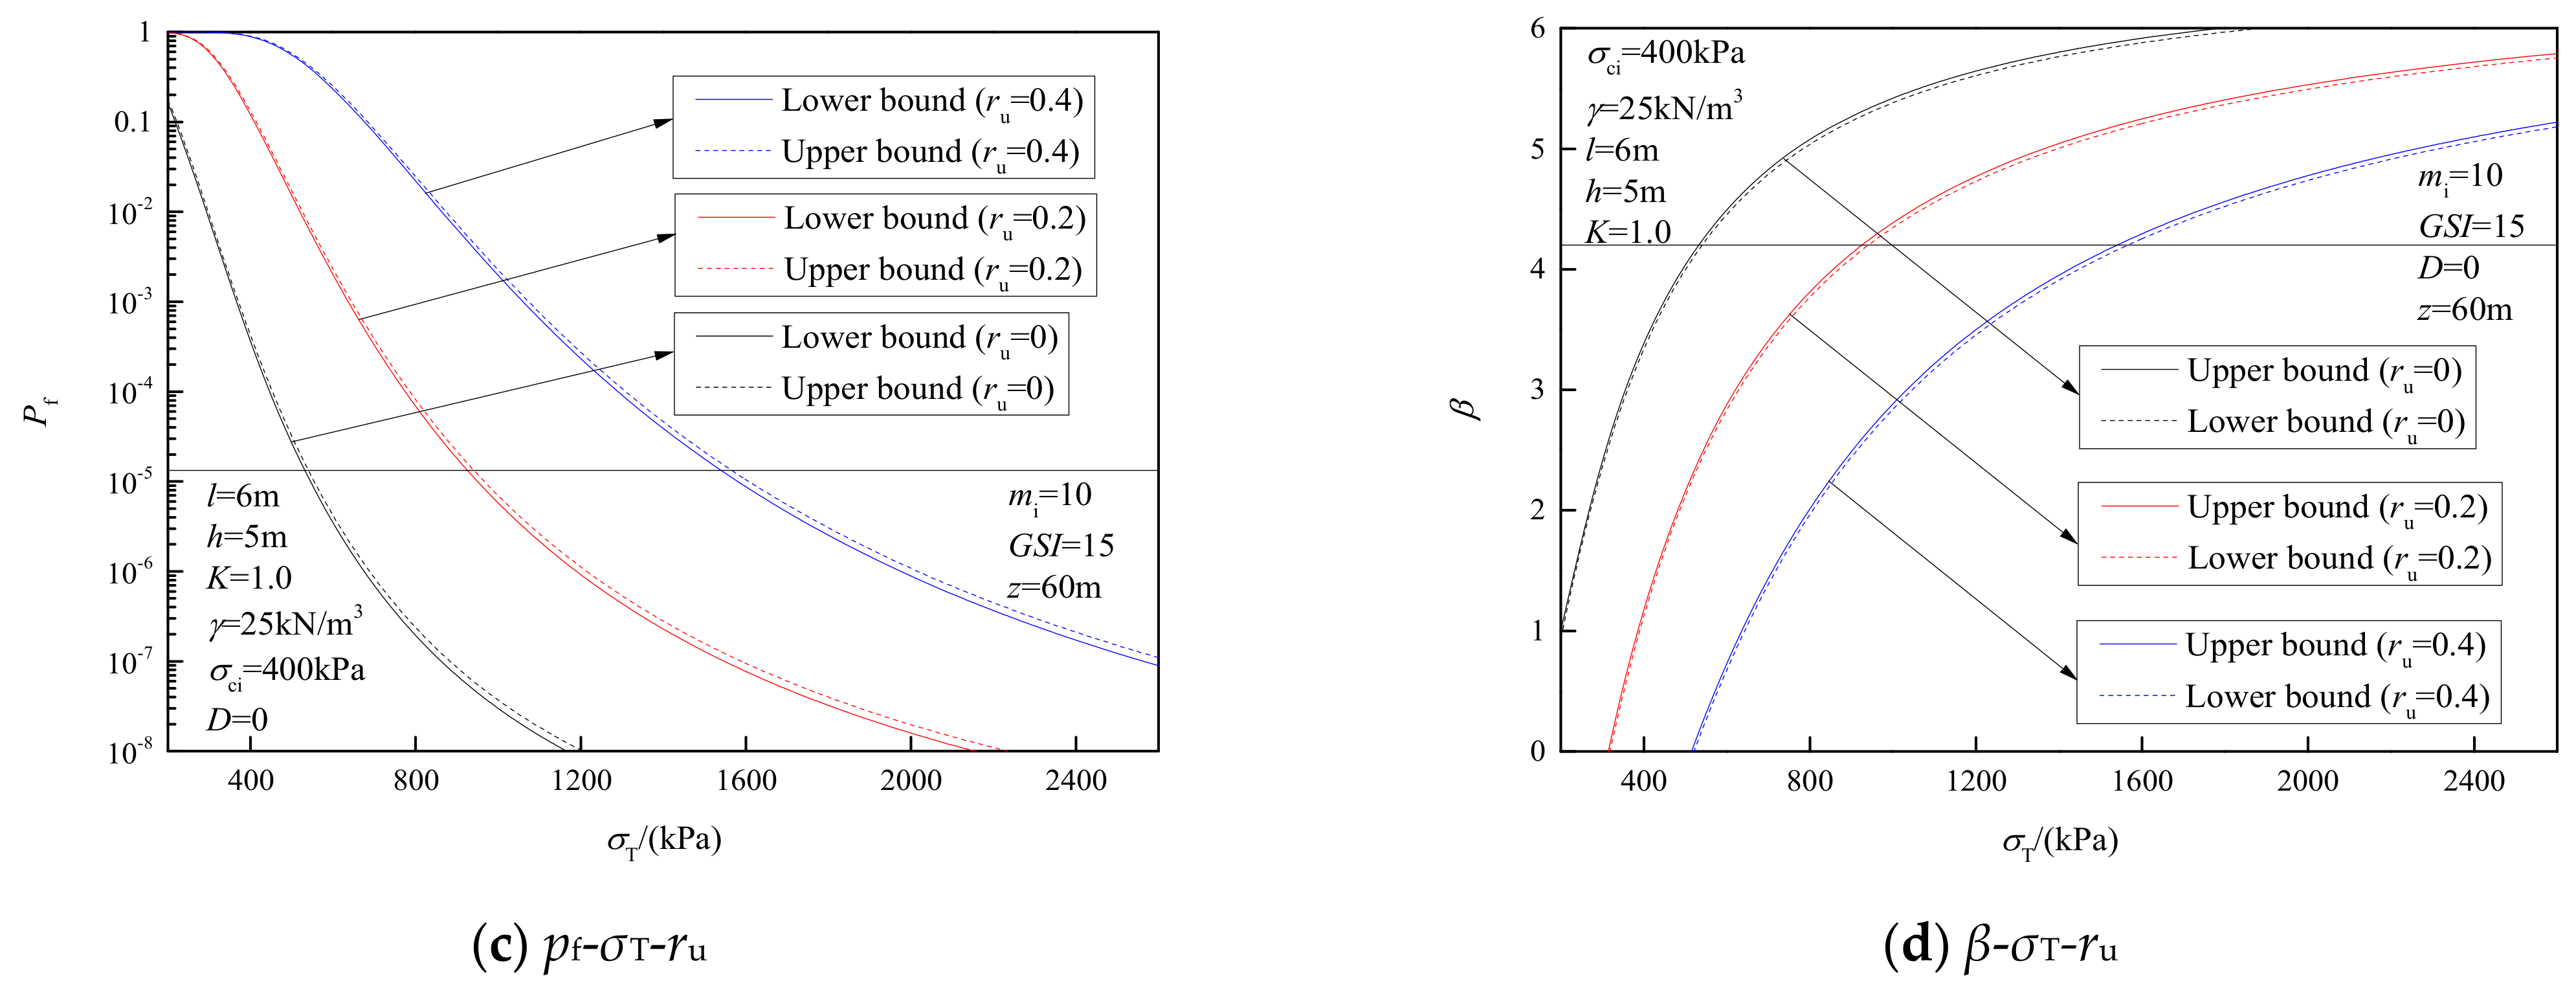
In order to examine the influence of pore water on the reliability of underground chambers, the failure probability Pf and reliability index β of underground chambers are calculated by using the narrow boundary method under different water level line heights z and pore water pressure coefficient ru respectively. Other parameters are as follows: γ = 25 kN/m3, l = 6 m, h = 5 m, K = 1, GSI = 15, mi = 10, σci = 400 kPa and D = 0. The effect of various water level line heights z and pore water pressure coefficient ru on the reliability of underground chambers is depicted in Figure 7. As Figure 7, the failure probability Pf of underground chambers decreases nonlinearly as the mean value of support force σT increases, whereas the reliability index β increases nonlinearly. Figure 7a–d show that the failure probability Pf of underground chambers increases as the increase in z and ru, but the dependable index β decreases. Therefore, the influence of pore water should be properly considered in the design of the underground chamber rich in groundwater, and an effective scheme of precipitation and drainage should be formulated. During construction, real-time monitoring of pore water should be strengthened to avoid the destruction of underground chambers due to excessive pore water pressure. Moreover, the concept of the safety level of underground chambers is introduced in Figure 7. The minimum support force range required to maintain the stability of underground chambers under different water level line heights z and pore water pressure coefficient ru can be obtained when the safety level is 1 (Pf = 1.3 × 10⁻⁵ or β = 4.2), and the statistics are shown in Table 5.
7. Conclusions
- By comparing the situation with and without pore water, it is concluded that the existence of pore water will have a considerable impact on the surrounding rock pressure, and the average difference of the surrounding rock pressure of the underground chamber under different pore water pressure coefficients is more than 200 KPa.
- When parameter randomness is not considered, the surrounding rock pressure q of underground chambers increases with the increase in the rock mass gravity γ, while the roof pressure of underground chambers decreases with the increase in the lateral pressure coefficient K. For the Hoek-Brown failure criterion parameters, the surrounding rock pressure q of underground chambers decreases nonlinearly with the increase in the GSI, mi and σci, and shows a nonlinear increasing trend with the increase in D. For pore water, the rise of z and the increase in ru will lead to an increase in the surrounding rock pressure q of the chamber. Therefore, the influence of pore water should be fully considered in the design of the underground chamber rich in groundwater, and an effective scheme of precipitation and drainage should be formulated.
- Based on the narrow boundary method of the correlation of multiple failure modes, the reliability of underground chambers is analyzed under the influence of different random parameters. With the increase in σT, the failure probability Pf of underground chambers decreases nonlinearly from steep to slow, and the reliability index β increases nonlinearly. With the increase in the γ, z and ru, the failure probability Pf of underground chambers increases, and the reliability index β decreases. With the increase in the GSI, mi, σci or the decrease in D, the failure probability Pf of underground chambers decreases, and the reliability index β increases.
Author Contributions
Conceptualization, D.Z. and J.Z.; data curation, B.Y.; software, X.Y.; project administration, J.Z.; supervision, D.Z.; writing—original draft preparation, H.Y.; writing—review and editing, H.Y. All authors have read and agreed to the published version of the manuscript.
Funding
The work was funded by the National Natural Science Foundation of China, grant number 52074116 and 51804113.
Institutional Review Board Statement
Not applicable.
Informed Consent Statement
Not applicable.
Data Availability Statement
Not applicable.
Conflicts of Interest
All authors declare that they have no conflict of interest or financial conflict to disclose.
References
- Xie, C.; Nguyen, H.; Bui, X.-N.; Nguyen, V.-T.; Zhou, J. Predicting roof displacement of roadways in underground coal mines using adaptive neuro-fuzzy inference system optimized by various physics-based optimization algorithms. J. Rock Mech. Geotech. Eng. 2021, 13, 1452–1465. [Google Scholar] [CrossRef]
- Xie, C.; Nguyen, H.; Choi, Y.; Armaghani, D.J. Optimized functional linked neural network for predicting diaphragm wall deflection induced by braced excavations in clays. Geosci. Front. 2022, 13, 101313. [Google Scholar] [CrossRef]
- Weng, L.; Wu, Q.-H.; Zhao, Y.-L.; Wang, S.-M. Dynamic response and failure of rock in initial gradient stress field under stress wave loading. J. Cent. South Univ. 2020, 27, 963–972. [Google Scholar] [CrossRef]
- Wu, Q.-H.; Weng, L.; Zhao, Y.-L.; Feng, F. Influence of infilling stiffness on mechanical and fracturing responses of hollow cylindrical sandstone under uniaxial compression tests. J. Central South Univ. 2021, 28, 2485–2498. [Google Scholar] [CrossRef]
- Fraldi, M.; Guarracino, F. Limit analysis of collapse mechanisms in cavities and tunnels according to the Hoek–Brown failure criterion. Int. J. Rock Mech. Min. Sci. 2009, 46, 665–673. [Google Scholar] [CrossRef]
- Yang, X.-L.; Li, Z.-W.; Liu, Z.-A.; Xiao, H.-B. Collapse analysis of tunnel floor in karst area based on Hoek-Brown rock media. J. Central South Univ. 2017, 24, 957–966. [Google Scholar] [CrossRef]
- Zhang, J.-H.; Zhang, B. Reliability analysis for seismic stability of tunnel faces in soft rock masses based on a 3D stochastic collapse model. J. Central South Univ. 2019, 26, 1706–1718. [Google Scholar] [CrossRef]
- Zhang, D.; Zhang, B. Stability Analysis of the Pressurized 3D Tunnel Face in Anisotropic and Nonhomogeneous Soils. Int. J. Géoméch. 2020, 20, 1–18. [Google Scholar] [CrossRef]
- Zhang, D.-B.; Ma, Z.-Y.; Yu, B.; Yin, H.-D. Upper bound solution of surrounding rock pressure of shallow tunnel under nonlinear failure criterion. J. Central South Univ. 2019, 26, 1696–1705. [Google Scholar] [CrossRef]
- Sun, Y.; Zuo, J.; Karakus, M.; Liu, L.; Zhou, H.; Yu, M. A New Theoretical Method to Predict Strata Movement and Surface Subsidence due to Inclined Coal Seam Mining. Rock Mech. Rock Eng. 2021, 54, 2723–2740. [Google Scholar] [CrossRef]
- Wang, H.; Liu, P.; Wang, L.G.; Liu, C.; Zhang, X.; Liu, L. Three-Dimensional Collapse Analysis for a Shallow Cavity in Layered Strata Based on Upper Bound Theorem. Comput. Model. Eng. Sci. 2020, 124, 375–391. [Google Scholar] [CrossRef]
- Sun, R.; Yang, J.-S.; Zhao, Y.-D.; Yang, F. Upper bound adaptive finite element method with higher-order element based on Drucker-Prager yield criterion. Chin. J. Geotech. Eng. 2020, 42, 398–404. [Google Scholar] [CrossRef]
- Zhao, Y.; Li, X.; Tai, P.; Huang, L.; Pu, B.; Chen, R. Upper bound limit analysis of roof collapse of deep cavities in unsaturated soils. Int. J. Numer. Anal. Methods Géoméch. 2022, 46, 1224–1240. [Google Scholar] [CrossRef]
- Zhang, D.-B.; Liu, Z.-Z.; Zhang, J.-H. A new failure mechanism for deep cavity and upper bound solution of supporting pressure. J. Central South Univ. 2017, 24, 2082–2091. [Google Scholar] [CrossRef]
- Liu, Z.-Z.; Cao, P.; Lin, H.; Meng, J.-J.; Wang, Y.-X. Three-dimensional upper bound limit analysis of underground cavities using nonlinear Baker failure criterion. Trans. Nonferrous Met. Soc. China 2020, 30, 1916–1927. [Google Scholar] [CrossRef]
- Yu, L.; Lv, C.; Wang, Z.-H.; Sun, Y.; Yang, N.; Wang, Z.-L.; Wang, M.-N. Upper Bound Analysis of Collapse Failure in Deep Buried Tunnel under upper Cave. China J. Highw. Transp. 2021, 34, 209–219. [Google Scholar] [CrossRef]
- Huang, F.; Zhang, M.; Jiang, Z. Collapse mode of rock mass induced by a concealed karst cave above a deep cavity. J. Central South Univ. 2019, 26, 1747–1754. [Google Scholar] [CrossRef]
- Zhang, B.; Ma, Z.-Y.; Wang, X.; Zhang, J.-S.; Peng, W.-Q. Reliability analysis of anti-seismic stability of 3D pressurized tunnel faces by response surfaces method. Geomech. Eng. 2020, 20, 43–54. [Google Scholar] [CrossRef]
- Zhang, D.; Sun, W.; Wang, C.; Yu, B. Reliability Analysis of Seismic Stability of Shield Tunnel Face under Multiple Correlated Failure Modes. KSCE J. Civ. Eng. 2021, 25, 3172–3185. [Google Scholar] [CrossRef]
- Mollon, G.; Dias, D.; Soubra, A.-H. Range of the Safe Retaining Pressures of a Pressurized Tunnel Face by a Probabilistic Approach. J. Geotech. Geoenvironmental Eng. 2013, 139, 1954–1967. [Google Scholar] [CrossRef]
- Zhang, J.-H.; Wang, W.-J.; Zhang, D.-B.; Zhang, B.; Meng, F. Safe Range of Retaining Pressure for Three-dimensional Face of Pressurized Tunnels based on Limit Analysis and Reliability Method. KSCE J. Civ. Eng. 2018, 22, 4645–4656. [Google Scholar] [CrossRef]
- Zhang, J.; Zhang, L.; Wang, W.; Zhang, D.; Zhang, B. Probabilistic analysis of three-dimensional tunnel face stability in soft rock masses using Hoek–Brown failure criterion. Int. J. Numer. Anal. Methods Géoméch. 2020, 44, 1601–1616. [Google Scholar] [CrossRef]
- Zhang, J.-H.; Xu, P.; Sun, W.-C.; Li, B. Seismic reliability analysis of shield tunnel faces under multiple failure modes by pseudo-dynamic method and response surface method. J. Cent. South Univ. 2022, 29, 1553–1564. [Google Scholar] [CrossRef]
- Pan, Q.; Dias, D. Probabilistic evaluation of tunnel face stability in spatially random soils using sparse polynomial chaos expansion with global sensitivity analysis. Acta Geotech. 2017, 12, 1415–1429. [Google Scholar] [CrossRef]
- Cheng, H.-Z.; Chen, J.; Chen, R.-P.; Chen, G.-L. Reliability study on shield tunnel face using a random limit analysis method in multilayered soils. Tunn. Undergr. Space Technol. 2019, 84, 353–363. [Google Scholar] [CrossRef]
- Zhang, B.; Wang, X.; Zhang, J.-S.; Cheng, H. Safe range analysis of clear distance of twin shallow tunnels based on limit analysis and reliability theory. J. Central South Univ. 2018, 25, 196–207. [Google Scholar] [CrossRef]
- Lü, Q.; Xiao, Z.-P.; Ji, J.; Zheng, J. Reliability based design optimization for a rock tunnel support system with multiple failure modes using response surface method. Tunn. Undergr. Space Technol. 2017, 70, 1–10. [Google Scholar] [CrossRef]
- Luo, W.-H.; Li, W.-T. Reliability analysis of supporting pressure in tunnels based on three-dimensional failure mechanism. J. Central South Univ. 2016, 23, 1243–1252. [Google Scholar] [CrossRef]
- Viratjandr, C.; Michalowski, R.L. Limit analysis of submerged slopes subjected to water drawdown. Can. Geotech. J. 2006, 43, 802–814. [Google Scholar] [CrossRef]
- Zhang, J.-H.; Wang, W.-J.; Zhang, B.; Zhang, D.-B. Upper Bound Analysis for Collapse Failure of Shield Tunnel Face Excavated in Unsaturated Soils Considering Steady Vertical Flow. Math. Probl. Eng. 2019, 2019, 1–10. [Google Scholar] [CrossRef] [Green Version]
- Hoek, E.; Brown, E.T. Empirical Strength Criterion for Rock Masses. J. Geotech. Eng. Div. 1980, 106, 1013–1035. [Google Scholar] [CrossRef]
- Hoek, E.; Brown, E. Practical estimates of rock mass strength. Int. J. Rock Mech. Min. Sci. 1997, 34, 1165–1186. [Google Scholar] [CrossRef]
- Huang, F.; Zhang, D.-B.; Sun, Z.-B.; Wu, B. Influence of pore water pressure on upper bound analysis of collapse shape for square tunnel in Hoek-Brown media. J. Central South Univ. 2011, 18, 530–535. [Google Scholar] [CrossRef]
- Zhang, B.; Jiang, J.; Zhang, D.-B.; Liu, Z. Upper bound solution of collapse pressure and permanent displacement of 3D tunnel faces using the pseudo-dynamic method and the kinematic approach. Geomech. Eng. 2021, 25, 521–533. [Google Scholar] [CrossRef]
- Zhang, M. Structural Reliability Analysis: Methods and Procedures; Science Publishing & Media Group Ltd.: Beijing, China, 2009. [Google Scholar]
- Zhang, B. Three-Dimensional Stability Analysis and Reliability Study of Tunnel Faces Using upper Bound Method; Central South University: Changsha, China, 2018. [Google Scholar]
Figure 1.
Failure mode and velocity vector of underground chambers under pore water effect: (a) Failure mode; (b) Velocity vector.
Figure 1.
Failure mode and velocity vector of underground chambers under pore water effect: (a) Failure mode; (b) Velocity vector.

Figure 2.
Schematic diagram of BGC power calculation for rotating circular arc body.

Figure 3.
Chart of surrounding rock pressure under different pore water effects.

Figure 4.
Influence rule of key parameters on underground chamber rock pressure.


Figure 5.
Influence of various rock mass gravity on the reliability of underground chambers.

Figure 6.
Influence of different Hoek-Brown criterion parameters on underground chamber reliability.
Figure 6.
Influence of different Hoek-Brown criterion parameters on underground chamber reliability.


Figure 7.
Influence of various water level line heights and pore water pressure coefficients on underground chamber reliability.
Figure 7.
Influence of various water level line heights and pore water pressure coefficients on underground chamber reliability.


Table 1.
Surrounding rock pressure under different pore water effects/kPa.
| γ (kN/m3) | q (kPa) | Average Difference (kPa) | |||||
|---|---|---|---|---|---|---|---|
| ru = 0 | ru = 0.1 | ru = 0.2 | ru = 0.3 | ru = 0.4 | ru = 0.5 | ||
| 18 | 87.79 | 143.48 | 207.61 | 281.86 | 362.71 | 445.98 | 200.54 |
| 20 | 110.47 | 168.39 | 235.60 | 315.31 | 404.36 | 496.60 | 213.58 |
| 22 | 135.48 | 195.24 | 264.85 | 349.01 | 446.06 | 547.24 | 225.00 |
| 24 | 162.76 | 224.10 | 295.55 | 382.99 | 487.82 | 597.91 | 234.91 |
| 26 | 192.28 | 254.96 | 327.85 | 417.31 | 529.62 | 648.60 | 243.39 |
Table 2.
Statistical features of random variable parameters.
| Random Variable Parameter | Mean Value | Standard Deviation | Coefficient of Variation | Distribution Pattern |
|---|---|---|---|---|
| γ (kN/m3) | 25 | 1.25 | 0.05 | Normal distribution |
| ru | 0.3 | 0.06 | 0.20 | Normal distribution |
| GSI | 15 | 2.25 | 0.15 | Normal distribution |
| mi | 10 | 1.5 | 0.15 | Normal distribution |
| σci (kPa) | 400 | 60 | 0.15 | Normal distribution |
| D | - | - | 0.15 | Normal distribution |
| σT (kPa) | - | - | 0.15 | Normal distribution |
Table 3.
Support force range of underground chamber safety design level 1 under different rock mass gravity.
Table 3.
Support force range of underground chamber safety design level 1 under different rock mass gravity.
| γ (kN/m3) | Lower Bound of Narrow Boundary Method (kPa) | Upper Bound of Narrow Boundary Method (kPa) | Support Force Range (kPa) |
|---|---|---|---|
| 18 | 848 | 862 | [848, 862] |
| 22 | 1043 | 1061 | [1043, 1063] |
| 26 | 1239 | 1260 | [1039, 1260] |
Table 4.
Support force range of underground chamber safety design level 1 under different Hoek-Brown criterion parameters.
Table 4.
Support force range of underground chamber safety design level 1 under different Hoek-Brown criterion parameters.
| Random Variable Parameter | Lower Bound of Narrow Boundary Method (kPa) | Upper Bound of Narrow Boundary Method (kPa) | Support Force Range (kPa) | |
|---|---|---|---|---|
| GSI | 10 | 1224 | 1244 | [1224, 1244] |
| 20 | 1176 | 1196 | [1176, 1196] | |
| 30 | 1146 | 1165 | [1146, 1165] | |
| mi | 5 | 1609 | 1636 | [1609, 1636] |
| 15 | 1167 | 1187 | [1167, 1187] | |
| 25 | 1132 | 1149 | [1132, 1149] | |
| σci/kPa | 200 | 1425 | 1449 | [1425, 1449] |
| 600 | 1174 | 1195 | [1174, 1195] | |
| 1000 | 1147 | 1167 | [1147, 1167] | |
| D | 0.1 | 1197 | 1218 | [1197, 1218] |
| 0.3 | 1437 | 1461 | [1437, 1461] | |
| 0.5 | 2251 | 2287 | [2251, 2287] | |
Table 5.
Support force range of underground chamber safety design level 1 under various water level line heights and pore water pressure coefficients.
Table 5.
Support force range of underground chamber safety design level 1 under various water level line heights and pore water pressure coefficients.
| Random Variable Parameter | Lower Bound of Narrow Boundary Method (kPa) | Upper Bound of Narrow Boundary Method (kPa) | Support Force Range (kPa) | |
|---|---|---|---|---|
| z/m | 40 | 923 | 939 | [923, 939] |
| 60 | 1191 | 1211 | [1191, 1211] | |
| 80 | 1533 | 1557 | [1533, 1557] | |
| ru | 0 | 532 | 540 | [532, 540] |
| 0.2 | 925 | 941 | [925, 941] | |
| 0.4 | 1539 | 1565 | [1539, 1565] | |
Publisher’s Note: MDPI stays neutral with regard to jurisdictional claims in published maps and institutional affiliations. |
© 2022 by the authors. Licensee MDPI, Basel, Switzerland. This article is an open access article distributed under the terms and conditions of the Creative Commons Attribution (CC BY) license (https://creativecommons.org/licenses/by/4.0/).
Share and Cite
MDPI and ACS Style
Yin, H.; Zhang, D.; Zhang, J.; Yu, B.; Yuan, X. Reliability Analysis on Multiple Failure Modes of Underground Chambers Based on the Narrow Boundary Method. Sustainability 2022, 14, 12045. https://doi.org/10.3390/su141912045
AMA Style
Yin H, Zhang D, Zhang J, Yu B, Yuan X. Reliability Analysis on Multiple Failure Modes of Underground Chambers Based on the Narrow Boundary Method. Sustainability. 2022; 14(19):12045. https://doi.org/10.3390/su141912045
Chicago/Turabian StyleYin, Huadong, Daobing Zhang, Jiahua Zhang, Biao Yu, and Xiaomeng Yuan. 2022. "Reliability Analysis on Multiple Failure Modes of Underground Chambers Based on the Narrow Boundary Method" Sustainability 14, no. 19: 12045. https://doi.org/10.3390/su141912045
Note that from the first issue of 2016, this journal uses article numbers instead of page numbers. See further details here.