
Consumers’ Intention to Purchase Functional Non-Dairy Milk and Gender-Based Market Segmentation
 , ,
, , 
Abstract
:1. Introduction
2. Related Theories and Hypotheses Development
2.1. Gender Effect and Segmentation
2.2. Functional Foods in Thailand
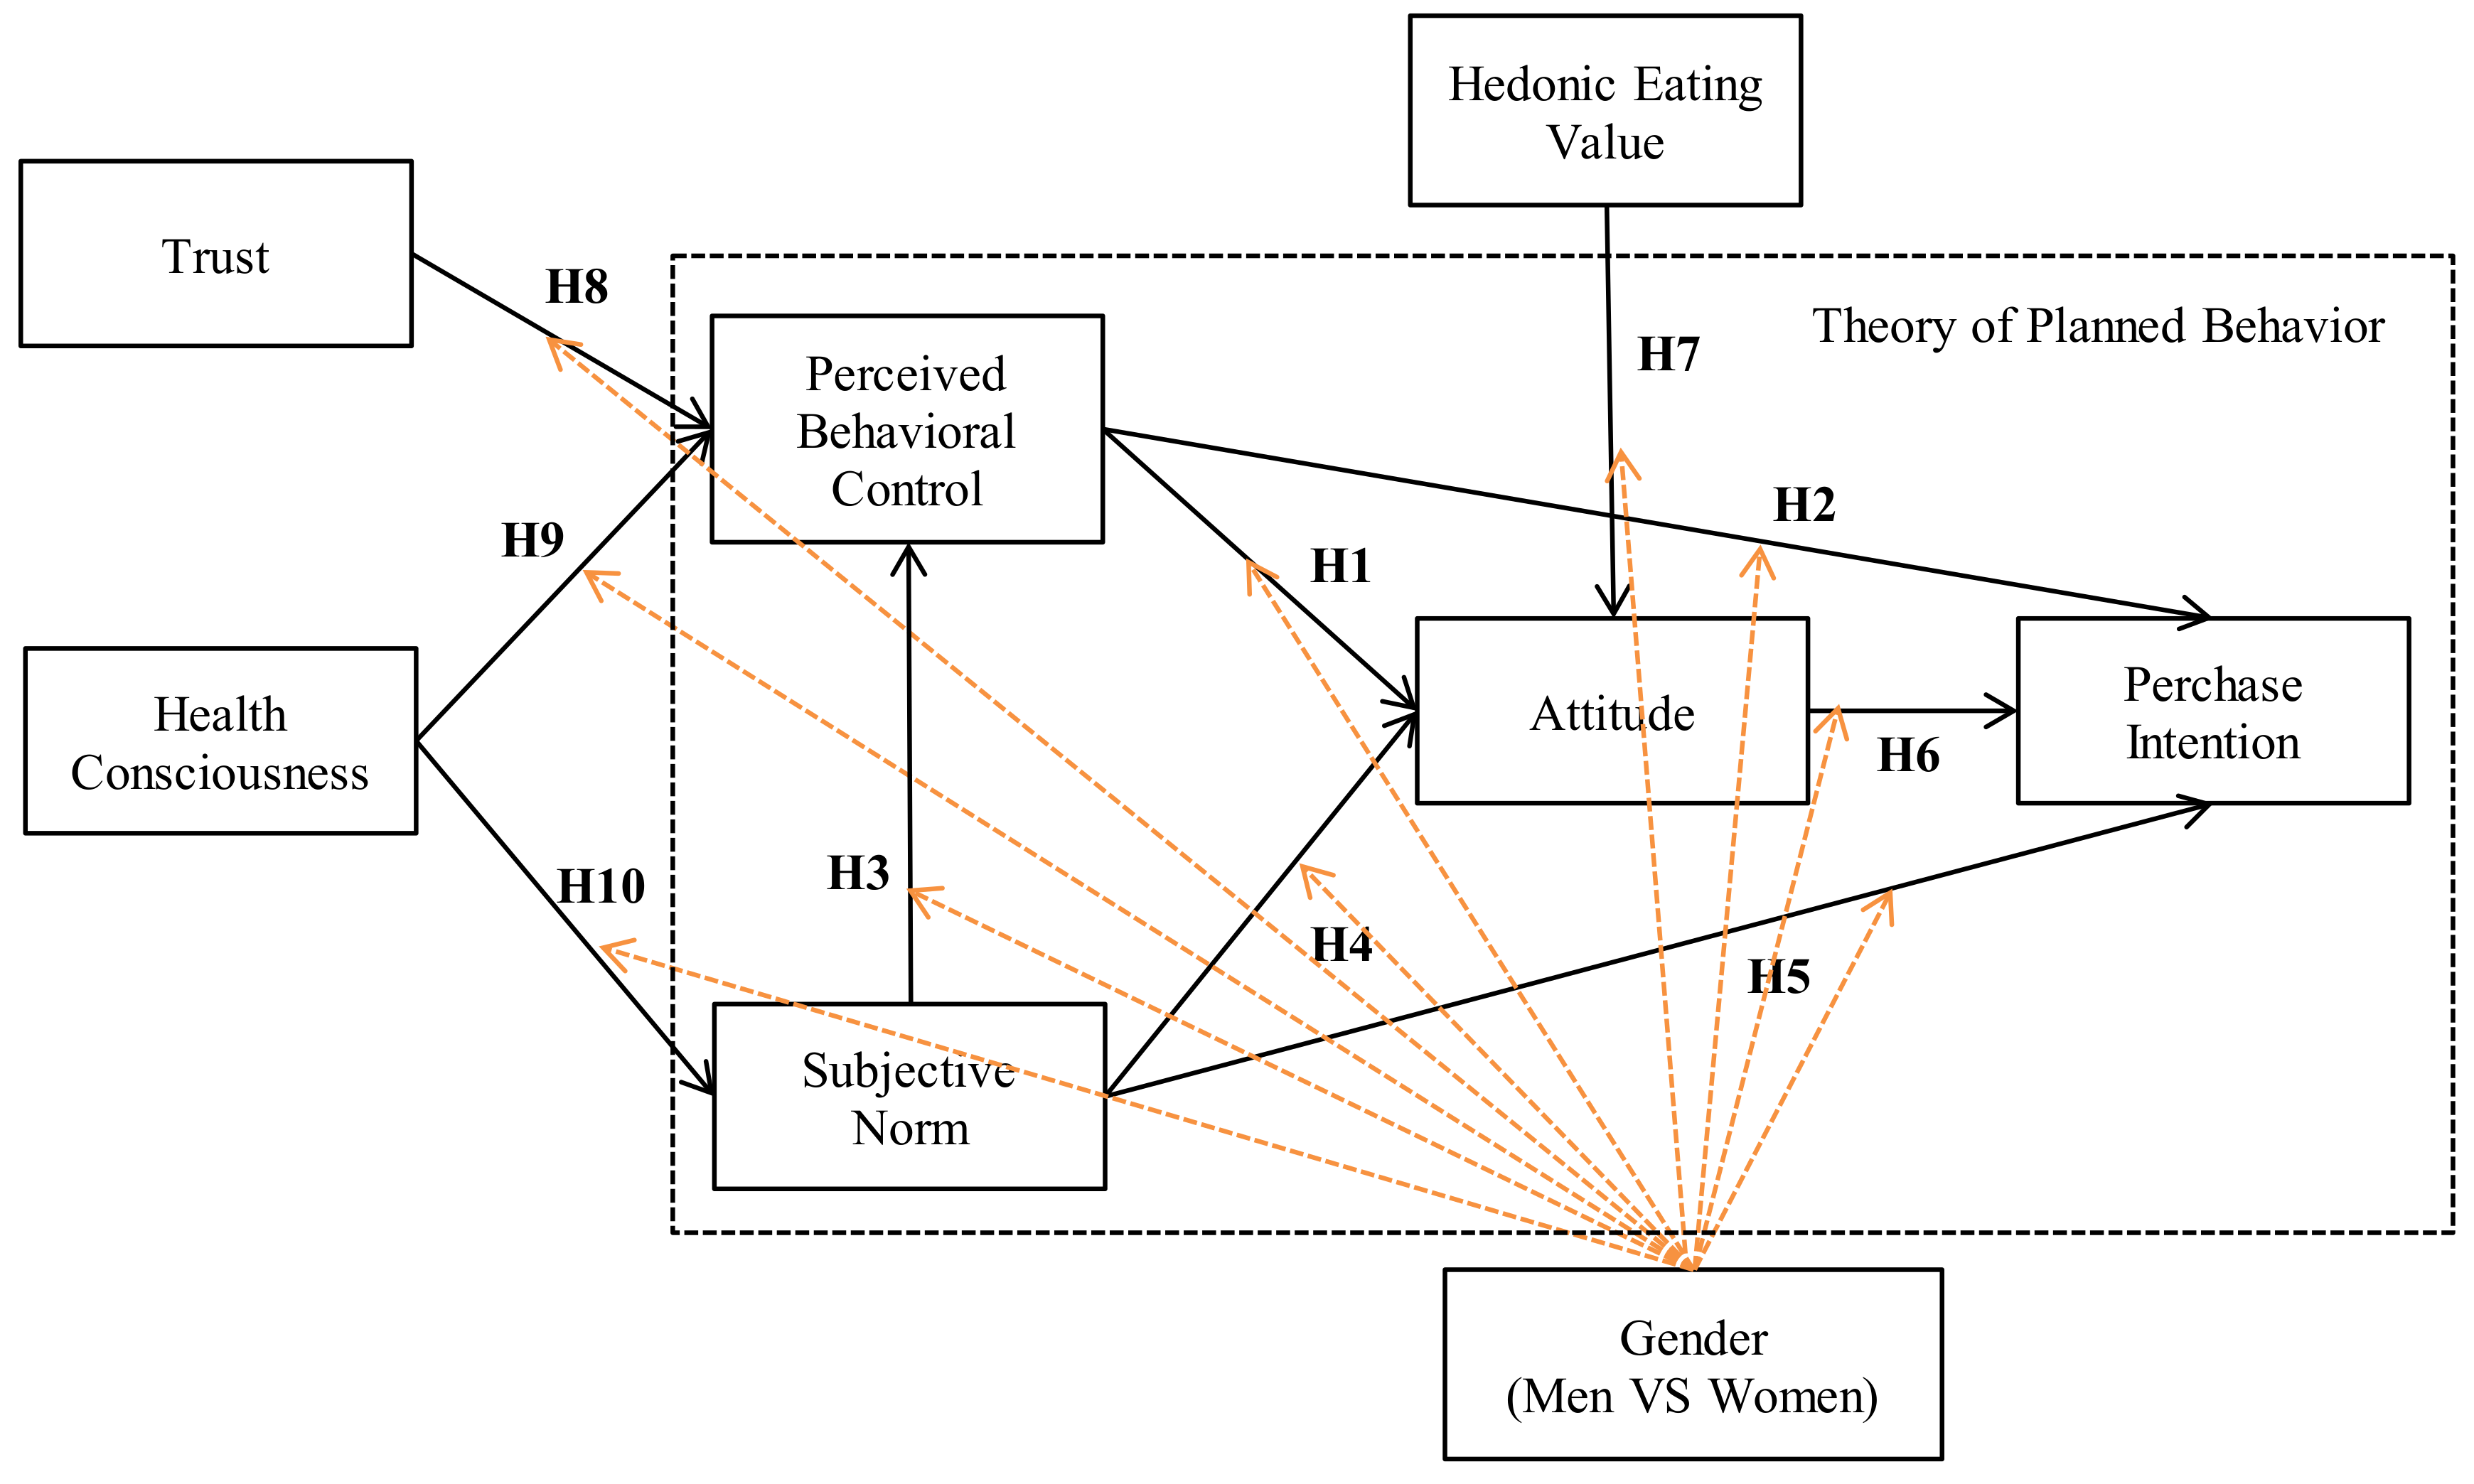
2.3. Theory of Planned Behavior (TPB)
2.3.1. Perceived Behavioral Control
2.3.2. Subjective Norm
2.3.3. Attitude
2.3.4. Purchase Intention
2.4. Hedonic Eating Value
2.5. Trust
2.6. Health Consciousness
3. Research Methodology
3.1. Sampling and Data Collection
3.2. Data Analysis
4. Results and Discussion
4.1. Descriptive Statistics for Demographic Profile
4.2. Measurement Model (Confirmatory Factor Analysis)
4.2.1. The Goodness of Fit (GOF)
4.2.2. Convergent Validity
4.2.3. Discriminant Validity
4.3. Structural Equation Modeling (SEM)
4.4. Multigroup Moderation Analysis (MGA)
4.4.1. Measurement Invariance (MI)
4.4.2. Z-Test for Loading Differences
5. Discussion
6. Research Implications
7. Conclusions
8. Limitation and Future Research Directions
Author Contributions
Funding
Institutional Review Board Statement
Informed Consent Statement
Data Availability Statement
Acknowledgments
Conflicts of Interest
Appendix A. Questionnaire
Appendix A.1. Introductory Questions
Appendix A.2. Demographic Data of Respondents
- Gender
- Male, Female
- Occupation
- Student, College Student, Self-Employed, Government Officer, Office Worker, Unemployed
- Age (years)
- Gen Z, Gen Y, Gen X, Baby Boomer
- Income (Thai Baht)
- <$500, $500–$666, $666–$833, $833–$1000, >$1000
- Have you ever tasted functional non-dairy milk
- Tested, Never
- Will you buy functional non-dairy milk in the future?
- Will, Will not
Appendix A.3. Questionnaire
| Items | Measure/Question |
| ATD1 | Is it good to drink functional non-dairy milk? |
| ATD2 | Drinking functional non-dairy milk regularly would make you feel pleasure. |
| ATD3 | Drinking functional non-dairy milk regularly would make you smarter. |
| ATD4 | I am interested in drinking functional non-dairy milk. |
| ATD5 | I have a desire to consume functional non-dairy milk. |
| H1 | Drinking functional non-dairy milk that brings joy and happiness is very important to me. |
| H2 | Drinking a delicious smell product of functional non-dairy milk is important to me. |
| H3 | I focus on drinking functional non-dairy milk that gives me pleasure. |
| H4 | For me, functional non-dairy milk always has a good taste. |
| T1 | I believe that functional non-dairy milk provides the benefits that the seller promises. |
| T2 | I believe that functional non-dairy milk is innovative products. |
| T3 | I believe the consumption of functional non-dairy milk is safe. |
| T4 | I believe in the quality of the functional non-dairy milk brand that I brought. |
| T5 | I believe in the institution that certifies functional non-dairy milk products. |
| HC1 | I am very concerned with my health and wellbeing. |
| HC2 | I try to make healthy choices. |
| HC3 | Normally, I am more attentive to my health. |
| HC4 | I have regular check-ups on my health. |
| PBC1 | I can control myself to drink functional non-dairy milk everyday. |
| PBC2 | Drinking functional non-dairy milk depends on me whether I drink regularly or not. |
| PBC3 | I believe that I have the ability to drink functional non-dairy milk regularly |
| PBC4 | If it is up to me, I’m sure I will be able to drink functional non-dairy milk regularly |
| SN1 | I will buy functional non-dairy milk when I see my friends drink them |
| SN2 | I will buy functional non-dairy milk when a group of my friends suggests me |
| SN3 | I will buy functional non-dairy milk when it becomes a trend |
| PI1 | If there is a functional non-dairy milk product available in the store, I would intend to buy it |
| PI2 | I intend to buy functional non-dairy milk products next time when I go shopping |
| PI3 | I want to buy functional non-dairy milk next time |
| PI4 | Functional non-dairy milk products are my first thought to buy in the store |
| Source. Data adapted from authors (2022). |
References
- Betoret, E.; Barrera, C.; Seguí, L.; Betoret, N. Sustainable Strategies in the Development of Functional Foods. In Innovation Strategies in the Food Industry; Academic Press: Cambridge, MA, USA, 2022; pp. 145–156. [Google Scholar] [CrossRef]
- Shete, B.S.; Shinkar, N.P.; Kamaltai Gawai, S. Dairy Industry Wastewater Sources, Characteristics & Its Effects on Environment Department of Civil Engineering. J. Curr. Eng. Technol. 2013, 3, 1611–1615. [Google Scholar]
- Capper, J.; Cady, R.A.; Bauman, D.E. The environmental impact of dairy production: 1944 compared with 2007. J. Anim. Sci. 2009, 87, 2160–2167. [Google Scholar] [CrossRef]
- Siciliano, R.; Reale, A.; Mazzeo, M.; Morandi, S.; Silvetti, T.; Brasca, M. Paraprobiotics: A New Perspective for Functional Foods and Nutraceuticals. Nutrients 2021, 13, 1225. [Google Scholar] [CrossRef] [PubMed]
- Luvián-Morales, J.; Varela-Castillo, F.O.; Flores-Cisneros, L.; Cetina-Pérez, L.; Castro-Eguiluz, D. Functional foods modulating inflammation and metabolism in chronic diseases: A systematic review. Crit. Rev. Food Sci. Nutr. 2021, 62, 4371–4392. [Google Scholar] [CrossRef] [PubMed]
- Bigliardi, B.; Galati, F. Innovation trends in the food industry: The case of functional foods. Trends Food Sci. Technol. 2013, 31, 118–129. [Google Scholar] [CrossRef]
- Wardle, J.; Haase, A.M.; Steptoe, A.; Nillapun, M.; Jonwutiwes, K.; Bellisie, F. Gender differences in food choice: The contribution of health beliefs and dieting. Ann. Behav. Med. 2004, 27, 107–116. [Google Scholar] [CrossRef]
- Austad, S.N. Why women live longer than men: Sex differences in longevity. Gend. Med. 2006, 3, 79–92. [Google Scholar] [CrossRef]
- IFT. Top 10 Functional Food Trends. Available online: https://www.ift.org/news-and-publications/food-technology-magazine/issues/2020/april/features/the-top-10-functional-food-trends (accessed on 18 August 2022).
- Cong, L.; Bremer, P.; Mirosa, M. Functional Beverages in Selected Countries of Asia Pacific Region: A Review. Beverages 2020, 6, 21. [Google Scholar] [CrossRef]
- Nor, N.A.A.M.; Masdek, N.R.N.M.; Sulaiman, N.H. Functional Food Business Potential Analysis in Malaysia, Thailand, Indonesia and The Philippines. Econ. Technol. Manag. Rev. 2016, 11b, 99–110. [Google Scholar]
- Trevanich, S. Probiotic beverages in Thailand: Health attributes and future trends. Probiotic Beverages 2021, 2021, 81–97. [Google Scholar] [CrossRef]
- Ju, S.; Song, S.; Lee, J.; Hwang, S.; Lee, Y.; Kwon, Y.; Lee, Y. Development of Nano Soy Milk through Sensory Attributes and Consumer Acceptability. Foods 2021, 10, 3014. [Google Scholar] [CrossRef] [PubMed]
- Roila, R.; Branciari, R.; Verdini, E.; Ranucci, D.; Valiani, A.; Pelliccia, A.; Fioroni, L.; Pecorelli, I. A Study of the Occurrence of Aflatoxin M1 in Milk Supply Chain over a Seven-Year Period (2014–2020): Human Exposure Assessment and Risk Characterization in the Population of Central Italy. Foods 2021, 10, 1529. [Google Scholar] [CrossRef] [PubMed]
- Market Study on Soy Milk: East Asia & Europe to Account for Bulk of Demand. Available online: https://www.persistencemarketresearch.com/market-research/soy-milk-market.asp (accessed on 15 March 2022).
- Gazdecki, M.; Goryńska-Goldmann, E.; Kiss, M.; Szakály, Z. Segmentation of Food Consumers Based on Their Sustainable Attitude. Energies 2021, 14, 3179. [Google Scholar] [CrossRef]
- Manippa, V.; Padulo, C.; Van Der Laan, L.N.; Brancucci, A. Gender Differences in Food Choice: Effects of Superior Temporal Sulcus Stimulation. Front. Hum. Neurosci. 2017, 11, 597. [Google Scholar] [CrossRef]
- Morse, K.L.; Driskell, J.A. Observed sex differences in fast-food consumption and nutrition self-assessments and beliefs of college students. Nutr. Res. 2009, 29, 173–179. [Google Scholar] [CrossRef]
- Ajzen, I. The Theory of Planned Behavior. Organ. Behav. Hum. Decis. Process. 1991, 50, 179–211. [Google Scholar] [CrossRef]
- Nystrand, B.T.; Olsen, S.O. Consumers’ attitudes and intentions toward consuming functional foods in Norway. Food Qual. Preference 2020, 80, 103827. [Google Scholar] [CrossRef]
- Park, J.; Ahn, J.; Yoo, W.S. The Effects of Price and Health Consciousness and Satisfaction on the Medical Tourism Experience. J. Heal. Manag. 2017, 62, 405–417. [Google Scholar] [CrossRef]
- Loera, B.; Murphy, B.; Fedi, A.; Martini, M.; Tecco, N.; Dean, M. Understanding the purchase intentions for organic vegetables across EU: A proposal to extend the TPB model. Br. Food J. 2022, 8, 875. [Google Scholar] [CrossRef]
- Hair, J.; Black, W.; Babin, B.; Anderson, R. Multivariate Data Analysis, 8th ed.; Cengage Learning: Hampshire, UK, 2019. [Google Scholar]
- Byrne, B.M. Structural Equation Modeling with Mplus: Basic Concepts, Applications, and Programming; Routledge: New York, NY, USA, 2016; ISBN 9780203807644. [Google Scholar]
- Yelkur, R.; Chakrabarty, S. Gender Differences in Service Quality Expectations in the Fast Food Industry. Serv. Mark. Q. 2006, 27, 141–151. [Google Scholar] [CrossRef]
- Fischer, E.; Arnold, S.J. Sex, Gender Identity, Gender Role Attitudes, and Consumer Behavior. Psychol. Mark. 1994, 11, 163–182. [Google Scholar] [CrossRef]
- Brecic, R.; Gorton, M.; Barjolle, D. Understanding variations in the consumption of functional foods—Evidence from Croatia. Br. Food J. 2014, 116, 662–675. [Google Scholar] [CrossRef]
- Verneau, F.; La Barbera, F.; Furno, M. The Role of Health Information in Consumers’ Willingness to Pay for Canned Crushed Tomatoes Enriched with Lycopene. Nutrients 2019, 11, 2173. [Google Scholar] [CrossRef]
- Büyükkaragöz, A.; Bas, M.; Sağlam, D.; Cengiz, E. Consumers’ awareness, acceptance and attitudes towards functional foods in Turkey. Int. J. Consum. Stud. 2014, 38, 628–635. [Google Scholar] [CrossRef]
- Akiroǧlu, F.P.; Uçar, A. Consumer Attitudes towards Purchasing Functional Products. Prog. Nutr. 2018, 20, 257–262. [Google Scholar] [CrossRef]
- Bech-Larsen, T.; Scholderer, J. Functional foods in Europe: Consumer research, market experiences and regulatory aspects. Trends Food Sci. Technol. 2007, 18, 231–234. [Google Scholar] [CrossRef]
- Verbeke, W. Consumer acceptance of functional foods: Socio-demographic, cognitive and attitudinal determinants. Food Qual. Preference 2005, 16, 45–57. [Google Scholar] [CrossRef]
- Sääksjärvi, M.; Holmlund, M.; Tanskanen, N. Consumer knowledge of functional foods. Int. Rev. Retail. Distrib. Consum. Res. 2009, 19, 135–156. [Google Scholar] [CrossRef]
- Siró, I.; Kápolna, E.; Kápolna, B.; Lugasi, A. Functional food. Product development, marketing and consumer acceptance—A review. Appetite 2008, 51, 456–467. [Google Scholar] [CrossRef]
- Bellows, A.C.; Alcaraz, G.; Hallman, W.K. Gender and food, a study of attitudes in the USA towards organic, local, U.S. grown, and GM-free foods. Appetite 2010, 55, 540–550. [Google Scholar] [CrossRef]
- Joung, H.-W.; Choi, E.-K.; Wang, E. Effects of Perceived Quality and Perceived Value of Campus Foodservice on Customer Satisfaction: Moderating Role of Gender. J. Qual. Assur. Hosp. Tour. 2016, 17, 101–113. [Google Scholar] [CrossRef]
- Mikolajczyk, R.T.; El Ansari, W.; Maxwell, A.E. Food consumption frequency and perceived stress and depressive symptoms among students in three European countries. Nutr. J. 2009, 8, 31. [Google Scholar] [CrossRef]
- De Leeuw, A.; Valois, P.; Morin, A.; Schmidt, P. Gender Differences in Psychosocial Determinants of University Students’ Intentions to Buy Fair Trade Products. J. Consum. Policy 2014, 37, 485–505. [Google Scholar] [CrossRef]
- Grogan, S.C.; Bell, R.; Conner, M. Eating Sweet Snacks: Gender Differences in Attitudes and Behaviour. Appetite 1997, 28, 19–31. [Google Scholar] [CrossRef] [PubMed]
- Rapport, M.D.; Carlson, G.A.; Kelly, K.L.; Pataki, C. Methylphenidate and Desipramine in Hospitalized Children: I. Separate and Combined Effects on Cognitive Function. J. Am. Acad. Child Adolesc. Psychiatry 1993, 32, 333–342. [Google Scholar] [CrossRef] [PubMed]
- Supachaturat, S.; Pichyangkura, R.; Chandrachai, A.; Pentrakoon, D. Perspective on Functional Food Commercialization in Thailand. Int. Food Res. J. 2017, 24, 1374–1382. [Google Scholar]
- Kessuvan, A.; Akanit, R. The Perceived Service Quality of Chain Restaurants in Bangkok. In Proceedings of the 12th SARD Workshop, Bangkok, Thailand, 28–30 November 2014. [Google Scholar]
- Chen, M.-F. The joint moderating effect of health consciousness and healthy lifestyle on consumers’ willingness to use functional foods in Taiwan. Appetite 2011, 57, 253–262. [Google Scholar] [CrossRef]
- Conner, M.; Armitage, C. Extending the Theory of Planned Behavior: A Review and Avenues for Further Research. J. Appl. Soc. Psychol. 1998, 28, 1429–1464. [Google Scholar] [CrossRef]
- Byrne, B.M. Structural Equation Modeling with EQS. In Basic Concepts, Applications, and Programming, 7th ed.; Routledge: New York, NY, USA, 2013; pp. 1–440. [Google Scholar] [CrossRef]
- Kim, H.Y.; Chung, J.-E. Consumer purchase intention for organic personal care products. J. Consum. Mark. 2011, 28, 40–47. [Google Scholar] [CrossRef]
- Kim, E.; Ham, S.; Yang, I.S.; Choi, J.G. The roles of attitude, subjective norm, and perceived behavioral control in the formation of consumers’ behavioral intentions to read menu labels in the restaurant industry. Int. J. Hosp. Manag. 2013, 35, 203–213. [Google Scholar] [CrossRef]
- Quevedo-Silva, F.; Freire, O.; Lima-Filho, D.D.O.; Brandão, M.M.; Isabella, G.; Moreira, L.B. Intentions to purchase food through the internet: Developing and testing a model. Br. Food J. 2016, 118, 572–587. [Google Scholar] [CrossRef]
- Fishbein, M.; Ajzen, I. Theory-based Behavior Change Interventions: Comments on Hobbis and Sutton. J. Heal. Psychol. 2005, 10, 27–31. [Google Scholar] [CrossRef]
- Wan, C.; Shen, Q.; Choi, S. Experiential and instrumental attitudes: Interaction effect of attitude and subjective norm on recycling intention. J. Environ. Psychol. 2017, 50, 69–79. [Google Scholar] [CrossRef]
- Tarkiainen, A.; Sundqvist, S. Subjective norms, attitudes and intentions of Finnish consumers in buying organic food. Br. Food J. 2005, 107, 808–822. [Google Scholar] [CrossRef]
- Scalco, A.; Noventa, S.; Sartori, R.; Ceschi, A. Predicting organic food consumption: A meta-analytic structural equation model based on the theory of planned behavior. Appetite 2017, 112, 235–248. [Google Scholar] [CrossRef]
- O’Connor, E.L.; White, K.M. Willingness to trial functional foods and vitamin supplements: The role of attitudes, subjective norms, and dread of risks. Food Qual. Preference 2010, 21, 75–81. [Google Scholar] [CrossRef]
- Bai, L.; Wang, M.; Gong, S. Understanding the Antecedents of Organic Food Purchases: The Important Roles of Beliefs, Subjective Norms, and Identity Expressiveness. Sustainability 2019, 11, 3045. [Google Scholar] [CrossRef]
- Zsóka, Á.; Szerényi, Z.M.; Széchy, A.; Kocsis, T. Greening due to environmental education? Environmental knowledge, attitudes, consumer behavior and everyday pro-environmental activities of Hungarian high school and university students. J. Clean. Prod. 2013, 48, 126–138. [Google Scholar] [CrossRef]
- Woo, E.; Kim, Y.G. Consumer attitudes and buying behavior for green food products: From the Aspect of Green Perceived Value (GPV). Br. Food J. 2019, 121, 320–332. [Google Scholar] [CrossRef]
- Zendehdel, M.; Paim, L.H.; Osman, S.B. Students’ online purchasing behavior in Malaysia: Understanding online shopping attitude. Cogent Bus. Manag. 2015, 2, 1078428. [Google Scholar] [CrossRef]
- Barauskaite, D.; Gineikiene, J.; Fennis, B.M.; Auruskeviciene, V.; Yamaguchi, M.; Kondo, N. Eating healthy to impress: How conspicuous consumption, perceived self-control motivation, and descriptive normative influence determine functional food choices. Appetite 2018, 131, 59–67. [Google Scholar] [CrossRef] [PubMed]
- Chen, J.; Lobo, A.; Rajendran, N. Drivers of organic food purchase intentions in mainland China—Evaluating potential customers’ attitudes, demographics and segmentation. Int. J. Consum. Stud. 2014, 38, 346–356. [Google Scholar] [CrossRef]
- Mauricio, R.A.; Campos, J.A.D.B.; Nassu, R.T. Meat with edible coating: Acceptance, purchase intention and neophobia. Food Res. Int. 2022, 154, 111002. [Google Scholar] [CrossRef] [PubMed]
- Fan, Y.-W.; Miao, Y.-F. Effect of Electronic Word-of-Mouth on Consumer Purchase Intention: The Perspective of Gender Dif-ferences. Int. J. Electron. Bus. Manag. 2012, 10, 7. [Google Scholar]
- Vahdat, A.; Alizadeh, A.; Quach, S.; Hamelin, N. Would you like to shop via mobile app technology? The technology acceptance model, social factors and purchase intention. Australas. Mark. J. 2020, 29, 187–197. [Google Scholar] [CrossRef]
- Patch, C.S.; Tapsell, L.C.; Williams, P. Attitudes and Intentions toward Purchasing Novel Foods Enriched with Omega-3 Fatty Acids. J. Nutr. Educ. Behav. 2005, 37, 235–241. [Google Scholar] [CrossRef]
- Wądołowska, L.; Danowska-Oziewicz, M.; Stewart-Knox, B.; de Almeida, M.D.V. Differences between older and younger Poles in functional food consumption, awareness of metabolic syndrome risk and perceived barriers to health improvement. Food Policy 2009, 34, 311–318. [Google Scholar] [CrossRef]
- Rezai, G.; Teng, P.K.; Shamsudin, M.N.; Mohamed, Z.; Stanton, J.L. Effect of perceptual differences on consumer purchase intention of natural functional food. J. Agribus. Dev. Emerg. Econ. 2017, 7, 153–173. [Google Scholar] [CrossRef]
- Martín-Consuegra, D.; Díaz, E.; Gómez, M.; Molina, A. Examining consumer luxury brand-related behavior intentions in a social media context: The moderating role of hedonic and utilitarian motivations. Physiol. Behav. 2019, 200, 104–110. [Google Scholar] [CrossRef]
- Ferguson, J.L.; Mohan, M. Use of celebrity and non-celebrity persons in B2B advertisements: Effects on attention, recall, and hedonic and utilitarian attitudes. Ind. Mark. Manag. 2019, 89, 594–604. [Google Scholar] [CrossRef]
- Maehle, N.; Iversen, N.M.; Hem, L.E.; Otnes, C. Exploring consumer preferences for hedonic and utilitarian food attributes. Br. Food J. 2015, 117, 3039–3063. [Google Scholar] [CrossRef]
- Loebnitz, N.; Grunert, K.G. Impact of self-health awareness and perceived product benefits on purchase intentions for hedonic and utilitarian foods with nutrition claims. Food Qual. Preference 2018, 64, 221–231. [Google Scholar] [CrossRef]
- Kim, S.; Ham, S.; Moon, H.; Chua, B.-L.; Han, H. Experience, brand prestige, perceived value (functional, hedonic, social, and financial), and loyalty among GROCERANT customers. Int. J. Hosp. Manag. 2018, 77, 169–177. [Google Scholar] [CrossRef]
- Nejati, M.; Moghaddam, P.P. Gender differences in hedonic values, utilitarian values and behavioural intentions of young consumers: Insights from Iran. Young-Consum. 2012, 13, 337–344. [Google Scholar] [CrossRef]
- Dolgopolova, I.; Teuber, R.; Bruschi, V. Consumers’ perceptions of functional foods: Trust and food-neophobia in a cross-cultural context. Int. J. Consum. Stud. 2015, 39, 708–715. [Google Scholar] [CrossRef]
- Nguyen, N.-T. Attitudes and repurchase intention of consumers towards functional foods in ho chi minh city, vietnam. Int. J. Anal. Appl. 2020, 18, 212–242. [Google Scholar] [CrossRef]
- Siegrist, M.; Stampfli, N.; Kastenholz, H. Consumers’ willingness to buy functional foods. The influence of carrier, benefit and trust. Appetite 2008, 51, 526–529. [Google Scholar] [CrossRef]
- Falguera, V.; Aliguer, N.; Falguera, M. An integrated approach to current trends in food consumption: Moving toward functional and organic products? Food Control 2012, 26, 274–281. [Google Scholar] [CrossRef]
- Roosen, J.; Bieberstein, A.; Blanchemanche, S.; Goddard, E.; Marette, S.; Vandermoere, F. Trust and willingness to pay for nanotechnology food. Food Policy 2015, 52, 75–83. [Google Scholar] [CrossRef]
- Oude Ophuis, P.A.M. Measuring Health Orientation and Health Consciousness as Determinants of Food Choice Behavior: Development and Implementation of Various Attitudinal Scales. In Athens School of Economics and Business; Athens School of Economics and Business: Athens, Greece, 1989. [Google Scholar] [CrossRef]
- Identifying the Health Conscious Consumer—ProQuest. Available online: https://www.proquest.com/openview/0dde829e457e501295727eb2a5106938/1?cbl=36770&pq-origsite=gscholar&parentSessionId=vYovVjJfIGdBlTM%2Bhqu2vnE1ycHVI8%2FVENX2NRZpFx8%3D (accessed on 15 August 2022).
- Newsom, J.T.; McFarland, B.; Kaplan, M.S.; Huguet, N.; Zani, B. The health consciousness myth: Implications of the near independence of major health behaviors in the North American population. Soc. Sci. Med. 2005, 60, 433–437. [Google Scholar] [CrossRef]
- Yadav, R.; Pathak, G.S. Young consumers’ intention towards buying green products in a developing nation: Extending the theory of planned behavior. J. Clean. Prod. 2016, 135, 732–739. [Google Scholar] [CrossRef]
- Kahle, L.R. Book Review: Marketing Research: An Applied Orientation. J. Mark. Res. 1994, 31, 137–139. [Google Scholar] [CrossRef]
- Naruetharadhol, P.; Wongsaichia, S.; Zhang, S.; Phonthanukitithaworn, C.; Ketkaew, C. Understanding Consumer Buying Intention of E-Commerce Airfares Based on Multivariate Demographic Segmentation: A Multigroup Structural Equation Modeling Approach. Sustainability 2022, 14, 8997. [Google Scholar] [CrossRef]
- Kline, R.B. Response to Leslie Hayduk’s Review of Principles and Practice of Structural Equation Modeling, 4th Edition. Can. Stud. Popul. 2018, 45, 188–195. [Google Scholar] [CrossRef]
- Leung, L. Validity, reliability, and generalizability in qualitative research. J. Fam. Med. Prim. Care 2015, 4, 324–327. [Google Scholar] [CrossRef]
- Bell, E.; Bryman, A. The Ethics of Management Research: An Exploratory Content Analysis. Br. J. Manag. 2007, 18, 63–77. [Google Scholar] [CrossRef]
- Aguirre-Urreta, M.I.; Hu, J. Detecting Common Method Bias. ACM SIGMIS Database: Database Adv. Inf. Syst. 2019, 50, 45–70. [Google Scholar] [CrossRef]
- Kock, N. Common Method Bias in PLS-SEM: A Full Collinearity Assessment Approach. In Partial Least Squares Path Modeling; Springer: Berlin/Heidelberg, Germany, 2017. [Google Scholar]
- Kock, N. Harman’s Single Factor Test in PLS-SEM: Checking for Common Method Bias. Data Anal. Perspect. J. 2020, 2, 1–6. [Google Scholar]
- Franke, G.R. Multicollinearity. In Wiley International Encyclopedia of Marketing; Wiley: Hoboken, NJ, USA, 2010. [Google Scholar]
- Balicki, J.; WSEAS (Organization). International Conference on Mathematical, C. and S.S. (2nd: 2014: G.; International Conference on Finite Differences, F.E. Exploratory Factor Analysis. Concepts Theory 2014, 27, 375–382. [Google Scholar]
- Steenkamp, J.-B.E.M.; Baumgartner, H. Assessing Measurement Invariance in Cross-National Consumer Research. J. Consum. Res. 1998, 25, 78–90. [Google Scholar] [CrossRef]
- Wongsaichia, S.; Naruetharadhol, P.; Schrank, J.; Phoomsom, P.; Sirisoonthonkul, K.; Paiyasen, V.; Srichaingwang, S.; Ketkaew, C. Influences of Green Eating Behaviors Underlying the Extended Theory of Planned Behavior: A Study of Market Segmentation and Purchase Intention. Sustainability 2022, 14, 8050. [Google Scholar] [CrossRef]
- Ketkaew, C.; Sukitprapanon, C.; Naruetharadhol, P. Association between retirement behavior and financial goals: A comparison between urban and rural citizens in China. Cogent Bus. Manag. 2020, 7, 1739495. [Google Scholar] [CrossRef]
- Ketkaew, C.; Wongthahan, P.; Sae-Eaw, A. How sauce color affects consumer emotional response and purchase intention: A structural equation modeling approach for sensory analysis. Br. Food J. 2021, 123, 2152–2169. [Google Scholar] [CrossRef]
- Anderson, J.C.; Kellogg, J.L.; Gerbing, D.W. Structural Equation Modeling in Practice: A Review and Recommended Two-Step Ap-proach. Psychol. Bull. 1988, 103, 411. [Google Scholar] [CrossRef]
- Klein, R.B. Principles and Practice of Structural Equation Modeling, 4th ed.; The Guilford Press: New York, NY, USA, 2016; p. 8. [Google Scholar]
- Hu, L.-T.; Bentler, P.M. Cutoff Criteria for Fit Indexes in Covariance Structure Analysis: Conventional Criteria versus New Alternatives. Structural Equation Modeling. Struct. Equ. Model. A Multidiscip. J. 1999, 6, 1–55. [Google Scholar] [CrossRef]
- Bollen, K.A. Sample size and bentler and Bonett’s nonnormed fit index. Psychometrika 1986, 51, 375–377. [Google Scholar] [CrossRef]
- Fornell, C.; Larcker, D.F. Evaluating Structural Equation Models with Unobservable Variables and Measurement Error. J. Mark. Res. 1981, 18, 39–50. [Google Scholar] [CrossRef]
- Abraham, J.; Barker, K. Exploring Gender Difference in Motivation, Engagement and Enrolment Behaviour of Senior Secondary Physics Students in New South Wales. Res. Sci. Educ. 2014, 45, 59–73. [Google Scholar] [CrossRef]
- Fornell, C.; Larcker, D.F. Structural equation models with unobservable variables and measurement error: Algebra and statistics. J. Mark. Res. 1981, 18, 382–388. [Google Scholar] [CrossRef]
- Henseler, J.; Ringle, C.M.; Sarstedt, M. A new criterion for assessing discriminant validity in variance-based structural equation modeling. J. Acad. Mark. Sci. 2015, 43, 115–135. [Google Scholar] [CrossRef]
- Phonthanukitithaworn, C.; Naruetharadhol, P.; Gebsombut, N.; Chanavirut, R.; Onsa-Ard, W.; Joomwanta, P.; Chanyuan, Z.; Ketkaew, C. An Investigation of the Relationship Among Medical Center’s Image, Service Quality, and Patient Loyalty. SAGE Open 2020, 10, 2158244020982304. [Google Scholar] [CrossRef]
- Roitner-Schobesberger, B.; Darnhofer, I.; Somsook, S.; Vogl, C.R. Consumer perceptions of organic foods in Bangkok, Thailand. Food Policy 2008, 33, 112–121. [Google Scholar] [CrossRef]
- My, N.H.; Rutsaert, P.; Van Loo, E.J.; Verbeke, W. Consumers’ familiarity with and attitudes towards food quality certifications for rice and vegetables in Vietnam. Food Control 2017, 82, 74–82. [Google Scholar] [CrossRef] [Green Version]
- Fenko, A.; Backhaus, B.W.; Van Hoof, J. The influence of product- and person-related factors on consumer hedonic responses to soy products. Food Qual. Preference 2015, 41, 30–40. [Google Scholar] [CrossRef]
- Ricci, E.C.; Banterle, A.; Stranieri, S. Trust to Go Green: An Exploration of Consumer Intentions for Eco-friendly Convenience Food. Ecol. Econ. 2018, 148, 54–65. [Google Scholar] [CrossRef]
- Khare, A.; Pandey, S. Role of green self-identity and peer influence in fostering trust towards organic food retailers. Int. J. Retail Distrib. Manag. 2017, 45, 969–990. [Google Scholar] [CrossRef]
- Menozzi, D.; Sogari, G.; Mora, C. Understanding and modelling vegetables consumption among young adults. LWT 2017, 85, 327–333. [Google Scholar] [CrossRef]
- Nuttavuthisit, K.; Thøgersen, J. The Importance of Consumer Trust for the Emergence of a Market for Green Products: The Case of Organic Food. J. Bus. Ethics 2017, 140, 323–337. [Google Scholar] [CrossRef]
- Sultan, P.; Tarafder, T.; Pearson, D.; Henryks, J. Intention-behaviour gap and perceived behavioural control-behaviour gap in theory of planned behaviour: Moderating roles of communication, satisfaction and trust in organic food consumption. Food Qual. Preference 2019, 81, 103838. [Google Scholar] [CrossRef]
- Saleki, R.; Quoquab, F.; Mohammad, J. What drives Malaysian consumers’ organic food purchase intention? The role of moral norm, self-identity, environmental concern and price consciousness. J. Agribus. Dev. Emerg. Econ. 2019, 9, 584–603. [Google Scholar] [CrossRef]
- Shin, Y.H.; Im, J.; Jung, S.E.; Severt, K. Motivations behind Consumers’ Organic Menu Choices: The Role of Environmental Concern, Social Value, and Health Consciousness. J. Qual. Assur. Hosp. Tour. 2018, 20, 107–122. [Google Scholar] [CrossRef]
- Functional Food Market Size, Share & Growth Forecast to 2027. Available online: https://www.kbvresearch.com/functional-food-market/ (accessed on 15 March 2022).
- To, E.K. Sensory Evaluation Ratings of Non-Dairy Milk Substitutes in a Cold Chocolate Dessert; ProQuest: Ann Arbor, MI, USA, 2012. [Google Scholar]
- Rego, C. Application of the Theory of Planned Behavior: Examining the Factors That Influence the Consumption of Dairy Milk among Canadian University Students. Ph.D. Thesis, University of Waterloo, Waterloo, ON, Canada, 2020. [Google Scholar]


| Demographic Variable | Category | Segment 1 (Men) | Segment 2 (Women) | Total | Significance Chi-Square Test | |||
|---|---|---|---|---|---|---|---|---|
| n | % | n | % | n | % | |||
| Segment Size | 195 | 47.2 | 218 | 52.8 | 413 | 100.0 | ||
| Occupation | Student | 8 | 4.1 | 12 | 5.5 | 20 | 4.8 | 0.652 |
| College Student | 136 | 69.7 | 158 | 72.5 | 294 | 71.2 | ||
| Self-employed | 12 | 6.2 | 6 | 2.8 | 18 | 4.4 | ||
| Government official | 19 | 9.7 | 21 | 9.6 | 40 | 9.7 | ||
| Office Worker | 7 | 3.6 | 7 | 3.2 | 14 | 3.4 | ||
| Unemployed | 13 | 6.7 | 14 | 6.4 | 27 | 6.5 | ||
| Age | Gen Z | 4.7 | 24.1 | 65 | 29.8 | 112 | 27.1 | 0.580 |
| Gen Y | 121 | 62.1 | 127 | 58.3 | 248 | 60.0 | ||
| Gen X | 23 | 11.8 | 21 | 9.6 | 44 | 10.7 | ||
| Boomer | 4 | 2.1 | 5 | 2.3 | 9 | 2.2 | ||
| Income | Below $500 | 136 | 69.7 | 168 | 77.1 | 304 | 73.6 | 0.215 |
| $500–$666 | 32 | 16.4 | 20 | 9.2 | 52 | 12.6 | ||
| $666–$833 | 3 | 1.5 | 5 | 2.3 | 8 | 1.9 | ||
| $833–$1000 | 4 | 2.1 | 6 | 2.8 | 10 | 2.4 | ||
| More than $1000 | 20 | 10.3 | 19 | 8.7 | 39 | 9.4 | ||
| Taste experience | Tasted | 144 | 73.8 | 177 | 78.4 | 315 | 76.3 | 0.273 |
| Never | 51 | 26.2 | 47 | 21.6 | 98 | 23.7 | ||
| Will purchase again | Will | 160 | 82.1 | 200 | 91.7 | 360 | 87.2 | 0.003 |
| Will not | 35 | 17.9 | 18 | 8.3 | 53 | 12.8 | ||
| Fit Index | Value | Threshold | Assessment |
|---|---|---|---|
| p-value | 0.000 | Acceptable for complex model | |
| CMIN/df | 2.863 | <3.00 | Passed |
| TLI | 0.927 | >0.90 | Passed |
| CFI | 0.94 | >0.90 | Passed |
| IFI | 0.94 | >0.90 | Passed |
| RMSEA | 0.067 | <0.10 | Passed |
| Construct | Indicator | Loading | Cronbach α | AVE | CR. |
|---|---|---|---|---|---|
| Attitude | ATD2 | 0.671 | 0.844 | 0.744 | 0.895 |
| ATD4 | 0.937 | ||||
| ATD5 | 0.951 | ||||
| Hedonic | H1 | 0.826 | 0.867 | 0.727 | 0.914 |
| H2 | 0.875 | ||||
| H3 | 0.882 | ||||
| H4 | 0.826 | ||||
| Perceived Behavioral Control | PBC1 | 0.754 | 0.888 | 0.742 | 0.895 |
| PBC3 | 0.943 | ||||
| PBC4 | 0.876 | ||||
| Subjective Norm | SN1 | 0.922 | 0.912 | 0.784 | 0.916 |
| SN2 | 0.936 | ||||
| SN3 | 0.792 | ||||
| Trust | T1 | 0.85 | 0.925 | 0.689 | 0.917 |
| T2 | 0.758 | ||||
| T3 | 0.869 | ||||
| T4 | 0.85 | ||||
| T5 | 0.819 | ||||
| Health Consciousness | HC1 | 0.799 | 0.707 | 0.499 | 0.744 |
| HC3 | 0.755 | ||||
| HC4 | 0.538 | ||||
| Purchase Intention | PI1 | 0.763 | 0.750 | 0.50 | 0.749 |
| PI2 | 0.723 | ||||
| PI3 | 0.628 |
| Fornell & Larker Criterion | |||||||||
|---|---|---|---|---|---|---|---|---|---|
| Construct | CR | AVE | H | HC | T | SN | PBC | ATT | PI |
| H | 0.914 | 0.727 | 0.853 | - | - | - | - | - | - |
| HC | 0.744 | 0.499 | 0.658 | 0.706 | |||||
| T | 0.917 | 0.689 | 0.74 | 0.637 | 0.83 | - | - | - | - |
| SN | 0.916 | 0.784 | 0.357 | 0.543 | 0.346 | 0.885 | - | - | - |
| PBC | 0.895 | 0.742 | 0.454 | 0.569 | 0.51 | 0.522 | 0.861 | - | - |
| ATT | 0.895 | 0.744 | 0.621 | 0.515 | 0.537 | 0.327 | 0.634 | 0.863 | - |
| PI | 0.749 | 0.5 | 0.313 | 0.26 | 0.267 | 0.178 | 0.305 | 0.5 | 0.707 |
| HTMT Ratio Approach | |||||||||
| PI | - | - | - | - | - | - | - | ||
| H | 0.25 | - | - | - | - | - | - | ||
| HC | 0.22 | 0.55 | - | - | - | - | - | ||
| T | 0.23 | 0.65 | 0.6 | - | - | - | - | ||
| SN | 0.19 | 0.31 | 0.51 | 0.44 | - | - | - | ||
| ATT | 0.51 | 0.55 | 0.67 | 0.37 | 0.26 | - | - | ||
| PBC | 0.32 | 0.47 | 0.53 | 0.51 | 0.54 | 0.66 | - | ||
| Fit Index | Value | Threshold | Assessment |
|---|---|---|---|
| p-value | 0.000 | Acceptable for complex model | |
| CMIN/df | 2.603 | <3.00 | Passed |
| TLI | 0.937 | >0.90 | Passed |
| CFI | 0.946 | >0.90 | Passed |
| IFI | 0.947 | >0.90 | Passed |
| RMSEA | 0.062 | <0.10 | Passed |
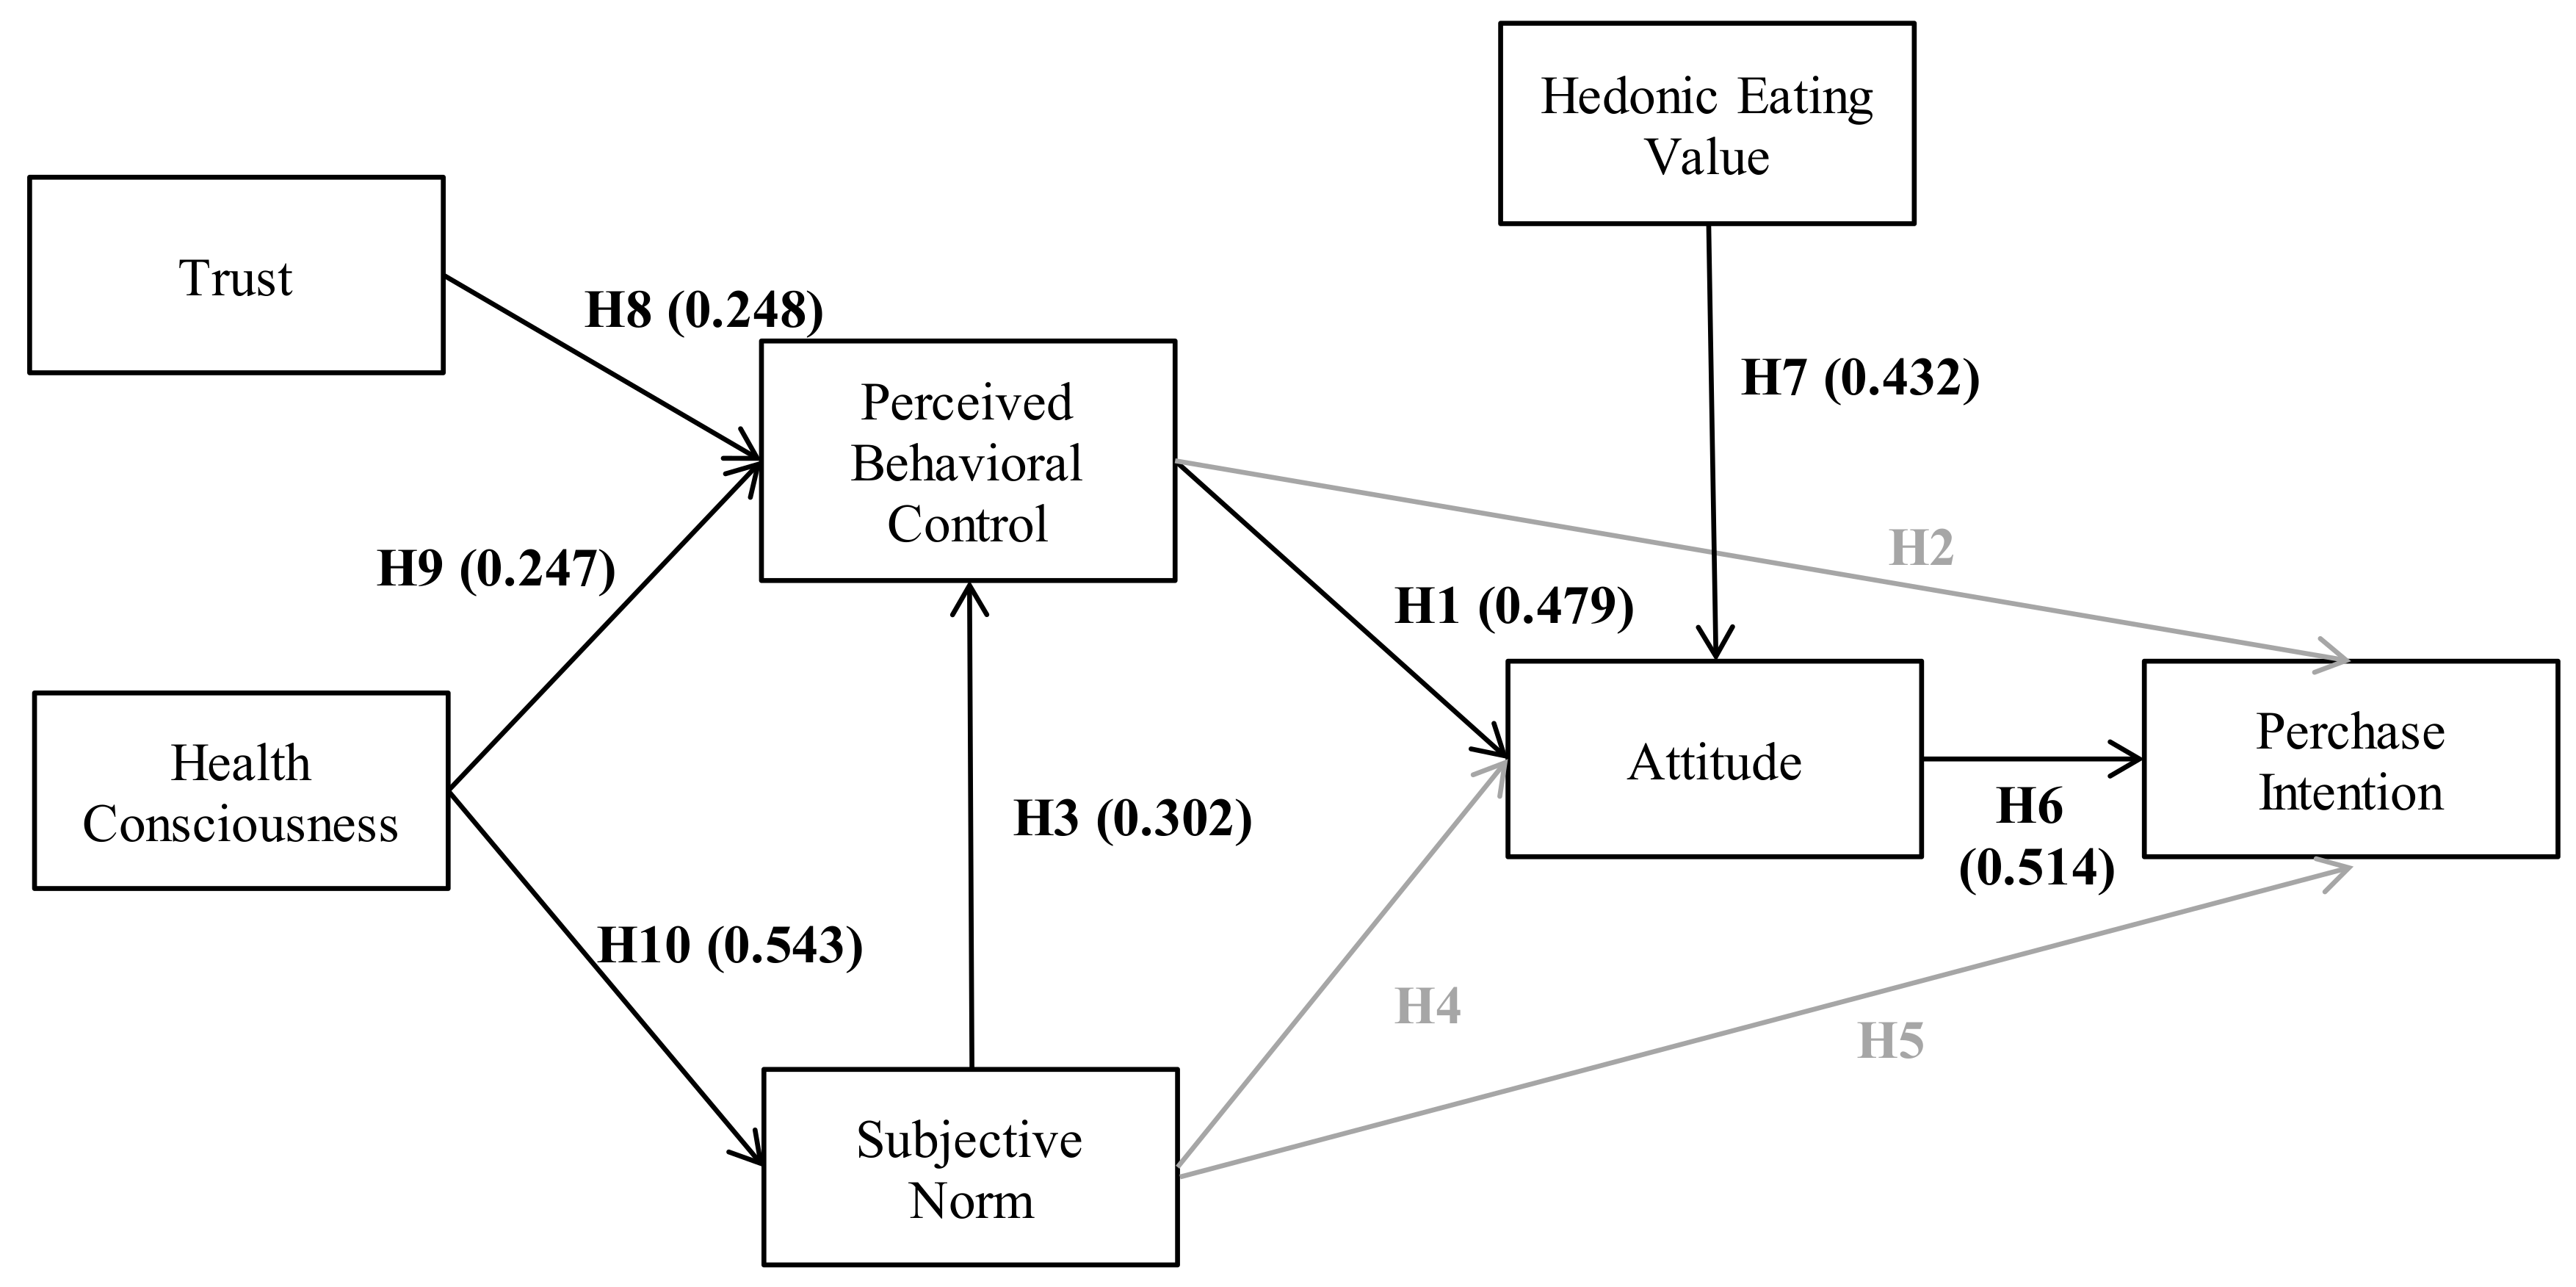
| Hypothesis | Endogenous Variable | Exogenous Variable | Model | Path | p-Value | Result |
|---|---|---|---|---|---|---|
| Coefficients (β) | ||||||
| H7 | Hedonic Eating Value | Attitude | H→ATT | 0.432 | *** | Supported |
| H8 | Trust | Perceived behavioral control | T→PBC | 0.248 | *** | Supported |
| H9 | Health Consciousness | Perceived behavioral control | HC→PBC | 0.247 | 0.002 ** | Supported |
| H10 | Health Consciousness | Subjective Norm | HC→SN | 0.543 | *** | Supported |
| H3 | Subjective Norm | Perceived behavioral control | SN→PBC | 0.302 | *** | Supported |
| H1 | Perceived Behavioral Control | Attitude | PBC→ATT | 0.479 | *** | Supported |
| H6 | Attitude | Purchase Intention | ATT→PI | 0.514 | *** | Supported |
| H2 | Perceived behavioral control | Purchase Intention | PBC→PI | −0.036 | 0.667 | Rejected |
| H4 | Subjective Norm | Attitude | SN→ATT | −0.077 | 0.105 | Rejected |
| H5 | Subjective Norm | Purchase Intention | SN→PI | 0.029 | 0.656 | Rejected |
| Fit Index | Configural Invariance (Unconstrained Model) | Metric Invariance (Equal Factor Loading) | Scalar Invariance (Equal Intercept) | Threshold |
|---|---|---|---|---|
| p-value | 0.000 | |||
| CMIN/df | 1.916 | 1.894 | 1.884 | <3.00 |
| TLI | 0.923 | 0.931 | 0.931 | >0.90 |
| CFI | 0.939 | 0.939 | 0.938 | >0.90 |
| IFI | 0.940 | 0.939 | 0.938 | >0.90 |
| RMSEA | 0.047 | 0.047 | 0.046 | <0.10 |
| Assessment | Passed | Passed | Passed |
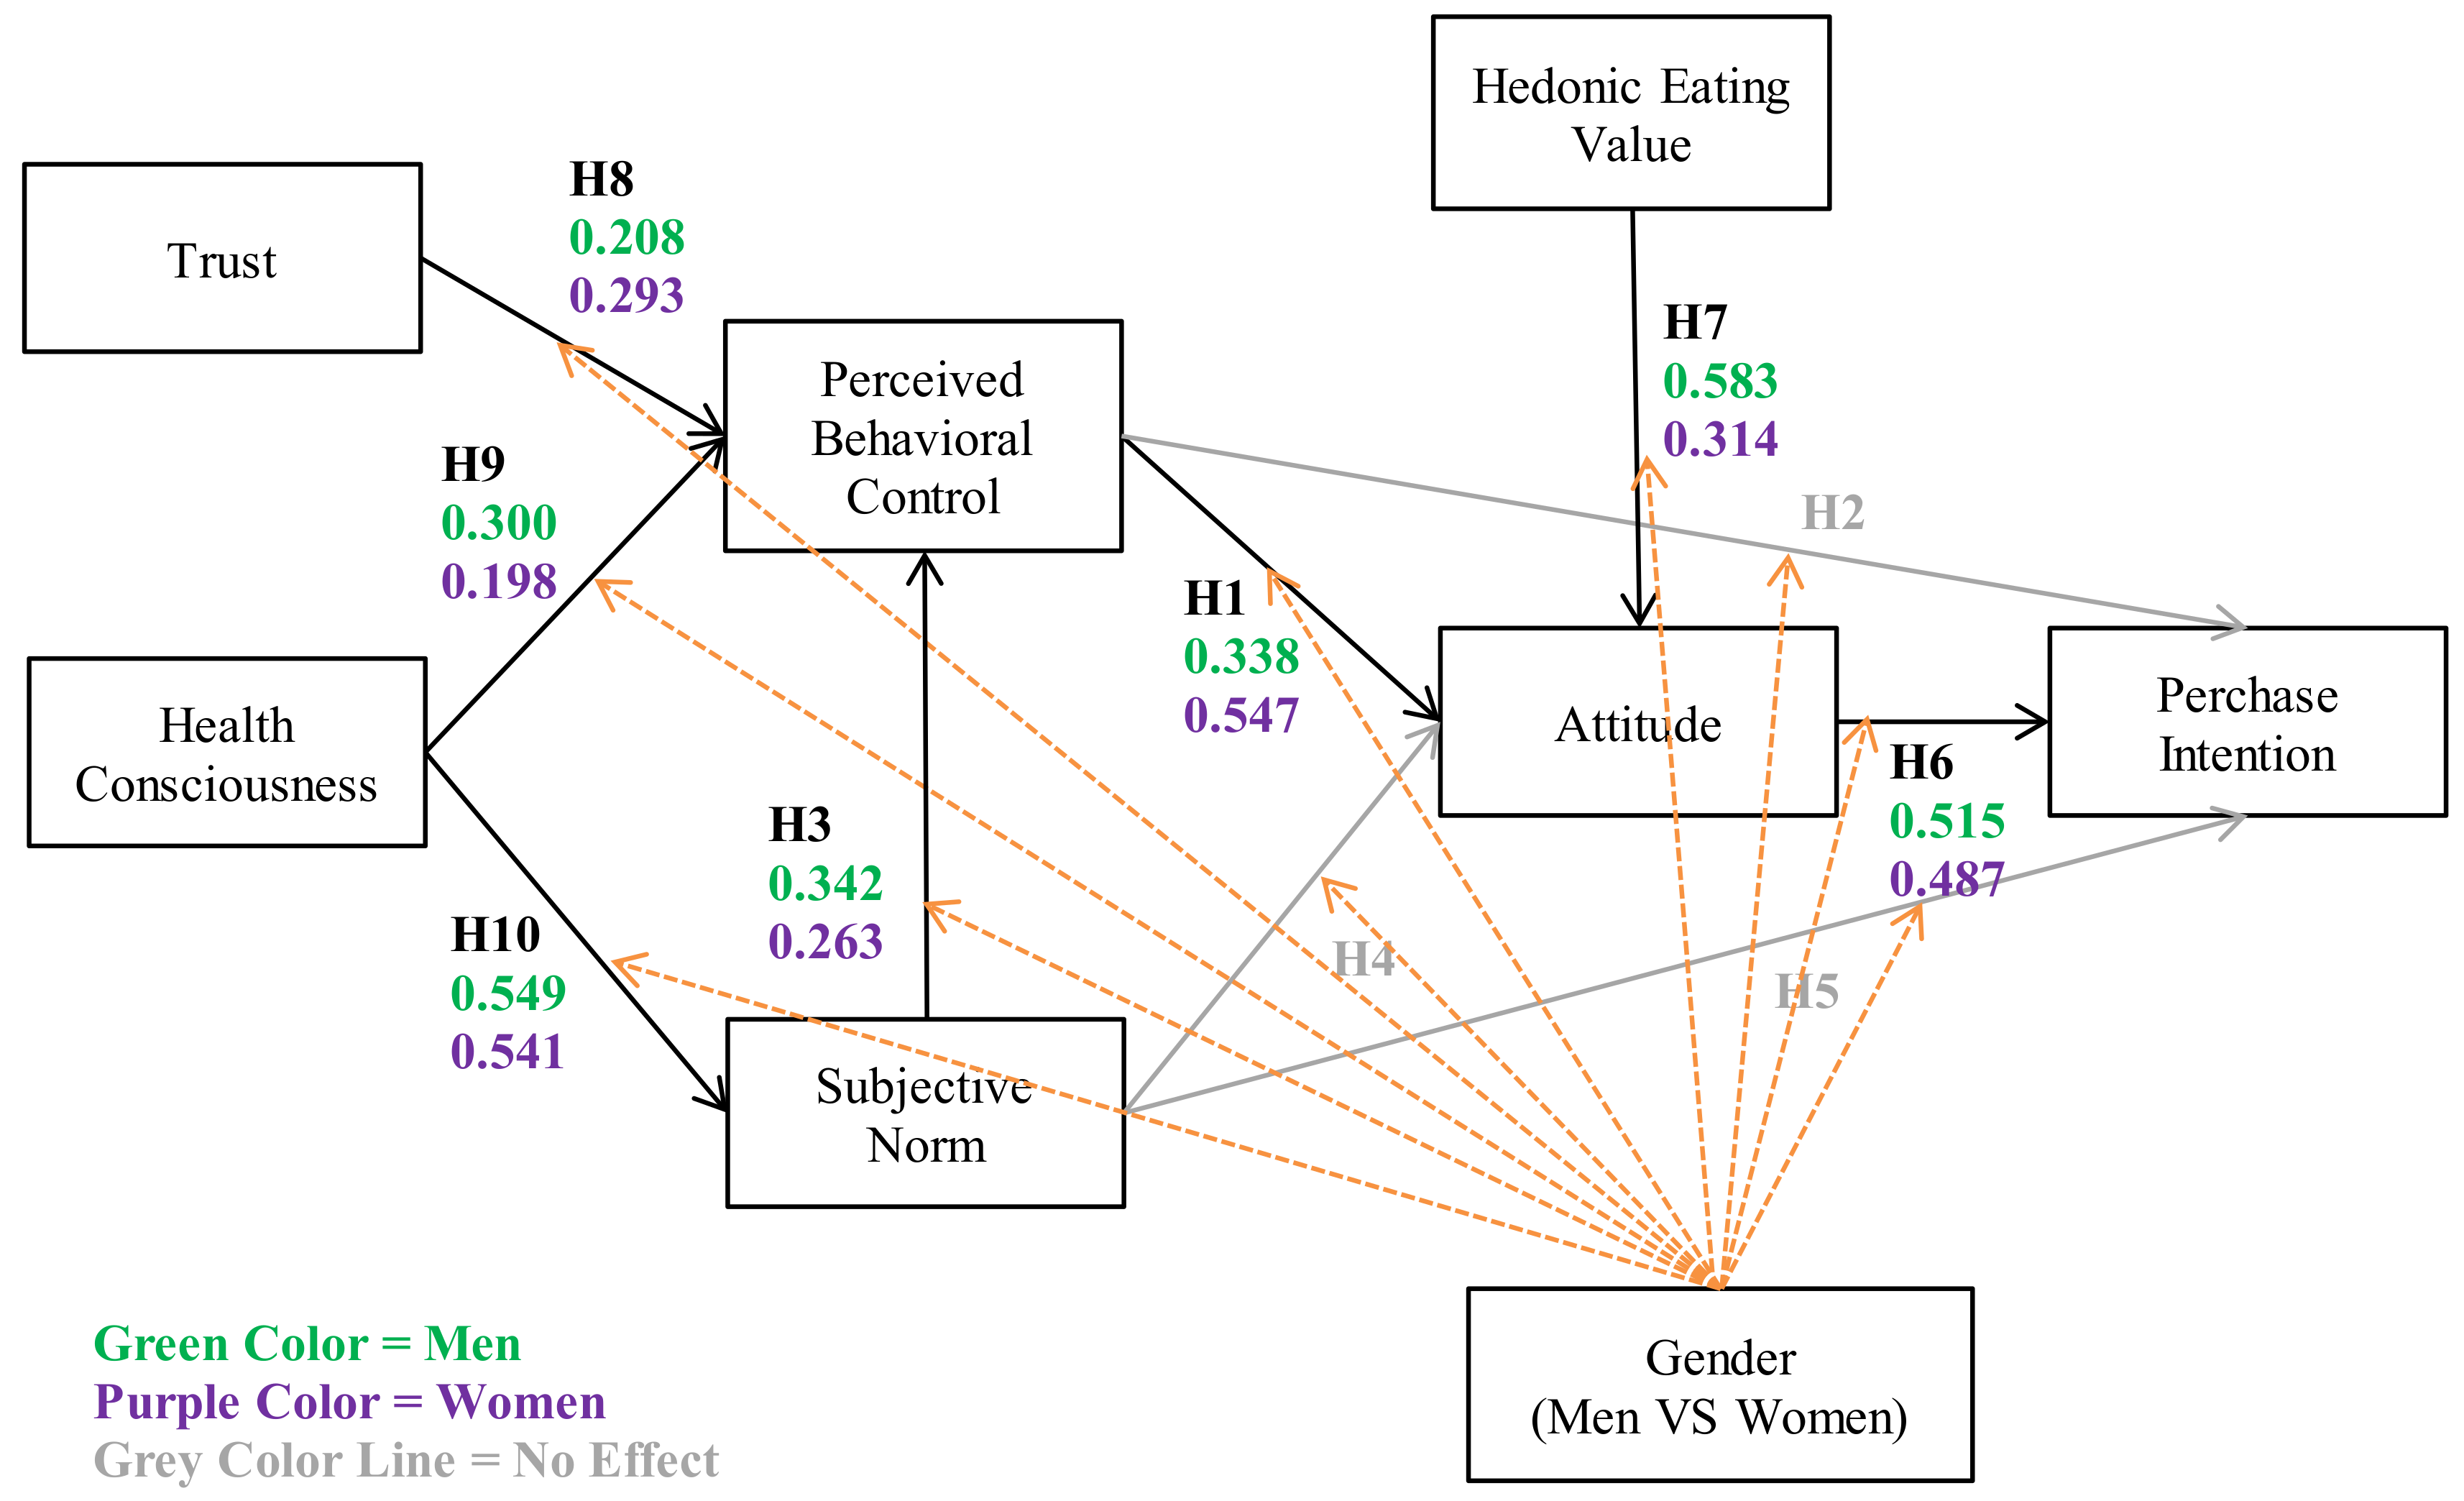
| Path | Relationship | Standardized Loading | Critical Ratio Difference | Threshold | |
|---|---|---|---|---|---|
| Men | Women | ||||
| H7 | Hedonic Eating Value→Attitude | 0.583 *** | 0.314 *** | |−2.807|* | |1.96| |
| H8 | Trust→Perceived Behavioral Control | 0.208 * | 0.293 ** | |0.758| | |1.96| |
| H9 | Health Consciousness→Perceived Behavioral Control | 0.300 ** | 0.198* | |−0.522| | |1.96| |
| H10 | Health Consciousness→Subjective Norm | 0.549 *** | 0.541 *** | |−0.47| | |1.96| |
| H3 | Subjective Norm→Perceived behavioral control | 0.342 *** | 0.263 *** | |−0.201| | |1.96| |
| H1 | Perceived Behavioral Control→Attitude | 0.338 *** | 0.547 *** | |1.034| | |1.96| |
| H6 | Attitude→Purchase Intention | 0.515 *** | 0.487 *** | |0.525| | |1.96| |
| H2 | Perceived behavioral control→Purchase Intention | −0.162 | 0.125 | |1.7| | |1.96| |
| H4 | Subjective Norm→Attitude | −0.103 | −0.063 | |−0.322| | |1.96| |
| H5 | Subjective Norm→Purchase Intention | 0.081 | −0.033 | |−0.832| | |1.96| |
Publisher’s Note: MDPI stays neutral with regard to jurisdictional claims in published maps and institutional affiliations. |
© 2022 by the authors. Licensee MDPI, Basel, Switzerland. This article is an open access article distributed under the terms and conditions of the Creative Commons Attribution (CC BY) license (https://creativecommons.org/licenses/by/4.0/).
Share and Cite
Pienwisetkaew, T.; Wongthahan, P.; Naruetharadhol, P.; Wongsaichia, S.; Vonganunsuntree, C.; Padthar, S.; Nee, S.; He, P.; Ketkaew, C. Consumers’ Intention to Purchase Functional Non-Dairy Milk and Gender-Based Market Segmentation. Sustainability 2022, 14, 11957. https://doi.org/10.3390/su141911957
Pienwisetkaew T, Wongthahan P, Naruetharadhol P, Wongsaichia S, Vonganunsuntree C, Padthar S, Nee S, He P, Ketkaew C. Consumers’ Intention to Purchase Functional Non-Dairy Milk and Gender-Based Market Segmentation. Sustainability. 2022; 14(19):11957. https://doi.org/10.3390/su141911957
Chicago/Turabian StylePienwisetkaew, Teerapong, Peerapong Wongthahan, Phaninee Naruetharadhol, Sasichakorn Wongsaichia, Chonnipa Vonganunsuntree, Siraphat Padthar, Santi Nee, Ping He, and Chavis Ketkaew. 2022. "Consumers’ Intention to Purchase Functional Non-Dairy Milk and Gender-Based Market Segmentation" Sustainability 14, no. 19: 11957. https://doi.org/10.3390/su141911957