1. Introduction
Today, the world is facing drastic environmental problems and no country is being spared from the associated changes. Several studies have documented that unsustainable consumption represents the main driver of climate change [
1,
2]. Unsustainable consumption is not astonishing for developing countries. Developed countries are also facing climatic problems. The demand for food, water, and energy is increasing, due to which biocapacity is decreasing in these countries [
3,
4]. Besides that, N-11 countries are among those countries whose ecological deficit is rising continuously. Therefore, it is important to measure the factors of ecological deficit in these nations because they are contributing to the world’s economic development. To deal with environmental problems, N-11 countries have established many environmental regulations.
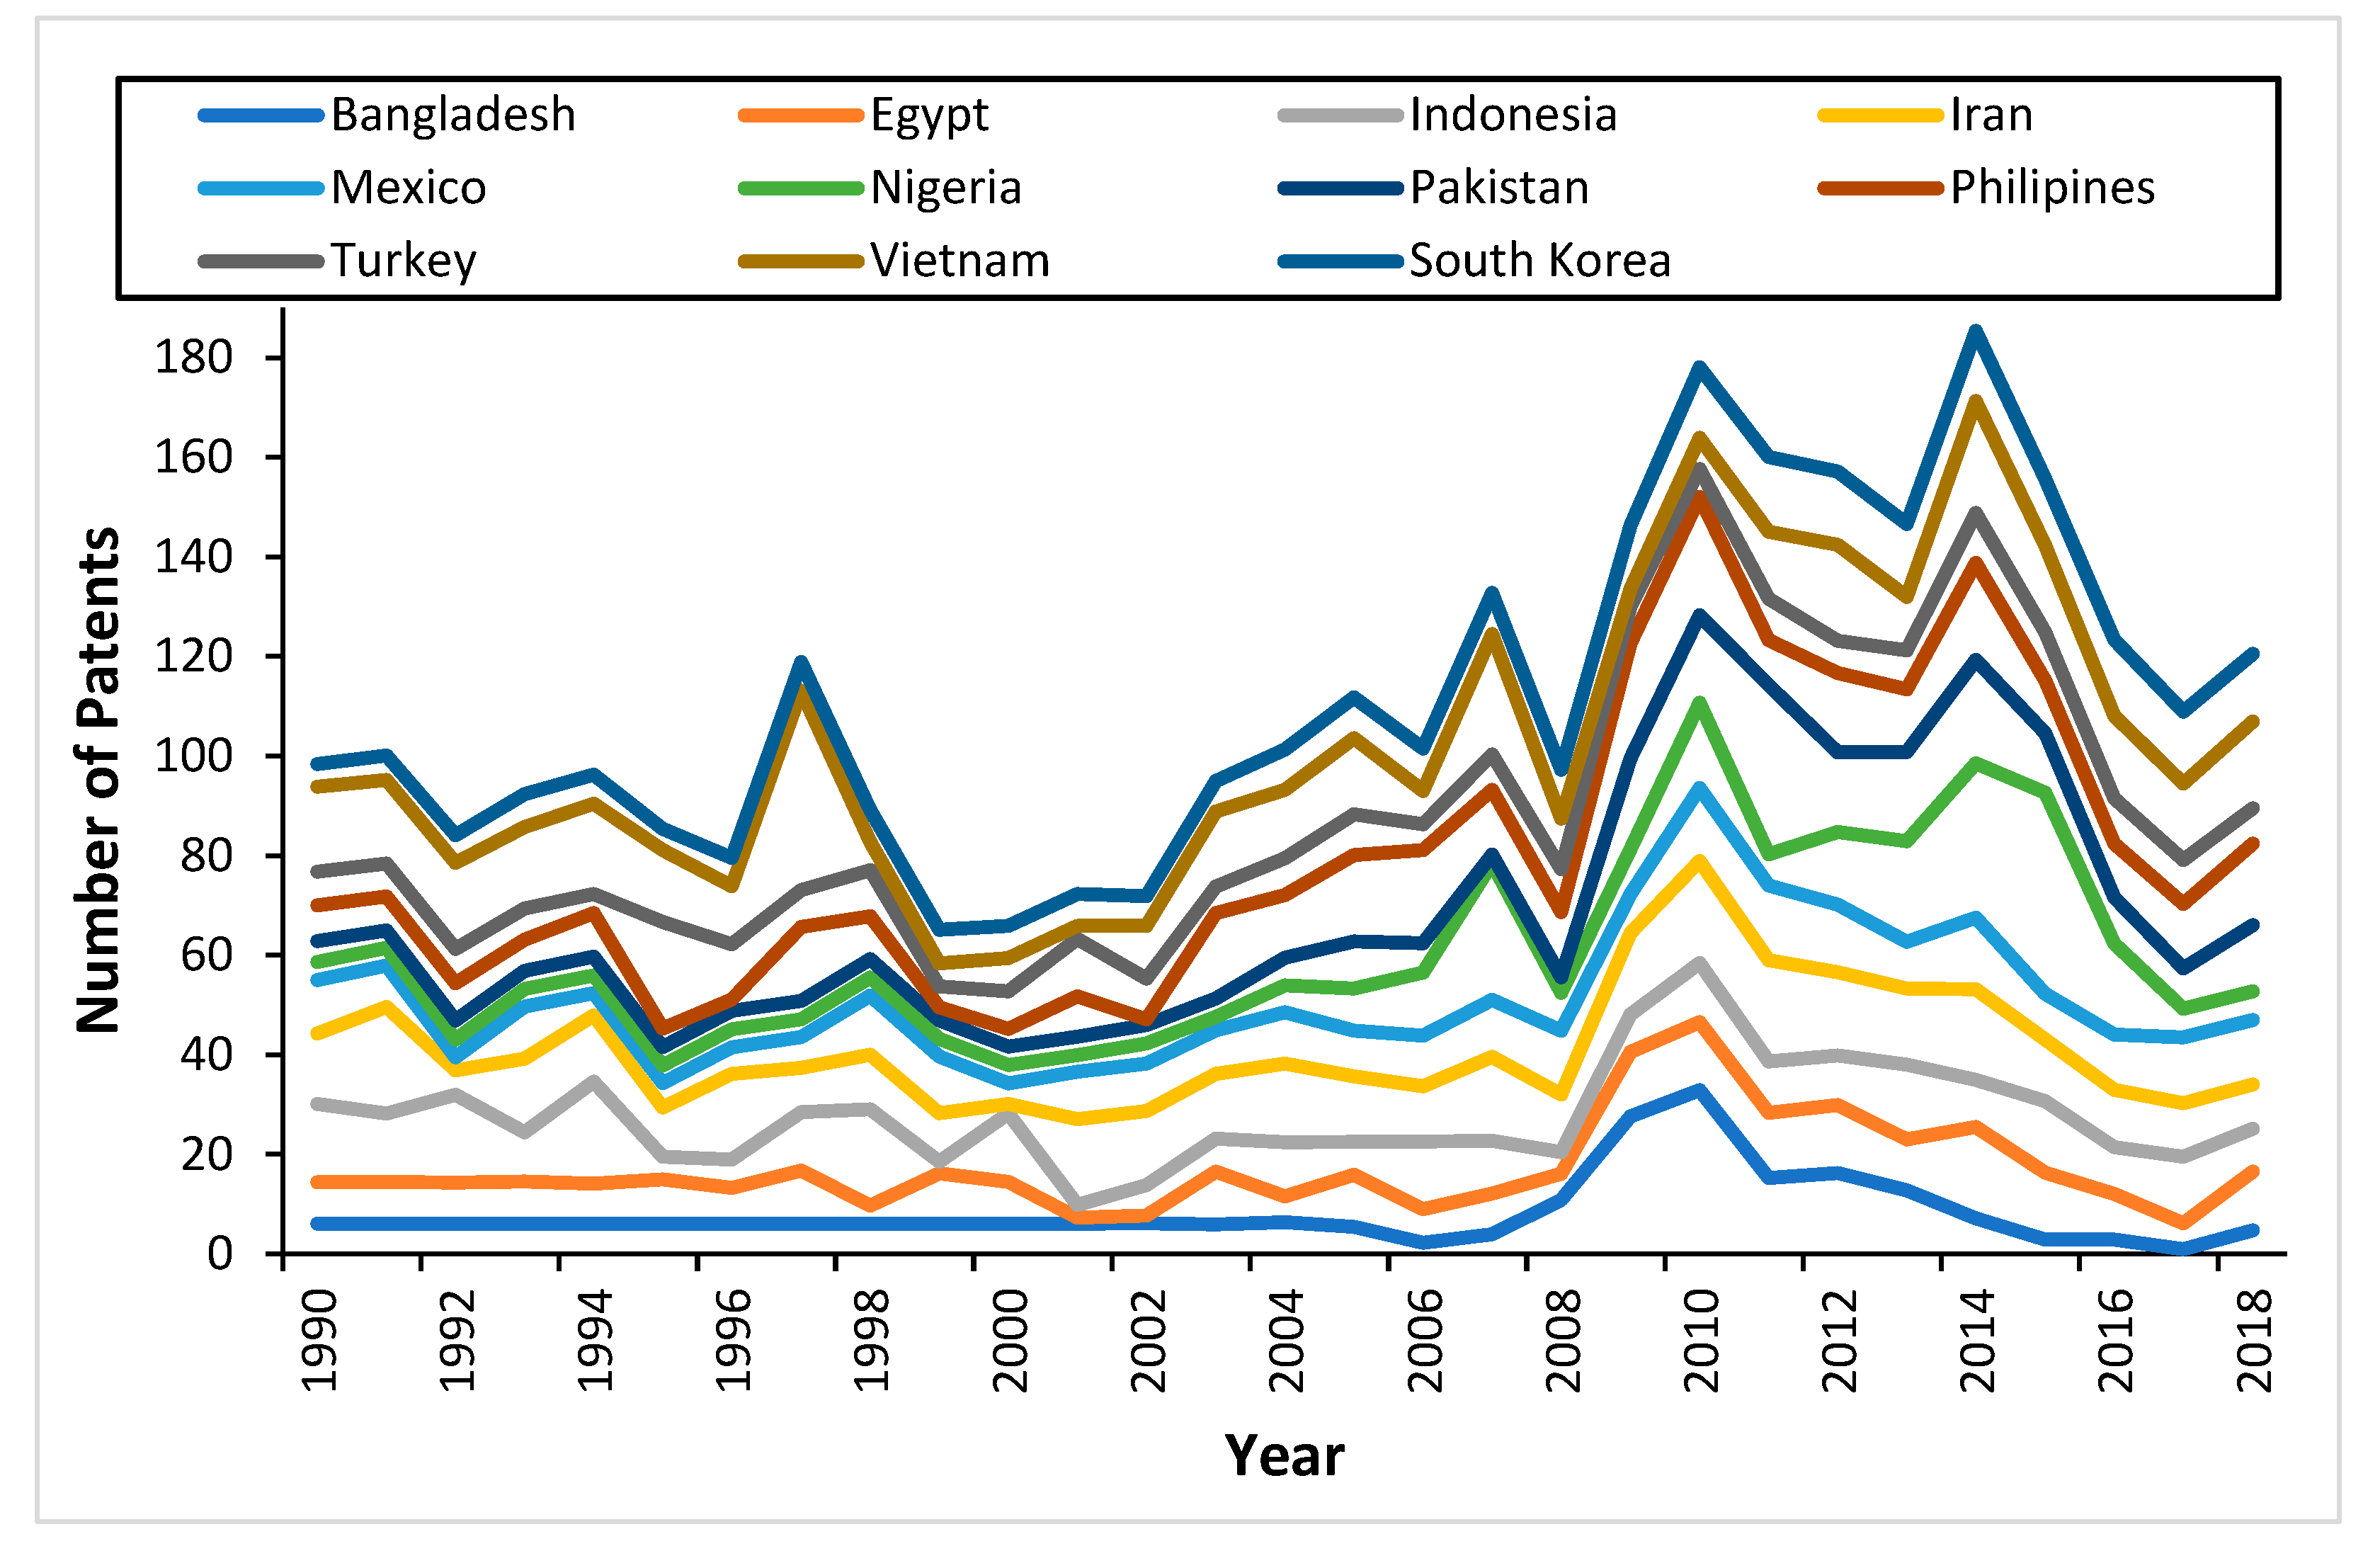
Figure 1 shows the trends of patents on environmental technologies in N-11 nations. The number of patents shows the research and development in a particular country. This activity can be enhanced if the quality of education is good and equal opportunities are provided to all citizens. The trend of patents is almost changing similarly in these countries, but the number of patents can be varied due to the diverse economic growth and population growth.
Despite the efforts to improve their environment, these countries are investing in non-renewable energy (RE) sectors, especially after the COVID-19 pandemic.
This work aims to investigate the impacts of environmental regulations (ER) and democracy (DEM) on ecological footprints (EF) in N-11 nations. This work adds other important factors of (RE) economic growth (GDP) and globalization to the model. Energy plays a fundamental role in economic development, but if this energy is from fossil fuels, it will degrade the climatic quality [
5,
6]. To curb the ecological deficit, different countries can promote efficient energy, but this energy may provide limited benefits. To reduce ecological footprints, it is important to move towards cleaner energy. These cleaner energy sources of solar, wind, and hydropower can boost economic growth and create environmental sustainability [
7,
8]. Countries must design environmental regulations to promote greener technologies and effectively manage waste. ER can reduce environmental pollution by bringing efficient sources of energy production. These efficient resources can boost greener technologies that increase economic growth without hurting the climate [
9]. On the other side, flexible environmental regulations can bring dirty technologies for energy production that can pollute the climatic quality [
10]. Therefore, in this era of globalization, countries with flexible environmental laws import more carbon than their partners with strong environmental regulations [
9]. Xiaoman et al. [
11] said that globalization is mitigating the environmental pollution in the countries that have strict environmental regulations.
ER may not provide the desired results due to poor implementation. In this context, Omojolaibi et al. [
1] cannot find an effective role of ER in the MENA region to reduce EF. Therefore, it is valid to enquire about the role of ER towards environmental pollution. It is also essential to probe the role of democracy because democracy controls environmental regulations. Several studies have documented the role of democratic accountability toward ecological sustainability in many ways. For example, media and freedom of speech increase public awareness about environmental pollution [
12]. This environmental awareness further pressurizes the government for strict environmental regulations. These strict environmental regulations further create environmental sustainability [
13]. Moreover, democratic systems create more accountability and public participation [
14]. This kind of accountability ensures the implementation of ER and reduces corruption. On the other side, the economies may focus on economic development rather than on ecological ones. Democracy is considered to have strong connections with the economic prosperity of the people and this economic growth may degrade the climatic quality. Hence, in line with the modernization theory, democracy may degrade the climate [
15].
The research works that investigated the associations of ER, democracy, and ecological footprints are very few with contradictory results. For example, Omojolaibi et al. [
1] found that democracy is degrading the climate in the MENA region, but the work by Murshed et al. [
9] proved that ER is improving air quality in south Asian countries.
This work has chosen the next eleven countries for analysis because these countries are among the leading economies that significantly contribute to the world’s GDP.
Goldman Sachs investment bank identified these countries as having the potential to become the largest economies in December 2005. The bank selected these countries on the basis of factors, including economic stability, political maturity, investment policies, trade openness, and education quality. Although these countries varied in terms of geography and economy, one thing that connects them is their high potential for economic growth and huge, growing population. Therefore, considering their economic potential, it is important to investigate the factors of ecological footprints for effective policy instruments in the future.
However, in pursuit of rapid economic growth, these countries compromised their natural environment, which is evident from their increasing ecological footprints. These countries have been actively engaged in globalization activities for the last few decades. In this context, these countries are promoting environmental innovation and a renewable energy transition to overcome ecological degradation and biodiversity loss. Considering the increasing role of globalization and ecological footprints, it is important to explore the impacts of globalization and RE on ecological footprints. The role of environmental regulations is essential for a cleaner environment and a system of government can shape the environmental regulations. Therefore, this work also includes democracy and environmental regulations in the model for N-11 nations. The effect of these variables on ecological footprint is still unclear.
In this background, this work contributes to the literature in three ways. Firstly, this work explores the linkages of environmental regulations, democracy, and ecological footprints in N-11 countries in the occurrence of renewable energy, economic growth, and globalization. The long and short-run linkages have been probed in this work because the authors have not seen any work for N-11 countries. Secondly, this work presents the estimations from the methods of cross-sectional autoregressive distributed lag (CS-ARDL), fully modified ordinary least squares (FMOLS), and augmented mean group (AMG) to compare the findings. CS-ARDL is a second-generation method and provides short and long-run coefficient values. This method also provides the error correction term (ECM), which shows the stability of the model. The AMG method is an efficient method that includes the CD in the panel data and provides coefficient values. Thirdly, this study has taken ecological footprints as a proxy for environmental pollution. EF presents a holistic approach to studying environmental pollution as a sum of soil, air, and water pollution [
2,
16]. On the other side, CO
2 emissions capture energy-related pollution only [
17]. Therefore, this work is utilizing the guidelines of recent literature in taking EF as a proxy for environmental pollution.
2. Literature Review
Previous studies have documented the impacts of ER on EF from different perspectives. For example, Danish et al. [
18] used the FMOLS method to investigate the impacts of ER on CO
2 emissions in BRICS. They validated the environmental Kuznets curve (EKC) and found that ER is reducing CO
2 emissions. Wenbo et al. [
19] found that ER mitigates air pollution in Chinese provinces, but this association is subject to regional variations. They also validated the EKC in 30 Chinese provinces.
Yang et al. [
20] found that ER is linked with the companies that are relocated in the areas with weak ER in China. They found that different areas responded differently to different ER. For OECD countries, Hashmi et al. [
21] used random and fixed effect models and found that ER reduces CO
2 emissions. On the flip side, Wang et al. [
22] showed that innovations are increasing the CO
2 emissions due to rebound effects. Moreover, ER can slow down economic growth in developing nations. Pei et al. [
23] reported that ER not only lowers CO
2 emissions, but also enhances environmental quality through efficient technologies. Zhang et al. [
24] found that ER is improving air quality in China at the national level, but the unification of ER and industrial production is useful in some regions and not useful in other regions. Zhao et al. [
10] found that ER helps to reduce CO
2 emissions and it is also helping in making energy-efficient resources in China.
Considering the EF and ER connection, Murshed et al. [
25] said that ER is reducing EF in south Asian countries due to renewable energy consumption. Omojolaibi et al. [
1] said that economic growth and energy use are degrading the climate, but ER does not affect EF in the MENA region. Shahzad [
26] studied an inclusive literature survey to know the ER and EF linkages. They found that this association is still ambiguous and needs more scrutiny. Wang et al. [
27] argue that market-oriented environmental regulation tools can play a pivotal role in improving the green total factor energy efficiency, which improves the environment. Ahmed et al. [
28] probed the linkages of economic complexity, democracy, and RE budgets on EF over the years 1985–2017 in G-7. They found that democratic accountability is increasing EF, but that RE and financial development curb EF. Huang [
29] found that communication technologies, economic complexities, and human capital contribute to more environmental pollution. RE is improving air quality in G-7 nations. Addai et al. [
30] investigated the impacts of urbanization and economic growth on EF in eastern Europe. They pointed out that urbanization and economic growth are reducing EF. Qin et al. [
31] validated EKC in G-7 nations. They found that composite risk index and green innovations improve air quality. Abbas et al. [
32] investigated the impacts of RE, non-RE, transport, and urbanization on CO
2 emissions in Pakistan. They found that urbanization, transportation, and non-Re are degrading the climate.
At the same time, several studies investigated democracy and EF linkages. Güngör et al. [
14] applied the pool mean group (PMG) method to nine countries and found that democracy (DEM) mitigates CO
2 emissions. Moreover, Adams et al. [
33] found that DEM and renewable energy (RE) lowers CO
2 emissions in African countries. Murshed [
34] documented that DEM lowers deforestation and helps to validate the EKC in Bangladesh. Akalin et al. [
15] said that DEM is increasing EF in OECD countries but RE is increasing environmental quality. Shao et al. [
35] examined the impacts of green innovations and RE on CO
2 emissions in N-11 nations. RE and green innovations are important for a cleaner environment. Agheli and Taghvaee [
36] found that there is a connection between political stability and the environment. Li et al. [
37] found that environmental accountability can lower the environmental pollution in China. Banik [
38] found that democracy can bring sustainable development effectively. Zhao et al. [
39] found that green technology is an effective factor that can lower ecological footprints.
From the above arguments, the impacts of ER and DEM on EF are scant. Different studies have found contradictory findings and the literature on this topic is inconclusive. Therefore, this study investigates the impacts of DEM and ER on EF in the panel of N-11 countries.
3. Theoretical Basis, Data, Model, and Methodology
Today, developed and developing countries are facing the problems of environmental pollution. In efforts to mitigate the environmental pollution, nations are striving for clean energy production. Governments are increasing the research and development projects by approving special budgets through regulations. A fair and transparent regulatory body is essential to launch transparent regulations. In this regard, it is important to analyze the linkages of renewable energy production, environmental regulations, and democracy on ecological footprints.
This paper investigates the impacts of democracy (DEM), environmental regulations (ER), renewable energy (RE), economic growth (G), and globalization (GL) on ecological footprints (EF) in N-11 countries (Egypt, Bangladesh, Iran, Indonesia, Nigeria, Mexico, Philippines, Pakistan, South Korea, Turkey, and Vietnam). This work adopts the EF as a proxy for environmental pollution. Unlike CO
2 emissions, EF takes environmental pollution from a holistic approach. EF considers the soil, wind, and water pollution (current). Economic growth is well known for its contribution to ecological degradation because it requires huge energy [
40]. However, RE provides an important substitution for energy usage and it contributes to economic growth [
8]. Nevertheless, nations implement effective ER for energy efficiency [
26]. ER not only curbs environmental pollution but also increases the RE for economic growth. The ER is implemented by political institutions. Democracy is an important political condition that increases freedom of speech through media and enhances environmental awareness. Therefore, democracy makes the citizens pressurize their governments for strict environmental regulations. The implementation of strict environmental regulations further improves environmental sustainability [
13]. Finally, globalization can import energy-intensive technologies that can pollute the climate because bilateral trade can import dirty technologies to developing countries with flexible environmental regulations [
9]. On the other side, globalization can also lower the
EF by importing efficient technologies [
41]. The data concerning
EF were obtained from the global footprint network. The data on
RE and GDP were obtained from the World Bank. Environmental regulations, democracy, and globalization data were obtained from the OECD, ICRG, and KOF institute, respectively. Hence, considering the above discussion, the following will be the model for this work:
where
EF is ecological footprints in global hectors,
DEM is democracy measured by the democratic accountability index,
ER is environmental regulations calculated by the patents related to environmental technologies,
G is economic growth,
GL shows globalization (overall index), and RE is renewable energy (% of total energy).
Table 1 shows the variables, their description, and sources.
All the data is transformed into their log form. Log form increases the sharpness of the data and provides robust results [
42]. The log form of equation is as follows:
This work utilizes the annual data of 1990–2018 for all variables. The data before 1993 for
ER were unavailable for some countries. Therefore, this work used the interpolation method to complete the data for a balanced panel. This work follows the [
9,
18] to take patents related to environmental technologies as a proxy for
ER. The data for
ER and
EF were retrieved from OECD and GFN respectively. Renewable energy data were obtained from the World Bank. RE consists of solar, wind, and hydropower energy. Democratic accountability data has been obtained from the ICRG database. ICRG index consists of a range from 0 to 6. The high value represents more democratic accountability and vice versa. Globalization data were obtained from the KOF institute. The data for economic growth were obtained from the world bank.
3.1. Methodology
This work relies on panel data estimation because the data are for 29 years with 11 cross sections. Before the econometric methods, it is compulsory to conduct cross sectional dependence (
CD) test. Globalization has made all the countries on a single platform experience economic growth. Therefore, the data for the panel countries may have similar variations. This outcome can affect the consistency of the estimation method. To overcome this problem, Pesaran [
43] is applied to
CD in the panel data.
Therefore, the equation for this test is as follows:
where
T and
N represent time and cross-sections.
is an association of errors. The next step is to check the slope homogeneity of the data. The nature of the panel data was introduced by Pesaran and Yamagata [
44]. The equation form of slope test is as under:
After examining the CD, the next step is to check the stationarity property of the data. The existence of CD can affect the results of first-generation unit root tests. Therefore, this work applies the second-generation unit root test of cross-sectionally augmented IPS (CIPS) and CADF tests. These tests control the CD in the data and provide robust results.
3.2. Co-Integration Test
This work moves forward to ascertain the co-integration among ecological footprints, RE, financial globalization, GDP, and natural resources. For this purpose, the work applies Westerlund [
45] the cointegration test. The test is effective in providing robust results in the presence of
CD in the data. The equations are as follows:
shows the yearly correction.
3.3. Long and Short-Run Analysis
Among the available empirical methods of FMOLS and DOLS, this research selects the CS-ARDL method by Chudik et al. [
46] to gain short and long-run coefficient values. CS-ARDL provides authentic results while considering the CD in the data. First-generation tests cannot do this. Therefore, the equation for this test is as under:
where
= (Δ
EFt AEVt) signifies the averages of cross-section and
AEV shows a set of illustrative variables.
3.4. Robustness Check Test
To cross-check the findings and to ensure robustness, this work employs the augmented mean group (AMG) methods and fully modified ordinary least square (FMOLS). This method takes into account the CD and heterogeneity problems [
47].
4. Results and Discussion
This section consists of all the test results in ascending form. This means the tests of CD, slope homogeneity test, unit root test, co-integration test, log run and short run analysis, and robustness check tests. Before the estimation, this work checks for any multicollinearity in the panel data. For this purpose, the variance inflation factor (VIF) is sought.
Table 2 shows the relevant findings. It was noted that the value is below 5 for each variable. This means that there is no multicollinearity in the panel data.
The next step is to apply the CD test to check the cross-sectional dependence among the panel data.
Table 3 is shows the results of the cross-sectional dependence analysis.
It can be noted that data for
EF,
ER,
G,
GL, and
RE present cross-sectional dependence at a 1% level except DEM. This means that the panel data of N-11 countries are interlinked strongly. This CD is due to similar socio-economic conditions. The next step is to check the slope homogeneity.
Table 4 shows the relevant results.
According to
Table 4, the delta and adjusted delta values are significant at a 1% level. The successive step is to find out the unit root test in the panel data. This work utilizes two-unit root tests of CIPS and CADF and
Table 5 shows the relevant results.
Unit root test findings are showing that all the variables have mix order of integration, but all the variables show stationarity at first difference. This means that ecological footprints, renewable energy, globalization, economic growth, democracy, and environmental regulations are moving together in the long run. The next step is to find out the co-integration in the panel data. For this purpose, Westerlund [
45] is applied.
Table 6 shows the relevant findings.
According to the results, two values of the group and two values of the panel are significant at a 5%, and 10% level. This means that EF, RE, DEM, ER, GLO, and GDP are strongly co-integrated in the long run. This outcome further makes way to conduct cross sectional autoregressive distributed lag (CS-ARDL) approach to find out the coefficient values in the long and short run. CS-ARDL is an efficient approach that provides long and short run coefficient values for panel data. This method also provides error correction term (ECT). ECT provides the stability of the model. Short run values may differ from long run values.
Table 7 is showing the results of the CS-ARDL method. The CS-ARDL method controls the CD in the panel data and provides short and long run values.
The results are showing that economic growth is positively linked with EF. This result is similar to the findings of Zafar et al. [
8] in G-7 nations. Economic growth is achieved with services and the consumption of goods. When the income level rises, it is accompanied by the consumption of food, energy, and water. It also generates waste at the industrial, transportation, and residential levels. Due to such consumption, the environment degrades, and EF enhances. This result is in line with the findings of Ahmed et al. [
48]. The coefficient value of RE is −0.093. This means that a 1% increase in renewable energy is lowering EF by 0.093% in the long run. This result is similar to the findings of Nathaniel et al. [
49] in CIVET nations, Peng et al. [
50] for BRICS countries, as well as Ahmad et al. [
17] for emerging countries. Energy use is essential for continued economic growth, and it is the renewable energy from solar, wind, and hydro power that enhances sustainable growth. Therefore, RE consumption can boost environmental quality with sound economic growth.
The value of environmental regulation is negative and significant. This means that a 1% increase in ER will lower the EF by 0.007% and 0.004% in the short run and long run in N-11 countries. This novel finding contradicts the findings of Omojolaibi et al. [
1], who found that ER does not affect EF in MENA countries. Our finding is in line with the findings of Murshed et al. [
9], who found that ER is improving the climate in South Asian countries. This result is showing that strict environmental regulations have the ability to lower the EF in N-11 countries. Environmental regulations lower the use of fossil fuels and enhance the usage of RE. ER is calculated by the patents-related environmental technologies. These technologies enhance the environmental related machineries that lower EF. Hence, N-11 countries should enhance environmental-related technologies to mitigate the EF.
Democracy is decreasing the ecological footprints. A 1% increase in democratic accountability is lowering EF by 0.066% in the short run and 0.038% in the long run in N-11 countries. This result is acutely consistent with the findings of Akalin et al. [
15] in OECD nations but contradictory with the findings of Usman et al. [
51], who documented that democracy increases the people’s welfare only by increasing economic growth. Economic growth uses energy, which degrades the climate. This outcome is supporting the argument that democracy increases the freedom of speech through media and it also increases public awareness about environmental problems. This awareness further pressurizes the governments for strict environmental regulations [
13]. Moreover, a high level of accountability and public participation are important components of democracy [
14]. This kind of condition further makes it easy for government organizations to launch environmental policies and implement them at commercial and domestic levels. This finding is in line with the findings of Güngör et al. [
14] and Acheampong et al. [
52].
Finally, globalization is lowering EF in N-11 countries, indicating that globalization is supporting environmental sustainability in N-11 countries. This result supports the results of Ahmed and Le [
41] in ASEAN nations but contradicts the findings of Ahmad et al. [
53], who found that globalization escalates the ecological footprints in emerging countries. This finding is important for the N-11 countries. These countries should continue to import green technologies from the developed nations because it is helping to lower EF in the long run.
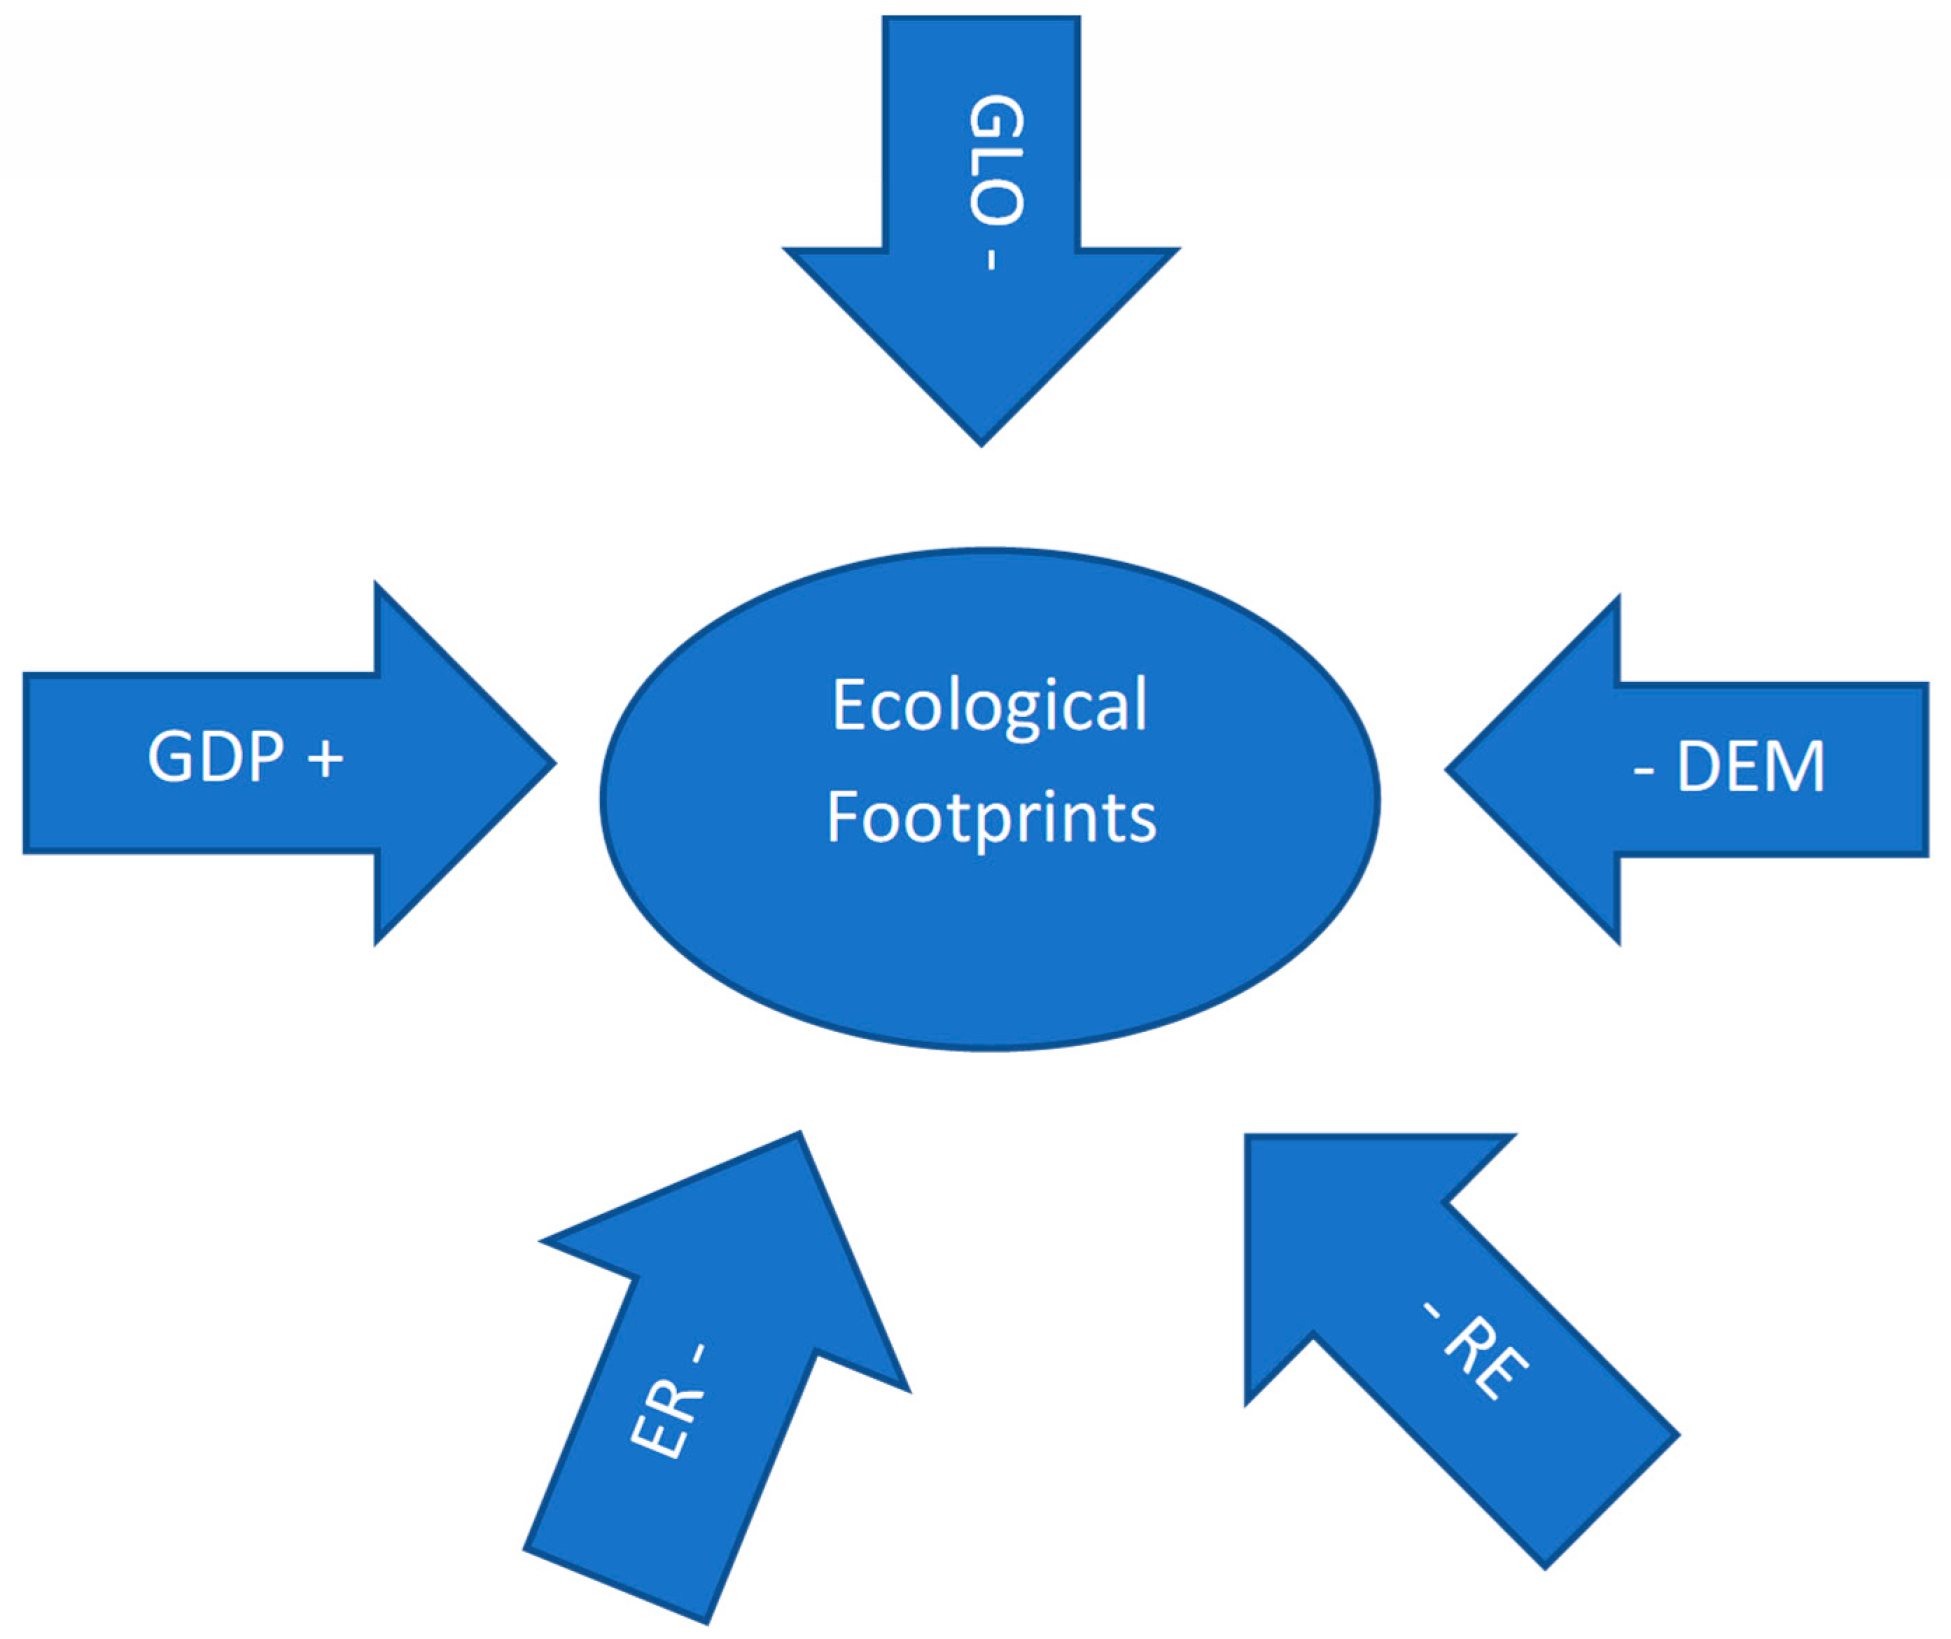
Table 8 shows the results of the robustness check analysis of AMG and FMOLS tests. AMG and FMOLS are efficient methods that can consider the cross-sectional dependence in the panel data while giving the authentic results. These methods provide results on the base of probability values. The findings endorse the results of the CS-ARDL method that ER, DEM, GLO, and RE are environmentally friendly but economic growth is contaminating the climate. This means that N-11 nations are still consuming high ratio of fossil fuels to achieve rapid economic growth. Therefore, it is need of the hour to increase the % of RE in total energy mix. Moreover, strict environmental regulations will encourage the corporate sectors to adopt RE. A graphical representation of the results is provided in
Figure 2.
5. Conclusions and Policy Recommendation
This work probes the impacts of environmental regulations and democracy on ecological footprints in N-11 countries. Other important factors of economic growth, renewable energy, and globalization are also included in the model. This study utilizes the annual data from 1990–2018 and applies the second-generation unit root and cointegration tests of CIPS, CADF, and Westerlund. This work applies CS-ARDL with some robustness check tests, namely FMOLS and AMG tests. The findings show that democracy, environmental regulations, renewable energy, and globalization are contributing factors to environmental quality. Economic growth is increasing ecological footprints in N-11 countries.
Based on the findings, this work is suggesting that N-11 countries should strengthen their democratic institutions to mitigate their ecological footprints. Democratic accountability will strengthen the environmental regulations that increase renewable energy consumption. In this regard, it is important to enhance public participation in the environmental regulatory processes. The accountability for the allocation of investment for environmental-related purposes should also be increased. Media channels should be used to enhance public awareness about environmental problems. This aspect can be amplified by using the freedom of speech aspect of democracy.
Although N-11 countries have made many commitments to environmental sustainability, they have still heavily invested in fossil fuel-related energy. Therefore, high taxes should be imposed on fossil fuels to promote renewable energy. There is a need to invest in creating more environmental-related technologies. The role of globalization is vital in this regard because globalization has three dimensions of economic, political, and social globalization. These three indices play a fundamental role in increasing collaborative efforts of the people across the world. These collaborations further guide the developing nations in how to change their lifestyle according to a changing nature. Moreover, globalization helps to import environmentally friendly machinery from the developed world.
This work provides important insights regarding the impacts of democracy and environmental regulations on ecological footprints in N-11 countries. This study used a limited time dimension (1990–2018) for empirical analysis. Future research work can check the moderating role of environmental regulation in the nexus between economic growth and ecological footprint by expanding the time framework.


 ,
, 

