Article

A Macroinvertebrate-Based Multimetric Index for Assessing Ecological Condition of Forested Stream Sites Draining Nigerian Urbanizing Landscapes

by
Augustine Ovie Edegbene
1,2,*,
Frank Chukwuzuoke Akamagwuna
1,
Oghenekaro Nelson Odume
1,
Francis Ofurum Arimoro
3,
Tega Treasure Edegbene Ovie
4,
Ehi Constantine Akumabor
5,
Efe Ogidiaka
6,
Edike Adewumi Kaine
7 and
Kehi Harry Nwaka
8
1
Institute for Water Research, Rhodes University, Makhanda 6140, South Africa
2
Department of Biological Sciences, Federal University of Health Sciences, Otukpo 972261, Nigeria
3
Department of Animal Biology, Federal University of Technology, Minna P.M.B. 65, Nigeria
4
Department of Chemistry, Federal University of Health Sciences, Otukpo 972261, Nigeria
5
Safety and Security Management Division, Department of Engineering Management Services, Federal Ministry of Works and Housing, Abuja 900108, Nigeria
6
Department of Marine Science, University of Delta, Agbor 321103, Nigeria
7
Department of Animal and Environmental Biology, Delta State University, Abraka 330105, Nigeria
8
Department of Planning, Research and Statistics, Ministry of Education (Technical), Asaba 320242, Nigeria
*
Author to whom correspondence should be addressed.
Sustainability 2022, 14(18), 11289; https://doi.org/10.3390/su141811289
Submission received: 8 August 2022 / Revised: 1 September 2022 / Accepted: 3 September 2022 / Published: 8 September 2022

Abstract

:
Urban pollution is increasing at an alarming rate within the catchments of forested riverine systems in sub-Saharan Africa, Nigeria inclusive. Assessing the impact of pollution in riverine systems in the Niger Delta region is still within the use of physico-chemical variables and biota-based assemblage. In covering this important gap in freshwater biomonitoring, we developed a macroinvertebrate-based multimetric index (MMI) that would be useful in monitoring, assessing, and managing forested riverine sites affected by urban pollution. We collected macroinvertebrates and physico-chemical samples monthly at 20 sites in 11 streams. Physico-chemical variables were analysed using standard methods while a kick sampling procedure was employed in collecting macroinvertebrates. The physico-chemical variables were used to classify the sites into three disturbance categories: least-impacted sites (LIS), moderately impacted sites (MIS), and heavily impacted sites (HIS). Fifty-nine candidate macroinvertebrate metrics were selected and screened for developing our MMI. We employed sensitivity, seasonality, repeatability and redundancy tests, and metric scoring in screening and arriving at the final metrics for the MMI development. Five metrics were finally selected for the MMI development: Trichoptera abundance, %Chironomidae+Oligochaeta, Coleoptera richness, Simpson diversity, and Shannon–Wiener index. Correlation in the selected metrics with physico-chemical variables showed that Simpson diversity was negatively correlated with pH in the MIS and Coleoptera richness was positively correlated with dissolved oxygen (DO) and water depth in the LIS. Nitrate, biochemical oxygen demand (BOD), conductivity, and water temperature were negatively correlated with %Chironomidae+Oligochaeta in the HIS. This MMI can aid river and stream managers in assessing the ecological conditions of rivers and streams in the Niger Delta region of Nigeria.

1. Introduction

Anthropogenic activities are increasing at an alarming rate in the catchments of forested riverine systems in sub-Saharan Africa as a result of increased urban development, driven by rural–urban migration [1,2]. It has been reported that urban development negatively affects the ecological condition of riverine systems, including deterioration of water quality and physical habitat structure, as well as altered biological structure and function [2,3,4]. Our study area, the Niger Delta region of Nigeria, used to be home to numerous inland waters, mangrove swamps, and creeks with thickly forested catchments. However, recently the forested catchments have been subjected to increasing urban activities and most of the forested riverine systems in the area are now draining partially urbanised catchments [5].
Forests are important natural components in river catchments in the Niger Delta and throughout the tropical rain forest belt of Nigeria. Many forested rivers and streams within the Niger Delta are influenced naturally by processes occurring as a result of forest dominance, such as shading, leaf litter, and hydrological predictability [6,7]. Allochthonous food resources and shading resulting from the forested riparian zones are critical for determining the assemblage structure and function of naturally forested riverine systems [6,7]. The river continuum concept from Vannote et al. [6] predicts a pattern for forested rivers and streams where soluble organic materials, coarse particulate organic matter (CPOM), and dominance of macroinvertebrate shredders and collector–gatherers are common. The shredders and collector–gatherers accelerate the breakdown and transformation of CPOM into fine particulate organic matter (FPOM) [6,8]. However, urbanisation reduces the dense tree canopy and increases water temperatures [2], thereby reducing the dominance of shredders and collector–gatherers [9]. The rapid urbanisation of the Niger Delta region is of great concern to river managers. Therefore, developing cost-effective biomonitoring tools that would be useful in monitoring the effects of urbanisation and urban pollution on these systems is pertinent.
In developing biomonitoring indices for riverine systems, a number of approaches have been employed globally [10,11,12,13]. These approaches include single biotic indices, multivariate analyses, functional feeding groups, and structure- and trait-based multimetric indices (MMIs) [2,10,11,12,13] and these approaches have their advantages and disadvantages. Bonada et al. [10] explicitly outlined the advantages and disadvantages of biotic assessment approaches. The advantages of some of these approaches are as follows: (i) the single biotic index approach awards a pollution sensitivity score to each taxon and averages the total for a sampled site, (ii) multivariate analyses are developed by comparing control sites with impaired sites, (iii) the functional approach is based on the feeding habits of biota, (iv) the trait-based approach takes into account physiological, behavioural, and biological characteristics of taxa, and (v) multimetric indices (MMIs) incorporate all or most of the approaches into a single score [10,11,12]. The MMIs potentially include biotic indices, such as taxonomic, trait, and functional metrics, as well as abundance, composition, richness, and diversity and, therefore, have been reported to be more robust and effective than other biomonitoring indicators [4,10,11,14]. The MMIs are more advantageous based on the following premise: the single biotic index score is awarded to only one taxon and can only be used to judge organismal responses to disturbance in a local context. The multivariate approach takes into account one site per time and cannot be used to assess the ecological health of a whole stretch of a riverine system. The functional and trait-based approaches only define the feeding habits and characteristics of taxa despite the fact that they can be employed widely in several geographical regions. However, the MMIs take into account all the approaches, which makes them more robust for the development of biotic indices in most quarters [2,3,4,10,13,14].
In developing MMIs, aquatic fauna and flora, such as aquatic macrophytes, phytoplankton, diatoms, macroinvertebrates, fish, and birds, have been widely employed globally [13,14,15,16,17,18,19,20]. Among the aquatic fauna and flora employed in developing MMIs, macroinvertebrates have been widely explored globally because of their important position as secondary producers in the aquatic food chain and food web and their sampling ease [13,21,22,23]. Most MMIs are developed using macroinvertebrate metric measures to assess general water conditions and, usually, for single riverine systems [3,4,11,14]. In the present study, we explored several forested riverine systems draining urban landscapes in the Niger Delta region of Nigeria in a bid to develop an MMI for assessing the deteriorating state of riverine systems. Therefore, we developed a macroinvertebrate MMI for assessing the ecological condition of forested riverine sites draining partially urbanising landscapes in the Niger Delta region of Nigeria.

2. Materials and Methods
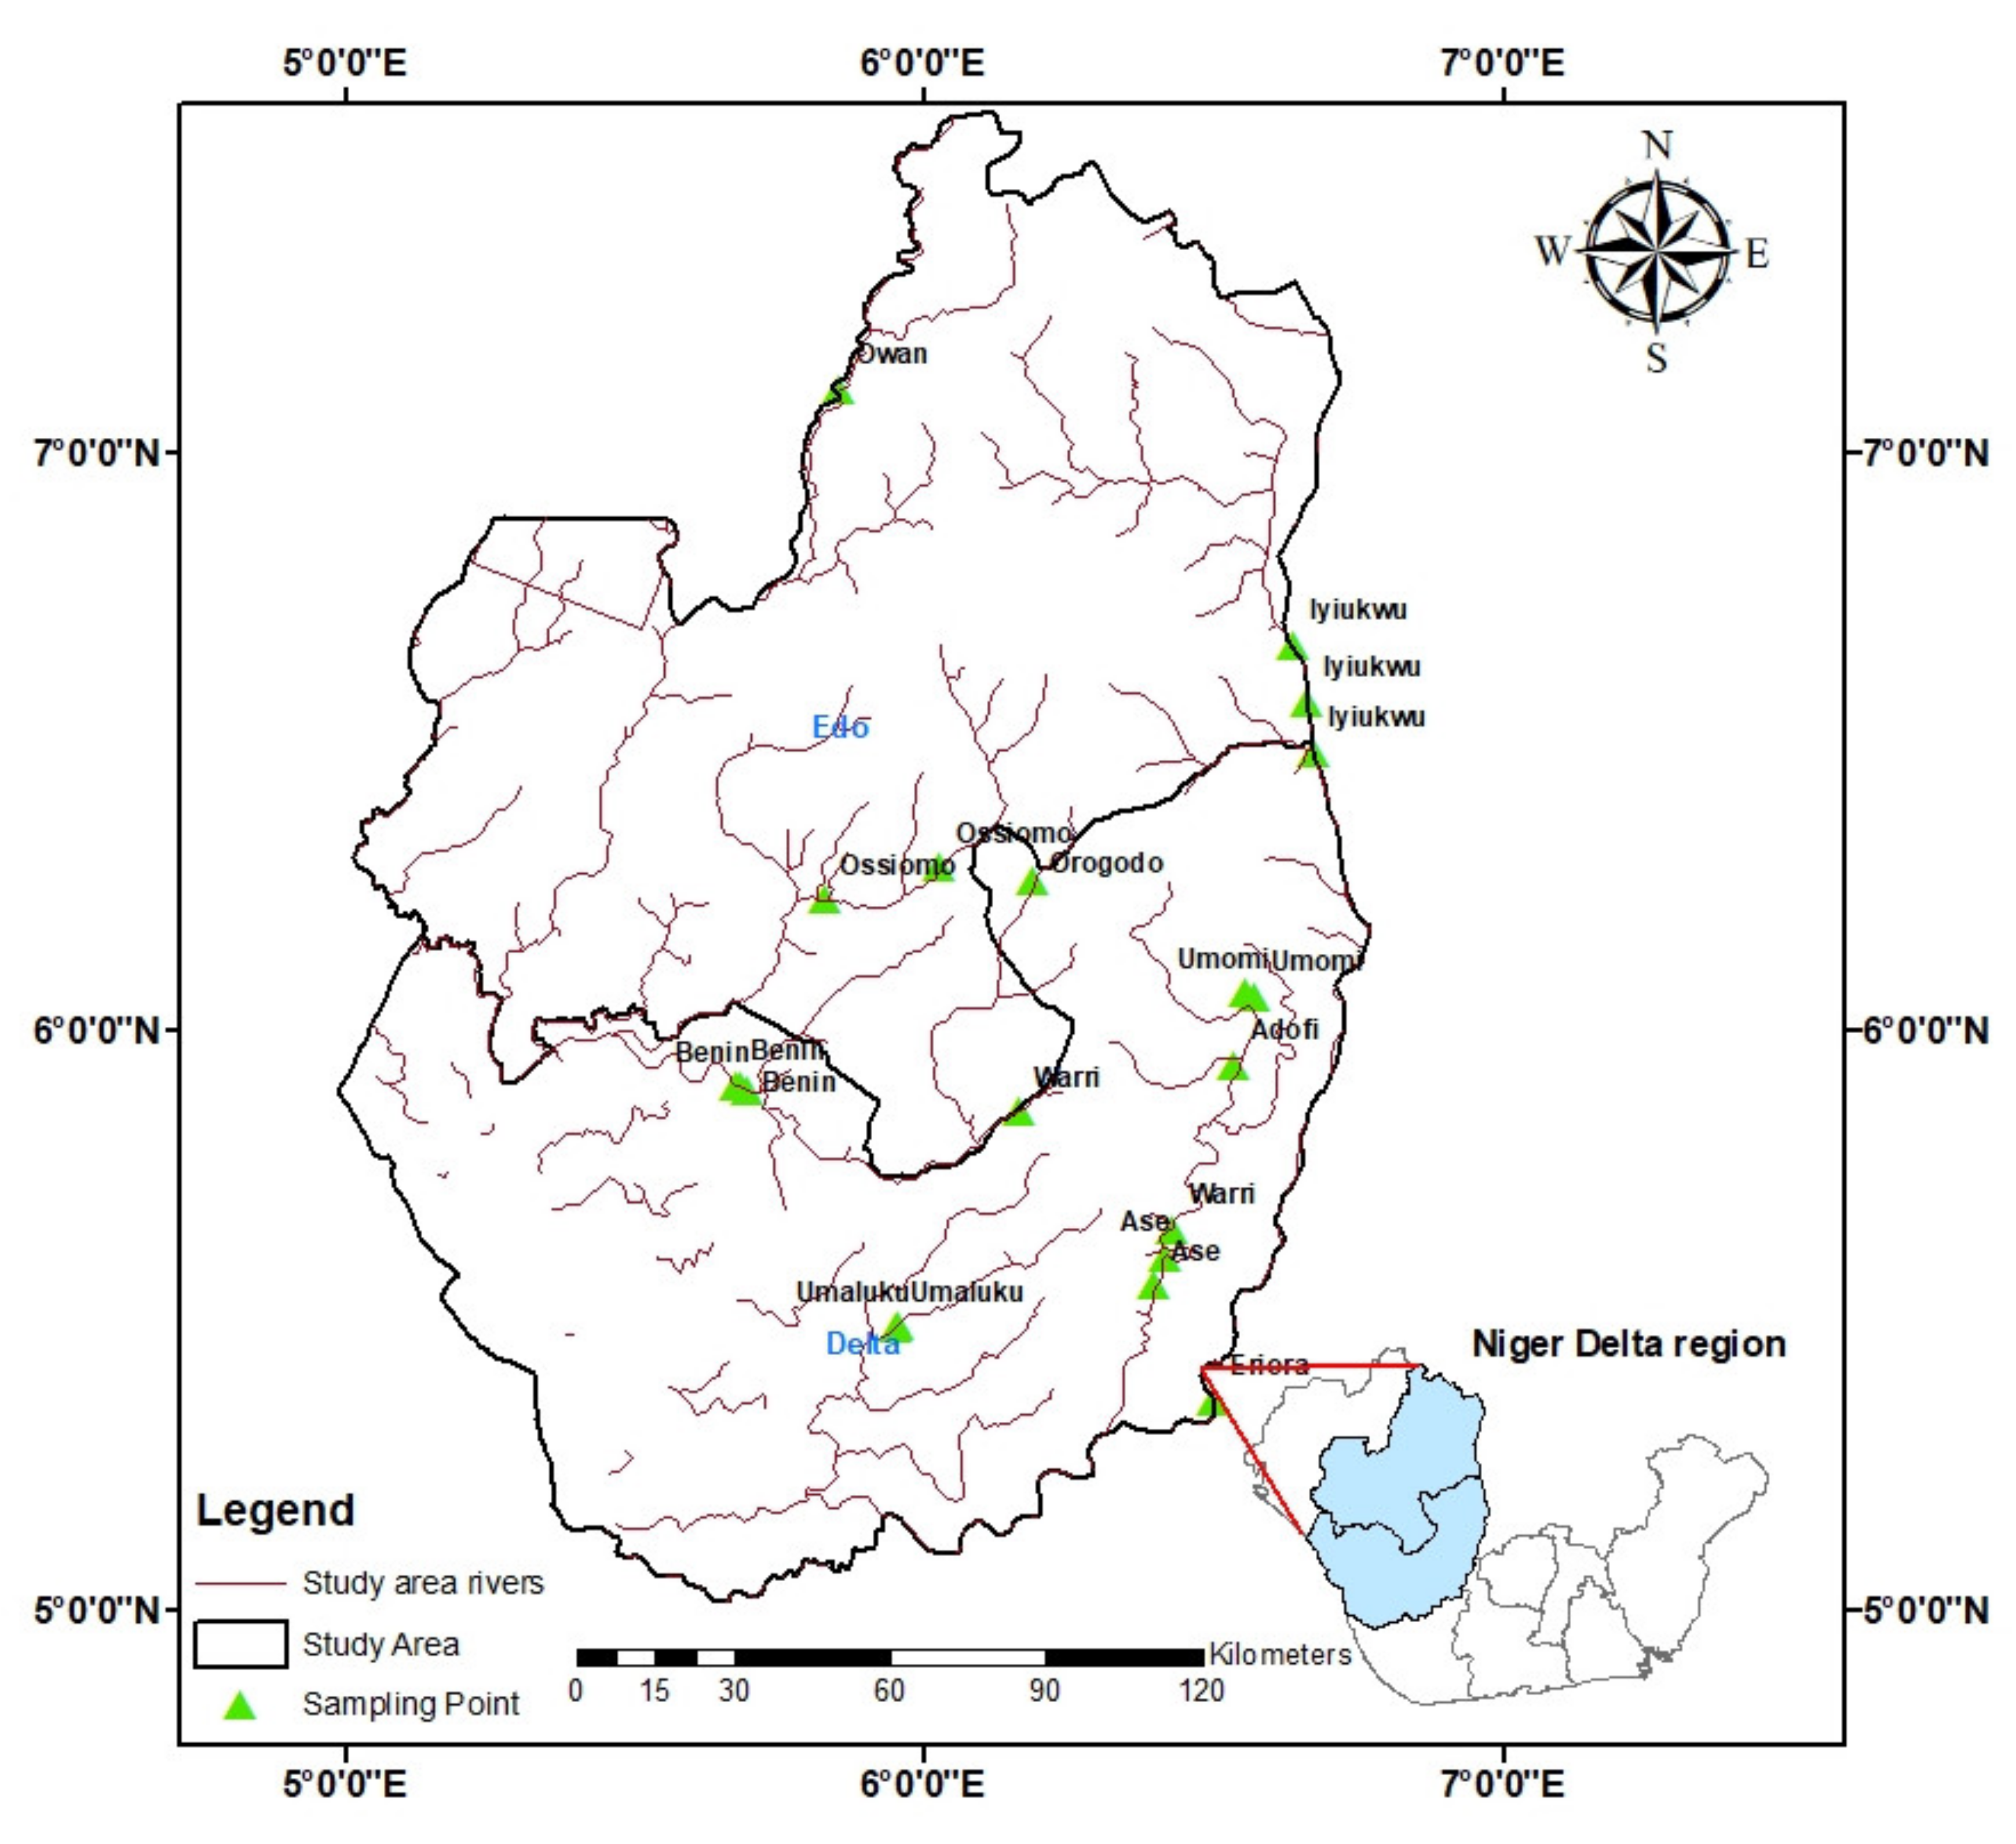
2.1. Study Area

We sampled 20 sites in 11 streams within Edo and Delta states of the Niger Delta region of Nigeria (Figure 1 and Figure 2). The study area covers 70,000 km2 at latitude 5.438000–7.11070 and longitude 5.67800–6.64700 [24]. Two seasons (wet and dry) characterize the area with the wet season spanning from March to September, while the dry season is from October to February [25]. The wet season temperatures range from 15 °C to 25 °C and the dry season temperatures are between 25 °C and 35 °C. The average annual rainfall is 2000 m–3500 mm and the relative humidity is 85% [2,25]. Most of the sites are bordered by forested catchments with patches of urban, industrial, and agricultural activities in some reaches of the streams. Urban, industrial and agricultural activities within the sampled streams included crude oil exploration, logging, fishing, farming, washing, and bathing [26,27]. The Niger Delta contributes the bulk of foreign exchange for Nigeria because it is the crude-oil-rich region in the country, which also drives the urbanisation and industrialisation of the region [24]. However, cities in the region have poor drainage systems and their streams suffer from untreated waste disposal and storm water flows [27].

2.2. Physico-Chemical and Macroinvertebrate Sampling

Before the commencement of sampling exercise, the coordinates of each site were marked out to ensure that datasets collected were coming from the same site. All sampling instruments and equipment were properly calibrated and examined to ensure accuracy of the samples collected per sampling expedition. Further, as sampling was performed by a research group, briefing was conducted by the lead researcher on each sampling occasion to avoid incongruity in the collections made by each group involved.
Physico-chemical variables and macroinvertebrates were sampled monthly for five years between 2008 and 2012. Mercury thermometer was used to measure water temperature and a metal rod calibrated in centimetres was used to measure water depth. Current velocity was measured following the flotation method [28]. DO, pH, and EC were measured by using a portable HANNA HI9829 multiprobe meter. Three replicate water samples were collected in 500 mL glass bottles on each visit for determining BOD, nitrate, and phosphate, then analysed in the laboratory [29].
Macroinvertebrates were collected using a D-frame kick-net [30] at each site for three minutes. All habitat types present (vegetation, mud, silt, sand, stones) were sampled and then combined into a single composite sample for each site visit [24]. The samples we collected were preserved in 70% alcohol and taken to the laboratory for sorting, identification, and enumeration [24]. Macroinvertebrates were identified to family level by using a stereoscopic microscope at X10 magnification and available keys [31,32,33].

2.3. Data Analyses

Site Classification

The 20 sites in 11 streams of the forested riverine systems within urban catchments were categorised into three potential impact categories using physico-chemically based classification using a multivariate model: principal component analysis (PCA). The impact categories were least-impacted sites (LISs), moderately impacted sites (MISs), and heavily impacted sites (HISs) (Appendix A Table A1) [34,35]. The PCA was computed using the vegan package version 2.5.4 in R [36,37]. Three sites were classified as LIS, seven as MIS, and ten as HIS (Appendix A Table A1). Details on how the sites were classified into LIS, MIS, and HIS are contained in our previous study [24].

2.4. Macroinvertebrate Metric Selection

Fifty-nine (59) candidate metrics were selected for developing the MMI based on available literature [35,38,39]. The 59 metrics were defined into five measures, namely: abundance, composition, richness, diversity, and traits (Appendix A Table A2). Abundance metrics included absolute abundances of individuals in various macroinvertebrate groups, whereas composition metrics were determined as the relative abundances of groups in the entire sample [3]. Richness metrics were calculated as the absolute number of taxa in macroinvertebrate groups and diversity measures were defined following Clarke and Warwick [40] and Edegbene et al. [35]. Trait metric information was gathered from Krynak and Yates [41] and Edegbene et al. [12]. Trait information was fuzzy coded [42] in which we awarded scores of 0–3 to each trait attribute per taxa, with a score of 0 for taxa with no affinity to a particular trait and 1, 2, and 3 for taxa with low, moderate, and high affinity for a given trait.

2.5. MMI Development

We followed a four-step procedure to select metrics by testing each metric for: (i) sensitivity (discrimination), (ii) seasonality, (iii) repeatability (signal/noise), and (iv) redundancy.

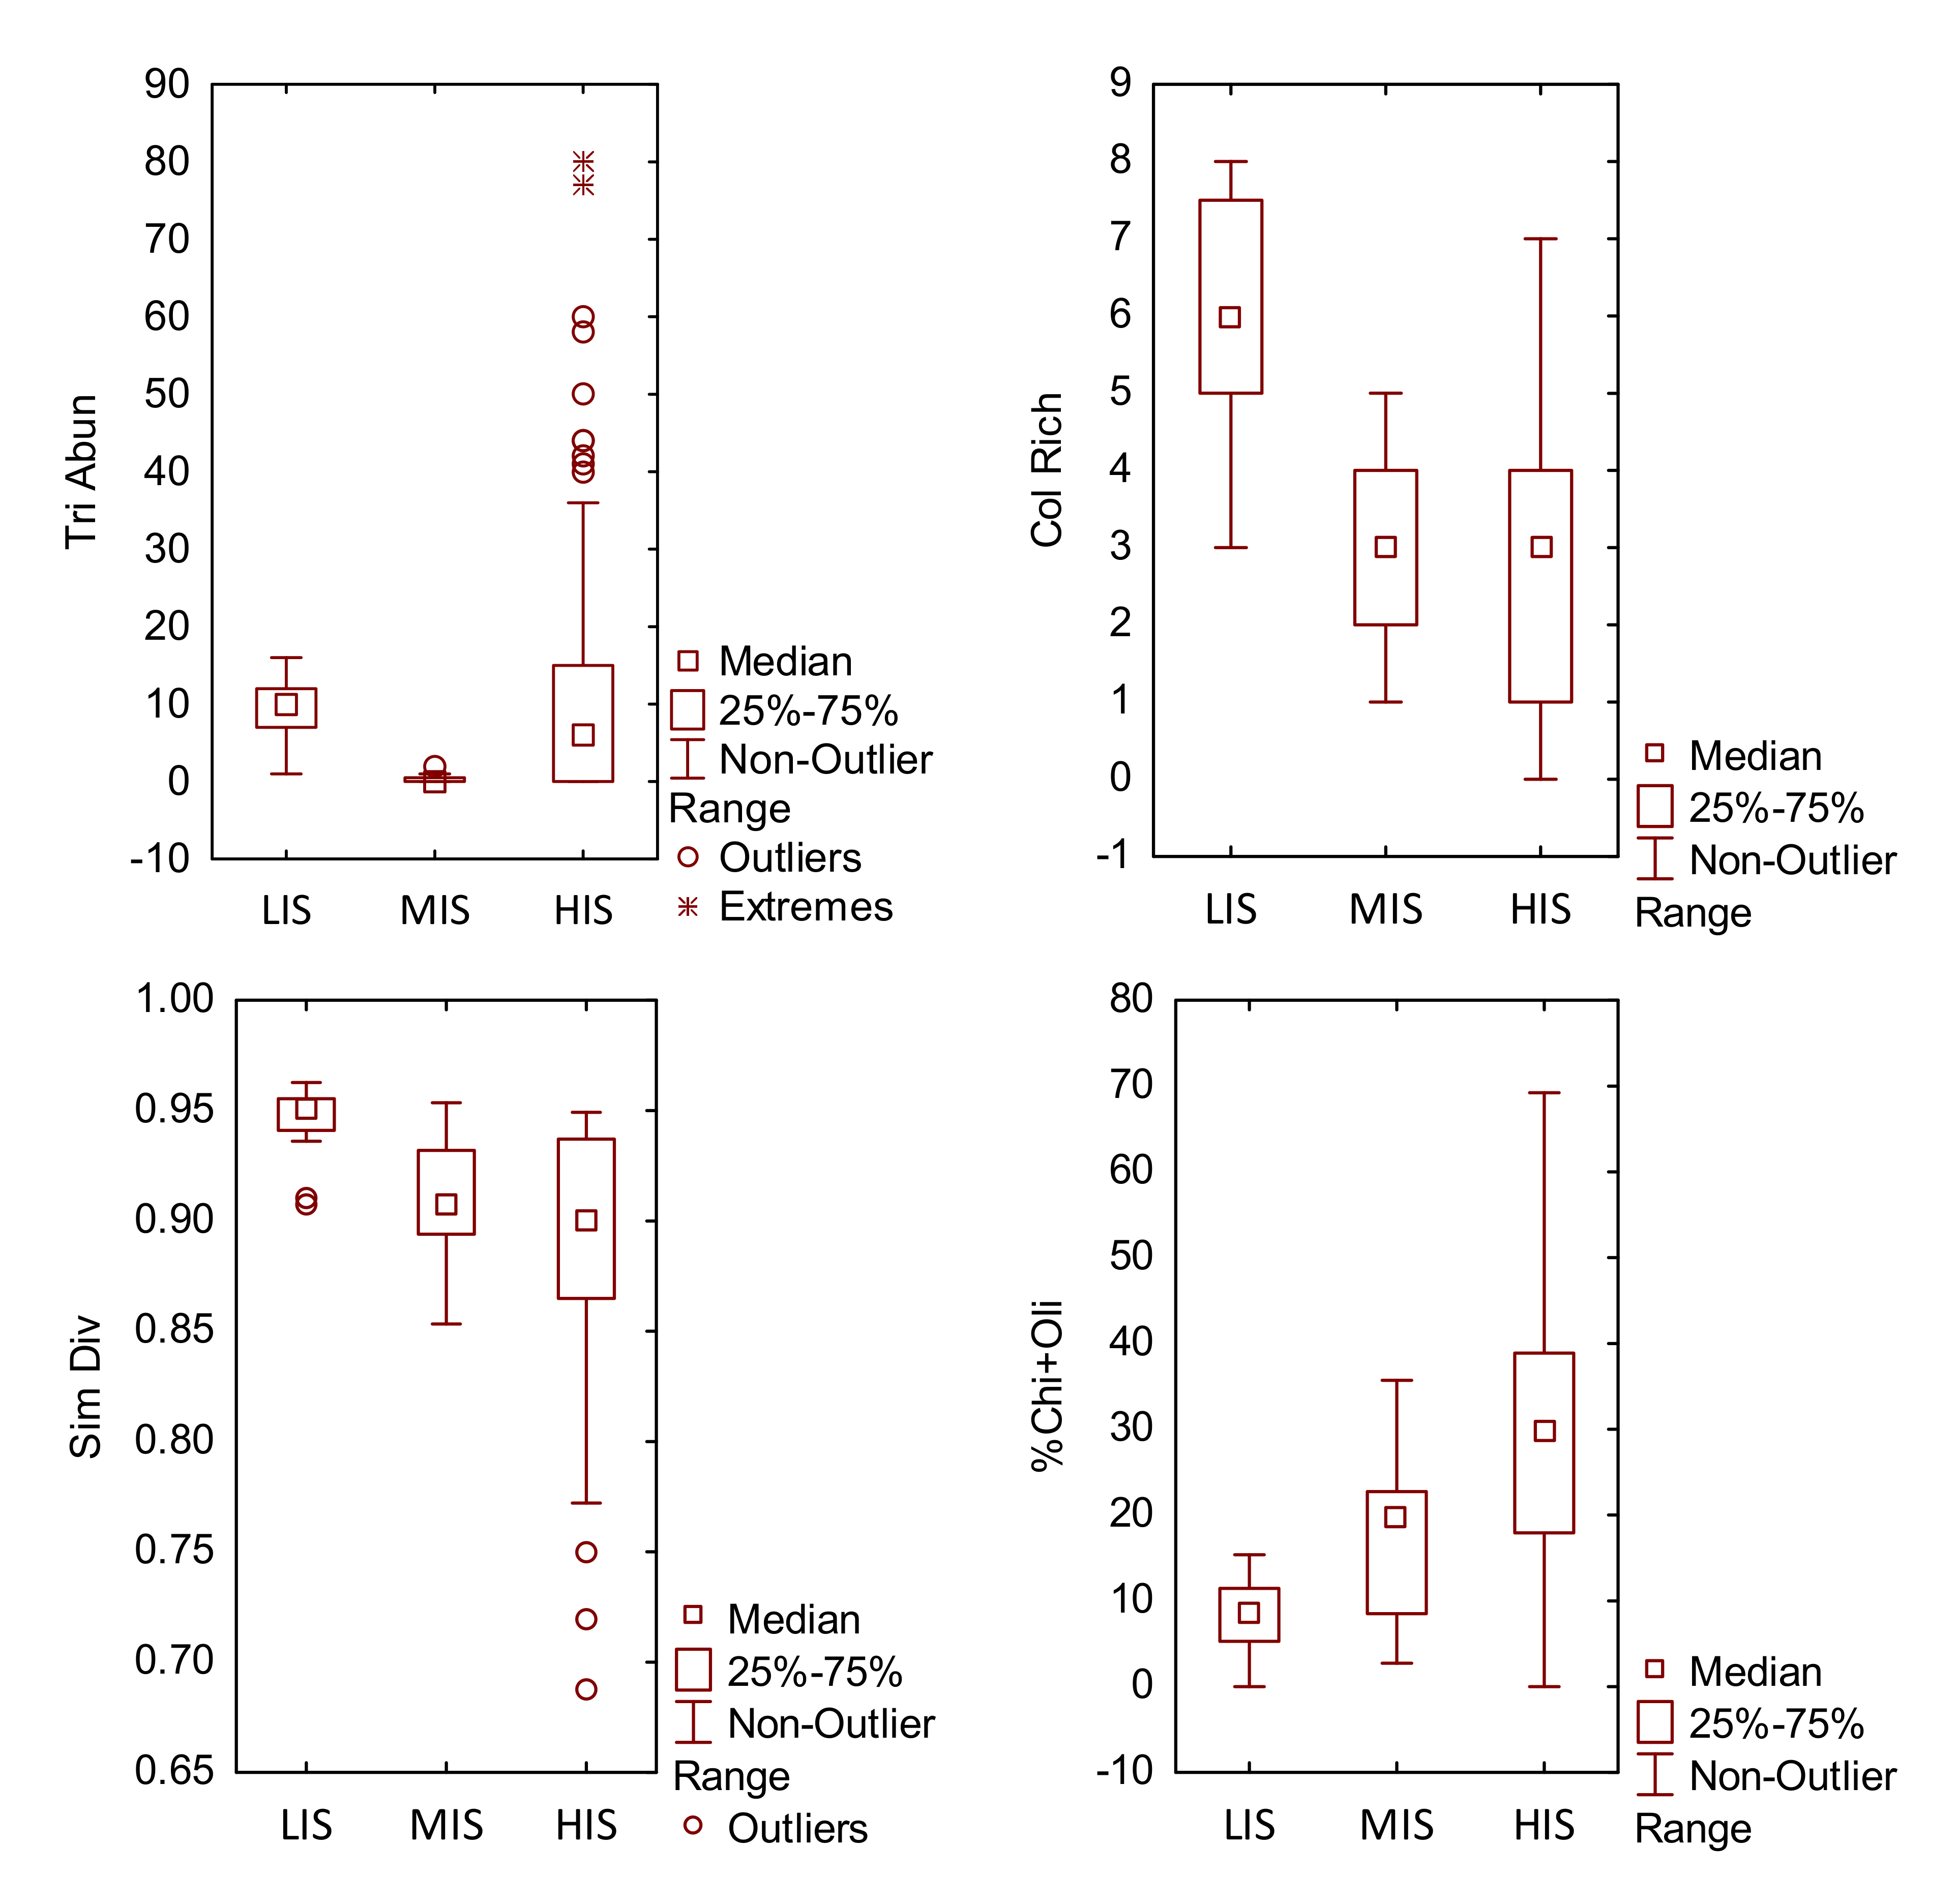
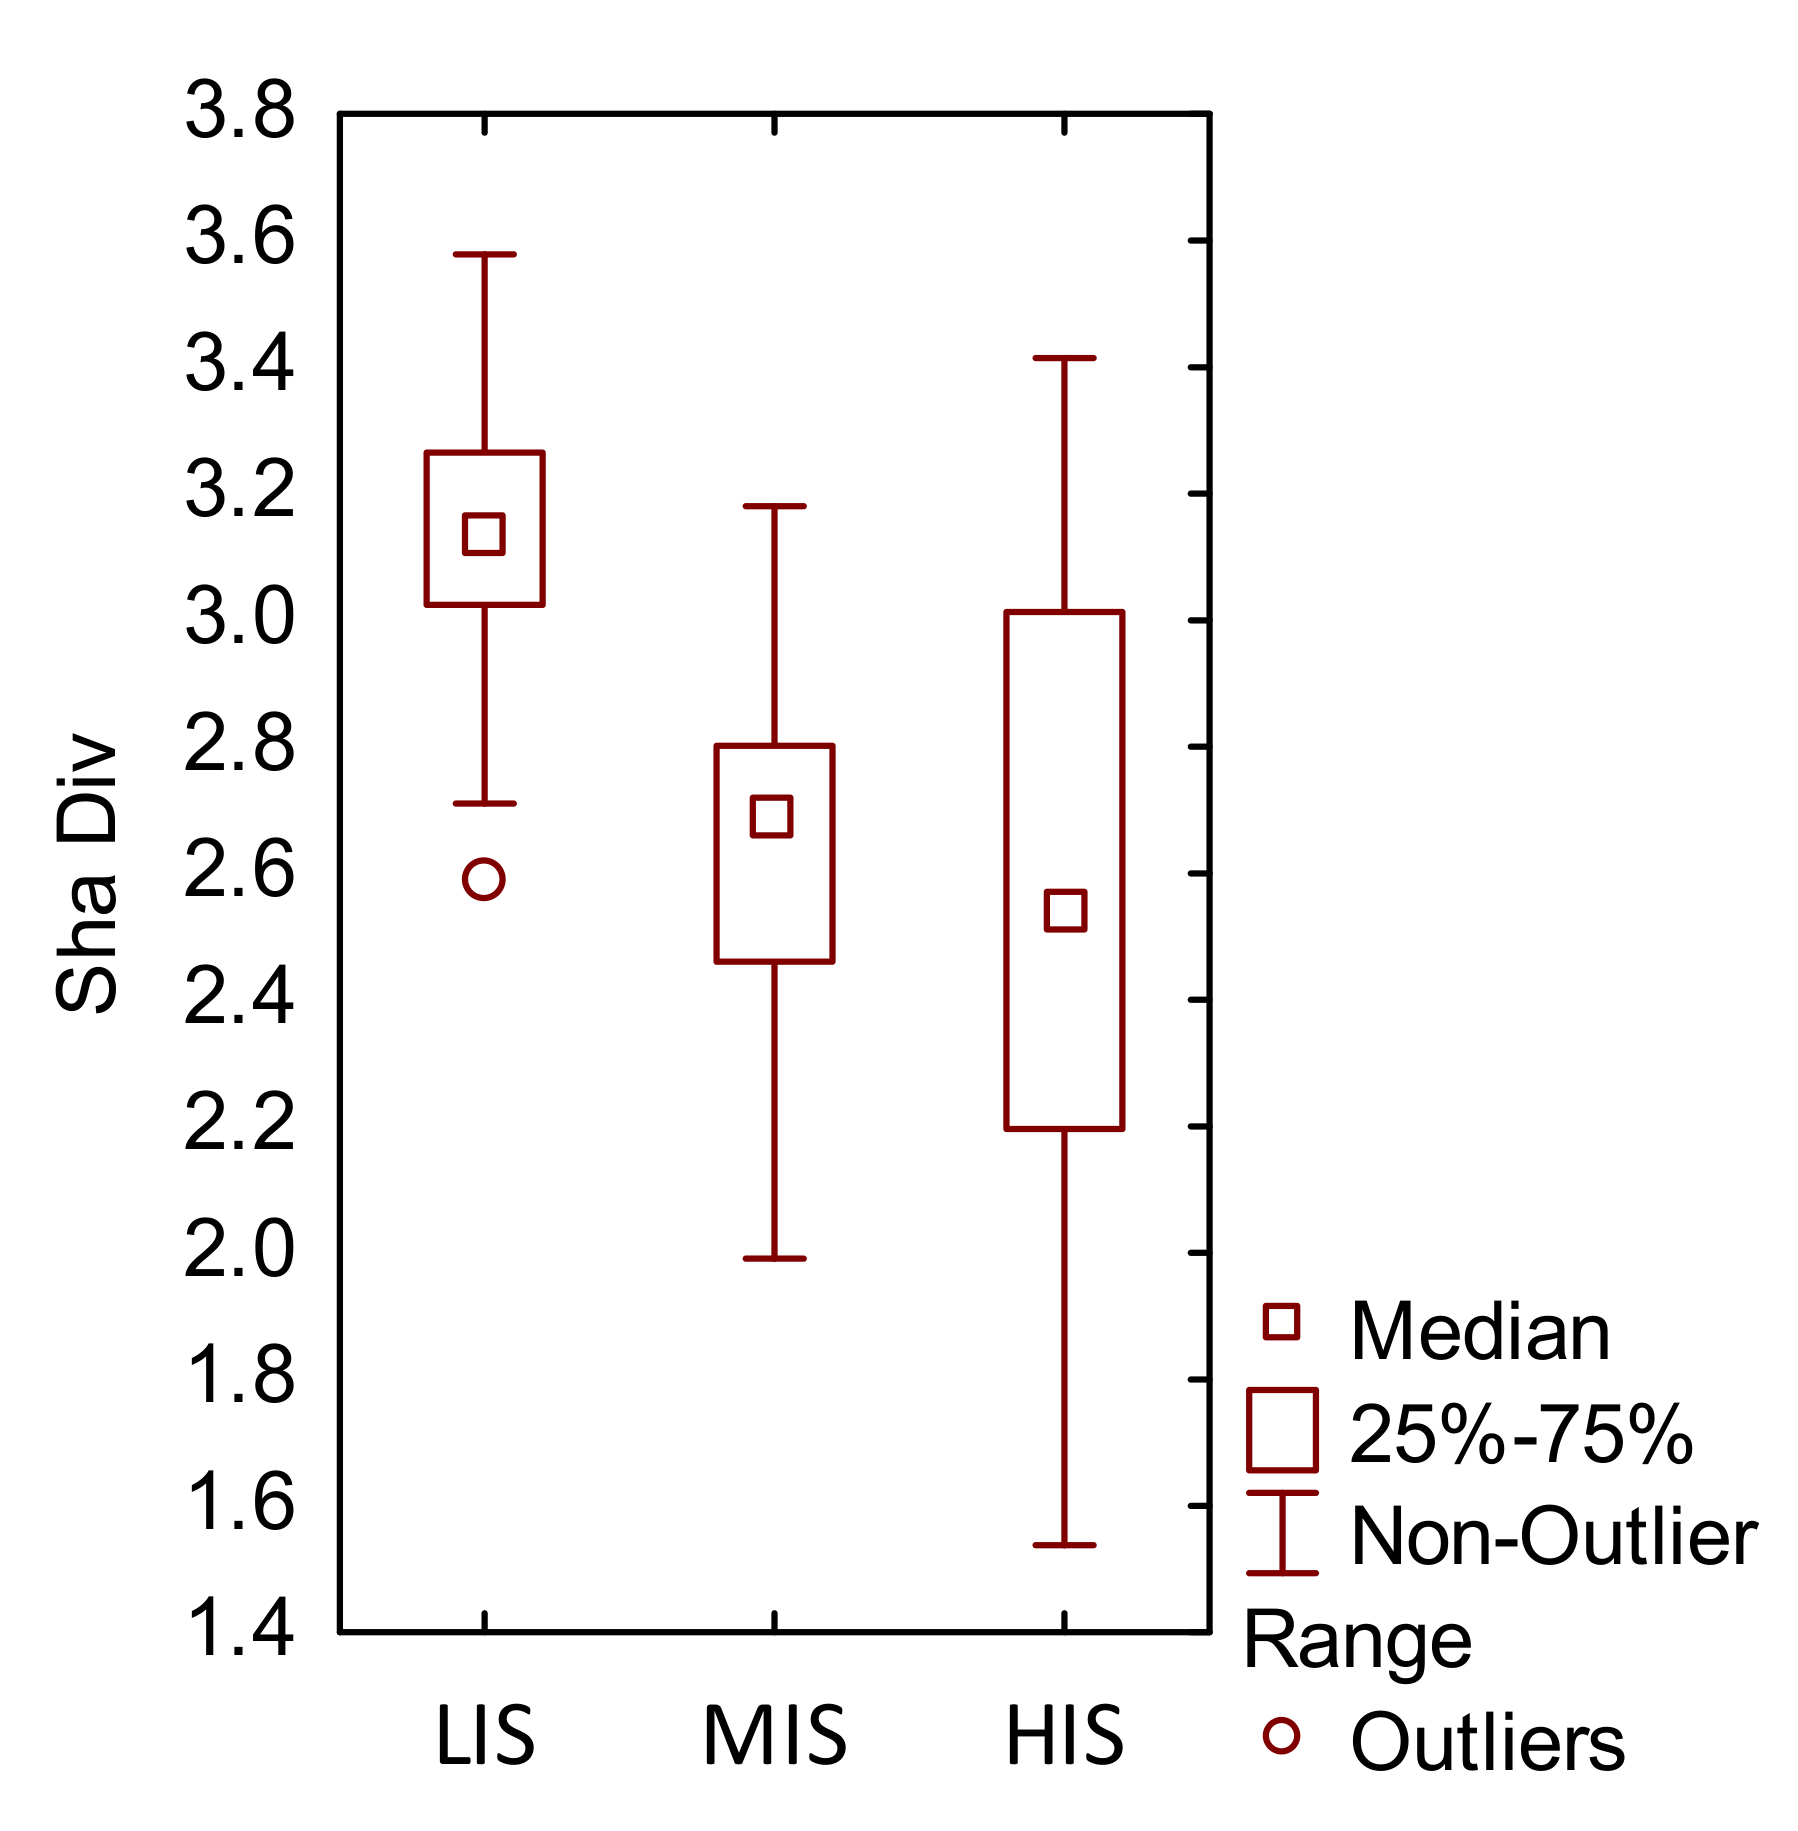
2.5.1. Test for Sensitivity (Discrimination)

We tested the discriminatory potential of metrics by comparing their performance in the LIS, MIS, and HIS [43] by using box and whisker plots. We considered two criteria in selecting metrics that showed discriminatory potential. First, a metric that showed no overlap in the interquartile ranges (IQRs) between LIS and MIS and HIS was considered sensitive [35,43]. Second, if there was overlap in the IQRs but if their medians were outside of the IQRs, such a metric was considered discriminatory [35,43].
To test the significance level of the selected sensitive metrics as per the result from the box and whisker plots, we first performed a Kolmogorov–Smirnov normality test. The test indicated that metrics were not normally distributed; therefore, we used a non-parametric Mann–Whitney (U) test to test for metrics level of significance. Metrics exhibiting a significant difference at p < 0.05 between the LIS and the MIS and HIS were retained for further analysis [44]. Box and whisker plots were constructed using Statistica version 13.4.14 (TIBCO Software Inc., Palo Alto, CA, USA, 2018). The Kolmogorov–Smirnov and Mann–Whitney tests were calculated using Palaentological Statistical Package (PAST) [45].

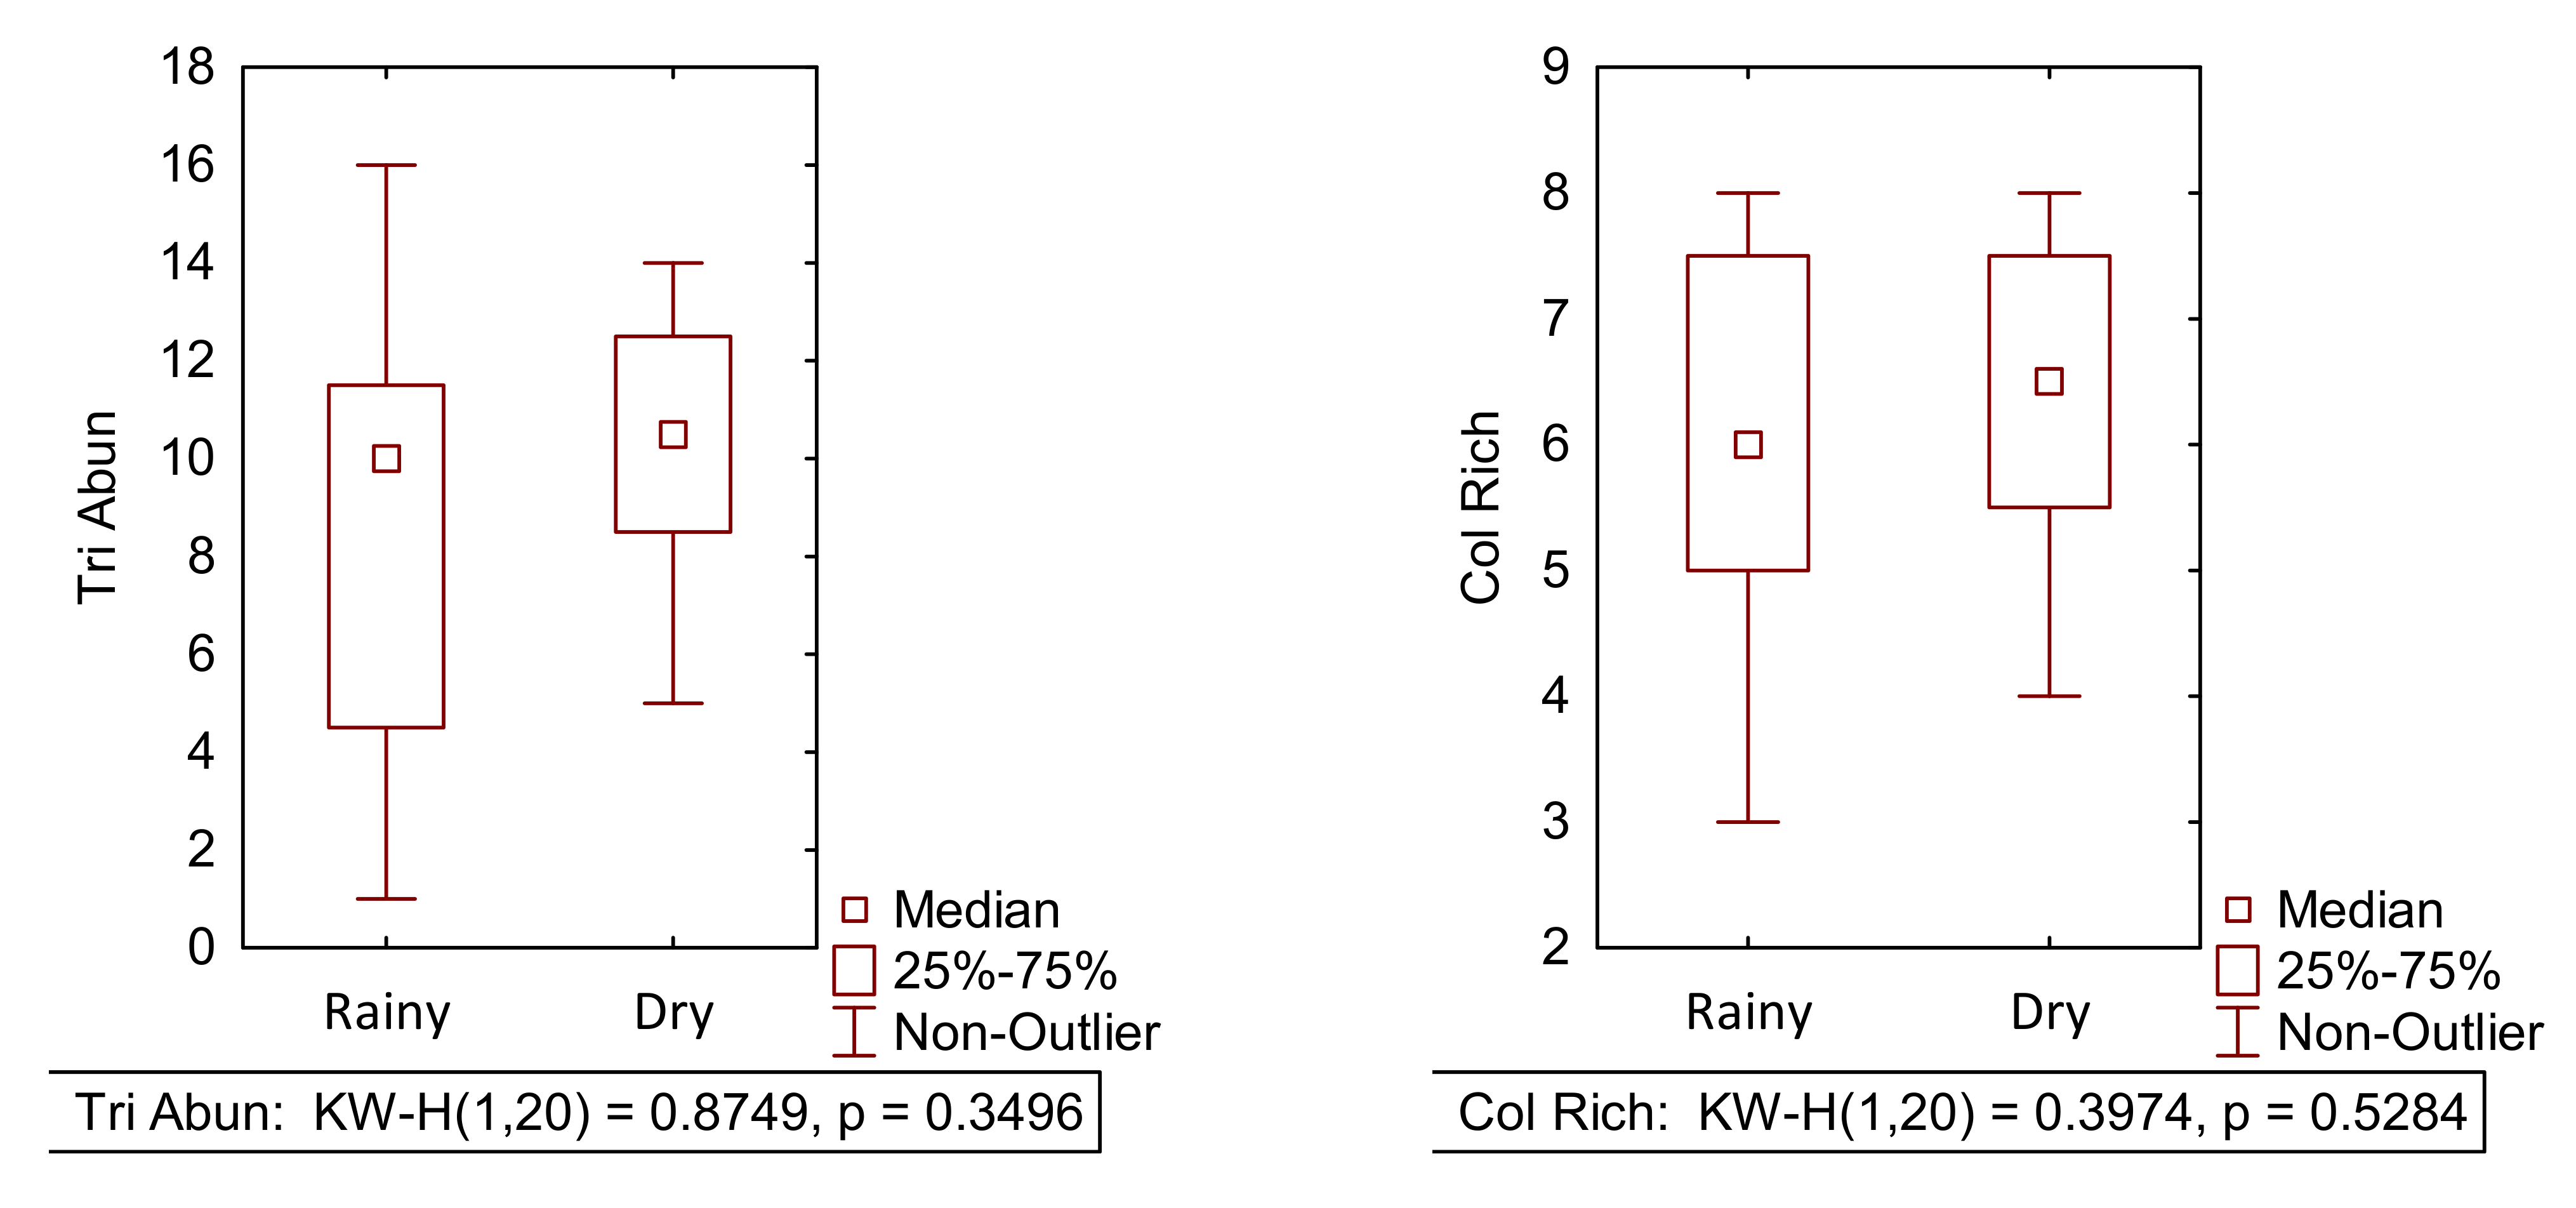
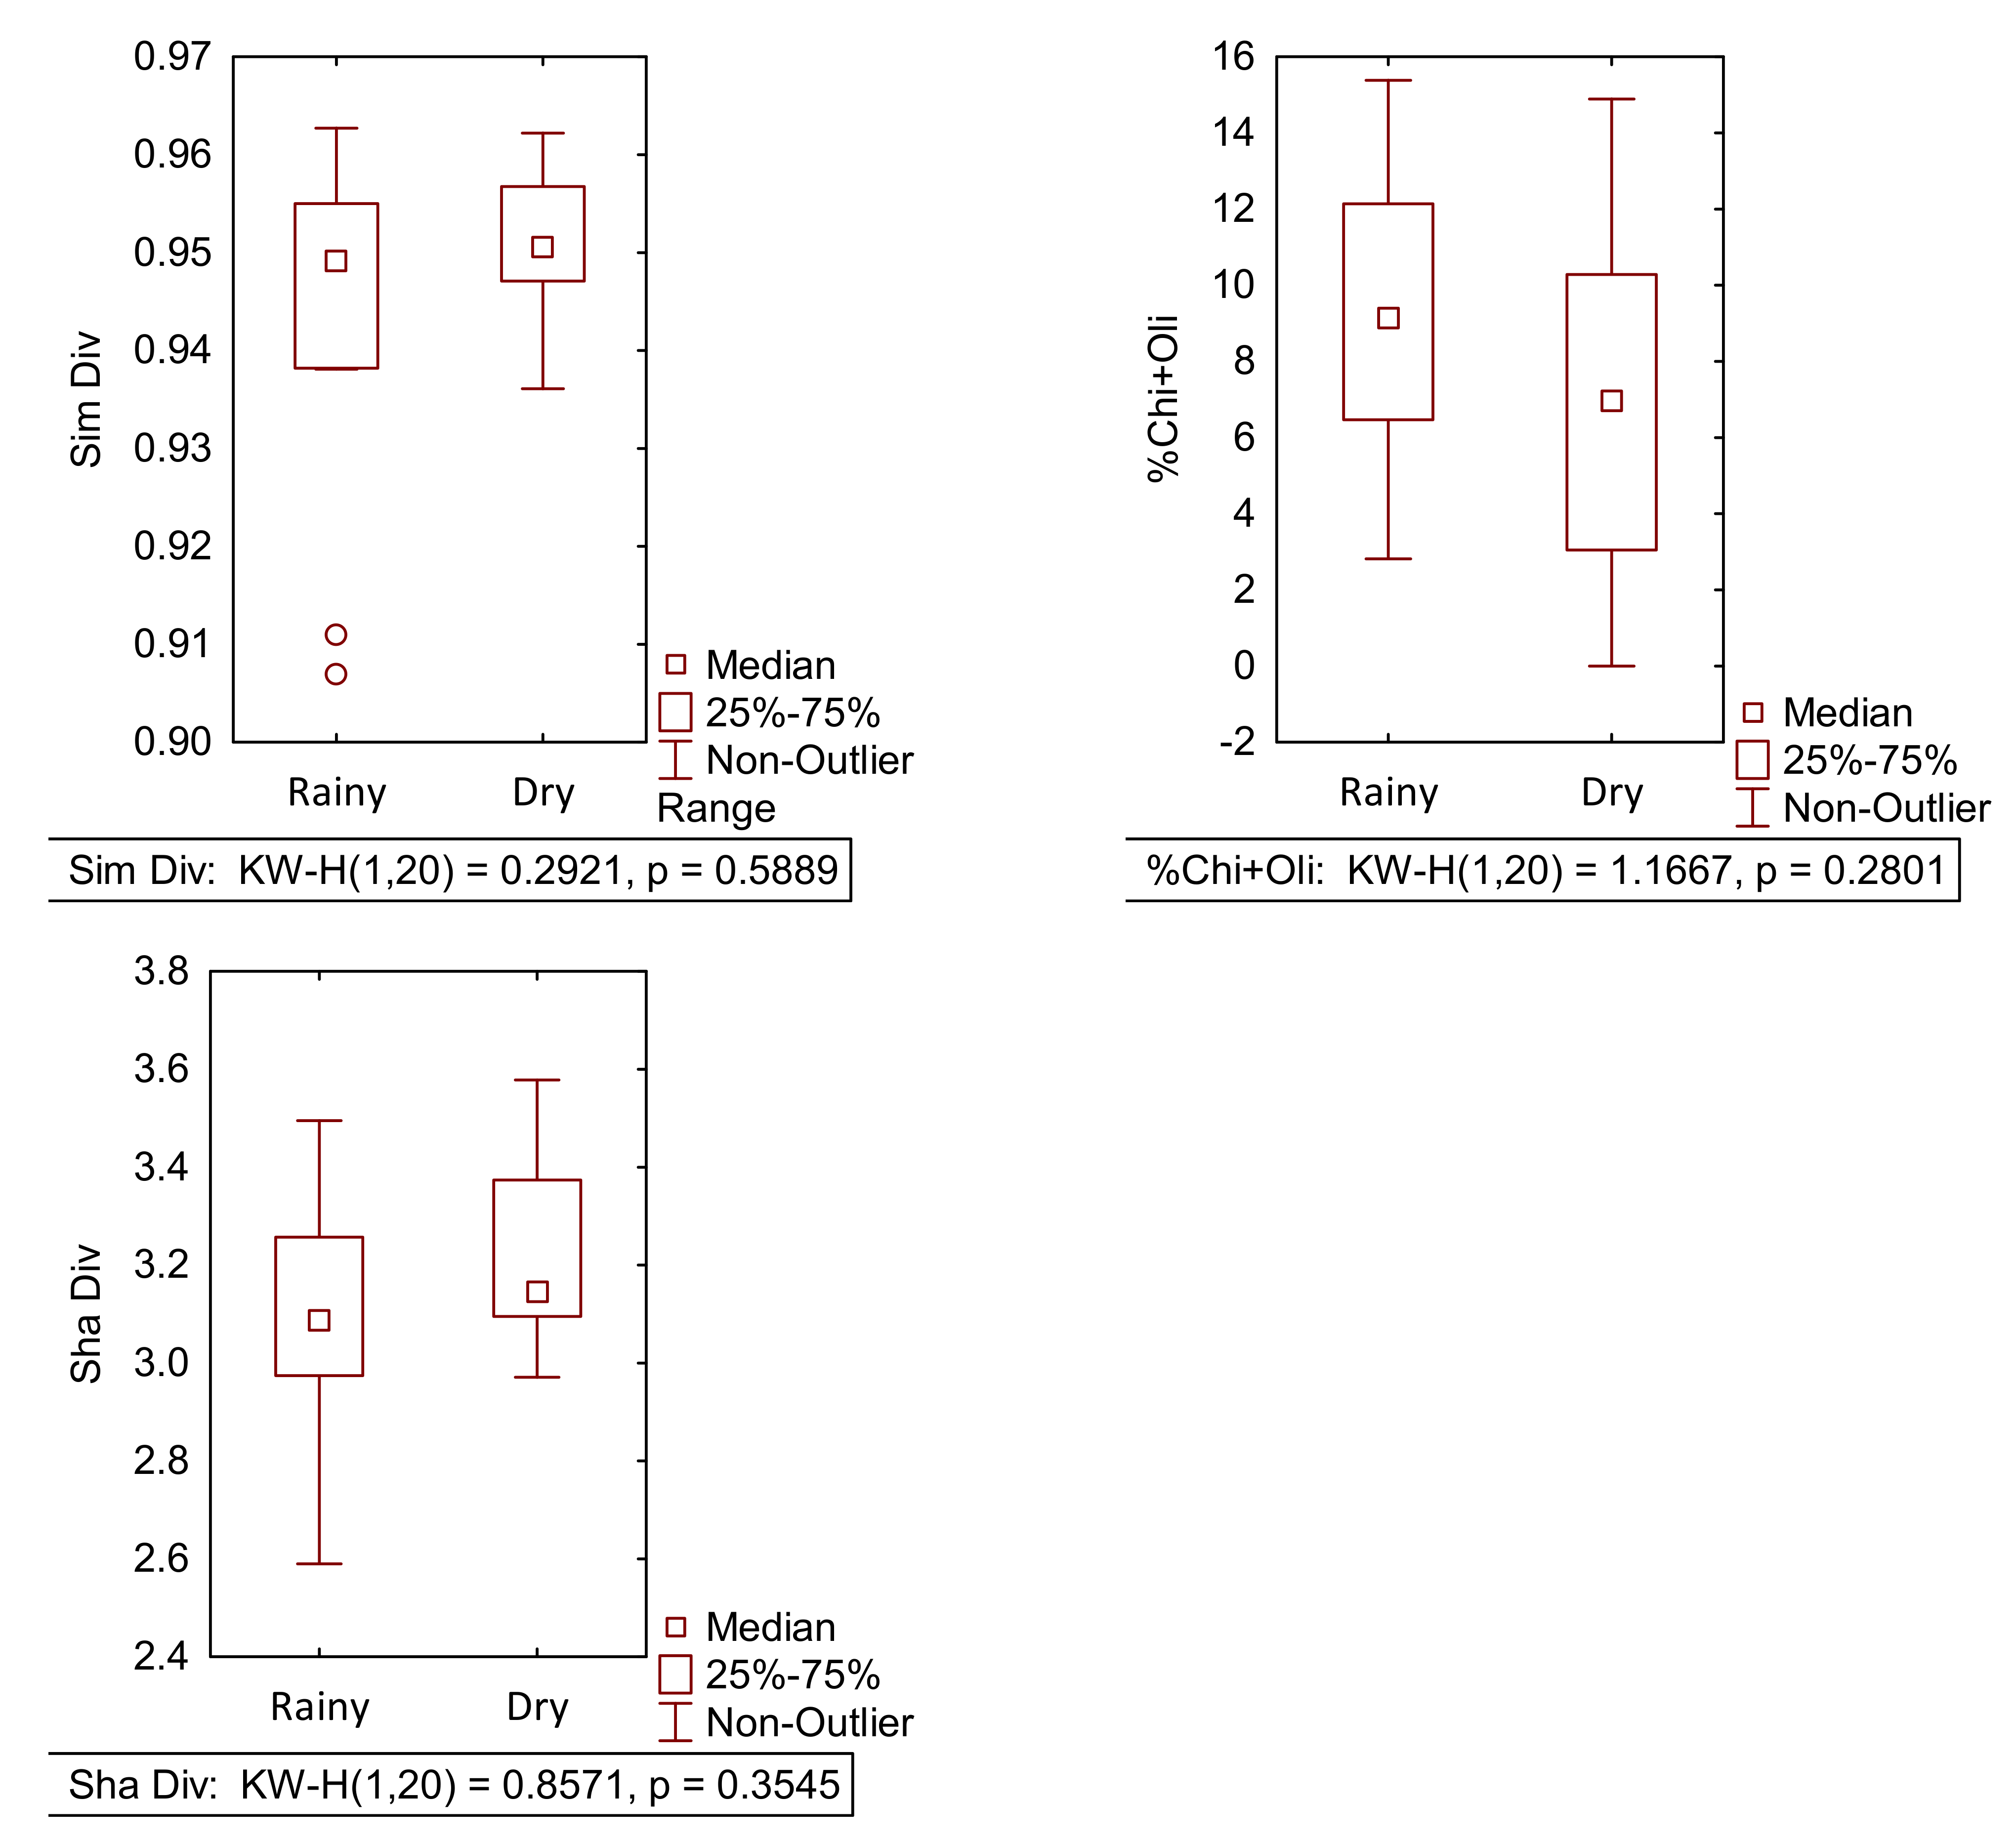
2.5.2. Test for Seasonality

Metrics that were sensitive (discriminatory) were subjected to seasonal stability test. Seasonal stability of metrics was visualized by box and whisker plots and further confirmed by a Kruskal–Wallis test [35,46]. Metrics that discriminated between wet and dry seasons based on the visual observation from box and whisker plots and showed no significant difference (p > 0.05) were considered seasonally stable [2,47]. Metric seasonal stability was tested only on LIS samples to avoid confounding urban pollution with seasonal variability [14].

2.5.3. Test for Metric Repeatability (Signal/Noise)

Metric repeatability was tested using the signal (S) to noise (N) ratio, i.e., S:N [48]. The signal value for each metric was arrived at by calculating the metric variance in all the samples from all the sites. On the other hand, the noise value for each metric was obtained by calculating the metric variance in the samples from the least-impacted sites (LISs). Therefore, the repeatability potential of each metric was assessed by dividing the value of signal (S) by that of noise (N). Metrics with high signal-to-noise ratios were considered to be relatively precise (repeatable) and those with low signal-to-noise ratios were considered to be less precise [49]. Following Stoddard et al. [48], metrics with S:N values >2 were retained.

2.5.4. Test for Metric Redundancy

Metrics are redundant if they convey similar information [35]. A correlation coefficient (Spearman’s r) was computed for metrics that passed the seasonal stability test. Metrics with r ≥ 0.78 were deemed redundant [43].

2.6. Metric Scoring

To integrate metrics with different value ranges into the final MMI, we standardised each metric to a score of 0–10 using the 5th (scoring floor) and 95th (scoring ceiling) percentiles of the LIS values [48,49]. Two steps were followed in awarding either a score of 0 (poor) or 10 (good) to each metric. Metrics that respond negatively to increasing pollution were awarded a score of 10 if they correspond to the 95th percentile of the metric raw values and a score of 0 if they correspond to the 5th percentile of the metric raw values. On the other hand, metrics that respond positively to increasing pollution were awarded a score 0 if they correspond to the 95th percentile of the metric raw values, whereas a score of 10 was awarded if they correspond to the 5th percentile of the metric raw values [50]. In integrating the selected metrics into the final MMI, a metric with raw value of 0 was given a value of 0, then metric with raw value of >0–10 was given a value of 5 and metric with raw value of >10 was given a value of 10. Similar approach had earlier been used by Huang et al. [49] and Edegbene [51] to award either a score of 0 or 1 to metric raw values. In scoring the metric continuously in the study we adopted the following procedures: for metrics that decrease with pollution, the raw score of the 5th percentile was subtracted from the raw score of 95th percentile, divided by 5 and scored continuously, and for metrics that increase with pollution the raw score of the 5th percentile was added to the raw score of 95th percentile, divided by 5 and scored continuously.
The final MMI score was computed following the method earlier used by Klemm et al. [52] by summing the scores of all metrics and dividing by the total number of metrics. Hence, the final MMI score was within a range of 0–10. Finally, we assigned three biological condition categories to the final MMI scores, namely good, fair, or poor. The three condition categories were adopted as had earlier been argued by Ganasan and Hughes [53] that many ecological categories/classes can lead to confounding interpretation of final MMI scores and, thus, affect stream managers’ decisions on water quality. Further, good, fair, and poor condition categories were deemed appropriate for the MMI biological condition categories as the riverine systems used in this study are partially draining urbanising landscape; hence, there cannot possibly be an excellent or very good biological condition category.

2.7. Correlating Metrics with Physico-Chemical Variables

A test of unimodality and linearity using detrended correspondence analysis (DCA) showed a gradient length < 3, which indicated that the metric data were linear [54]. Therefore, the final selected metrics were correlated with selected physico-chemical variables via multivariate redundancy analysis (RDA) [55]. Physico-chemical variables that were highly multi-colinear (r ≥ 0.80) were removed from the RDA model analysis. Furthermore, a test of global significance (Monte Carlo) test with 999 permutations was used to ascertain the level of significant differences between the first two RDA axes [56]. The RDA and Monte Carlo tests were performed in R (vegan package) [36,37].

3. Results

3.1. Metric Screening

Of the 59 candidate metrics tested, only 14 showed discriminatory potential (Appendix A Table A3) and 12 were seasonally stable. Among the 12 seasonally stable metrics, only three were deemed to be both repeatable (Table 1) and not redundant (Table 2); hence they were retained for MMI scoring (Figure A1 and Figure A2 in Appendix A). In addition to the three non-redundant metrics retained, two more metrics (Trichoptera abundance and %Chironomidae+Oligochaeta) were included in the MMI scoring for fair representation of all the metric measures selected for this study, except metrics in the trait measure that did not scale through the test for seasonality and, hence, were excluded from the tests for repeatability and redundancy. Further, Trichoptera abundance and %Chironomidae+Oligochaeta were included in the MMI scoring because they were deemed repeatable following the signal/noise test conducted.

3.2. MMI Scoring

As with metric scoring, the 5th percentile was used as the scoring floor and 95th percentile as the scoring ceiling using the metric values of the LIS (Table 3). The metric values of LIS were used to avoid confounding effects of pollution on the metrics selected. Four of the retained metrics respond negatively to increasing pollution, namely: Trichoptera abundance, Coleoptera richness, Simpson diversity, and Shannon–Wiener index, and they were, thus, awarded a score of 10, corresponding to the 95th percentile of the raw values and 0, corresponding to the 5th percentile of the raw values. Only one metric (%Chironomidae+Oligochaeta) that responds positively to increasing pollution was awarded a score of 10, corresponding to the 5th percentile of the raw value and 0, corresponding to the 95th percentile of the raw value. Therefore, metric scoring of the retained metrics in Table 3 was scored following the score distribution patterns below.
For metrics that decrease with pollution, the raw score of the 5th percentile was subtracted from the raw score of the 95th percentile, divided by 5 and scored continuously as follows: Trichoptera abundance LIS raw score corresponding to 5th percentile was 1.00 and was scored as 0 and 95th percentile was 14.1 and was scored 10. Trichoptera abundance raw score of <1 = 0. Trichoptera abundance raw score of 1–3.62 was scored as 1/5(10) = 2. Trichoptera abundance raw score of 3.62–6.24 was scored as 2/5(10) = 4. Trichoptera abundance raw score of 6.24–8.86 was scored as 3/5(10) = 6. Trichoptera abundance raw score of 8.86–11.48 was scored as 4/5(10) = 8. Trichoptera abundance raw score of 11.48–14.1 was scored as 5/5(10) = 10.
Coleoptera richness LIS raw scores corresponding to the 5th and 95th percentiles ranged from 3.95 (scored 0) to 8.00 (scored 10), Coleoptera richness raw score of <3.95 = 0. Coleoptera richness raw score of 3.95–4.76 was scored as 1/5(10) =2. Coleoptera richness raw score of 4.76–5.57 was scored as 2/5(10) = 4. Coleoptera richness raw score of 5.55–6.38 was scored as 3/5(10) = 6. Coleoptera richness raw score of 6.38–7.19 was scored as 4/5(10) = 8. Coleoptera richness raw score of 7.19–8.00 was scored as 5/5(10) = 10.
The Simpson diversity LIS raw scores corresponding to the 5th and 95th percentile values range from 0.91 (scored as 0) to 0.96 (scored as 10). Simpson raw score < 0.91–0.91 = 0. Simpson raw score of 0.92 was scored as 1/5 (10) = 2. Simpson raw score of 0.93 was scored as 2/5(10) = 4. Simpson raw score of 0.94 was scored as 3/5(10) = 6. Simpson raw score of 0.95 was scored as 4/5(10) = 8. Simpson raw score of 0.96 and above was scored as 5/5(10) = 10.
The Shannon diversity LIS raw scores corresponding to the 5th and 95th percentile values range from 2.70 (scored as 0) to 3.50 (scored as 10). Shannon diversity LIS raw score < 2.70 = 0. Shannon diversity raw score of 2.86 was scored as 1/5 (10) = 2. Shannon diversity raw score of 3.02 was scored as 2/5(10) = 4. Shannon diversity raw score of 3.18 was scored as 3/5(10) = 6. Shannon diversity raw score of 3.34 was scored as 4/5(10) = 8. Shannon diversity raw score of 3.5 and above was scored as 5/5(10) = 10.
For metrics that increase with pollution, the raw score of the 5th percentile was added to the raw score of the 95th percentile, divided by 5 and scored continuously as follows: The %Chironomidae+Oligochaeta LIS raw scores corresponding to the 5th and 95th percentile values range from 1.27% (scored as 10) to 15.20% (scored as 0). The %Chironomidae+Oligochaeta raw score of >1.27–3.294% was scored as -3.294/15(10) + 10 = 7.804. The %Chironomidae+Oligochaeta raw score of 6.588% was scored as −6.588/15(10) + 10 = 5.608. The %Chironomidae+Oligochaeta raw score of 9.882% was scored as −9.882/15(10) + 10 = 3.412. The %Chironomidae+Oligochaeta raw score of 13.176% was scored as −13.176/15(10) + 10 = 1.216. The %Chironomidae+Oligochaeta raw score of >13.176% and 15.2 was scored as −15.2/15(10) + 10 = 0.00.
Finally, we assigned three biological categories based on the site MMI scores: poor (<2.0), fair (2.0–4.0), and good (>5.0).

3.3. Correlating MMI Metrics with Physico-Chemical Variables

The first and second axes of the RDA model explained 81.93% and 18.07% of the total variance, respectively, but the Monte Carlo test indicated that the first two axes of the RDA were not significantly different (p > 0.05). Nonetheless, Simpson diversity was negatively correlated with pH in the MIS along Axis 1 and Coleoptera richness was positively correlated with DO and water depth in the LIS along Axis 1 (Figure 3). Nitrate, BOD, conductivity, and water temperature were positively correlated with %Chironomidae+Oligochaeta in the HIS along Axis 2.

4. Discussion

In the present study, we developed a macroinvertebrate-based multimetric index (MMI) for assessing forested riverine sites draining partially urbanising catchments in the Niger Delta region of Nigeria. Fifty-nine (59) candidate metrics were selected for the development of MMI and, of the fifty-nine metrics, only five metrics in the measures of abundance (composition, richness, and diversity) were retained for final integration into the MMI. The test for discrimination (sensitivity) revealed 14 of the selected metrics to satisfactorily discriminate LIS from MIS and HIS and these sensitive metrics were mainly in the measures of composition and richness. The high composition and richness measures of macroinvertebrates can be inferred from the fact that streams that are least impacted are known to support an array of diverse macroinvertebrate communities because such rivers provide heterogeneous habitats, favouring a diverse niche partitioning [22]. However, rivers that have been impacted as a result of anthropogenic activities (e.g., urbanisation), diverse composition, and richness potentials of the inhabitant aquatic biota (e.g., macroinvertebrates) tend to be sensitive, thus, indicating why they proved sensitive in the present study. Composition and richness measures have continually been included in most multimetric indices developed for aquatic systems based on the fact that they prove to be highly sensitive [56,57]. Other studies have also reported the effectiveness of metrics in the measures of abundance, composition, and richness, hence, their continuous integration into multimetric indices developed for biomonitoring freshwater ecosystems [4,14,39,49,58,59,60]. Taxa of macroinvertebrates, which comprise metrics in the abundance, composition, and richness categories, as well as functional ecology have been asserted to structure the community balance of the freshwater ecosystem [39,49,59,60]. For instance, Huang et al. [49] developed and applied benthic macroinvertebrate-based multimetric indices for the assessment of streams and rivers in the Taihu Basin, China. They employed metrics, such as richness, composition, diversity and evenness, pollution tolerance, and functional feeding groups, and they concluded the MMI developed proved important for ecological biomonitoring and management.
In this study, we integrated five metrics into the final MMI and they include Trichoptera abundance, Coleoptera richness, Simpson diversity, Shannon–Wiener index, and %Chironomidae+Oligochaeta, although, Trichoptera abundance and %Chironomidae+Oligochaeta were either non-repeatable or redundant. Trichoptera abundance was not repeatable while %Chironomidae+Oligochaeta was redundant. Trichoptera abundance and %Chironomidae+Oligochaeta were included in the MMI scoring, owing to the fact that they are ecologically significant [3,14]. Earlier studies integrated metrics that were redundant into an MMI following similar criteria, which was hinged on fair representation of all metric measures selected for development of MMI [2,3,47]. Taxa in the Order Trichoptera have been reported by several authors as being sensitive to pollution while taxa in the Chironomidae and Oligochaeta are tolerant of pollution [2,3,14,27,34].
In the tropics, Trichoptera has been documented to usually present a critical biological feature based on their high affinity to increase dissolved oxygen concentration as well as their ability to build their case with leaves and litters [46]. Thus, forested systems in the tropics present an ideal habitat for species of Trichoptera that build their case with leaves and litters. This is due to the availability of appropriate materials in forested systems for building case and further serves as a food source for them, as most Trichopterans are shredders and collector–gatherers [25]. Since Trichopterans are intolerant of dissolved oxygen depletion, the non-availability of case-building materials and food sources would make the Trichoptera disappear in the face of such ecological alteration. Trichopterans are usually one of the first sets of macroinvertebrate taxa to reduce in abundance in response to ecological degradation occasioned by human activities along the catchments of riverine systems, hence, their quick disappearance in the face of anthropogenic disturbance (e.g., urban pollution). This characteristic may be the reason Trichopteran abundance metric in this study proved sensitive and further scaled through seasonality test and, finally, integrated into the MMI. Similar studies documented the negative response of metrics in the categories of Trichoptera abundance, Coleoptera richness, and diversity indices to pollution [3,35]. Aside from Trichoptera abundance, other metrics, such as %Chironomidae+Oligochaeta, %Chironomidae, and Coleoptera richness, have also been selected for integration into MMI because of their significance in defining ecological status [60]. Among these, Chironomidae and Oligochaeta have been known to respond positively to increasing anthropogenic activities in freshwater systems [14]. This was confirmed by %Chironomidae+Oligochaeta correlation with nutrient (nitrate), conductivity, BOD, and water temperature on the RDA we performed in the present study. Other authors had earlier integrated our selected metrics into multimetric indices, e.g., [3,35]. In recent times, studies on the use of Chironomidae and other tolerant taxa, such as Oligochaetes, in flowing water ecosystems as an indicator of pollution have received attention. Chironomidae (Diptera) and Oligochaetes (Annelida) preponderance in ecosystems rich in increasing nutrient concentration and depleting dissolved oxygen concentration have been reported by several authors, e.g., [23,49], to be useful indicators for assessing organic pollution in riverine systems. The possession of haemoglobin by Chironomidae makes them tolerant of sites with depleted oxygen concentration as they use haemoglobin molecules to trap oxygen within their body in the event of reduced dissolved oxygen in water [25,34], hence, their importance in assessing polluted sites in riverine systems. Other genera of the order Diptera (e.g., Eristalis in the family Syrphidae) possess extensible breathing tubes for capturing atmospheric oxygen in the face of depleted dissolved oxygen in polluted sites [46]. Further, Oligochaetes have moist skin, which enables them to extract atmospheric oxygen, hence, their ability to survive in polluted sites. These features possessed by this group of macroinvertebrates make them important taxa for developing indices of biotic integrity and other biomonitoring tools globally [22,25,34,35,46,49].

5. Conclusions

In this study, we developed a multimetric index (MMI) for forested riverine sites draining partially urbanising landscape in the Niger Delta region of Nigeria. Five metrics in the measures of abundance, composition, richness, and diversity were finally selected and integrated into the MMI. Of the five integrated metrics, four were adjudged to be sensitive to pollution, namely: Trichoptera abundance, Coleoptera richness, Simpson diversity, and Shannon–Wiener diversity. On the other hand, the remaining metric %Chironomidae+Oligochaeta was pollution tolerant. The combination of both sensitive and tolerant metrics in the MMI we developed made it robust and deemed effective for biomonitoring forested riverine systems draining partially urbanising catchments. Forested streams and rivers in the Niger Delta region have been urbanising tremendously and MMI of this kind is pertinent to assess the level of perturbation the streams are subjected to. We recommend the developed MMI for biomonitoring forested rivers and streams impacted by urban pollution in the Niger Delta region of Nigeria. Further, we recommend a more sophisticated MMI to be developed for the Niger Delta region, which will take into account more sampling sites along the stretch of the riverine systems in the region.

Author Contributions

Conceptualization, A.O.E.; methodology, A.O.E., O.N.O. and F.O.A.; validation, A.O.E.; formal analysis, A.O.E.; investigation, A.O.E.; data curation, A.O.E.; writing—original draft preparation, A.O.E.; writing—review and editing, A.O.E., F.C.A., O.N.O., F.O.A., T.T.E.O., E.C.A., E.O., E.A.K. and K.H.N.; funding acquisition, A.O.E. All authors have read and agreed to the published version of the manuscript.

Funding

This research was funded by the South Africa National Research Foundation (NRF) and The World Academy of Sciences (TWAS), grant/award number: 110894.

Data Availability Statement

Datasets used in the study are available at https://www.mdpi.com/2073-4441/12/11/3111/s1 (accessed 21 July 2021).

Acknowledgments

This work was supported by the National Research Foundation of South Africa and The World Academy of Sciences (NRF-TWAS-grant number: 110894). Banwinile Malhaba is hereby acknowledged for making the initial study area map.

Conflicts of Interest

The authors declare no conflict of interest.

Appendix A

Table A1. Potential impact categories classification and mean (range) of physico-chemical conditions of forested river sites draining partially urbanized landscapes in the present study.
Mean Physico-Chemical Variables
RiversSite CodesLISMISHISWater Temperature (°C)Depth
(m)
Flow Velocity
(ms−1)
Conductivity
(µscm−1)
DO
(mgL−1)
BOD
(mgL−1)
pHNitrate
(mgL−1)
Phosphate
(mgL−1)
WarriWa2X 22.3
(21.0–23.4)
0.91
(0.63–1.12)
0.14
(0.1 –1.7)
9.5
(8.11–11.5)
5
(4.3–5.62)
0.9
(0.04–1.24)
7
(6.8 –7.2)
0.1
(0.09–0.12)
0.1
(0.07–0.12)
WarriWa1X 25.2
(23.4–28.0)
0.95
(0.65–1.31)
0.14
(0.13–0.22)
9.9
(8.02–12.1)
8.8
(7.0–10.8)
1
0.72–1.1)
7
(6.6–7.2)
0.09
(0.06–0.12)
0.09
(0.06–0.11)
AdofiAdX 21.1
(20.2–21.5)
0.56
(0.37–0.74)
0.27
(0.24–0.35)
11.7
(9.8–13.2)
8
(7.06–9.2)
2.3
(1.9–2.8)
6.7
(5.5–7.1)
0.5
(0.42–0.53)
0.4
(0.38–0.42)
OrogodoOr X 26
(24.5–28.4)
0.66
(0.25–0.75)
0.1
(0.09–0.17)
13.6
(12.0–14.3
7.4
(5.0–7.8)
2.3
(2.1–2.6)
6.4
(6.1–7.9)
2.8
(0.8–3.4)
0.01
(0.009–0.013)
AseAs2 X 24.9
(22.3–25.0)
0.54
(0.34–0.61)
0.27
(0.17–0.32)
15.3
(12.6–16.4)
6.1
(5.5–6.3)
2.4
(1.8–2.8)
7.3
(5.2–8.3)
1.3
(0.6–2.6)
0.15
(0.12–0.17)
IyiukwuIy3 X 27.8
(25.6–28.6)
0.45
(0.23–0.51)
0.23
(0.09–0.32)
15.4
(11.5–16.8)
6
(5.2–6.9)
2.6
(1.9–2.9)
6.4
(6.2–6.7)
0.03
(0.01–0.05)
2.2
(1.3–2.9)
IyiukwuIy1 X 27.4
(21.7–29.3)
0.59
(0.15–0.62)
0.2
(0.12–0.24)
16.6
(13.2–17.4)
6
(5.6–6.4)
2.8
(1.6–3.2)
5.6
(4.7–6.2)
0.4
(0.01–0.7)
2.8
(0.08–3.5)
AseAs1 X 25.3
(22.3–26.0)
0.7
(0.51–0.82)
0.22
(0.07–0.28)
17
(13.0–18.5)
5.4
(5.2–5.8)
3.3
(0.98–4.6)
6.7
(5.6–7.9)
2.3
(0.06–2.8)
0.13
(0.03–0.16)
IyiukwuIy2 X 27.6
(24.6–28.2)
0.63
(0.25–0.68)
0.2
(0.08–0.24)
17.4
(11.2–18.0)
6
(5.5–6.8)
3.2
(2.4–3.8)
5.6
(4.3–6.1)
0.04
(0.01–0.08)
2.5
(1.2–2.9)
BeninBe3 X 24.7
(21.5–25.5)
0.66
(0.56–0.72)
0.14
(0.05–0.17)
20.7
(17.2–22.6)
8
(7.2–8.4)
2.9
(2.3–3.1)
6
(5.0–6.5)
0.08
(0.01–0.09)
0.06
(0.02–0.08)
OssiomoOs2 X26
(21–27.5)
0.53
(0.45–0.56)
0.26
(0.13–0.28)
23
(21.0–24.0)
6.6
(5.4–7.4)
1.8
(0.9–2.3)
6.2
(5.6–6.7)
0.04
(0.02–0.05)
0.24
(0.06–0.27)
BeninBe1 X24.5
(23.1–24.8)
1
(0.4–1.2)
0.13
(0.09–0.16)
24.9
(22.5–25.7)
6.7
(5.0–7.4)
2.9
(1.3–3.7)
6.7
(6.2–6.9)
0.08
(0.02–0.10)
0.08
(0.01–0.09)
OssiomoOs1 X25.9
(24.8–26.7)
0.53
(0.22–0.58)
0.29
(0.12–0.34)
25.6
(21.4–26.2)
6
(5.3–6.2)
2.3
(1.9–2.8)
6.2
(5.4–7.6)
0.05
(0.01–0.07)
0.2
(0.12–0.20)
OwanOa X24.7
(23.8–25.1)
1.36
(0.62–1.53)
0.34
(0.06–0.42)
29.2
(21.4–30.2)
6.2
(5.1–6.7)
2.1
(1.3–2.9)
6.5
(6.2–6.8)
0.06
(0.01–0.09)
0.69
(0.01–0.87)
UmalukuUm2 X26
(21.6–27.3)
0.63
(0.16–0.74)
0.19
(0.11–0.22)
35.5
(26.5–36.0)
5.4
(5.0–6.4)
2.5
(1.8–2.8)
6.8
(5.6–7.2)
1.25
(0.07–1.4)
10.6
(2.5–11.8)
ErioraEr X29.8
(23.8–30.4)
0.75
(0.51–0.78)
0.25
(0.18–0.27)
56.5
(34.0–58.5)
11.3
(5.9–11.8)
9.7
(7.2–11.8)
5.3
(4.7–5.8)
1.45
(0.05–1.57)
0.26
(0.01–0.32)
UmomiUi2 X22.4
(20.0–23.5)
1
(0.40–1.1)
0.22
(0.18–0.26)
62.5
(45.8–63.7)
6.3
(6.2–6.6)
3.5
(2.3–3.9)
6.8
(5.8–7.4)
0.04
(0.01–0.07)
1.3
(1.1–1.4)
UmalukuUm1 X25.7
(22.4–26.3)
0.49
(0.21–0.52)
0.22
(0.07–0.26)
70.3
(43.9–71.3)
2.8
(2.2–2.6)
8.8
(7.5–9.7)
5.9
(5.2–6.3)
4.4
(1.2–5.6)
0.34
(0.01–0.52)
UmomiUi1 X22
(20–24.5)
0.99
0.23–1.3)
0.2
(0.10–0.25)
81.9
(72.3–82.6)
5
(4.3–5.4)
3.4
(2.7–3.8)
6.9
(5.8–7.1)
0.03
(0.01–0.04)
1.15
(1.1–1.16)
BeninBe2 X24.5
(21–8–26.2)
0.79
(0.52–0.82)
0.19
(0.08–0.25)
198
(187–199)
4
(3.9–4.2)
14.6
(9.5–16.5)
7.2
(6.3–8.0)
0.5
(0.2–0.7)
0.8
Note: LIS = least-impacted sites, MIS = moderately impacted sites, HIS = heavily impacted sites; X means site is either LIS, MIS and HIS.
Table A2. Selected macroinvertebrates metrics for the present study.
Selected Macroinvertebrate MetricsCorresponding Codes for
Selected Metrics
Expected Response of Selected Metrics to Ecosystem
Degradation
Abundance measures
Ephemeroptera family abundanceEph AbunNegative
Trichoptera family abundance Tri AbunNegative
Ephemeroptera Plecoptera and Trichoptera abundance EPT AbunNegative
Ephemeroptera Trichoptera Odonata and Coleoptera abundance ETOC AbunNegative
Chironomidae abundanceChi AbunPositive
Oligochaeta family abundanceOli AbunPositive
Chironomidae + Oligochaeta abundance Chi + Oli AbunPositive
Mollusca family abundance Mol AbunPositive
Diptera family abundance Dip AbunPositive
Decapoda family abundance Dec AbunVariable
Mollusca + Diptera family abundanceMol + Dip AbunPositive
Mollusca + Decapoda family abundance Mol + Dec AbunVariable
Odonata family abundance Odo AbunNegative
Coleoptera family abundance Col AbunNegative
Hemiptera family abundance Hem AbunNegative
Coleoptera + Hemiptera abundance Col + Hem AbunNegative
Ephemeroptera Plecoptera and Trichoptera family/Chironomidae abundance EPT/Chi AbunNegative
Ephemeroptera Trichoptera Odonata and Coleoptera family/Chironomidae abundance ETOC/Chi AbunNegative
Ephemeroptera Trichoptera Odonata and Coleoptera family/Diptera abundance ETOC/Dip AbunNegative
Chironomidae/Diptera family abundance Chi/Dip AbunPositive
Composition measures
% Ephemeroptera%EphNegative
% Trichoptera%TriNegative
% Ephemeroptera, Plecoptera and Trichoptera%EPTNegative
% Ephemeroptera, Trichoptera, Odonata and Coleoptera%ETOCNegative
% Chironomidae %ChiPositive
% Oligochaeta%OliPositive
%Chironomidae+Oligochaeta%Chi + OliPositive
% Mollusca%MolPositive
% Diptera%DipPositive
% Decapoda%DecVariable
%Mollusca+Decapoda%Mol + DecVariable
%Mollusca+Diptera%Mol + DipPositive
% Coleoptera%ColNegative
% Hemiptera %HemNegative
% Odonata%OdoNegative
% Coleoptera + Hemiptera%Col + HemNegative
Richness measures
Ephemeroptera richnessEph RichNegative
Trichoptera richnessTri RichNegative
Ephemeroptera, Plecoptera and Trichoptera richness EPT RichNegative
Ephemeroptera, Trichoptera, Odonata and Coleoptera richnessETOC RichNegative
Mollusca richnessMol RichPositive
Diptera richnessDip RichIncrease
Chironomidae richness Chi RichPositive
Oligochaeta richnessOli RichPositive
Chironomidae + Oligochaeta richnessChi + Oli RichPositive
Coleoptera richnessCol RichNegative
Hemiptera richnessHem RichNegative
Coleoptera + Hemiptera richness Col + Hem RichNegative
Odonata richnessOdo RichNegative
Decapoda richness Dec RichVariable
Diversity measures
Shannon–Wiener diversity index (H) Sha IndNegative
Margalef index (Taxa diversity index) Mar IndNegative
Evenness index (e^H/S) Eve IndNegative
Simpson diversity (1–D) Sim DivNegative
Traits measures
Logarithm of relative abundance of large (>20–40 mm)Log LarNegative
Logarithm of relative abundance of hardshellLog HaSNegative
Logarithm of relative abundance of predator Log PrePositive
Logarithm of relative abundance of nymphLog NymNegative
Logarithm of relative abundance of pupa aquatic stageLog PupPositive
Table A3. Confirmation of selected forested riverine system macroinvertebrate metrics sensitivity to urban pollution. Note: Sensitivity of a metric is confirmed if its p-value is <0.05. √ = sensitivity confirmed, X = sensitivity not confirmed.
MetricsMann–Whitney Testp-ValueMetric Sensitivity Status
Abundance measures
Tri Abun7500.0025
Col Abun9190.087X
EPT/Chi Abun4685.35 × 10−7
Composition measures
%EPT9680.18X
%Tri9670.16X
%ETOC9920.24X
%Odo7630.0044
%Mol+Dip4013.81 × 10−8
%Chi2963.61 × 10−10
%Chi+Oli3882.16 × 10−8
%Dip4411.93 × 10−7
Richness measures
ETOC Rich 9590.16X
Col Rich6630.000305
Hem Rich7210.0013
Col+Hem Rich6025.17 × 10−5
Odo Rich9230.090X
Diversity measures
Sha Div7640.0045
Mar Ind6086.71 × 10−5
Sim Div6630.00040
Trait attributes measures
LogPup9930.025
Figure A1. Box and whisker plots showing metric sensitivity between least-impacted sites (LIS), moderately impacted sites (MIS), and highly impacted sites (HIS).
Sustainability 14 11289 g0a1aSustainability 14 11289 g0a1b
Figure A2. Box and whisker plots showing metric seasonality.
Sustainability 14 11289 g0a2aSustainability 14 11289 g0a2b

References

  1. Parienté, W. Urbanisation in Sub-Saharan Africa and challenges of access to basic services. J. Demogr. Econ. 2017, 83, 31–39. [Google Scholar] [CrossRef]
  2. Edegbene, A.O.; Arimoro, F.O.; Odume, O.N. Developing and applying a macroinvertebrate-based multimetric index for urban rivers in the Niger Delta, Nigeria. Ecol. Evol. 2019, 9, 12869–12885. [Google Scholar] [CrossRef] [PubMed]
  3. Mereta, S.T.; Boets, P.; De Meester, L.; Goethals, P.L.M.C. Development of multimetric index based on benthic macroinvertebrates for the assessment of natural wetlands in southwest Ethiopia. Ecol. Indic. 2013, 29, 510–521. [Google Scholar] [CrossRef]
  4. Gieswein, A.; Hering, D.; Lorens, A.W. Development and validation of a macroinvertebrate-based biomonitoring tool to assess fine sediment impact in small mountain streams. Sci. Total Environ. 2019, 652, 1290–1301. [Google Scholar] [CrossRef] [PubMed]
  5. Arimoro, F.O.; Ikomi, R.B.; Nwadukwe, F.O.; Eruotor, O.D.; Edegbene, A.O. Fluctuating salinity levels and increasing pollution gradient on fish community structure and trophic levels in a small creek in the Niger Delta, Nigeria. Int. Aquat. Res. 2014, 6, 187–202. [Google Scholar] [CrossRef]
  6. Vannote, R.L.; Minshall, G.W.; Cummins, K.W.; Sedell, J.R.; Cushing, C.E. The river continuum concept. Can. J. Fish. Aquat. Sci. 1980, 37, 130–137. [Google Scholar] [CrossRef]
  7. Sedell, J.R.; Reeves, G.H.; Hauer, F.R.; Stanford, J.A.; Hawkins, C.P. Role of refugia in recovery from disturbances: Modern fragmented and disconnected river systems. Environ. Manag. 1990, 14, 711–724. [Google Scholar] [CrossRef]
  8. Rowntree, K.M.; Wadeson, R.A.; O’Keeffe, J. The development of a geomorphological classification system for the longitudinal zonation of South African rivers. S. Afr. Geogr. J. 2000, 82, 163–172. [Google Scholar] [CrossRef]
  9. Desrosiers, M.; Usseglio-Polatera, P.; Archaimbault, V.; Larras, F.; Methot, G.; Pinel-Alloul, B. Assessing anthropogenic pressure in the St. Lawrence River using traits of benthic macroinvertebrates. Sci. Total Environ. 2019, 649, 233–246. [Google Scholar] [CrossRef]
  10. Bonada, N.; Prat, N.; Resh, V.H.; Statzner, B. Development in aquatic insect biomonitoring: A comparative analysis of recent approaches. Annu. Rev. Entomol. 2006, 51, 495–523. [Google Scholar] [CrossRef] [Green Version]
  11. Monaghan, K.; Soares, A.M.V.M. Bringing new knowledge to an old problem: Building a biotic index from lotic macroinvertebrates traits. Ecol. Indic. 2012, 20, 213–220. [Google Scholar] [CrossRef]
  12. Edegbene, A.O.; Arimoro, F.O.; Odume, O.N. Exploring the distribution patterns of macroinvertebrate signature traits and ecological preferences and their responses to urban and agricultural pollution in selected rivers in the Niger Delta ecoregion, Nigeria. Aquat. Ecol. 2020, 54, 553–573. [Google Scholar] [CrossRef]
  13. Ruaro, R.; Gubiani, E.A.; Hughes, R.M.; Mormul, R.P. Global trends and challenges in multimetric indices of ecological condition. Ecol. Indic. 2020, 110, 105862. [Google Scholar] [CrossRef]
  14. Melo, S.; Stenert, C.; Dalzochio, M.S.; Maltchik, L. Development of a multimetric index based on aquatic macroinvertebrate communities to assess water quality of rice fields in southern Brazil. Hydrobiologia 2015, 742, 1–14. [Google Scholar] [CrossRef]
  15. Stevenson, R.J.; Zalack, J.T.; Wolin, J. A multimetric index of lake diatom condition based on surface-sediment assemblages. Freshw. Sci. 2013, 32, 1005–1025. [Google Scholar] [CrossRef]
  16. Katsiapi, M.; Moustaka-Gouni, M.; Sommer, U. Assessing ecological water quality of freshwaters: Phycol—A new phytoplankton community index. Ecol. Inf. 2016, 31, 22–29. [Google Scholar] [CrossRef]
  17. Petriki, O.; Lazaridou, M.; Bobori, D.C. A fish-based index for the assessment of the ecological quality of temperate lakes. Ecol. Indic. 2017, 78, 556–565. [Google Scholar] [CrossRef]
  18. Tsiaoussi, V.; Mavromatic, E.; Kemitzoglou, D. Report on the development of the national method for the assessment of the ecological status of natural lakes in Greece. In Using he Biological Quality Element “Phytoplankton”, 1st ed.; Greek Biotope/Wetland Centre and Special Secretariat for Waters, Ministry of Environment: Thermi, Greece, 2017. [Google Scholar]
  19. Zervas, D.; Tsiaoussi, V.; Tsiripidis, I. HeLM: A macrophyte-based method for monitoring and assessment of Greek lakes. Environ. Monit. Assess. 2018, 190, 326. [Google Scholar] [CrossRef] [PubMed]
  20. Lu, K.; Wu, H.; Xue, Z.; Lu, X.; Batzer, D.P. Development of a multi-metric index based on aquatic invertebrates to assess floodplain wetland condition. Hydrobiologia 2019, 827, 141–153. [Google Scholar] [CrossRef]
  21. Moyo, S.; Richoux, N.B. Macroinvertebrate functional organization along the longitudinal gradient of an austral temperate river. Afr. Zool. 2017, 52, 125–136. [Google Scholar] [CrossRef]
  22. Pallottini, M.; Cappelletti, D.; Fabrizi, A.; Gaino, E.; Goretti, E.; Selvaggi, R.; Cereghino, R. Macroinvertebrate functional trait responses to chemical pollution in agricultural landscapes. River Res. Appl. 2017, 33, 505–513. [Google Scholar] [CrossRef]
  23. White, J.C.; Hill, M.J.; Bickerton, M.A.; Wood, P.J. Macroinvertebrate taxonomic and trait compositions within lotic habitats affected by river restoration practices. Environ. Manag. 2017, 60, 513–525. [Google Scholar] [CrossRef] [PubMed]
  24. Edegbene, A.O.; Arimoro, F.O.; Odume, F.O. How does urban pollution influence macroinvertebrate traits in forested riverine systems? Water 2020, 12, 3111. [Google Scholar] [CrossRef]
  25. Arimoro, F.O.; Odume, O.N.; Uhunoma, S.I.; Edegbene, A.O. Anthropogenic impact on water chemistry and benthic macroinvertebrate associated changes in a southern Nigeria stream. Environ. Monit. Assess. 2015, 187, 1–14. [Google Scholar] [CrossRef]
  26. Zabbey, N.; Erondu, E.S.; Hart, A.I. Nigeria and the prospect of shrimp farming: Critical issues. Livest. Res. Rural. Dev. 2010, 22, 1–6. Available online: https://wwwlrrdorg/lrrd2%202/11/zabb2%202198htm (accessed on 9 August 2022).
  27. Edegbene, A.O.; Arimoro, F.O. Ecological Status of Owan River, Southern Nigeria Using Aquatic Insects as Bioindicators. J. Aquat. Sci. 2012, 27, 99–111. [Google Scholar]
  28. Gordon, N.D.; McMahon, T.A.; Finlayson, B.L. Stream Hydrology, an Introduction for Ecologists; John Wiley & Sons Ltd.: New York, NY, USA, 1994. [Google Scholar]
  29. APHA. Standard Methods for the Examination of Water and Wastewater; American Public Health Association: Washington, DC, USA, 1995. [Google Scholar]
  30. Lazorchak, J.M.; Klemm, D.J.; Peck, D.V. Environmental Monitoring and Assessment Program Surface Waters: Field Operations and Methods Manual for Measuring the Ecological Condition of Wadeable Streams; EPA 620/R-94/004F; Environmental Protection Agency: Washington, DC, USA, 1998. [Google Scholar]
  31. Day, J.A.; Harrison, A.D.; De Moor, I.J. Guides to the Freshwater Invertebrates of Southern Africa: Diptera; Water Research Commission: Pretoria, Southern Africa, 2003. [Google Scholar]
  32. de Moor, I.J.; Day, J.A.; de Moor, F.C. Guides to the Freshwater Invertebrates of Southern Africa. Volume 7: Insecta I. Ephemeroptera, Odonata and Plecoptera; Report No. TT207/03; Water Research Commission: Pretoria, South Africa, 2003. [Google Scholar]
  33. Merritt, R.W.; Cummins, K.W. An Introduction to the Aquatic Insects of North America; Kendall Hunt: St. Louis, MO, USA, 1996. [Google Scholar]
  34. Odume, O.N.; Palmer, C.G.; Arimoro, F.O.; Mensah, P.K. Chironomid assemblage structure and morphological response to pollution in an effluent-impacted river, Eastern Cape, South Africa. Ecol. Indic. 2016, 67, 391–402. [Google Scholar] [CrossRef]
  35. Edegbene, A.O.; Elakhame, L.A.; Arimoro, F.O.; Osimen, E.C.; Odume, O.N. Development of Macroinvertebrates Multimetric Index for Ecological Evaluation of a River in North Central Nigeria. Environ. Monit. Assess. 2019, 191, 274. [Google Scholar] [CrossRef]
  36. Oksanen, J.; Blanchet, D.; Minchin, P.R.; O’Hara, R.B.; Simpson, G.L.; Solymos, P.; Steven, M.H.M.; Szoecs, E.; Wagner, H. Vegan: Community Ecology Package. Published 04-02-2019, 11:50:04 UTC. 2019. Available online: https://cran.r-project.org; https://github.com/veganders/vegan (accessed on 11 February 2019).
  37. R Development Core Team. R Statistical Computing Environment; R Foundation for Statistical Computing: Vienna, Austria, 2019; ISBN 3-900051-07-0. [Google Scholar]
  38. Baptista, D.F.; Henriques-Oliveira, A.L.; Oliveira, R.B.S.; Mugnai, R.; Nessimian, J.L.; Buss, D.F. Development of a benthic multimetric index for Serra da Bocaina bioregion in Southeast Brazil. Braz. J. Biol. 2013, 73, 573–583. [Google Scholar] [CrossRef]
  39. Fierro, P.; Arismendi, I.; Hughes, R.M.; Valdovinos, C.; Jara-Flores, A. A benthic macroinvertebrate multimetric index for Chilean Mediterranean streams. Ecol. Indic. 2018, 91, 13–23. [Google Scholar] [CrossRef]
  40. Clarke, K.R.; Warwick, R.M. Change in Marine Communities: An Approach to Statistical Analysis and Interpretation; Plymouth Marine Laboratory: Plymouth, UK, 1994. [Google Scholar]
  41. Krynak, E.M.; Yates, A.G. Benthic invertebrates taxonomic and trait associations with land use intensively managed watershed: Implications for indicator identification. Ecol. Indic. 2018, 93, 1050–1059. [Google Scholar] [CrossRef]
  42. Chevenet, F.; Dolédec, S.; Chessel, D. A fuzzy coding approach for analysis of longterm ecological data. Freshw. Biol. 1994, 31, 295–309. [Google Scholar] [CrossRef]
  43. Baptista, D.F.; Buss, D.F.; Egler, M.; Giovanelli, A.; Silveira, M.P.; Nessimian, J.L. A multimetric index based on benthic macroinvertebrates for evaluation of Atlantic Forest streams at Rio de Janeiro State, Brazil. Hydrobiologia 2007, 575, 83–94. [Google Scholar] [CrossRef]
  44. Barbour, M.T.; Gerritsen, J.; Griffith, G.E.; Frydenbourg, R.; McCarron, E.; White, J.S.; Bastian, M.L. A framework for biological criteria for Florida streams using benthic macroinvertebrates. J. N. Am. Benthol. Soc. 1996, 15, 185–211. [Google Scholar] [CrossRef]
  45. Hammer, Ø.; Harper, D.A.T.; Ryan, P.D. PAST: Paleontological statistics software package for education and data analysis. Palaeontol. Electron. 2001, 4, 9. [Google Scholar]
  46. Edegbene, A.O. Developing Macroinvertebrate Trait-And Taxonomically-Based Approaches for Biomonitoring Wadeable Riverine Systems in the Niger Delta, Nigeria. Ph.D. Thesis, Rhodes University, Grahamstown, South Africa, 2020. [Google Scholar] [CrossRef]
  47. Aura, C.M.; Kimani, E.; Musa, S.; Kundu, R.; Njiru, J.M. Spatio-temporal macroinvertebrate multi-index of biotic integrity (MMiBI) for a coastal river basin: A case study of River Tana, Kenya. Ecohydrol. Hydrobiol. 2017, 17, 113–124. [Google Scholar] [CrossRef]
  48. Stoddard, J.L.; Herlihy, A.T.; Peck, D.V.; Hughes, R.M.; Whitter, T.R.; Tarquinio, E. A process for creating multimetric indices for large-scale aquatic surveys. J. N. Am. Benthol. Soc. 2008, 27, 878–891. [Google Scholar] [CrossRef]
  49. Huang, Q.; Gao, J.; Cai, Y.; Yin, H.; Gao, Y.; Zhao, J.; Liu, L.; Huang, J. Development and application of benthic macroinvertebrate-based multimetric indices for the assessment of streams and rivers in the Taihu Basin, China. Ecol. Indic. 2015, 48, 649–659. [Google Scholar] [CrossRef]
  50. Terra, B.F.; Hughes, R.M.; Francelinus, M.R.; Araujo, F.G. Assessment of biotic condition of Atlantic Rainforest Streams: A fish-based multimetric approach. Ecol. Indic. 2013, 34, 136–148. [Google Scholar] [CrossRef]
  51. Edegbene, A.O. Assessing the health of forested riverine systems in the Niger Delta area of Nigeria: A macroinvertebrate-based multimetric index approach. Environ. Sci. Pollut. Res. 2022, 29, 15068–15080. [Google Scholar] [CrossRef]
  52. Klemm, D.J.; Blocksom, K.A.; Fulk, F.A.; Herlihy, A.T.; Hughes, R.M.; Kaufmann, P.R.; Peck, D.V.; Stoddard, J.L.; Thoeny, W.T.; Griffith, M.B.; et al. Development and evaluation of a macroinvertebrate biotic integrity index (MBII) forregionally assessing Mid-Atlantic highlands streams. Environ. Manag. 2003, 31, 656–669. [Google Scholar] [CrossRef] [PubMed]
  53. Ganasan, V.; Hughes, R.M. Application of an index of biological integrity to fish assemblages of the rivers Khan and Kshipra, India. Freshw. Biol. 1998, 40, 367–383. [Google Scholar] [CrossRef]
  54. ter Braak, C.J.F. Ordination. In Data Analysis in Community and Landscape Ecology; Jongman, R.H.J., ter Braak, C.J.F., van Tongeren, O.F.R., Eds.; Cambridge University Press: Cambridge, UK, 1995. [Google Scholar]
  55. Legendre, P.; Legendre, L. Numerical Ecology. In Development in Environmental Modelling, 3rd ed.; Elsevier Science BV: Amsterdam, The Netherlands, 2012; Volume 24. [Google Scholar]
  56. Helson, J.E.; Williams, D.D. Development of a macroinvertebrate multimetric index for the assessment of low-land streams in the neotropics. Ecol. Indic. 2013, 29, 167–178. [Google Scholar] [CrossRef]
  57. Barbour, M.T.; Gerritsen, J.; Synder, B.D.; Stribling, J.B. Rapid Bioassessment Protocols for Use in Streams and Wadeable Rivers: Periphyton, Benthic Macroinvertebrates and Fish, 2nd ed.; EPA 841-B-99-002; Environmental Protection Agency, Office of Water: Washington, DC, USA, 1999. [Google Scholar]
  58. Suriano, M.T.; Fonseca-Gessner, A.A.; Roque, F.O.; Froehlich, C.G. Choice of macroinvertebrate metrics to evaluate stream conditions in Atlantic Forest, Brazil. Environ. Monit. Assess. 2011, 175, 87–101. [Google Scholar] [CrossRef]
  59. Pond, G.J.; Bailey, J.E.; Lowman, B.M.; Whitman, M.J. Calibration and validation of a regionally and seasonally stratified macroinvertebrate index for West Virginia wadeable streams. Environ. Monit. Assess. 2013, 185, 1515–1540. [Google Scholar] [CrossRef]
  60. Rizo-Patron, F.; Kumar, A.; Colton, M.B.; Springer, M.; Trama, F.A. Macroinvertebrate communities as bioindicators of water quality in conventional and organic irrigated rice fields in Guanacaste, Costa Rica. Ecol. Indic. 2013, 29, 68–78. [Google Scholar] [CrossRef]
Figure 1. Map of the Niger Delta region of Nigeria showing region elevations (maps of Africa and Nigeria insert).
Sustainability 14 11289 g001
Figure 2. Map of the study area showing the sampling stations (map of the Niger Delta region of Nigeria insert).
Sustainability 14 11289 g002
Figure 3. Redundancy analysis of the correlation between MMI metrics and physio-chemical variables. Abbreviations: Physio-chemical variables: Wat Temp = water temperature, Cond = conductivity, Flow Vel = flow velocity, Nit = Nitrate, Phos = phosphate, DO =dissolved oxygen, BOD = biochemical oxygen demand. Metrics: Tri Abun = Trichoptera abundance, Col Rich = Coleoptera richness, %Chi+Oli = %Chironomidae+oligochaete, Sim Div—Simpson diversity, Sha Div = Shannon–Wiener diversity.
Sustainability 14 11289 g003
Table 1. Repeatability (signal/noise) of macroinvertebrate metrics.
MetricsSignal (N)Noise (N)S/NMetric Status
Tri Abun285.3171.41.66Rejected
EPT/Chi Abun2756.60.48Rejected
%Odo47.530.21.57Rejected
%Chi222.31131.541.69Rejected
%Chi+Oli256.519.912.89Retained
%Dip389.517.322.50Retained
%Mol+Dip409.119.321.20Retained
Col Rich4.752.32.07Retained
Col+Hem Rich10.425.271.97Rejected
Sha Div0.220.0593.73Retained
Sim Div0.00280.0002212.73Retained
Mar Ind2.371.331.78Rejected
Table 2. Redundancy of macroinvertebrate metrics as revealed by Spearman’s rank correlation (r ≥ 0.78, p < 0.05).
Metrics%Chi+Oli%Dip%Mol+DipCol RichSim DivSha Div
%Chi+Oli0.002.14 × 10−72.14 × 10−70.890080.0461070.079317
%Dip0.88530.000.000.71110.0387530.034475
%Mol+Dip0.88531.000.000.71110.0387530.034475
Col Rich−0.033020.0883450.0883450.000.0180820.00906
Sim Div0.450710.465190.465190.522580.001.77 × 10−11
Sha Div0.40150.474610.474610.56750.960870.00
Note: None of the metrics were significant at p < 0.05.
Table 3. Metric values and scoring.
MetricsPercentiles
5th (Scoring Floor)95th (Scoring Ceiling)
Trich Abun1.0014.1
%Chi+Oli1.2715.20
Col Rich3.958.00
Sim Div0.910.96
Sha Div2.703.50
Publisher’s Note: MDPI stays neutral with regard to jurisdictional claims in published maps and institutional affiliations.

