Article

Rural Development Potential in the Bioeconomy in Developed Countries: The Case of Biogas Production in Denmark

by
Jens Fyhn Lykke Sørensen
* and
Henning Peter Jørgensen
Department of Sociology, Environmental and Business Economics, University of Southern Denmark, Degnevej 14, 6705 Esbjerg Ø, Denmark
*
Author to whom correspondence should be addressed.
Sustainability 2022, 14(17), 11077; https://doi.org/10.3390/su141711077
Submission received: 16 August 2022 / Revised: 26 August 2022 / Accepted: 31 August 2022 / Published: 5 September 2022

Abstract

:
Policy makers have expressed much optimism about the potentials of the bioeconomy in terms of economic growth and job creation in rural areas in developed countries. However, only few studies have attempted to quantify the rural employment effects of bioeconomic projects. This paper uses the biogas production in Denmark as a case within the bioeconomy. It performs a regional input-output analysis to estimate the number of jobs created in rural areas by an increase in the biogas production. The input-output analysis estimates the direct job creation at the biogas plants, the indirect job creation at firms that supply inputs to the plants, and the induced job creation that is generated locally through increased income spending. The results show that an increase in the biogas production by 10% of the available farm manure will give a permanent increase of 342 jobs and an extra annual income of approximately 21 million euros. Consequently, if all available biomass from farm manure were to be used in biogas production, it would result in 3420 jobs. The calculated employment effect is quite sizable but still somewhat modest compared to the significant employment declines in rural Denmark in recent years. Meanwhile, biogas is only one element in the bioeconomy.

1. Introduction

In recent decades, rural areas in Western countries have faced a wide range of interconnected challenges, such as depopulation, loss of workplaces, deterioration of the housing stock, and loss of private and public services etc. [1,2]. To counter this development, the bioeconomy—a biomass-based economy—has often been mentioned as a promising development opportunity.
Policy makers have expressed much optimism about the potentials of the bioeconomy in terms of economic growth and job creation in rural areas in developed countries [3,4,5,6,7,8]. For example, in the 2012 EU strategy on bioeconomy, it is envisioned that the bioeconomy can “maintain and create economic growth and jobs in rural, coastal and industrial areas, reduce fossil fuel dependence and improve the economic and environmental sustainability of primary production” [3] (p. 2). In the 2018 update of the EU strategy on bioeconomy, it is stated that “a sustainable European bioeconomy would lead to the creation of jobs, particularly in coastal and rural areas” [4] (p. 2) and that the bioenergy has the potential “to boost local rural economies through increased investment in skills, knowledge, innovation and new business models” [4] (p. 6). Moreover, in the OECD strategy on bioeconomy, it is envisioned that the bioeconomy can “reverse the neglect of agriculture” [5] (p. 6) and be a tool to promote “rural regeneration, re-industrialization, the circular economy and smart specialization” [6] (p. 11).
Researchers have also expressed optimism about the rural development potential in the bioeconomy. Various theoretical papers argue that the bioeconomy may enhance the development and economic growth of rural areas [9,10]. Among other things, it is argued that the bioeconomy may result in an increased demand for biomass, which primarily originates in rural areas. It is also mentioned that the bioeconomy permits decentralized small-scale production that can stimulate local economic development [11,12]. Likewise, it is argued that there is a need to acquire more value out of the waste materials in agriculture [13]. Apart from these regional development potentials, the bioeconomy has potentials in relation to the environment and in terms of sustainability [14,15].
In a report commissioned by the Nordic Working Group on Green Growth under the Nordic Council of Ministers, Teräs et al. [16] investigate different cases of bioeconomy in peripheral areas in five Nordic countries (Denmark, Finland, Iceland, Norway, Sweden). Based on literature reviews, document analyses and study visits and interviews, Teräs et al. [16] (p. 9) conclude that the “bioeconomy can be an engine for creating jobs and economic activities in rural regions while being beneficial for the environment”—without, however, specifying how many jobs the bioeconomic activities have created. In the most optimistic scenario, Johnson and Altman [10] point to the possibility that rural areas may obtain a comparative advantage over urban areas if the present fossil-based economy were to be completely replaced by a bio-based economy. Rural areas would gain this advantage mainly through low transportation costs due to their closeness to biomass resources.
At present, the positive expectations regarding the job creation potential in the bioeconomy in rural areas in Western countries are mainly theoretically based. In fact, attempts to quantify the rural employment effects of bioeconomic projects are very rare. To fill some of this gap, this paper contributes with an estimation of the job effects for a case within the Danish bioeconomy using a regional input-output model. The paper estimates the number of jobs created in rural areas by an increase in the biogas production by 10% of the maximum potential quantity of farm manure from livestock and poultry. Additionally, the paper calculates the maximum employment effect of a 100% utilization of all available farm manure in Denmark. Alongside Netherlands, France, Ireland, and Italy, Denmark is the country in Europe with the most collectable farm manure from per km2 [17] (p. 925). This makes Denmark a suitable case for evaluating the maximum employment effects from biogas production in the European context.
There is no consensus on the definition of the term bioeconomy. The definition of the Organization for Economic Co-operation and Development (OECD) includes the biotechnology sector [5], which the EU definition does not. On the other hand, the EU definition includes traditional agricultural outputs [3]. This paper uses the definition of bioeconomy put forward by a panel of government-appointed experts in Denmark, The Danish Bioeconomy Panel, that is, “an economy where the fundamental building stones that are used to produce energy, chemicals and materials come from renewable biological resources from plants and animalistic residues” [7] (p. 3). The cornerstone in this definition is the refinery of biomass to produce biofuels (such as biogas and bioethanol) and other products of higher value, e.g., biochemicals and bioplastic [18]. The definition by the Danish Bioeconomy Panel [7] is thus focused on what could be termed “innovative bioeconomy”.
The rest of the paper is organized as follows. Section 2 reviews previous quantitative studies on the employment effects of bioeconomic projects in rural areas. Section 3 contains a brief overview over the size of the Danish biogas production. Section 4 describes the methodology, and Section 5 presents the results. The last section concludes and discusses policy implications.

2. Previous Quantitative Studies

Previous studies on the employment effects of bioeconomic projects are rare and mainly originate from Europe and the US. They all rely on input-output analyses that estimate the total number of direct and indirect jobs that are generated by the given bioeconomic activity.
Three studies involve the Finnish case. Based on a regional input-output model, Okkonen and Lehtonen [19] study the potential local, regional, and national socioeconomic impacts related to the investment and production of a forest biomass-based bio-oil factory in the sub-region Pielinen Karelia in Finland. The authors estimate that the factory will result in 127 permanent jobs locally, between 159 to 214 permanent jobs in the surrounding region (North Karelia), and 200–216 other permanent jobs at the national level. Despite the job gains, the construction of the bio-fuel factory is only estimated to be able to slow down the negative employment growth that has taken place in Pielinen Karelia since 2000. In an earlier paper, also based on a regional input-output model, Lehtonen and Okkonen [20] examine the job-related consequences of carrying out a planned strategy to establish a full-scale biochar factory in the Finnish peripheral municipality of Nurmes. The authors arrive at a total employment effect of 126 to 281 new and permanent jobs in the region. The authors show that the employment effect in the municipality is so significant that it could break the negative job development that has existed in the municipality since 1994. Finally, Lehtonen and Okkonen [21] calculate the potential job creation by building a wooden village in the village Suutela in Finland. It was envisaged that the new houses would be built of wood and be low-energy houses and with a heating system based on wood chips. Using a regional input-output model, the authors calculate the job creation to 250 jobs in the region of North Karelia.
Several studies from the US have calculated the employment effects of the bioethanol production in the country. These studies are all based on input-output analyses that estimate the direct and indirect job effects of the bioethanol plants. The employment creation is estimated very differently in the different studies. This is highlighted by Swenson [22] who investigates the job multipliers in 14 different US studies. The job multiplier is a number showing the relationship between the total job creation (direct and indirect) and the direct job creation on the bioethanol plants. The job multiplier is thus a figure that illustrates the business activity effect of the plants in the surrounding society, cf. the spinoff-effect. Swenson [22] shows a very large variation in the calculated job multipliers, ranging from around 3 to over 50. He points to several methodological flaws in some of most positive studies and notes that stakeholders with vested interests naturally highlight the studies that project to largest employment effects. In his own analysis, Swenson [22] (p. 14) reports a job multiplier of 3.8. A later study by Low and Isserman [23] reaches comparable results. In this study, the job multipliers for four plants in different locations in the US range from 2.8 to 6.4, according to our own calculations based on data in Low and Isserman [23] in their Table 7 (p. 84).
In a related US study, De La Torre Ugarte et al. [24] use input-output analyses to estimate the economic and agricultural effects of expanding the US biofuel production with up to 60 million gallons annually by 2030. This expansion in biofuel production is considered for three scenarios that partly rest on assumptions as to when the 2nd generation cellulose-to-ethanol technology would be able to supplement the traditional 1st generation corn-to-ethanol technology. The study confirms the feasibility of expanding the production to 60 million gallons annually by 2030. The effect of the scenario where the cellulose-to-ethanol technology would become commercially available in 2012 projects 58,000 jobs into the biofuel sector and 238,000 jobs into the agricultural sector. This study thus holds positive prospects in terms of invigorating rural economics through biofuel production.
As for the Danish case, Gylling et al. [25] presented a report with the so-called “+10 million tons plan” with analyses on how to increase the Danish production of biomass in agriculture and forestry by 10 million tons of biomass. The report contains an input-output analysis of the employment consequences in case a Danish biorefinery sector (producing cellulosic ethanol) was established, and the extra biomass was used in this sector. According to the report, if the extra biomass were to be used in a future Danish biorefinery sector, it would generate an extra production value of 14, 25 and 18 billion DKK and an employment of 12,000, 21,000 and 18,000 jobs in three different scenarios [25].
In conclusion, all previous studies foresee some employment growth as a result of bioeconomic projects in rural areas. The size of the employment growth depends on the assumptions put into the study and the object of the study. No previous study has been carried out on the biogas sector. We will now turn to this focus using our biogas case from Denmark.

3. The Danish Case

The production of energy in Denmark by main sources and by main renewables is shown in Figure 1A,B. The production of renewable energy in 2020 was 202 PJ. Total energy production was 1102 PJ. Renewable energy thus constitutes 18% of total Danish production of energy. Since Denmark is now a net importer of energy, the share of renewable energy use is less (12%). Crude oil production peaked in 2004 with 829 PJ, and natural gas production peaked in 2005 with 765 PJ. Since then, fossil production went down to less than half of the production in 2004/2005. Meanwhile, renewable energy production has increased.

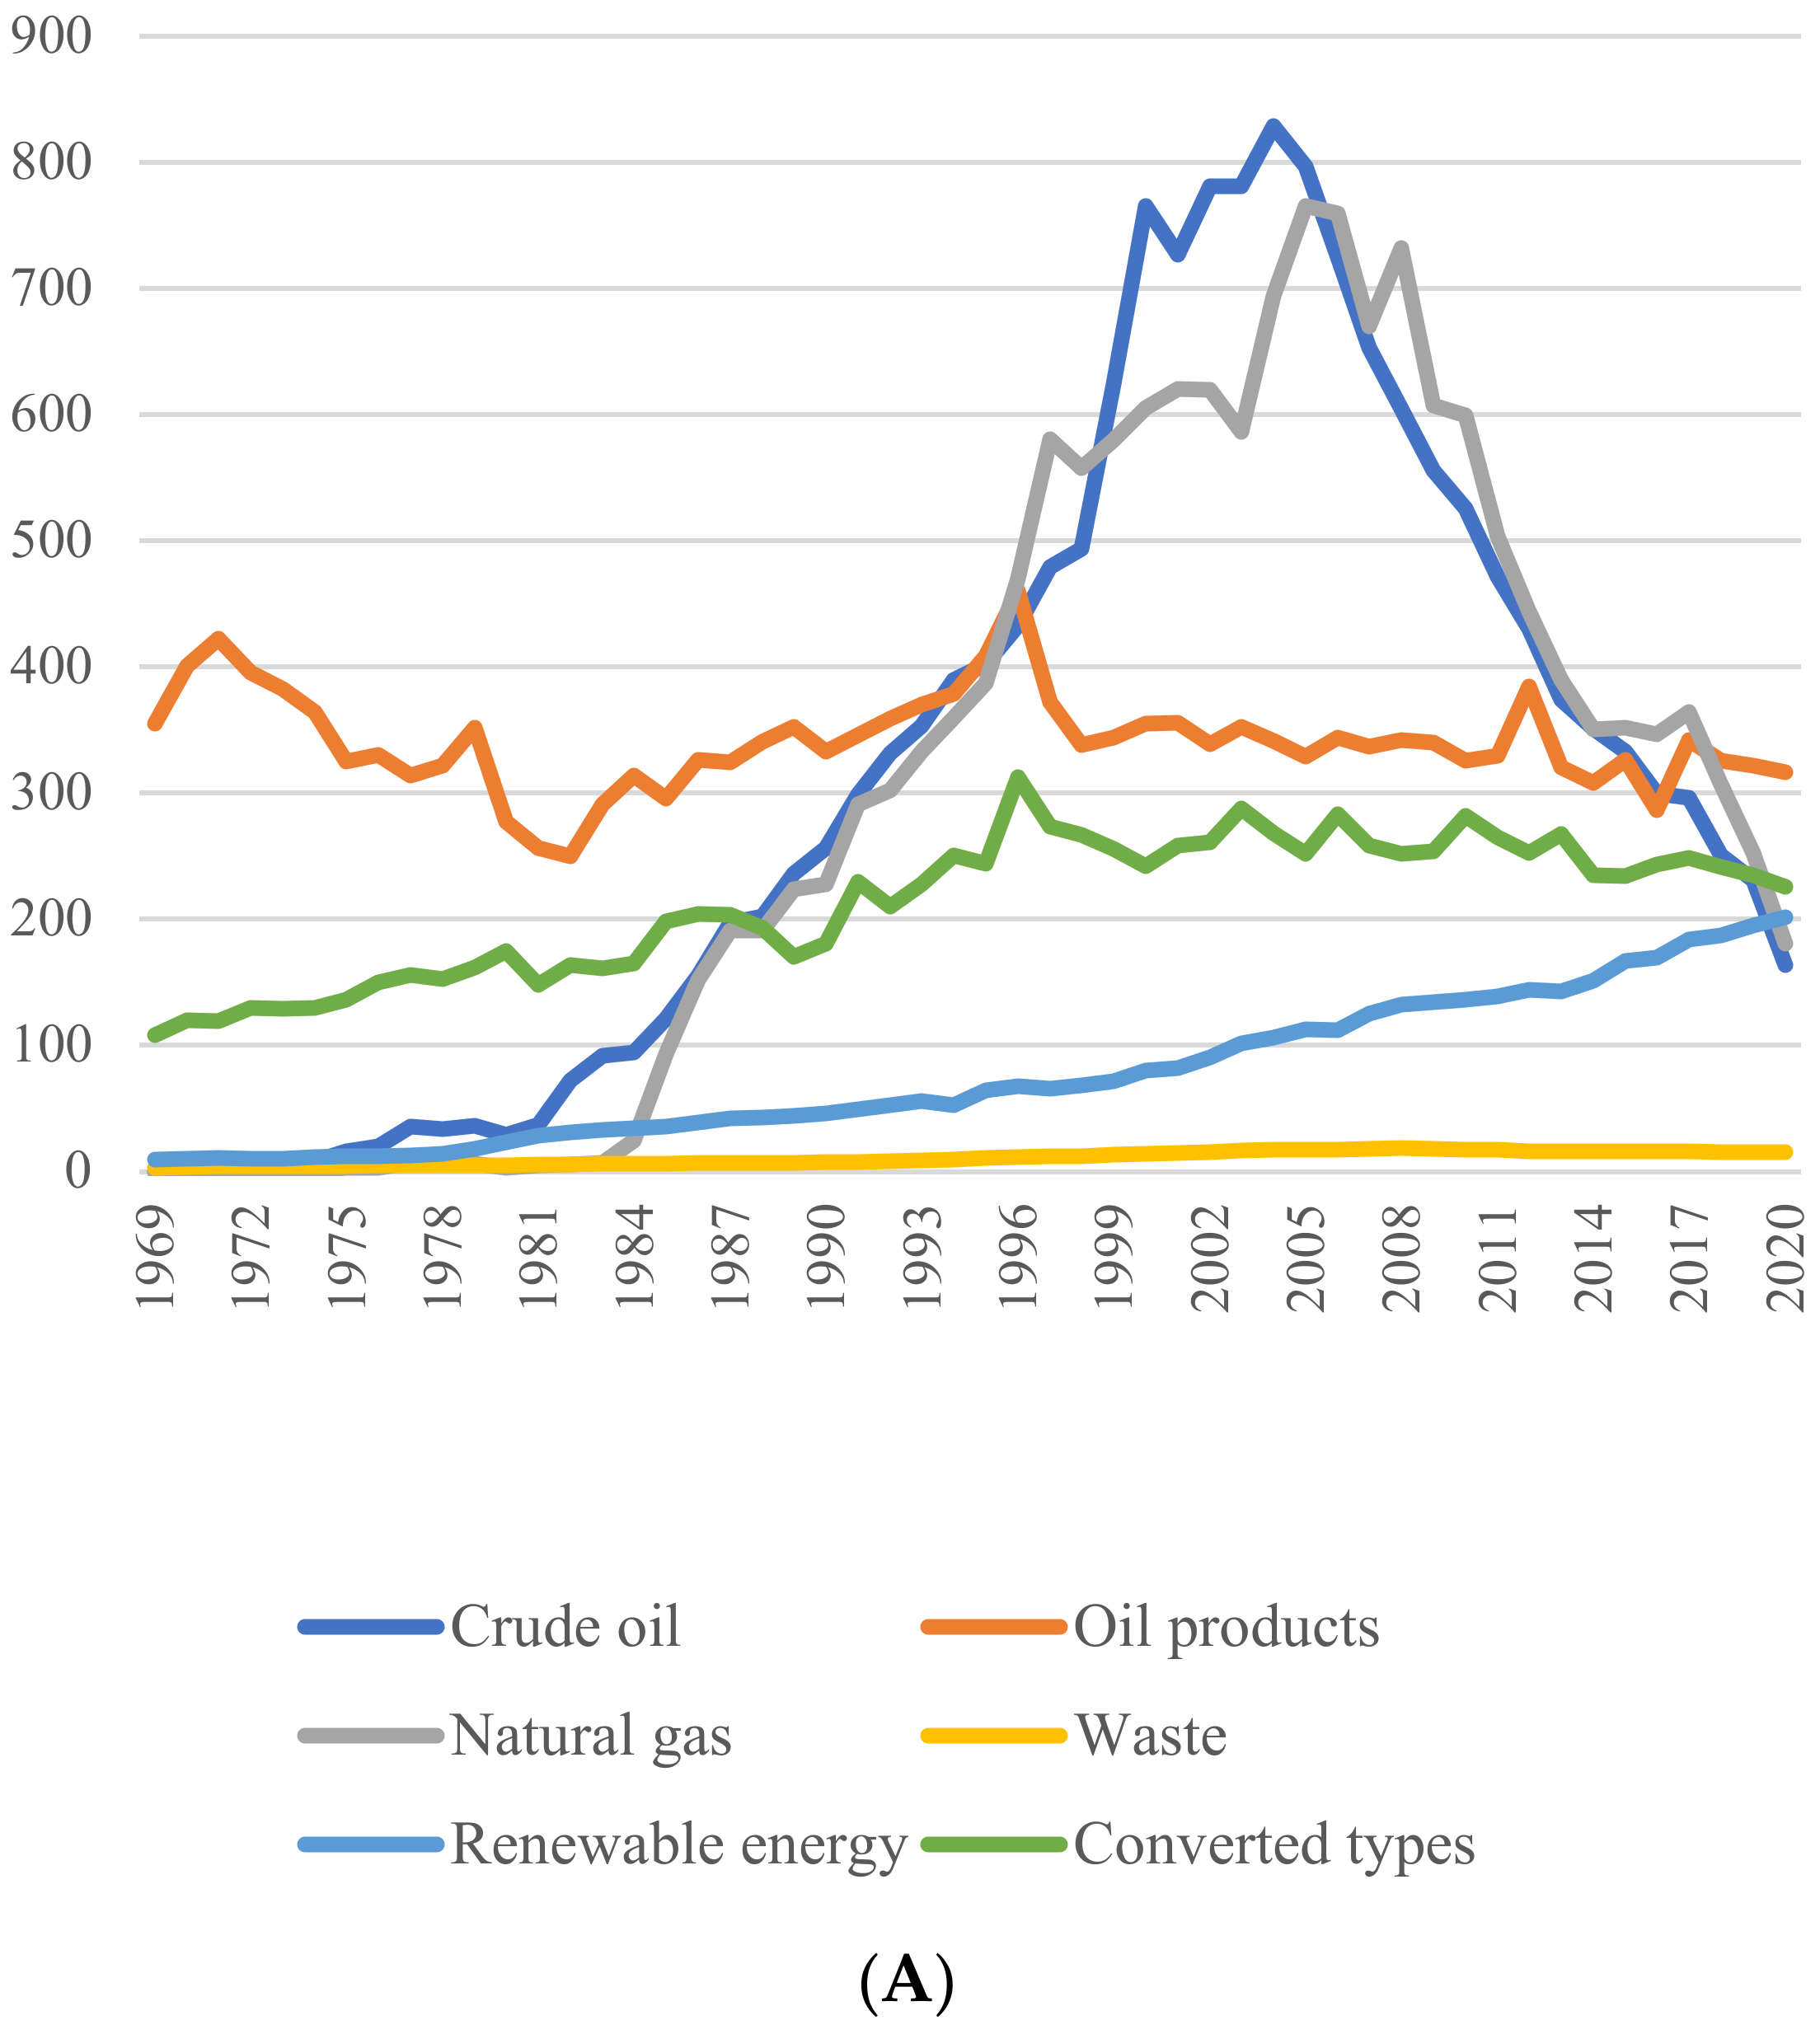
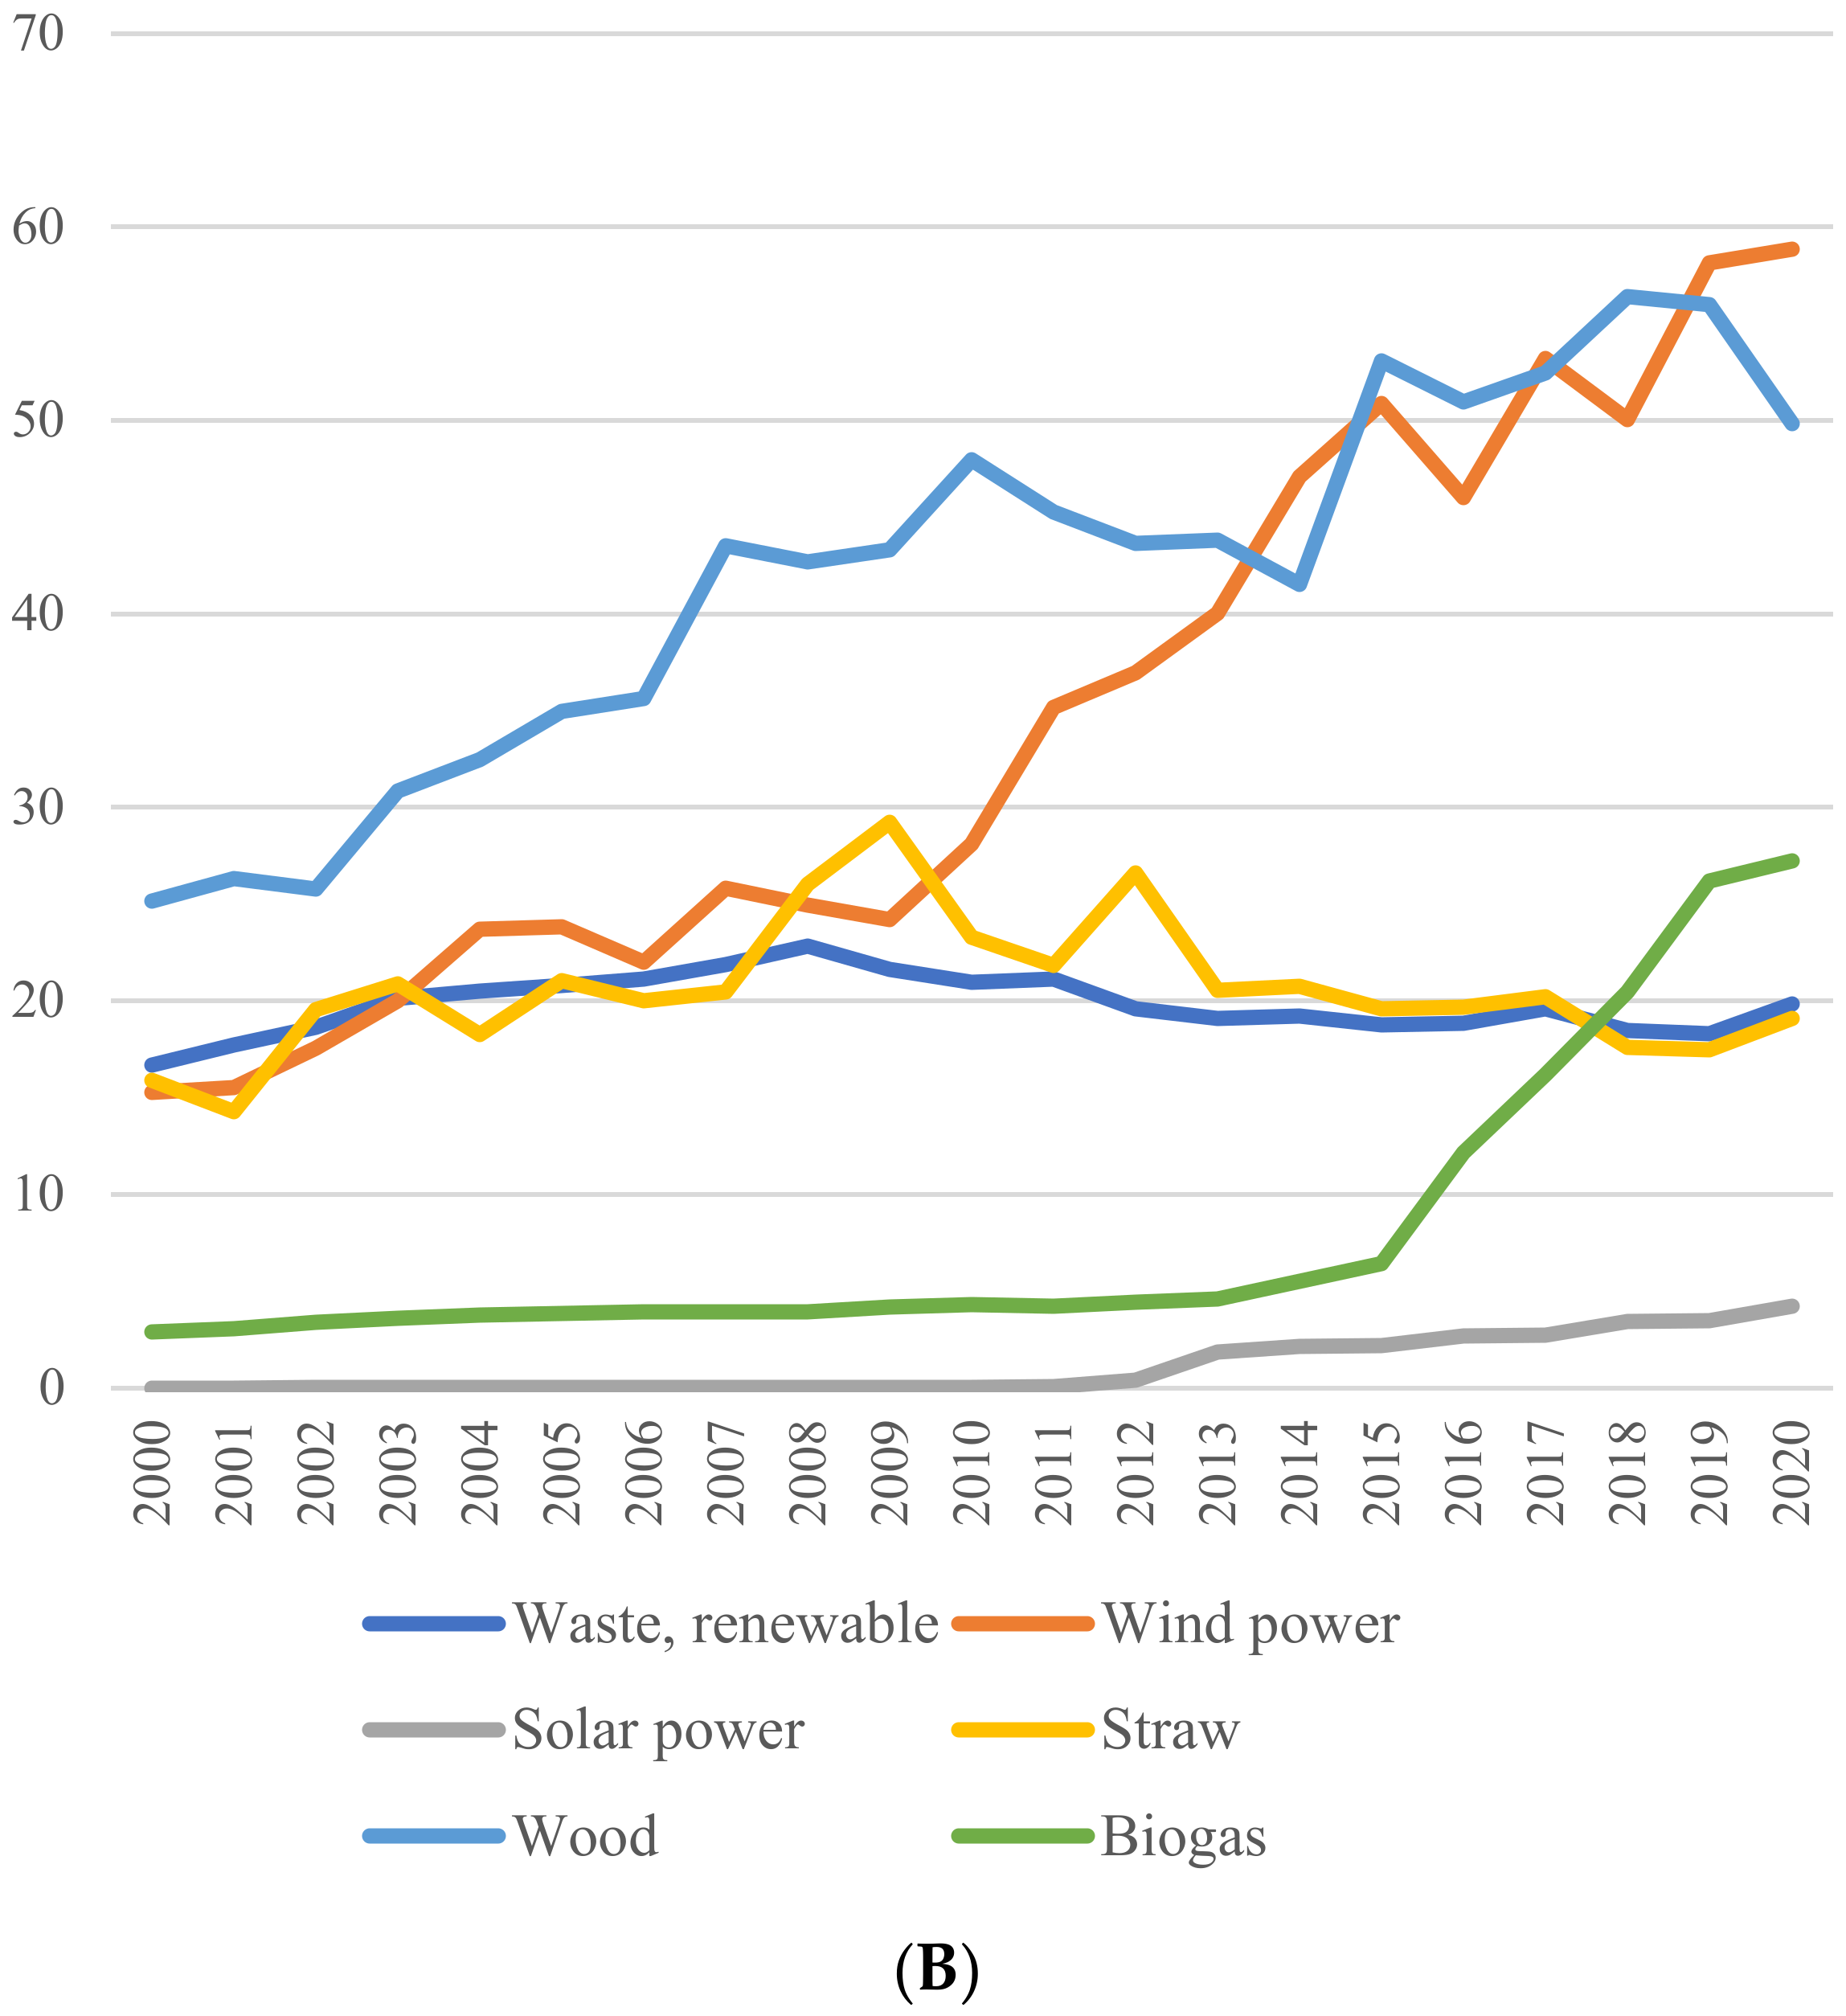
3.1. The Danish Biogas Sector

Since 1975, the production of biogas has increased steadily until 2015, after which it increased rapidly, as can be seen in Figure 1B. In 2020, the production of biogas was 27.3 PJ. According to data from the Danish Energy Agency [26], two-thirds of this biogas was upgraded as bio natural gas (biomethane). Bio natural gas can be fed into the well-established natural gas distribution net. 30% of the bio natural gas was used in the manufacturing industry, and 23% of the bio natural gas was used for heating purposes. One third of the biogas was used without upgrading. 83% of this raw biogas was used in combined heat and power plants, and 10% was used in the manufacturing industries.

3.2. The Demand for Biogas

Obviously, a dramatic increase in renewable energy sources such as biogas is essential as the de-fossilization of the economy is progressing. Since the natural gas network is well established for supplying energy intensive industrial production and for heating in households, there is sufficient demand for potentially increased production of biogas. Especially in the present and future situation where sources for natural gas partly from the North Sea and partly in the European networks are interrupted due to maintenance of one of the main gas production platforms (the Tyra field) in the North Sea and due to the war in Ukraine. Moreover, as natural gas from the North Sea is no longer available in the quantities previously available (see Figure 1A), the distribution network is either idle or must be supplied form other sources among others from upgraded biogas.

4. Methodology

We will now explain the method for estimating the number of jobs that are created in rural areas in Denmark by increasing the production by 10% of the potential raw material available in the form of farm manure from livestock and poultry.
In Denmark, there are different assessments of the availability of farm manure, which is the basis of biogas production. However, the calculations for this paper are based on an estimate for 2020 made by the Danish Business Authority [27] in its report on identifying the optimal locations of new biogas plants in 2020. The report estimated the total availability of farm manure from livestock and poultry in 2020 to be 3.23 million tons dry matter, see Table 1. Of the 3.23 million tons, 91% is judged to be realistically collectable for use in the biomass plants [27] (p. 42). This means that 2.94 million tons manure dry matter is available for biogas production. The assessment of availability of farm manure by the Danish Business Authority corresponded well with the estimates of Scarlat et al. [17] for Denmark. For Denmark, Scarlat et al. [17] (p. 919) estimate a total of 34.3 million produced and a total 29.3 million tons collectable slurry manure. As 1 ton slurry manure roughly equates to 0.1 ton dry matter manure [28], the two estimates are quite comparable. Further, the two estimates on farm manure collectability are also comparable: 91% vs. 85%.
In the calculations, we calculate the effect of an expansion corresponding to 10% of the biomass potential, or approximately 294,000 tons dry matter manure. This can be compared to a utilization percentage of 15% in 2018 [29] (p. 17).

4.1. Starting Point in a Hypothetical, Average Biogas Plant: The Model Biogas Plant

We will base our calculations on the specific configurations of a hypothetical biogas plant. Data for this hypothetical plant, which we will refer to as the Model Biogas Plant, was constructed by Jacobsen et al. [28] who derived the data from investigations into many different biogas plants located in Denmark. The data for the Model Biogas Plant is thus a synthesis of the biogas plants in Denmark, and its production capacity is considered representative for the average biogas plant at present.
To be able to use the data available for the Model Biogas Plant for the chosen expansion of 10% of the expected raw material base, the first step is a scaling of the data for the plant. This is comparable to asking: How many of Model Biogas Plants would require a raw material input that corresponds to 10% of the expected raw material base of 294,000 tons dry matter manure?
As stated in Jacobsen et al. [28] (p. 63), the Model Biogas Plant has a wet matter input of 255,000 tons biomass per year. These 255,000 tons of wet biomass have an average dry matter content of 11.3% [28] (p. 65). 11.3% of 255,000 tons is 28,815 tons dry matter. As shown in Table 2, the dry matter content varies across the biomass types that are used in the Model Biogas Plant, and some of the 255,000 tons wet biomass is not from manure but from corn biomass. The corn part constitutes 10% of the 255,000 tons wet biomass input, which corresponds to 25,500 tons wet corn biomass. The dry matter content in this wet corn biomass is rather high (33%), cf. Table 2, and the dry matter content in the corn biomass therefore amounts to 33% of the 25,500 tons, which equals 8415 tons dry matter of corn biomass. If we deduct this part of the dry matter from the total dry matter that is put into the Model Biogas Plant, i.e., 28,815 tons dry matter, we acquire 20,400 tons dry matter from manure. This means that each Model Biogas Plant treats 20,400 tons dry matter from manure, and that 14.4 Model Biomass Plants may treat 294,000 tons dry matter manure, which is 10% of the total available manure biomass, as mentioned above. In other words, we will calculate the employment effect of operating a capacity corresponding to 14.4 Model Biogas Plants.

4.2. Estimation of the Employment Effects

Calculating the employment effect of operating 14.4 Model Biogas Plants is based on the annual cost structure of the Model Biogas Plant as informed by Jacobsen et al. [28]. The annual costs of operating 14.4 Model Biogas Plants were calculated by scaling up the data for the single Model Biogas Plant. The cost structure of operating 14.4 Model Biogas Plants is presented in Table 3.
On the biogas plant itself, there is a direct employment. The plant in addition requires several materials and services and from the cost structure it was possible to associate the activities on the plant to the sectors delivering these inputs. The indirect impact of the activities on the plant are computed using an input-output model based on a regional input-output table. Input-output tables for the national level are published electronically by Statistics Denmark for 117 industries, and these tables are used to generate our regional input-output model system. The indirect effect is also known as the derived effect and comprises deliveries in several linkages within the value chain of biogas production.
In addition to the direct and indirect effect, the induced effect that arises as the income generated by the direct and indirect effects are spent. This creates further business activity and income. The induced effect is associated with households spending their earnings received, as business activity increases in the rural area. This will take place throughout several linkages within the value chains for consumer products.
We chose to focus on the expected development of biogas plants in the two “statistical provinces” of South Jutland and West Jutland, which we assessed to be representative in terms of industry structure for the areas in which the future development of biogas plants will take place.
We chose to use statistical provinces rather than Danish administrative regions because the 11 statistical provinces are more homogenous than the 5 administrative regions that were constructed with a more heterogenous way containing both rural and urbanized areas, see the statistical provinces in Figure 2. The regions are thus not statistically suited for regional analysis of rural district issues. The statistical provinces constitute a division at the NUTS 3 level, whereas the regions constitute the NUTS 2 level in the EU regional nomenclature.
The input-output table for the national level is aggregated so that numbers for regional employment and Gross Value Added could be used for delimitation of the regional input-output table.
The calculations of the regional input-output coefficients are based on procedures for regional impact assessment using regional multipliers estimated from national input-output data and so-called location quotients as explained by McCann [30]. The method entails that the technical coefficients for domestic deliveries to the other industries and to final demand is divided in a regional coefficient and a coefficient for deliveries from other domestic regions. The coefficient for deliveries from the region itself is based on location quotients. Location quotients show if an industry is well represented in the region compared to the national level. If the industry is equally represented regionally as nationally the location quotient is one. The location quotients may be calculated from industry employment or industry production value statistics. The location quotient shows a regional industry’s share of the total employment in the region compared to the industry’s share of the total employment at the national level. The location quotients are shown in Table 4 for the region used in the biogas analysis, i.e., for the province of South Denmark and the province of West Jutland combined. Figure 3A,B show the employment shares for the two provinces. Figure 3A shows the employment shares for the primary and secondary industries in the two provinces selected for the analysis and at the national level. Similarly, the employment shares for the tertiary industries are shown in Figure 3B. As shown in Figure 3A, primary and secondary industries hold a higher share of total employment in the two provinces compared to the nation. On the other hand, as shown in Figure 3B, the tertiary industries are underrepresented in the two provinces when measured by employment shares.
In addition to the location quotients, so-called cross industry quotients are used. For each combination of receiving and supplying industry, these show the comparison of the supplying sectors’ share in the regional economy with the demanding sectors’ position in the region. If the receiving sector is rather large and the supplying sector is small, a larger share of the intermediate products and services must originate in other regions. The input coefficients are adjusted in accordance.
Next, in terms of the model technique, the primary industries “agriculture, forestry, fishery, and extraction” are exogenized so that production in these three sectors are exogenously determined since the production in these sectors are heavily regulated and therefore cannot be expected to expand production when demand increases. This correction is often made to avoid unrealistic effects in the primary sectors in the short run, cf. Petersan [31] for a calculation of regional impacts of an agriculture industry project in Nebraska. If relevant, this condition could be altered to make calculations in which the primary sectors are demand-driven as well. It was not chosen to do so here.
After having adjusted the input coefficients for regional input using the location quotients and the cross-industry quotients to take into consideration that the regional effect of the extra demand is less due to leakage of demand to other regions and abroad, the input coefficients for regional input emerge. According to conventional methods, the regional Leontief matrix is computed [32]. When this matrix is multiplied by the activities of the biogas plants distributed on the relevant specification of industries, you acquire the effect of the biogas plants on the production value distributed on industries. After this, the effect on different measures can be calculated by multiplying the coefficients inputs in each industry by the change in the production value.
If the regional Leontief matrix is concatenated by a row for regional income and a column for input coefficients in regional consumption you may by this extended Leontief matrix, L’, calculate the total effect of the plant including the induced effect. The induced effect results from a deduction of the total effect and the calculation of the direct and indirect effect:
L = L υ c υ i υ
The total dispersion effect is similar to the Keynesian multiplier which in its simplest form is 1/(1-c), where c is the marginal propensity to consume. In a regional context, it can be relevant to expand this to 1/(1-abc) where a is marginal propensity to consume, b is the share of consumption directed toward local produce and c is the share of local industry input purchases from local sources. It is mainly these three factors that determine the local impact of local activities. In the input-output model, this is taken care of for each industry.
When numbers for the biogas plants’ activities are obtained, the demand on other industries are calculated representing what can be expected to be realized in the region. By this, it has been taken into consideration that not all can be supplied from the region itself. If a region is very small, you would expect less to be supplied from the region and more to be supplied from other regions. The smaller the region, the more will be expected to be supplied from other regions a priory. However, it depends on the industry structure if the region can supply the necessary inputs. This is what is taken care of by the regionalized input-output model. In some regions with a long history for cooperation among industries in networks, the necessary capacity in intermediate input industries may be available. In other regions, it may not be the case, especially for new industries and new energy related industries are also often rather capital intensive. In capital intensive industries, the employment effect is lower after the initial building period. Few local people will be needed to run a large capital-intensive biogas plant; thus, the regional employment effect of everyday activity is small compared to the production value.
By analyzing the connection between the direct effects and the indirect effects, one can cast light on the scale of the derived impacts in different industries. This shows that in some industries, particularly traditional industries, there are strong multiplier effects apparently because they have developed over many years with strong mutual ties. In other industries, there is a strong employment effect, independent of materials. Since materials often have a large content of imports, this may reduce the multiplier effect. A large share of associated home market activities may also result in a larger impact and multiplier effect. This has been demonstrated for slaughter plants, dairies, sugar industry, tobacco, refineries, fertilizers, pharmaceuticals, recycling, gas production and distribution, housing, real estate, private research and development, and PR services.

5. Results

Table 5 shows the total effects for employment and income of an expansion of the biogas production in South Jutland and West Jutland by 10% of the potential raw material basis in the form of farm manure from livestock and poultry.
A biogas capacity that gives opportunity to utilize 10% of the available biomass resource will according to this calculation create 342 permanent jobs, an extra annual income of 20.8 million euros, and an annual tax revenue of 6.3 million euros. In total, there are a few more jobs created outside the plants than at the plants. The job multiplier can be calculated to be 2.04 (342/168). The induced impact is relatively small and is generated when the extra income is spent on consumption goods in the households. The job multiplier of 2.04 is comparable to the job multipliers found by other researchers in studies on the impacts of bioethanol and wood-based bioeconomy [20,22,23,25].
In addition to the permanent jobs, temporary jobs will be created in connecting with the construction of the new biogas plants. The increase in temporary jobs will amount to 294 person-years in case of a 10% expansion. These temporary jobs will be created in various industries via direct, indirect, and induced impacts, see Table A1 in the Appendix A.
Since we study the long-run employment impacts of bio-economic projects in rural areas, the permanent jobs are the most interesting. Table 6 shows the permanent jobs by industry. As can be seen in Table 6, several industries achieve employment gains from the biogas expansion. As for the direct impact, 168 jobs will be created at the biogas plants in the gas industry. As for sectors delivering inputs to the biogas plants, the motor vehicle repair industry and the building maintenance and repair industry acquire the largest shares of the new jobs. Finally, multiplier effects spread throughout the rest of the economy as is visible in the creation of jobs in the sales and service sectors, mainly retail sales, wholesale, sale of motor vehicles and restaurants.

5.1. The Total Employment Potential of Biogas Production in Denmark

It is possible to assess the employment potential if larger shares than 10% of the available farm manure is used for biogas production.
In 2018, the biomass utilization percentage was 15% [29], which suggest that 513 jobs were linked to the biogas production. If a utilization percentage of 50% is reached, the employment would increase to 1710 jobs. Finally, the total employment potential of biogas production in Denmark in case of 100% utilization, the total employment effect would be 3420 jobs as the absolute upper limit.
The previously mentioned ”+10 million tons plan” by Gylling et al. [25] estimated that a utilization of 10 million tons biomass in a Danish biorefinery sector would potentially create between 1200 and 21,000 jobs. The raw material basis in the present study has a physical limit on 2.94 million tons. If this limit is used, the maximum job creation with the data from Gylling et al. [25] can be calculated to somewhere between 3528 and 6174 jobs.
The present study suggests a maximum of 3420 jobs, which is a bit below the number based on the lowest estimate by Gylling et al. [25]. This deviation is partially caused by the regional perspective of the present study. The comparison, however, suggests that the employment impacts per unit biomass input are similar for biogas production and cellulosic ethanol production.

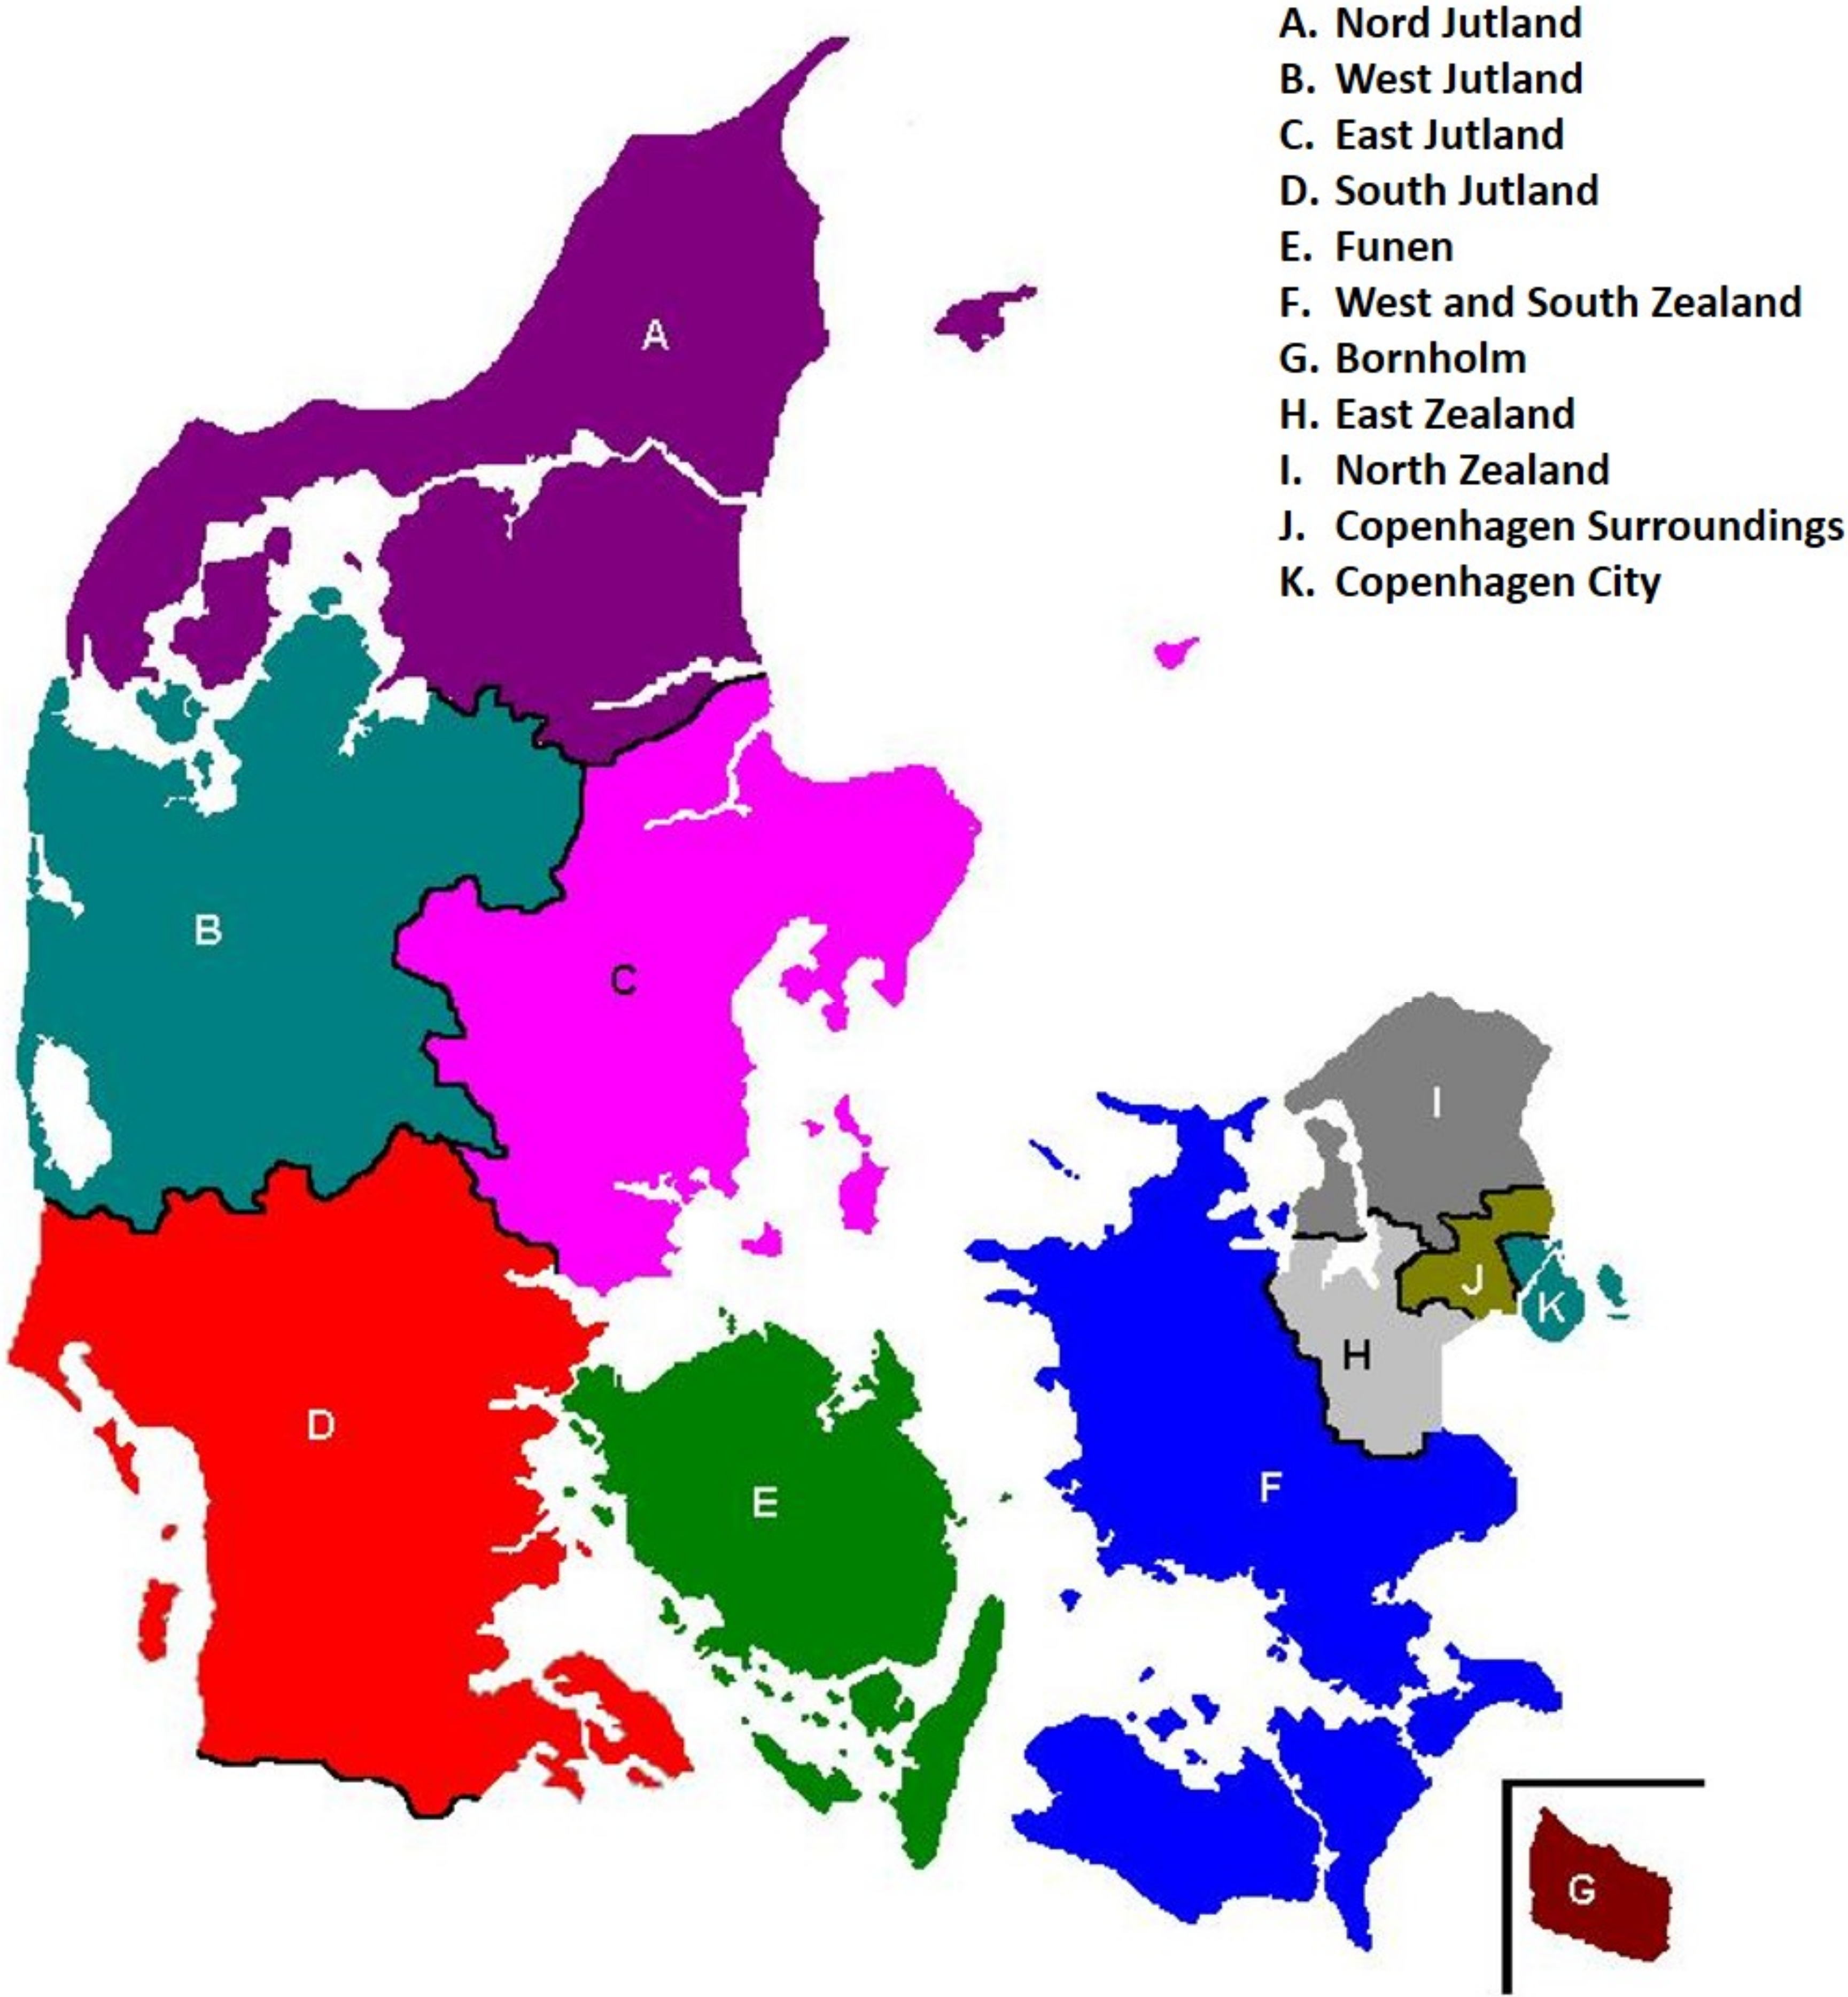
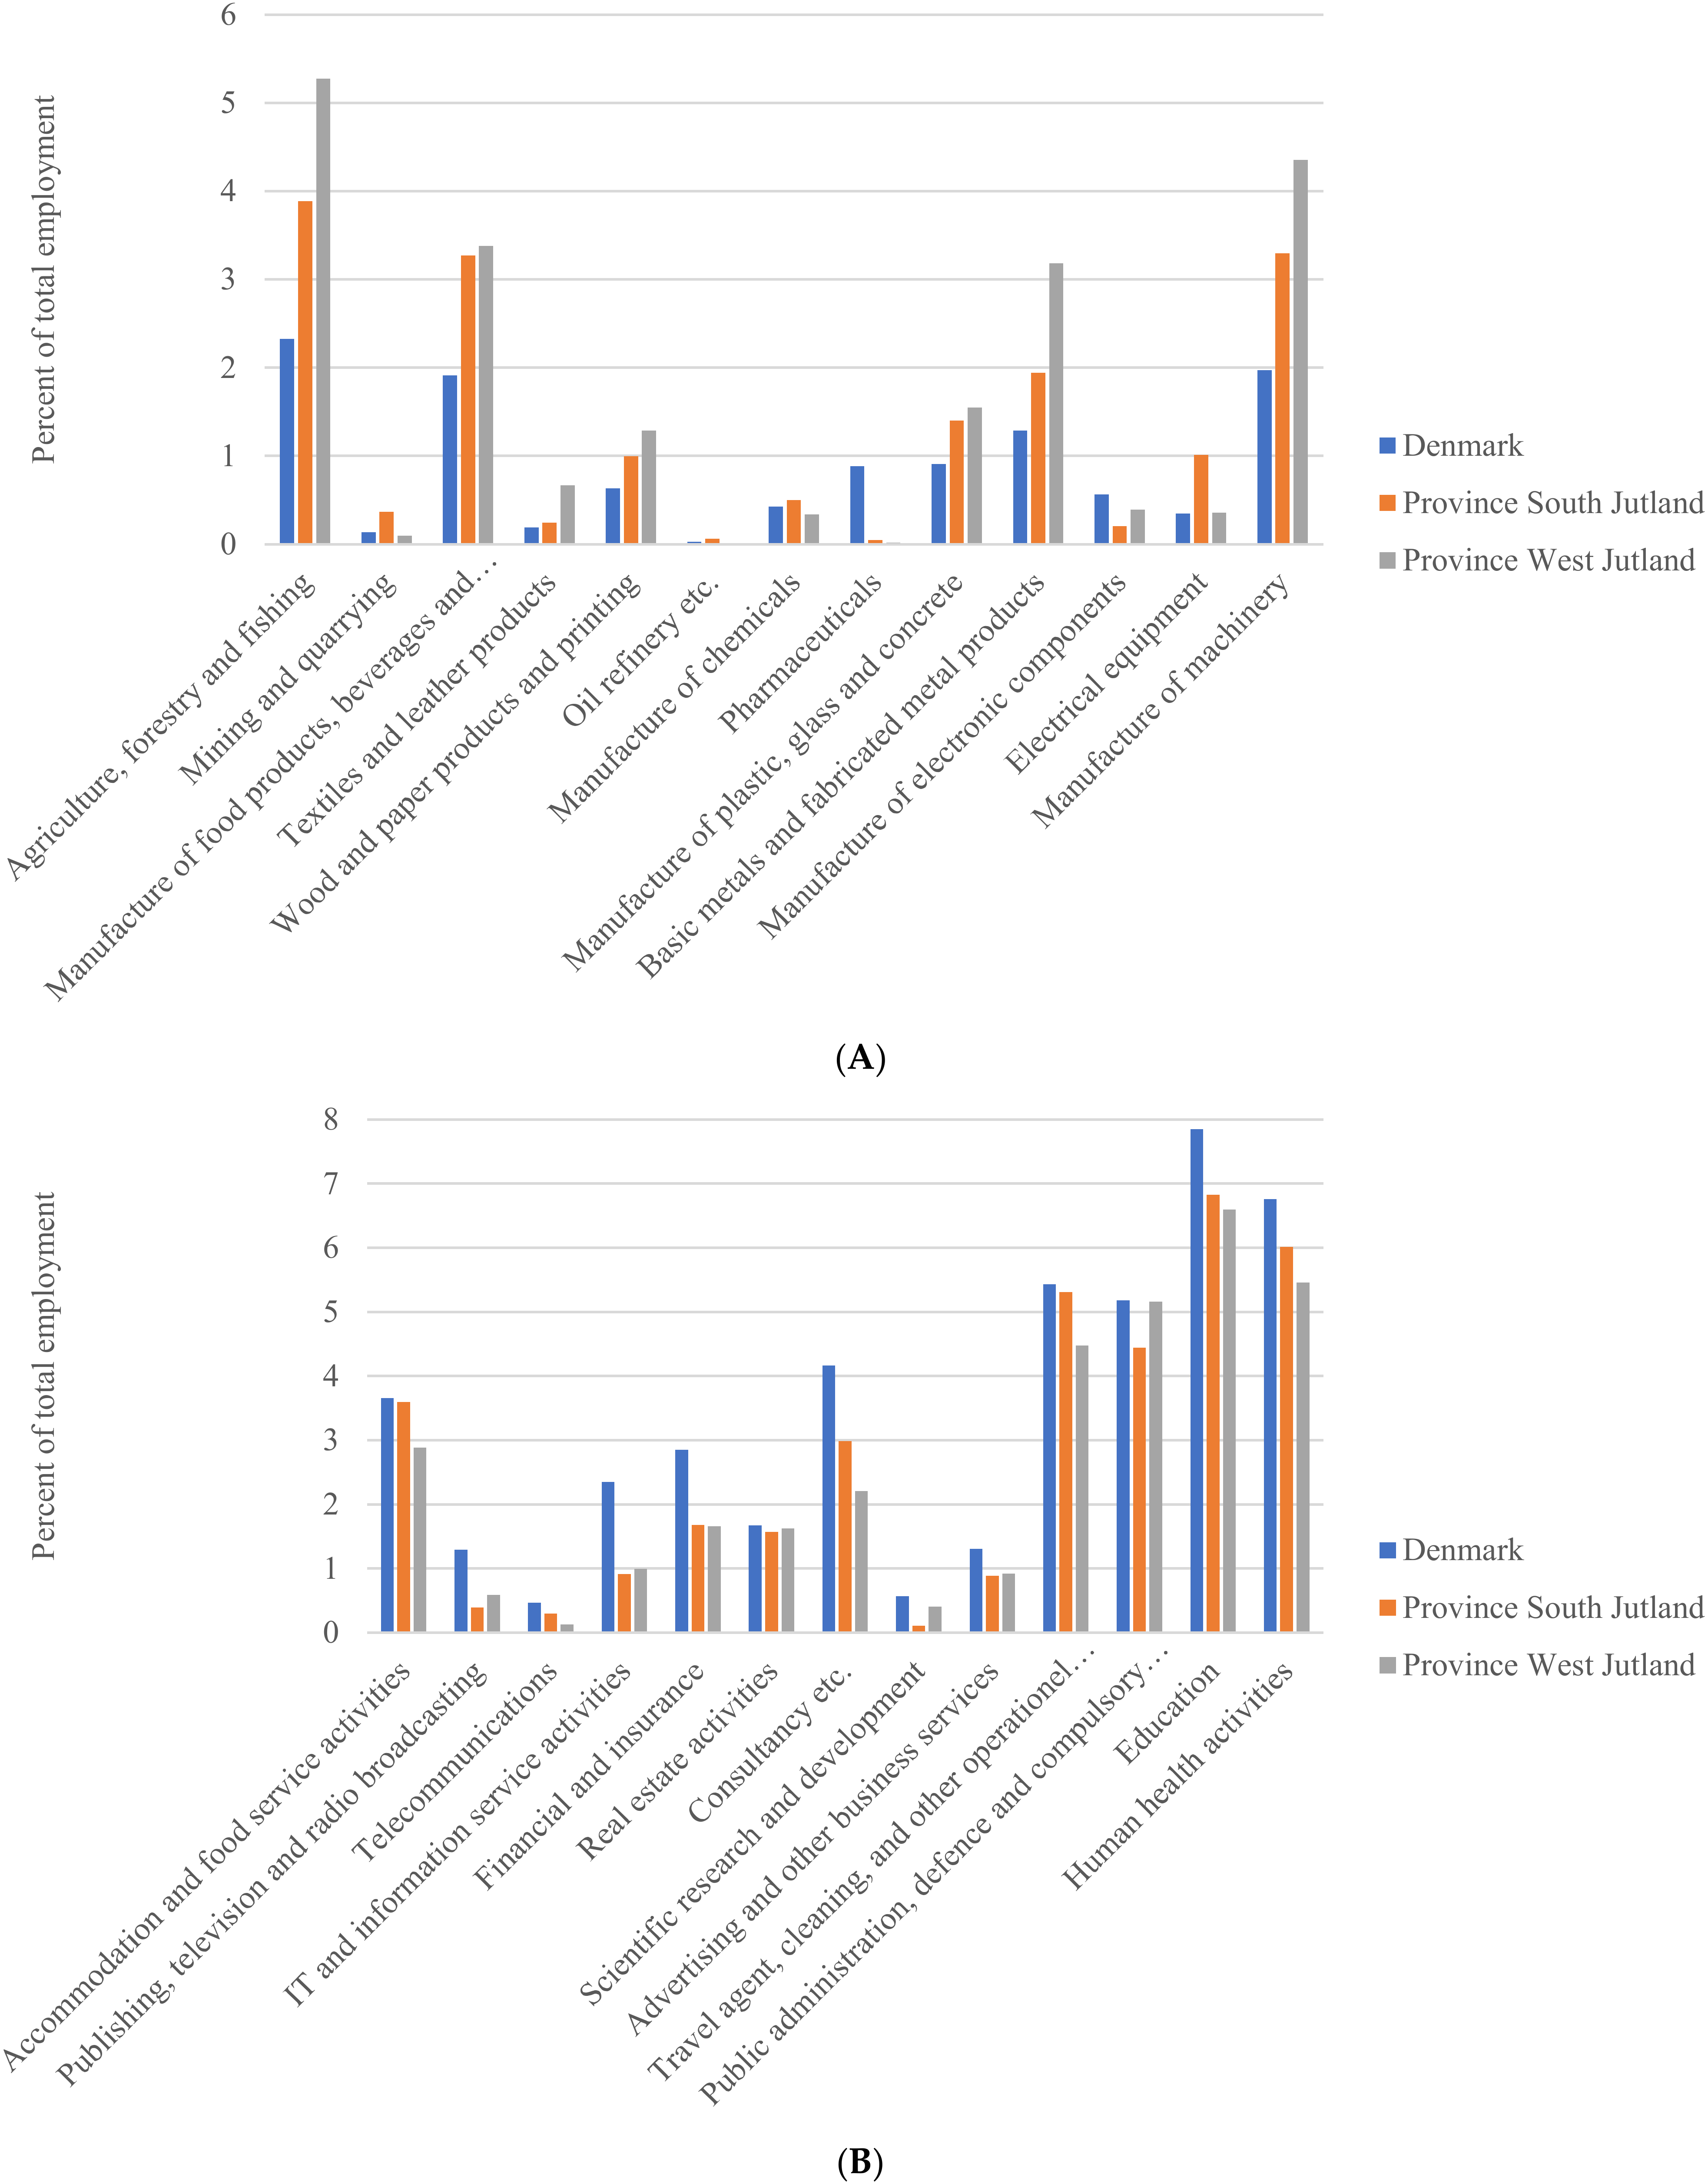
5.2. Assessing the Employment Impact in the Danish Rural Development Context

Bioenergy projects are often envisioned to have a considerable development potential in challenged rural areas. However, how substantial is the calculated employment effect of biogas production in comparison to the overall employment decline in rural areas in Denmark in recent years? In the last decade, rural areas in Denmark have in fact seen significant declines in employment numbers. For example, during the period from 2008 to 2020, the number of employed people in the provinces of South Jutland and West Jutland declined by 13,132 and 12,138, respectively. During the same period, the number of employed people increased by 61,230 in Denmark as a whole, according to own calculations based on publicly available data from Statistics Denmark found at: www.statbank.dk/RAS302, accessed on 8 May 2022.
Moreover, in the 16 Danish municipalities that are defined as the most peripheral municipalities in Denmark, the number of employed people declined by 32,416 (12.7%) from 1994 to 2020, according to own calculations based on data from Statistics Denmark (custom run and publicly available online: www.statbank.dk/RAS302, accessed on 8 May 2022). Denmark has a total of 98 municipalities. During the same period, the number of employed people increased by 288,948 (11.0%) in Denmark as a whole. When compared to the mentioned employment declines, the calculated total employment effect of 3420 jobs is somewhat modest.
For illustrative purposes, to further assess the magnitude of the employment impact from a 100% biogas production expansion, we made two forecasts of the total employment in the 16 peripheral municipalities: one assuming no biogas expansion, and another assuming that the full biogas expansion is carried out in the peripheral municipalities, see Figure 4. Under the used assumptions (see table note), the maximum employment impact from a 100% utilization of the biomass potential would be reached in 2027. Again, the forecast reveals an employment impact from a biogas expansion that is quite sizable but still somewhat modest compared to the significant employment declines in rural Denmark in recent years. Figure 4 shows that the biogas expansion will have a quite sizable employment impact, but at the same time, that it is far from large enough to turn around the downward trend in the employment numbers in the peripheral municipalities.
Meanwhile, one should not forget that biogas production is not the only activity in the bioeconomy. Moreover, the calculations in this paper relied on the input of farm manure and corn biomass only. According to the Danish Business Authority [27], 3.7 million tons are also available for biogas production from straw and grass. This extra potential input into biogas production was held out of the calculations, and the available straw and grass can be used for other bioeconomic purposes, e.g., bioethanol production.

6. Conclusions and Policy Implications

In the recent decade, both policy makers [3,4,5,6] and researchers [9,10,11,12,13,16] have expressed much—and sometimes huge—optimism about the potentials of the bioeconomy in terms of economic growth and job creation in rural areas in developed countries. However, there are not many quantitative studies on the rural employment potential in the bioeconomy. On this background, to fill some of the gap, this paper presented a regional input-output analysis of the potential employment effects of expanding the biogas production in Denmark. Denmark is a suitable country for evaluating the maximum employment effects from biogas production in the European context, as Denmark is one of the counties with most farm manure per km2 in Europe [17].
Based on the used assessment by the Danish Business Authority [27] of the availability of farm manure from livestock and poultry in 2020, the main calculation showed that an increase in biogas production by 10% of the available farm manure would result in the creation of approximately 342 permanent jobs. The 342 jobs are distributed on 168 employed in the biogas plants directly, 94 in jobs in derived activities and 80 jobs due to spending in households who experience an increase in income due to the extra activity.
Accordingly, the maximum employment impact reached by a 100% utilization of available biomass from farm manure was estimated to be 3420 jobs. This total employment potential of biogas production is sizable, but still somewhat modest in comparison to the significant declines in employment that has taken place in rural Denmark in recent years. Since Denmark has one of the largest farm manure potentials per km2 in Europe, the possible job gains for increasing biogas production in other European countries could also be expected to be modest in relation to the rural employment declines in these countries. Meanwhile, importantly, biogas is only one element in the bioeconomy, and in our biogas case, only farm manure was used as raw material, leaving other biomass materials (e.g., grass and straw) to be used in other present and future bioeconomic activities, such as bioethanol production, bioplastic, and biomaterials. The recommendation of this paper is therefore to continue having a political focus on developing bioeconomic projects in rural areas.
As our study and previous studies only analyze the effects of one specific bioeconomic activity, it would be interesting to see future studies analyzing the effects of several bioeconomic projects being implemented at the same time. Moreover, it would be valuable if future studies would integrate negative externalities in their models, such as increased odor emission, noise, and visual pollution, see, e.g., Zemo et al. [33] and Lee et al. [34], in the analyses. Another angle could be to discuss the bioeconomy in rural areas from a theoretical perspective by drawing on such concepts as degrowth and the social and solidarity economy. Certainly, as most biogas plants in Denmark are organized in the tradition of the Danish cooperative movement, the Danish biogas sector resembles a social economy that is naturally local and where the members have a say in the decision-making process [35] (p. 61).

Author Contributions

Conceptualization, J.F.L.S. and H.P.J.; methodology, J.F.L.S. and H.P.J.; formal analysis, H.P.J.; investigation, J.F.L.S. and H.P.J.; resources, J.F.L.S. and H.P.J.; writing—original draft preparation, J.F.L.S. and H.P.J.; writing—review and editing, J.F.L.S.; visualization, J.F.L.S. and H.P.J.; supervision, J.F.L.S. All authors have read and agreed to the published version of the manuscript.

Funding

Funding for the practical implementation of the research described in this paper was obtained from the Danish Ministry of Industry, Business and Financial Affairs in 2015.

Institutional Review Board Statement

Not applicable.

Informed Consent Statement

Not applicable.

Data Availability Statement

Publicly available input-output tables from Statistics Denmark were used in this study. This data can be found here: https://statbank.dk/10160 (accessed on 5 May 2022).

Conflicts of Interest

The authors declare no conflict of interest.

Appendix A

Table A1. Temporary employment impacts in investment and construction phase by industry based on the expansion of common biogas plants by 10% of the available biomass resource (employment measured in person-years).
IndustriesDirect Impact at Biogas PlantsInput for Plants, Direct and Indirect ImpactsInduced Impact via Consumption
Manufacture of wood and wood products 22
Manufacture of concrete and bricks 33
Manufacture of fabricated metal products 46
Manufacture of engines, windmills and pumps 11
Construction of new buildings85
Professional repair and maintenance of buildings3214
Sale of motor vehicles 2
Repair and maintenance of motor vehicles etc. 12
Wholesale 510
Retail sale 120
Transport by suburban trains, buses and taxi operation, etc. 2
Freight transport by road and via pipeline 12
Support activities for transportation 1
Postal and courier activities 1
Hotels and similar accommodation 1
Restaurants 8
Monetary intermediation 13
Buying and selling of real estate9
Renting of non-residential buildings 1
Renting of residential buildings 2
Legal activities2 1
Accounting and bookkeeping activities 11
Business consultancy activities 12
Architectural and engineering activities 89
Other technical business services 11
Employment activities 11
Services to buildings, cleaning and landscape activities 13
Other business service activities 1
Medical and dental practice activities 2
Social work activities without accommodation 4
Activities of membership organizations 1
Other personal service activities 2
Other industries with impact less than 1.0 person-year 826
Total12841125

References

  1. Eurostat. Eurostat Regional Yearbook, 2018th ed.; Eurostat: Luxembourg, 2018. [Google Scholar]
  2. United Nations. World Urbanization Prospects, 2018th ed.; United Nations, Department of Economic and Social Affairs, Population Division: New York, NY, USA, 2019. [Google Scholar]
  3. European Commission. Innovating for Sustainable Growth: A Bioeconomy for Europe; European Commission: Brussels, Belgium, 2012. [Google Scholar]
  4. European Commission. A Sustainable Bioeconomy for Europe: Strengthening the Connection between Economy, Society and the Environment; European Commission: Brussels, Belgium, 2018. [Google Scholar]
  5. Organization for Economic Co-operation and Development (OECD). The Bioeconomy to 2030 Designing a Policy Agenda Main Findings and Policy Conclusions; International Futures Project; OECD: Paris, France, 2009. [Google Scholar]
  6. Organization for Economic Co-operation and Development (OECD). Meeting Policy Challenges for a Sustainable Bioeconomy; International Futures Project; OECD: Paris, France, 2018. [Google Scholar]
  7. Danish Bioeconomy Panel (Det Nationale Bioøkonomipanel). Danmark Som vækstcenter for en Bæredygtig Bioøkonomi. Udtalelse fra Det Nationale Bioøkonomipanel [Denmark as Growth Center for Sustainable Bioeconomy. Statement from the National Bioeconomy Panel]. 2014. Available online: www.naturerhverv.dk/tvaergaaende/biooekonomi (accessed on 11 November 2015).
  8. Nordic Committee for Agricultural and Food Research. The Nordic Bioeconomy Initiative 2013–2018. 2013. Available online: http://nkj.nordforsk.org/ (accessed on 6 April 2015).
  9. Van Dam, J.E.G.; de Klerk-Engels, B.; Struik, P.C.; Rabbinge, R. Securing renewable resource supplies for changing market demands in a bio-based economy. Ind. Crops Prod. 2005, 21, 129–144. [Google Scholar] [CrossRef]
  10. Johnson, T.G.; Altman, I. Rural development opportunities in the bioeconomy. Biomass Bioenergy 2014, 63, 341–344. [Google Scholar] [CrossRef]
  11. Langeveld, J.W.A.; Dixon, J.; Jaworski, J.F. Development perspectives of the biobased economy: A review. Crop Sci. 2010, 50, 142–151. [Google Scholar] [CrossRef]
  12. Bramsiepe, C.; Sievers, S.; Seifert, T.; Stefanidis, G.D.; Vlachos, D.G.; Schnitzer, H.; Schembecker, G. Low-cost small-scale processing technologies for production applications in various environments. Mass produced factories. Chem. Eng. Process. Process Intensif. 2012, 51, 32–52. [Google Scholar] [CrossRef]
  13. Bruins, M.E.; Sanders, J.P.M. Small-scale processing of biomass for biorefinery. Biofuels Bioprod. Biorefin. 2012, 6, 135–145. [Google Scholar] [CrossRef]
  14. Pfau, S.F.; Hagens, J.E.; Dankbaar, B.; Smits, A.J.M. Visions of sustainability in bioeconomy research. Sustainability 2014, 6, 1222–1249. [Google Scholar] [CrossRef]
  15. Bugge, M.M.; Hansen, T.; Klitkou, A. What is the bioeconomy? A review of the literature. Sustainability 2016, 8, 691. [Google Scholar] [CrossRef]
  16. Teräs, J.; Lindberg, G.; Johnsen, I.H.G.; Perjo, L.; Giacometti, A. Bioeconomy in the Nordic region: Regional Case Studies; NORDREGIO working paper 2014:4; Nordic Centre for Special Development: Stockholm, Sweden, 2014. [Google Scholar]
  17. Scarlat, N.; Fahl, F.; Dallemand, J.-F.; Monforti, F.; Motola, V. A spatial analysis of biogas potential from manure in Europe. Renew. Sustain. Energy Rev. 2018, 94, 915–930. [Google Scholar] [CrossRef]
  18. Sørensen, J.F.L. Bioøkonomiens Betydning for Landdistrikterne. En Litteraturgennemgang og Sektorbeskrivelse [The Importance of the Bioeconomy for the Rural Districts. A Literature Review and Sector Description]; CLF Report 51/2016; University of Southern Denmark, Centre for Rural Research: Esbjerg, Denmark, 2016. [Google Scholar]
  19. Okkonen, L.; Lehtonen, O. Local, regional and national level of the socioeconomic impacts of a bio-oil production system—A case in Lieksa, Finland. Renew. Sustain. Energy Rev. 2017, 71, 103–111. [Google Scholar] [CrossRef]
  20. Lehtonen, O.; Okkonen, L. Socio-economic impacts of a local bioenergy-based development strategy. The case of Pielinen Karelia, Finland. Renew. Energy 2016, 85, 610–619. [Google Scholar] [CrossRef]
  21. Lehtonen, O.; Okkonen, L. Regional socio-economic impacts of decentralised bioeconomy: A case of Suutela wooden village, Finland. Environ. Dev. Sustain. 2013, 15, 245–256. [Google Scholar] [CrossRef]
  22. Swenson, D. Input-Outrageous: The Economic Impacts of Modern Biofuel Production; Iowa State University, Department of Economics: Ames, IA, USA, 2006. [Google Scholar]
  23. Low, S.A.; Isserman, A.M. Ethanol and the local economy. Industry trends, location factors, economic impacts, and risks. Econ. Dev. Q. 2009, 23, 71–88. [Google Scholar] [CrossRef]
  24. De la Torre Ugarte, D.G.; English, B.C.; Jensen, K. Sixty billion gallons: Economic and agricultural impacts of ethanol and biodiesel expansion. Am. J. Agric. Econ. 2007, 85, 1290–1295. [Google Scholar] [CrossRef]
  25. Gylling, M.; Jørgensen, U.; Bentsen, N.S.; Kristensen, I.T.; Dalgaard, T.; Felby, C.; Kvist, V. + 10 Mio. Tons Planen. Muligheder for En øget Produktion af Bæredygtig Biomasse Til Bioraffinaderier [The + 10 Million Tons Plan. Possibilities for an Increased Production of Sustainable Biomass for Use in Biorefineries]; Copenhagen University: Copenhagen, Denmark, 2012. [Google Scholar]
  26. Danish Energy Agency. Månedlig og Årlig Energistatistik [Monthly and Yearly Energy Statistics]. 2022. Available online: https://ens.dk/service/statistik-data-noegletal-og-kort (accessed on 8 May 2022).
  27. Danish Business Authority (Erhvervsstyrelsen). Kortlægning af Hensigtsmæssig Lokalisering af Nye Biogasanlæg i Danmark [Mapping of Optimal Localization of New Biogas Facilities in Denmark]; SEGES and AgroTech for The Biogas Travel Team, Danish Business Authority: Copenhagen, Denmark, 2015. [Google Scholar]
  28. Jacobsen, B.H.; Laugesen, F.M.; Dubgaard, A.; Bojesen, M. Biogasproduktion i Danmark. Vurderinger af Drifts- og samfundsøkonomi [Biogas Production in Denmark. Assessments of Private and Social Economics]; Copenhagen University, Department of Food and Resource Economics: Copenhagen, Denmark, 2013. [Google Scholar]
  29. Danish Energy Agency (Energistyrelsen). Perspektiver for Produktion og Anvendelse af Biogas i Danmark [Perspectives for Production and Use of Biogas in Denmark]; Danish Energy Agency: Copenhagen, Denmark, 2018. [Google Scholar]
  30. McCann, P. Urban and Regional Economics; Chapter 4; Oxford University Press: New York, NY, USA, 2006. [Google Scholar]
  31. Petersan, D.N. Estimated Economic Effects for the Nordic Biofuels Ethanol Plant in Ravenna, Nebraska; Economic Development Department, Nebraska Public Power District: Columbus, NE, USA, 2002. [Google Scholar]
  32. Leontief, W. Input-Output Economics; Oxford University Press: New York, NY, USA, 1966. [Google Scholar]
  33. Zemo, K.H.; Panduro, T.E.; Termansen, M. Impact of biogas plants on rural residential property values and implications for local acceptance. Energy Policy 2019, 129, 1121–1131. [Google Scholar] [CrossRef]
  34. Lee, G.-E.; Loveridge, S.; Joshi, S. Local acceptance and heterogeneous externalities of biorefineries. Energy Econ. 2017, 67, 328–336. [Google Scholar] [CrossRef]
  35. Hospers, G.-J.; Reverda, N. Managing Population Decline in Europe’s Urban and Rural Areas; Springer International: Cham, Switzerland, 2015. [Google Scholar]
Figure 1. (A) Energy production, PJ. (B) Production of renewables, PJ. Note: Wood comprises of firewood, wood chips, wood pellets, and wood waste. Source: Statistics Denmark, Available online: www.statbank.dk/ENE2HO (accessed on 4 May 2022).
Sustainability 14 11077 g001aSustainability 14 11077 g001b
Figure 2. Map of Danish provinces.
Sustainability 14 11077 g002
Figure 3. (A) Employment shares (%) in 2020 in the statistical provinces South Jutland and West Jutland and at the national level. Primary and secondary industries. (B) Employment shares (%) in 2020 in the statistical provinces South Jutland and West Jutland and at the national level. Tertiary industries. Source: Own calculations based on data from Statistics Denmark, Available online: www.statbank.dk/RAS302 (accessed on 8 May 2022).
Sustainability 14 11077 g003
Figure 4. Employment development in the 16 peripheral municipalities in Denmark: Historic employment (1994–2020) and forecasted employment with and without a full biogas expansion up to the 100% utilization of the biomass potential. Note: The forecasted development (red line) is calculated via an exponential trend model based on the development from 1994–2020, which produces a forecasted yearly growth rate of −0.7%. The forecasted employment linked to a biogas expansion (green line) is calculated through several steps. First, we assume that the future expansion with follow the yearly growth rate of PJ expansion in the biogas production in the period 2012–2020, see Figure 1A, which was 25.6%. Next, based on this PJ forecast, we forecast the number of new jobs due to biogas expansion by using our estimated increase of 342 permanent jobs per 10% extra utilization of available biomass, and our knowledge that the utilization rate of biomass was 15% in 2018. Based on these assumptions, the calculations reveal that all available biomass will be used by 2027, and thus the maximum employment impact from a 100% biogas expansion will be reached in 2027. Source: Custom run from Statistics Denmark (employment data from 1994–2007) and publicly available employment data from 2008–2020 from Statistics Denmark, Available online: www.statbank.dk/RAS302 (accessed on 8 May 2022).
Sustainability 14 11077 g004
Table 1. Dry matter by animal species. 1000 tons per year.
Animal SpeciesDry Matter, 1000 Tons per Year
Cattle1883
Pigs1007
Poultry197
Fur-bearing animals69
Horses47
Sheep16
Goats4
Deer8
Total3233
Source: Danish Business Authority [27] (p. 32).
Table 2. The biomass input mix in the Model Biogas Plant.
TypeInputProportion,
pct.
Dry Matter Content,
pct.
CattleRaw, untreated manure367.5
PigRaw, untreated manure424.9
CattleFiber fraction of separated manure530
PigFiber fraction of separated manure730
CornCorn silage1033
Total10011.3
Source: Jacobsen et al. [28] (p. 65).
Table 3. Cost structure of operating 14.4 Model Biogas Plants. Annual costs of biogas production in the 10% of potential manure biomass scenario.
Annual Costs
Cost category1000 Euros
Electricity2759
Maintenance
Pumps247
Macerator49
Stir equipment247
Struvite cleaning98
Removal of sand123
Gas refinement385
Other material inputs96
Water etc.96
Analysis96
El and control578
Other maintenance578
Total maintenance2593
Own transport
Wages3652
Fuel2457
Other current expenses1772
Total transport7881
Transport re-investment1088
Operational costs
Wages management2311
Insurance771
Board385
Office385
Revision193
Manure administration193
Other office costs193
Total operational costs4431
Total direct wage and employment
Wages6734
Employed, number of persons168
Source: Own calculations based on Jacobsen et al. [28].
Table 4. Location quotients in 2020 for provinces South Jutland and West Jutland combined.
IndustryLocation Quotient
Agriculture, forestry, and fishing1.90
Mining and quarrying1.99
Manufacture of food products, beverages, and tobacco1.73
Textiles and leather products2.13
Wood and paper products and printing1.75
Oil refinery etc.1.55
Manufacture of chemicals1.03
Pharmaceuticals0.04
Manufacture of plastic, glass, and concrete1.61
Basic metals and fabricated metal products1.87
Manufacture of electronic components0.48
Electrical equipment2.23
Manufacture of machinery1.87
Transport equipment1.64
Manufacture of furniture and other manufacturing1.69
Electricity, gas, steam, and air conditioning supply1.27
Water supply, sewerage, and waste management1.08
Construction1.05
Wholesale and retail trade1.07
Transportation1.13
Accommodation and food service activities0.91
Publishing, television, and radio broadcasting0.36
Telecommunications0.49
IT and information service activities0.40
Financial and insurance0.59
Real estate activities0.95
Consultancy etc.0.65
Scientific research and development0.39
Advertising and other business services0.69
Travel agent, cleaning, and other operational services0.92
Public administration, defence, and compulsory social security0.91
Education0.86
Human health activities0.86
Note: Location quotients LQi = (LRi/LR)/(LNi/LN), where index i is industry. LRi is regional employment in industry i, while LR is total employment in the region. Similarly, LNi is employment in industry i at the national level, while LN is total employment at the national level. Location quotients can be defined from industry employment or industry production value statistics. Source: Own calculations based on national income accounts and employment data from Statistics Denmark: www.statbank.dk/RAS302 (accessed on 8 May 2022).
Table 5. Economic impacts per year of an expansion of common biogas plants by 10% of the available biomass resource.
EmploymentIncome,
Gross Value
Added
Tax Revenue from Indirect and Local Income Taxes
JobsMillion EurosMillion Euros
Direct impact at biogas plants1686.81.7
Input for plants, direct and indirect impacts947.22.4
Induced impact via consumption806.82.2
Total34220.86.3
Table 6. Permanent employment impacts of an expansion of common biogas plants by 10% of the available biomass resource by industry (number of permanent jobs).
IndustryDirect Impact at Biogas PlantsInput for Plants, Direct and Indirect ImpactsInduced Impact via Consumption
Manufacture of fabricated metal products 12
Manufacture of other machinery 3
Manufacture of motor vehicles and related parts 11
Production and distribution of electricity 7
Manufacture and distribution of gas168
Civil engineering 1
Professional repair and maintenance of buildings 103
Sale of motor vehicles 35
Repair and maintenance of motor vehicles etc. 401
Wholesale 69
Retail sale 13
Transport by suburban trains, buses and taxi operation, etc. 1
Freight transport by road and via pipeline 1
Support activities for transportation 1
Postal and courier activities 1
Restaurants 5
Monetary intermediation 12
Insurance and pension funding 4
Renting of non-residential buildings 11
Renting of residential buildings
Accounting and bookkeeping activities 4
Business consultancy activities 21
Services to buildings, cleaning and landscape activities 1
Medical and dental practice activities 1
Social work activities without accommodation 2
Other personal service activities 1
Other industries with impact less than 1.0 job 1028
Total1689480
Publisher’s Note: MDPI stays neutral with regard to jurisdictional claims in published maps and institutional affiliations.

