1. Introduction
With the increasingly significant impact of climate change on human survival and development, the issue of climate change has gradually become a substantial challenge for all countries in the world [
1,
2,
3]. As a significant global emitter of greenhouse gases, how to effectively promote the sustainable development of enterprises has become an unavoidable vital issue for China’s economic growth and social development. In the face of downward economic pressure and environmental resource pressure, it is a rational choice for China to seek a win-win low-carbon economic development path for both emission reduction and sustainable development [
1,
4,
5]. In particular, green technology innovation, as the key to promoting low-carbon governance, can promote energy efficiency and renewable energy, thus facilitating the transformation of the old and new development dynamics and realizing the transformation of the economy from high-speed growth to high-quality development, as well as the synergistic development of economic society and ecological civilization.
In this context, how to promote the low-carbon development of enterprises and realize the sustainable development of a green economy has become the focus of the Chinese government. In 2010, China’s National Development and Reform Commission promulgated the Notice on Piloting Low-Carbon Provinces and Low-Carbon Cities. It began implementing the low-carbon pilot city policy that year, starting with five provinces, including Guangdong and Liaoning, and eight cities, including Tianjin and Chongqing. Subsequently, the second and third batches of pilot cities were carried out in 2012 and 2017, gradually increasing the number of low-carbon pilot cities. Now, 87 low-carbon pilot cities have been approved in three batches nationwide. In particular, in 2020, China proposed a future development strategy of “peak carbon dioxide emissions” and “carbon neutrality” at the 75th session of the United Nations General Assembly, signifying that “carbon reduction” has become the top priority for China’s sustainable development. It promoted the continuation and implementation of the low-carbon pilot city policy. As a result, research on low-carbon pilot city policies has become the focus of academic circles.
In previous studies, scholars mainly focused on the mid-macro perspective of low-carbon pilot city policy and primarily evaluated the effectiveness of low-carbon pilot city policy through energy and carbon emission-related indicators (e.g., energy efficiency, carbon emissions, etc.). For example, Song, H. et al. [
1] conducted a study on air quality to explore the impact of low-carbon pilot city policies on air quality. The research shows that the implementation of the low-carbon pilot city policy significantly reduced air pollution in pilot cities, mainly by reducing corporate emissions and upgrading industrial structures. Fan, D. et al. [
2] studied the impact of the low-carbon pilot city policy on energy efficiency. They found that the low-carbon pilot city policy effectively improved the energy use efficiency of pilot cities. Yang, J.P. et al. [
3] focused on the impact of low-carbon pilot city policy on carbon emissions. They demonstrated that the implementation of the low-carbon pilot city policy significantly contributed to reducing carbon emissions, and there was a spatial spillover effect, which also reduced carbon emissions in neighboring areas. Overall, the low-carbon pilot city policy has a significant impact on improving energy efficiency, reducing total carbon emissions of cities, and building industrial systems and consumption patterns characterized by low carbon.
However, there are limitations to the above studies. Firstly, previous studies have mainly examined the impact of low-carbon pilot city policies from the medium and macro perspectives of cities and industries. In contrast, studies based on the micro view of enterprises are scarce. In addition, studies based on the micro perspective of enterprises tend to ignore the reality of policy implementation in batches and instead analyze provinces and cities with multiple batches of policy pilots as a unified whole, lacking a multi-period perspective to reveal the true impact of low-carbon pilot city policy implementation on listed enterprises. Secondly, most previous studies have selected indicators that directly measure the impact of the low-carbon pilot city policy for assessment, and few have explored the indirect indicator dimensions, especially regarding firm innovation capacity and innovation efficiency. The low-carbon pilot city policy requires the implementation of a low-carbon economy and the development of low-carbon industries. Achieving this purpose is inevitably accompanied by corporate technological innovation, which encourages companies to update existing technologies and develop green technologies that meet the needs of low-carbon development. However, from the perspective of green innovation, the literature studying the effects of low-carbon pilot city policy implementation is still relatively scarce. The impact of the low-carbon pilot city policy on green technology innovation at the firm level needs to be further identified and analyzed.
Therefore, based on integrating and combing related literature, this paper explores the impact of implementing the low-carbon pilot city policy on green technology innovation of listed companies from the microscopic perspective of enterprises using a multi-period difference-in-difference model (multi-period DID). Furthermore, we use Propensity Score Matching (PSM) to check the robustness to ensure the accuracy of the estimation results. Collectively, the main innovations of this paper are: (1) extension of research data: in previous studies, the research data were mainly focused on the period 2005–2015. This paper expands the time window of samples to 2007–2019 by considering the third batches of low-carbon pilot cities. It obtains the secondary market trading data, patent data, and economic data of relevant enterprises based on the perspective of Chinese A-share listed companies; (2) innovation in research perspective: in contrast to the multidimensional assessment from the medium and macro perspectives, this paper examines the role of the low carbon pilot city policy in promoting enterprise green technology innovation based on enterprise microdata, expanding on existing related research; (3) research method innovation: this paper uses a multi-period DID model to assess the impact of pilot policies implemented in different years. Additionally, the PSM method is further used to mitigate the selection bias between the treatment and control groups, minimize the bias caused by the model specification as well as omitted variables, which can ensure the accuracy of the multi-period DID estimation results, and obtain a more precise impact of low carbon pilot city policy on enterprises’ green innovation; and (4) in the background of the low-carbon pilot city policy, this paper explores the impact of the degree of enterprise digitalization on its enterprise green technology innovation. It proves that accelerating the digital transformation is of great significance for enterprises to carry out green technology innovation.
2. Literature Review
The research in this paper is related to the following two types of literature. The first type of literature focuses on the specific effects of low-carbon pilot city policy, and the second type of literature is about corporate green innovation.
2.1. Effects of Low-Carbon Pilot City Policy
For the policy research of low-carbon pilot cities, scholars focus on the impact of policies on different fields, mainly on pollutants [
1], efficiency innovation [
2,
6,
7,
8], carbon emission reduction pollutants [
3,
4,
5], and technological innovation [
9]. For example, in terms of carbon reduction, Li, L.H. [
4] studied the impact of low-carbon pilot city policy on carbon intensity. This study found that the implementation of the low carbon pilot city policy had a significant reduction effect on carbon intensity in pilot cities, with a reduction of about 6.82% compared to non-pilot towns. Wei, D.M. et al. [
5] explored low-carbon government construction in cities. The result showed that the low-carbon pilot city policy can significantly guide pilot cities in low-carbon governance construction and that low-carbon governance construction promotes green economic growth mainly through green technological innovation. In terms of efficiency innovation, Fan, D. et al. [
2] focused on the impact on energy efficiency. They examined the guiding role of the low-carbon pilot city policy based on the difference-in-difference model. This research found that the approach significantly improved the energy use efficiency of the pilot cities by leveraging industrial structure upgrading and technological innovation. Zhang, B.B. et al. [
8] examined the role of low-carbon pilot city policies on cities’ total factor energy efficiency using the difference-in-difference model. They found that the implementation of low-carbon city pilot policies has a leading role in improving total factor energy efficiency in cities.
In addition, in the study of low-carbon pilot city policies, scholars have used different methods to examine the impact of low-carbon pilot city policies, mainly including the difference-in-difference method [
2,
10,
11], the synthetic control method [
3], and the indicator evaluation method [
6,
12,
13,
14]. For example, Yang, J.P. et al. [
3] focused on the impact of low-carbon pilot city policy on carbon emissions. Based on the combination of the synthetic control method and the dynamic spatial Dubin model, the result shows that the low-carbon pilot city policy significantly reduced carbon emissions. Deng, R.R. et al. [
6] used eco-efficiency indicators for assessment to study the effect of low-carbon pilot city policies on the construction of ecological civilization. The result shows that the low-carbon pilot city policy can significantly improve the eco-efficiency of the pilot city, and the policy implementation effect had a positive spillover effect. The effectiveness of the policy is mainly achieved through green technological innovation and industrial structure upgrading. Xu, J. et al. [
10] used the difference-in-difference model to verify that low-carbon pilot city policies can guide green technology innovation at the overall level of enterprises. Additionally, they found that command-and-control tools are the main mechanism by which the pilot policy works. However, few existing studies use the multi-period DID for verification to consider the policies implemented in different years.
2.2. Corporate Green Innovation
In the studies on corporate green innovation, scholars have explored the specific roles of different influencing factors in generating corporate green innovation. The influencing factors mainly involve external factors such as government environmental regulations, carbon emission policies, digital finance, green tax systems, green credit, and internal factors such as human resources and party organization embedding [
15,
16,
17,
18]. For example, in terms of external factors, Wang, L. et al. [
19] explored the impact of digital finance on corporate green technology innovation, using the number of green patent applications to proxy the level of corporate green technology innovation. The study found that digital finance has a driving effect on corporate green technology innovation. The breadth of coverage and depth of use of digital finance has a significant impact. Xie, Z.F. et al. [
20] conducted a study on the green tax system to examine the impact of inter-provincial differences in environmental protection tax amounts on firms’ green technological innovation. The research found that the difference had no significant effect on the share of total green patent applications by firms in the tax-increasing region but significantly contributed to the percentage of green utility model patent applications. In terms of internal factors, Zhao, Y.H. et al. [
9] examined the impact of party organization embedding on corporate green innovation from the perspective of corporate grassroots party organizations. They used the ratio of the number of green patents to the number of green patents applied for that year to measure corporate green innovation. The result shows that embedding party organization structures facilitates corporate green innovation. Liang, M. et al. [
21] examined the impact of executives’ environmental cognition on corporate green innovation. They used a maturity scale to calculate the questionnaire data to represent green innovation and found that executive environmental perceptions positively contribute to the improvement of green innovation performance.
In addition, scholars have used various measures of green innovation, mainly using green patent-related indicators (number of green patent applications, number of green patents granted, percentage of green patents, etc.) [
22,
23,
24] and scale design metrics [
19,
25,
26,
27]. Specifically, in the study of green patent-related indicators, Zhong, C.B. et al. [
28] measured green innovation by using the number of green patent applications and the ratio of green patent applications to all patent applications in that year and evaluated the effect of China’s low-carbon pilot policy on enterprises’ green innovation. Yao, X. et al. [
29] studied the impact of the carbon trading mechanism on corporate green innovation. The indicator used the number of green patent applications of listed companies as a percentage of their patent applications in that year. Using the triple differences model (DDD), they found that the carbon trading pilot policy could promote enterprises’ proportion of green patent applications in high-pollution industries in pilot provinces. In terms of scale design metrics, Xie, Z.F. et al. [
20] conducted a study on the green tax system to examine the impact of inter-provincial differences in environmental protection tax amounts on firms’ green technological innovation. The difference was found to have no significant effect on the share of total green patent applications by firms in the tax-increasing region but significantly contributed to the share of green utility model patent applications. Cao, H.J. et al. [
25] examined the influence of the internal and external environment on firms’ green innovation strategies. To measure green innovation strategies, they used a maturity scale to measure the questionnaire.
By combing through the literature, the current results of low-carbon pilot city policy and corporate green innovation are relatively abundant, which lays the foundation for further research in this paper. Meanwhile, considering the shortage of current research perspectives and methods, further study can be carried out in the following aspects. Existing studies have discussed the impact of the low-carbon pilot city policy from multiple directions. Most scholars mainly discuss the effects of the policy on direct indicators (such as pollutant emissions, energy efficiency, and total factor productivity). However, few scholars have conducted in-depth discussions on whether to promote green technology innovation in listed enterprises. This impact is crucial for the sustainable development of China’s economy in the future and the realization of carbon peaks and carbon neutralization. In addition, methodologically, few scholars have studied the impact of low-carbon pilot city policy implementation on enterprises’ green innovation from a multi-period perspective. Therefore, this paper uses the PSM-Multi-period DID model to reveal the role of low-carbon pilot city policies on enterprises’ green technology innovation using enterprise micro-level data.
3. Hypothesis Formulation
The low-carbon pilot city policy aims to take a low-carbon economy as the development mode and direction, strive to develop low-carbon industries, promote energy-saving and emission-reduction technology innovation, to guide Chinese provinces and cities to promote local low-carbon governance, and improve the level of green and sustainable economic development. Since 2010, the National Development and Reform Commission has successively appointed low-carbon pilot provinces and cities, and 87 low-carbon pilot provinces and cities have been approved for establishment in three batches. Nowadays, carbon peaking and carbon neutrality have been elevated to China’s national strategy, proving the Chinese government’s firm attitude and orientation towards sustainable development. The Chinese government’s low-carbon city pilot city policy is a significant attempt at sustainable development. The relevant policy documents indicate that the key to low-carbon city pilot cities lies in developing innovative green technologies for enterprises. Therefore, the implementation of the low-carbon pilot city policy has actively promoted and motivated the green technology innovation of enterprises and provided critical political support for green technology innovation.
By reviewing most of the research results, it can be seen that the implementation of a low-carbon pilot city policy can help improve energy efficiency, reduce carbon emissions in production processes, and low-carbon transformation and upgrading of industries, thus reducing the carbon intensity and total carbon emissions of cities [
2,
3,
4,
8]. It shows that the implementation of a low-carbon pilot city policy has a significant enhancement effect on the efficiency improvement and transformation, and reform of enterprises. In reality, the upgrading development of enterprises mainly relies on technological breakthroughs, thus promoting green technological innovation activities. Therefore, there is a positive influence of the low-carbon pilot city policy on the green technological innovation of enterprises. The first hypothesis proposed in this paper is as follows:
Hypothesis 1 (H1). The low-carbon pilot city policy helps enterprises carry out green technology innovation activities.
Second, the impact effects of low-carbon pilot city policies can be heterogeneous depending on the ownership of enterprises. State-owned enterprises and non-state-owned enterprises have different systems and characteristics. State-owned enterprises are mostly traditional industrial enterprises with colossal volume and extensive policy support. They can possess a strong dependence on innovation and be less responsive to policy pressure. In contrast, non-SOEs are smaller, have unstable profitability, and face greater market competition. Under the pressure of low-carbon pilot city policies, they are more likely to promptly submit to market policies and adjust their R&D directions. Therefore, non-SOEs are usually more enthusiastic and flexible about upgrading under political pressure. For example, Zhong, C.B et al. [
28] found that the low-carbon pilot city policy promotes green technology innovation in both state-owned and private enterprises, but more so in private enterprises. Accordingly, this paper proposes that:
Hypothesis 2 (H2). The low-carbon pilot city policy can promote green technological innovation activities of non-state-owned enterprises, and the promotion effect is greater than that of state-owned enterprises.
In addition, the effect of low-carbon pilot city policy can also be heterogeneous depending on the different geographical locations of the firm. Local cities have significant differences in geographic location, level of economic development, and policy implementation in the development process, leading to different responses to low-carbon pilot city policy implementation compared with other regions. That is, the more developed the economy, the greater the energy consumption, the higher the policy implementation requirements, and the more pronounced the impact of low carbon policies on reducing carbon emissions. Eastern China is the most economically developed region in China. Major cities such as Beijing, Tianjin, Shanghai, Nanjing, Guangzhou, and Shenzhen are all located in the eastern part of mainland China. Accordingly, this paper proposes that:
Hypothesis 3 (H3). The implementation of the low-carbon pilot city policy is more capable of promoting green technology innovation activities of enterprises in eastern China compared to central and western China.
The impact of low-carbon pilot city policies can also be heterogeneous in terms of the different stock sectors in which enterprises are located. Different stock plates can be used to distinguish different types, market values, and profitability of enterprises. Different kinds of enterprises have significant differences in profit sources and technological innovation, which can lead to varying responses of enterprises in various sectors to the policy implementation of low-carbon pilot cities. The main board consists of mainly large blue-chip enterprises and huge traditional industries with stable profitability. The Growth Enterprise Market (GEM) primarily aims at small- and medium-sized enterprises with technological growth and high technology content. Its primary source of profit is intellectual property rights, and it is easier to use its technological advantages for innovation under certain policy pressures. Accordingly, this paper proposes that:
Hypothesis 4 (H4). Compared with the main board enterprises, the implementation of the low-carbon pilot city policy can promote the green technological innovation activities of GEM enterprises.
In the era of the digital economy, digital reform of enterprises can effectively promote industrial structure optimization, business upgrading, factor cost reduction, and thus enhance the sustainability of enterprises. Green innovation technologies, as the main concept of enterprise sustainability, will also benefit from the digital reform of enterprises. The digital reform of enterprises can guide the upgrading and development of green innovation technologies and promote the generation and iterative optimization of green innovation technologies. For example, Wang, L. et al. [
19] explored the role of digital finance in influencing corporate green technology innovation. The study demonstrated that digital finance has a guiding effect on corporate green technology innovation. Additionally, the breadth of coverage and depth of use of digital finance also has a substantial impact. Song, D.Y. et al. [
30] examined the impact of corporate digital transformation on corporate green technology innovation and found that corporate digital transformation can significantly promote corporate green technology innovation. Accordingly, this paper proposes that:
Hypothesis 5 (H5). In the context of low-carbon pilot city policy, the digital transformation of enterprises has a catalytic effect on corporate green innovation.
4. Variable Selection and Model Setting
4.1. Data Sources and Sample Selection
The pilot areas selected in this paper are the provinces and cities announced by the three low-carbon pilot city policies in 2010, 2012, and 2017.This study uses transaction data, patent data, and corresponding economic data of Chinese A-share listed companies as the research sample. Patent data for listed companies are from the State Intellectual Property Office of the People’s Republic of China, while other corporate-level data are from the CSMAR database. The city-level data come from previous years’ China City Statistical Yearbooks, and the sample period runs from 2007 to 2019. Since green technology innovation activities are most active in the manufacturing industry and relatively few in other sectors, this paper only studies the data of manufacturing enterprises. The data on green patents are collected based on the World Intellectual Property Organization’s (WIPO) “Green List of International Patent Classification” (The International Patent Classification). Green List is an online tool launched by the World Intellectual Property Organization on 16 September 2010, to facilitate searching for information on patents related to environmentally friendly technologies (ESTs). According to the United Nations Framework Convention on Climate Change, the list classifies green patents. It includes seven major categories: transportation, waste management, energy conservation, alternative energy production, administrative regulatory or design aspects, agriculture or forestry, and nuclear power generation. According to this criterion, we count the enterprises’ annual number of green patents. To further study the specific direction of the role of low-carbon pilot city policies, green invention-type patents and green utility model patents are distinguished based on the total number. After the above sample selection, we finally obtained 7813 annual observations.
4.2. Variable Selection
Green patent application data: from the literature review, scholars have various measures of green innovation, mainly including the number of green patent applications, the number of green patents granted, the percentage of green patents, and the scale design metric [
9,
19,
20,
21,
25,
29,
31,
32,
33]. Among them, the number of green patent applications most intuitively reflects the number of green technology innovations made by enterprises and is accessible. Therefore, in this paper, the data on green patent applications of listed companies were selected as the explanatory variables. In addition, in the subsequent study, to further explore the specific direction of low-carbon pilot city policies on green innovation, this paper divides the total number of green patents into two categories, i.e., green invention-type and green utility model patents. We will discuss this in further study. Specifically, the total number of green patent applications is logarithmically treated in this paper to obtain the explanatory variable (Pat). To avoid the effect of zero value, we adopt logarithmic processing: the number of green patent applications is added by one and then logarithmized to obtain the logarithmic value.
- 2.
Explained variables
Time dummy variable (Post): According to the implementation time of the three batches of low-carbon pilot city policies, the policy times of the three batches of pilot cities are 2010, 2012, and 2017, respectively. However, considering that the list of the second batch of pilot cities was published in December 2012, close to the end of the year, the policy time is set to 2010, 2013, and 2017. If the year is greater than the individual policy implementation time, the value is 1. Otherwise, the value is 0.
Subgroup dummy variable (Treat): Based on the list of three low-carbon pilot cities, if the city or province is a pilot area announced in the three batches of policies, the value is 1. Otherwise, the value is taken as 0.
As the core explanatory variable, the interaction between the two variables can be replaced by a virtual variable to indicate whether the individual i implements the policy in the period t. Specifically, if individual i implements a policy, the value is 1 in period t, otherwise the value is 0.
- 3.
Control variables
We chose some firm-level control variables [
10,
19,
31,
34] and city-level control variables [
12,
30,
35] based on previous research. This paper selects seven firm-level control variables, including enterprise-scale (
), firm age (
), Tobin’s Q (
), corporate leverage (
), return on total assets (
), the shareholding of the first largest shareholder (
), proportion of independent directors (
), and four city-level control variables, including GDP per capita (
), industrial structure (
), sulfur dioxide emissions per unit of economic output (
), and sewage treatment rate (Water). In fact, the incorporation of these control variables causes some missing values in the samples. Based on the most common handling method [
5], this paper uses the average value to fill in the missing values.
Table 1 presents the definition of each of the above variables.
4.3. Model Setting
In this paper, we use low-carbon pilot city policy as a quasi-natural experiment to investigate the impact of low-carbon pilot city policies on green technology innovation using the multi-period DID model.
In previous studies, the difference-in-difference model (DID) is a common measurement identification strategy used in policy effect evaluation to eliminate endogeneity and better resolve the impact of policy releases [
36]. To assess the effect of the policy and compare the difference between post-policy and pre-policy, the rationale is to divide the sample into a treatment group (areas where the policy was implemented) and a control group (areas where the policy was not implemented). The DID model uses cross-term coefficients to reflect policy effects, which leads to treatment effects and identifies the net effect of policy implementation. However, the traditional DID model cannot conduct an accurate assessment analysis in the face of multi-period problems [
37,
38]. Therefore, this paper aims to investigate the impact of low-carbon pilot city policies on enterprises’ green innovation technologies with the intention of comparing whether there is a change in the number of enterprises’ green patents in the pilot cities after the policies. Considering that this paper is based on three batches of low-carbon pilot provinces and cities with varying periods, a multi-period DID model is exploited [
39,
40].
The treatment group contains the provinces and cities identified by the three batches of pilot policies in 2010, 2012, and 2017. The control group consists of the remaining provinces and towns. Furthermore, the intention is to study the impact of the low-carbon pilot city policy on firms’ green technology innovation. The model setup is as follows.
The explanatory variable in model (1) is , which indicates the number of green patent applications in year for the listed company . Furthermore, is the core explanatory variable. In the multi-period DID model, since the time point () for different individuals to implement policies is different, the policy time variable will become . Therefore, we can only use one dummy variable to represent whether the individual i implements the policy in the period t, namely model (2). The coefficient is the focus of attention in this paper and reflects the net effect of policy implementation. is a matrix of a series of control variables. is a time-fixed effect, is the individual fixed effect, and is a random disturbance term.
This paper also employs Propensity Score Matching (PSM) to ensure the accuracy of the multi-period DID estimation results. PSM aims to mitigate the selection bias between the treatment and control groups and minimize the bias caused by the model specification and the omitted variables.
5. Empirical Results
5.1. Descriptive Statistics
Table 2 shows the results of descriptive statistics for each variable. As shown in
Table 2, the mean value of the total number of green patent applications of enterprises is about 0.323, the maximum value is 6.441, and the standard deviation is 0.761. The result shows that the overall number of green patent applications is still relatively small, and the innovation ability varies significantly among enterprises.
5.2. Benchmark Regression
Following the benchmark model constructed above, this paper performs a benchmark regression on the model, and the estimated results are shown in
Table 3. The results show that in column (1), the regression only controls for time-level fixed effects and individual fixed effects. The results show that the estimated coefficient of
is significantly positive. To further examine the robustness of the results, we added control variables to the regressions. Column (2) shows the results. The estimated coefficient of
in column (2) is still significantly positive, indicating that the implementation of the policy has increased the logarithm of the total number of green patent applications by approximately 4.5%, which further confirms hypothesis 1.
In addition, for the control variables, some of the control variables are consistent with theoretical expectations. However, classical conclusions have shown that older executives are more conservative, pursue low-growth strategies, and tend to avoid risks. Child [
41] believed that older CEOs are less likely to invest in R&D because they have different motivations from young CEOs: R&D expenditure is detrimental to the current earnings of enterprises, and the investment recovery period is extended. If older CEOs have only a few years of tenure before retirement, R&D may not bring them higher short-term rewards and dividends. Similarly, the older the firm is, the more senior its internal executives are likely to be, the more reluctant they are to innovate and take risks, and the less they invest in R&D. Therefore, this finding is also reasonable to some extent.
5.3. Robustness Analysis
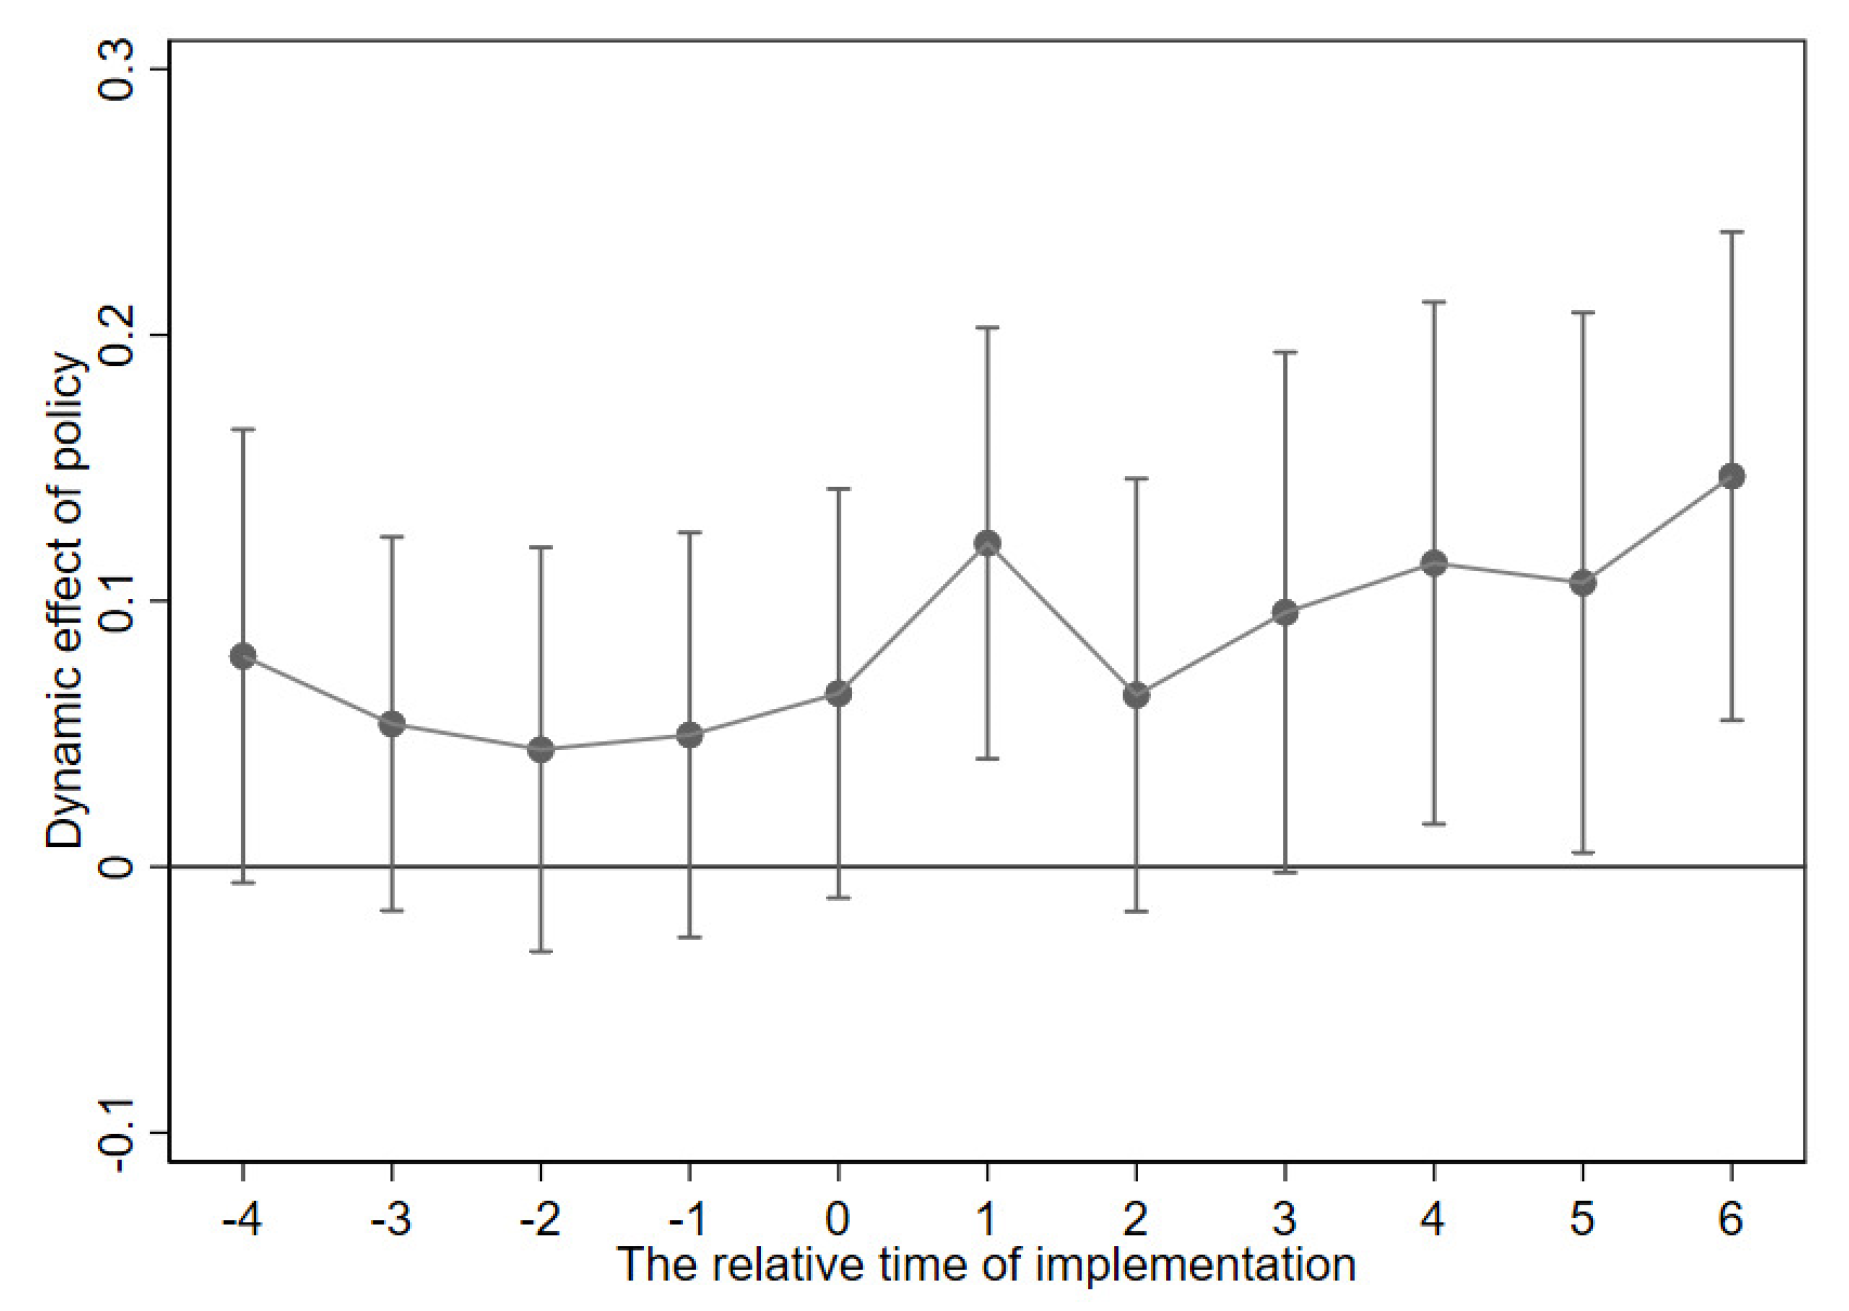
5.3.1. Parallel Trend Test
One of the prerequisite assumptions for the multi-period DID model to be valid is that the trend of change between the treatment and control groups is the same before the external policy shock. The assumption of a parallel trend needs to be satisfied. Therefore, this section will first use Stata 15.0 to map the policy effects of the treatment and control groups from 2007 to 2019. Specifically, considering the scarcity of data in the first five years and the last six years of policy implementation, this paper treats the data in the first five years of policy implementation as the same period as the data in the last six years of policy implementation to the same period. The results are shown in
Figure 1.
As shown in
Figure 1, the coefficients of time variables before policy implementation are not significant (with a 95 percent confidence interval), which means that the trend of carbon intensity in national low-carbon pilot cities and non-pilot cities is the same before policy implementation. Thus, the parallel trend assumption is satisfied. From the event analysis, the policy effect is relatively apparent in the first year, the third year, the fourth year, and the sixth year after the policy implementation. In contrast, the empirical results in the second year are not noticeable. The possible reason is that different cities have different reactions to the performance of the policy, and there may be a time lag.
5.3.2. PSM-Multi-Period DID
In the counterfactual inference framework, it is required that the micro-individual characteristics of the treatment group and the control group be the same to truly reflect the changes in firms’ innovation performance due to policy shocks. However, some of the sample enterprises in this paper are different beforehand, such as the location and business scope. Furthermore, the randomness with which each region decides whether or not to implement the low-carbon policy does not meet such a condition. That is, there is “self-selection bias”.
By reviewing the relevant literature, most scholars use Propensity Score Matching (PSM) to mitigate the selection bias between the treatment and control groups. PSM can be used to deal with observational data and reduce the impact of data deviation and confounding variables. It is convenient to make a more reasonable comparison between the treatment and control groups so that the observation studied is approximately random. In reality, the policy is essentially a non-randomized experiment (quasi-natural experiment), so the multi-period DID model used in policy effect evaluation inevitably has a self-selection bias. Using the PSM method, each treatment group sample can be matched to a specific control group sample, making the quasi-natural experiment nearly random.
Therefore, we utilize the idea of PSM to minimize the bias caused by the model specification and the omitted variables to ensure the accuracy of the multi-period DID estimation results.
Table 4 examines the sample sizes of the two groups within the standard range of values. The results show that only 3 and 24 samples are outside the expected range of values for both the treatment and control groups, respectively, indicating that most of the samples (especially the control group samples) met the matching criteria. Therefore, in the subsequent experiments, 7786 samples were regressed.
Following previous studies [
34,
38],
,
,
, and
are selected as the covariates in this empirical study. The matching results in
Table 5 show that the %bias of the covariates are all less than 10%, and all of them are significantly smaller than the %bias before matching. It indicates that there is no gap between the two groups for the covariates, and the matching effect is ideal. Among them, the standard bias of
,
,
, and
are reduced by 66.5%, 86.1%, 91.2%, and 83.5%, respectively. In addition, the results show that all five covariates are not significant after matching, indicating that the original hypothesis of “no systematic bias in the values of the covariates between the two groups” is not rejected, and the matching effect is ideal.
Table 6 presents the results of the regression for the PSM-matched sample. The results show that the regression coefficient of
is significantly positive, which is similar to the results of the benchmark regression. It indicates that the low-carbon pilot city policy has a promotional effect on corporate green innovation. It further supports the research hypothesis of this paper.
5.4. Heterogeneity Analysis
5.4.1. Examining the Heterogeneity of Business Ownership
Enterprises with different ownerships usually respond differently to the policy shock, which causes different policy effects. Therefore, this paper distinguishes two subsamples, state-owned enterprises (SOEs) and non-state-owned enterprises (non-SOEs), to examine the impact of low-carbon pilot city policy on enterprises with different ownerships. The estimation results are shown in
Table 7.
The results show that the coefficient of the core explanatory variable is insignificant in column (1) and significantly positive in column (2). It shows that the low-carbon pilot city policy does not substantially promote green technology innovation in state-owned enterprises but particularly promotes green technology innovation in non-state-owned enterprises. Thus, there exists heterogeneity regarding firm ownership in such a policy. Possible reasons for this heterogeneity have been mentioned earlier. That is, non-SOEs face greater market competition and are more likely to submit to market policies, while SOEs have a more substantial path-dependence effect. The results corroborate hypothesis 2.
5.4.2. Examining the Heterogeneity of Different Geographical Locations
Enterprises in different geographic locations have different levels of development and policy implementation effects and may have different responses to policy implementation. Therefore, according to the geographic location of each enterprise, this paper divides it into three subsamples: east, central, and west.
Table 8 shows the regression results.
The coefficient of the core explanatory variable is significantly positive in column (3), indicating that the low-carbon pilot city policy has a facilitative effect on green technology innovation by firms in the eastern region. In contrast, the coefficient is insignificant in column (2), indicating that there is no promotion effect for the western regions. In Column (1), it is significantly negative, which is inconsistent with expectations. The possible reason is that the central region includes Shanxi, Henan, and other provinces. Most of the enterprises in these provinces are engaged in traditional industries, with state-owned enterprises accounting for the largest share, nearly 50%. Resources are relatively depleted, and talent cultivation is relatively backward, so innovation cannot be carried out. Therefore, the experimental results confirm hypothesis 3. As mentioned before, one possible reason is that the more developed the economy and the more energy-consuming the region, the higher the policy implementation requirements. Thus, the more significant the impact of low-carbon policies on reducing carbon emissions.
5.4.3. Examining the Heterogeneity of Different Equity Structures
Different equity structures of firms may lead to varying responses to low-carbon pilot city policy implementation in various firms. Therefore, this paper further examines the impact of low-carbon pilot city policy implementation on corporate green innovation under different equity structures. According to the equity structure, we divided the overall sample into two subsamples: institutional shareholding and retail shareholding. For sample selection, this paper takes the average value of the institutional shareholding ratio of the company in all years. It uses the comparison between the average value and 0.5 to distinguish the samples.
Table 9 shows the regression results.
The result indicates that the coefficient of the core explanatory variable
is not significant in column (2) corresponding to the retailer sample, indicating that there is no significant effect of retailer shareholding on corporate green innovation. However, it is also insignificant in column (1) corresponding to the institutional sample, which indicates that institutional shareholding also has no significant effect on corporate green innovation, which is not in line with the theory. The possible reason is that institutional investors possess many classifications, and the impact of different institutional investors on corporate green innovation is different. Some may even be negatively affected. Therefore, the general institutional investors that are not targeted may not reflect the green technology innovation effect. For example, Tian, X.L. et al. [
42] found that qualified foreign institutional investors’ shareholding negatively regulated the relationship between tax incentives and R&D investment, while fund holdings, insurance holdings, and brokerage holdings had no significant regulatory effect. In this regard, the research on the heterogeneity of different equity structures needs to be further explored.
5.4.4. Examining the Heterogeneity of Different Stock Sectors
Companies belonging to different stock sectors can react differently to implementing a low-carbon pilot city policy. Different sectors have various requirements for listed companies so that stock sectors can distinguish between enterprises of various types, market capitalization, and profitability. The main board is mainly for large blue-chip enterprises, mainly in large traditional industries. Enterprises are in maturity and have large asset sizes and stable profitability. On the other hand, the Growth Enterprise Market (GEM) is mainly for small and medium-sized enterprises (SMEs) of technological growth, which are in the start-up phase and relatively small in size. Therefore, this paper further investigates the effect of the low-carbon pilot city policy on the two subsamples of listed enterprises belonging to GEM and the main board of SZSE.
Table 10 shows the regression results.
As seen in the table, the coefficient of the core explanatory variable is significantly positive in the corresponding column (1) of the GEM sample. It indicates that the low carbon pilot city policy has a promotional impact on the green technology innovation of the firms in the GEM. However, it is not significant in column (2), corresponding to the main board sample, indicating that the policy has no significant effect on the green technological innovation of firms on the main board. The possible reason is that, compared to the traditional enterprises on the main board, the enterprises in the GEM are mainly new technology growth enterprises with higher technological content. Their profit sources mostly come from intellectual property rights. Facing stricter market regulations, GEM enterprises can flexibly respond to policy pressure and exploit their technical advantages to vigorously develop green technology innovation.
6. Further Research
6.1. Different Patent Categories
6.1.1. Two Categories of Green Patents
To further explore the specific promotion direction of low-carbon pilot city policy on green technology innovation, this paper distinguishes green patents from green invention-type patents and green utility model patents for research.
Construct the green invention-based patent (
) and green utility model patent (
) variables. This paper adopts the same treatment as above and performs the PSM-Multi-period DID model.
Table 11 shows the regression results of the impact of the low-carbon pilot city policy on firms’ green technology innovation after PSM. The estimated coefficients of the green invention patent (
) in columns (1) and (2) are significantly positive, and the estimated coefficient of the green utility model (
) in columns (3) and (4) is not significant. This shows that the low-carbon pilot city policy promotes the innovation of green invention patents by enterprises to a certain extent.
To further examine the specific direction of the impact of individual differences in the sample on corporate green innovation, this paper examines the effect of green invention-based patents and green utility model patents under different circumstances.
Table 12 shows the heterogeneity of varying enterprise ownership. The results show that the coefficient of the difference-in-difference term is insignificant in column (2) and significantly positive in column (4). Based on the total number, it further shows that with the promotion effect on non-state-owned enterprises, it specifically promotes the innovation of green utility model patents. As for the state-owned enterprises, the same as the effects of the total number, the green technology innovation effect of the low-carbon pilot city policy is not significant.
Table 13 shows the heterogeneity across geographic locations. In columns (3) and (6), the coefficient of the core explanatory variable
is significantly positive. This indicates that the promotion of low-carbon pilot city policy in the eastern region has mainly promoted the innovation of green invention patents and green utility model patents. Furthermore, the promotion effect of green invention patents is more significant. Additionally, there is no promotion effect on the central and western areas.
Table 14 shows the heterogeneity of different equity structures. The core explanatory variable
coefficient has no significant effect on both types of patents in both sample groups, as does the effect of the low-carbon pilot city policy on the total number of green patents. The possible reason is the same as in the previous section. The impact of different institutional investors on corporate green innovation is different. The general institutional investors that are not targeted may not reflect the effect of promoting green technology innovation.
Table 15 shows the heterogeneity of the different stock sectors. In columns (1) and (3), which correspond to the GEM sample, the coefficient of the core explanatory variable
is significantly positive. It is insignificant in columns (2) and (4), corresponding to the main board sample. It shows that the low-carbon pilot city policy significantly affects green technology innovation for enterprises belonging to GEM. The direction of the effect is green invention-based patents and green utility model patents. However, there is no significant effect on enterprises belonging to the main board.
6.1.2. Seven Categories of Green Patents
After examining the total number of green, green invention patents, and green utility model patents, this paper further selects three patent categories with different directions among the seven categories for study. This paper looks at three levels: the largest number, the direction of corporate innovation, and new energy sources. We selected patients in the categories of energy conservation (), administrative regulation and design (), and nuclear power () to examine the heterogeneous effects of low-carbon pilot city policy on different categories of green patents.
In
Table 16, the coefficients of the difference-in-difference term are significantly positive in columns (1) and (2). It indicates that the low-carbon pilot city policy can greatly encourage enterprises to carry out patent innovation in the energy-saving and administrative regulation and design categories. However, the coefficient of the difference-in-difference term is not significant in column (3), indicating that the low-carbon pilot city policy does not significantly promote patents in the nuclear power category. The possible reason is as follows: the direct manifestation of the impact of the low-carbon pilot city policy is mainly the improvement of energy efficiency, the reduction of carbon intensity and total carbon emission at the overall city level, and the construction of an industrial system and consumption pattern characterized by low carbon emission, etc. Energy conservation category patents are conducive to improving energy efficiency. Additionally, administrative regulation and design-category patents reconstruct the industrial system and consumption pattern characterized by low carbon emissions. In contrast, there is still a need for further development of nuclear power-related patents, and enterprises’ development of related technologies is limited. Therefore, the implementation of a low-carbon pilot city policy can realize the low-carbon development of enterprises by promoting the innovation of the first two types of critical technologies.
6.2. The Impact of Digital Shocks on Green Innovation
Today, we are surrounded by a digital economy. Digital finance and digital transformation have become critical areas of concern for governments, enterprises, and scholars. On 13 May 2020, the National Development and Reform Commission released the “Digital Transformation Partnership Initiative” on its official website. The digitalization of enterprises has become an important direction for future reform and transformation. Enterprises can make use of emerging digital technologies for digital adaptation. Studies have proven that digital reform of enterprises can lead to the upgrading and development of green innovation technologies and drive the generation and iteration of green innovation technologies. In particular, the breadth of coverage and depth of use of digitalization have an essential impact on the effectiveness of digital reform [
19].
Therefore, to further explore the effect of the breadth of coverage or depth of use of enterprise digital transformation on enterprise green technology innovation, this paper groups the samples according to the level of digitization. As for the measure of enterprise digitalization level, this paper refers to the treatment of Wu, F. et al. [
43]. This paper calculates the corresponding keyword frequencies in the annual reports of listed companies. The calculation results are used as a proxy for the degree of digitalization of enterprises.
Table 17 shows the estimation results.
The regression results show that the coefficient of the difference-in-difference term is significantly positive in column (1), corresponding to the sample with a high degree of digitization. In contrast, the coefficient of the double difference for the example with a low degree of digitization is not significant in column (2). It indicates that enterprises with a high degree of digitalization are more active in green technology innovation. This result supports hypothesis 4 and further corroborates that emerging digital technologies can have a catalytic effect on firms’ green technology innovation.
7. Conclusions and Policy Recommendations
Sustainable development is an essential task for further developing China’s economy, and green technology innovation is a vital force in promoting sustainable development. Based on patent data of Chinese A-share listed companies from 2007 to 2019, this paper examines the role of low-carbon pilot city policies on corporate green technology innovation using the multi-period DID model. Further, it analyzes the role of heterogeneity and digital transformation. Finally, we obtained the following research findings: (1) the low-carbon pilot city policy can promote green technology innovation among listed companies in pilot cities. This finding still holds in the parallel trend test and the PSM-Multi-period DID model; (2) at the enterprise level, the implementation of low-carbon pilot city policy has a more significant guiding effect on green technology innovation in non-state enterprises than in state-owned enterprises; (3) due to geographical differences, implementing low-carbon pilot city policies in the eastern region can promote green technology innovation activities of enterprises more than in the central and western regions; (4) from the perspective of different stock sectors, compared with the main board, the low-carbon pilot city policy can significantly promote GEM-affiliated enterprises’ green technology innovation activities; and (5) further research indicates that listed companies with a high degree of digital transformation are more active in green technology innovation in the context of low-carbon pilot city policy.
Based on the above findings, this paper provides some recommendations for promoting the low-carbon pilot city policy and achieving sustainable enterprise development. (1) The low-carbon pilot city policy positively affects corporate green technology innovation and is in line with China’s national conditions of vigorously promoting sustainable development. It contributes to China’s climate action goals of “peak carbon by 2030 and carbon neutral by 2060” from the enterprise level. Therefore, the country can further develop the fourth batch of pilot cities and promote low-carbon city pilots nationwide. (2) Heterogeneity of low-carbon pilot city policy exists at the enterprise level. The implementation of the policy promotes non-state enterprises more than state-owned enterprises. Therefore, relevant policies for non-SOEs should be strengthened to encourage green innovation. At the same time, we should consider improving SOEs’ path-dependence effect and promoting SOEs’ green innovation. (3) The low-carbon pilot city policy is also heterogeneous across geographic locations. It has a more significant promotion effect on the eastern region, which has a higher level of economic development. Therefore, when the country releases pilot policies, it can fine-tune them appropriately according to the geographical situation to promote green innovation in the central and western regions. (4) In the context of the low-carbon pilot city policy, listed companies with a high degree of digital transformation are more active in green technology innovation. Enterprises vigorously developing digital transformation can promote corporate green technology innovation, thus promoting China’s green and low-carbon development. Therefore, the state can issue corresponding policy compensation by encouraging enterprises to develop digital transformation and improve their digitalization vigorously. (5) Green technology innovation is of great significance to enterprises’ sustainable development. The government should increase the support of relevant policies to encourage enterprises to make breakthroughs in some cutting-edge innovative technologies, such as energy-saving technologies, green transportation, and alternative energy, especially renewable energy. Such policy guidance can not only guarantee the quantity of innovative technologies but also effectively improve the quality of innovative technologies.
This paper initially examines the green technology innovation effects of the low-carbon pilot city policy. However, due to data availability, there are still some shortcomings in this paper. For example, the data disclosure is insufficient, resulting in some missing data; the conclusions of the heterogeneity analysis of different equity structures are limited and need further research. Therefore, there is large room for improvement.


