Article

Strengthening a Regional Green Infrastructure through Improved Multifunctionality and Connectedness: Policy Suggestions from Sardinia, Italy

Department of Civil and Environmental Engineering, and Architecture, University of Cagliari, 09123 Cagliari, Italy
*
Author to whom correspondence should be addressed.
Sustainability 2022, 14(15), 9788; https://doi.org/10.3390/su14159788
Submission received: 6 July 2022 / Revised: 27 July 2022 / Accepted: 4 August 2022 / Published: 8 August 2022

Abstract

:
A wide body of research in recent years has studied either green infrastructures as providers of multiple ecosystem services, especially at the urban level, or ecological corridors and the issue of connectivity between landscape patches in the face of growing fragmentation. However, not many studies have analyzed how the two concepts can be combined to ground evidence-based policy and planning recommendations. In this study, a methodological approach for such a combination is proposed: after mapping a regional green infrastructure building upon the assessment of multiple ecosystem services and a network of ecological corridors through the resistance to movement of species, the two spatial layouts are combined so as to analyze correlations between the potential provision of ecosystem services and the resistance to movement. The methodology is applied in the case of the island of Sardinia, whose self-containment makes it possible to discard potential effects from surrounding areas, hence facilitating the implementation of the model. The outcomes of the regression model point out three ecosystem services as the most important factors that should be targeted by appropriate spatial policies if connectivity is to be increased: regulation of micro and local climate, forestry productivity, and cultural identity and heritage values.

1. Introduction

Two common and recurring themes that encompass different definitions of Green Infrastructures (GIs) are multifunctionality and connectedness [1,2]. The European Commission [3] has, for almost a decade, promoted GIs as networks of green spaces that are simultaneously multifunctional because they deliver multiple functions that result in the provision of goods and services to people and are interconnected, meaning that smaller and larger patches are interlinked within a single, planned, and managed system that comprises natural, semi-natural, or even artificial green areas.
Within the planning domain and literature [4,5,6], GIs are considered a means for simultaneously delivering, in an integrated way, several policy objectives. This entails that a wide range of different goals are pursued, particularly as far as urban settlements are concerned [7], where environmental goals can clash with social and economic ones. Such different and sometimes contrasting objectives are delivered through the functions performed by GIs; these, in turn, translate into the supply of multiple ecosystem services (ESs) [8], although the semantic ambiguity of the term “function”, which takes different meanings in the ES lexicon and in the GI lexicon, can lead to imprecision or even confusion [9].
A typical characteristic of GIs is, therefore, multifunctionality, here considered as the landscape’s capacity to provide, through properly functioning ecosystems, a number of benefits that are sought after and valued by human beings; that is, a number of ESs [10,11], notwithstanding the fact that at the very local level, and especially in urban areas, the conception, design, and implementation of GIs is usually monofunctional [12,13], for instance, driven by the need to regulate floods or to mitigate the heat island effect. For them to be an effective planning tool to improve sustainability, resilience, and wellbeing within a landscape or even within urban spaces, GIs must, therefore, be properly designed, planned, and managed with a view to multifunctionality. This entails operationalizing the ES approach in spatial planning and moving away from traditional planning and mindsets that pursue monofunctionality, for instance, through zoning schemes and segregated land-use allocations [1,8].
The second outstanding feature, connectivity, points to the concept of ecological corridors (ECs). As a matter of fact, GIs can be conceived of as a system of core areas or nodes, i.e., the most significant areas in terms of the potential supply of ESs, which are interlinked through branches, i.e., through ECs, hence allowing for the movement of species and for fostering spontaneous biological exchanges across core areas. The effectiveness of ECs in improving the operational capacity of GIs is based on decreasing the effects on biological and species flows generated by forestry and agricultural production, urbanization and related infrastructure, and pollutant emissions to air and water, whose degradation or even depletion of natural ecosystems result in negative impacts on ECs and, in turn, on GIs [14].
However, some landscape elements can prevent ECs from effectively contributing to supporting biological flows and exchanges within a GI. The most prominent are physical obstacles, be they natural (such as water courses, which can act as barriers to movement for some species) or human-made (such as boundary walls or roads, railroads, and linear infrastructure in general); also worthy of note is the presence or absence of areas that provide key contributions to support species’ life cycles, such as suitable habitats and nourishment [14,15,16]. Therefore, the absence of such physical obstacles is a prerequisite for putting GI’s potential to good use, as ensuring connectivity through ECs is key to allowing for species’ movement along suitable linear branches that connect core areas within a GI [17].
According to the European Commission, a GI is identified as a spatial network that provides a set of ESs since a GI is “[A] strategically planned network of natural and semi–natural areas with other environmental features designed and managed to deliver a wide range of ESs. It incorporates green spaces (or blue if aquatic ecosystems are concerned) and other physical features in terrestrial (including coastal) and marine areas. On land, GI is present in rural and urban settings” [3] p. 3, and “The work done over the last 25 years to establish and consolidate the network means that the backbone of the EU’s GI is already in place. It is a reservoir of biodiversity that can be drawn upon to repopulate and revitalize degraded environments and catalyze the development of GI. This will also help reduce the fragmentation of the ecosystems, improving the connectivity between sites in the Natura 2000 network and thus achieving the objectives of Article 10 of the Habitats Directive” [3] p. 7. This entails that planning policies aimed at increasing and enhancing the provision of services supplied by nature and natural resources should target GIs as networks providing a large set of ESs while protecting their environmental features [2].
The operational definition by the European Commission entails that GIs are relevant systems with reference to conservation and the improvement of biodiversity, increase in ecosystem continuity, and the enhancement of ESs provision [18].
It also implies that the increase in the supply of ESs, and the conservation and enhancement of biodiversity, must be prioritized as management objectives for the implementation of GIs [2,19].
In this study, we regard GIs as both providers of ESs and networks of core areas interconnected through ECs, and we contribute to the current academic debates on the relationship between ES supply and connectivity [20,21], not only by quantitatively investigating such relationship but also by identifying evidence-based policy recommendations aimed at strengthening its significance. The second section provides the reader with some background information on the study area, as well as on methodological approaches that can be used to map an RGI based on patches’ suitability both to simultaneously provide several ESs and to belong to linear ECs that connect core areas. In the third section, the results from the implementation of the models in the study area are presented: by overlaying the spatial configuration of ECs upon the map of potential provision of ESs, a regression model is implemented to analyze correlations between the two key characteristics of the GI. Next, the fourth section discusses, in light of the current literature, some highlights from the regression model, which concern those ESs that contribute the most to increasing an area’s suitability to belong to an EC. Finally, the fifth and concluding section provides suggestions for policymakers and planning practitioners, with a view to improving the environmental characteristics of an RGI in order to enhance its capacity to supply ESs; moreover, the exportability of the adopted methodological approaches to other Italian and European Union (EU) regional contexts is also discussed.

2. Materials and Methods
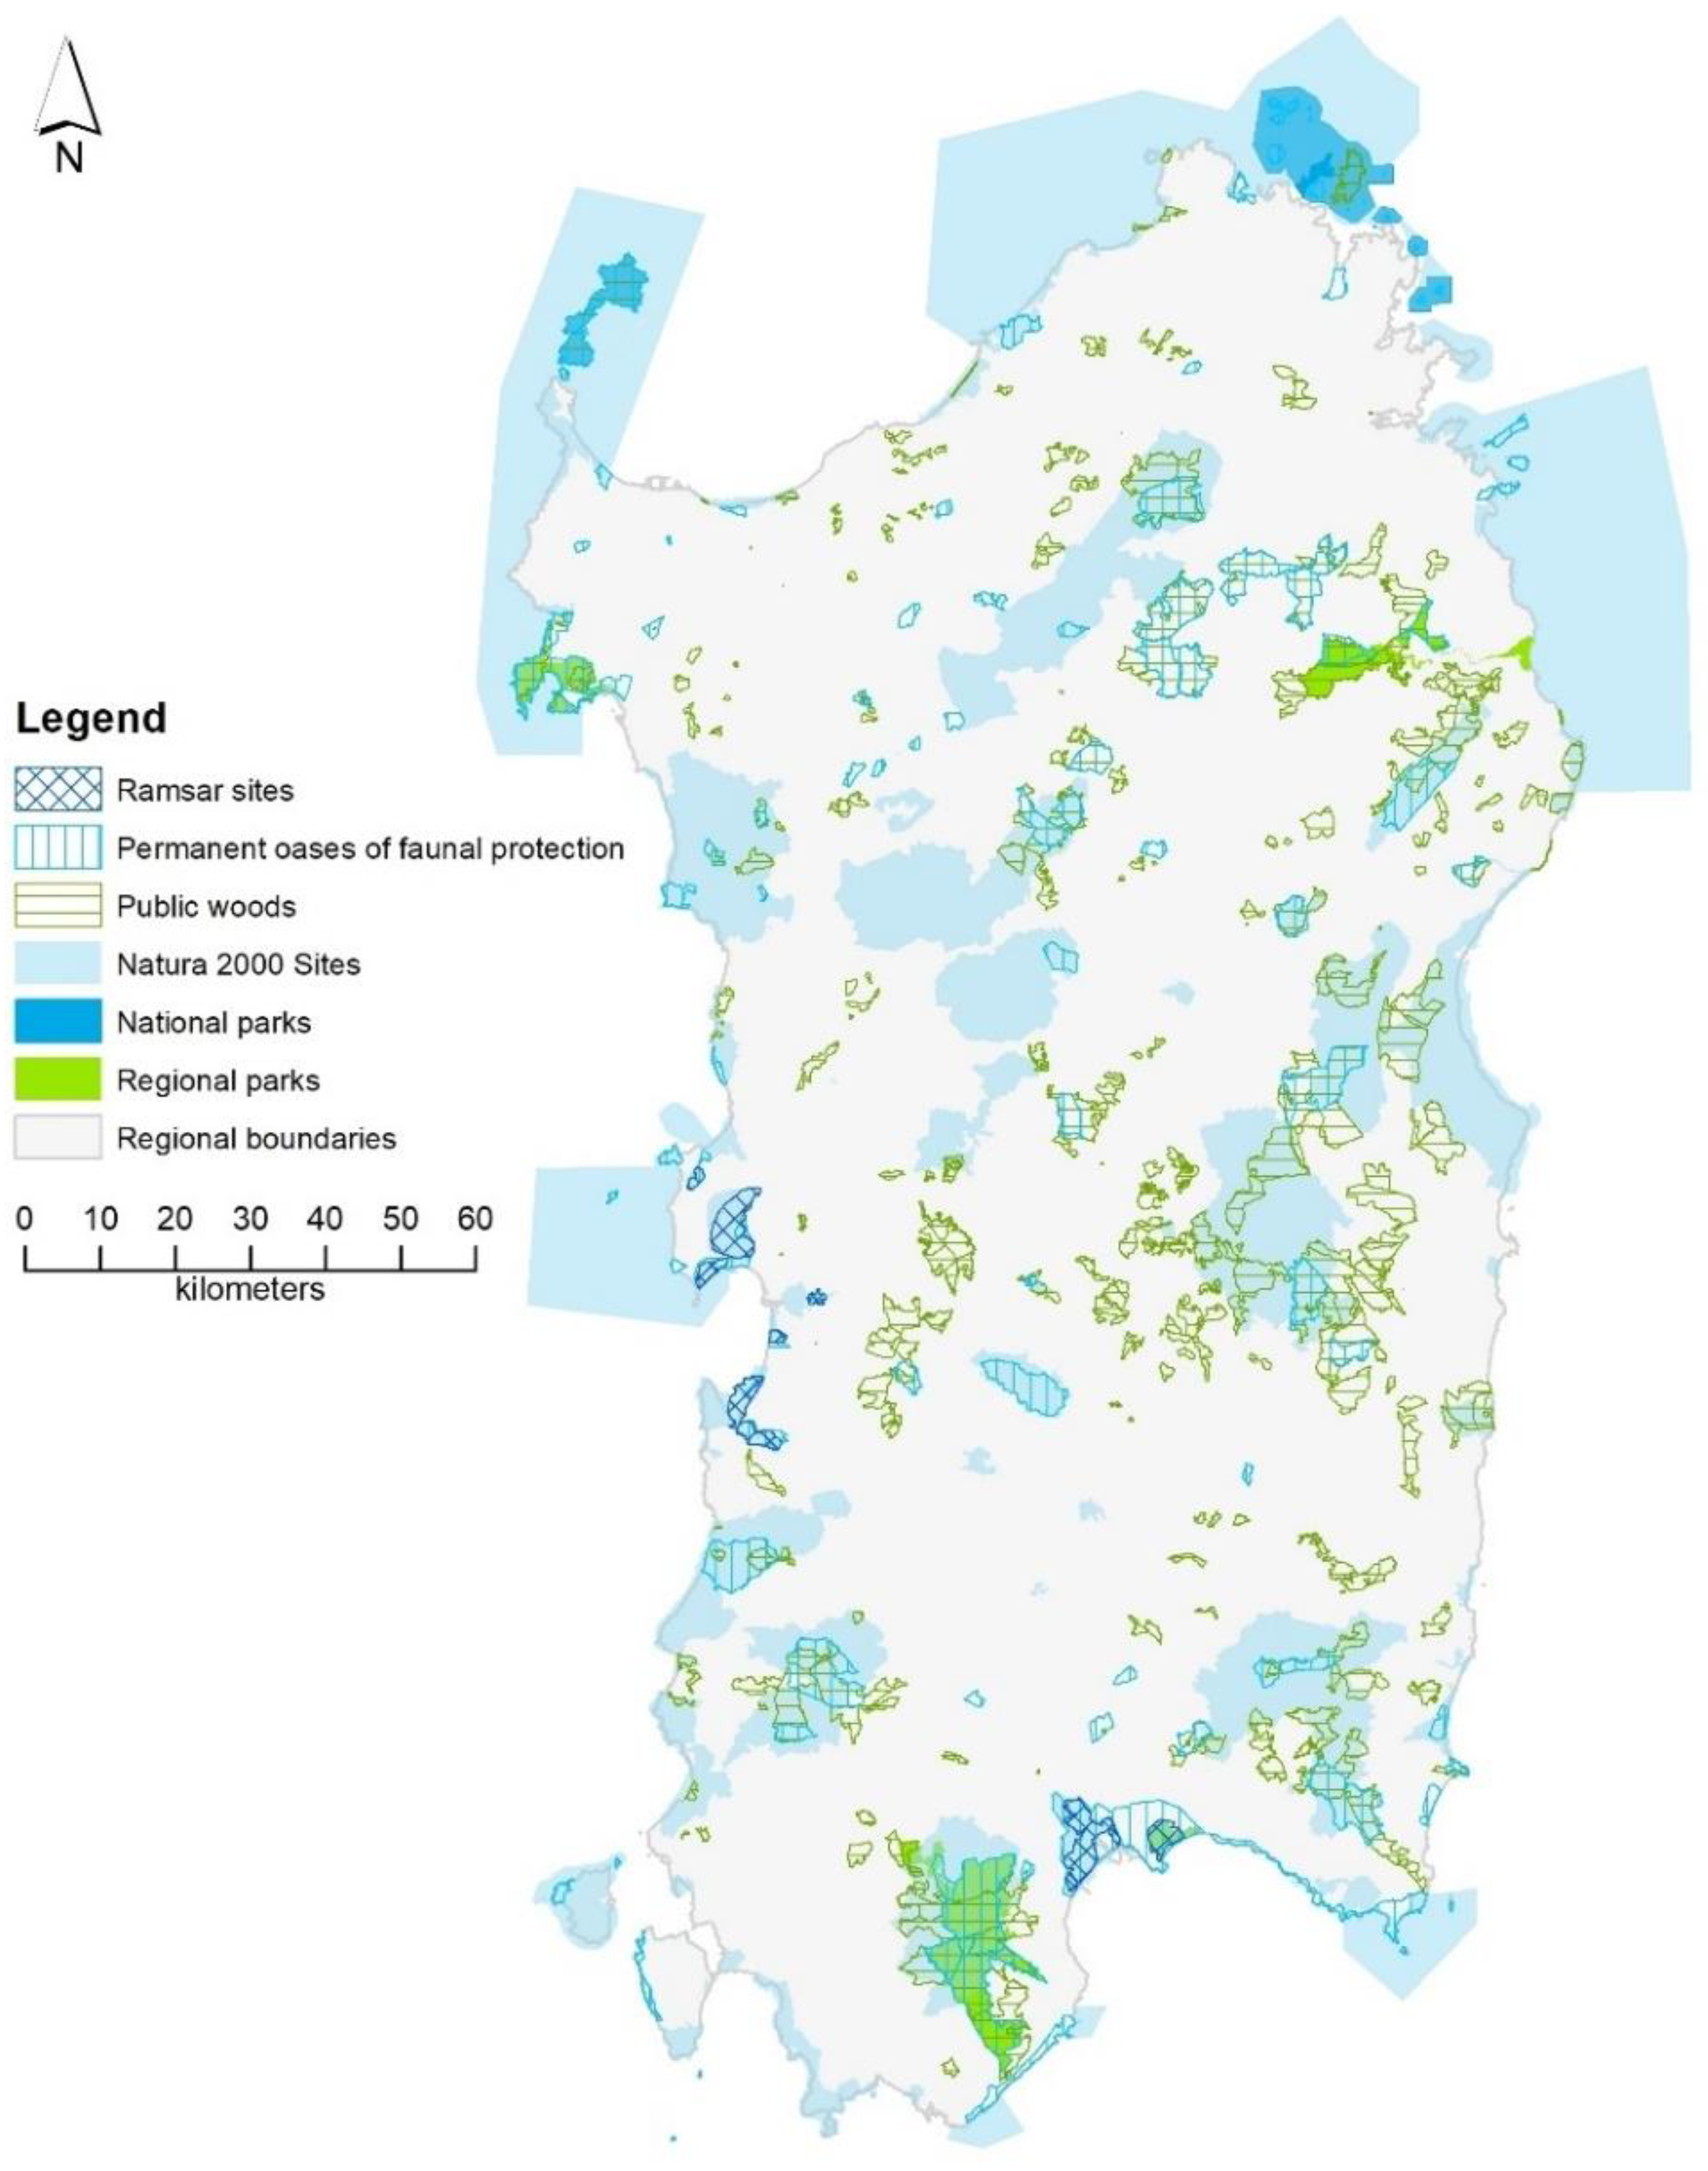
2.1. Study Area

Sardinia is a Mediterranean island with a land mass of about twenty-four thousand square kilometers and a coastline of approximately 1850 km; from an administrative point of view, it is an autonomous region with a population of nearly 1.6 million residents. Because it is an island, its GI can be regarded as self-contained and not affected by factors concerning proximal or contiguous areas; therefore, it constitutes an ideal context to investigate a regional GI (RGI) and its characteristics in terms of both provision of ESs and layout of terrestrial ECs.
A GI is here regarded as a network whose branches are linear ECs that enable connectivity among core areas. In Sardinia, core areas are taken as those that are protected under national or regional laws (Protected Areas, henceforth PAs) for their natural characteristics, and that can be listed as follows (Figure 1), following Lai et al. [22].
  • The four natural regional parks established under the provisions of Regional Law no. 31/1989.
  • Public woods managed by the Regional Agency for Forests and the “permanent oases of faunal protection”, identified by Regional Law no. 23/1998, whose maps are available from the Geoportal of the Autonomous Region of Sardinia [23].
  • The Ramsar sites designated by the Ramsar Convention, signed in 1971; nine Sardinian Ramsar sites have been established since 1977.
  • The Natura 2000 sites, broadly classed into two groups: Sites of Community Interest (SCIs) and Special Areas of Conservation (SACs), designated under the Habitats Directive [24], and Special Protection Areas (SPAs), designated under the Birds Directive [25]; in Sardinia 128 sites have been established under the provisions of such Directives: 31 SPAs, 97 SCIs, and 10 that have been designated both as SPAs and as SCIs; 84 former SCIs have recently been designated as SACs [26].

2.2. Data

Seven ESs were selected to spatially assess multifunctionality, i.e., the potential and simultaneous delivery of a number of ESs. The choice of which ESs was to be included was made in such a way to comprise at least one ES for each of the three sections identified within the hierarchical taxonomy offered by the Common International Classification of Ecosystem Services (CICES) [27], as follows.
  • Regulating and maintenance section, “Regulation of physical, chemical, biological conditions” division.
    • Preserving levels of habitat quality that are suitable to support the life cycles of wild plants and animals that can be useful to people (HAB_QUAL), within the class “Maintaining nursery populations and habitats (Including gene pool protection)”, group “Lifecycle maintenance, habitat and gene pool protection”.
    • Micro and regional climate regulation through the mitigation of land surface temperature (REG_LST), within the class “Regulation of temperature and humidity, including ventilation and transpiration”, group “Atmospheric composition and conditions”. Carbon sequestration and storage in soils and vegetation (CARB_SEQ), within the class “Regulation of chemical composition of atmosphere and oceans”, group “Atmospheric composition and conditions”.
  • Provisioning section, “Biomass” division.
    • Value of agricultural and forest land, taken as a proxy for agricultural crop production and harvested wood (CROP_WOOD), encompassing three classes (“Cultivated terrestrial plants (including fungi, algae) grown for nutritional purposes”, “Fibers and other materials from cultivated plants, fungi, algae and bacteria for direct use or processing (excluding genetic materials)”, “Cultivated plants (including fungi, algae) grown as a source of energy”) within the group “Cultivated terrestrial plants for nutrition, materials or energy”.
  • Cultural section.
    • Endangered species or habitats and areas that are relevant for conservation purposes (CONSERV), within the class “Characteristics or features of living systems that have an existence, option or bequest value” class, “Other biotic characteristics that have a non-use value” group, “Indirect, remote, often indoor interactions with living systems that do not require presence in the environmental setting” division.
    • Ecosystems’ capacity to support nature-based recreation (RECREAT), within the class “Characteristics of living systems that enable activities promoting health, recuperation or enjoyment through active or immersive interactions”, “Physical and experiential interactions with natural environment”, “Direct, in-situ and outdoor interactions with living systems that depend on presence in the environmental setting” division.
    • Landscape features that support local identity, cultural heritage, and tourism (CULT_HER), within the class “Characteristics of living systems that are resonant in terms of culture or heritage”, group “Intellectual and representative interactions with natural environment”, “Direct, in-situ and outdoor interactions with living systems that depend on presence in the environmental setting” division.

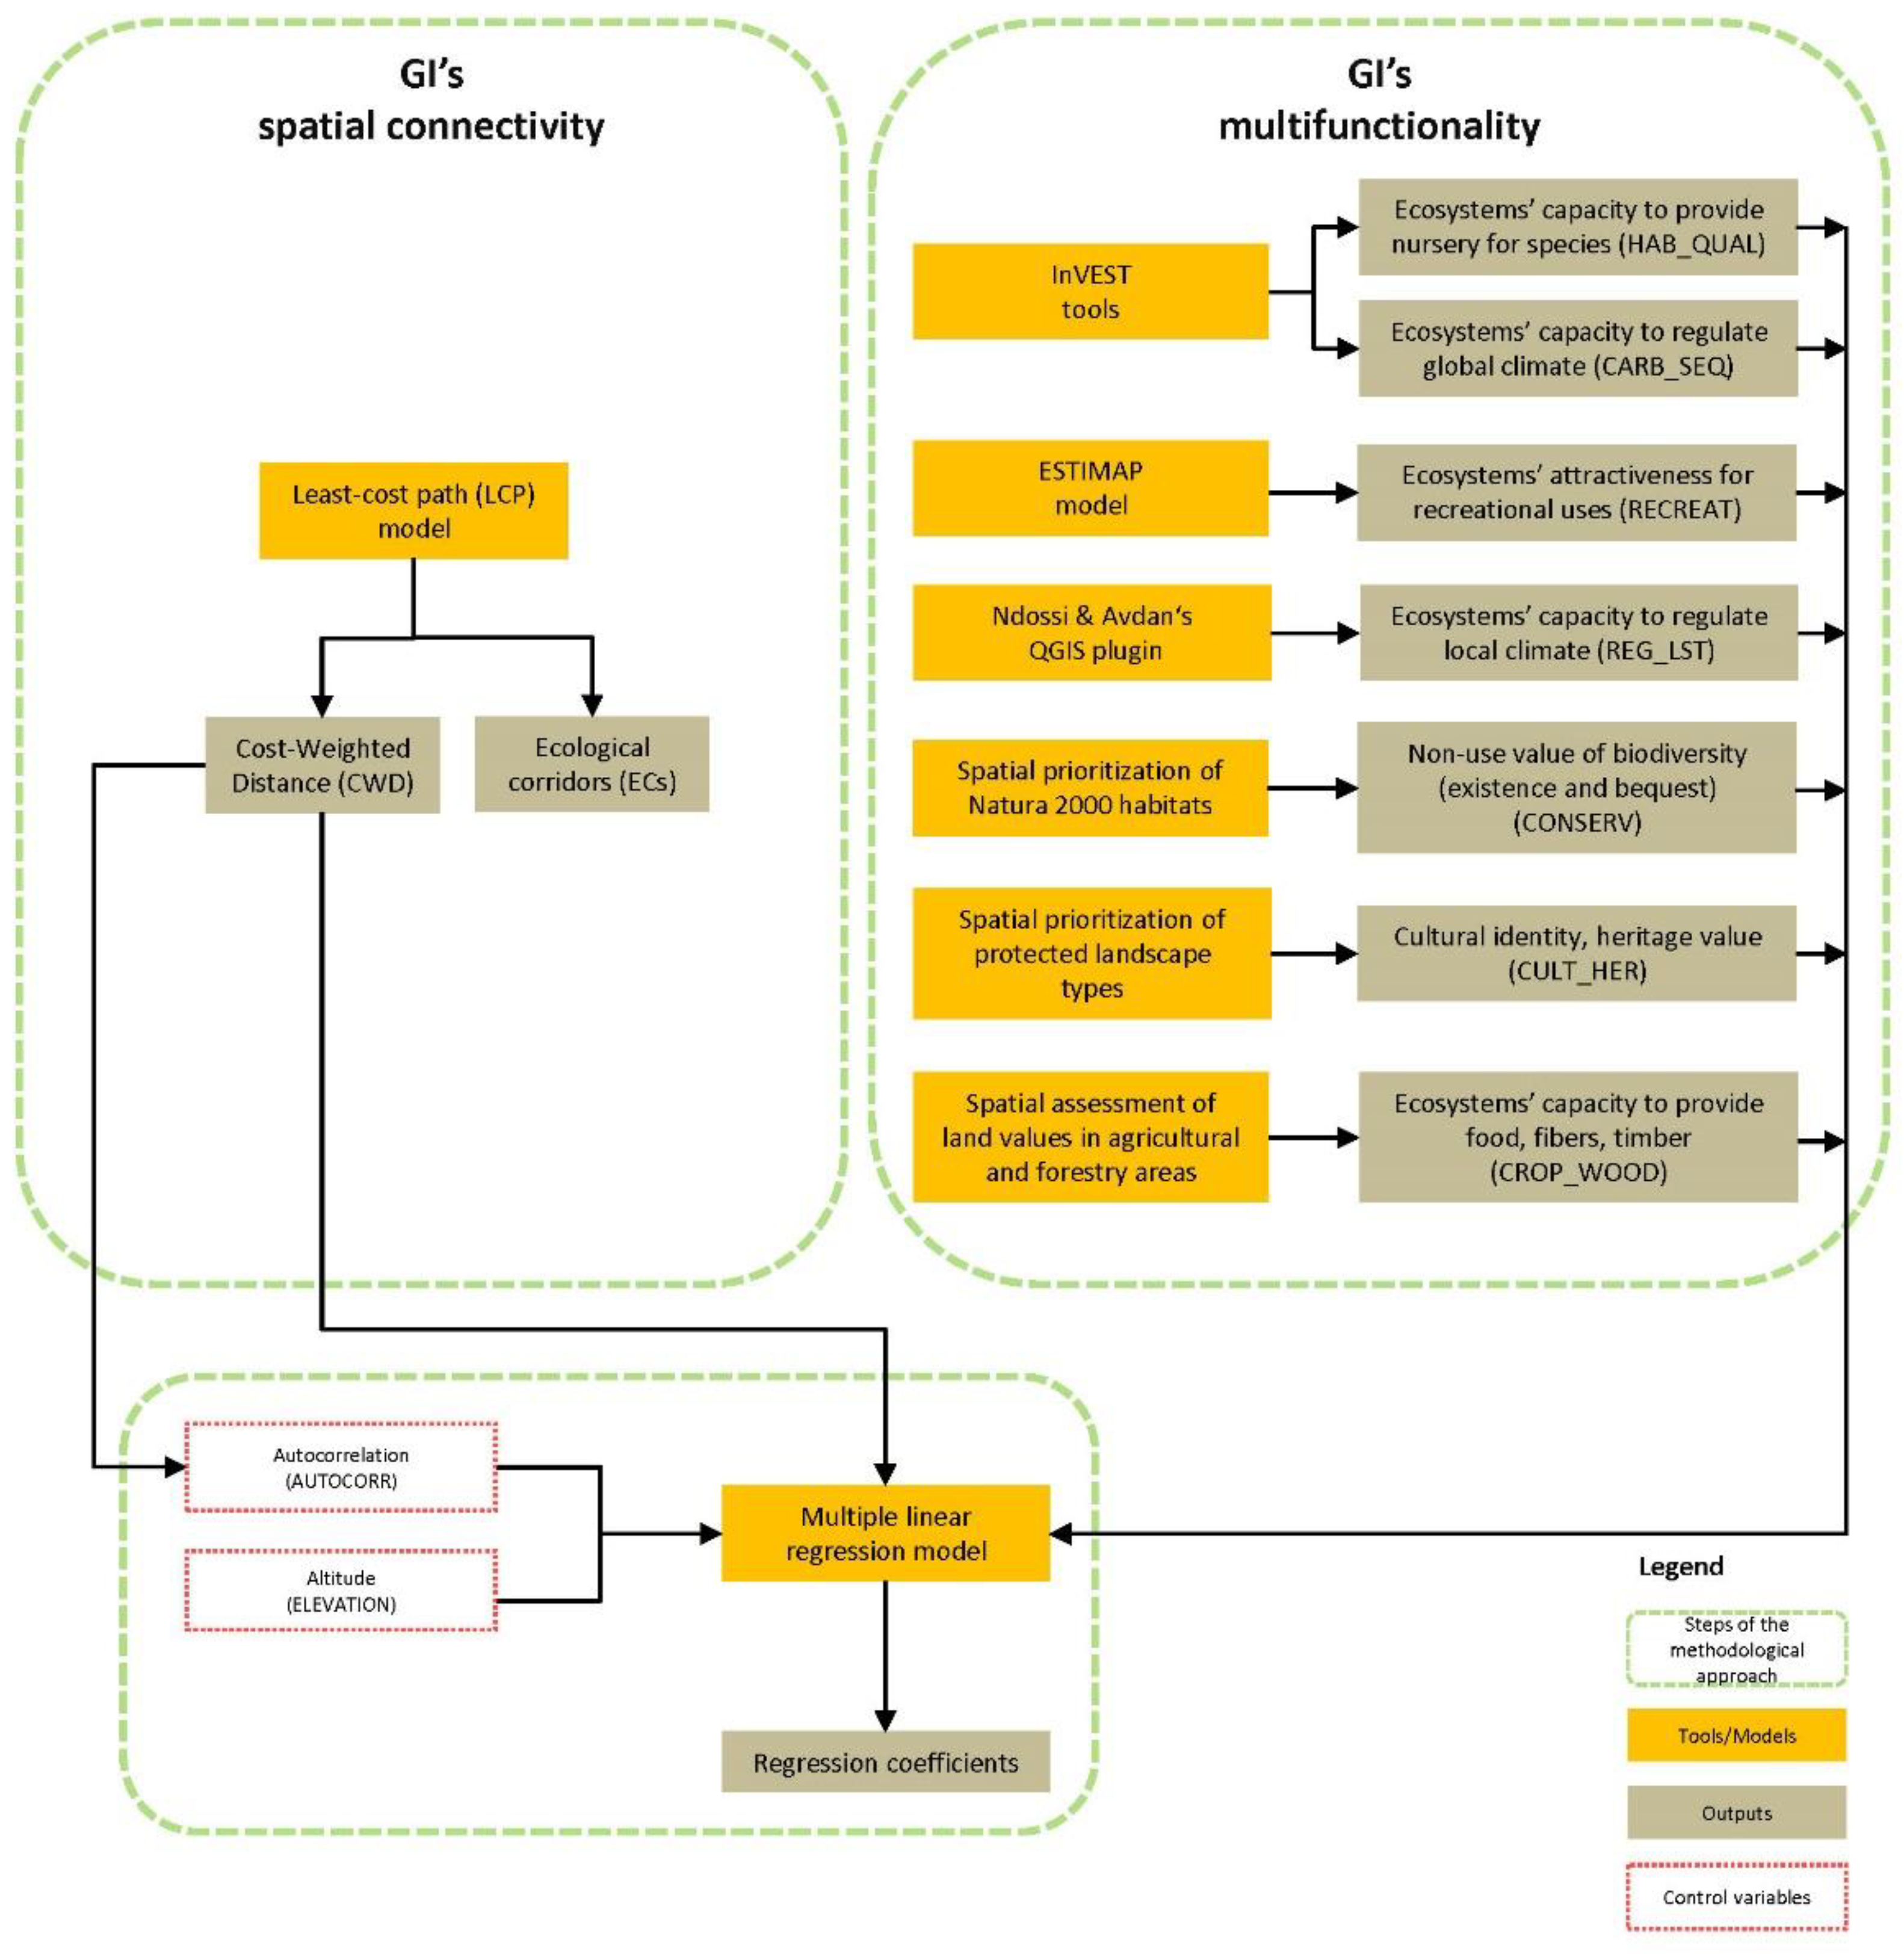
2.3. Methodological Approach

This section presents, in three subsections, the steps of the methodological approach. The first subsection is devoted to the analysis and mapping of the seven chosen ESs, on whose basis the multifunctionality of the RGI is assessed. The second subsection presents an approach that relies upon resistance maps to spatially identify the layout of ECs. For both of the first two subsections, the reader can refer to Isola et al. [28], chapters 2 and 3, respectively, for more details on the methodological approaches implemented to model the ESs and the ECs. Finally, the third subsection explains how the regression model was used here to unveil correlations between the RGI and the ECs was implemented.
A graphic representation of the methodological approach adopted in this study is provided in Figure 2.

2.3.1. Assessing GI’s Multifunctionality

For each selected ES, Table 1 lists the variable abbreviation and provides an overview of input data requirements, data sources, and available tools or conceptual models. An off-the-shelf set of tools developed by the Natural Capital Project is InVEST [29], which makes it possible to map both HAB_QUAL and CARB_SEQ by means of two tools, termed “Habitat quality” and “Carbon Storage and Sequestration”. Another ready-to-use tool used to assess REG_LST is a QGIS plugin [30] that makes it possible to map land surface temperature by using free and worldwide available satellite imagery as the only input data. A conceptual model to be tailored to the scope, aim, and scale of the assessment is ESTIMAP [31,32], one of whose outputs provides the spatial layout of areas showing different levels of potential suitability for nature-based recreation and is used here to map RECREAT. Concerning the other three ESs, the approach developed by Lai and Leone [33] was implemented to map both CONSERV and CULT_HER: as for CONSERV, its spatial assessment is grounded on qualitative and quantitative data concerning the Natura 2000 Sardinian network contained within the Standard Data Forms, i.e., on descriptive forms that are compulsory and standardized across the European Union [34] and within a monitoring report commissioned by the Sardinian Regional Government; as for CULT_HER, its assessment relies on the spatial dataset of landscape features protected under the Regional Landscape Plan (RLP) and on a qualitative score that reflects the protection level to which each feature is subject, under the assumption that the stricter planning provisions and restrictions correlate with higher supply of this ES. Finally, in the absence of detailed regional data (either biomass or market values) on agricultural crops and harvested wood production, CROP_WOOD was assessed based on the land value of agricultural and forestry areas, under the assumption that land values correlate with productivity [35].
For each selected ES, a raster map was produced with a spatial resolution of 300 m. Since each ES had its own unit of measurement and scale, unity-based normalization was performed to bring the values into the [0, 1] range to ensure homogeneity and comparability, where zero corresponds to the absence of ES provision, while 1 means that the ES is provided at the maximum level in Sardinia. For this reason, inversion of the scale was required in the case of REG_LST so that zero would correspond to the maximum temperature and one to the minimum.

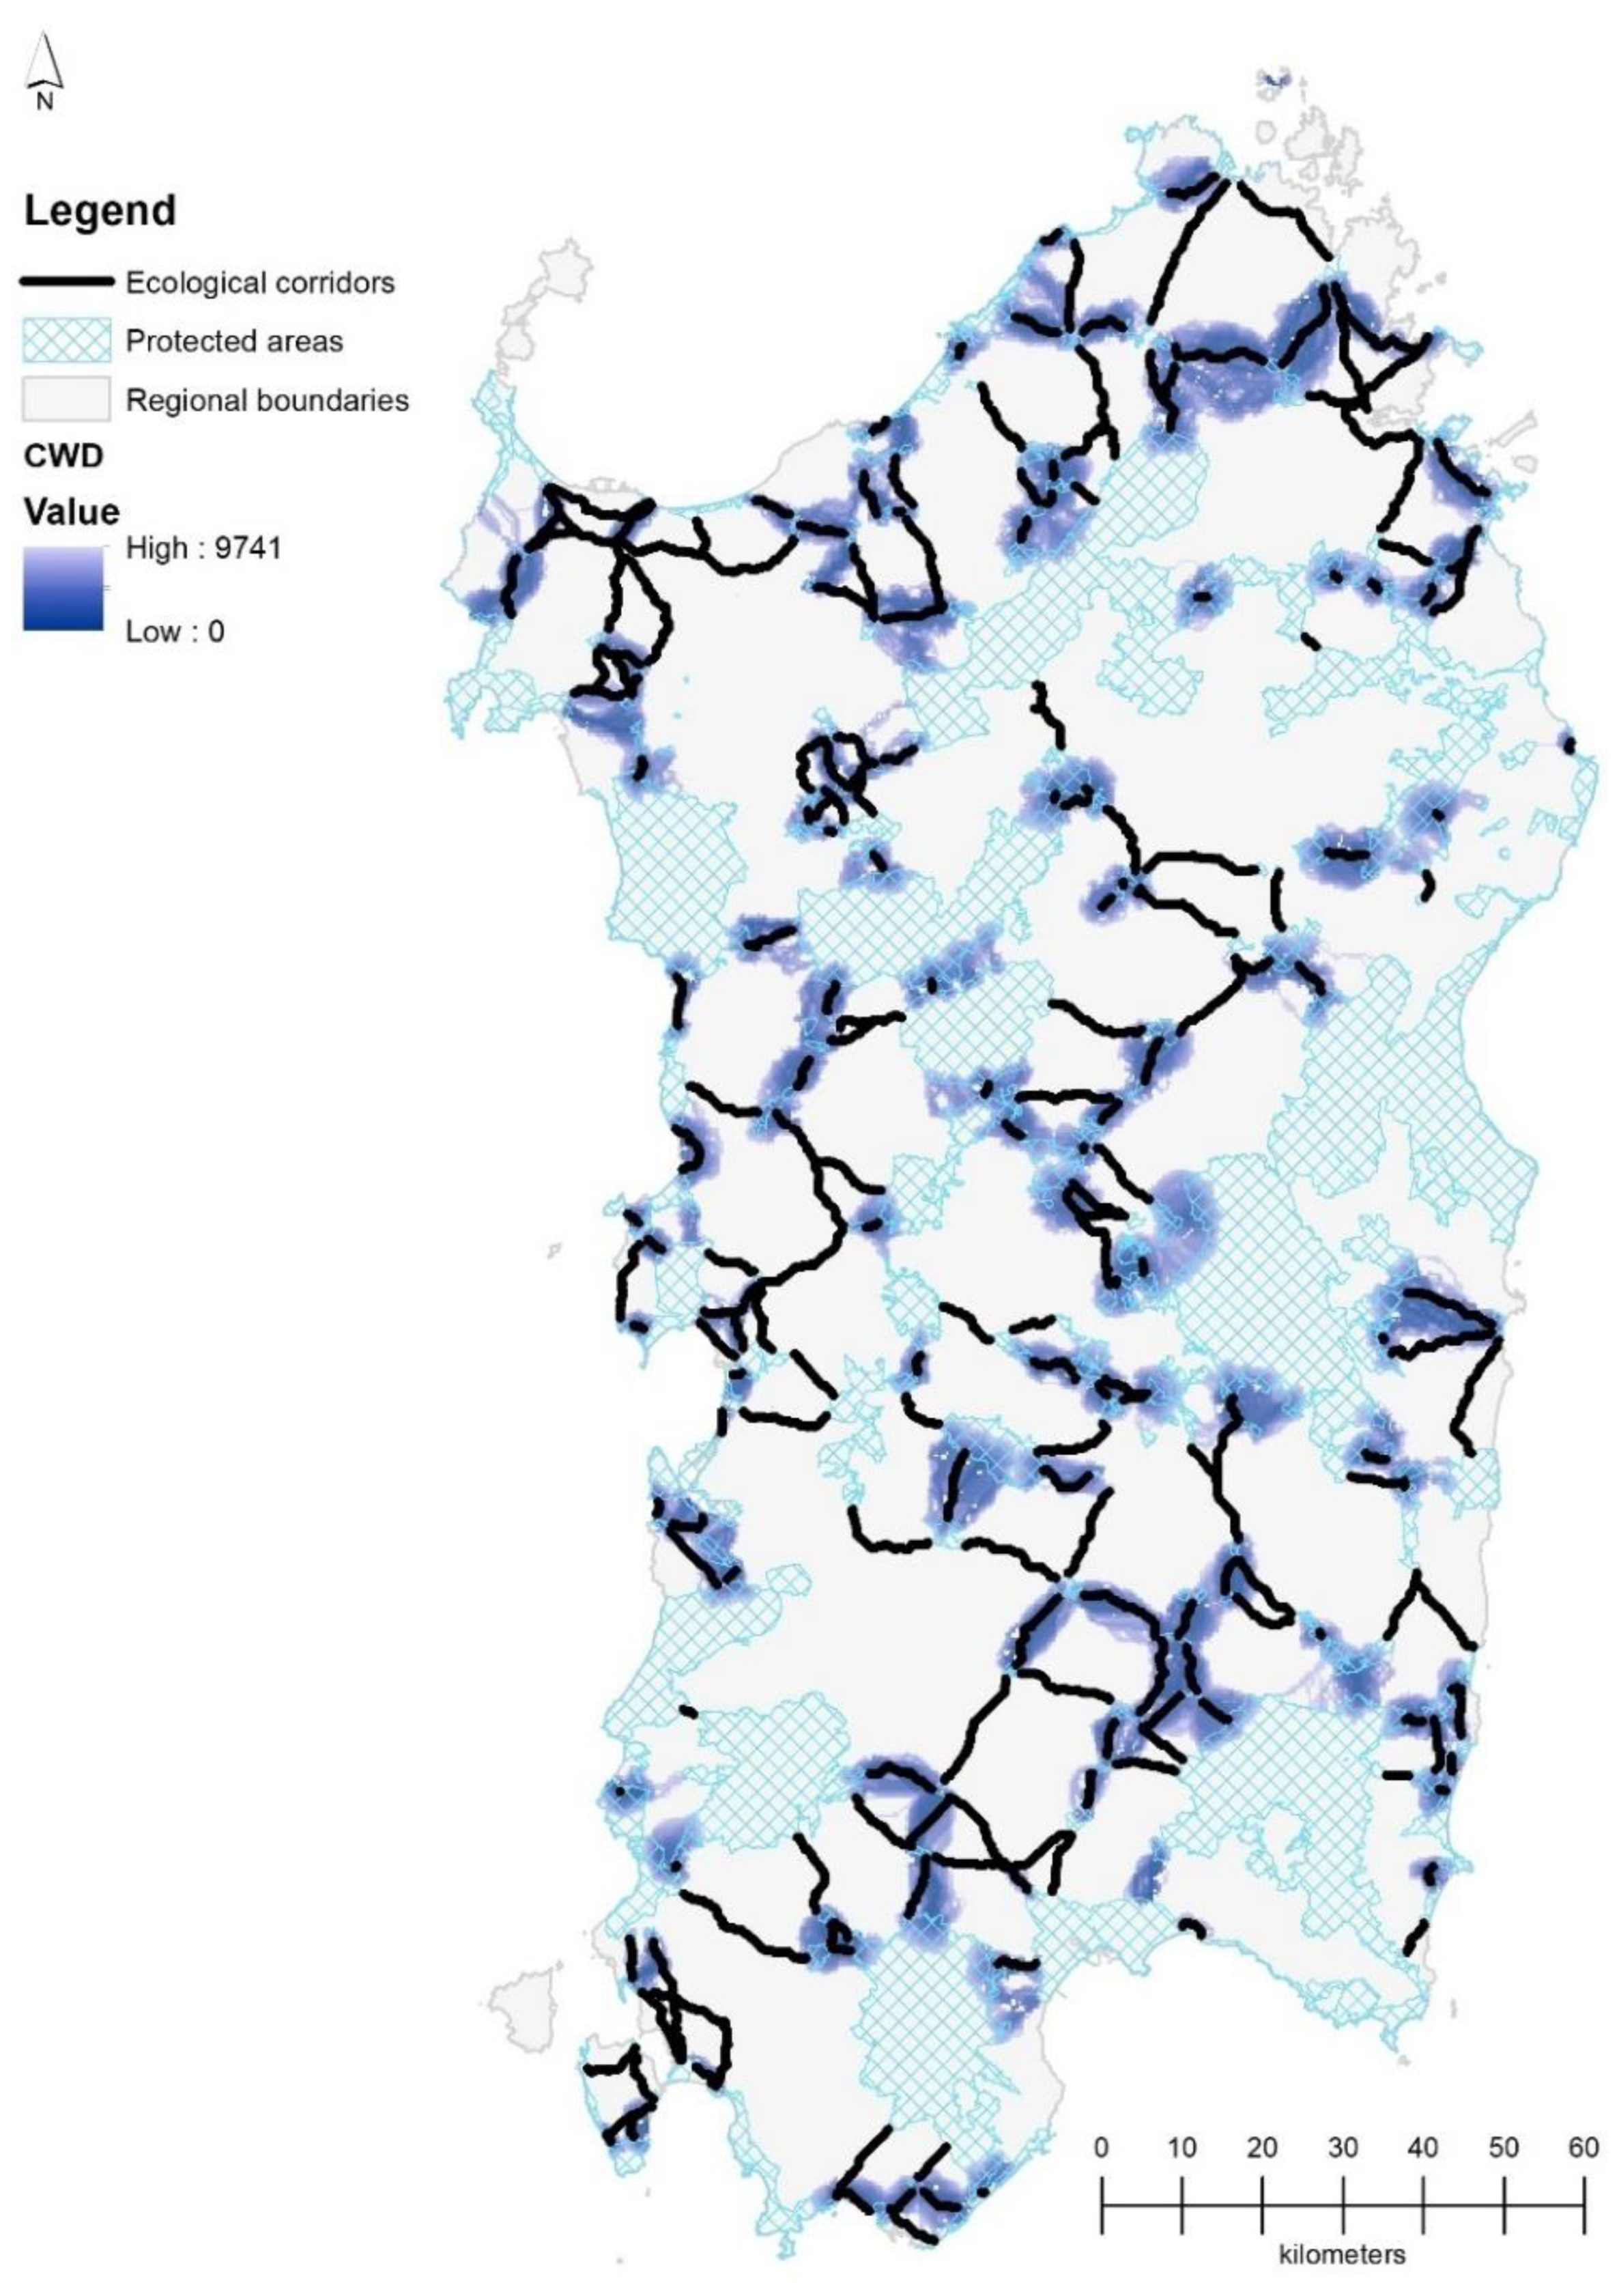
2.3.2. The Spatial Layout of the ECs

Widely used models to spatially assess connectivity between patches of land are those that map resistance, which “represents the willingness of an organism to cross a particular environment, the physiological cost of moving through a particular environment, the reduction in survival for the organism moving through a particular environment, or an integration of all these factors” [37] p. 778. Among these models, those based on the circuit theory [38] and on individual behavior [39] are the most complex because of the amount of required data and accuracy in their selection [40]. Therefore, least-cost-path (LCP) models are most often used to analyze spatial connectivity and to map ECs [41,42] as linear strips of patches having low resistance to the movement of animal species. The general axiom of the LCP approaches is that animals own an intrinsic comprehensive perception of the environment they live in, which allows them to choose the best way when moving [40].
The methodology implemented in this study to retrieve a connectivity map builds upon Cannas et al.’s approach [43,44,45,46] and develops through the following stages.
  • Identification of the regional spatial taxonomy of the habitat suitability.
  • Identification of the regional spatial taxonomy of the ecological integrity.
  • Identification of the regional spatial taxonomy of the resistance.
  • Identification of the ECs connecting the regional PAs.
In the first stage, a habitat suitability vector map is produced for the study area based on the probability that organisms use selected habitats located in the land parcels where they live and move. This map takes, as input data, the regional land cover map [47] together with a lookup table where each land cover is assigned, for each considered species, a score ranging in the 0–3 interval that represents its suitability to provide a suitable habitat for the species. Such scores are provided in a report [48] that is part of a regional biodiversity monitoring project assessing the conservation status of habitats and species located in Natura 2000 sites. The scores of the habitat suitability concerning the land cover classes belonging to the Natura 2000 network, reported in the study, are extended to the same classes located outside the network, and, in doing so, a vector spatial taxonomy of the habitat suitability is identified for the whole regional land.
In the second stage, Burkhard et al.’s method [49,50], where the landscape capacity to deliver various ESs is assessed through qualitative judgments from experts in the [0, 5] range, is applied to develop a vector map of ecological integrity. The basic connection between ecological integrity and spatial connectivity is that ecological integrity is positively correlated with an organism’s attitude to movement.
In the third stage, a resistance map is obtained following LaRue and Nielsen’s approach [51], which comprises four steps. First, the two vector maps representing habitat suitability and ecological integrity indices are converted into raster ones. Next, the two indices are inverted, and two inverted raster maps are produced. Afterward, the two inverted raster maps are rescaled in the [1,2,3,4,5,6,7,8,9,10,11,12,13,14,15,16,17,18,19,20,21,22,23,24,25,26,27,28,29,30,31,32,33,34,35,36,37,38,39,40,41,42,43,44,45,46,47,48,49,50,51,52,53,54,55,56,57,58,59,60,61,62,63,64,65,66,67,68,69,70,71,72,73,74,75,76,77,78,79,80,81,82,83,84,85,86,87,88,89,90,91,92,93,94,95,96,97,98,99,100] interval, following an approach proposed by the European Environment Agency [19], where the higher the value, the higher the resistance. Finally, the newly produced (i.e., inverted and rescaled) raster maps are summed through raster algebra to develop a total resistance map.
The total resistance map, together with the vector map of the regional PAs, feeds into the model to map ECs through the “Linkage Pathways” tool, part of the ArcMAP “Linkage Mapper” toolbox [52], which implements an LCP-related model whereby the Cost-Weighted Distance (CWD) is mapped [53]. The CWD between two elements of the PAs vector map is calculated as follows: (i) the average values of the resistance of couples of adjacent areal units along the connecting path are calculated; (ii) these values are multiplied times the Euclidean distance between their centers [54]; and (iii) such results are summed up across the patches of the path. The Linkage Pathways tool returns, as final outputs, a raster map representing the CWD and the spatial and linear configuration of the ECs.

2.3.3. A multiple Linear Regression to Identify How the ECs Relate to the ESs Provided by the RGI

The ECs detected through the Linkage Pathways tool overlay the RGI spatial layout, which builds on the seven ES typologies earlier defined. ECs include spatial units whose CWDs are lower than the second decile. The CWD of a spatial unit j, included in an EC, which connects two PAs labeled M and N, is identified as follows:
CWDj = CWDjM + CWDjN,
where CWDjM and CWDjN are the CWDs from spatial unit j to PAs M and N.
A regression model is implemented that estimates the marginal effects of variables representing the supply of ESs on the CWD of the spatial units overlaying ECs, i.e., whose CWDs feature values are lower than the second decile. These spatial units are considered the core patches of the RGI. The model takes the following form:
CWD = γ0 + γ1 CONSERV + γ2 HAB_QUAL + γ3 RECREAT + γ4 CULT_HER + γ5 CROP_WOOD +
γ6 REG_LST + γ7 CARB_SEQ + γ8 ELEVATION + γ9 AUTOCORR,
where dependent and independent variables come from the intersections of spatial units supplying ESs and the ECs, as follows.
  • CWD represents the cost-weighted distance of a spatial unit overlaying an EC.
  • CONSERV, HAB_QUAL, RECREAT, CULT_HER, CROP_WOOD, REG_LST, and CARB_SEQ are variables that lay in the [0, 1] interval, and that represent the potential provision of the ESs described in Section 2.
  • ELEVATION is a covariate that controls for the altitude of the spatial units overlaying the ECs, whose values are detected from a digital elevation model retrieved from the geoportal of the Sardinian region.
  • AUTOCORR is a control variable related to the spatial autocorrelation phenomenon.
The model provides the estimates of the marginal impacts of the explanatory variables on the CWD of the spatial units overlaying the ECs. The use of the regression model is motivated by the fact that no priors are identified with reference to the marginal effects on CWD of the covariates that represent the ESs, which feature the RGI [55,56,57,58]; that being so, the n-dimensional hypersurface that stands for the phenomenon at stake can be locally represented by its linear approximation, expressed by model (2) [59,60].
The covariate representing the elevation of patches identifies systematic differences in marginal effects related to altitude. The p-value related to the elevation coefficient allows to detect if its estimate is significant; if this is so, altitude is an important determinant of the size of the contribution of ESs provided by the spatial units of the RGI to the ECs detection.
The AUTOCORR variable controls for autocorrelation as a spatially lagged covariate; its identification is based on Anselin’s studies [61,62], as implemented by Zoppi and Lai [63], and computed through GeoDa [64].
Finally, the estimated coefficients of the explanatory variables allow to detect, through their p-values, if their estimates are significant, for instance, at 5%.

3. Results

This section provides the reader with the results of this study, structured into three subsections. First, the spatial taxonomies of the supply of the seven ESs are described as a basis for the Sardinian RGI, and their outstanding features are highlighted. Next, the ECs are identified as connections between the Sardinian PAs. Finally, the results of the estimates of model (2) are reported; these identify a hierarchy in the relevance of different ESs as regards their contribution to the inclusion of patches in the ECs’ spatial system.

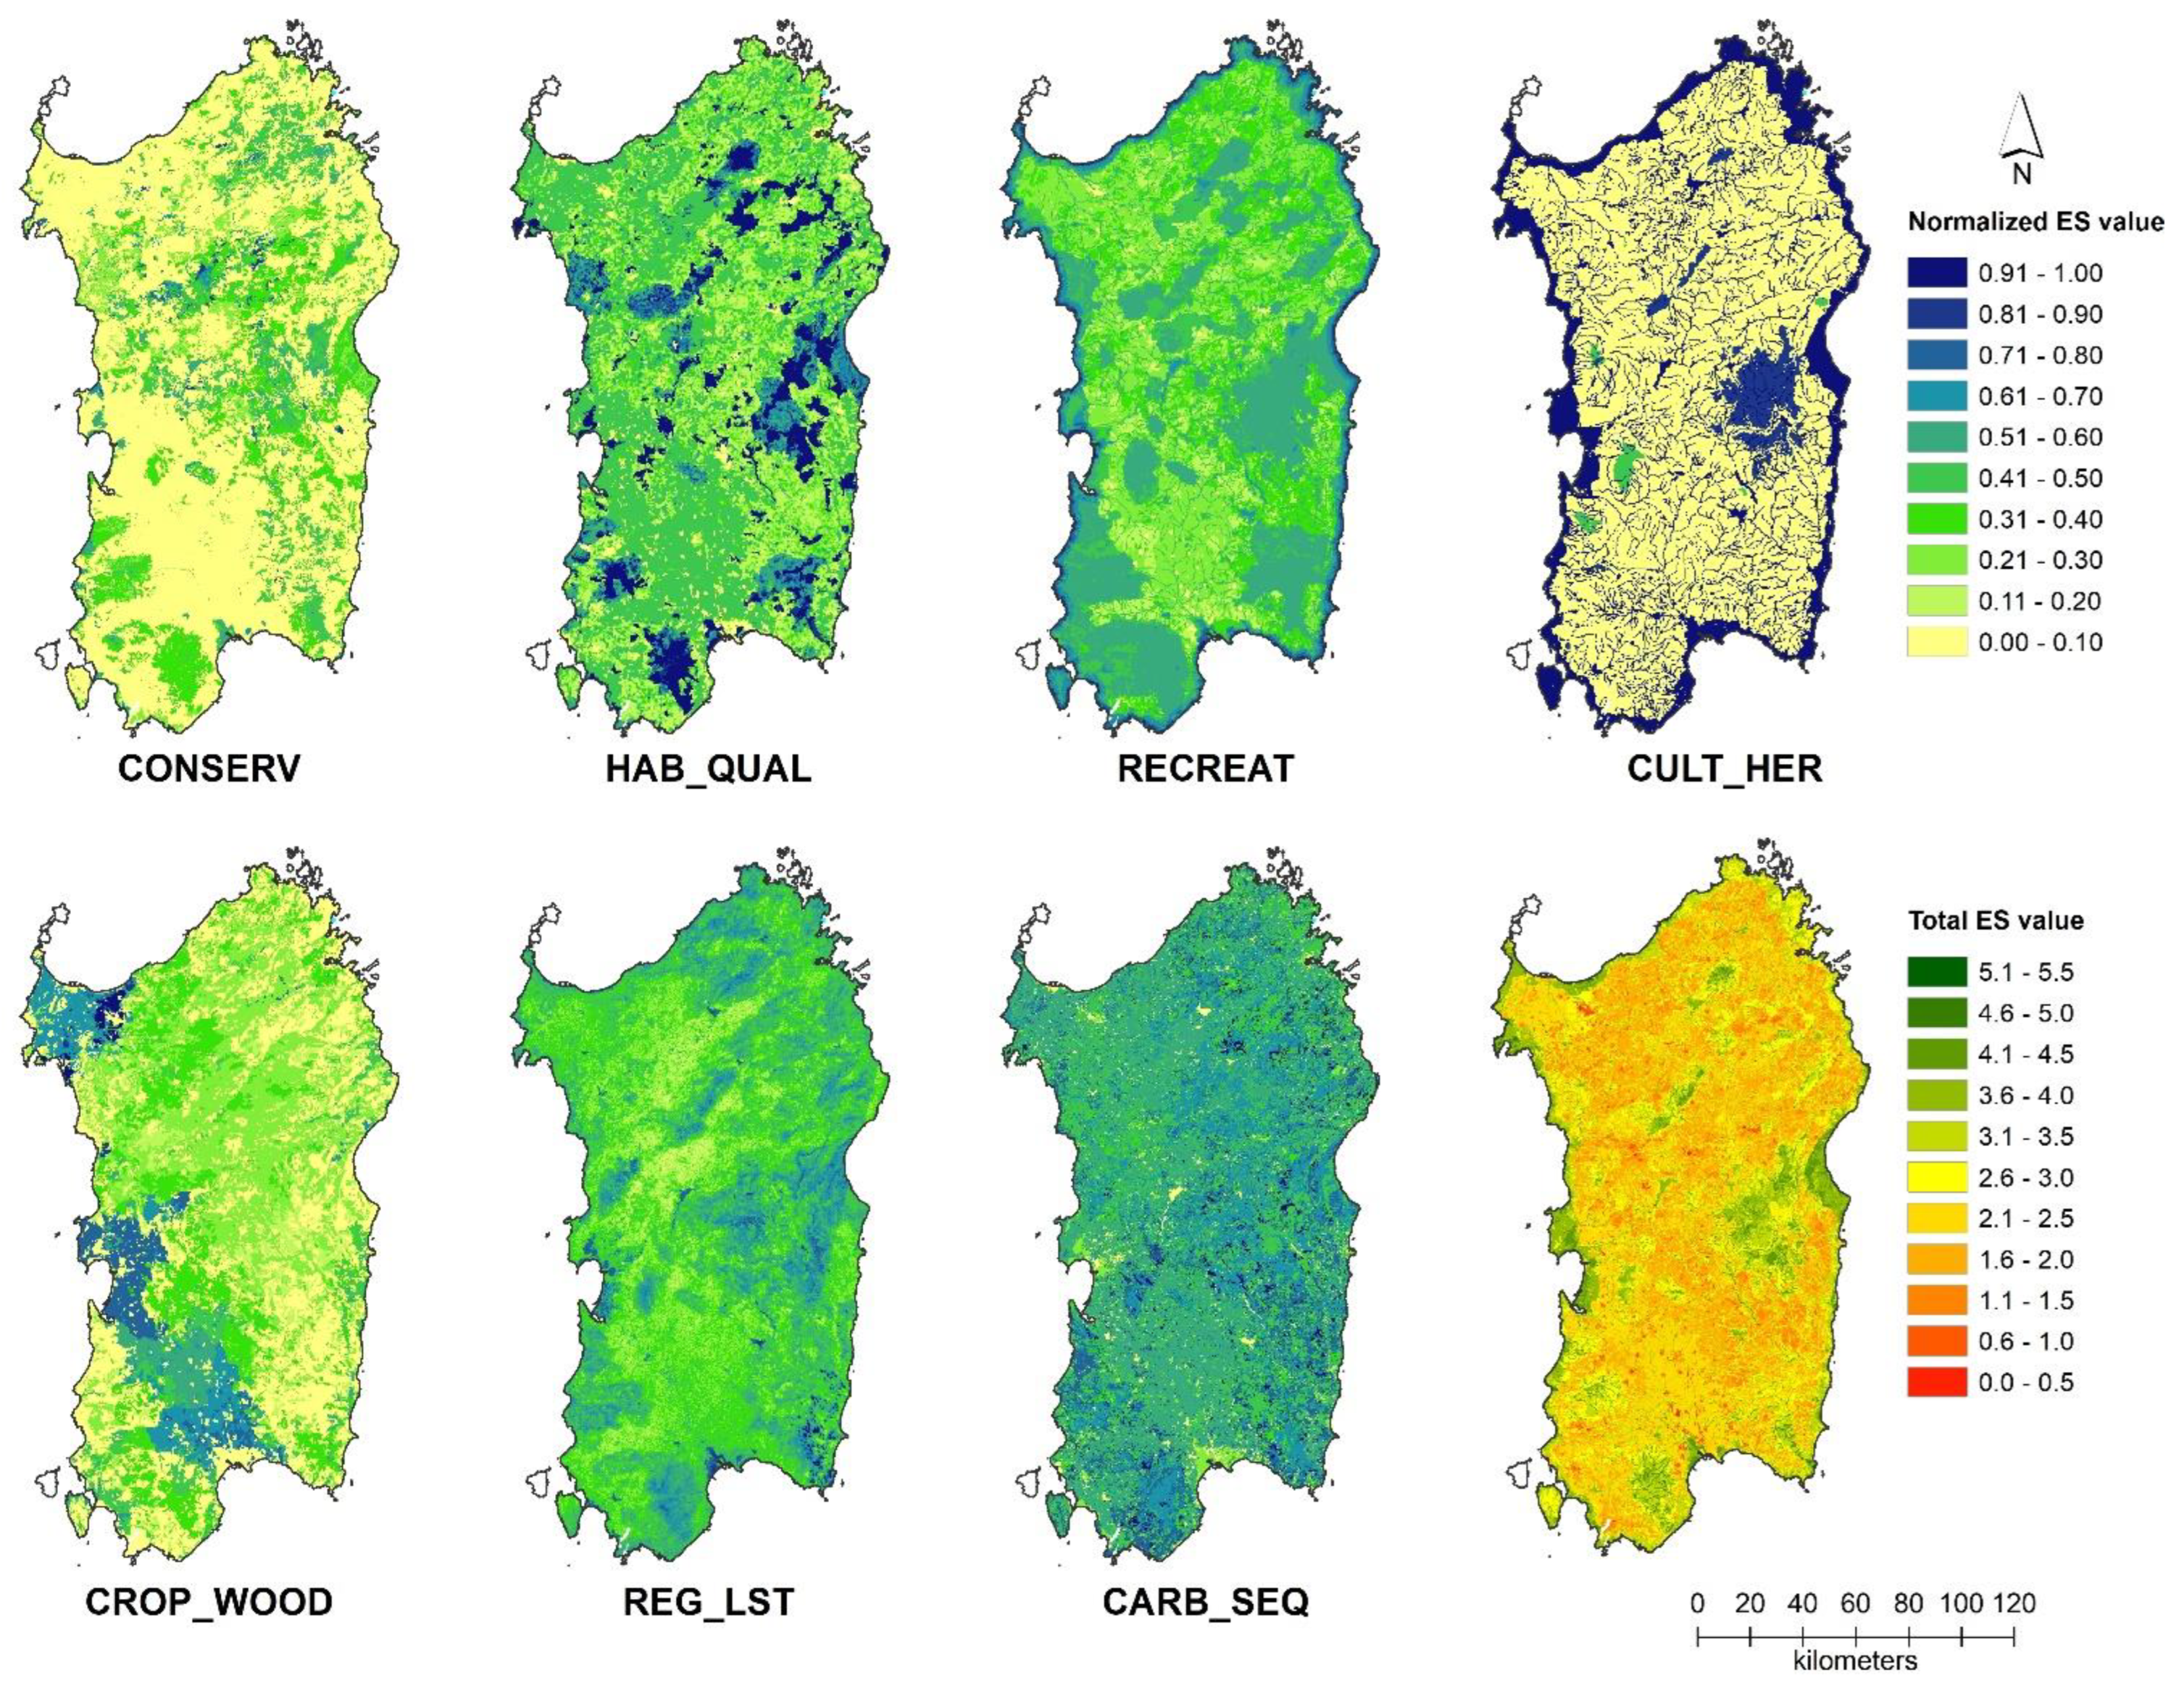
3.1. The Spatial Assessment of the Potential Delivery of Ecosystem Services

Figure 3 shows the spatial distribution of the seven values listed in Section 2.2 (i.e., CONSERV, HAB_QUAL, RECREAT, CULT_HER, CROP_WOOD, REG_LST, CARB_SEQ) and modeled as per Section 2.3.1. A further map, obtained by summing up the seven values, is also provided.
CONSERV takes null values in almost two-thirds of the regional land, while the highest values are mostly clustered within areas belonging to the regional Natura 2000 network and in their proximity. This is consistent with expectations since CONSERV accounts for endangered habitats and areas that are relevant for conservation purposes, including habitats of community interest and Natura 2000 sites. Only a small percentage of the island (0.90%) has values higher than 0.75; 4.95% have values between 0.50 and 0.75, and 27.80% have values below 0.50.
HAB_QUAL equals zero in only 3.44% of the island land mass; 35.51% hosts low-quality habitats (HAB_QUAL ≤ 0.33), 62.45% middle-quality habitats (0.33 < HAB_QUAL ≤ 0.66), while 13.8% hosts high-quality habitats (0.66 < HAB_QUAL ≤ 1). The highest values can be found either within national or regional PAs or in areas occupied by forests and woodlands.
As for RECREAT, around 49.5% of the island takes low values (RECREAT ≤ 0.33), and around 44.75% takes mid values (0.33 < RECREAT ≤ 0.66), while only the remaining 5.75% takes very high values (0.66 < RECREAT ≤ 1). Null values concern only a tiny fraction of the regional land mass. As for its spatial layout, RECREAT shares some common traits with HAB_QUAL, but, contrary to the latter, it is characterized by its distinctively large values across coastal areas.
CULT_HER is null in over 60% of the island’s land mass. The highest values are usually associated with the following three landscape goods, protected against land transformation and development under the provisions of the landscaper plan in force: “Coastal strip” (clearly visible along the coastline in Figure 3), “Lakes, reservoirs, wetlands and their 300-m buffers”, and “(listed) Rivers, creeks and their 150-m buffers” (also clearly visible in Figure 3).
CROP_WOOD equals zero in approximately a third of the region; low values (lower than 0.33) dominate in nearly a half of the island, with less than 5% taking high values, i.e., over 0.66. As Figure 3 shows, the latter is remarkably clustered along the two main plains: Nurra to the north, and Campidano, which stretches from the mid-west to the south.
REG_LST takes low values (lower than 0.33) in nearly 40% of the island; because REG_LST is a value that represents the ecosystems’ capacity to regulate micro and regional climate through the mitigation of land surface temperature, low values of REG_LST are associated with hot land surface temperatures. Less than 2% of the regional land mass takes high values of REG_LST, while mid-normalized values concern nearly 60% of the island. No real clusters emerge, here: the small, dark blue spots on the map generally correspond to lakes and wetlands, while lighter shades of blue in general correspond to mountain chains and peaks.
As for CARB_SEQ, a mere 4.8% have low values (0 < CARB_SEQ ≤ 0.33), while the large majority, i.e., about 74.4%, have mid values (0.33 < CARB_SEQ ≤ 0.66), and around 18.6% have high values (0.66 < CARB_SEQ ≤ 1), which leaves the remaining 2.2% with null values. Low values are usually found either in artificial land covers or in water courses.
A basic assessment of multifunctionality can be carried out by calculating the multiple ecosystem services landscape index (MESLI) [65,66], whose spatial distribution is provided in the eightieth map in Figure 3. This index is simply calculated as the sum of the seven selected values; since each value varies between zero and one, the MESLI can, in principle, range in the [0, 7] interval. The underlying assumption here is that the higher the index, the higher the ES multifunctionality; this is actually a simplification since large values of the index could be due to either the high supply of a few ESs or to the low supply of a larger number of ESs. However, the map can provide an expeditive tool to highlight the areas that, in principle, are more multifunctional and should, therefore, deserve to be included in a GI

3.2. The Spatial Layout of the Network of Ecological Corridors

The taxonomy of CWD and the spatial plot of the ECs that connect the Sardinian regional PAs are the outcomes generated by the methodology implemented in the previous section.
Such outcomes show 240 ECs, detected through spatial units identified by CWDs lower than the second decile, whose length is included in the 0.07–27.34-km interval (Figure 4).

3.3. The Regression Outcomes

The results of the implemented regression model display the marginal impacts of the provision of the seven types of ESs on the CWD of the spatial units overlaying the ECs (Table 2), and, in so doing, an ESs hierarchy is identified on the basis of the size of their contribution to boost the connection capacity within the ECs regional network.
The estimate of the coefficient of the elevation-related variable is significant in terms of the p-value, and it shows a positive marginal effect. Therefore, it can be stated that the higher the elevation, the higher the CWD of patches belonging to ECs. On average, an increase of 100 m in altitude implies an increase of about 1% in CWD.
The spatially lagged variable AUTOCORR, which accounts for the spatial autocorrelation phenomenon, shows a positive and significant value as well, which indicates that CWD is positively influenced by autocorrelation or that autocorrelation has a negative impact on the performance of patches in terms of their eligibility to be included in ECs.
All in all, the estimates of the two control variables’ coefficients are significant, and they highlight negative effects on the patches’ performance.
That being so, the analysis of the estimated coefficients concerning the other covariates can be straightforwardly enacted, and, therefore, the size of the impact of each of the seven types of ESs on the CWD of spatial units included in the ECs’ regional network was easily identified. Moreover, the p-values of the estimated coefficients are always significant at 5%, which gives strength to the assessment of the model estimates.
Three ES types show negative effects, i.e., their increase is associated with a decrease in CWD and, thus, with an increase in the connection potential of ECs. The corresponding variables are REG_LST, CROP_WOOD, and CULT_HER. REG_LST reveals the largest effect, with an average decline in CWD of 7.7‰ related to a 10% increase in REG_LST, while the corresponding increases in CROP_WOOD and CULT_HER are associated with a 1.6‰ and a 1.8‰ decline in CWD, respectively.
Furthermore, CONSERV, HAB_QUAL, RECREAT, and CARB_SEQ reveal positive impacts since a 10% growth in the covariates is correlated to 3.8‰, 8.4‰, 3.5‰, and 5.2‰ increases, respectively.
As a consequence, the estimated model shows that the ESs, whose provision is associated with their capacity to host plants and wildlife (CONSERV and HAB_QUAL), of supplying recreational and leisure time-related infrastructure and services (RECREAT) and of capturing and storing carbon dioxide (CARB_SEQ), are the most challenging when dealing with the identification of ECs within the Sardinian regional context, whereas mitigation of land surface temperature (REG_LST), crop and forest production (CROP_WOOD), and landscape heritage (CULT_HER) are the most functional ESs to drive connections within the spatial network of the Sardinian PAs.

4. Discussion

The results from the regression models point to three values, i.e., REG_LST, CROP_WOOD, and CULT_HER, as the prominent factors that affect the suitability of a parcel of land to be included within an EC.
As for the first, i.e., REG_LST, lower values correlate with diminishing CWD, which can be explained by looking at farmland areas. Agricultural land uses can hamper species’ movement across ECs, hence hindering connectivity [67], mainly because of the widespread use of boundary walls and artificial fences [68], but also due to farming techniques that are neither soil-friendly nor species-friendly, such as tillage, which alters the physical characteristics of soils [69], or the use of fire to clean the fields once the crop is yielded [70], or improper application of chemicals, including biocides and fertilizers [67,71]. Furthermore, as argued by Lai et al. [72], REG_LST can be negatively affected by farming activities as these can hamper the cooling effect generated by air circulation and evapotranspiration in the case of dense and thick low vegetation [73].
As with REG_LST, CROP_WOOD is also affected by agricultural uses and farming practices, which, again, can hinder species’ movement. It is pretty intuitive that connectivity decreases when agricultural potential productivity (which depends both on locational characteristics, first and foremost, elevation and soil type, and on crop type) increases, for the very same reasons highlighted with reference to the relationship between CWD and REG_LST. On the contrary, connectivity is positively influenced by forests and woodlands, as shown by lower CWD in wooded land covers. Following Santos et al. [74], land cover changes in forest areas are prominent drivers of habitat loss for a number of species due to reduction in patch sizes and increase in landscape fragmentation, which result in lower variety and population numbers of species that can survive [75]. Moreover, small forest-covered patches may seem irrelevant in terms of connectivity; however, they do play a key role in connecting remote and isolated patches [76], and additionally, small forest-covered patches can work as stepping stones to foster species movement [77] and as fundamental habitats for some species [76], as shown in the case of the Stołowe Mountains National Park, where a staggering 40% of epiphytic bryophytes are hosted by broadleaved forest-covered patches, although these account for less than 5% of the area [78].
Concerning CULT_HER, the outcomes of the regression model revealed that the higher the CULT_HER, the lower the CWD. It is worth underlining that CULT_HER is assessed based upon landscape assets protected under the provisions of the Sardinian RLP, and the values of the corresponding covariate are identified with reference to the restrictions in force, in such a way that the stricter the rules, the higher the CULT_HER values are. The Italian Code on cultural heritage and landscape (Law enacted by decree no. 2004/42) defines landscape assets as buildings and areas that are expressions of the historical, cultural, natural, morphological, and aesthetic values of a spatial context. In relation to environmental assets, which are a type of landscape assets, the highest values are associated with water courses and their 150-m buffers, as well as with natural lakes, artificial water basins, and wetlands together with their 300-m buffers. According to article no. 20 of the RLP implementation code, any transformation is generally precluded in non-urbanized areas within the coastal strips. According to article no. 25 of the RLP implementation code, within the spatial system that includes rivers and their surroundings, the following operations are prohibited: (i) anthropic interventions on riverbeds and banks, including riparian vegetation removal; (ii) reforestation with non-native species; and (iii) river sand sampling and substitution in the absence of specific projects that demonstrate the compatibility of regeneration. Furthermore, the connectivity function performed by water courses, one of the most common types of landscape assets across the island, is well established in the literature: though riparian vegetation, an umbrella term for several plant species that grow along the riverbanks and stretch into the floodplain, water courses offer shelter and suitable reproduction habitats for many species [79], as well as nourishment and water [80]. Riparian vegetation, therefore, represents, per se, a suitable EC for many species, among which are not only fish but also birds, amphibians, and reptiles [79]. On the other hand, the role of riparian formations in terms of species movement can be hindered by human-induced activities and geomorphological conditions [81].
By shedding light on how the potential supply of ESs impacts the suitability of land patches to belong to EC, taken as the branches of a GI, this study contributes to the recent academic debates on the relationship between connectivity and multifunctionality of a GI with a novel perspective. Thus far, studies have investigated such interaction using two broad approaches. The first takes connectivity as a driver of direct or indirect impacts on the supply of ES, and it focuses on investigating how fragmentation and decreased connectivity degrade natural capital, in turn, affecting ES provision [20,21,82]. This group of studies posits that ES provision depends on the spatial interaction between patches [83] and that such dependency is complex when looking at multiple ESs, not only because of the synergies and trade-offs among the services but also because, rather counterintuitively, fragmentation and patch interspersion can positively affect the flow of some ESs by making nature more accessible to ES beneficiaries; that is, human beings; this holds especially as far as recreational, and provisioning services are concerned [82]. The second approach attempts to integrate the concept of multifunctionality within either circuit models or LCP models in two different ways: either by considering patches that simultaneously provide multiple ESs as nodes of the graphs [84,85] or by regarding areas rich in wildlife as nodes and identifying branches, hence corridors, as linear aggregations of patches that simultaneously provide multiple ESs [86,87,88]. The approach taken in this study is, in our view, novel because, although it assumes that a causal relationship exists between connectivity and multifunctionality, as the first approach does, it changes the direction of the relationship by regarding connectivity as a function of variables that represent multifunctionality to explain the causal relationship. Moreover, and differently to the second approach, the identification of the ecological corridors and the spatial assessment of selected ESs are carried out independently of each other, which is a prerequisite if causal relationships are to be analyzed through the regression model.

5. Conclusions

In this section, some suggestions for planners and policymakers are offered, drawing upon the outcomes of the model and their discussion through the lens of the extant literature. Such suggestions aim to improve the suitability of land parcels to be included within a GI by focusing on the three aspects discussed in the previous section (i.e., mitigating land surface temperature, increasing forest and woodland in size, improving the protection regime of landscape assets), which have been found to be key to strengthening the EC network.
Following Lai et al. [89], whose study concerns the Sardinian region, land surface temperature can be lowered, and, therefore, the REG_LST variable used in this study can be increased in value through regional afforestation policies.
Moreover, since heat waves and islands characterize urbanized areas, especially the consolidated fabrics of urban centers, policies aimed at decreasing air temperature should be based on targeting urban contexts at the micro-scale level. Urban greening measures, aimed at increasing existing green areas and setting up new ones, planting rows of trees and urban woodland, are the most successful in order to mitigate climate change impacts related to LST on urban areas [90,91,92].
An outstanding paragon of the implementation of such policies is offered by the London Green Grid, which counters a 3 °C increase in average temperature in the London area [93], which drives sensible decreases in the urban life quality and health conditions and water supply, and increases in focuses of insect- and vermin-related infections, and drought-affected open-spaces and urban parks. Green grids, facades, and walls are the most effective planning measures that characterize the implementation of the London Green Grid conceptual approach into the East London Green Grid, which entails a dense tissue of blue and green paths that feature city landscapes where densely-built areas, sealed land, and hub centers used by commuters are intertwined with the Green Belt and Thames green and blue infrastructures [94].
The increased supply of ecosystem services that mitigate heat island and wave phenomena improves the quality of urban life [95]. These measures implement a number of planning policies that may boost virtuous approaches on behalf of urban communities, organized citizen groups, building enterprises, and public administrations [96]. An important issue is connected to the narrow relation between the price of the urban land and the buildable volume size, be it for new houses or service buildings. That being so, since targeting urban areas for greening-oriented interventions, be they enlarged existing ones or newly vegetated, implies a significant decline in their property values, the implementation of such planning policies should entail the establishment of compensatory measures concerning the landowners’ loss of value generated by the local administration pursuing sustainability-oriented goals concerning urban heat waves and islands. Steady building rules should state that newly-built settlements or existing ones should be endowed with an appropriate amount of green spaces, which may possibly be complemented with green facades and roofs or with blue and green lanes, as has happened as regards the Green Grid of East London [97,98]. Moreover, due to the outstanding relevance of the availability of financial resources, a scheme of allowances should be designed aimed at increasing the number of green elevations and rooftops and blue and green lanes in new and existing developments, which would make such settlements more interesting to building enterprises [99,100]. Such incentives could consist of discounts on impact fees, and taxes on property and value-added, and allowances granted to building entrepreneurs to enhance the quality of the local environment [101,102]. Lastly, the implementation of infrastructures such as blue and green lanes, green roofs and facades, etc., would drive attention and consensus, on behalf of the local communities, to the local administrations’ positive attitude towards environmental quality and landscape protection [103,104].
Afforestation policies should target not only urban areas but also non-artificial ones; in Sardinia, where agriculture is generally associated with the highest temperature values in non-urbanized areas; this entails targeting rural, farmland areas. Moreover, the implementation of afforestation policies in rural areas would also be beneficial as far as CROP_WOOD is concerned, as shown by the coefficient of the regression model related to this variable. Therefore, implementing afforestation actions would feed two birds with one scone, as it can significantly improve an RGI by contributing to both the regulation of micro and regional climate and providing wood, fibers, and other materials retrievable from sustainably managed forests.
In rural areas, this would entail supporting land cover transition processes from agriculture to forestry, which have been studied by Ryan and O’Donoghue [105], who analyze the social and economic factors that feature such processes. From this perspective, a relevant opposite role is played by the social and cultural ties between farmers and their agricultural land [106]. Such a relationship is grounded on their familiarity with the flexible and low-pressure practices that characterize crop production [107] and with their historically consolidated farming know-how, which often acts as a substitute for the increase in income that can come from transitioning towards forestry production [105]. Moreover, land-cover change from agriculture to forestry is feasible in the case it concerns extensive, low-rent cropland, while afforestation is almost unfeasible with reference to intensively cultivated, highly profitable arable land [108]. In the case of processes related to extensive agriculture, afforestation should be encouraged by financial resources made available in order to cover transition and retraining costs [109].
When dealing with transition policies concerning afforestation related to cropland, the issue of the weakening of rural areas should be carefully assessed since afforestation implies a net decrease in the presence of farmers and, as a consequence, a potential social and cultural deterioration of rural environments [110]. Another relevant question is represented by the need for a careful assessment of the affordability of the public investment entailed by the implementation of afforestation policies in order to identify the optimal land-cover change size [111].
Although not as important as low land surface temperature and high forestry activities, a third factor that has been found to be relevant in this study to improve an RGI by strengthening ECs that connect core areas is the endowment of landscape-protected goods and assets. In the Sardinian case, such goods and assets can be natural features (such as the coastal strip or the riverine network) or artifacts (such as archaeological sites); for both, the RLP mandates that transformations be restricted, if not totally forbidden. Thus, decision-makers have two main tools at their disposal to increase the value of CULT_HER: one possibility would rely on making landscape protection policies even stricter than they currently are by increasing the levels of restrictions for those landscape features and goods that are already protected within the RLP; a second possibility would, instead, entail increasing the protection scope of the RLP by including further categories of landscape features to be protected, in the future, through the RLP provisions. This second direction can, in principle, be very powerful if linear landscape elements can effectively act as corridors, and are treated as landscape assets and goods to be protected. For instance, vegetated edges along agricultural plots or tree lines along linear infrastructures can foster connectivity [112], as well as enable landscape heterogeneity and, as a consequence, can support larger varieties of species [113,114,115], and facilitate their movement, especially as far as small animals are concerned [116]. Policymakers are, therefore, recommended to include such landscape elements, widely treated as cultural and identity features [117,118], among the goods and assets to be protected against land transformation and to encourage their inclusion in new developments.
In this study, we have implemented an integrated and flexible methodology that can be readily applied and tailored to other local contexts. Elements that can be adjusted to account for data availability and scholars’ expertise, or even for local needs and legal frameworks, include but are not limited to, the scores that were here used the build the resistance map or the taxonomy of core areas to be connected through the ECs, or the choice of ESs to be considered to assess multifunctionality, or the selection of models that were implemented here to map the selected ESs.
Finally, the limitations of this study that should be taken into account in directions for future research concern the validation of the data in relation to both REG_LST and REC-REAT. The spatial layout of LST could not be compared with real data. Therefore, direct and in situ observations would be needed to validate the baseline dataset concerning LST. On the one hand, in relation to the in situ observations, continuous and effective monitoring of LST values is unattainable due to the inhomogeneity in the spatial distribution of the measurement sites and the inaccuracy of the model simulations [119]. On the other hand, remote sensing approaches are characterized by significant uncertainty due to atmospheric effects in terms of attenuation and emissions and the inhomogeneity of land surface emissivity [120]. The absence of a validated dataset risks jeopardizing the possibility of implementing planning policies aimed at influencing LST values. In relation to the RECREAT variable, the model estimates the potential supply of natural recreational services; therefore, as with REG_LST, a comparison with direct and in situ observations would be worthwhile to validate the dataset by looking at the effective use of recreational services. Moreover, the methodological approach used to identify ECs does not take into consideration physical (either artificial or natural) barriers to movement, such as roads, railways, and rivers. Further research is hence needed to evaluate and adjust the ECs; in this regard, a possible approach is that by Wu et al. [41], who use remote sensing to adjust the EC layout by overlaying the potential ecological corridors with fragmenting elements, such as roads and human settlements.

Author Contributions

F.I., S.L., F.L. and C.Z. collaboratively designed this study, and jointly wrote the introduction. Individual contributions are as follows: S.L.: Section 2.1, Section 2.2, Section 2.3.1 and Section 3.1. F.I. and F.L.: Section 2.3.2, Section 3.2 and Section 4; C.Z.: Section 2.3.3 and Section 3.3; S.L. and C.Z.: Section 4 and Section 5. All authors have read and agreed to the published version of the manuscript.

Funding

The study was carried out in the framework of the research project “Paesaggi rurali della Sardegna: pianificazione di infrastrutture verdi e blu e di reti territoriali complesse” [Rural landscapes of Sardinia: Planning policies for green and blue infrastructure and spatial complex networks], funded by the Autonomous Region of Sardinia for the period 2019–2021, under the 2017 call for “Projects related to fundamental or basic research”, implemented at the Department of Civil and Environmental Engineering and Architecture (DICAAR) of the University of Cagliari, Italy.

Institutional Review Board Statement

Not applicable.

Informed Consent Statement

Not applicable.

Data Availability Statement

Not applicable.

Conflicts of Interest

The authors declare no conflict of interest.

References

  1. Lennon, M.; Scott, M. Delivering ecosystems services via spatial planning: Reviewing the possibilities and implications of a green infrastructure approach. Town Plann. Rev. 2014, 85, 563–587. [Google Scholar] [CrossRef] [Green Version]
  2. Liquete, C.; Kleeschulte, S.; Dige, G.; Maes, J.; Grizzetti, B.; Olah, B.; Zulian, G. Mapping green infrastructure based on ecosystem services and ecological networks: A Pan–European case study. Environ. Sci. Policy 2015, 54, 268–280. [Google Scholar] [CrossRef]
  3. European Commission. Communication from the Commission to the European Parliament, the Council, the European Economic and Social Committee and the Committee of the Regions. Green Infrastructure—Enhancing Europe’s Natural Capital. SWD (2013) 155 Final. 2013. Available online: https://eur-lex.europa.eu/resource.html?uri=cellar:d41348f2-01d5-4abe-b817-4c73e6f1b2df.0014.03/DOC_1&format=PDF (accessed on 30 June 2022).
  4. Benedict, M.A.; McMahon, E.T. Green infrastructure: Smart conservation for the 21st century. Renew. Resour. J. 2002, 20, 12–17. [Google Scholar]
  5. Tzoulas, K.; Korpela, K.; Venn, S.; Yli-Pelkonen, V.; Kaźmierczak, A.; Niemela, J.; James, P. Promoting ecosystem and human health in urban areas using Green Infrastructure: A literature review. Landscape Urban Plan. 2007, 81, 167–178. [Google Scholar] [CrossRef] [Green Version]
  6. Maes, J.; Barbosa, A.; Baranzelli, C.; Zulian, G.; Batista e Silva, F.; Vandecasteele, I.; Hiederer, R.; Liquete, C.; Paracchini, M.L.; Mubareka, S.; et al. More green infrastructure is required to maintain ecosystem services under current trends in land-use change in Europe. Landscape Ecol. 2015, 30, 517–534. [Google Scholar] [CrossRef] [PubMed] [Green Version]
  7. Madureira, H.; Andresen, T. Planning for multifunctional urban green infrastructures: Promises and challenges. Urban Des. Int. 2014, 19, 38–49. [Google Scholar] [CrossRef]
  8. Selman, P. Planning for landscape multifunctionality. Sustain. Sci. Pract. Policy 2009, 5, 45–52. [Google Scholar] [CrossRef]
  9. Hansen, R.; Stahl Olafsson, A.; van der Jagt, A.P.N.; Rall, E.; Pauleit, S. Planning multifunctional green infrastructure for compact cities: What is the state of practice? Ecol. Indic. 2019, 96, 99–110. [Google Scholar] [CrossRef]
  10. Hansen, R.; Pauleit, S. From multifunctionality to multiple ecosystem services? A conceptual framework for multifunctionality in green infrastructure planning for urban areas. AMBIO 2014, 43, 516–529. [Google Scholar] [CrossRef] [Green Version]
  11. Wang, Y.; Chang, Q.; Fan, P. A framework to integrate multifunctionality analyses into green infrastructure planning. Landscape Ecol. 2021, 36, 1951–1969. [Google Scholar] [CrossRef]
  12. Meerow, S.; Newell, J.P. Spatial planning for multifunctional green infrastructure: Growing resilience in Detroit. Landsc. Urban Plan. 2017, 159, 62–75. [Google Scholar] [CrossRef]
  13. Meerow, S. The politics of multifunctional green infrastructure planning in New York City. Cities 2020, 100, 102621. [Google Scholar] [CrossRef]
  14. D’Ambrogi, S.; Gori, M.; Guccione, M.; Nazzini, L. Implementazione della connettività ecologica sul territorio: Il monitoraggio ISPRA 2014 [Ecological connectivity implementation in practice: ISPRA’s 2014 monitoring]. Reticula 2015, 9, 1–7. [Google Scholar]
  15. Battisti, C. Frammentazione Ambientale, Connettività, Reti Ecologiche. Un Contributo Teorico e Metodologico con Particolare Riferimento alla Fauna Selvatica [Environmental Fragmentation, Connectivity, Ecological Networks. A Technical and Methodological Contribution with Particolar Reference to Wildlife Species]; Provincia Di Roma, Assessorato Delle Politiche Ambientali; Agricoltura e Protezione Civile [Province of Rome, Board of Environmental Policy, Agriculture and Civil Protection]: Rome, Italy, 2004. [Google Scholar]
  16. D’Ambrogi, S.; Nazzini, L. Monitoraggio ISPRA 2012: La rete ecologica nella pianificazione territoriale [The ecological network in spatial planning]. Reticula 2013, 3, 1–5. [Google Scholar]
  17. Baudry, J.; Merriam, H.G. Connectivity and connectedness: Functional versus structural patterns in landscapes. In Proceedings of the 2nd IALE Seminar “Connectivity in Landscape Ecology”, Münster, Germany, 19–24 July 1987; Münsterche Geographische Arbeiten: Münster, Germany, 1988; Volume 29, pp. 23–28. [Google Scholar]
  18. Directorate–General Environment, European Commission. The Multifunctionality of Green Infrastructure, Science for Environment Policy, DG News Alert Service, In–Depth Report. 2012. Available online: https://ec.europa.eu/environment/nature/ecosystems/docs/Green_Infrastructure.pdf (accessed on 30 June 2022).
  19. European Environment Agency. Spatial Analysis of Green Infrastructure in Europe; EEA Technical Report no. 2/2014; Publications Office of the European Union: Luxembourg, 2014. [Google Scholar] [CrossRef]
  20. Mitchell, M.G.E.; Bennett, E.M.; Gonzalez, A. Linking landscape connectivity and ecosystem service provision: Current knowledge and research gaps. Ecosystems 2013, 16, 894–908. [Google Scholar] [CrossRef]
  21. Correa Ayram, C.A.; Mendoza, M.E.; Etter, A.; Salicrup, D.R.P. Habitat connectivity in biodiversity conservation: A review of recent studies and applications. Prog. Phys. Geogr. Earth Environ. 2016, 40, 7–37. [Google Scholar] [CrossRef]
  22. Lai, S.; Leone, F.; Zoppi, C. Land cover changes and environmental protection: A study based on transition matrices concerning Sardinia (Italy). Land Use Policy 2017, 67, 126–150. [Google Scholar] [CrossRef]
  23. SardegnaGeoportale. Available online: http://www.sardegnageoportale.it (accessed on 30 June 2022).
  24. European Council Directive 92/43/EEC of 21 May 1992 on the Conservation of Natural Habitats and of Wild Fauna and Flora. Available online: https://eur-lex.europa.eu/legal-content/EN/TXT/?uri=CELEX:31992L0043 (accessed on 30 June 2022).
  25. European Parliament and Council Directive 2009/147/EC of 30 November 2009 on the Conservation of Wild Birds. Available online: http://eur-lex.europa.eu/legal-content/EN/TXT/PDF/?uri=CELEX:32009L0147 (accessed on 30 June 2022).
  26. SIC, ZSC e ZPS in Italia [SCIs, SACs, and SPAs in Italy]. Available online: https://www.mite.gov.it/pagina/sic-zsc-e-zps-italia (accessed on 30 June 2022).
  27. Common International Classification of Ecosystem Services. Available online: https://cices.eu/ (accessed on 30 June 2022).
  28. Isola, F.; Lai, S.; Leone, F.; Zoppi, C. Green Infrastructure and Regional Planning: An Operational Framework; FrancoAngeli: Milan, Italy, 2022. [Google Scholar]
  29. InVEST. Available online: https://naturalcapitalproject.stanford.edu/software/invest (accessed on 30 June 2022).
  30. Ndossi, M.I.; Avdan, U. Application of open source coding technologies in the production of Land Surface Temperature (REG_LST) maps from Landsat: A PyQGIS Plugin. Remote Sens. 2016, 8, 413. [Google Scholar] [CrossRef] [Green Version]
  31. Zulian, G.; Paracchini, M.L.; Maes, J.; Liquete, C. ESTIMAP: Ecosystem Services Mapping at European Scale; JRC Technical Report EUR 26474 ENG; Publications Office of the European Union: Luxembourg, 2013. [Google Scholar] [CrossRef]
  32. Vallecillo, S.; La Notte, A.; Polce, C.; Zulian, G.; Alexandris, N.; Ferrini, S.; Maes, J. Ecosystem Services Accounting: Part I-Outdoor Recreation and Crop Pollination; EUR 29024 EN; Publications Office of the European Union: Luxembourg, 2018. [Google Scholar] [CrossRef]
  33. Lai, S.; Leone, F. Bridging biodiversity conservation objectives with landscape planning through green infrastructures: A case study from Sardinia, Italy. In Proceedings of the 17th International Conference on Computational Science and Its Applications (ICCSA 2017), Trieste, Italy, 3–6 July 2017; Lecture Notes in Computer Sciences Series. Gervasi, O., Murgante, B., Misra, S., Borruso, G., Torre, C., Rocha, A.M.A.C., Taniar, D., Apduhan, B.O., Stankova, E., Cuzzocrea, A., Eds.; Springer: Cham, Switzerland, 2017; Volume 10409, pp. 456–472. [Google Scholar] [CrossRef]
  34. Decision of the EU Commission of 11 July 2011 Concerning a Site Information Format for Natura 2000 Sites. Available online: https://eur-lex.europa.eu/legal-content/EN/TXT/PDF/?uri=CELEX:32011D0484&from=EN (accessed on 30 June 2022).
  35. Lai, S.; Isola, F.; Leone, F.; Zoppi, C. Assessing the potential of green infrastructure to mitigate hydro-geological hazard. Evidence-based policy suggestions from a Sardinian study area. TeMA J. Land Use Mobil. Environ. 2021, 2021, 109–133. [Google Scholar] [CrossRef]
  36. Bacchetta, G.; Bagella, S.; Biondi, E.; Farris, E.; Filigheddu, R.; Mossa, L. Vegetazione forestale e serie di vegetazione della Sardegna (con rappresentazione cartografica alla scala 1: 350.000) [Forest vegetation and serial vegetation of Sardinia (with map at the scale 1:350,000)]. Fitosociologia 2009, 46, 3–82. [Google Scholar]
  37. Zeller, K.A.; McGarigal, K.; Whiteley, A.R. Estimating landscape resistance to movement: A review. Landscape Ecol. 2012, 27, 777–797. [Google Scholar] [CrossRef]
  38. McRae, B.H.; Dickson, B.G.; Keitt, T.H.; Shah, V.B. Using circuit theory to model connectivity in ecology, evolution, and conservation. Ecology 2008, 89, 2712–2724. [Google Scholar] [CrossRef]
  39. Palmer, S.C.F.; Coulon, A.; Travis, J.M.J. Introducing a ‘stochastic movement simulator’ for estimating habitat connectivity. Methods Ecol. Evol. 2011, 2, 258–268. [Google Scholar] [CrossRef]
  40. Balbi, M.; Petit, E.J.; Corci, S.; Nabucet, J.; Georges, R.; Madec, L.; Ernoult, A. Ecological relevance of least cost path analysis: An easy implementation method for landscape urban planning. J. Environ. Manag. 2019, 244, 61–68. [Google Scholar] [CrossRef]
  41. Wu, J.; Delang, C.O.; Li, Y.; Ye, Q.; Zhou, J.; Liu, H.; He, H.; He, W. Application of a combined model simulation to determine ecological corridors for western black-crested gibbons in the Hengduan Mountains, China. Ecol. Indic. 2021, 128, 107826. [Google Scholar] [CrossRef]
  42. Guo, X.; Zhang, X.; Du, S.; Li, C.; Siu, Y.L.; Rong, Y.; Yang, H. The impact of on-shore wind power projects on ecological corridors and landscape connectivity in Shanxi, China. J. Clean. Prod. 2020, 254, 120075. [Google Scholar] [CrossRef]
  43. Cannas, I.; Zoppi, C. Ecosystem Services and the Natura 2000 Network: A Study concerning a green infrastructure based on ecological corridors in the metropolitan city of Cagliari. In Proceedings of the 17th International Conference on Computational Science and Its Applications (IC-CSA 2017), Trieste, Italy, 3–6 July 2017; Lecture Notes in Computer Sciences Series. Gervasi, O., Murgante, B., Misra, S., Borruso, G., Torre, C., Rocha, A.M.A.C., Taniar, D., Apduhan, B.O., Stankova, E., Cuzzocrea, A., Eds.; Springer: Cham, Switzerland, 2017; Volume 10409, pp. 379–400. [Google Scholar] [CrossRef]
  44. Cannas, I.; Zoppi, C. Un’infrastruttura verde nell’area metropolitana di Cagliari: Corridoi ecologici come connessioni tra i Siti della Rete Natura 2000 [A Green Infrastructure in the Metropolitan Area of Cagliari: Ecological Corridors as Connections between the Sites of the Natura 2000 Network]. In Atti Della XX Conferenza Nazionale SIU. Urbanistica E/È Azione Pubblica [Proceedings of the 20th National Conference of SIU. Spatial Planning And/Is Public Action]; AA.VV.; Planum Publisher: Rome, Italy; Milan, France, 2017; pp. 1373–1386. [Google Scholar]
  45. Cannas, I.; Lai, S.; Leone, F.; Zoppi, C. Green infrastructure and ecological corridors: A regional study concerning Sardinia. Sustainability 2018, 10, 1265. [Google Scholar] [CrossRef] [Green Version]
  46. Cannas, I.; Lai, S.; Leone, F.; Zoppi, C. Integrating green infrastructure and ecological corridors: A Study concerning the Metropolitan Area of Cagliari (Italy). In Smart Planning: Sustainability and Mobility in the Age of Change; Papa, R., Fistola, R., Gargiulo, C., Eds.; Springer International Publishing: Basel, Switzerland, 2018; pp. 127–145. [Google Scholar] [CrossRef]
  47. CORINE Land Cover. Available online: https://www.eea.europa.eu/publications/COR0-landcover (accessed on 30 June 2022).
  48. AGRISTUDIO; CRITERIA; TEMI. Realizzazione del Sistema di Monitoraggio dello Stato di Conservazione degli Habitat e delle Specie di Interesse Comunitario della Regione Autonoma della Sardegna. Relazione Generale, Allegato 1b: Carta dell’Idoneità Faunistica [Implementation of the Monitoring System Concerning the Conservation Status of Habitats and Species of Community Interest of the Autonomous Region of Sardinia. General Report, Attachment 1b: Habitat Suitability Map]. Unpublished work. 2011. [Google Scholar]
  49. Burkhard, B.; Kroll, F.; Müller, F.; Windhorst, W. Landscapes’ capacities to provide ecosystem services–A concept for land-cover based assessments. Landsc. Online 2009, 15, 1–22. [Google Scholar] [CrossRef]
  50. Burkhard, B.; Kroll, F.; Nedkov, S.; Müller, F. Mapping ecosystem service supply, demand and budgets. Ecol. Indic. 2012, 2, 17–29. [Google Scholar] [CrossRef]
  51. LaRue, M.A.; Nielsen, C.K. Modelling potential dispersal corridors for cougars in Midwestern North America using least-cost path methods. Ecol. Model. 2008, 212, 372–381. [Google Scholar] [CrossRef]
  52. Linkage Mapper. Available online: https://linkagemapper.org/ (accessed on 30 June 2022).
  53. McRae, B.H.; Kavanagh, D.M. User Guide: Linkage Pathways Tool of the Linkage Mapper Toolbox—Version 2.0—Updated October 2017. Available online: https://github.com/linkagescape/linkage-mapper/files/2204107/Linkage_Mapper_2_0_0.zip (accessed on 30 June 2022).
  54. Shirabe, T. Buffered or bundled, least-cost paths are not least-cost corridors: Computational experiments on path-based and wide-path-based models to conservation corridor design and effective distance estimation. Ecol. Inform. 2018, 44, 109–116. [Google Scholar] [CrossRef]
  55. Zoppi, C.; Argiolas, M.; Lai, S. Factors influencing the value of houses: Estimates for the City of Cagliari, Italy. Land Use Policy 2015, 42, 367–380. [Google Scholar] [CrossRef]
  56. Sklenicka, P.; Molnarova, K.; Pixova, K.C.; Salek, M.E. Factors affecting farmlands in the Czech Republic. Land Use Policy 2013, 30, 130–136. [Google Scholar] [CrossRef]
  57. Stewart, P.A.; Libby, L.W. Determinants of farmland value: The case of DeKalb County, Illinois. Rev. Agric. Econ. 1998, 20, 80–95. [Google Scholar] [CrossRef]
  58. Cheshire, P.; Sheppard, S. On the price of land and the value of amenities. Economica 1995, 62, 247–267. [Google Scholar] [CrossRef]
  59. Wolman, A.L.; Couper, E. Potential consequences of linear approximation in economics. Fed. Reserve Bank Econ. Q. 2003, 11, 51–67. [Google Scholar]
  60. Bera, A.K.; Byron, R.P. Linearized estimation of nonlinear single equation functions. Int. Econ. Rev. 1983, 24, 237–248. [Google Scholar] [CrossRef]
  61. Anselin, L. Spatial Econometrics: Methods and Models; Kluwer Academic Publishers: Dordrecht, The Netherlands, 1988. [Google Scholar]
  62. Anselin, L. Spatial econometrics. In A Companion to Theoretical Econometrics; Baltagi, B.H., Ed.; Blackwell Publishing: Oxford, UK, 2003; pp. 310–330. [Google Scholar]
  63. Zoppi, C.; Lai, S. Land-taking processes: An interpretive study concerning an Italian region. Land Use Policy 2014, 36, 369–380. [Google Scholar] [CrossRef]
  64. GeoDa-An Introduction to Spatial Data Science. Available online: https://geodacenter.github.io (accessed on 30 June 2022).
  65. Rodríguez-Loinaz, G.; Alday, J.G.; Onaindia, M. Multiple ecosystem services landscape index: A tool for multifunctional landscapes conservation. J. Environ. Manag. 2015, 147, 152–163. [Google Scholar] [CrossRef]
  66. Pilogallo, A.; Scorza, F. Ecosystem services multifunctionality: An analytical framework to support sustainable spatial planning in Italy. Sustainability 2022, 14, 3346. [Google Scholar] [CrossRef]
  67. Gregory, A.; Spence, E.; Beier, P.; Garding, E. Toward best management practices for ecological corridors. Land 2021, 10, 140. [Google Scholar] [CrossRef]
  68. Hilty, J.; Worboys, G.L.; Keeley, A.; Woodley, S.; Lausche, B.; Locke, H.; Carr, M.; Pulsford, I.; Pittock, J.; White, J.W.; et al. Guidelines for Conserving Connectivity through Ecological Networks and Corridors; Best Practice Protected Area Guidelines Series no. 30; IUCN: Gland, Switzerland, 2020. [Google Scholar] [CrossRef]
  69. McLaughlin, A.; Mineau, P. The impact of agricultural practices on biodiversity. Agric. Ecosyst. Environ. 1995, 55, 201–212. [Google Scholar] [CrossRef]
  70. Peirce, K.N.; vanDaele, L.J. Use of a garbage dump by brown bears in Dillingham, Alaska. Ursus 2006, 17, 165–177. [Google Scholar] [CrossRef]
  71. Robbins, C.S.; Bystrak, D.; Geissler, P.H. The Breeding Bird Survey: Its First Fifteen Years, 1965–1979; Resource Publication, Series no.157; U.S. Fish and Wildlife Service: Washington, DC, USA, 1986. Available online: https://pubs.er.usgs.gov/publication/5230189 (accessed on 30 June 2022).
  72. Lai, S.; Leone, F.; Zoppi, C. Policies to decrease land surface temperature based on land cover change: An assessment related to Sardinia, Italy. In Innovation in Urban and Regional Planning–Proceedings of the 11th INPUT Conference, Lecture Notes in Civil Engineering; La Rosa, D., Privitera, R., Eds.; Springer: Cham, Switzerland, 2021; Volume 146, pp. 101–109. [Google Scholar] [CrossRef]
  73. Oke, T.R. The urban energy balance. Prog. Phys. Geog. 1988, 12, 471–508. [Google Scholar] [CrossRef]
  74. Santos, J.S.; Leite, C.C.C.; Viana, J.C.C.; dos Santos, A.R.; Milton Marques Fernandes, M.M.; de Souza Abreu, V.; do Nascimento, T.P.; dos Santos, L.S.; de Moura Fernandes, M.R.; Gilson Fernandes da Silva, G.F.; et al. Delimitation of ecological corridors in the Brazilian Atlantic Forest. Ecol. Indic. 2018, 88, 414–424. [Google Scholar] [CrossRef]
  75. Hidalgo, P.J.; Hernández, H.; Sánchez-Almendro, A.J.; López-Tirado, J.; Vessella, F.; Porras, R. Fragmentation and connectivity of island forests in agricultural Mediterranean environments: A comparative study between the Guadalquivir Valley (Spain) and the Apulia Region (Italy). Forests 2021, 12, 1201. [Google Scholar] [CrossRef]
  76. Wang, Z.; Yang, Z.; Shi, H.; Han, L. Effect of forest connectivity on the dispersal of species: A case study in the Bogda World Natural Heritage Site, Xinjiang, China. Ecol. Indic. 2021, 125, 107576. [Google Scholar] [CrossRef]
  77. Fischer, J.; Lindenmayer, D.B. Landscape modification and habitat fragmentation: A synthesis. Global Ecol. Biogeogr. 2007, 16, 265–280. [Google Scholar] [CrossRef]
  78. Wierzcholska, S.; Dyderski, M.K.; Pielech, R.; Gazda, A.; Smoczyk, M.; Malicki, M.; Horodecki, P.; Kamczyc, J.; Skorupski, M.; Hachułka, M.; et al. Natural forest remnants as refugia for bryophyte diversity in a transformed mountain river valley landscape. Sci. Total Environ. 2018, 640–641, 954–964. [Google Scholar] [CrossRef]
  79. Sánchez-Montoya, M.M.; Moleón, M.; Sánchez-Zapata, J.A.; Tockner, K. Dry riverbeds: Corridors for terrestrial vertebrates. Ecosphere 2016, 7, e01508. [Google Scholar] [CrossRef] [Green Version]
  80. Allen, A.M.; Singh, N.J. Linking movement ecology with wildlife management and conservation. Front. Ecol. Evol. 2016, 3, 155. [Google Scholar] [CrossRef] [Green Version]
  81. Sabo, J.L.; Sponseller, R.; Dixon, M.; Gade, K.; Harms, T.; Heffernan, J.; Jani, A.; Katz, G.; Soykan, C.; Watts, J.; et al. Riparian zones increase regional richness by harboring different, not more species. Ecology 2005, 86, 56–62. [Google Scholar] [CrossRef]
  82. Mitchell, M.G.E.; Suarez-Castro, A.F.; Martinez-Harms, M.; Maron, M.; McAlpine, C.; Gaston, K.J.; Johansen, K.; Rhodes, J.R. Reframing landscape fragmentation’s effects on ecosystem services. Trends Ecol. Evol. 2015, 30, 190–198. [Google Scholar] [CrossRef] [Green Version]
  83. Ng, C.N.; Xie, Y.J.; Yu, X.J. Integrating landscape connectivity into the evaluation of ecosystem services for biodiversity conservation and its implications for landscape planning. Appl. Geogr. 2013, 42, 1–12. [Google Scholar] [CrossRef]
  84. Peng, J.; Yang, Y.; Liu, Y.; Hu, Y.; Du, Y.; Meersmans, J.; Qiu, S. Linking ecosystem services and circuit theory to identify ecological security patterns. Sci. Total Environ. 2018, 644, 781–790. [Google Scholar] [CrossRef] [Green Version]
  85. Shi, X.; Qin, M.; Li, B.; Zhang, D. A framework for optimizing green infrastructure networks based on landscape connectivity and ecosystem services. Sustainability 2021, 13, 10053. [Google Scholar] [CrossRef]
  86. Lee, J.A.; Chon, J.; Ahn, C. Planning landscape corridors in ecological infrastructure using least-cost path methods based on the value of ecosystem services. Sustainability 2014, 6, 7564–7585. [Google Scholar] [CrossRef] [Green Version]
  87. Fňukalová, E.; Zýka, V.; Romportl, D. The network of green infrastructure based on ecosystem services supply in Central Europe. Land 2021, 10, 592. [Google Scholar] [CrossRef]
  88. Field, R.D.; Parrott, L. Mapping the functional connectivity of ecosystem services supply across a regional landscape. eLife 2022, 11, e69395. [Google Scholar] [CrossRef]
  89. Lai, S.; Leone, F.; Zoppi, C. Land surface temperature and land cover dynamics. A study related to Sardinia, Italy. TeMA J. Land Use Mobil. Environ. 2020, 13, 329–351. [Google Scholar] [CrossRef]
  90. Geneletti, D.; Cortinovis, C.; Zardo, L.; Blam Adel, E. Planning for Ecosystem Services in Cities; Springer: Dordrecht, Germany, 2019. [Google Scholar] [CrossRef] [Green Version]
  91. Ustaoglu, E.; Aydınoglu, A. Land suitability assessment of green infrastructure development. A case study of Pendik District (Turkey). TeMA-J. Land Use Mobil. Environ. 2019, 12, 165–178. [Google Scholar] [CrossRef]
  92. Lai, S.; Leone, F.; Zoppi, C. Spatial distribution of surface temperature and land cover: A study concerning Sardinia, Italy. Sustainability 2020, 12, 3186. [Google Scholar] [CrossRef] [Green Version]
  93. Mayor of London. London’s Urban Heat Island: A Summary for Decision Makers; Greater London Authority, City Hall: London, UK, 2006.
  94. Pötz, H.; Sjauw En Wa-Windhorst, A.; van Someren, H. Urban Green-Blue Grids Manual for Resilient Cities; Atelier Groenblauw: Delft, The Netherlands, 2016. [Google Scholar]
  95. Gómez-Baggethun, E.; Barton, D.N. Classifying and valuing ecosystem services for urban planning. Ecol. Econ. 2013, 86, 235–245. [Google Scholar] [CrossRef]
  96. Mazzeo, G.; Zucaro, F.; Morosini, R. Green is the colour. Standards, equipment and public spaces as paradigm for the Italian sustainable city. TeMA-J. Land Use Mobil. Environ. 2019, 12, 31–52. [Google Scholar] [CrossRef]
  97. Mathey, J.; Rößler, S.; Lehmann, I.; Bräuer, A. Urban green spaces: Potentials and constraints for urban adaptation to climate change. In Resilient Cities. Cities and Adaptation to Climate Change. Proceedings of the Global Forum 2010, Munich, Germany, 19–20 May 2010; Otto-Zimmermann, K., Ed.; Springer: Dordrecht, Germany, 2011; Volume 1, pp. 479–485. [Google Scholar] [CrossRef]
  98. Jenning, V.; Larson, L.; Yun, J. Advancing sustainability through urban green space: Cultural ecosystem services, equity and social determinants of health. Int. J. Environ. Res. Public Health 2016, 13, 196. [Google Scholar] [CrossRef] [PubMed] [Green Version]
  99. Webster, C. The new institutional economics and the evolution of modern urban planning: Insights, issues and lessons. Town Plan. Rev. 2005, 76, 455–502. [Google Scholar] [CrossRef]
  100. Bramley, G.; Watkins, D.G. ‘Measure twice, cut once’—Revisiting the strength and impact of local planning regulation of housing development in England. Environ. Plan. B 2014, 41, 863–884. [Google Scholar] [CrossRef]
  101. Buijs, A.; Hansen, R.; Van der Jagt, S.; Ambrose-Oji, B.; Elands, B.; Lorance Rall, E.; Mattijssen, T.; Pauleit, S.; Runhaar, H.; Stahl Olafsson, A.; et al. Mosaic governance for urban green infrastructure: Upscaling active citizenship from a local government perspective. Urban For. Urban Green. 2019, 40, 53–62. [Google Scholar] [CrossRef]
  102. Slätmo, E.; Nilsson, K.; Turunen, E. Implementing green infrastructure in spatial planning in Europe. Land 2019, 8, 62. [Google Scholar] [CrossRef] [Green Version]
  103. Fors, H.; Frøik Molin, J.; Murphy, M.A.; Konijnendijk van den Boschab, C. User participation in urban green spaces—For the people or the parks? Urban. For. Urban. Green. 2015, 14, 722–734. [Google Scholar] [CrossRef] [Green Version]
  104. Pérez-Urrestarazu, L.; Fernández-Cañero, R.; Franco-Salas, A.; Egea, G. Vertical greening systems and sustainable cities. J. Urban. Technol. 2015, 22, 65–85. [Google Scholar] [CrossRef]
  105. Ryan, M.; O’Donoghue, C. Socio-economic drivers of farm afforestation decision-making. Ir. For. J. 2016, 73, 96–121. [Google Scholar]
  106. Howley, P.; Buckley, C.; O’Donoghue, C.; Ryan, M. Explaining the economic ‘irrationality’ of farmers’ land use behaviour: The role of productivist attitudes and non-pecuniary benefits. Ecol. Econ. 2015, 109, 186–193. [Google Scholar] [CrossRef]
  107. Duesberg, S.; Ní Dhubháin, A.; O’Connor, D. Assessing policy tools for encouraging farm afforestation in Ireland. Land Use Policy 2014, 38, 194–203. [Google Scholar] [CrossRef]
  108. Kumm, K.-I.; Hessle, A. Economic comparison between pasture-based beef production and afforestation of abandoned land in Swedish forest districts. Land 2020, 9, 42. [Google Scholar] [CrossRef] [Green Version]
  109. Hyytiainen, K.; Leppanen, J.; Pahkasalo, T. Economic analysis of field afforestation and forest clearance for cultivation in Finland. In Proceedings of the International Congress of European Association of Agricultural Economists, Ghent, Belgium, 26–29 August 2008. [Google Scholar] [CrossRef]
  110. Behan, J.; McQuinn, K.; Roche, M.J. Rural land use: Traditional agriculture or forestry? Land Econ. 2006, 82, 112–123. [Google Scholar] [CrossRef]
  111. Zavalloni, M.; D’Alberto, R.; Raggi, M.; Viaggi, D. Farmland abandonment, public goods and the CAP in a marginal area of Italy. Land Use Policy 2021, 107, 104365. [Google Scholar] [CrossRef]
  112. Kollányi, L.; Máté, K. Connectivity analysis for green infrastructure restoration planning on national level. In Proceedings of the Fábos Conference on Landscape and Greenway Planning 2016, Budapest, Hungary, 30 June–3 July 2016; Available online: https://scholarworks.umass.edu/fabos/vol5/iss1/30 (accessed on 30 June 2022).
  113. Penko Seidl, M.; Golobič, M. Quantitative assessment of agricultural landscape heterogeneity. Ecol. Indic. 2020, 112, 106115. [Google Scholar] [CrossRef]
  114. Ernoult, A.; Alard, D. Species richness of hedgerow habitats in changing agricultural landscapes: Are α and γ diversity shaped by the same factors? Landscape Ecol. 2011, 26, 683–696. [Google Scholar] [CrossRef]
  115. Lenoir, J.; Decocq, G.; Spicher, F.; Gallet-Moron, E.; Buridant, J.; Closset-Kopp, D. Historical continuity and spatial connectivity ensure hedgerows are effective corridors for forest plants: Evidence from the species–time–area relationship. J. Veg. Sci. 2021, 32, e12845. [Google Scholar] [CrossRef]
  116. Lai, S.; Leone, F.; Zoppi, C. Assessment of municipal masterplans aimed at identifying and fostering green infrastructure: A study concerning three towns of the metropolitan area of Cagliari, Italy. Sustainability 2019, 11, 1470. [Google Scholar] [CrossRef] [Green Version]
  117. Oreszczyn, S.; Lane, A. The meaning of hedgerows in the English landscape: Different stakeholder perspectives and the implications for future hedge management. J. Environ. Manag. 2000, 60, 101–118. [Google Scholar] [CrossRef]
  118. Gravsholt Busck, A. Hedgerow planting analysed as a social system—Interaction between farmers and other actors in Denmark. J. Environ. Manag. 2003, 68, 161–171. [Google Scholar] [CrossRef]
  119. Cheng, J.; Meng, X.; Dong, S.; Liang, S. Generating the 30-m land surface temperature product over continental China and USA from Landsat 5/7/8 data. Sci. Remote Sens. 2021, 4, 100032. [Google Scholar] [CrossRef]
  120. Li, J.; Wu, H.; Li, Z.-L. An optimal sampling method for multi-temporal land surface temperature validation over heterogeneous surfaces. ISPRS J. Photogramm. 2020, 169, 29–43. [Google Scholar] [CrossRef]
Figure 1. Map of the Sardinian natural protected areas (PAs).
Sustainability 14 09788 g001
Figure 2. Graphical overview of the three-step methodological approach.
Sustainability 14 09788 g002
Figure 3. Mapping multifunctionality: the spatial layout of the seven selected ecosystem services, normalized in the [0, 1] range, and of their sum.
Sustainability 14 09788 g003
Figure 4. Spatial representation of PAs, ECs, and spatial units whose CWDs are lower than the second decile.
Sustainability 14 09788 g004
Table 1. Spatial datasets developed to assess multifunctionality: ESs, input data, sources, tools.
ESVariableInput DataInput Data Source(s)Tool/Model
Non-use value of biodiversity (existence and bequest)CONSERVHabitats of Community interest
Regional monitoring report
Regional administration dataset
Natura 2000 standard data formsEnvironmental ministry’s website
Ecosystems’ capacity to provide nursery for speciesHAB_QUALRegional land cover map
Protected areas map
Threats to biodiversity
(spatial data only)
Sardinian regional geoportalInVEST
(Habitat quality model)
Expert judgmentsQuestionnaires
Ecosystems’ attractiveness for recreational usesRECREAT2018 Corine land cover mapCopernicus Land monitoring serviceESTIMAP
(Ecosystem-based recreation potential model)
Potential vegetation seriesPotential distribution of vegetation series and geoseries by Bacchetta et al. [36]
Nitrogen inputsNational Census
Livestock densityNational Zootechnical Register
Natural protected areas and landscapesSardinian regional geoportal
Distance from the coastlineSardinian regional geoportal
Coastal geomorphologyEEA website, EUROSION project
Bathing water qualityEuropean Environment Agency website
Cultural identity, heritage valueCULT_HERRegional landscape plan (RLP) datasetSardinian regional geoportal
Ecosystems’ capacity to provide food, fibers, timberCROP_WOOD2018 Corine land cover mapCopernicus Land monitoring service
Land value
(Agricultural areas)
CREA website
Land value (Forestry areas)National Revenue Agency’s website
Ecosystems’ capacity to regulate local climate REG_LSTLandsat 8 TIRS and OLI
satellite imagery
USGS’s Earth Resources Observation and Science’s websiteREG_LST QGIS plugin by
Ndossi & Avdan [30]
Ecosystems’ capacity to regulate global climateCARB_SEQRegional land cover mapRegional geoportalInVEST
(Carbon Storage and Sequestration model)
Carbon pool data2005 National Inventory of Italian Forests
Regional pilot project on land units and soil capacity in Sardinia
Table 2. Regression outcomes.
Explanatory
Variable
CoefficientStandard Deviationt-Statisticp-ValueMean of the
Explanatory Variable
CONSERV378.904346.02128.2330.0000.1357
HAB_QUAL844.639335.807723.5880.0000.4134
RECREAT345.085967.19345.1360.0310.4210
CULT_HER−180.837022.4312−8.0620.0000.3078
CROP_WOOD−157.347245.2657−3.4760.0000.2128
REG_LST−773.240974.6302−10.3610.0000.4485
CARB_SEQ516.696457.68438.9570.0000.5606
ELEVATION0.90550.036125.0590.000356.8034
AUTOCORR0.53400.0022241.7490.0005597.6660
Dependent variable: CWD: Mean: 4925.448 km; Standard deviation: 2866.052 km; Adjusted R-squared: 0.523.
Publisher’s Note: MDPI stays neutral with regard to jurisdictional claims in published maps and institutional affiliations.

