Article

Blue and Green Water Footprint of Agro-Industrial Avocado Production in Central Mexico

by
Alberto F. Gómez-Tagle
1,2,†,
Alberto Gómez-Tagle
1,*,
Diana J. Fuerte-Velázquez
3,
Alma G. Barajas-Alcalá
1,
Fernando Quiroz-Rivera
1,4,
Pablo E. Alarcón-Chaires
5,† and
Hilda Guerrero-García-Rojas
6
1
Earth Science Department, Natural Resources Institute (INIRENA), Universidad Michoacana de San Nicolás de Hidalgo, Morelia 58330, Mexico
2
Alto-Fresno Ecohydrological Station, Tirio, Morelia 58346, Mexico
3
Graduate Program in Sustainability, Faculty of Economy, Universidad Michoacana de San Nicolás de Hidalgo, Morelia 58030, Mexico
4
Graduate Program in Integrative Ecology (MCEI), Natural Resources Institute, Universidad Michoacana de San Nicolás de Hidalgo, Morelia 58330, Mexico
5
Ecosystem and Sustainability Research Institute (IIES), National Autonomous University of Mexico (UNAM), Morelia 58341, Mexico
6
Faculty of Economy, Universidad Michoacana de San Nicolás de Hidalgo, Morelia 58030, Mexico
*
Author to whom correspondence should be addressed.
Deceased.
Sustainability 2022, 14(15), 9664; https://doi.org/10.3390/su14159664
Submission received: 29 May 2022 / Revised: 24 July 2022 / Accepted: 31 July 2022 / Published: 5 August 2022

Abstract

:
Mexico is the world-leading avocado producer. The municipality of Uruapan in the Avocado Belt region in Central Mexico produces 153,000 tons a year, nearly 6.4% of Mexico’s total volume. We performed a green and blue water footprint (WF) analysis between 2012 to 2017 in this municipality, and compared the estimated WF volumes with water concessions for agriculture. Mean annual rainfall was 1757.0 mm in the study period, mean effective rainfall 877.2 mm, mean crop evapotranspiration 933.1 mm, and 312.5 mm of mean irrigation requirement. The mean WFtotal was 744.3 m3 ton−1, below the global mean WF for this crop (1086 m3 ton−1). WFtotal was 2.5 times higher in irrigated plantations (1071.4 m3 ton⁻1) than in rainfed plantations (417.1 m3 ton−1). The crop yield was slightly higher (3.8%) under irrigated (10.26 ton ha−1 year−1) than in rainfed plantations (9.88 ton ha−1 year−1). WF and its components varied between years. The lowest WFblue was in 2015 when atypical spring rainfall increased available water during the dry season. The irrigation of avocado plantations doubles water use with a slight yield increase in relation to rainfed plantations. Regarding WF volumes and water concessions, we found that agroindustrial avocado production consumes up to 120% of the surface and groundwater volumes granted to agriculture use in years with dry conditions. The results indicate that other water users are depleted of this resource, creating water stress and scarcity, and leading to water rights conflicts and social discomfort.

1. Introduction

Water is an essential resource for economic and ecological processes. The efficient and sustainable use and management of water resources are key to maintaining social and economic development and proper ecological functioning. Agriculture production is considered to be the largest global water consumer [1] and estimates point out that 70% of the world’s freshwater withdrawals are directly linked to agriculture activities [2]. Moreover, growing water scarcity is nowadays considered a global systemic risk [3,4].
In water-stressed regions, identifying and recognizing the spatial and temporal dimensions of water withdrawals and consumption is key to provide effective and sound water resources management guidelines. In this context, the water footprint and water scarcity concepts had proven to be useful among some other tools that reveal both, water consumption and scarcity. In this sense we can mention the following: the water footprint method, the water footprint according to the ISO: 14046 standard and the agronomic productivity of water (WP). The first, introduced by Hoekstra et al. [5] is an integrated sustainability indicator in agriculture and food production [6] which recently has been applied to other types of goods, e.g., clothing [7]. This concept is aimed to contribute toward the adequate, efficient management and use of freshwater resources, and refers to the volume of freshwater required to produce a specific product [5,6]. Three water footprint categories are established: green, blue, and gray. The green water footprint is defined as the volume of rainwater that does not become run-off and is consumed in the production process. The blue corresponds to the volume of surface or groundwater that is used in the production process, while the gray water footprint is defined as the volume of freshwater required to reduce the pollutants to ambient levels [5,6]. According to NGO Agualimpia [8] the second method was approved in 2014, and it is based on the Life Cycle Analysis approach of a product, and is a tool to evaluate the use, transformation, consumption, and destination of natural resources, including water. The water footprint ISO: 14046 standard identifies the impacts generated in the environment [9]. Finally, the agronomic productivity of water, which is the relationship between production and the water used or consumed; this concept allows the definition of the physiological and agronomic mechanisms that govern the relationships between the input and output of crop water [10]. Although the aforementioned methods are all adequate to measure the water consumption associated with a specific agricultural crop, the water footprint approach was chosen for the present study, because this sustainability indicator has the advantage of allowing the estimation of the volume of water used in relation to the water resources available at a specific time and place [11].
Given a finite amount of available water resources in a region, water resource stress increases with water use and consumption [12]. Then, water scarcity can be defined as the rate of utilizable water supply in the primary water supply [13]. Further, water scarcity is generally divided into several levels, such as: no water stress, low water stress, mid-water stress, high water stress, and very high water stress [1]. Moreover, Hoekstra et al. [5] define the scarcity of blue water in a geographically defined area, usually a basin or watershed, as the ratio of the blue water footprint in the area and the availability of water, where the latter represents the environmental needs for ecological health.
In the last decade, blue water scarcity indicators have become more relevant because of decreasing water availability in many regions. The latter is a major concern, and the UN Sustainable Development Goals (SDGs) dedicate goal 6 to blue water efficiency and mitigation of water scarcity, and the sustainable use of water resources [14].
Mexico is considered a nation facing severe water scarcity, water pollution, and unequal social water access, but it is also a major producer of several crops [15]. Commodity cash crops are produced mainly for global export markets and are grown in low- and middle-income countries, such as Brazil, Indonesia, Congo, or Mexico [16]. In several of these countries the deforestation process aimed to expand agricultural land is considered a relevant land-use change driver [16,17,18,19,20,21].
According to FAOSTAT, 2022 [17], global avocado production had risen from 1.8 million tons to 8.2 million tons between 1990 and 2020, while global avocado plantation surface increased from 285,674 hectares to 825,532 hectares in the same period with a mean yield of about 9.6 ton ha1 year1 (see Supplementary Figure S1). In the last 30 years, world avocado production was led by Mexico with nearly 29.3% of world production (mean yield of 10.6 ton ha1 year1), followed by Colombia (10.7%), Dominican Republic (8.3%), Peru (8.1%), Indonesia (7.4%), and Kenya (3.9%). This nutritious fruit is nowadays cultivated in at least 65 countries, of which 35 produce over 10,000 tons per year [17].
However, world avocado production is highly spatially concentrated [18,19], and about 45% of global trading volume is produced in a region called Franja aguacatera de Michoacán, the Avocado Belt in the state of Michoacan, in central Mexico. According to Mexico’s agrifood and fisheries information service 2020 report (“siap” is its name in spanish). this state had a surface area of 169,939.5 hectares of avocado plantations, nearly 70.5% of the country [20]. At the time of writing this contribution, Michoacan was the only Mexican state certified for avocado exportation to the largest avocado market in the world, the USA market, by the Department of Agriculture [21].
The Avocado Belt of Michoacan had been described by Arima et al. [18] as “A contiguous geographic region which constitutes a cohesive ecological area in terms of temperature, precipitation, biogeography, vegetation types, soil groups and terrain”. The area is dominated by temperate forest types including coniferous, oak, and mixed forests, which can be differentiated from the rest of the state where tropical forests predominate. The establishment of avocado plantations has been identified as one of the major threats to native forests in Michoacan [16,18,22].
It is well established that water use by avocado production can be related to water access inequity in regions with agroindustrial avocado production aimed for exportation, such as Petorca and La Ligua valleys in central Chile [23]. In these valleys, water is used to produce this exportation commodity crop and entire communities are left without this scarce and vital resource [23,24].
Avocado, as a fruit crop, has a significant demand for irrigation water, and estimates are frequently in the range of 750 m3 ton1 [25,26], but a recent study published by the Swedish University of Agricultural Sciences found water consumption close to 2900 m3 ton1 for avocado produced in Chile when combining green, blue, and gray water footprint [27]. Chilean avocado producers claim 389 m3 ton1 [28], and avocado producer representatives in Mexico claim a water footprint of 600 m3 ton1 [29] even when at the national level, Mexico has an estimated mean water footprint of 1012 m3 ton1 for this crop [30], which is similar to the earlier reported global means of 1132 m3 ton1 and 1086 m3 ton1 [31,32].
It is to our knowledge that no water footprint estimation had been performed considering this fruit crop with a regional or local perspective in the Avocado Belt region. We therefore consider this relevant since this region produces nearly half of the global exports and concentrates about 21% of the world avocado cultivated surface. Therefore, a closer and more detailed insight is needed to evaluate the water footprint of this crop to guide strategies aimed at making avocado production sustainable [33].
In this contribution, we analyzed information of an iconic and representative municipality within the Avocado Belt of Michoacan, Uruapan. This municipality produces nearly 6.5% of Mexico’s annual, 2.4 million tons and we evaluated the water green and blue footprints and addressed the water stress index, comparing the blue WF and the available water for agricultural use through water rights concessions.

2. Materials and Methods
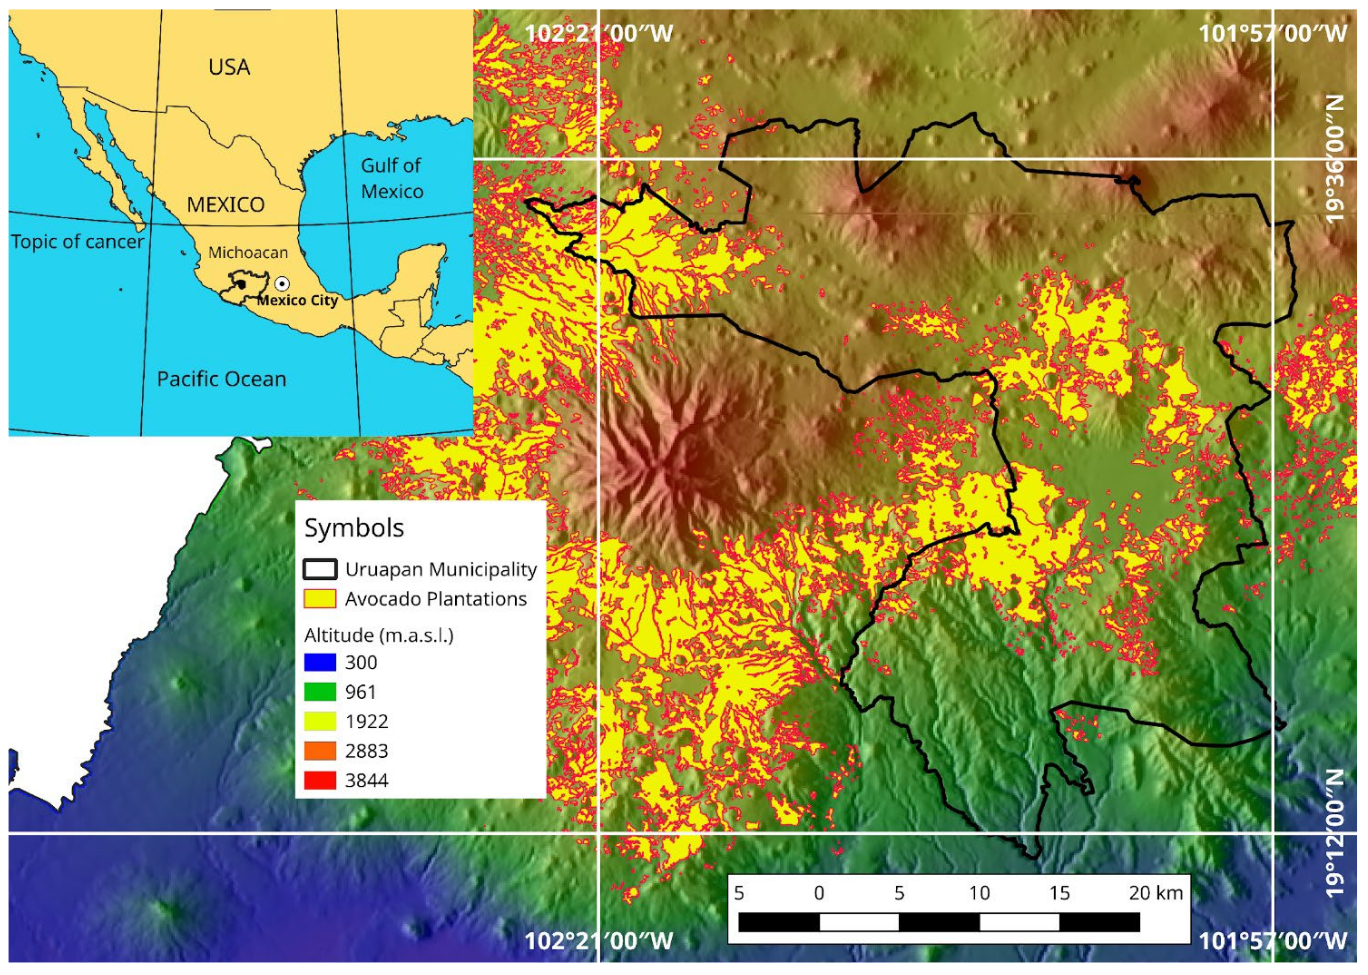
2.1. Study Area

Our study area is located between 19.18496° and 19.62749° northern latitude and 101.93616° and 102.39363° western longitude and comprises the municipality of Uruapan in the Avocado Belt of Michoacan state, in Central Mexico (Figure 1). The municipality covers 101,477.33 ha (1014.77 km2) [34]. Avocado plantations covered 15,101 ha in 2017 [20], and avocado plantations can be found between 1138 and 2654 m.a.s.l. [22]. Mean altitude of plantations is 1620 m.a.s.l. and standard deviation of 242.4, with a mode altitude of 1580 m.a.s.l.
In the target municipality, annual rainfall ranges from 1083.7 mm in the driest areas to 1669.7 mm in the wettest locations, with a mean of 1378.9 mm [35]. The rainy season occurs during the summer, between June and October, and a small proportion of annual precipitation falls during the winter months, accounting for less than 5% of annual precipitation [36], while the mean annual temperature is about 17.3 °C [37].
Located in central Mexico and part of the Trans-Mexican Volcanic Belt, soils are of volcanic origin, and Andosols and Luvisols are the main soil groups [18,38,39].

2.2. Calculating Blue and Green Water Footprint Indicators

The water footprint methodology, based on the crop water requirement (CWR), the amount of water used in the production of a specific crop will depend on climatic parameters, specifically potential evapotranspiration (ETo), as well as crop and soil characteristics [5]. The water availability for the crop depends on specific soil characteristics, mainly available soil water controlled by soil depth, soil texture, organic matter content, and bulk density which determine water storage and availability in the soil [40].
The methodology was developed to evaluate the commercial flows of water in the agricultural sector, and it has been adapted to other sectors such as the trade of livestock products and other types of products [41].

2.2.1. Crop Water Requirement

The term crop water requirement (CWR, mm) refers to the volume of water needed by a crop to grow and produce a specific product. CWR depends on the evaporation power of the atmosphere, expressed by the reference evapotranspiration (ETo, mm) and on crop water use characteristics, which are strongly related to crop health and phenology, and can be summarized in the crop coefficient (Kc, dimensionless) [42]. ETo was estimated using the CROPWAT model and considering the standard Penman–Monteith equation described by Allen et al. [42]. The CWR is calculated by multiplying ETo by Kc under standard conditions, this is, with no water limitations for crop growth. The CWR is equal to actual crop evapotranspiration (ETc, mm):
CWR = K c ET o = ET c ,
where ETo is the reference crop evapotranspiration and represents the evapotranspiration from a standard vegetated surface of 0.12 m tall grass with surface resistance of 70 s m1 and an albedo of 0.23 [42]. The Kc represents the conditions where no limitations are placed on crop growth or evapotranspiration due to water shortage, crop density, disease, weed, insect, or salinity-derived stress [42].
Variations in the Kc occur because of the change in crop features during the growing cycle and are influenced by crop variety, climate, and growth stages. Further, the crop-growing period can be divided into four stages: the initial, the developmental, the mid-season, and the late-season stage [42].

2.2.2. Crop Water Use

Estimating the crop water use (CWU) requires estimates of the evapotranspiration (ET) rates for the studied crop in the climate of the region. These data were obtained applying the CROPWAT v 8.0 (M. Smith; https://www.fao.org/fileadmin/user_upload/faowater/Applications/CRW8.ZIP) model using weather monthly data for the municipality, together with soil and crop characteristics from reference plantations throughout the study area [5].

2.2.3. Green CWU

The green crop water use (CWUg, m3 ha1) is the amount of rainwater that the crop (avocado) transpires as the photosynthesis process takes place, plus the direct evaporation from the soil in the crop fields [5]. The CWUg is calculated from the daily evapotranspiration of rainwater during the growth period. A factor of 10 is used to express water depth (mm) as the volume of water per surface unit (m3 ha1).
CWU g = 10 d = 1 g . period ET g ,
Ewaid et al. [43] mention that ETg can be either the effective rain (Effrain) or the ETc. In the case that Effrain > CWR, then the ETg = ETc, this assumes that the crop never utilizes more water than is required for ideal growth. On the other hand, if Effrain < ETc, then ETg = Effrain. In study case, Effrain was estimated considering the USDA, SCS method described by Dastane [44] and included within the CROPWAT model [45].

2.2.4. Blue CWU

The blue crop water use corresponds to the irrigation requirement (CWUb, m3 ha1), also called the blue water, is the amount of irrigation water required by the crop and includes sources, such as surface or groundwater [5].
CWU b = 10 d = 1 g . period ET ir
The irrigation requirement is calculated as the difference between the ETc and the effective rain depth (Effrain, mm). This concept considers the amount of water that the soil can hold and the infiltration capacity of the soil. So, if the Effrain > ETc, the CWUb is zero, and no irrigation is required by the crop. On the contrary, in case the CWR is not completely met by Effrain, the evapotranspiration met by irrigation (ETir, mm) is the difference between them.
ET ir = ET c Eff rain

2.2.5. Total Water Footprint of a Crop

The total WF of a crop is calculated as the sum of the green water footprint (WFg) and the blue water footprint (WFb), both in m3 ton1 [5]. The WF represents then, the amount of water required to produce a certain crop yield in m3 ton1.
WF = WF g + WF b
where the WFg is calculated by dividing CWUg (m3 ha1) by the crop yield (Y, ton ha1)
WF g = CWU g Y
further on, WFb is calculated by dividing the IR (m3 ha1) by the crop yield (Y, ton ha1).
WF b = IR Y
In this approach, the WF of a crop is the volume of water used to develop a specific amount of crop production in a growth period, therefore, the total WF production of a crop (m3 ton1) is the addition of the green and blue WF components.

2.2.6. Blue Water Footprint Water Stress Index

According to Fuerte-Velázquez [46], the blue water footprint water stress index was determined by the ratio between the WFb of the studied crop in the analyzed area (m3 year1) and the concessioned volume of surface and groundwater (m3 year1) for agricultural use for each year in the same area:
WSI = WF b CS w
where WSI is the water stress and CSw corresponds to the available total volume of surface and ground for agricultural use.
According to Mexican law, both the surface and subsurface water belong to the nation and therefore are under federal government jurisdiction. Water volume rights can be concessioned or granted by the National Water Commission (Comision Nacional del Agua). The CSw volumes data for the target municipality were obtained from the Public Registry of Water Rights of the Mexican government (REDPA by its acronym in Spanish) [47] and correspond to the concessioned volume of water (m3 year1) to agriculture activities, given by Mexican authorities.

2.3. Data Requirement

2.3.1. Weather Data

We estimated CWU using the CROPWAT v 8.0 software [45], for this, we used daily weather data from four automated weather stations which are part of the network of APEAM and are available online [48]. Original daily weather records span from December 2011 to June 2018, these were aggregated and summarized in a single monthly time series of average weather conditions for the municipality. Monthly means of maximum, minimum, daily temperature, wind speed, and relative humidity, were calculated, in the case of precipitation, daily precipitation depths were added to provide a monthly total. Standard gap-filling correlative procedures between stations were applied to original daily and monthly time series data in order to fill database gaps. The final time series spans from January 2012 to December 2017, covering 6 complete calendar years (Figure 2).
We assumed that these average weather conditions were representative and homogeneous across the whole municipality for the time series span.

2.3.2. Crop and Soil Parameters

The soil parameters required by the CROPWAT v 8.0 model included detailed information about the soil, such as total available moisture content, initial moisture depletion, maximum rain infiltration rate, and maximum rooting depth. To fulfill these, we used information derived from direct field observations, soil profile descriptions, and previously acquired and analyzed soil samples from avocado plantations.
We assumed that the soil characteristics were valid and homogeneous throughout the whole extension of the municipality (Table 1). We are aware of the possible systematic errors generated by this assumption, but avocado yield and production data are available in their most refined form only at the municipality scale [20]. Regarding rainfall interception, we used the USDA soil conservation method.
For crop parameters, including rooting depth, critical depletion, and time span of plant growth stages, we used information from in situ measurements, direct observations, and information provided by key informants as plantation managers and farmers, for Kc values and yield response factor we considered values reported in the specialized literature [39,41,49,50].
Avocado crop cycle dates were taken into account, considering the phenology of the crop reported by Rocha-Arroyo et al. [49], and including the normal (winter) flower blooming with anthesis normally occurring the third week of January, as the only flower bloom, since it produces the largest and most reliable fruit production in the region [49].
The fruit development duration of 9.6 months (290 days) was considered and assumed that standard conditions occurred during the whole crop cycle. These included: the crop is under optimum soil water conditions, it is well-fertilized, grown in large fields, disease-free, and achieving full production under the given climatic conditions (Table 1).
It is known to us that even in the absence of irrigation infrastructure in the plantations, trees can receive auxiliary irrigation during flowering, fruit set, and later fruit development in order to avoid the loss of flowers and fruits due to water stress. However the quantification of such input is out of the reach of the present research since it implies knowing the exact amount of water poured in each plantation. The spatial scale considered, and the available data sets does not allow this level of analysis.

2.3.3. Avocado Production, Planted Surface, and Yield Data

The data of avocado crop planted surface (ha), production (ton year1), and yield data (ton ha1 year1) of the 2012 to 2017 production cycles were obtained from Mexico’s Agrifood and Fisheries Information Service (SIAP for its name in Spanish) [20]. The SIAP database distinguishes between rainfed and irrigation avocado plantations. The most common irrigation system in the study area is sprinkling irrigation followed by drip irrigation [41].

3. Results

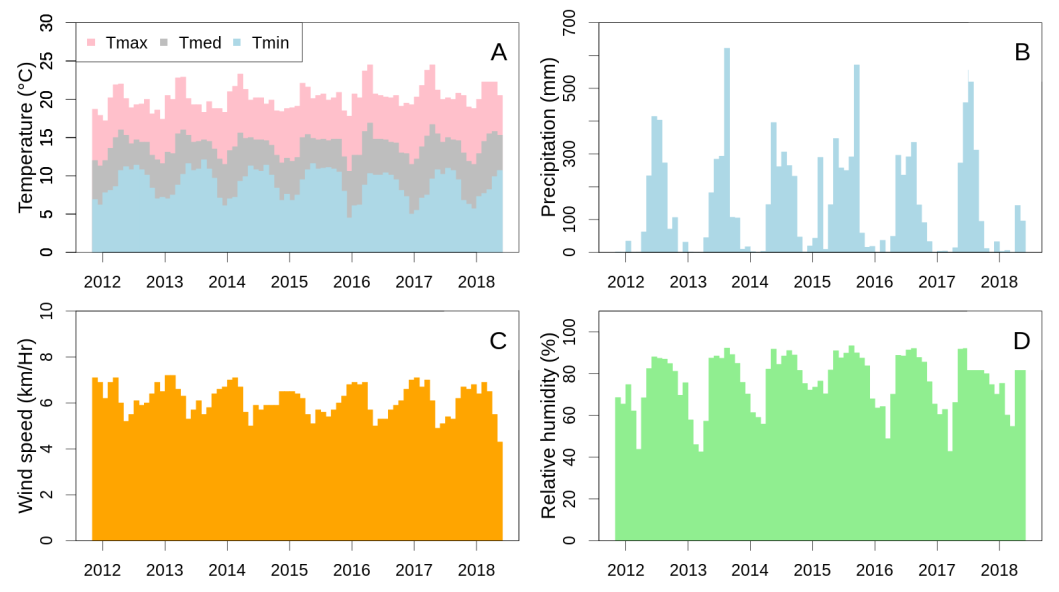
3.1. General Features of the Climate in Uruapan

Seasons are clearly defined as wet or rainy (June to October) and dry season (November to May). The temperature fluctuates in a clear yearly pattern with the lowest temperatures during the winter months reaching a minimum of nearly 4.5 °C usually in January, and the highest temperatures of about 27.7 °C during daytime in the spring, happen always in May (Figure 2A).
The summer months coincide with the rainy season (Figure 2B). Wind speed and relative humidity depict also strong seasonal patterns, with higher wind speeds during the dry season, that may reach up to 13 km hr1 during the daytime, but monthly means are about 7 km hr1. During the wet season wind speeds are lower, and about 5.3 km hr1. (Figure 2C). Regarding air relative humidity, it reaches its lowest during the last part of the dry season in the spring (May) and right before the rainy season begins, with nearly 51.3% (Figure 2D), and reaches its highest point in the second half of the rainy season (September) (91.7%).
Due to high wind speeds and high temperatures, the highest evapotranspiration is known to occur during the spring months.

3.2. Crop Water Requirements

Total annual rainfall depth oscillated between 1531.4 mm and 2296.6 mm with a mean of 1757.0 mm in the analyzed period (2012–2017). The registered mean was above the long-term annual rainfall in the region, with a depth of 1520.7 mm [51]. The year 2015 was an atypical wet year with unusually high precipitation depths during early spring and these precipitations were related to a late winter storm that delivered 289.6 mm of rainfall in March 2015 (Figure 2B). The long-term mean rainfall for that month is 6.3 mm, and the highest recorded monthly precipitation for the month is 79.5 mm in 1968 [51]. The aforementioned unusual precipitation had an impact on the dry season evapotranspiration and crop ETc. In fact, the year 2015 registered the lowest ETc (906.3 mm) of the study period, together with the lowest irrigation requirement depth (Table 2).
Fluctuations in weather conditions strongly influence ETc and IR and these can change from one year to another. The mean IR depth for avocado was estimated at 312.5 mm, while the mean ETc depth was 933.1 mm (Table 2).

3.3. Crop Production

In the overall picture, the avocado plantation surface in this municipality increased by 2642 ha during the study period: from 12,459 ha in 2012 to 15,101 ha in 2017, with a mean increment of 440.3 ha year−1. Total avocado production volume increased to 26,429.9 tons between 2012 and 2017, with a mean volume increase of 4405.0 ton year−1 (Table 3).
The relation between the production volume of rainfed and irrigated plantations was nearly 1:2, while the planted surface between these two production modalities was also near 1:2 (Table 3). An increasing trend in the crop surface was detected in both, rainfed and irrigated plantations with a net increase of 1763 ha in rainfed plantations but only 879 ha in the irrigated ones. This implies a steady increment in plantation surface of 293.8 ha year−1 and 146.5 ha year−1 for rainfed and irrigated plantations respectively.
The detected increase in plantation surface was linearly related to an increase in production volume in both, rainfed and irrigated plantations from 37,249.2 tons in 2012 to 51,804.0 tons in 2017 for the rainfed condition (Table 3), with a net increase of 14,554.8 tons, and a mean increase of 2425.9 ton year−1.
The avocado production volume under irrigation modality increased by 11,875.1 tons in this 6-year period, from 89,826.3 tons in 2012 to 101,701.4 tons in 2017, with a mean of 1979.18 tons year−1 (Table 3).
Regarding crop yield, irrigated plantations had a higher mean yield of 10.26 tons ha1 year1 while rainfed plantations had 9.88 tons ha1 year1. The one-way repeated measures ANOVA aimed to evaluate the effect of production modality on crop annual yield, showed a significant effect of production modality (F(1, 9) = 8.116, p < 0.05). Further, crop yield was steady in the rainfed condition but depicted a slight increasing trend in the irrigated condition (Table 3). However, the Mann–Kendall trend test [52] indicated the non-existence of significant trends in neither of the production modalities.

3.4. Crop Water Use

In rainfed avocado plantations CWU ranged from 29.3 Mm3 in 2012 to 56.2 Mm3 in 2015 with a mean of 41.6 Mm3 year1 (Table 4). On the other hand, crop water use of rainfall water in irrigated plantations ranged from 67.9 Mm3 in 2013 to 104.5 Mm3 in 2015, with a mean of 79.4 Mm3 year1 while crop water use of irrigation water varied between 14.3 Mm3 in 2015 and 42.8 Mm3 in 2017 with a mean of 31. Mm3 year1 (Table 4). Total crop water use in irrigated plantations, considering the rainfall and irrigation water, ranged between 98.5 Mm3 in 2012 and 118.8 Mm3 in 2015 with a mean of 110.4 Mm3 year1 (Table 4).
Adding up avocado rainfed and irrigated plantations, the mean crop water use was 152.0 Mm3 year1, with the lowest value in 2012 (127.8 Mm3) and the highest in 2015 (175.0 Mm3) (Table 4).

3.5. Avocado Water Footprint (WF)

The analysis revealed that the mean water footprint of agro-industrial avocado production in the studied municipality was 744.3 m3 ton1 (Table 5), and varied from year to year, with the highest mean water footprint occurring in 2015 (864.6 m3 ton1) and the lowest in 2012 (625.3 m3 ton1) (Table 5). It is worth noting that the total water footprint of rainfed plantations (417.1 m3 ton1) was lower than the green water footprint of the irrigated plantations (709.6 m3 ton1) (Table 5). The blue water footprint component of irrigated plantations varied between 140.6 m3 ton1 in 2015 and 404.2 m3 ton1 in 2017 (Table 5) with a mean value of 280.8 m3 ton1, while the total water footprint of irrigated plantations ranged from 956.6 m3 ton1 to 1164.8 m3 ton1, with a mean of 1071.4 m3 ton1 (Table 5). The blue water footprint reached its lowest level in 2015, a year with outstanding high precipitation for the study area (Figure 2B, and Table 2 and Table 4), which diminished the requirement for irrigation water and resulted in a low blue water footprint. This is of high importance since the total water footprint of avocado produced in irrigated plantations was nearly 2.6 times larger than the footprint of rainfed plantations with a marginal 3.8% increase in crop yield (Table 3).

3.6. Blue Water Footprint, Water Availability, and Water Stress

The analysis of the water footprint, water availability and water stress, indicated the occurrence of severe water stress in most of the years studied (Table 6). In these years, the appropriation of water aimed at avocado cultivation exceeded 40% of the total water volume granted for agricultural use in the municipality. In this context, a mean of the total water footprint of this fruit of 30.99 Mm3 year1 was estimated, while the concession volume of surface water granted for agricultural use in the municipality increased from 22.94 Mm3 year1 in 2012 to 23.10 Mm3 year1 in 2017. The concession volume of groundwater increased by 1.88 Mm3 year1 in the study period (Table 6). The total granted volume of water for agriculture also increased, from 33.61 Mm3 year1 (2012) to 35.6 Mm3 year1 (2017) (Table 6). The mean proportion of appropriation of granted water for agricultural use by agroindustrial avocado production was 89.89% but varied between 41.18% (2015) and 120.17% (2017).
Our results indicate that in 2015 the unexpected extra spring season rainfall water reduced groundwater demand and diminished water stress. However, in 2013, 2016, and 2017 agroindustrial avocado production used more than the total granted volume of water for all agricultural production within the municipality. In 2017 water consumption of avocado exceed all concessioned water for agricultural production by 20.17% (Table 6).

4. Discussion

4.1. Crop Production and Crop Water Requirements

It is undeniable that Mexico is the world’s top avocado producer, and the steady increase in the planted surface and production volumes in both rainfed and irrigated plantations can be interpreted as a consequence of avocado’s production economic success [53]. However, in the studied period (2012 to 2017) and the studied municipality, the water demand for avocado production increased from 127.8 Mm3 to 157.8 Mm3 (Table 4), representing an increase of nearly 23.4% in 6 years. Nevertheless, our results indicate that the increase in crop water use for avocado production did not affect yield improvement, since yield remained stable for both rainfed and irrigated plantations (Table 3).
According to the international database of FAOSTATS, between 2012 and 2017 Mexico ranked between the 19th and 21st world rank regarding yield, with mean annual yields between 9.84 tons ha1 year1 in 2015 and 10.75 tons ha1 year1 in 2017. The countries in the next five positions in the world’s top-ranking production volume had annual yields over 11.0 tons ha1 year1: Colombia (11.15 tons ha1 year1), The Dominican Republic (15.68 tons ha1 year1), Peru (13.04 tons ha1 year1), Indonesia (13.13 tons ha1 year1) and Kenya (13.19 tons ha1 year1) [17]. The mean world avocado yield between 2012 and 2017 fell between 8.46 tons ha1 year1 and 9.01 tons ha1 year1 [17].
Our results show that in Uruapan, rainfed and irrigated plantations were in all cases above the world yield mean during the studied period (Table 3), but below the world top yield. World top yield ranged from 29.76 tons ha1 year1 to 40.14 tons ha1 year1 (The Dominican Republic, 2015) [17].
Considering these figures, the top world avocado yield is about 3.3 times the reported Mexican mean (Table 6), about 3.4 times that of the rainfed plantations, and 3.3 times that of irrigated plantations in the present study (Table 3). This indicator shows that the rainfed plantations in the target municipality within the largest avocado production area in the world have a yield just above the world mean (9.88 tons ha1 year1; Table 3). Moreover, considering the irrigated plantations in the study area and the year 2017 as reference, the mean yield of the studied municipality would fall between the world’s 22nd (Guatemala, 10.53 tons ha1 year1) and 23rd (Cyprus, 9.31 tons ha1 year1) places [22].
It is known that countries with arid and semiarid climate conditions, e.g., Israel, have implemented high-efficiency irrigation systems, which enable reaching annual yields up to 13.07 tons ha1 year1 [17,54].
The results indicate that the ratio between water footprint of rainfed and irrigated plantation is nearly 2.6 while yield increases only 3.8%. This means that irrigated plantations use more than twice the water of the rainfed plantations but the increase in yield is well under 5%. We, therefore, state that there is an urgent need for water efficiency strategies implementation and actual crop yield improvement throughout the study area. Moreover, the estimation of the green water footprint of the avocado crop in Uruapan showed a lower water consumption in the rainfed plantations than in the irrigated ones. It is important to address that a considerable proportion of the green water flux is stored in the soil and became productive for humans through plant assimilation and fruit biomass production. This water was therefore not available as runoff in the ecosystem. This condition turns green water flux into a scarce resource, since the appropriation and use of green water for a specific purpose may turn it unavailable for other purposes [55]. Consequently, the appropriation of green water by avocado cultivation could represent a threat to the ecosystems, especially the aquatic ones that depend on surface runoff.
The actual model of agro-industrial avocado production in the Avocado Belt in central Mexico gives preference to plantation surface to increase production and economic benefits. Recent studies have shown that about 20% of avocado production for the USA market is closely related to deforestation processes in Michoacan [21]. In order to increase the sustainability of the studied crop in the target municipality, it is urgent to increase crop yield efficiency. However, to achieve this, more effective crop and water management strategies had to be implemented. Otherwise, it is likely that avocado crop expansion may cause similar conditions to those occurring in Petorca and La Ligua in Central Chile. In that region, water is used to produce this commodity crop depleting water for rural communities [18,24]. This situation generated international awareness [24] and social protests that led to a boycott of Chilean avocado in certain countries within the European Union [56,57].
The expansion of avocado production, much of which is export-oriented, produces relevant economic income and has become a keystone for the local and regional economy, but the profits of this avocado boom are unequally distributed and have significant social and environmental costs [19]. These affect the local communities and has caused land dispossession in indigenous and farmer communities with high presence of poverty, while food insecurity and health problems are common among agricultural workers and community members [19]. Besides avocado surplus, production and high commercial value have been related to drug cartel-related violence already present in the region, because avocado production presents an excellent possibility for money laundering and gaining control of this profitable lawful business [19,58,59].
In the Americas, Africa, and Asia the expansion of agro-industrial crop production has been an important driver of deforestation in tropical and temperate forests [16,60], besides deforestation tends to aggravate the loss of biodiversity, strongly affecting the livelihoods of nearby communities [61,62].

4.2. Avocado Water Footprint

The WF as an indicator of sustainability refers to the maintenance of water resources by human activities [63]. In this context, it is essential to understand the way in which natural resources are used in the system and thereby conceive that ecosystems are not only a source of resources for human activity but also fulfill various ecosystem functions [64]. Due to the increase in water consumption, there is a growing scarcity of water resources in several regions of the world [6]. Accounting for the WF is substantial, Moreover, increasing blue water efficiency and reducing blue water scarcity according to the SDGs is one of the major goals and one of the main international concerns.
Our results on the total water footprint of avocado production were much lower under rainfed conditions (417.1 m3 ton1) than under irrigation conditions (1071.4 m3 ton1) (Table 5 and Table 7). This situation of increased consumption of blue water occurs in many places worldwide, where irrigation water is used to compensate for soil moisture, causing pressure on the blue water resources. Nevertheless, according to Mekonnen [65], the great challenge nowadays is to transit towards more sustainable production models in order to reduce negative social, ecological, and economic impacts.
However, when comparing the water footprint of avocado obtained in the present study and those obtained in other studies, the total water footprint of avocado produced under rainfed conditions (417.0 m3 ton1) was very close to that reported in La Libertad in Chile (416.8 m3 ton1) [66] (Table 7).
We also found that the values reported for the mean green, blue, and total water footprint for Mexico [5], and Chile [67], as well as the world means [32] (Table 7), were rather similar to the values we found under irrigated conditions for green (790.0 m3 ton1), blue (280.0 m3 ton1) and total water footprint (1071.4 m3 ton1) (Table 7).
Nevertheless, the mean water footprints of avocado production, considering both rainfed and irrigated plantations in Uruapan, were 603.5 m3 ton1 for the green WF, 280.0 m3 ton1 for the blue WF, and 744.2 m3 ton1 for total WF, were below of most of the values reported in the literature for avocado production, except for that of Pineda and Naranjo [66] and ranged between 1012.0 m3 ton1 for Mexico [31] to 3630.0 m3 ton1 in Barbas-Bremen, Quindío, Colombia [68,69] (Table 7).
We can say that the total water footprint of avocado produced under rainfed conditions in Uruapan is relatively low when compared to the mean WF values of other crops such as mangoes (Table 7) and similar to that of strawberries, lemons, and oranges, according to mean world values [31]. However, the WF of avocado in our study area under irrigation conditions is nearly 2.6 times higher than rainfed avocado production (Table 5 and Table 7).
The international trading of water-intensive agricultural products from high-precipitation areas to arid areas may help alleviate water scarcity and the exports of a water-intensive product to another country corresponds to water in its virtual form [67,69].
Table 7. The green, blue, and total world mean water footprints of different key fruit crops according to Mekonen and Hoekstra [31], and avocado water footprint in different regions and countries, and at the present study.
ReferenceAgricultural CropGreen Water Footprint
(m3 ton1)
Blue Water Footprint
(m3 ton1)
Total Water Footprint
(m3 ton1)
[31]Watermelons147.025.0172.0
Tomatoes108.063.0171.0
Strawberries201.0109.0310.0
Lemons432.0152.0584.0
Oranges401.0110.0511.0
Mangoes1314.0362.01676.0
Olives2470.0499.02969.0
Avocado
ReferenceLocation, CountryGreen Water Footprint (m3 ton1)Blue Water FootprintTotal Water Footprint (m3 ton1)
[66]Chepén, La Libertad, Chile--416.8
[31]Mexico (mean)746.0266.01012.0
[67]Chile787.3225.91013.3
[32]World (mean)849.0237.01086.0
[68]Cachapoal, Chile--1480.0
[31]World (mean)--1981.0
[70]Chile--2000.0
[27]Chile--2900.0
[71]Barbas-Bremen, Quindío, Colombia3630.003630.0
Present study (rainfed)Uruapan, Michoacan, Mexico417.00417.1
Present study (irrigated)Uruapan, Michoacan, Mexico790.0280.01071.4
Present study (mean)Uruapan, Michoacan, Mexico603.5280.0744.2

4.3. Blue Water Footprint, Water Availability, and Scarcity

Our analysis indicates that for the years 2013, 2016, and 2017, avocado production concentrated all the concessioned water resources for agricultural production (Table 6). Further, considering 2017 as an example year due to the highest water footprint estimated (Table 6) and taking into account Mexico’s agroindustrial official production data [20]. In 2017 there were 886 hectares of 15 different crops other than avocado under the irrigation modality in the studied municipality. These produced 25,120 tons of agricultural products including sugar cane (17,480 tons in 190 hectares), blackberry (2322 tons in 135 hectares), guava (1552 tons in 160 hectares), and nopales (fresh edible cactus blades; 1200 tons in 40 hectares) among others. The question now is, how were all these crops produced if the avocado crop used 120% of all concessioned water for agriculture?
Well, we consider that the figures reported in this communication (Table 5 and Table 6) are indicative of the existence of a nonregistered appropriation of water for agricultural use. The unregistered appropriation may affect water access to other users, such as aquaculture, industrial, livestock, and urban. Which users and how much water are these users losing? The answer to this question is unclear at the moment and out of reach of the present communication. However, it is clear that this situation may lead to severe conflicts between different water users in the municipality and could generate social discomfort and protests.
As mentioned earlier and according to the Mexican government’s official databases [20], two avocado production modalities are registered; rainfed and irrigation plantations. A plantation is registered as irrigated when piping and water conduction infrastructure are present. Unless this infrastructure exists, the plantation is registered as rainfed. The sprinkler and drip irrigation are the most common irrigation methods in the study area [41]. However, key informants such as farmers, plantation, and production managers, often mention the use of the supportirrigation in rainfed plantations. It consists in pouring water directly into the root zone of the trees and, it is necessary, especially during the dry and hot season in the spring months. Support irrigation may also occur without piping systems using tractors and mobile water tanks where each tree may receive up to 400 L of water per week. This practice usually occurs between February and the beginning of the rainy season (June). According to the informants, if water deficit is present during flowering, fruit set or fruit development and support irrigation are not provided, a considerable number of flowers and fruit could be aborted, and fruit size will be smaller than under well-irrigated conditions. This is consistent with the early findings of Richards et al. [69,72] and Lahav et al. [73], as well as later research [54,73]. So, access to water by avocado trees during flowering, fruit set, and fruit development are critical to ensure fruit production and fruit yield [54,74]. This is relevant for the water footprint estimation in this contribution. We do not include water poured as support or auxiliary irrigation in rainfed plantations, as part of the water footprint analysis, because even though it is a common crop management practice, not all rainfed plantations are managed in this way. Moreover, estimation of blue water supplied as support irrigation would need additional further fieldwork and is out of the reach of this contribution and may be part of further research initiatives. We, therefore, consider that our water footprint estimates for rainfed plantations may be conservative and perhaps somehow underestimated. We consider our approach a sound, reliable and reproducible exercise conducted with the available data.
Regarding the appropriation of concessioned water for agricultural use by agroindustrial avocado production, the information presented herewith exposes the existence of conflicts in water access and water use by different users. The excessive appropriation of water may lead to social distress and socio-environmental conflicts due to water scarcity and water unavailability for certain users and productive activities. Earlier research showed that water rights assignment and unlawful appropriation of water resources related to the dominant existing agroindustrial avocado production model, generate social conflicts [23,24]. In this perspective social protests triggered by the inaccessibility of water resources, associated with the appropriation of water for crops of high economic value, such as avocados and berries, have recently begun to burst in other municipalities within the Avocado Belt of Michoacan [74,75] but have not been registered yet in the studied municipality.

5. Conclusions

The results of this study indicate that the mean WF of agro-industrial production of avocado in Uruapan municipality between 2012 and 2017 was 152.0 Mm3 year1. The overall mean WF considering rainfed and irrigation plantations were below the reported world average water footprint for this fruit crop [33]. At the same time, green water has a lower opportunity cost than blue water. However, the relationship between yield in rainfed and irrigated plantations indicates that a marginal increase (~3%) was achieved under irrigated production with a WF about 2.6 times higher than rainfed production.
Interannual variability of weather conditions, mainly precipitation, results in variable WF for the studied crop. For example, in 2015, unusual spring rainfall decreased the blue water demand for the crop that year. Weather and climate fluctuations affect therefore the production of the crop as well as the water demand of it at the production unit scale (plantation), but the steady increase in avocado planted surface indicates an overall increase in water use even if weather conditions are favorable such as those during the 2015 production cycle.
According to government REDPA databases, our findings indicate that in specific years, agroindustrial avocado production in the studied area uses the whole volume of water available for agriculture. We found that during 2017 water appropriation by avocado production reached up to 120% of the water volumes granted to agriculture in the municipality. This situation implies that other water uses were water-depleted. We foresee that excessive water withdrawals by agroindustrial avocado production will trigger social conflicts between different water users in a short period. These conflicts may increase in years with dry conditions.
Further, considering the UN Sustainable Development Goal 6 regarding blue water management efficiency and the mitigation of water scarcity, the evidence presented in this communication indicatesthat the actual agroindustrial avocado production model in the studied municipality does not align well with the UN goal 6. We can state then that the mainstream agroindustrial production model in the study area may generate water scarcity rather than mitigate it, especially during dry years.

Supplementary Materials

The following supporting information can be downloaded at: https://www.mdpi.com/article/10.3390/su14159664/s1, Figure S1: Avocado Mexico production; Table S1: Mensuales Uruapan Articulo Supplementary Data.

Author Contributions

Conceptualization, A.G.-T., D.J.F.-V., P.E.A.-C. and H.G.-G.-R.; methodology, A.F.G.-T., A.G.-T., D.J.F.-V., P.E.A.-C. and H.G.-G.-R.; formal analysis, A.G.-T. and D.J.F.-V.; investigation, A.G.-T., D.J.F.-V., H.G.-G.-R., F.Q.-R. and A.G.B.-A.; resources, A.G.-T., A.F.G.-T. and H.G.-G.-R.; data curation, A.G.-T., A.G.B.-A., F.Q-.R.; writing—original draft preparation, A.G.-T. and D.J.F.-V.; writing—review and editing, A.G.-T., D.J.F.-V., H.G.-G.-R., F.Q.-R. and A.G.B.-A.; supervision, A.F.G.-T., A.G.-T.; project administration, A.F.G.-T., A.G.-T. and H.G.-G.-R.; funding acquisition, A.F.G.-T., A.G.-T. and H.G.-G.-R. All authors have read and agreed to the published version of the manuscript.

Funding

This research was funded by Consejo Nacional de Ciencia y Tecnología (CONACyT), grant number CONACyT/PDCPN2016/3053; Instituto de Ciencia, Tecnología e Innovación de Michoacán PFCTI/ICTI/2019/A/315; COFOM-UMSNH 2016–2018 “Evaluación de la captación hídrico-pluvial mediante la metodología ecohidrológica de bosques templados en el estado de Michoacán”. D.J.F.-V. and F.Q.-R. received graduate study grants from CONACyT-PNPC for her doctoral and his master’s in science degrees respectively.

Institutional Review Board Statement

Not applicable.

Informed Consent Statement

Not applicable.

Acknowledgments

We dedicate this contribution to the scientific trajectories of the first author (A.F.G.-T.) and that of our friend and colleague researcher P.E.A.-C. of IEES-UNAM, whose perspectives and points of view were crucial in the development of this research. Both passed away during the preparation of the manuscript. A.F.G.-T. on 14 March 2022, while P.E.A.-C. on 2 February 2022. Thanks to both for their support, ideas, tenacity, and willingness to share. We also thank the work and effort of the three anonymous reviewers, their comments and suggestions really improved the quality of the paper.

Conflicts of Interest

The authors declare no conflict of interest.

References

  1. Xinchun, C.; Mengyang, W.; Xiangping, G.; Yalian, Z.; Yan, G.; Nan, W.; Weiguang, W. Assessing water scarcity in agricultural production system based on the generalized water resources and water footprint framework. Sci. Total Environ. 2017, 609, 587–597. [Google Scholar] [CrossRef]
  2. Huang, Z.; Hejazi, M.; Tang, Q.; Vernon, C.R.; Liu, Y.; Chen, M.; Calvin, K. Global agricultural green and blue water consumption under future climate and land use changes. J. Hydrol. 2019, 574, 242–256. [Google Scholar] [CrossRef]
  3. Vörösmarty, C.J.; McIntyre, P.B.; Gessner, M.O.; Dudgeon, D.; Prusevich, A.; Green, P.; Glidden, S.S.; Bunn, E.; Sullivan, C.A.; Reidy Liermann, C.; et al. Global threats to human water security and river biodiversity. Nature 2010, 467, 555–561. [Google Scholar] [CrossRef] [PubMed]
  4. Bakker, K. Water security: Research challenges and opportunities. Science 2012, 337, 914–915. [Google Scholar] [CrossRef] [PubMed]
  5. Hoekstra, A.Y.; Chapagain, A.K.; Mekonnen, M.M.; Aldaya, M.M. The Water Footprint Assessment Manual: Setting the Global Standard; Routledge: London, UK; Earthscan: London, UK, 2011; ISBN 978-1-84971.279-8. [Google Scholar]
  6. Hoekstra, A.Y.; Mekonnen, M.M. The water footprint of humanity. Proc. Natl. Acad. Sci. USA 2012, 109, 3232–3237. [Google Scholar] [CrossRef] [Green Version]
  7. Chico, D.; Aldaya, M.M.; Garrido, A. A water footprint assessment of a pair of jeans: The influence of agricultural policies on the sustainability of consumer products. J. Clean. Prod. 2013, 57, 238–248. [Google Scholar] [CrossRef] [Green Version]
  8. Agualimpia, O.N.G. Manual de Aplicación de Evaluación de Huella Hídrica Acorde A la Norma ISO 14046. 2016, ALICIA, CONCYTEC. Available online: https://repositorio.ana.gob.pe/handle/20.500.12543/3829 (accessed on 20 February 2022).
  9. Ramírez, A.A.; Carmona, L.G.; Romero, S.A. Análisis de ciclo de vida en el sector agrícola: El caso del municipio de Viotá, Cundinamarca (Colombia). Ambiente Desarro. 2014, 18, 117–133. [Google Scholar] [CrossRef] [Green Version]
  10. Rodés, R.R.; Robaina, F.G.; Puebla, J.H. Eficiencia en el uso del agua de riego en el cultivo de la papa (Solanum tuberosum L.) en el occidente de Cuba. Rev. Ing. Agrícola 2013, 3, 3–7. [Google Scholar]
  11. Le Roux, B.; van Der Laan, M.; Vahrmeijer, T.; Bristow, K.L.; Annandale, J.G. Establishing and testing a catchment water footprint framework to inform sustainable irrigation water use for an aquifer under stress. Sci. Total Environ. 2017, 599–600, 1119–1129. [Google Scholar] [CrossRef]
  12. Lamastra, L.; Miglietta, P.P.; Toma, P.; De Leo, F.; Massari, S. Virtual water trade of agri-food products: Evidence from Italian-Chinese relations. Sci. Total Environ. 2017, 599, 474–482. [Google Scholar] [CrossRef]
  13. Seckler, D.; Amarasinghe, U.; Molden, D.; De Silva, R.; Barker, R.W. World Water Demand and Supply, 1990 to 2025: Scenarios and Issues; International Water Management Institute: Colombo, Sri Lanka, 1988; ISBN 92-9090-354-6. [Google Scholar]
  14. Vanham, D.; Mekonnen, M.M. The scarcity-weighted water footprint provides unreliable water sustainability scoring. Sci. Total Environ. 2021, 756, 143992. [Google Scholar] [CrossRef]
  15. Oswald Spring, U. Water Resources in Mexico: Scarcity, Degradation, Stress, Conflicts, Management, and Policy; Springer Science & Business Media: London, UK; New York, NY, USA, 2011; ISBN 978-3-642-05431-0. [Google Scholar]
  16. Ramírez-Mejía, D.; Levers, C.; Mas, J.F. Spatial patterns and determinants of avocado frontier dynamics in Mexico. Reg. Environ. Change 2022, 22, 28. [Google Scholar] [CrossRef] [PubMed]
  17. FAOSTATS (Food and Agriculture Organization of the United Nations). Food and Agriculture Data. 2022. Available online: https://www.fao.org/faostat/en/#search/Avocado (accessed on 18 January 2022).
  18. Arima, E.Y.; Denvir, A.; Young, K.R.; González-Rodríguez, A.; García-Oliva, F. Modelling avocado-driven deforestation in Michoacán, Mexico. Environ. Res. Lett. 2022, 17, 034015. [Google Scholar] [CrossRef]
  19. De la Vega-Rivera, D.; Merino-Pérez, L. Socio-Environmental Impacts of the Avocado Boom in the Meseta Purépecha, Michoacán, Mexico. Sustainability 2021, 13, 7247. [Google Scholar] [CrossRef]
  20. Servicio de Información Agroalimentaria y Pesquera. 2022. Available online: https://nube.siap.gob.mx/cierreagricola/ (accessed on 30 January 2022).
  21. Cho, K.; Goldstein, B.; Gounaridis, D.; Newell, J.P. Where does your guacamole come from? Detecting deforestation associated with the export of avocados from Mexico to the United States. J. Environ. Manag. 2021, 278, 22–28. [Google Scholar] [CrossRef]
  22. Morales-Manilla, L.M.; Reyes González, A.; Cuevas García, G.; Ramuco, M.O. Inventario 2011 del Cultivo Del Aguacate Y Evaluación Del Impacto Ambiental Forestal en el Estado de Michoacán; Centro de Investigaciones en Geografía Ambiental, UNAM–COFUPRO: Morelia, Mexico, 2012.
  23. Budds, J. La demanda, evaluación y asignación del agua en el contexto de escasez: Un análisis del ciclo hidrosocial del valle del río La Ligua, Chile. Rev. De Geogr. Norte Gd. 2012, 52, 167–184. [Google Scholar] [CrossRef] [Green Version]
  24. Jepson, W.; Budds, J.; Eichelberger, L.; Harris, L.; Norman, E.; O’Reilly, K.; Young, S. Advancing human capabilities for water security: A relational approach. Water Secur. 2017, 1, 46–52. [Google Scholar] [CrossRef]
  25. Holmqvist, J.Å. Sustainable Water Footprint of Avocado Imported to norway from Chile: Norwegian Retailer’s Information and Influence on Water Management. Master’s Thesis, Norwegian University of Life Sciences, Ås, Norway, 2020. [Google Scholar]
  26. Tapia, V.L.M.; Bravo, M.E. Consumo de agua. In Impactos Ambientales Y Socioeconómicos Del Cambio De Uso Del Suelo Forestal A Huertos De Aguacate En Michoacán; Bravo Espinoza, M., Ed.; Instituto Nacional de Investigaciones Forestales Agrícolas y Pecuarias (INIFAP): Mexico City, Mexico, 2009; pp. 25–27. [Google Scholar]
  27. Potter, H.K.; Lundmark, L.; Röös, E. Environmental Impact of Plant-Based Foods; Report 112; Swedish University of Agricultural Sciences: Uppsala, Sweden, 2020; ISBN 978-91-576-9789-9. [Google Scholar]
  28. Poggio, C. The Avocado is not Responsible for the Drought in Chile. Fresh Plaza, 5 July 2018. Available online: https://www.freshplaza.com/article/2197726/the-avocado-is-not-responsible-for-the-drought-inchile/ (accessed on 12 December 2021).
  29. Redacción Récord. La APEAM Desarrolló Una Agenda Verde Con Estrategias Para el Cuidado De Recursos Naturales. 8 December 2018. Available online: https://www.record.com.mx/contra/depende-aguacate-de-michoacan-del-90-de-agua-de-lluvia (accessed on 12 December 2021).
  30. Mekonnen, M.M.; Hoekstra, A.Y. A global and high-resolution assessment of the green, blue and grey water footprint of wheat. Hydrol. Earth Syst. Sci. 2010, 14, 1259–1276. [Google Scholar] [CrossRef] [Green Version]
  31. Mekonnen, M.M.; Hoekstra, A.Y. The green, blue and gray water footprint of crops and derived crop products. Hydrol. Earth Syst. Sci. 2011, 15, 1577–1600. [Google Scholar] [CrossRef] [Green Version]
  32. Sommaruga, R.; Eldridge, H.M. Avocado Production: Water Footprint and Socio-economic Implications. EuroChoices 2021, 20, 48–53. [Google Scholar] [CrossRef]
  33. Ortiz-García, S.; Saynes-Santillán, V.; Bunge Vivier, V.; Anglés-Hernández, M.; Pérez, M.E.; Prado, B. Soil governance and sustainable agriculture in Mexico. Soil Secur. 2022, 7, 100059. [Google Scholar] [CrossRef]
  34. Instituto Nacional de Estadística y Geografía (INEGI). Áreas Geoestadísticas Municipales, escala 1:250,000. 1 June 2018. Available online: http://www.conabio.gob.mx/informacion/metadata/gis/muni_2018gw.xml?_httpcache%20=%20yes&_xsl=/db/metadata/xsl/fgdc_html.xsl&_indent%20=%20no (accessed on 12 December 2021).
  35. Eguiarte, A.F.; Centeno, R.R.; Hidalgo, J.Z. Methodologies used in the digital climatic atlas of Mexico for generating high-resolution maps. Geoacta 2014, 39, 165–173. [Google Scholar]
  36. García, E. Modificaciones al Sistema De Clasificación Climática De Köppen; Serie Libros, No 6.; Instituto de Geografía, Universidad Nacional Autónoma de México: Mexico City, Mexico, 2004; 90p, Available online: http://www.librosoa.unam.mx/handle/123456789/1372 (accessed on 14 December 2019).
  37. Instituto Nacional de Estadística y Geografía (INEGI). Climatología 1:250,000. Available online: https://www.inegi.org.mx/temas/climatologia/#Descargas. (accessed on 18 January 2022).
  38. Instituto Nacional de Estadisística y geografía (INEGI). Carta edafológica escala 1:250,000, Cartas Colima (E13-3) y Morelia (E14-1). 2013. Available online: https://inegi.org.mx/contenidos/productos/prod_serv/contenidos/espanol/bvinegi/productos/geografia/tematicas/Edafologia_hist/1_250_000/702825235147.pdf (accessed on 18 January 2022).
  39. Barajas-Alcalá, A.G. Capacidad de Sostenibilidad Ambiental, Social y Económica del Cultivo de Aguacate en Uruapan, Michoacán, México. Suelos Ecuat. 2021, 51, 1–13. [Google Scholar]
  40. Blum, W.E.H.; Schad, P.; Nortcliff, S. Essentials of Soil Science: Soil Formation, Functions, Use and Classification (World Reference Base, WRB); Borntraeger Science Plublishers: Stuttgart, Germany, 2018; ISBN 978-344-30-1090-4. [Google Scholar]
  41. Chapagain, A.K.; Hoekstra, A.Y. Virtual Water Flows between Nations in Relation to Trade in Livestock and Livestock Products (Value of Water Research Report Series No 13); UNESCO-IHE: Delft, The Netherlands, 2003; Available online: https://www.waterfootprint.org/media/downloads/Report13.pdf (accessed on 15 November 2021).
  42. Allen, R.G.; Pereira, L.S.; Raes, D.; Smith, M. Crop Evapotranspiration-Guidelines for Computing Crop Water Requirements; FAO Irrigation and Drainage Paper 56; Food and Agriculture Organization of the United Nations: Rome, Italy, 1998; p. D05109. [Google Scholar]
  43. Ewaid, S.H.; Abed, S.A.; Al-Ansari, N. Water footprint of wheat in Iraq. Water 2019, 11, 535. [Google Scholar] [CrossRef] [Green Version]
  44. Dastane, N.G. Effective Rainfall in Irrigated Agriculture; FAO Irrigation and drainage paper 25; Food and Agriculture Organization of the United Nations: Rome, Italy, 1978; Available online: https://www.fao.org/3/x5560e/x5560e00.htm#Contents (accessed on 15 October 2021).
  45. Smith, M. CROPWAT: A Computer Program for Irrigation Planning Management (No. 46).; Food and Agriculture Organization of the United Nations (FAO): Rome, Italy, 1992; Available online: https://books.google.it/books?id=p9tB2ht47NAC&pg=PP1&source=kp_read_button&redir_esc=y#v=onepage&q&f=false (accessed on 10 October 2021).
  46. Fuerte-Velázquez, D.J. Evaluación de la huella hídrica en la producción de aguacate y fresa en municipios de la Subcuenca de Cointzio. Un Análisis de Vulnerabilidad Hídrica. Ph.D. Thesis, Universidad Michoacana de San Nicolás de Hidalgo, Morelia, Mexico, 2022. [Google Scholar]
  47. REDPA (Registro Público de Derechos de Agua). Database of the Public Registers of Water Rights, National Water Commision (México), Uruapan Municipality. 2022. Available online: https://app.conagua.gob.mx/consultarepda.aspx (accessed on 30 April 2022).
  48. Asociación de Productores y Empacadores Exportadores de Aguacate en México (APEAM). Daily Weather Records. 2018. Available online: http://www.apeamclima.org/index.html?fbclid=IwAR3POX_hvYXrh3FuVdG0UEoDg7-CkUXA2kwhB0FFfWhbsk6quDhOgnR279E (accessed on 10 December 2019).
  49. Rocha-Arroyo, J.L.; Salazar-García, S.; Bárcenas-Ortega, A.E. Determinación irreversible de la floración del aguacate ‘Hass’ en Michoacán. Rev. Mex. De Cienc. Agrícolas 2010, 1, 469–478. [Google Scholar]
  50. Rocha-Arroyo, J.L.; Salazar-García, S.; Bárcenas-Ortega, A.E.; González-Durán, I.J.; Cossio-Vargas, L.E. Fenología del aguacate ‘Hass’ en Michoacán. Rev. Mex. De Cienc. Agrícolas 2011, 2, 303–316. [Google Scholar]
  51. Servicio Meteorológico Nacional. Registros meteorológicos diarios Uruapan, Michoacán Est. 16165. 2020. 6 April 2020. Available online: https://smn.conagua.gob.mx/tools/RESOURCES/Diarios/16165.txt (accessed on 18 January 2022).
  52. Hipel, K.W.; McLeod, A.I. Time Series Modelling of Water Resources and Environmental Systems; Elsevier: Amsterdam, The Netherlands, 1994. [Google Scholar]
  53. Barsimantov, J.; Navia, J.A. Forest cover change and land tenure change in Mexico’s avocado region: Is community forestry related to reduced deforestation for high-value crops? Appl. Geogr. 2012, 32, 844–853. [Google Scholar] [CrossRef]
  54. Carr, M.K.V. The water relations and irrigation requirements of avocado (Persea americana Mill.). Exp. Agric. 2013, 49, 256–278. [Google Scholar] [CrossRef]
  55. Schyns, J.F.; Hoekstra, A.Y.; Booij, M.J. Review and classification of indicators of green water availability and scarcity. Hydrol. Earth Syst. Sci. 2015, 19, 4581–4608. [Google Scholar] [CrossRef] [Green Version]
  56. Milne, N. Chile’s Booming Avocado Business Blamed for Water Shortages. Global Citeizen/Thomson and Reuters Foundation. 3 June 2019. Available online: https://www.globalcitizen.org/en/content/chile-avocado-business-water-shortages/ (accessed on 20 January 2022).
  57. DW Documental. Los Aguacates De Portugal: ¿Oro Verde o Riesgo Para el Medioambiente? 2021. Available online: https://youtu.be/l_0KqQp20kU (accessed on 20 January 2022).
  58. Maldonado Aranda, S. Stories of drug trafficking in rural Mexico: Territories, drugs and cartels in Michoacán. European Rev. Eur. De Estud. Latinoam. Y Del Caribe 2013, 94, 43–66. [Google Scholar] [CrossRef] [Green Version]
  59. Vilar, V.; Gohari, A.; Montel, N.; Roussel, V. Envoyé Spécial, Les Avocats Du Diable. 21 September 2017. Available online: https://bit.ly/35zfv9D (accessed on 25 January 2022).
  60. Curtis, P.G.; Slay, C.M.; Harris, N.L.V.; Tyukavina, A.; Hansen, M.C. Classifying drivers of global forest loss. Science 2018, 361, 1108–1111. [Google Scholar] [CrossRef] [PubMed]
  61. Vega-Agavo, M.I.; Suazo-Ortuño, I.; Lopez-Toledo, L.; Gómez-Tagle, A.; Sillero, N.; Pineda-López, R.; Alvarado-Díaz, J. Influence of avocado orchard landscapes on amphibians and reptiles in the trans-Mexican volcanic belt. Biotropica 2021, 53, 1631–1645. [Google Scholar] [CrossRef]
  62. BirdLife International. What are Key Biodiversity Areas? 2017. Available online: http://datazone.birdlife.org/sowb/casestudy/what-are-key-biodiversity-areas (accessed on 25 March 2021).
  63. Rivera-Hernández, J.E.; Blanco-Orozco, N.V.; Alcántara-Salinas, G.; Houbron, E.P.; Pérez-Sato, J.A. ¿Desarrollo sostenible o sustentable? La controversia de un concepto. Rev. Soc. Y Posgrado 2017, 15, 57–67. [Google Scholar] [CrossRef]
  64. Foladori, G. Ch. 7. La economía ecológica. In Sustentabilidad Desacuerdos Sobre el Desarrollo Sustentable; Guillermo Foladori, G., Pierri, N., Eds.; Miguel Ángel Porrúa: Mexico City, Mexico, 2001; pp. 189–195. ISBN 970-701-610-8. Available online: http://visitas.reduaz.mx/coleccion_desarrollo_migracion/sustentabilidad/Sustentabilidad10.pdf (accessed on 16 April 2022).
  65. Mekonnen, M.M.; Hoekstra, A.Y. Sustainability of the blue water footprint of crops. Adv. Water Resour. 2020, 143, 103679. [Google Scholar] [CrossRef]
  66. Rojas Falconi, C.L. Huella Hídrica en la Obtención De Palta (Persea Americana) Variedad Hass Para Exportación. Ph.D. Thesis, Universidad Nacional de Trujillo, Trujillo, Peru, 2019. [Google Scholar]
  67. Donoso, G.; Franco, E.G.; Blanco, J.L. Water footprints and agricultural growth: The case of Chile. Int. J. Water Resour. Dev. 2014, 32, 738–748. [Google Scholar] [CrossRef]
  68. Pineda, H.R.; Naranjo, J.F. Huella hídrica del cultivo de aguacate cv. Hass (Persea americana Mill.), en el Distrito de Conservación de Suelos Barbas-Bremen, Quindío, Colombia. Entre Cienc. E Ing. 2021, 15, 63–70. [Google Scholar]
  69. Richards, S.J.; Warneke, J.E.; Bingham, F.T. Avocado tree growth response to irrigation. Calif. Avocado Soc. Yearb. 1962, 46, 83–87. [Google Scholar]
  70. Caro, D.; Alessandrini, A.; Sporchia, F.; Borghesi, S. Global virtual water trade of avocado. J. Clean. Prod. 2021, 285, 124917. [Google Scholar] [CrossRef]
  71. Hoekstra, A.Y.; Hung, P.Q. Virtual Water Trade: A Quantification of Virtual Water Flows between Nations in Relation to International Crop Trade; Report No. 11; IHE: Delft, The Netherlands, 2002; Available online: https://www.waterfootprint.org/media/downloads/Report11.pdf (accessed on 15 February 2022).
  72. Richards, S.J.; Moore, P.W.; Bingham, F.T.; Embleton, T.W.; Labanauskas, C.K. Avocado irrigation and nitrogen fertilization plots at the Citrus Experiment Station. Calif. Avocado Soc. Yearb. 1958, 42, 25–29. [Google Scholar]
  73. Lahav, E.; Kalmar, D. Water requirements of avocado in Israel. II.* Influence on yield, fruit growth and oil content. Aust. J. Agric. Res. 1977, 28, 869–877. [Google Scholar] [CrossRef]
  74. Torres, F. Comuneros de Villa Madero Combaten daños ambientales de aguacateros. El Sol de Morelia Online, 1 February 2022. Available online: https://www.elsoldemorelia.com.mx/local/municipios/comuneros-de-villa-madero-combaten-danos-ambientales-de-aguacateros-7806067.html (accessed on 10 February 2022).
  75. Aguacate, Inicia la Batalla por el Agua. La Voz de Michoacán, 2 February 2022. Available online: https://youtu.be/J6U0LRMa_cc (accessed on 18 April 2022).
Figure 1. Study area location with Uruapan Municipality (black polygon) and avocado plantation distribution in the Avocado Belt of Michoacan (yellow polygons).
Sustainability 14 09664 g001
Figure 2. Mean monthly weather time series for Uruapan municipality between December 2011 and June 2018; Temperature (A), precipitation (B), wind speed (C), and relative humidity (D). Note the winter and spring of 2015 with abnormally high precipitation depths (B).
Sustainability 14 09664 g002
Table 1. Parameters considered for the soil and crop components of the CROPWAT v 8.0 model [35].
Soil
Total Available Soil Moisture (mm/m)150
Maximum rain infiltration rate (mm/day)300
Maximum rooting depth (cm)120
Initial Soil Moisture Depletion (as % of TAM)20
Initial available Soil moisture (mm/m)110
Crop
Planting date14 January *
Harvest date31 October
Crop height (m)7.5
Crop StagesDaysKc valuesCritical depletion factorRooting depth (cm)
Initial300.60.2580
Development50---
Mid-season1800.850.2580
Late-season200.750.2580
Total290---
* Avocado is a perennial tree fruit crop, we considered planting date as the normal anthesis date.
Table 2. Annual rainfall, crop water requirement, effective rainfall, and irrigation requirement (IR) for avocado in Uruapan municipality for the 2012 to 2017 production cycles.
YearTotal Rainfall (mm)ETc (mm)Effective Rainfall (mm)IR (mm)
20121599.4913.0783.5346.3
20131680.7936.5770.9388.3
20141677.0937.2895.3312.9
20152296.6906.31123.3154.2
20161531.4972.4813.1360.6
20171725.0977.8761.4446.1
Mean1757.0933.1877.2312.5
Italic case figures correspond to mean values.
Table 3. Avocado planted surface, production volume, and yield for rainfed and irrigated plantations in Uruapan municipality for the 2012 to 2017 production cycles.
YearRainfed PlantationsIrrigated Plantations
Planted Surface (ha)Production Volume (tons)Crop Yield (ton ha1 year1)Planted Surface (ha)Production Volume (tons)Crop Yield (ton ha1 year1)
2012373837,249.29.97872189,826.310.30
2013473347,330.010.00881088,100.010.00
2014496049,500.89.98907091,607.010.10
2015500049,750.09.95930094,860.010.20
2016511650,992.09.979980103,504.010.37
2017550151,804.09.429600101,701.410.59
Mean4709.446,964.49.889176.293,579.510.26
Italic case figures correspond to mean values.
Table 4. Water volumes used in avocado production in rainfed and irrigated plantations in Uruapan municipality for the years 2012 to 2017.
YearRainfed PlantationsIrrigated Plantations
Rainfall
(Mm3)
Rainfall
(Mm3)
Irrigation
(Mm3)
Total
(Mm3)
Total Rainfed and Irrigated Plantations
(Mm3)
201229.368.330.298.5127.8
201336.567.934.2102.1138.6
201444.481.228.4109.6154.0
201556.2104.514.3118.8175.0
201641.681.136.0117.1158.7
201741.973.142.8115.9157.8
Mean41.679.431.0110.4152.0
Italic case figures correspond to mean values. Water volumes are given in Mega m3.
Table 5. Water footprint of agroindustrial avocado production in Uruapan municipality under rainfed (only green WF) and irrigation regimes (green and blue WF) for the years 2012 to 2017.
YearRainfed PlantationsIrrigated Plantations
Green WF (m3 ton1)Green WF (m3 ton1)Blue WF (m3 ton1)Total WF (m3 ton1)Mean Total WF for Rainfed and Irrigated Plantations (m3 ton1)
2012293.9663.4293.2956.6625.3
2013364.9679.2342.11021.3693.1
2014445.0804.0281.01085.0765.0
2015564.51024.2140.61164.8864.6
2016417.4782.4347.01129.4773.4
2017444.8690.0404.21094.2769.5
Mean417.1790.6280.81071.4744.3
Italic case figures correspond to mean values. 1 m3 ton1 is equivalent to 1 L Kg1.
Table 6. Blue water footprint of avocado production in Uruapan municipality and surface, groundwater volumes, total concessed water volume for agriculture and proportion of appropriation of concessed water by avocado production in the years 2012 to 2017.
YearTotal Blue WF
(Mm3)
Surface Water Concession for Agricultural Use
(Mm3)
Groundwater Concession for Agricultural Use
(Mm3)
Total Concession Water for Agricultural Use
(Mm3)
Appropriation of Concessioned Water by Irrigated Avocado Production
(%)
201230.2022.9410.6733.6189.86
201334.2122.9411.0433.97100.69
201428.3822.9411.2434.1785.05
201514.3422.9411.8934.8241.18
201635.9922.9412.2235.16102.38
201742.8423.1012.5535.65120.17
Mean30.9922.9711.6034.5689.89
Italic numbers correspond to mean values, bold case corresponds to water appropriation over 100% of concessioned water.
Publisher’s Note: MDPI stays neutral with regard to jurisdictional claims in published maps and institutional affiliations.

