
Refinement Study on Pressure Relief Zone of Gas Extraction Borehole Considering Roughness


1
School of Mine Safety, North China Institute of Science and Technology, No. 467 College Street, Yanjiao High-Tech Zone, Langfang 065201, China
2
Emergency Science Research Academy, China Coal Research Institute, China Coal Technology and Engineering Group Co., Ltd., NO.5 Qingniangou Road, Hepingli, Beijing 100013, China
3
Emergency Management Training Center, China Europe Institute of Emergency Management, Party School of the Central Committee of C.P.C., National Academy of Governance, Beijing 100086, China
*
Author to whom correspondence should be addressed.
Sustainability 2022, 14(15), 9541; https://doi.org/10.3390/su14159541
Submission received: 6 July 2022
/
Revised: 29 July 2022
/
Accepted: 1 August 2022
/
Published: 3 August 2022
(This article belongs to the Special Issue Mine Disasters Control and Synergetic Mining: Challenges to Mine Sustainability)
Abstract
:Pre-pumping of coal seam gas by gas extraction borehole is an effective measure to manage gas. The existing study concluded that the pressure relief zone of the roadway is difficult to seal, and thus the sealing depth of the gas extraction borehole should generally exceed the pressure relief zone of the roadway. Based on the relationship between roughness and GSI, a numerical simulation was carried out with the engineering background of the 22200 machine tunnel of the E8 coal seam of the Sixth Mine of Pingdingshan Tianan Coal Industry Company Limited. The results of numerical simulation and field experiments show that: (1) the quantitative standard of whether the borehole has “air leakage” or whether the surrounding rock cracks around the borehole are connected to the free surface can be characterized by permeability; (2) the variation rate of relative permeability has an inflection point at 2–4 m from the free surface of the roadway wall; (3) the dividing point of whether the surrounding rock cracks around the borehole are connected to the free surface can be set at 6 m, which is located in the pressure relief zone. (4) when the sealing depth of the coal roadway is 6 m and the sealing depth of the rock roadway is 5 m, there is no gas leakage in the borehole, that is, there is an area where a crack is not connected with the free surface of the roadway in the pressure relief zone.
1. Introduction
The effect of borehole excavation on the stress distribution in the surrounding rock is essentially similar to that of a small circular tunnel excavation [1,2,3,4,5,6].
Most of the gas extraction boreholes are constructed in the wall of the underground coal mine roadway, therefore, the gas extraction boreholes will have a new impact on the redistribution of stress state after the tunnel roadway was constructed. the so-called loose circle or pressure relief zone formed by the borehole excavation coupled with the loose circle or pressure relief zone formed by the roadway, form a more unfavorable leakage circle for gas extraction [7,8,9,10,11,12,13,14,15,16,17,18,19,20,21,22,23,24,25,26].
However, since the diameter of the borehole is generally small, the expansion direction of the loose circle or pressure relief zone is the radial direction of the borehole. Relevant research shows [8,13,16,20] that even if the drainage, gas pressure and rock creep characteristics are considered, the maximum pressure relief circle of the borehole is still less than 1 m, which has little impact on the sealing parameters of gas drainage, coal seam water injection and gas pressure measurement, so it is rarely considered [8,13,16,20]. Based on the above situation, the coupling between the loose circle or pressure relief zone of the gas drainage borehole and the loose circle or pressure relief zone of the roadway has been less studied [1,4,5,19,20,21,22].
There are many methods, mainly focusing on two aspects, to judge whether the surrounding rock is stable. First, various strength failure criteria, such as M-C failure criterion, H-B failure criterion, D-P failure criterion, etc., indicate when the state of the rock is consistent with the rock failure criterion, which is when the rock or rock mass undergoes plastic failure and instability [1,5,15,27,28,29,30,31,32,33]. Second, stability depends on whether the surrounding rock is damaged, according to the relevant specifications and the size of surrounding rock deformation or deformation rate [2,15,30].
At present, the M-C failure criterion is mainly used for the stability analysis of the surrounding rock of the borehole. However, in engineering practice, the linear M-C failure criterion is not applicable due to the inherent nonlinear characteristics of rocks and rock masses, as well as the influence of structural surfaces, with stress states dependent on strength and affected by anisotropic rock masses. Especially in the case where the coal rock masses are mostly jointed rock masses, the damage characteristics are often more in line with the nonlinear H-B failure criterion [1,2,4,34]. At the same time, the joint roughness can be used as one of the indicators of the degree of stress concentration on the structural surface of the rock mass, which has a certain influence on the failure of the coal rock mass. Thus, it is necessary to establish the relationship between joint roughness and stress failure of coal rock mass [4,12,35,36,37,38,39,40,41,42,43,44,45,46].
2. Theoretical Fundamentals
2.1. Relationship between Roughness Coefficient and H-B Failure Criterion
Geological Strength Index GSI is a concept proposed by Hoek in the H-B failure criterion [28,34]. GSI is determined by the structure, integrity, discontinuity surface and other properties of rock. The larger the value of GSI, the more complete the rock mass, the better the macroscopic strength, and the harder the rock mass or rock [28,34,36,47,48]. The GSI rock mass classification system is shown in the literature [34].
However, the GSI value exists as a range, and a relatively accurate value cannot be obtained. Therefore, since the value of GSI has an element of subjectivity, Marinos and Hoek [49] suggest that it is better to sample more values within a certain range when taking the value, so as to better meet the characteristics of the rock itself such as nonlinear, nonhomogeneous, and anisotropic qualities. For example, it can be assumed that the values of GSI obey normal distribution under certain conditions, and then the corresponding probability distribution type can be obtained by Monte Carlo method, and finally the risk value of the plastic zone can be calculated by calculation.
Current research on improving the accuracy of GSI has attracted the attention of many researchers, and these studies have focused on two main aspects. One is the interpolation method, i.e., making a GSI quantification table similar to the one given by Hoek [34] by directly comparing the observation and measurement results with the GSI rock classification system. Among them, the following two studies have been widely used: Sonmez and Ulusay [48] improved the GSI taking values by integrating the factors of roughness, weathering degree and filling properties, using the rock volume joint number, rock structure polarity SR and rock surface condition roughness SCR; Cai and Kaiser [50] improved the GSI taking values based on the structural surface condition factor. The other aspect is that the equation of the relevant parameters determining the GSI taking value as a function of GSI was derived [35]. Obviously, the JRC mentioned before is an important influencing factor of GSI, and there is a certain functional relationship between JRC and GSI, as shown in Equation (1) [34,35,36].
where the above parameters are from the Q classification system; Jr is the joint roughness; Jn is the joint set coefficient; Ja is the joint alteration, Jw is the joint water reduction coefficient, and SFR is the stress discount factor. The parameter values can be referenced in the literature [50].
From Equation (1), it can be seen that GSI is simply positively correlated with Jr for a certain number of other variables.
In engineering practice, the linear M-C failure criterion could not explain the relevant problems well due to the nonlinear nature of the rock mass itself and the role of the jointing surface and the force situation on the strength with anisotropy. Especially in the case of coal rock masses mostly with joints, the force instability characteristics are often nonlinear and more in line with the H-B failure criterion [34,35,36].
Among them:
where σ1, σ3 are the maximum and minimum compressive stresses, respectively; σci is the uniaxial compressive strength of the rock; mb, s, a are the corresponding rock dimensionless parameters; mi is the dimensionless parameter, which can be obtained experimentally; GSI is the geological strength parameter; D is the disturbance factor.
2.2. Ontological Model
This simulation uses the H-B failure criterion, which, combined with the results of Section 2.1, has the following equation to determine whether damage occurs in the rock mass.
For relevant parameters, see Equations (1)–(5).
When, fs > 0, the material will suffer shear failure.
2.3. Relationship between Permeability and Gas Drainage Boreholes
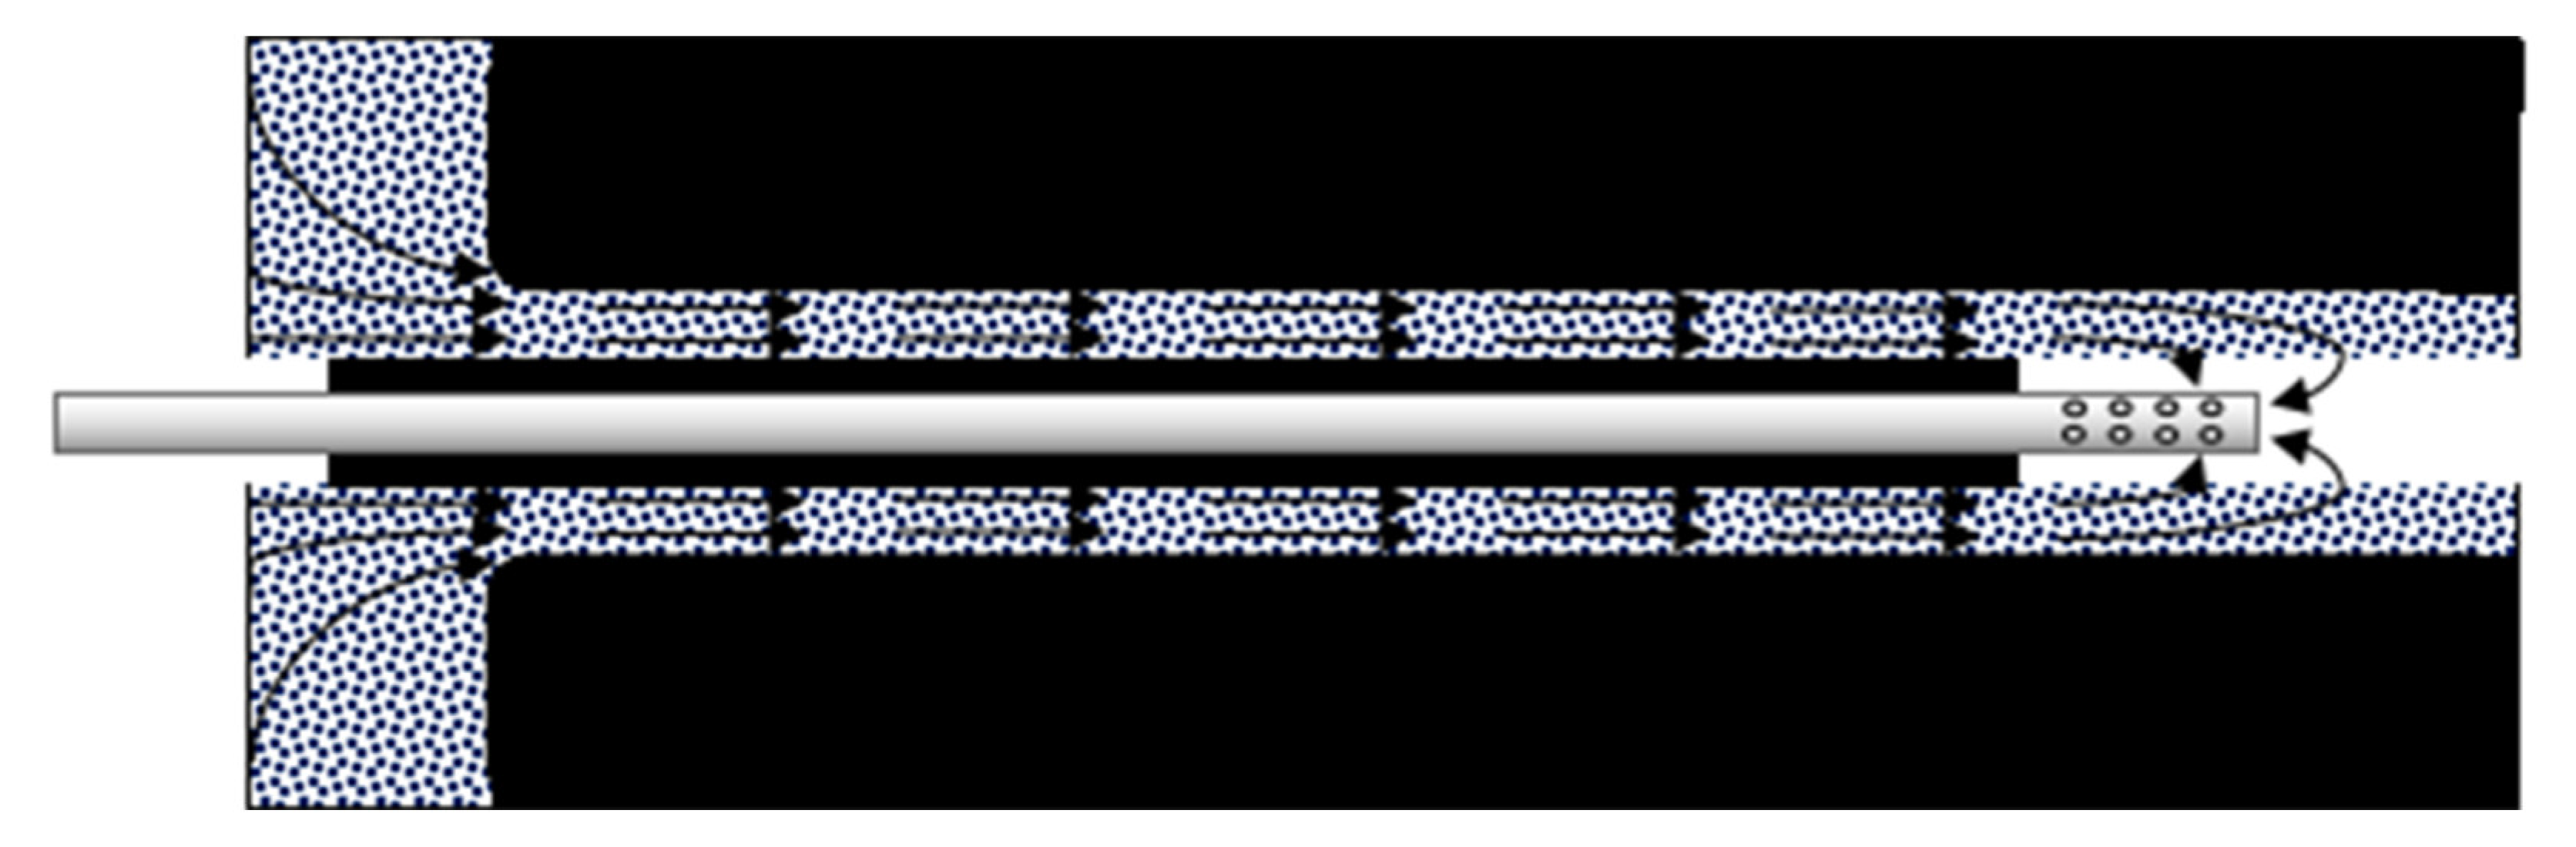
In the case that the coal rock mass is relatively intact and is not affected by tectonic or external forces to form large penetrating coal rock joints, the reasonable sealing parameters of the gas extraction borehole directly depend on the distribution of the fracture field around the borehole. A schematic diagram of a gas leakage fracture field of a gas extraction borehole is shown in Figure 1 [51].
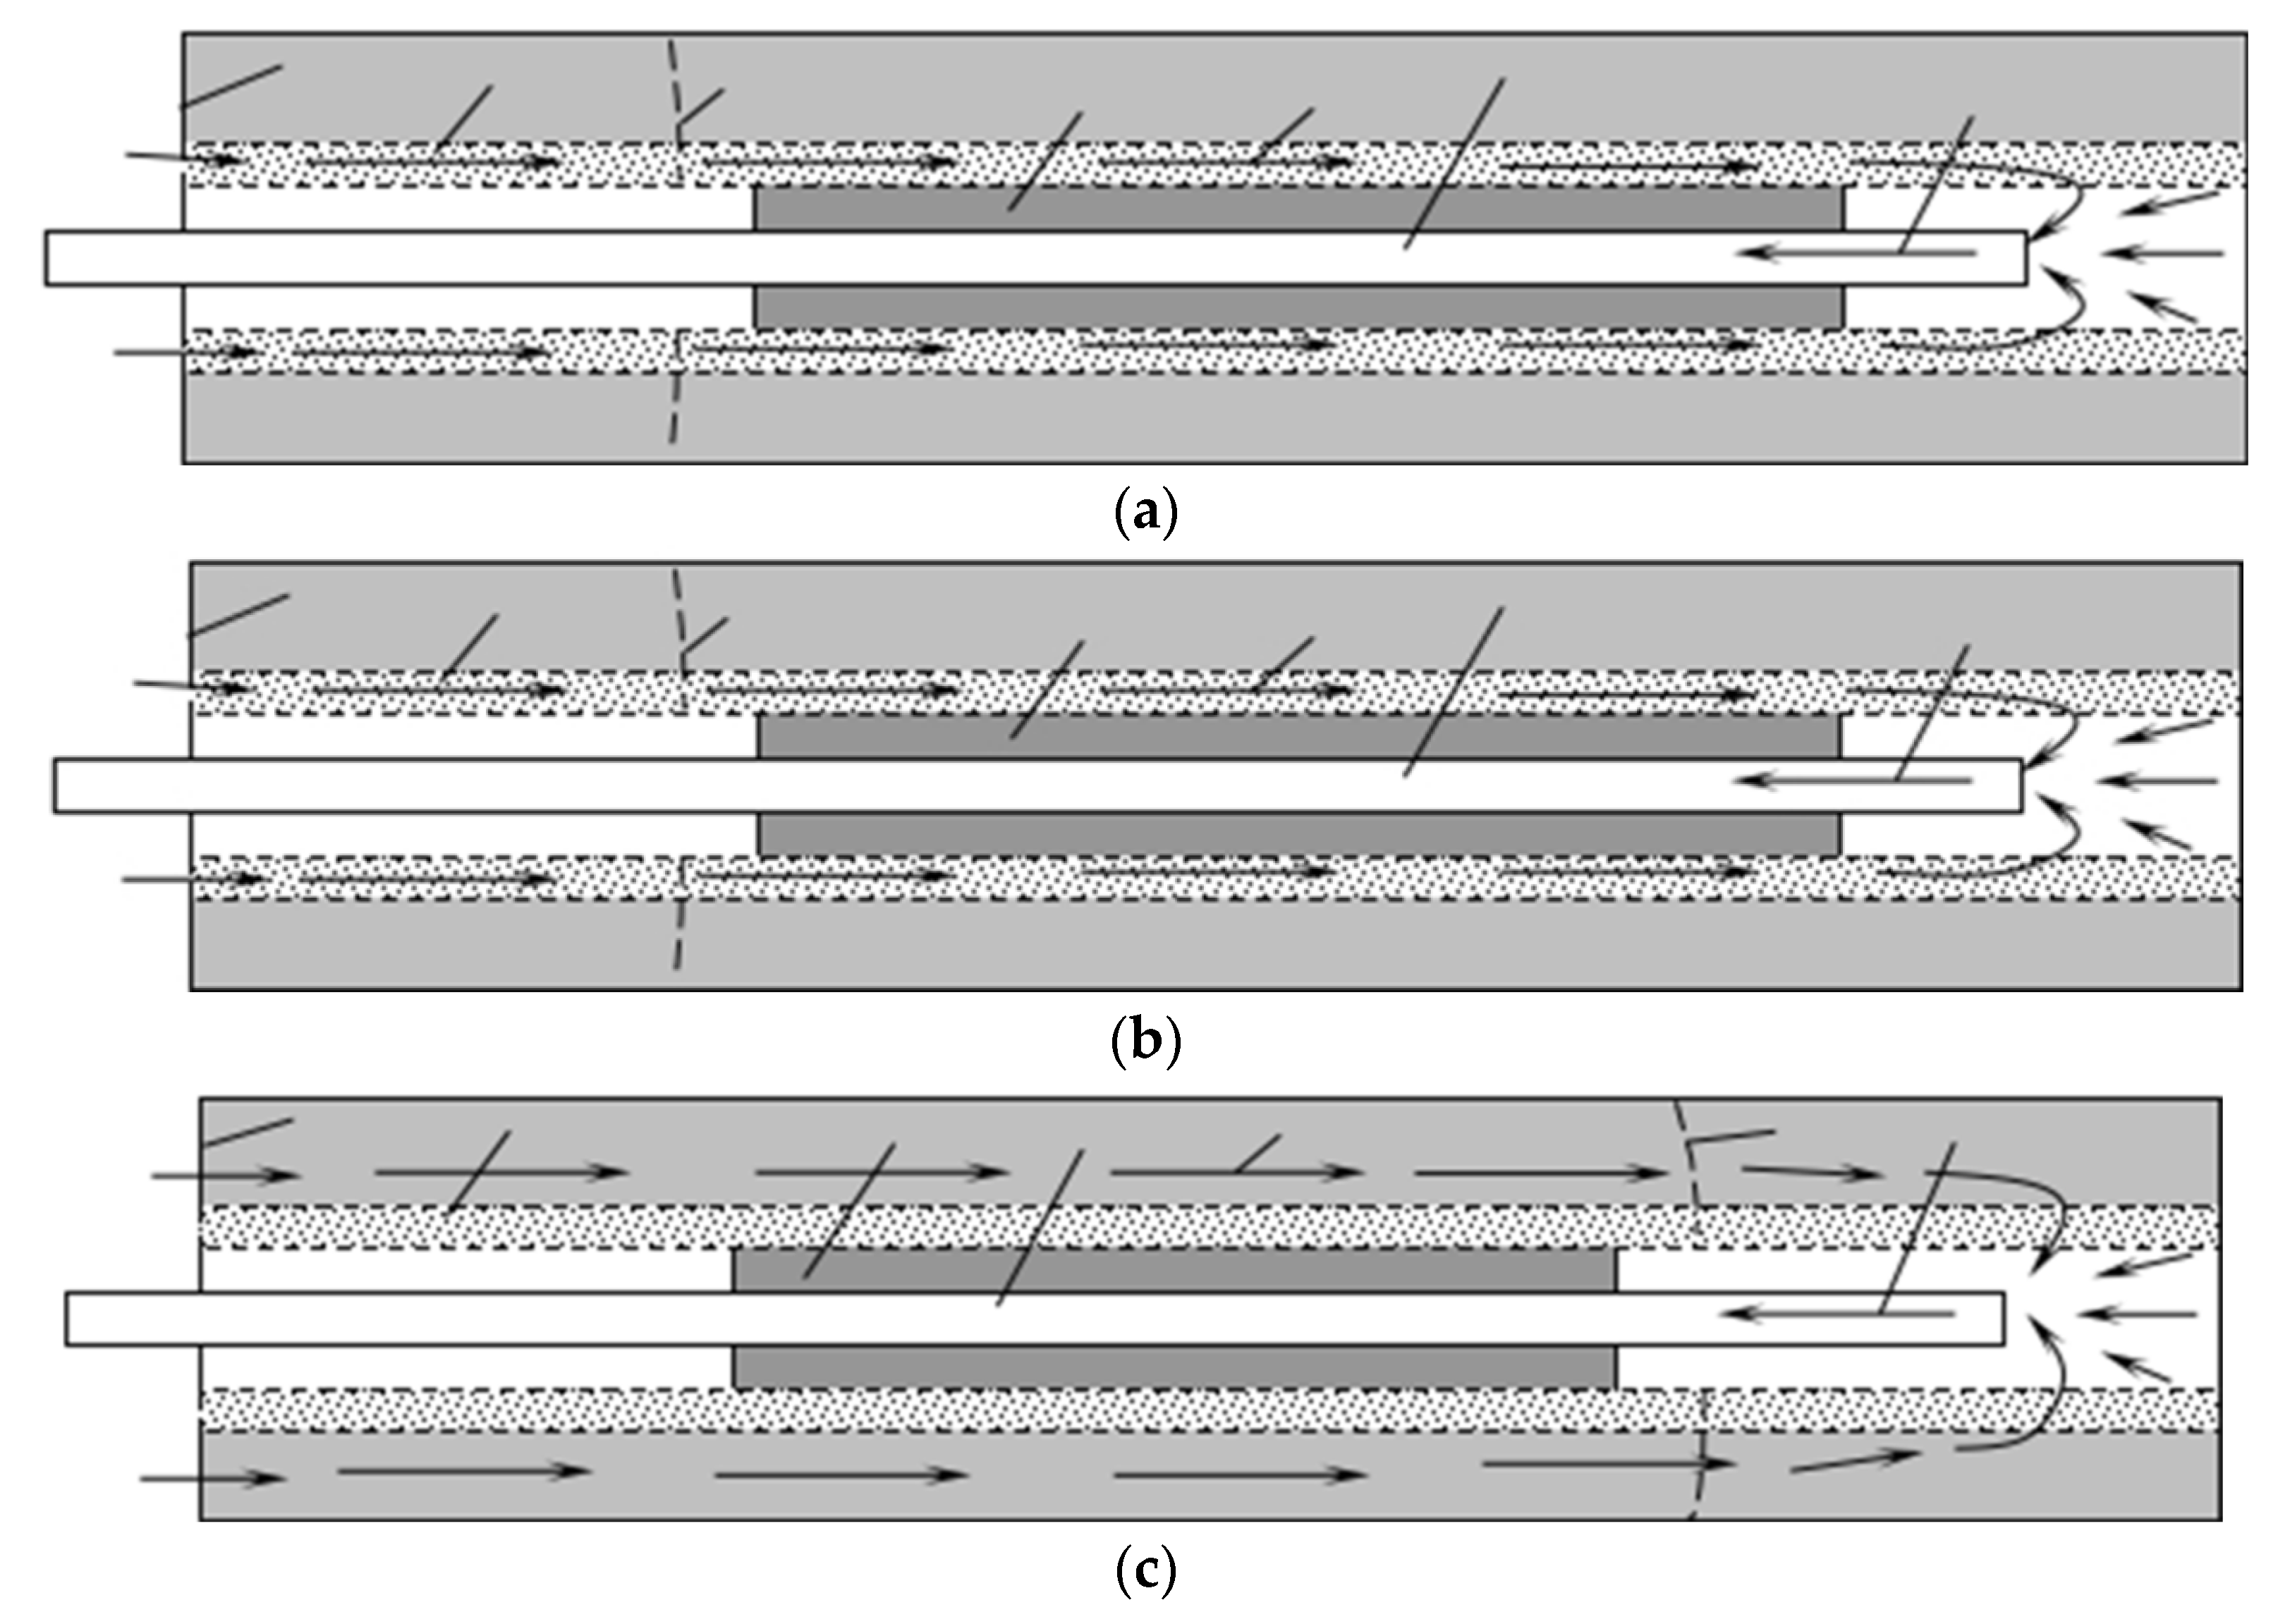
The degree of air leakage in a extraction borehole is an important indicator of the quality of the seal. There are three main ways for air leakage, and the actual air leakage is a combination of these three forms [12,22,24,25,51].
- (1)
- Strong permeability of the sealing material or the existence of cracks, causing air to flow into the borehole from the sealing material, as shown in Figure 2a.
- (2)
- The sealing material cannot seal the cracks developed in the surrounding rock of the borehole, causing air to leak in through these cracks, as shown in Figure 2b.
- (3)
- The sealing depth did not exceed “an area where the surrounding rock cracks are connected with the free surface of the roadway side”, resulting in the cracks of the borehole orifice being connected with the cracks in the deep part of the sealing section, and then air leakage, as shown in Figure 2c.
In order to simplify the problem of “gas leakage” in the borehole, assuming that the surrounding rock around the borehole is absolutely dense before excavation or the maximum pore and crack scale is smaller than the diameter of gas molecules and the permeability is zero, then the common point of the above three gas leakage paths is that the gas leakage channel will eventually communicate with the free surface of the roadway. That is, no matter how the surrounding rock cracks around the borehole expand and develop, a channel through the surrounding rock and directly to the free surface of the roadway wall will eventually be formed. In contrast, even if the cracks in the surrounding rock of the borehole are highly developed and pass through each other in a certain range, the cracks eventually should not pass through with the free surface of the roadway wall, and the borehole must not leak air. Therefore, the loose circle or pressure relief zone in the surrounding rock of the borehole can be distinguished into “an area where the crack of the surrounding rock of the borehole is connected with the free surface of the roadway wall”(it can be abbreviated as CCR) and “an area where the crack of the surrounding rock of the borehole is not connected with the free surface of the roadway wall”(it can be abbreviated as NCCR). However, it is difficult to judge whether the crack is connected to the free surface of the roadway through current research results. At the same time, some permeability of the surrounding rock exists in practice, to a certain extent. Due to the objective existence of permeability of the surrounding rock, the gas in the borehole will definitely penetrate into the roadway through the surrounding rock or the sealing material. Therefore, theoretically, the problem of “gas leakage” in boreholes is inevitable. As the research on permeability is more mature, we propose that the quantitative standard of whether the borehole has “air leakage” or whether the surrounding rock cracks around the borehole are connected to the free surface can be characterized by permeability.
2.4. Permeability Model
- (1)
- Permeability evolution equation of coal mass after excavation and decompression of the roadway
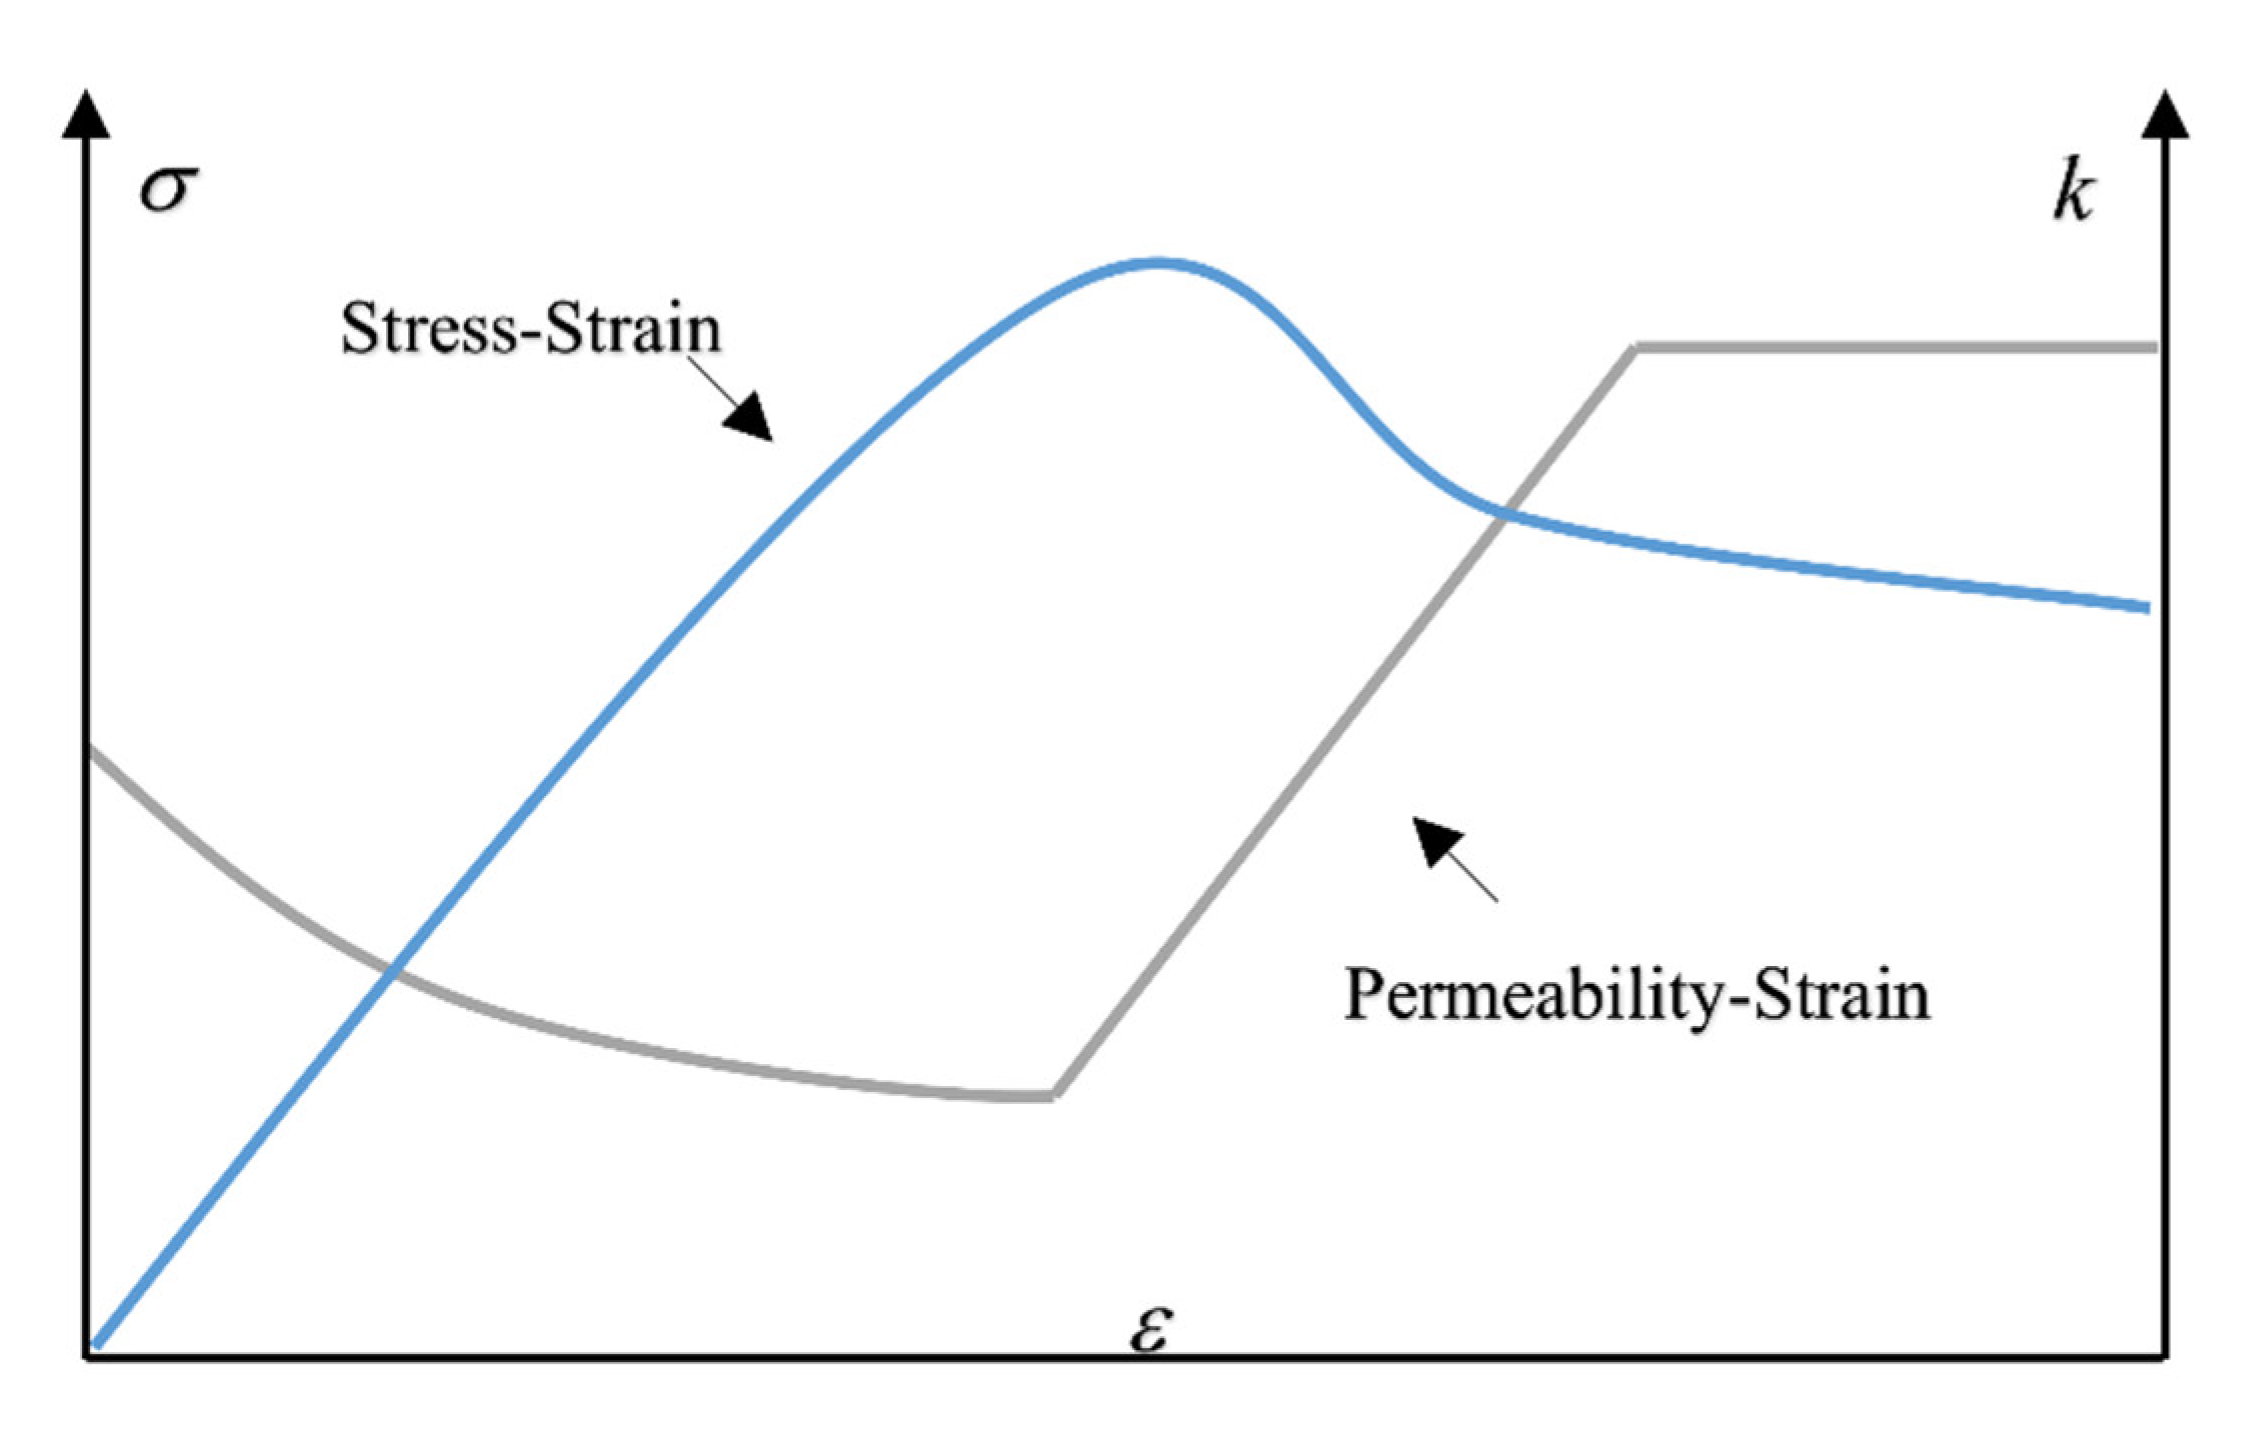
After the excavation and decompression of the roadway, the stress is redistributed after the roadway surrounding rock is disturbed. The change of stress distribution affects the stress state of surrounding rock. From the original three-dimensional stress, gradually the stress in the direction of the free surface near the roadway wall becomes two-dimensional or even one-dimensional. The strength of the surrounding rock mass and other indicators also change significantly. The coal mass near the roadway wall is less strong due to the loss of the surrounding pressure, and plastic deformation or even loss of bearing capacity occurs in a state lower than the original rock stress. With the occurrence of plastic deformation, the coal mass inherent fractures or pores will develop rapidly along its weak surface, and even macroscopic connected cracks appear, and the coal mass permeability increases rapidly during this process. While the coal mass near the peak stress point is under larger circumferential pressure, the coal mass is still in the elastic-plastic critical state although it is under the maximum stress; the pores or cracks in the coal mass are closed under the larger stress, and the permeability is minimized. The characteristic curve of permeability change corresponding to the full stress-strain process of coal rock is shown in Figure 3 [52,53].
As shown in Figure 3, the relationship between its permeability and volumetric stress when the coal mass undergoes only elastic deformation is:
where:
ka—permeability of coal mass in elastic deformation phase, m2;
k0—Initial permeability of the coal mass, m2.
bσ—Coefficient of effect of volumetric stress on permeability, MPa−1.
ΔΘ—Volume stress change, Θ = σ1 + σ2 + σ3, MPa.
After the damage expansion of the coal mass occurs, the damage fracture of the coal mass leads to a sudden increase in permeability, and the permeability increases to:
where:
kb—permeability of coal mass in plastic deformation state, m2;
εp—equivalent plastic strain.
εp*—initial equivalent plastic strain in the residual strength phase.
ζ—permeability surge factor.
The coefficient of influence of volumetric stress on coal permeability bσ= −0.1 MPa−1, the initial equivalent plastic strain in the residual strength phase εp* = 0.001 and the permeability surge factor ζ = 10. The equivalent plastic strain εp can be calculated by the following equation
where ε1p, ε2p, ε3p—plastic principal strain.
Permeability of the coal mass in the residual strength stage:
where kc—coal mass permeability during the residual strength phase, m2;
Therefore, the permeability of the coal mass after the unloading of the roadway can be divided according to the size of plastic deformation as follows:
where k1—permeability after pressure relief, m2.
The relationship of porosity of the corresponding coal mass is deduced from the cubic law as:
where:
ϕ1—porosity of the roadway after decompression.
ϕ0—original porosity.
The next section aims to provide a concise and precise description of the experimental results, their interpretation, as well as the experimental conclusions that can be drawn.
3. Case Study and Geometrical Model Generation
3.1. Background of Case Study
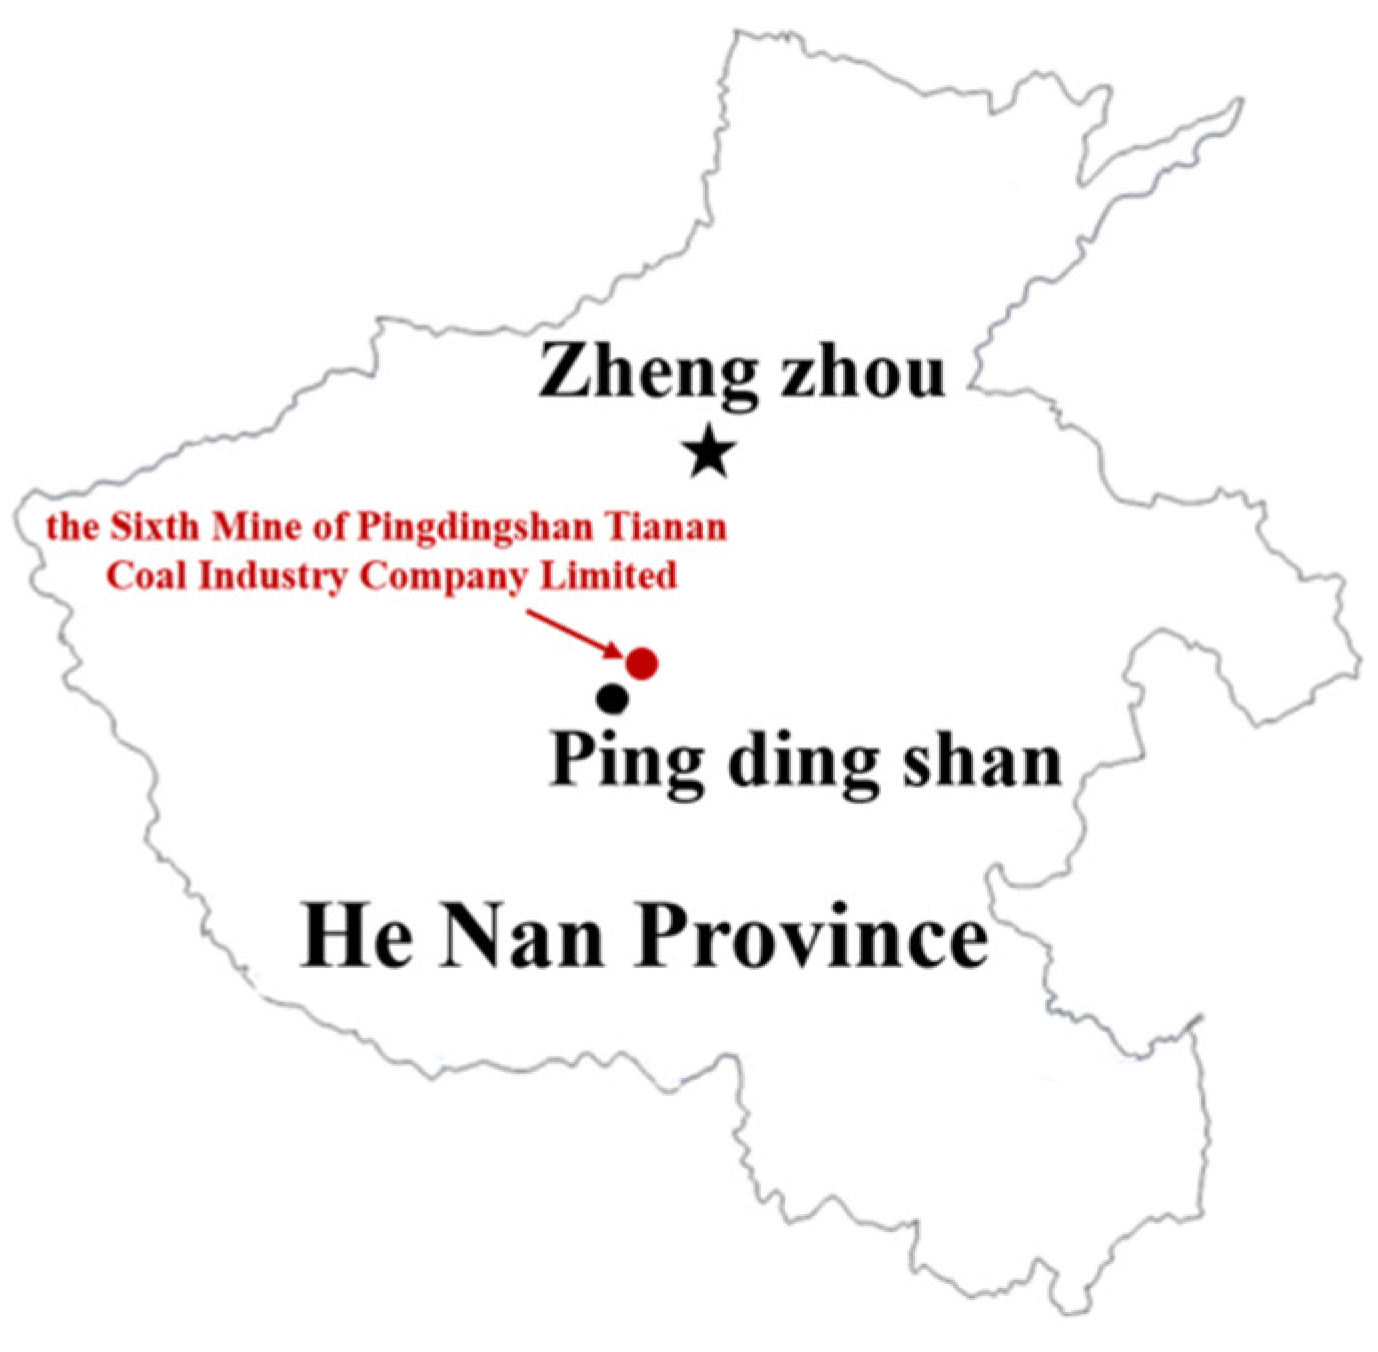
The Sixth Mine of Pingdingshan Tianan Coal Company Limited is located about 8 km northwest of the center of Pingdingshan City, Henan Province, and is one of the large backbone mines of Zhongping Energy and Chemical Group, which belongs to the Pingdingshan Coalfield and is under the jurisdiction of Baofeng County and Pingdingshan City (Figure 4). The geographical coordinates are 113°11′45″~113°22′30″ E, 33°40′15″~33°48′45″ N.
The highest point in the Sixth Mine mine field is Longshan with an elevation of +464.24 m, and the lowest point is Wuzhuang Village with an elevation of +128 m. Its main and auxiliary wells are located on the south slope of Longshan. The ridge is NW-trending, the southern slope is steeper, and the northern slope is gentler, in the form of a single-sided mountain.
Within the mine field, large folds are not developed, and only the wavy undulation of the coal seam along the strike and the secondary wide and gentle folds associated by the side of the fault are seen, with relatively large Shanzhuang syncline. According to the introduction of the mine geological report, the major faults within the mine field include Guodishan normal fault, Shanzhuang No. 1 reverse fault, Shanzhuang No. 2 reverse fault, Magou normal fault, F2 normal fault, f1-1 normal fault, f1-2 normal fault and Liujia normal fault.
The E8 coal seam 22200 machine road serves the E8 coal seam 22200 working face. The elevation of E8 coal seam 22200 working face is from −598 m to −630 m, corresponding to the surface elevation of 220 m–310 m. The location of the shaft: the eastern part is the protected coal pillar of E2 downhill; the western part is 300 m west of the 47 exploration line; the southern part is the E8-22180 mining area; the northern part is the unmined entity. The coal seams in the area are stable, with an overall gently inclined monoclinic structure, coal seam inclination 7–17°, coal seam inclination 9–11°, coal seam spacing between E8 and E9-10 between 8.6–19.0 m, coal seam thickness between 0.9–2.8 m, average coal thickness 2.0 m. The coal seam structure is simple, and the coal mass structure is primary structural coal. The coal type is 1/3 coking coal. The top of the coal seam has a layer of bituminous carbonaceous mudstone. The fault development pattern: the fault drop revealed by the E9-10 coal seam is larger than the fault drop revealed by the E8 coal seam. The hydrogeological conditions in the area are medium, and the water sources are mainly production water, roof sandstone aquifer, crack water and shallow old hollow water. With the shallow old hollow water isolated coal column 5 m, water exploration was developed through release design and measures. The ventilation method is one in one back ventilation method, using the upper corner extraction system. The original gas content of the working face is 2.99 m3/t, and the gas pressure is 0.25 MPa. The situation of the top and bottom of the coal seam is shown in Table 1.
3.2. Numerical Simulation
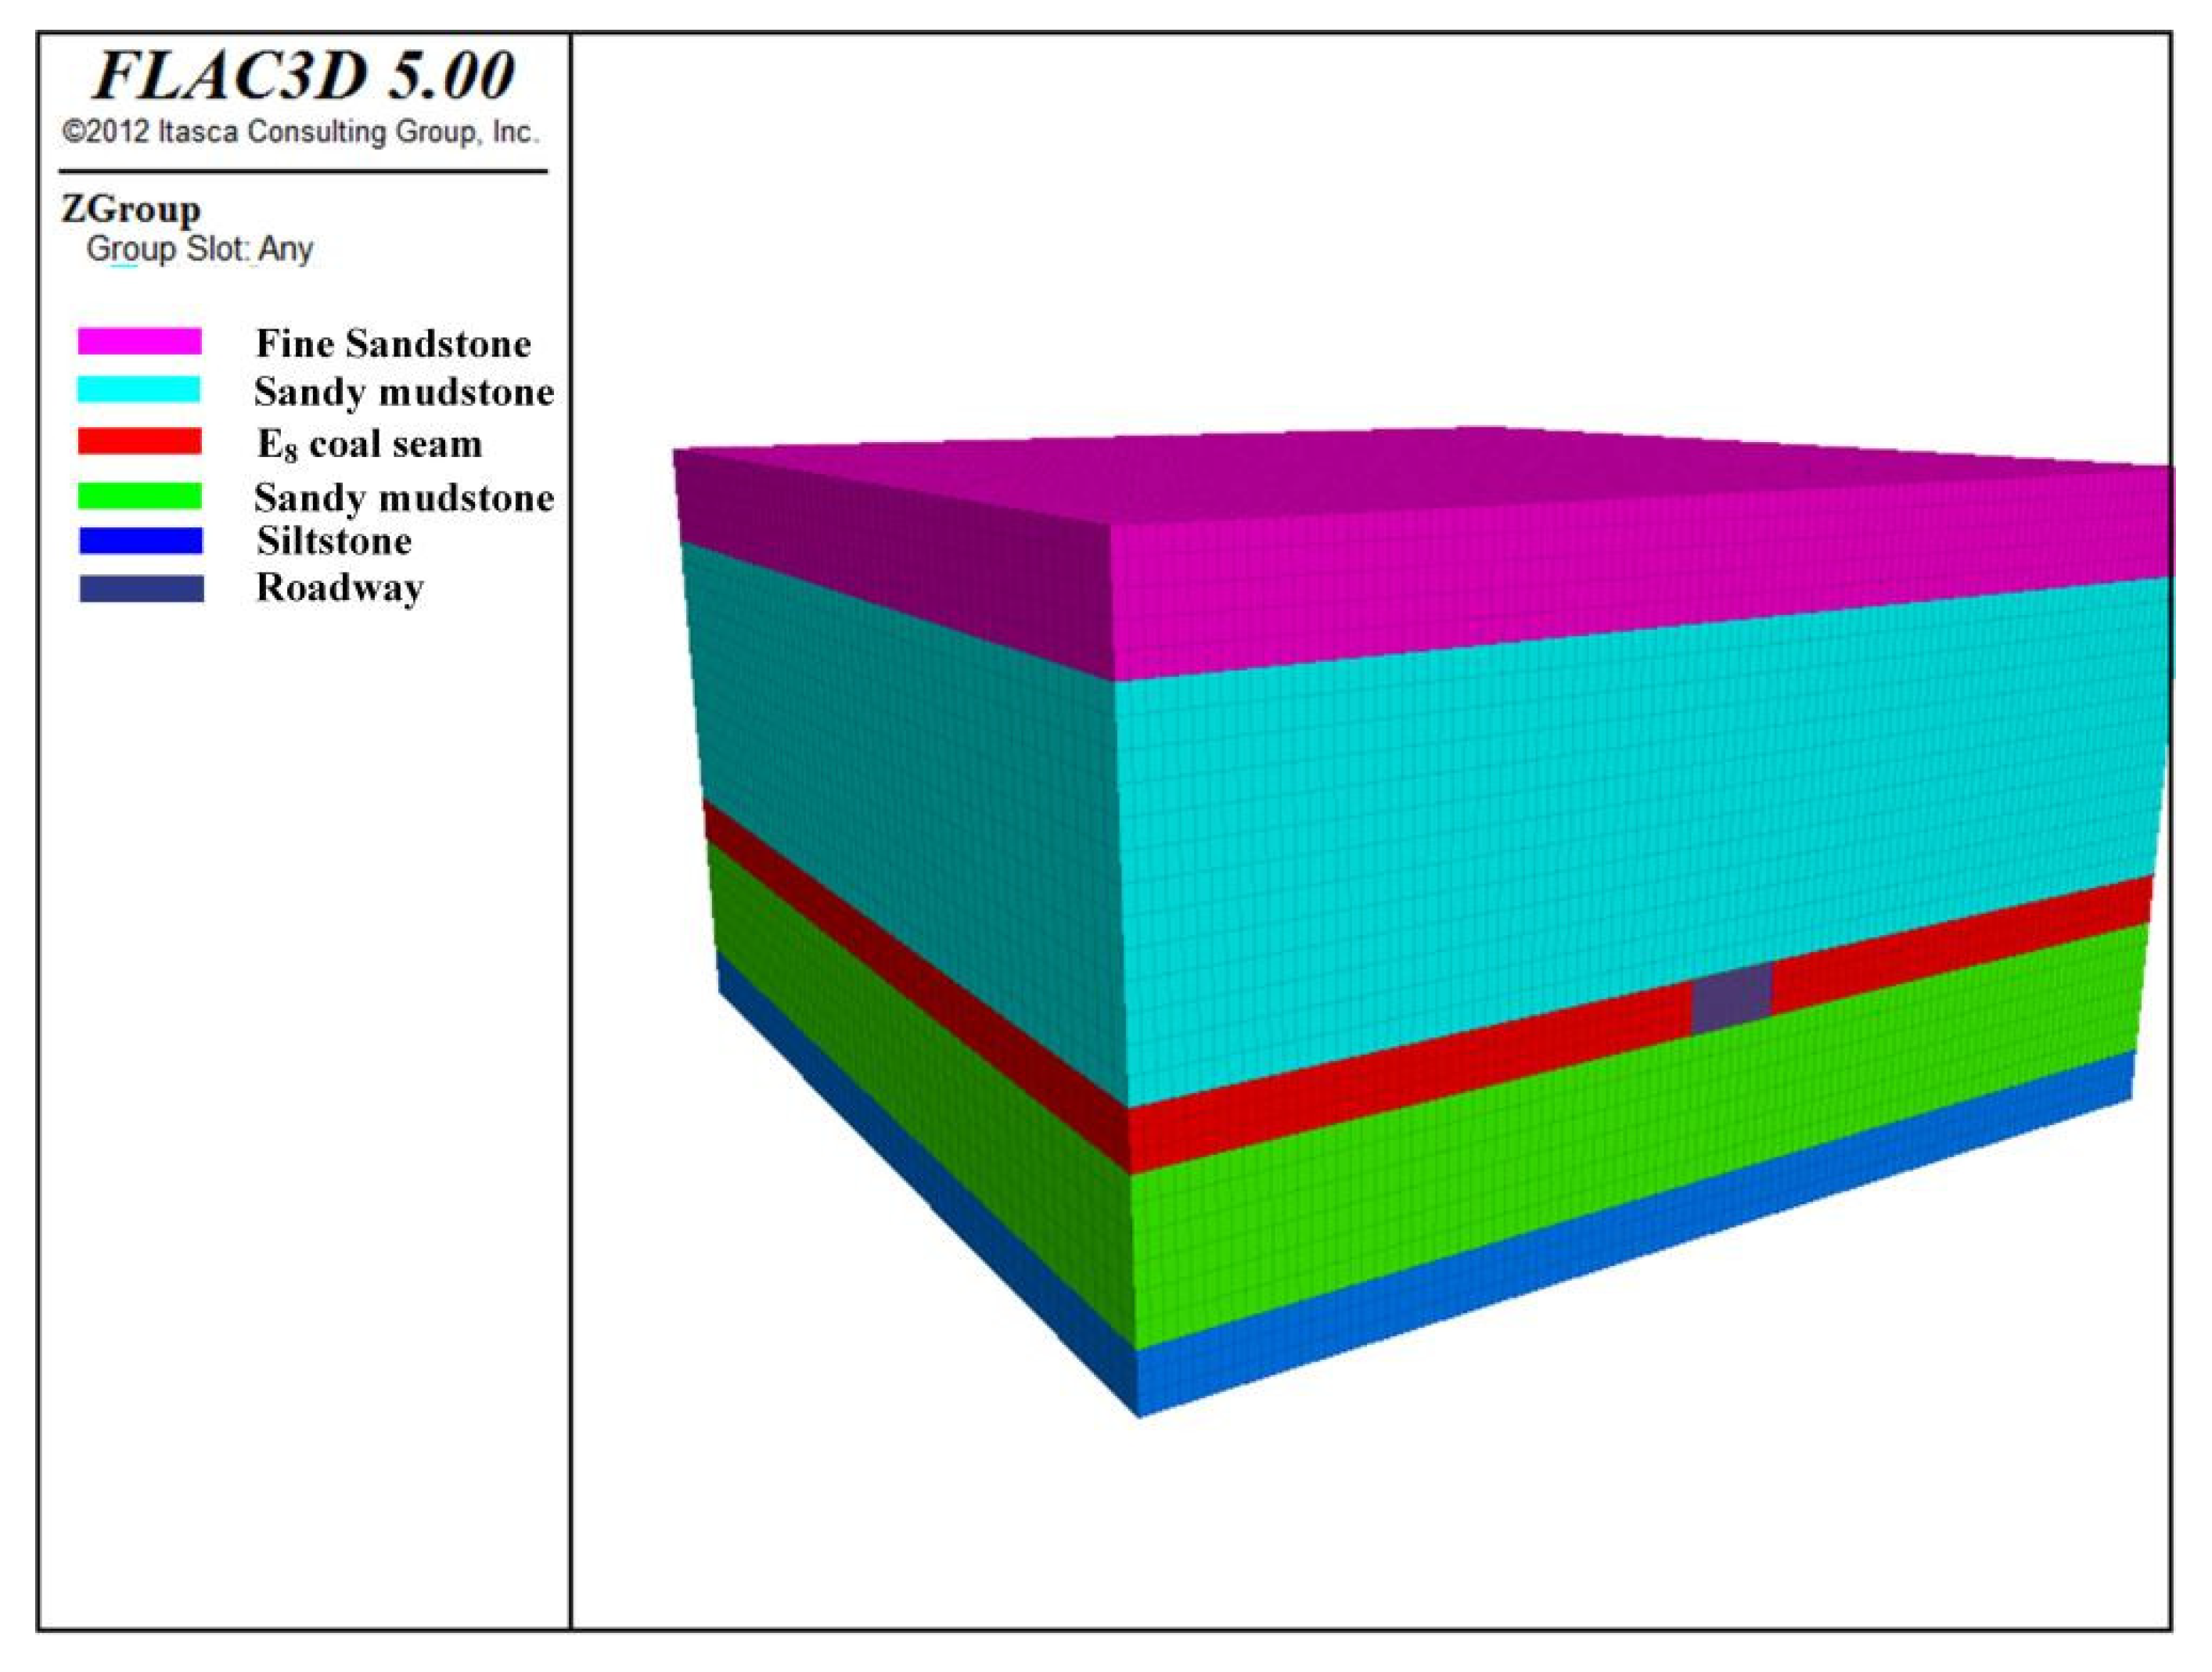
The numerical model was established using FLAC3D 5.0 in the background of the actual machine tunnel boring head of E8 coal seam in Sixth Mine of Pingdingshan Tianan Coal Industry Co. The numerical model is shown in Figure 5. The length, width and height of the model are 50 m, 50 m and 28.3 m respectively, and the width × height of the roadway is 4.4 × 2.2 m. The model boundary conditions (fixed bottom, restrained horizontal displacement of four sides, loaded on top). The ground stress is provided by the self weight of the overlying rock layer.
The model base parameters are shown in Table 2.
4. Numerical Simulation Results and Discussion
4.1. Stress Results
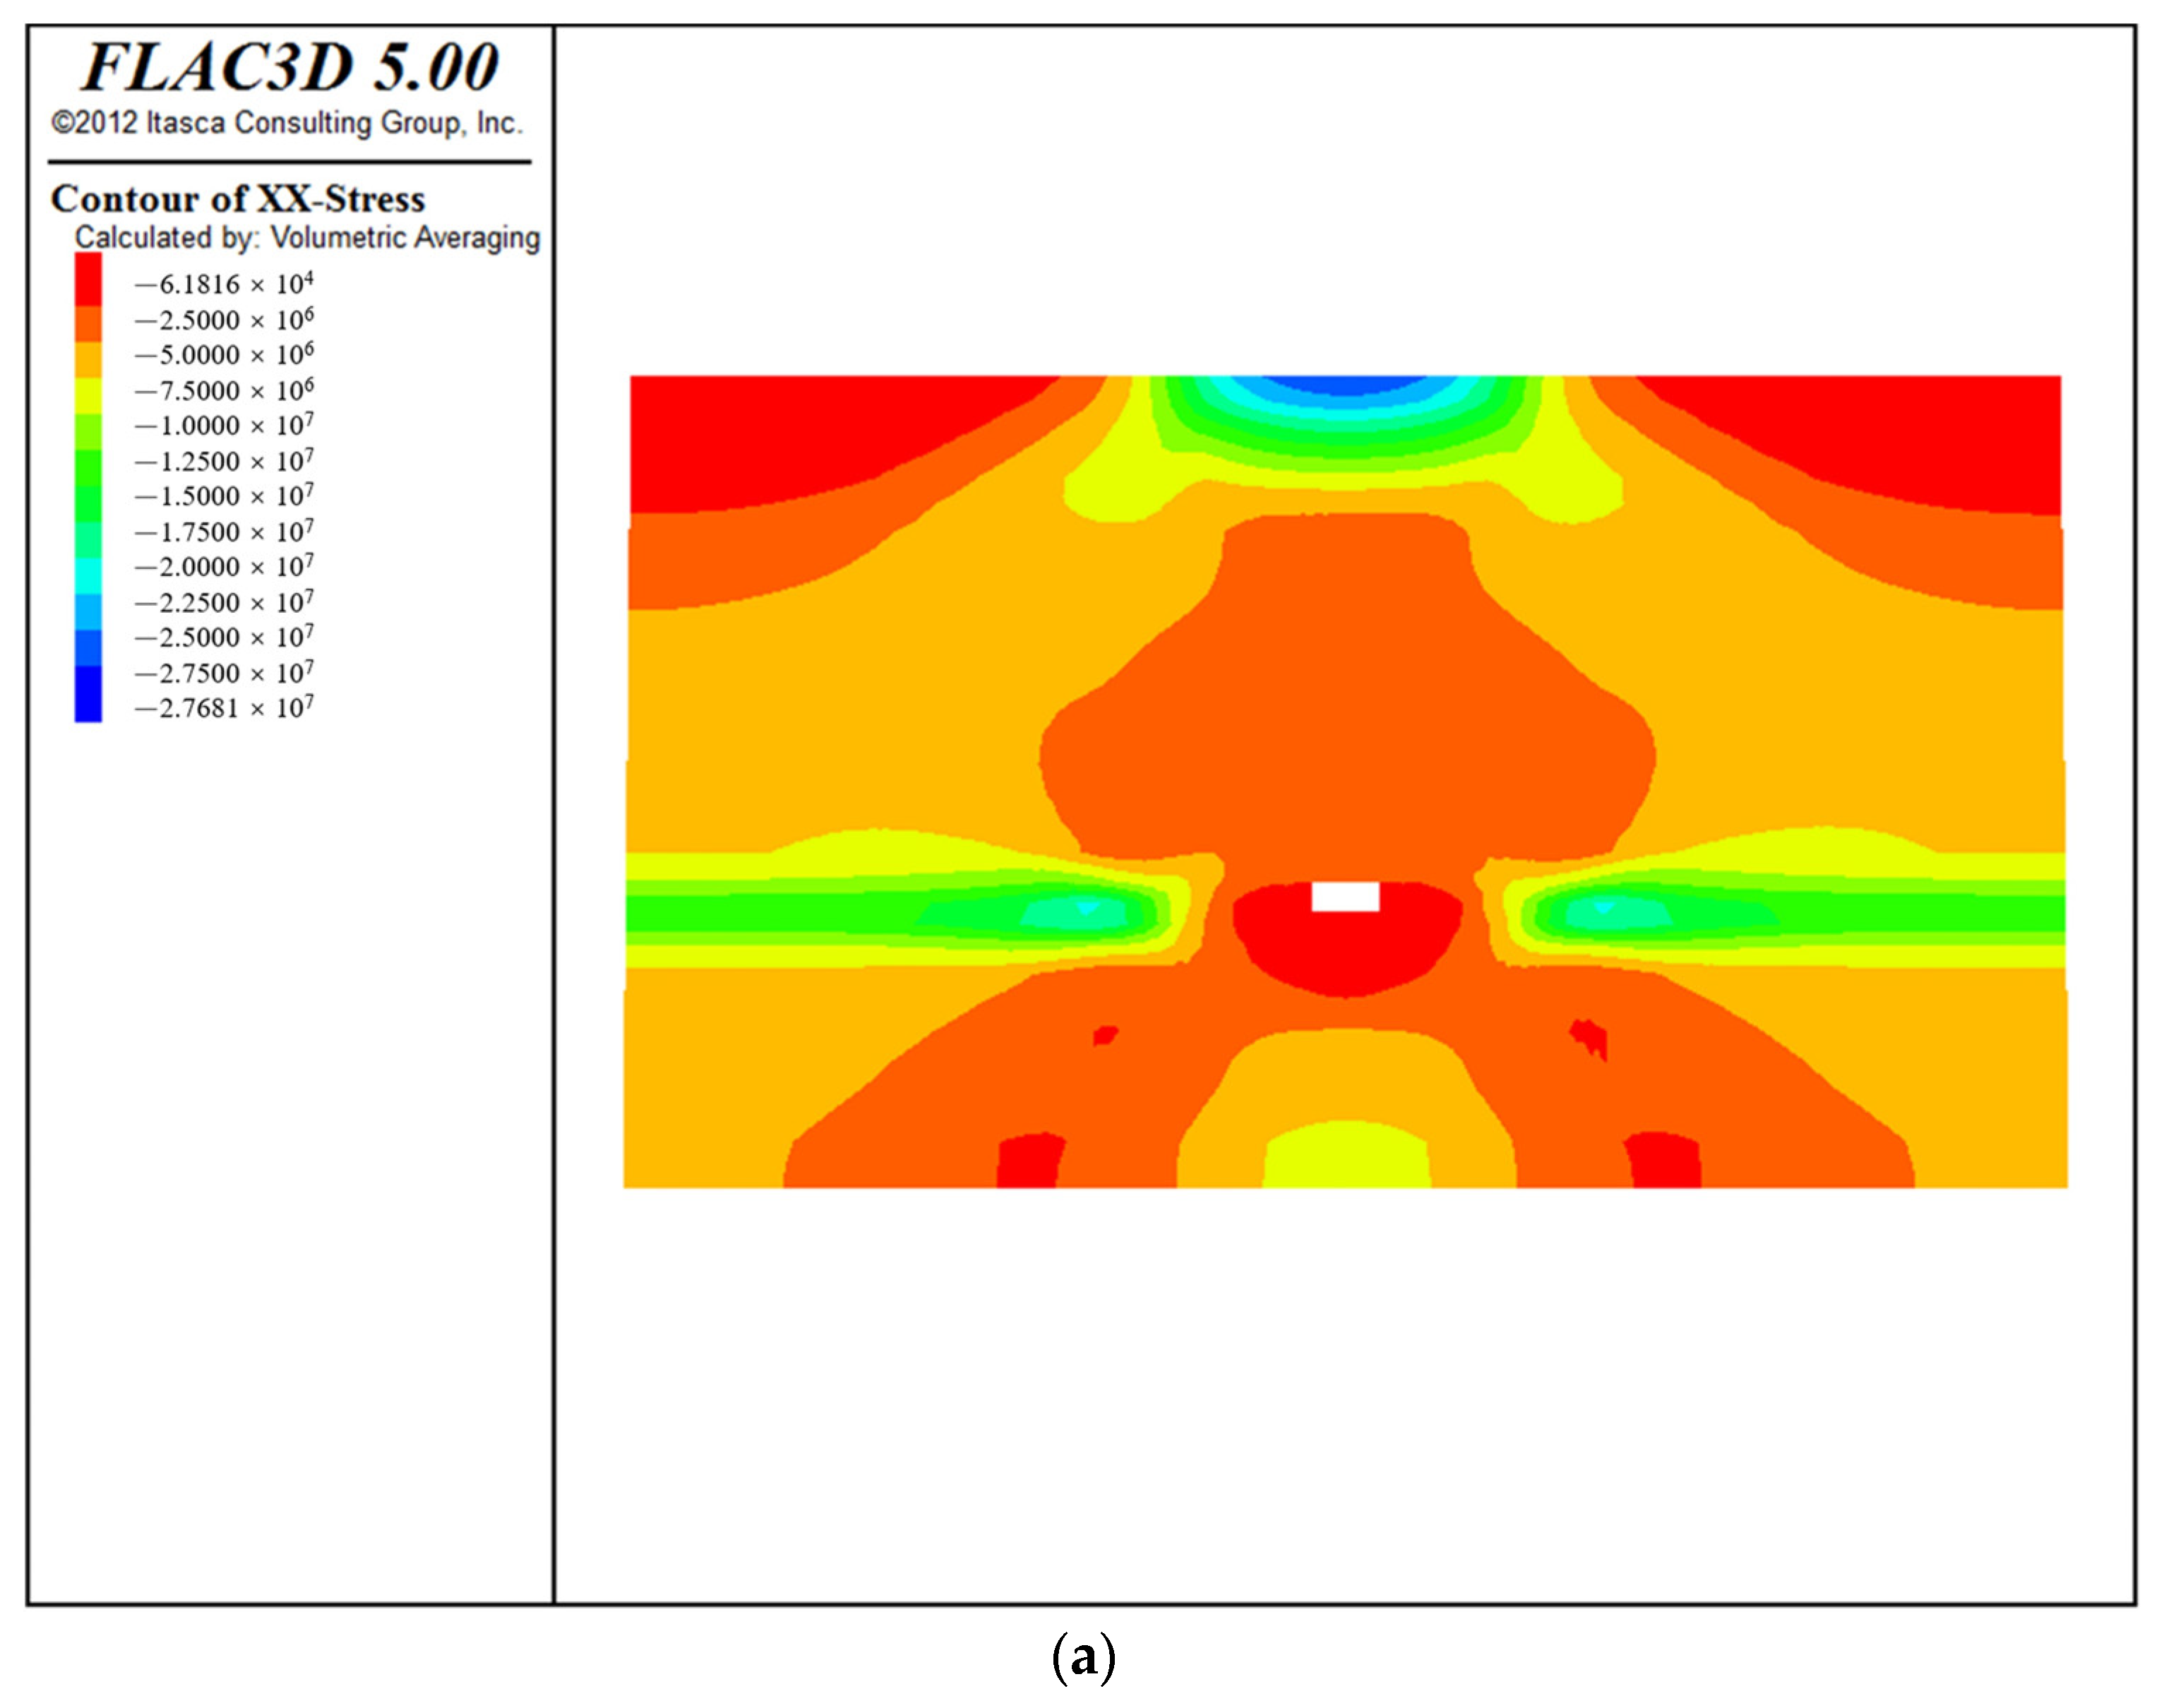
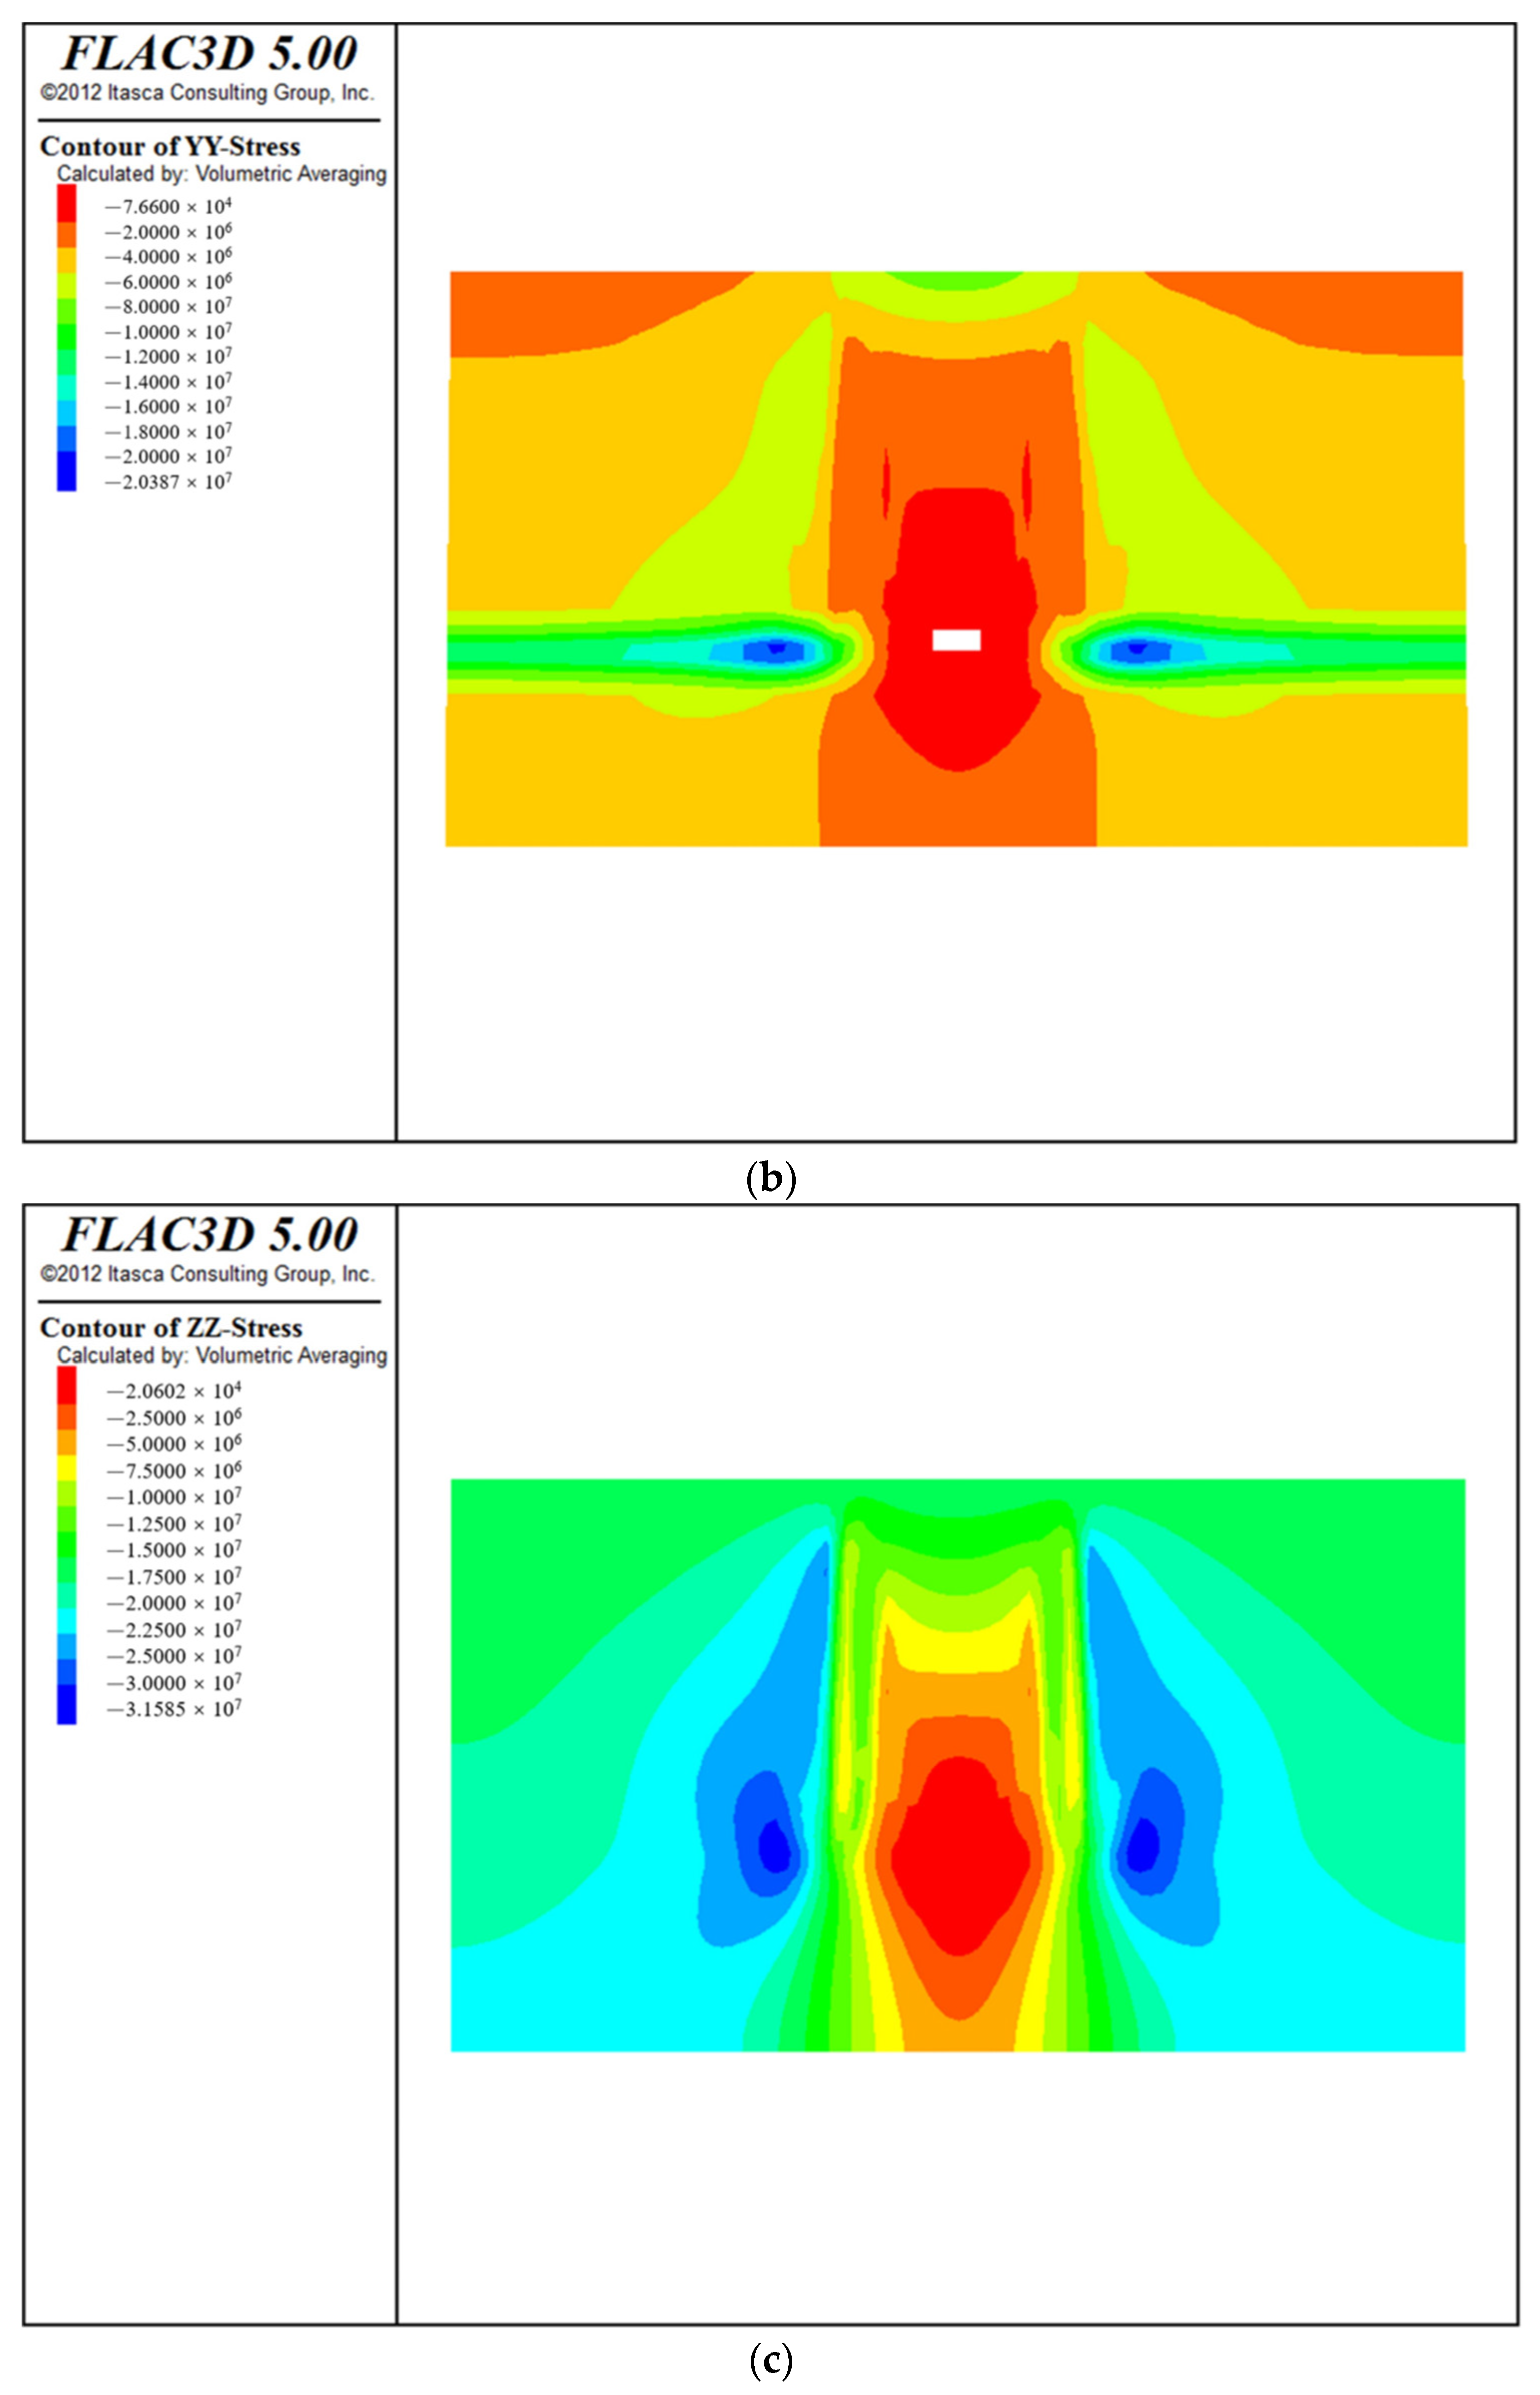
After the excavation and decompression of the roadway, the stress is redistributed after the roadway surrounding rock is disturbed. The change of stress distribution makes the surrounding rock stress change gradually from the original three-dimensional stress, in the direction of the free surface of the roadway wall, transitioning into two-dimensional or even one-dimensional stress. The surrounding rock mass strength and other indicators also changed significantly. The surrounding rock stress along the direction away from the roadway wall can be divided into a pressure relief area (loose circle), stress concentration zone and the original rock stress zone. The stress in the pressure relief area (loose circle) is lower than the original rock stress, and the area between the peak stress point and the free surface of the tunnel wall is plastic, while the area between the peak stress point and the original rock stress is elastic. The stress distribution cloud diagram is shown in Figure 6.
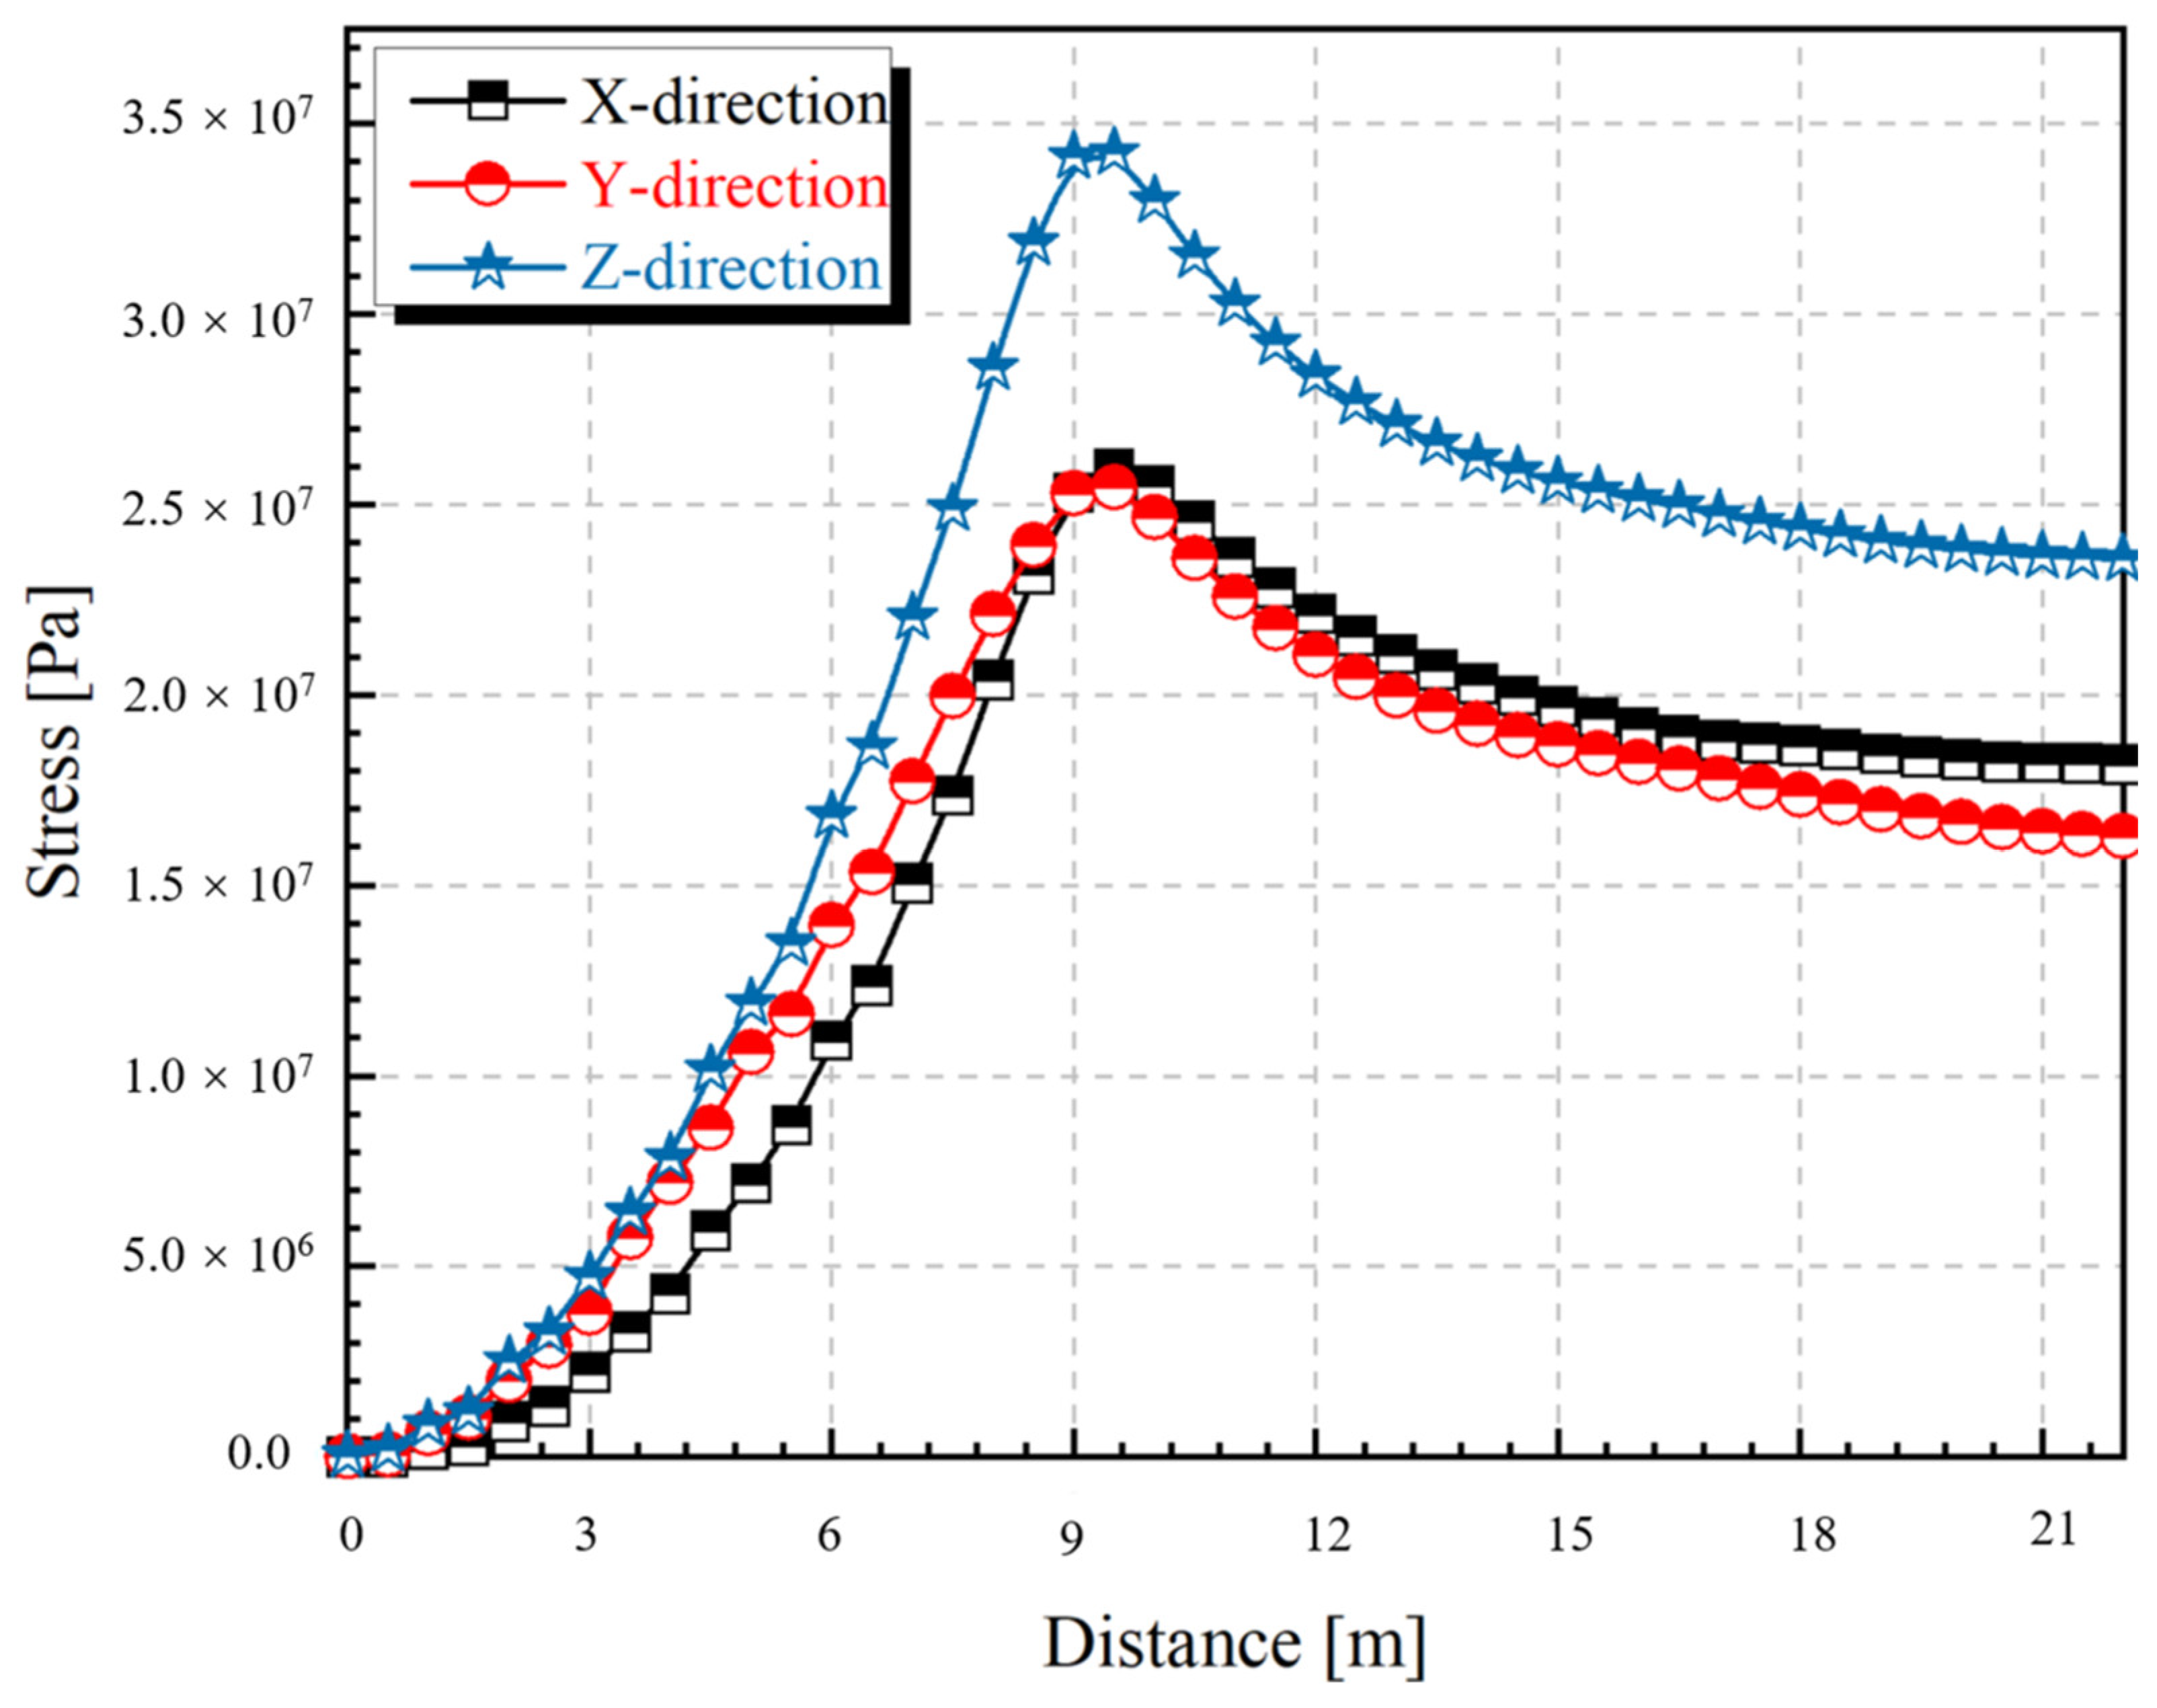
The above stress distribution is plotted in origin, as shown in Figure 7.
As shown in Figure 7, the three zones of the roadway envelope are generally divided by vertical stress, the vertical stabilized stress is the original rock stress in the vertical direction, and the peak point of the stress curve is the peak stress point. In the direction of the surrounding rock away from the roadway excavation section, the surrounding rock bearing capacity changes from small to large, and the surrounding rock stress state gradually from two-dimensional to unexcavated three-dimensional stress state. The stress on the free surface of the roadway wall is zero in three directions, then the stress state is gradually improved as far as the roadway wall, and the stress on the vertical direction of the surrounding rock is equal to the original rock stress at the boundary of the pressure relief zone (loose circle) (7 m from the roadway wall); then the stress on the vertical direction of the surrounding rock continues to increase, and the peak point of the vertical stress appears at the peak point of the stress (9.5 m from the roadway wall), and then the vertical stress starts to decrease. When the vertical stress reaches the original rock stress area (20 m away from the roadway wall), the vertical stress begins to stabilize.
4.2. Permeability Results
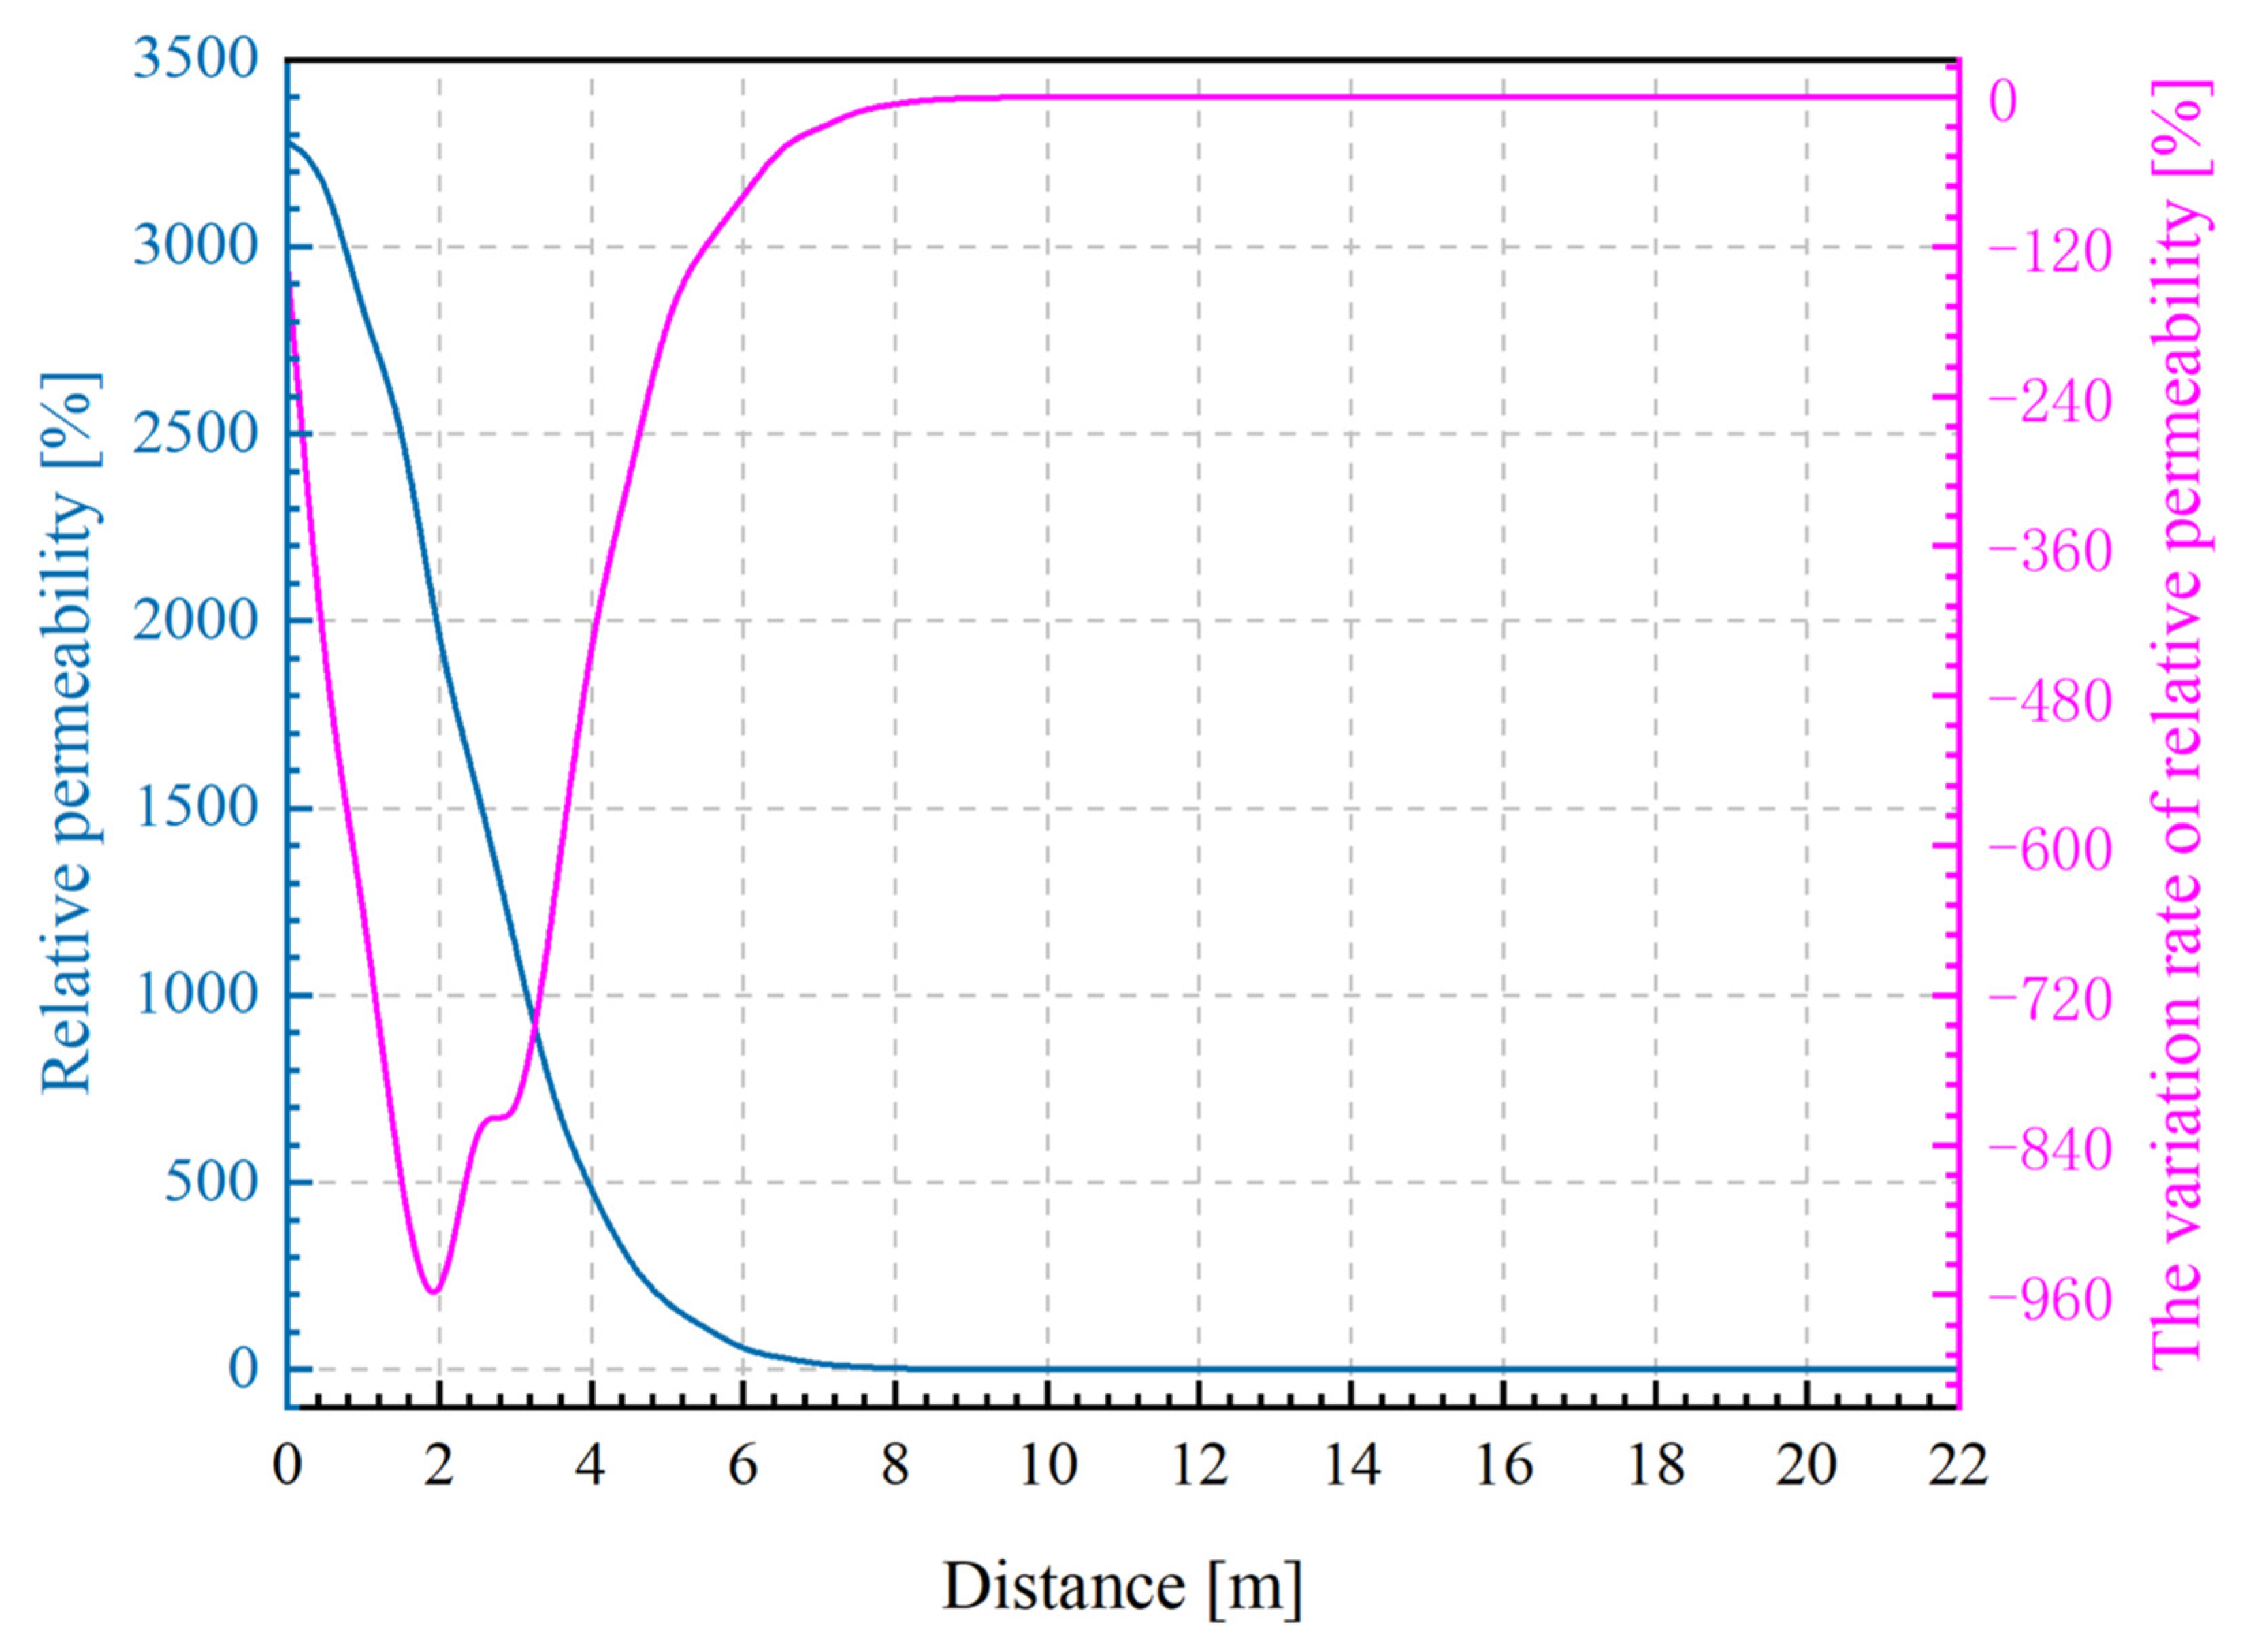
Based on the stress distribution results in the previous section, the stress data within 22 m from the free surface of the roadway wall on the right side of the roadway wall is adopted. The relative permeability distribution after roadway excavation and pressure relief can be calculated by Equation (11). The relative permeability is the ratio of the permeability after roadway excavation and pressure relief to the original permeability. The relative permeability and the variation rate of relative permeability are plotted in Figure 8.
As can be seen from Figure 8, the stress distribution curve after excavation of the roadway can be divided into plastic zone, elastic zone, and original rock stress zone. According to the minimum permeability point, the relative permeability distribution curve can also be roughly divided into three zones. Along the direction away from the roadway, it is divided into the zone of permeability sharp increase, the zone of permeability decrease, and the zone of permeability recovery. The peak stress point corresponds to the point of minimum relative permeability, both of which are located at a distance of 9.5 m from the free surface of the roadway, where the relative permeability is 0.0036.
In the direction of the minimum relative permeability away from the free surface of the roadway wall, the relative permeability increases slowly until it reaches the original permeability of the surrounding rock. In the direction of the minimum relative permeability away from the free surface of the roadway wall, the roadway excavation after the stress distribution is slightly different.
According to the stress distribution curve, at the boundary of the pressure relief zone (loose circle) (7 m from the roadway wall), where the surrounding rock is subject to the maximum principal stress, the vertical stress of the surrounding rock is equal to the original rock stress, while the relative permeability (7 m from the roadway wall) is 13.8, that is to say, the relative permeability (7 m from the roadway wall) is not the same as the original permeability, but has produced a certain plastic deformation.
According to the relative permeability distribution curve, the relative permeability is 1, at 8.5 m away from the roadway wall. It can be considered that from the stress peak point to 8.5 m away from the roadway wall, the relative permeability gradually returns to the original permeability with the reduction of surrounding rock stress.
This section can be compared to the elastic stage of the complete stress-strain curve of rock. The peak point of the complete stress-strain curve of rock is the critical point of the elastic-plasticity of the surrounding rock. In the direction close to the free surface of the roadway, in the plastic zone closer to the peak point, the stress state of the surrounding rock in this area is still a three-dimensional stress state, and the elastic deformation that occurs near the peak stress point gradually recovers as the stress decreases after the stress on the surrounding rock becomes smaller.
However, in the same direction, when the point of relative permeability is 1, the surrounding pressure of the surrounding rock mass decreases sharply, and the surrounding rock mass gradually enters a two-way stress state. The strength also starts to decrease sharply, and plastic deformation starts to occur at this point.
From the point where the relative permeability is 1 to the free surface of the roadway wall, although the vertical stress decreases rapidly, the decrease of the horizontal stress representing the confining pressure leads to a greater change in the strength of the surrounding rock, and finally makes the plastic deformation displacement and permeability of the surrounding rock increase monotonically. Finally, the relative permeability of the surrounding rock on the free surface of the roadway wall is 3280.
In the process from the point of relative permeability of 1 to the free surface of the roadway wall, although the vertical stress decreases rapidly, the reduction of the horizontal stress representing the surrounding pressure leads to a greater degree of change in the strength of the surrounding rock, which makes the displacement of plastic deformation of the surrounding rock and permeability increase monotonically. Finally, the relative permeability of the surrounding rock on the free surface of the roadway wall is 3280.
Since there is no quantitative classification standard for “whether the crack is connected to the free surface of the roadway”, we can refer to the standard for the degree of difficulty of coal seam gas drainage; that is, the difficulty degree of gas drainage can be measured by the permeability coefficient. When the permeability coefficient of coal seams is less than 0.1 m2/(MPa2·d), it is difficult to extract coal seams. When the permeability coefficient of coal seams is more than 10 m2/(MPa2·d) it is easy to extract coal seams.
There is a conversion relationship between permeability and permeability coefficient. Permeability coefficient 1 m2/(MPa2·d) is equivalent to 0.0025 md (permeability).
The original permeability of the coal seam of this case is 0.0045 md, which corresponds to the permeability coefficient of 0.18 m2/(MPa2·d). According to the coal seam permeability coefficient classification standard, 0.1 < 0.18 < 10, this coal seam is an extractable coal seam. It is known that even if the coal seam permeability is much improved when the relative permeability reaches 55, the coal seam permeability has not changed qualitatively, and still qualitatively belongs to the extractable coal seam. In this case, the relative permeability is 51 at 6 m from the roadway wall, which can be approximately regarded as the critical position of CCR and NCCR.
As can be seen from Figure 8, in the direction from the permeability minimum point to the free surface of the roadway wall, the trend of relative permeability is monotonically increasing, while the variation rate of relative permeability has an inflection point at 2–4 m from the free surface of the roadway wall. This indicates that the variation rate of relative permeability is not monotonic.
In the direction from the permeability minimum point to the free surface of the roadway wall, the surrounding rock starts to yield and plastic displacement occurs due to the decrease of the confining pressure. With the further decrease of confining pressure, the plastic displacement accumulates into cracks, and the cracks continue to expand, which is macroscopically realized as the increasing permeability.
Although the permeability increases rapidly, the existence of the above-mentioned areas makes the variation rate of relative permeability on both sides of the area significantly different. Specifically, in the direction from the permeability minimum point to the free surface of the roadway wall, the variation rate of relative permeability of the surrounding rock within the range of 2 m from the free surface of the roadway wall is much larger than that within 4–9.5 m from the roadway wall.
Therefore, it can be confirmed that the area represented by the inflection point of the variation rate of relative permeability is the area where the variation rate of relative permeability changes from quantitative to qualitative. According to the assumption of the simplified borehole air leakage problem above, it can be considered that the cracks within 2 m of the free surface of the roadway wall are interconnected to form a macro air leakage channel. At the distance of 4–9.5 m from the free surface of the roadway wall, the relative permeability is increasing and the cracks are expanding, but the cracks are not yet completely connected, so it can be approximated that there is no crack channel that can be connected with the free surface of the roadway in the surrounding rock of the borehole nearby. At the distance of 2–4 m from the free surface of the roadway wall, the cracks begin to interconnect and connect with the free surface of the roadway wall. Therefore, the area within 2–4 m from the free surface of the roadway wall is the boundary area between CCR and NCCR.
Based on the analysis of relative permeability and the variation rate of relative permeability, and considering a certain safety factor, the dividing point of CCR and NCCR can be set at 6 m, which is located in the pressure relief zone.
5. Field Testing
In order to verify the existence of NCCR in the pressure relief zone, the qualitative detection of sulfur hexafluoride gas is carried out by tracer gas. If the tracer gas injected through the seal depth control is located in the CCR, the borehole is leaking and the leaking sulfur hexafluoride gas can be detected qualitatively. If the tracer gas injected through the seal depth control is located in the NCCR, the borehole is not leaking and sulfur hexafluoride gas cannot be detected. If the tracer gas injected through the seal depth control is located in the NCCR, the hole will not leak and the sulfur hexafluoride gas cannot be detected. In order to avoid poor sealing quality and air leakage channels in the sealing material itself, the capsule mucus sealing method of “solid sealing liquid, liquid sealing gas” was adopted as the sealing process during the test.
5.1. Coal Roadway Test
5.1.1. Test Site and Protocol Design
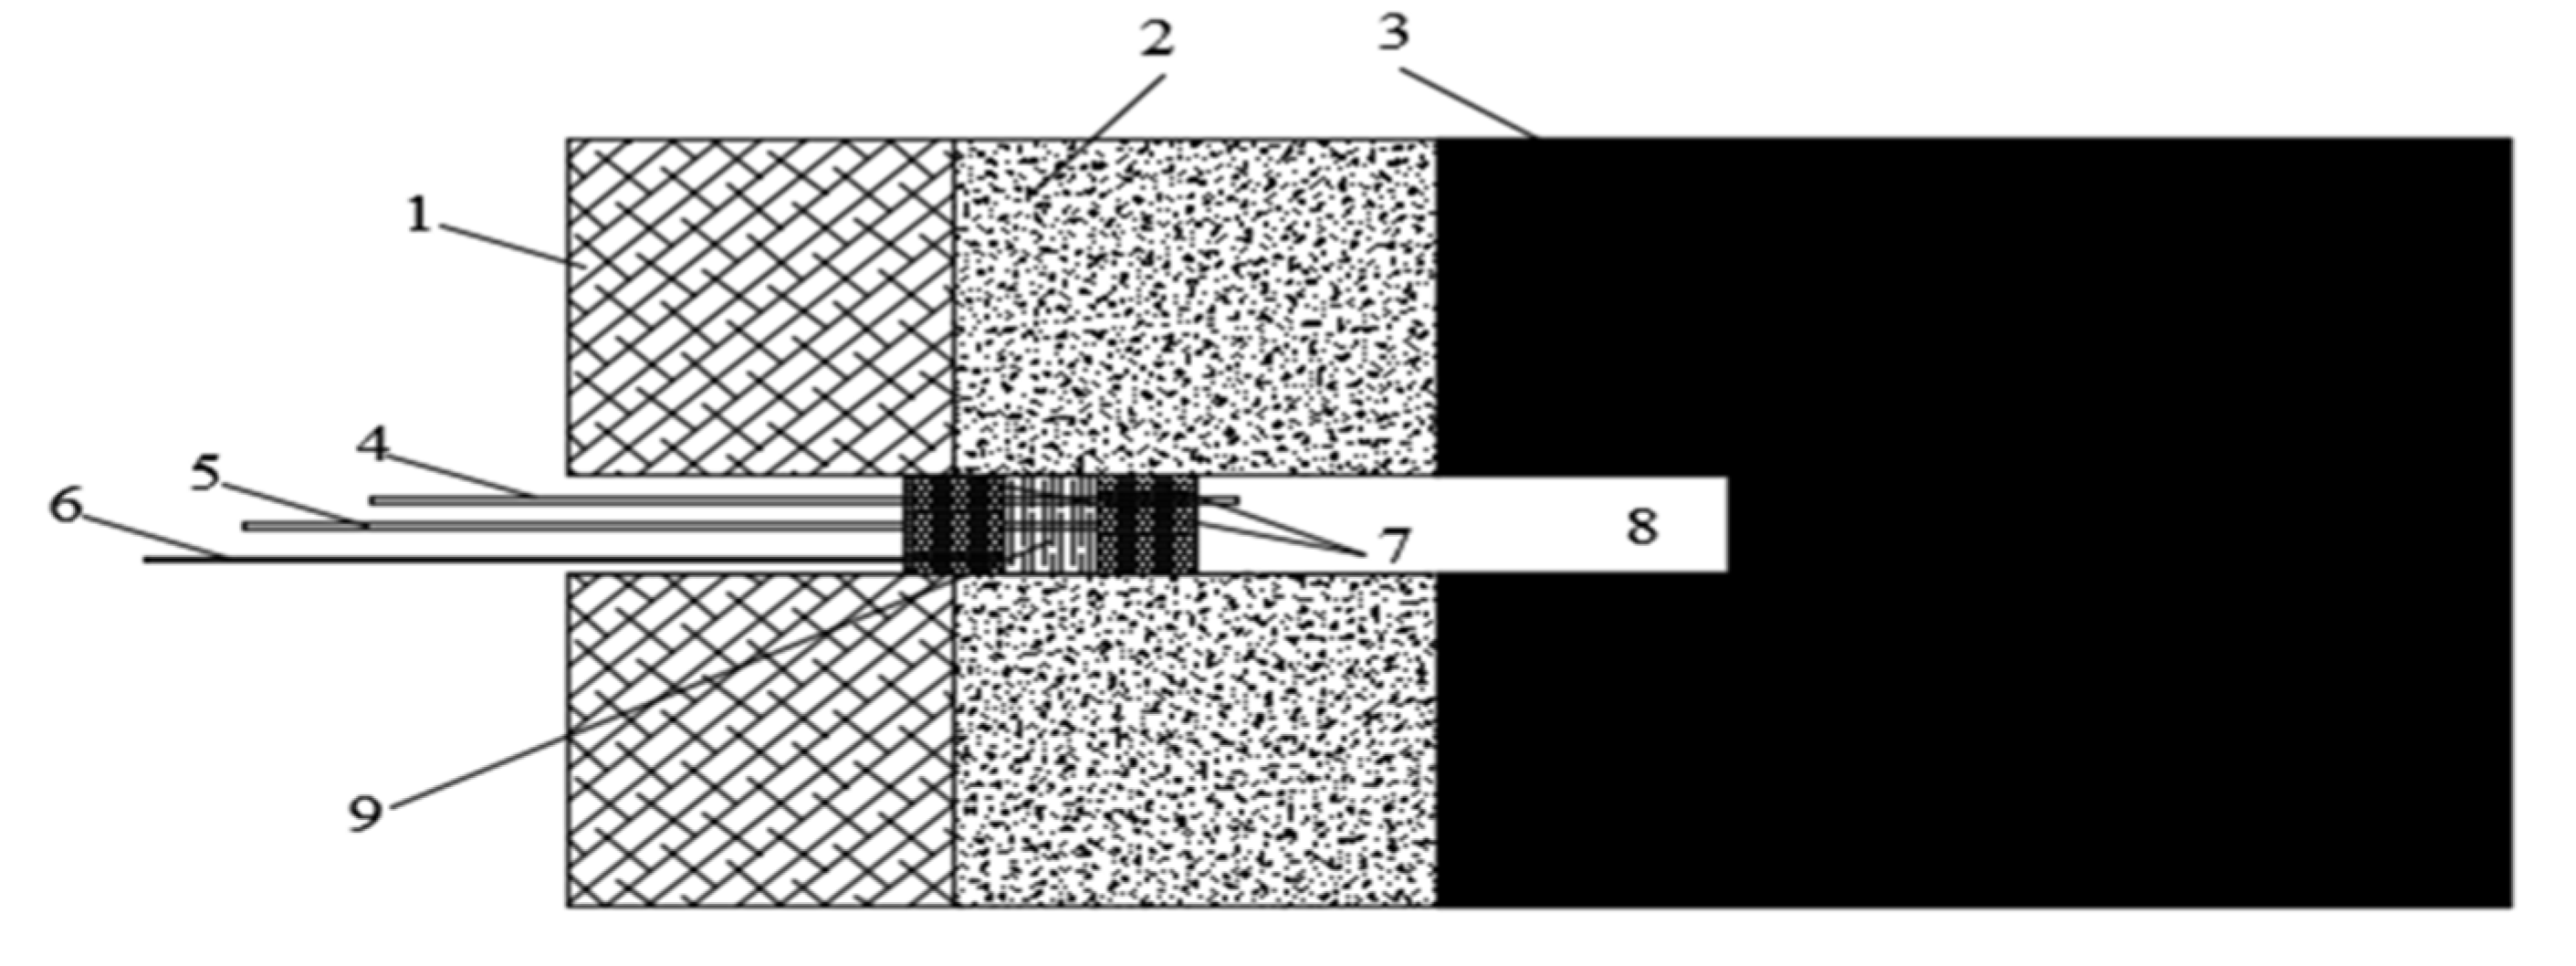
The test site is located at 100 m from the head of the E8 coal seam 22200 machine tunnel in the Sixth Mine of Pingdingshan Tianan Coal Industry Co., Pingdingshan, China. The test site has no tectonic zone, the integrity of E8 coal is good, and the solidity coefficient is about 0.8. According to theoretical analysis, numerical simulation and actual measurement data provided by the mine, the depth of the pressure relief circle is about 7.2 m. The actual measurement scheme of “fracture and free surface non-penetration area” is shown in Figure 9. According to the change of permeability in the previous numerical simulation, the depth of the sealed hole is determined as 6 m.
5.1.2. Experimental Equipment
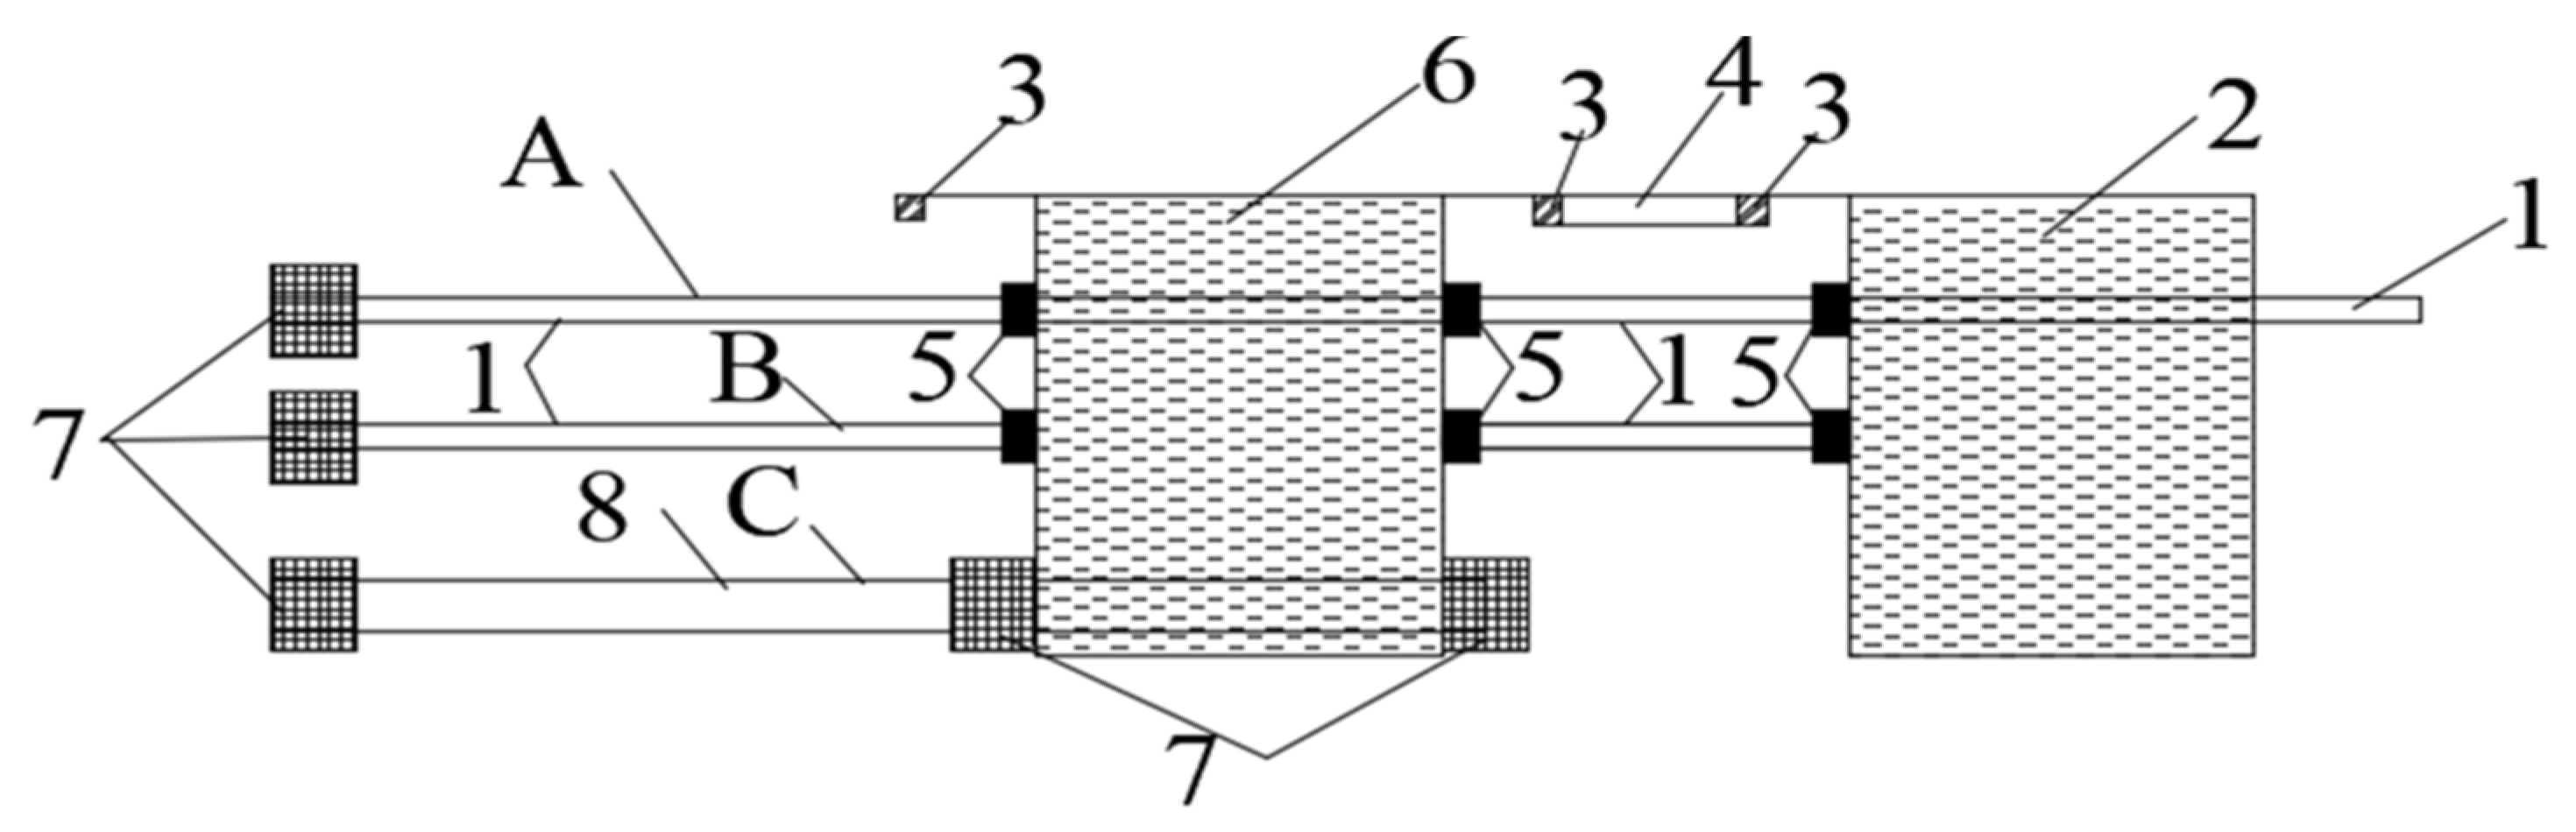
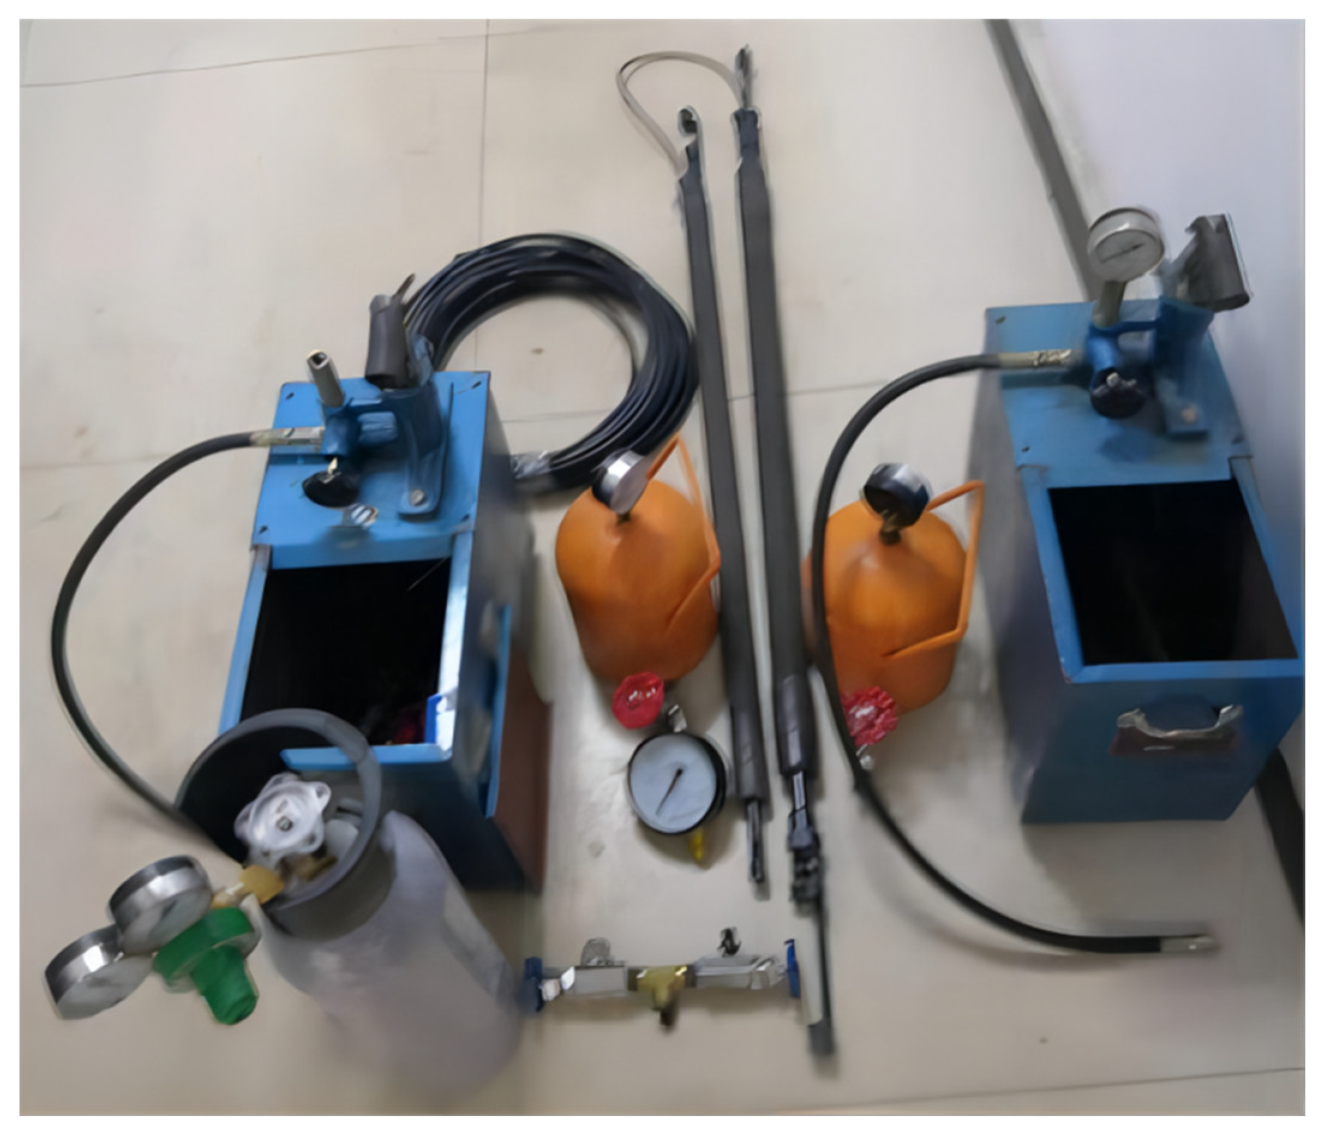
The experimental equipment mainly includes a set of water injection sealing devices (the distance between two capsules is controlled as 1 m), a bottle of 4 L of sulfur hexafluoride gas with pressure of 2.0 MPa, and XP-1A qualitative leak detector produced by Bosch Automotive Service Solutions LLC in Owatonna, MN, USA (Figure 10, Figure 11 and Figure 12).
5.1.3. Operation Steps
- (1)
- Drill the hole with 42 mm air-coal drill and blow the hole clean.
- (2)
- Connect the capsule to the pipeline and feed it into the designated position of the borehole.
- (3)
- Water is injected to expand the capsule, and the capsule pressure is approximately 3 MPa.
- (4)
- Inject the mucus with surfactant and a small amount of bentonite to stabilize the mucus pressure at 2 MPa.
- (5)
- Inject SF6 gas through the gas injection tube to make the pressure gauge reading reach 0.2 MPa.
- (6)
- Use XP-1A qualitative leak detector in the borehole or downwind of the roadway to test for SF6 escape.
- (7)
- Observe and record the change of gas pressure in the borehole.
5.1.4. Test Results
The pressure gauge readings were observed for twenty consecutive days, and the pressure curve is shown in Figure 13; the field test photo is shown in Figure 14.
As can be seen from Figure 13, since the borehole was a layered borehole, there was a gas and sulfur hexafluoride gas mixture in the gas chamber at the end of the borehole, adding to the prior gas pressure in the borehole. The gas pressure in the borehole was greater than 0.2 MPa when the sulfur hexafluoride gas was filled, which eventually made the gas mixture pressure in the borehole keep rising. It reached the original gas pressure at the location of the borehole, and the gas mixture pressure in the borehole stopped increasing. At the same time, no escape of sulfur hexafluoride gas was monitored during the observation time. Therefore, it can be clarified that at the sealing depth of 6m, there is no gas leakage from the borehole, that is to say, the crack of this area is not connected with the free surface of the roadway. This is consistent with the numerical simulation results in Section 4.2.
5.2. Rock Roadway Test
5.2.1. Test Site and Protocol Design
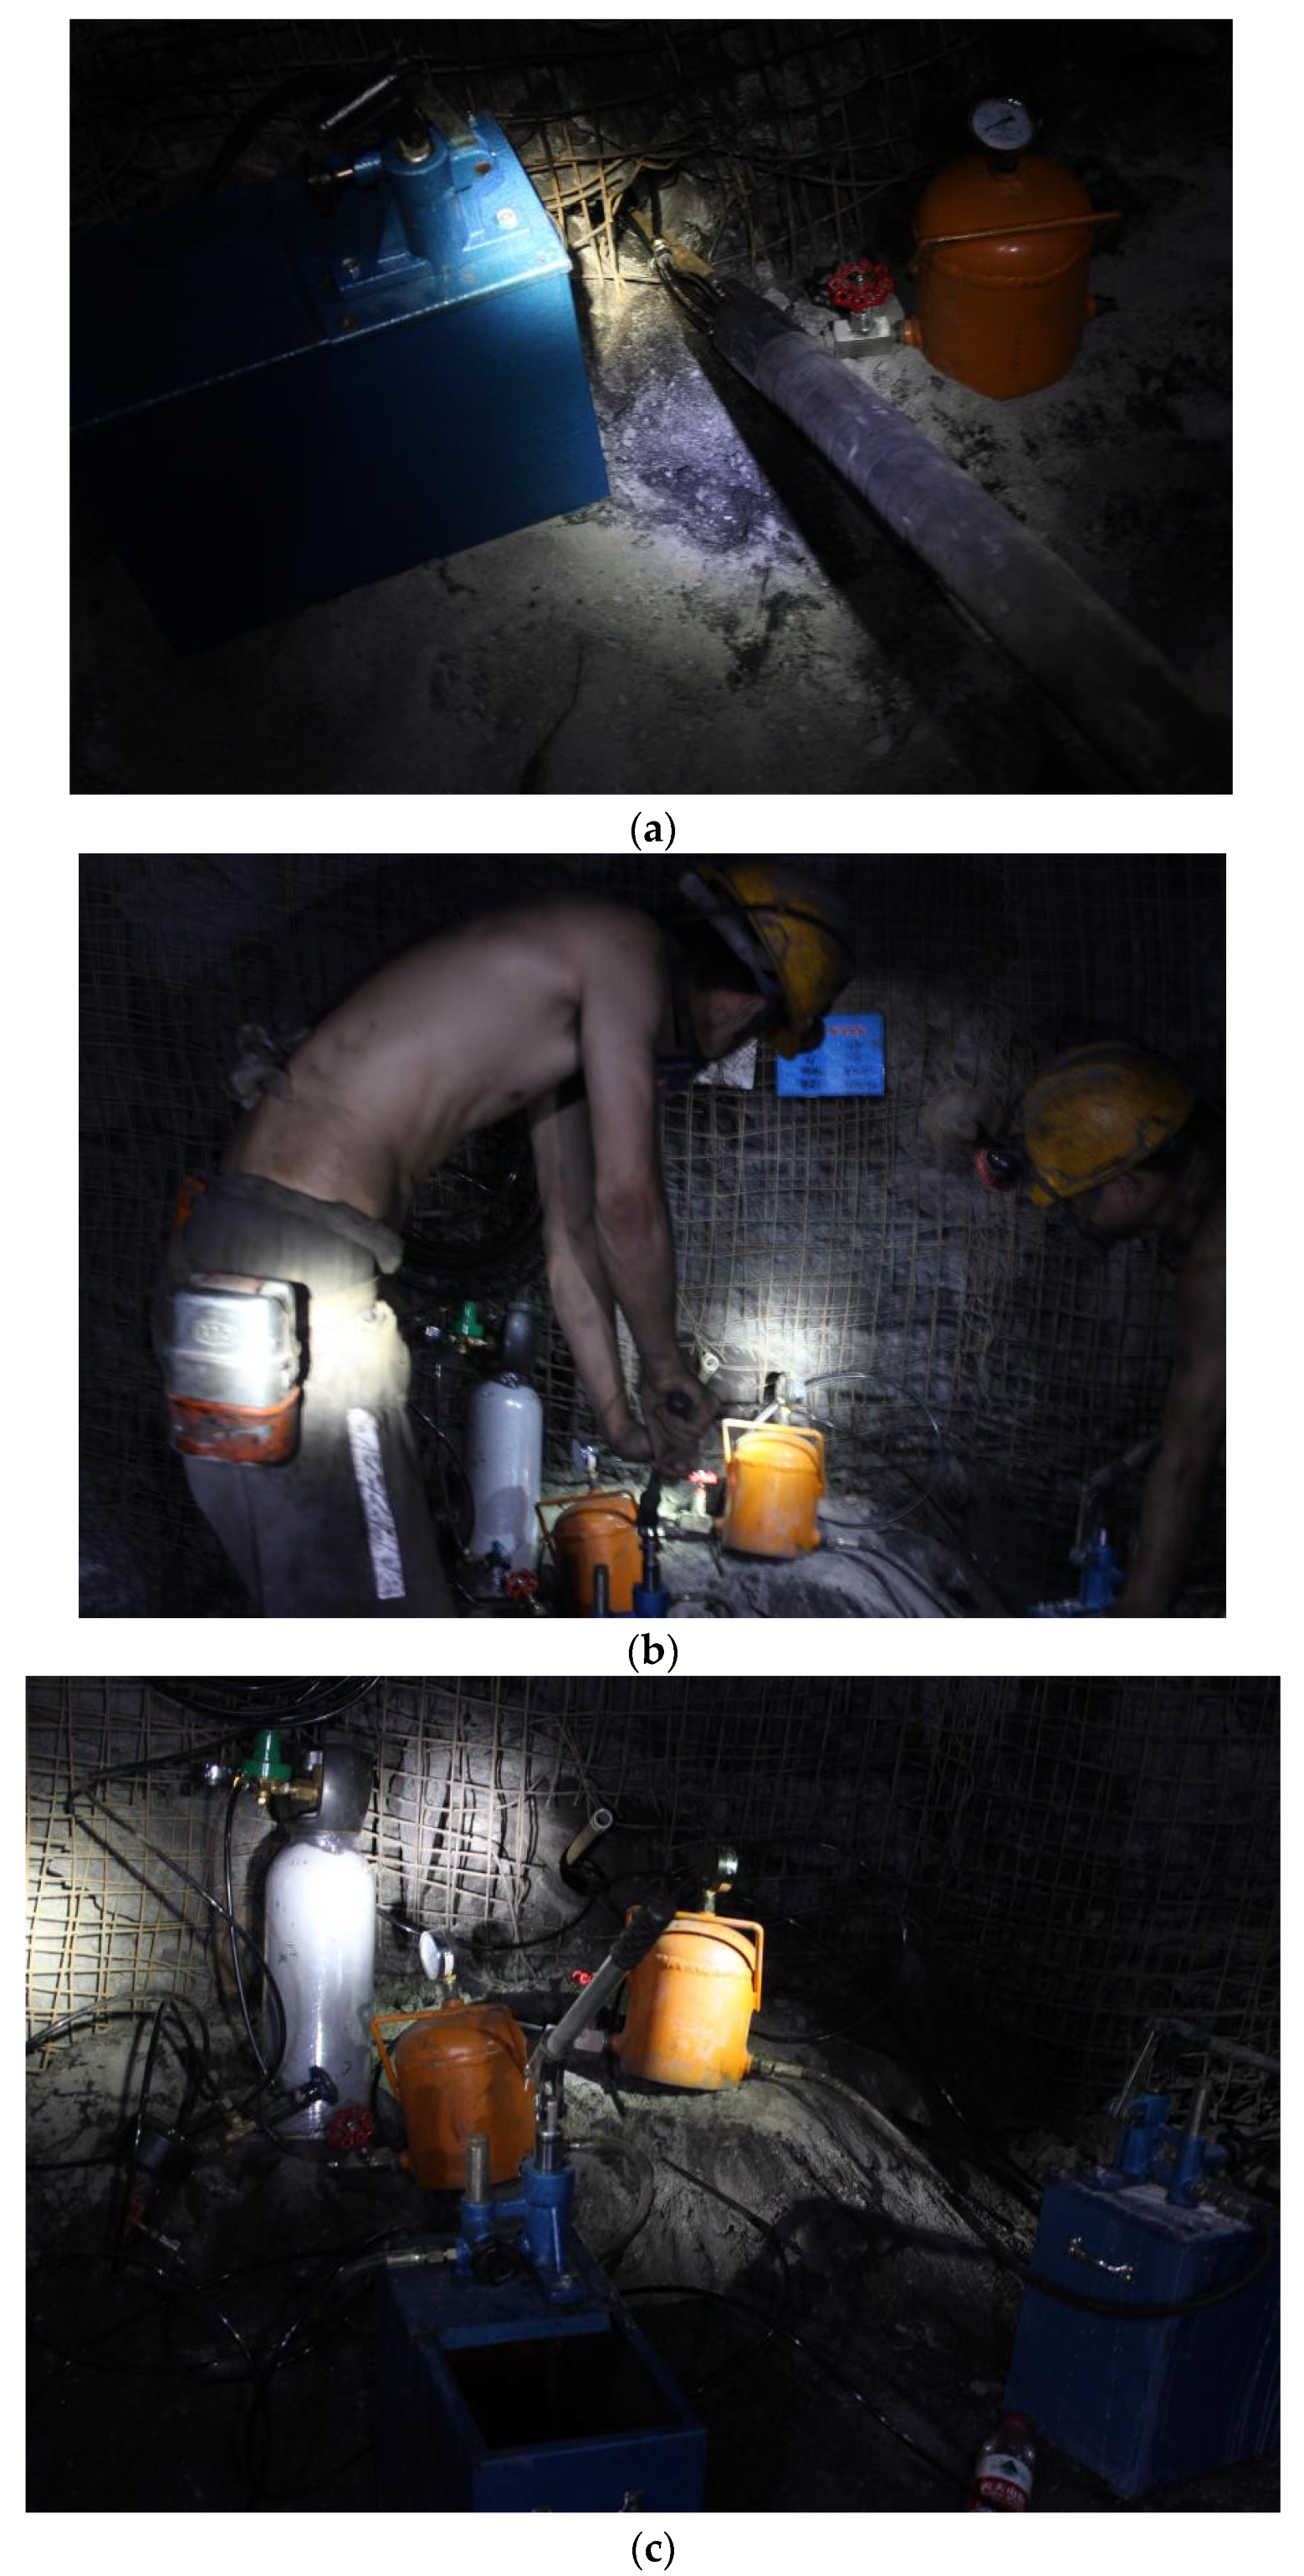
The test site was selected at 1500 m of the high extraction lane of the 32010 machine road in the E8 coal seam of the Sixth Mine of Pingdingshan Tianan Coal Industry Co. The test site is a fine sandstone road, the width and height of the roadway are 4.5 m and 3.5 m respectively, the tensile strength of the rock is 4.16 MPa, Poisson’s ratio is 0.19, the rock integrity of the roadway is good, the depth of burial is 920 m, and the distance from the E8 coal seam is about 18 m. Combined with theoretical analysis, numerical simulation and actual measurement information provided by the mine, the depth of the pressure relief circle at this location was determined to be about 4.3 m. Three 94 mm diameter pressure measurement boreholes with an inclination of −41°, a rock hole length of 28 m and a coal hole of 3m were constructed near this location. The field test photo of the rock tunnel is shown in Figure 15.
Considering the large inclination of the borehole, the length of the borehole in the pressure relief circle was calculated to be 5.7 m. The sealing depths of the three pressure measurement boreholes were 3 m, 4 m and 5 m. The test equipment and operation procedure were the same as 5.1, with the diameter of the capsule replaced by 64 mm.
5.2.2. Test Results
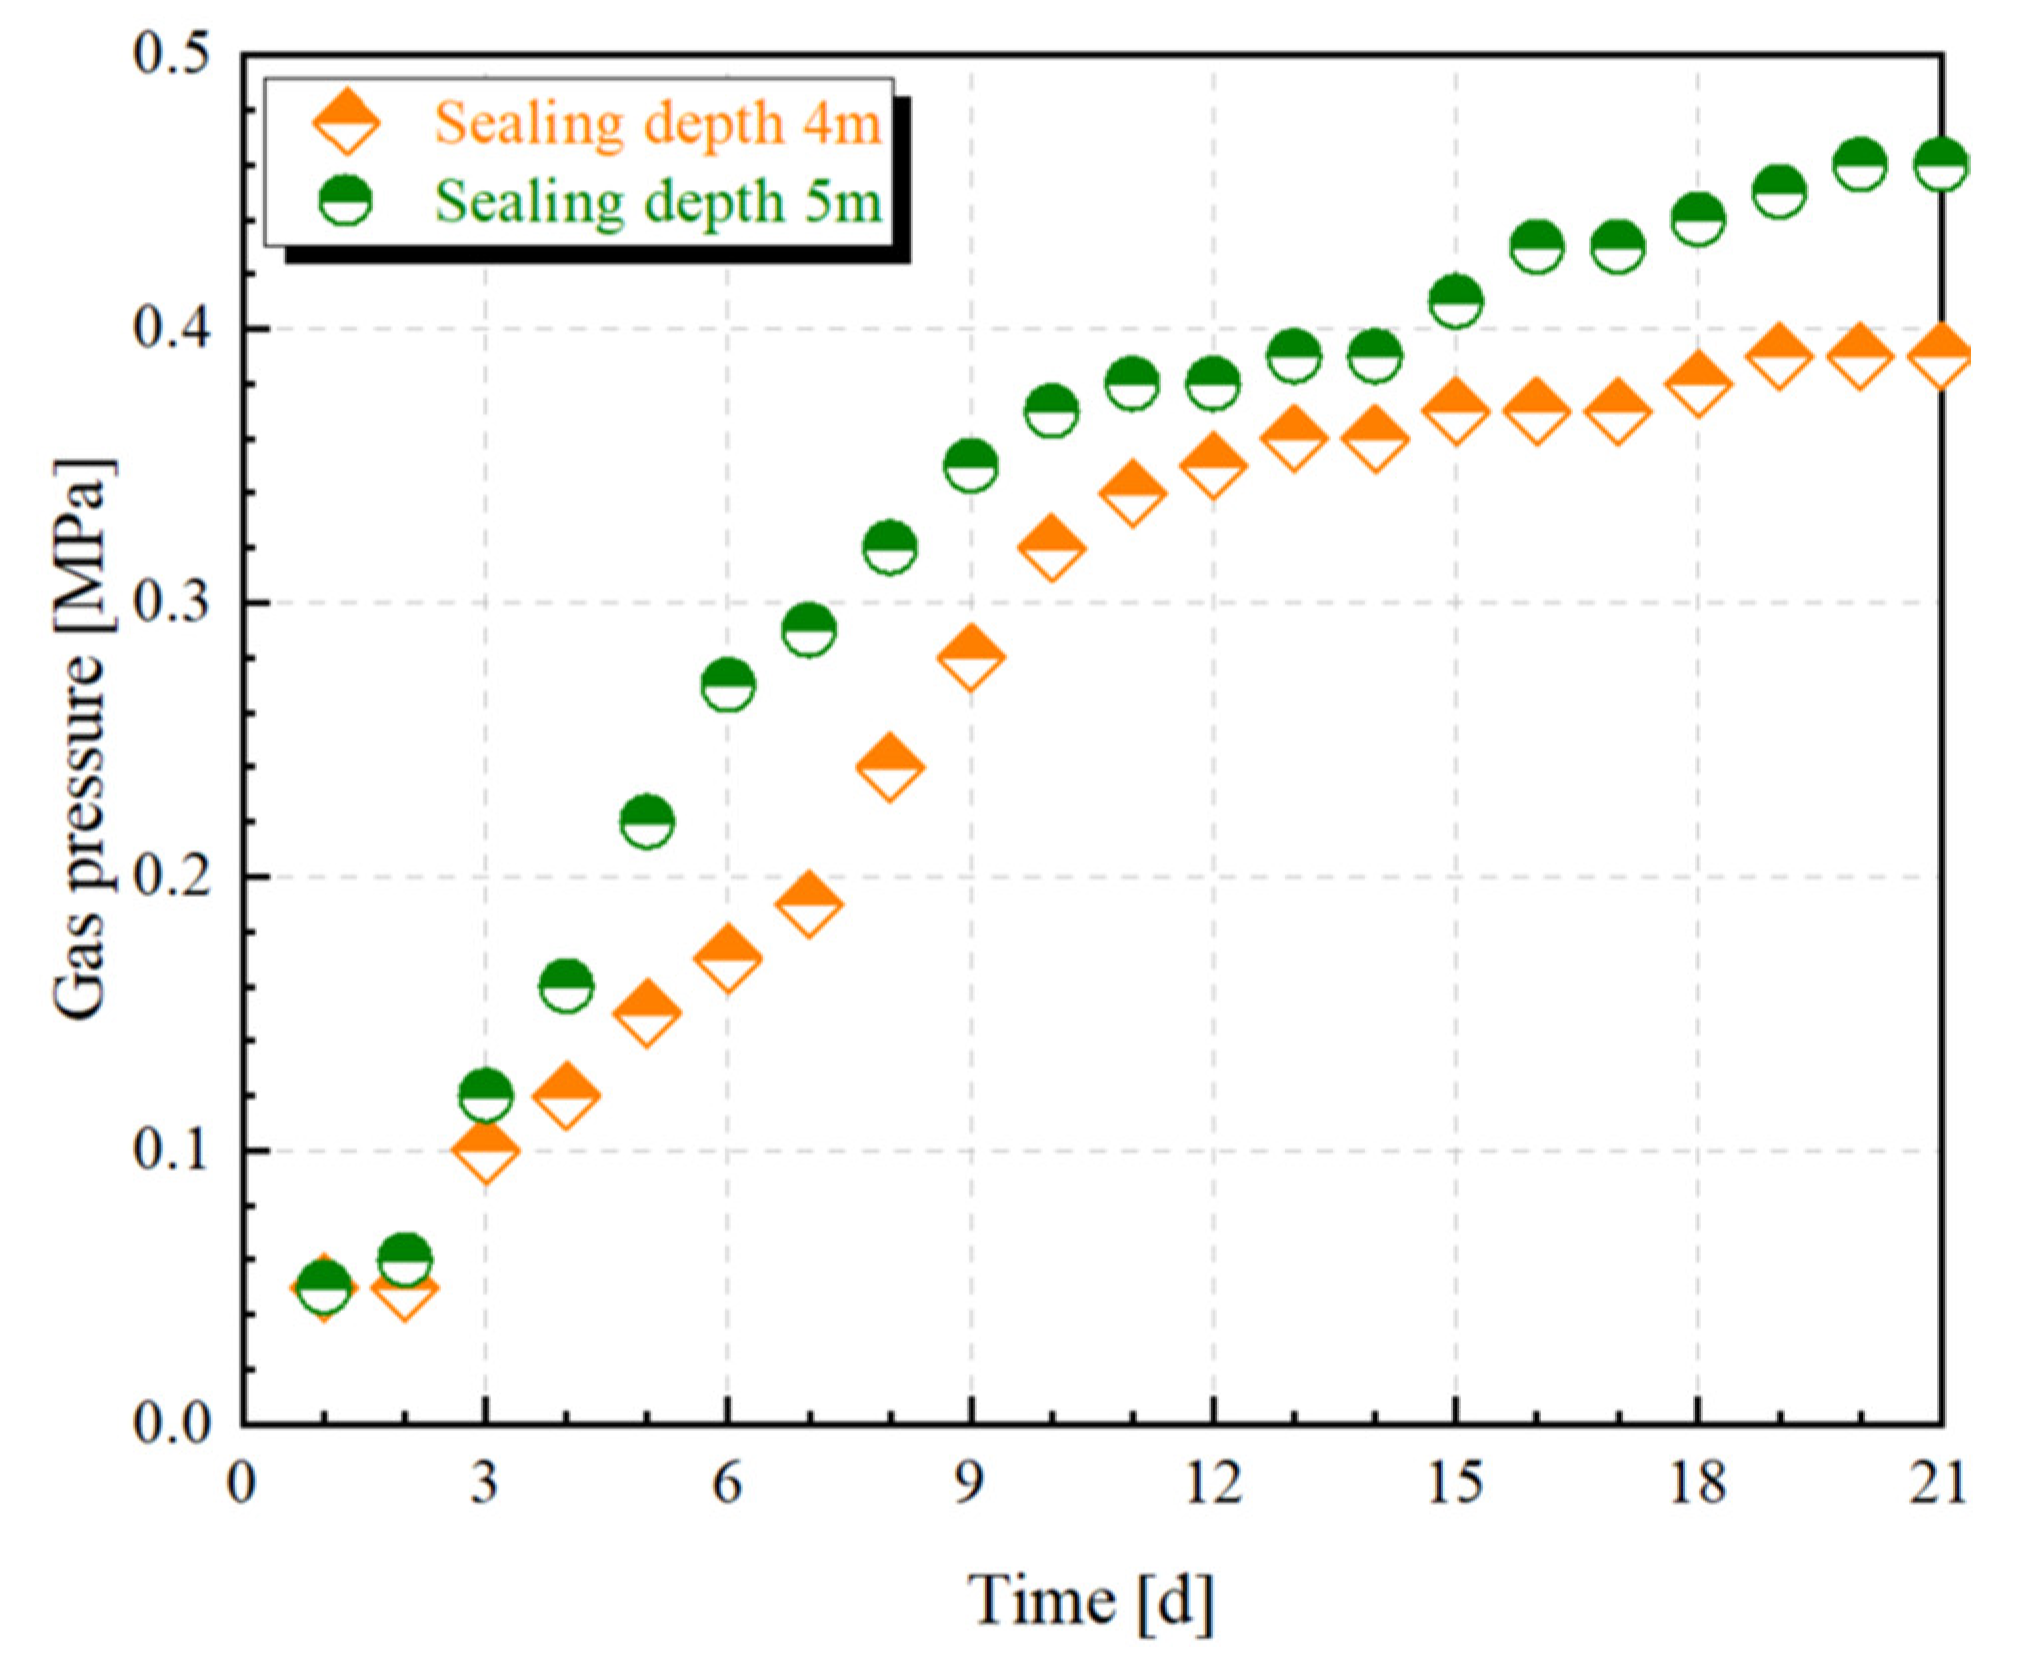
The pressure gauge readings observed for twenty consecutive days were recorded and the pressure curve is shown in Figure 16. During the test, the mucus pressure in the hole with a sealing depth of 3 m fell back when the mucus injection reached about 2 MPa, which finally confirmed the failure of the hole sealing, indicating that the cracks near the sealing section under this sealing depth were penetrating each other.
As can be seen from Figure 16, in the hole with a sealing depth of 4 m, a trace amount of sulfur hexafluoride gas was detected by XP-1A leak detector on the 11th day of reading at the sensitivity level of six, indicating that with the increase of the mixed gas pressure in the hole. This indicates that with the increase of mixed gas pressure in the borehole, sulfur hexafluoride gas eventually penetrated into the roadway through the crack, which may be due to the existence of a crack connected with the free surface of the roadway in the pressure measuring chamber of this borehole. While no sulfur hexafluoride gas escaped from the borehole with the sealing depth of 5 m during the test, the mixed gas pressure of this borehole reached 0.46 MPa, which is approached the original gas pressure here, indicating that when the location was more than 5 m away from the free surface of the roadway wall, the cracks between the surrounding rock of the borehole and the wall of the roadway are not connected.
6. Conclusions
- (1)
- Roughness can measure the degree of stress concentration when the rock body is stressed. Through the relationship between roughness and geological strength GSI in H-B criterion, the value of geological strength GSI is optimized, and the theoretical model for the analysis of the stability of the borehole surrounding rock is optimized. Based on the optimized theoretical model for numerical simulation, the boundary of the pressure relief zone (loose circle) of the roadway is 7 m from the roadway wall, the peak point of the stress is 9.5 m from the roadway wall, and the original rock stress area is 20 m from the roadway wall.
- (2)
- The pressure relief zone or so-called loose circle in the surrounding rock of the borehole can be distinguished into CCR and NCCR. However, it is difficult to judge whether whether the crack is connected to the free surface of the roadway through current research results. At the same time, the permeability of the surrounding rock exists in practice, to a certain extent. Due to the objective existence of permeability of the surrounding rock, the gas in the borehole will definitely penetrate into the roadway through the surrounding rock or the sealing material. Therefore, theoretically, the problem of “gas leakage” in boreholes is inevitable. As the research on permeability is more mature, we propose that the quantitative standard of whether the borehole is “air leakage” or whether the surrounding rock cracks around the borehole are connected to the free surface can be characterized by permeability.
- (3)
- Since there is no quantitative classification standard for “whether the crack is connected to the free surface of the roadway”, we can refer to the standard for the degree of difficulty of coal seam gas drainage; that is, the difficulty degree of gas drainage can be measured by the permeability coefficient. In the engineering context of this paper, it is known that even if the coal seam permeability is much improved when the relative permeability reaches 55, the coal seam permeability has not changed qualitatively, and still qualitatively belongs to the extractable coal seam. In this case, the relative permeability is 51 at 6 m from the roadway wall, which can be approximately regarded as the critical position of CCR and NCCR.
- (4)
- In the direction from the permeability minimum point to the free surface of the roadway wall, the trend of relative permeability is monotonically increasing, while the variation rate of relative permeability has an inflection point at 2–4 m from the free surface of the roadway wall. Specifically, in the direction from the permeability minimum point to the free surface of the roadway wall, the variation rate of relative permeability of the surrounding rock within the range of 2 m from the free surface of the roadway wall is much larger than that within 4–9.5 m from the roadway wall. Therefore, it can be confirmed that the area represented by the inflection point of the variation rate of relative permeability is the area where the variation rate of relative permeability changes from quantitative to qualitative. At the distance of 2–4 m from the free surface of the roadway wall, the cracks begin to interconnect and connect with the free surface of the roadway wall. Therefore, the area within 2–4 m from the free surface of the roadway wall is the boundary area between CCR and NCCR.
- (5)
- In order to verify the existence of NCCR in the pressure relief zone, the qualitative detection of sulfur hexafluoride gas was carried out by tracer gas. When the sealing depth of the coal roadway is 6 m and the sealing depth of the rock roadway is 5 m, there is no gas leakage in the borehole; that is, there is an area where the fissure is not connected with the free surface of the roadway in the pressure relief zone.
Author Contributions
Conceptualization, R.B.; methodology, R.B.; software, L.Z.; validation, X.L., R.B. and S.H.; formal analysis, L.Z.; investigation, R.B. and X.C.; resources, X.C.; data curation, X.L.; writing—original draft preparation, R.B.; writing—review and editing, S.W. and L.Z.; supervision, X.C., S.W. and S.H.; project administration, X.C.; funding acquisition, X.C. All authors have read and agreed to the published version of the manuscript.
Funding
This research was funded by the National Natural Science Foundation of China (NO. 52174181 and NO. 52074121), and the China Postdoctoral Science Foundation (NO. 2021M691390), and the Key R&D Plan Program of Hebei Province of China (No. 22375401D and No. 17275427), and Science and Technology Research Project of Higher Education Institutions of Hebei Provincial Department of Education (No. Z2018005), and the Fundamental Research Funds for the Central Universities (NO. 3142020003).
Institutional Review Board Statement
Not applicable.
Informed Consent Statement
Not applicable.
Data Availability Statement
The data used to support the findings of this study are presented in the article. Further inquiries can be directed to the corresponding author.
Conflicts of Interest
The authors declare no conflict of interest.
Abbreviations
| GSI | Geological Strength Index | ||
| JRC | Rock joint roughness coefficient | ||
| SR | Rock structure polarity | ||
| SCR | rock surface condition roughness | ||
| SFR | stress discount factor | ||
| RQD | rock quality designation | ||
| CCR | an area where the crack of the surrounding rock of the borehole is connected with the free surface of the roadway wall | ||
| NCCR | an area where the crack of the surrounding rock of the borehole is not connected with the free surface of the roadway wall | ||
| Nomenclature | |||
| Jr | joint roughness | Greek symbols | |
| Jn | joint set coefficient | ka | permeability of coal mass in elastic deformation phase (m2) |
| Ja | joint alteration | σ1 | the maximum compressive stresses (MPa) |
| Jw | joint water reduction coefficient | σ3 | the minimum compressive stresses (MPa) |
| mb | the corresponding rock dimensionless parameters | σci | the uniaxial compressive strength of the rock (MPa) |
| s | the corresponding rock dimensionless parameters | bσ | Coefficient of effect of volumetric stress on permeability (MPa−1) |
| a | the corresponding rock dimensionless parameters | ΔΘ | Volume stress change (MPa) |
| mi | rock empirical parameters | εp | equivalent plastic strain |
| D | disturbance factor | εp* | initial equivalent plastic strain in the residual strength phase |
| k0 | Initial permeability of the coal mass (m2) | ζ | permeability surge factor |
| kb | permeability of coal mass in plastic deformation state (m2) | Φ1 | porosity of the roadway after decompression |
| kc | coal mass permeability during the residual strength phase (m2) | Φ0 | original porosity |
| k1 | Permeability after pressure relief (m2) | ||
References
- Lee, Y.-K.; Pietruszczak, S. A New Numerical Procedure for Elasto-Plastic Analysis of a Circular Opening Excavated in a Strain-Softening Rock Mass. Tunn. Undergr. Space Technol. 2008, 23, 588–599. [Google Scholar] [CrossRef]
- Li, S.; Feng, X.-T.; Li, Z.; Chen, B.; Zhang, C.; Zhou, H. In Situ Monitoring of Rockburst Nucleation and Evolution in the Deeply Buried Tunnels of Jinping Ii Hydropower Station. Eng. Geol. 2012, 137–138, 85–96. [Google Scholar] [CrossRef]
- Sloan, S.W. Geotechnical Stability Analysis. Géotechnique 2013, 63, 531–571. [Google Scholar] [CrossRef] [Green Version]
- Feng, G.-L.; Feng, X.-T.; Chen, B.-R.; Xiao, Y.-X.; Yu, Y. A Microseismic Method for Dynamic Warning of Rockburst Development Processes in Tunnels. Rock Mech. Rock Eng. 2015, 48, 2061–2076. [Google Scholar] [CrossRef]
- Li, S.; Liu, B.; Xu, X.; Nie, L.; Liu, Z.; Song, J.; Sun, H.; Chen, L.; Fan, K. An Overview of Ahead Geological Prospecting in Tunneling. Tunn. Undergr. Space Technol. 2017, 63, 69–94. [Google Scholar] [CrossRef]
- Yang, S.Q.; Chen, M.; Jing, H.W.; Chen, K.F.; Meng, B. A Case Study on Large Deformation Failure Mechanism of Deep Soft Rock Roadway in Xin’an Coal Mine, China. Eng. Geol. 2017, 217, 89–101. [Google Scholar] [CrossRef]
- Bi, R.; Cheng, W.; Chen, X. Effect of Calcium Sulfate Variety and Content on Hydration Mechanism of Grout Sealants for Coal-Bed Methane Drainage Boreholes. Constr. Build. Mater. 2019, 203, 443–455. [Google Scholar] [CrossRef]
- Chen, X.; Bi, R.; Zhang, L. Effect of Water-to-Cement Ratio on Sulfo-Aluminate Type Cementitious Grouting Materials. Mag. Concr. Res. 2019, 71, 298–308. [Google Scholar] [CrossRef]
- Li, Y.B.; Yue, C.H.; Guo, X. Research on Drilling and Sealing Technology for Cross Bedding of Superthick Coal Seam. Adv. Civ. Eng. 2022, 2022, 3011856. [Google Scholar] [CrossRef]
- Zhao, D.; Liu, J.; Pan, J.T. Study on Gas Seepage from Coal Seams in the Distance between Boreholes for Gas Extraction. J. Loss Prev. Process Ind. 2018, 54, 266–272. [Google Scholar] [CrossRef]
- Xie, C.; Nguyen, H.; Choi, Y.; Armaghani, D.J. Optimized Functional Linked Neural Network for Predicting Diaphragm Wall Deflection Induced by Braced Excavations in Clays. Geosci. Front. 2022, 2, 101313. [Google Scholar] [CrossRef]
- Ge, Z.; Cao, S.; Lu, Y.; Gao, F. Fracture Mechanism and Damage Characteristics of Coal Subjected to a Water Jet under Different Triaxial Stress Conditions. J. Pet. Sci. Eng. 2022, 208, 109157. [Google Scholar] [CrossRef]
- Hu, S.; Hao, G.; Feng, G.; Guo, H.; Wu, D. A Method for Improving the Methane Extraction Concentrations of in-Seam Boreholes. Fuel 2020, 265, 117006. [Google Scholar] [CrossRef]
- Huang, C.G.; Zhang, Y.B.; He, J.F.; Luo, Y.; Sun, Z.G. Permeability Improvements of an Outburst-Prone Coal Seam by Means of Presplitting and Blasting with Multiple Deep Boreholes. Energy Sci. Eng. 2019, 7, 2223–2236. [Google Scholar] [CrossRef] [Green Version]
- Chen, X.; Shan, W.; Sun, R.; Zhang, L. Methane Displacement Characteristic of Coal and Its Pore Change in Water Injection. Energy Explor. Exploit. 2020, 38, 1647–1663. [Google Scholar] [CrossRef]
- Lin, B.; Yan, F.; Zhu, C.; Zhou, Y.; Zou, Q.; Guo, C.; Liu, T. Cross-Borehole Hydraulic Slotting Technique for Preventing and Controlling Coal and Gas Outbursts During Coal Roadway Excavation. J. Nat. Gas Sci. Eng. 2015, 26, 518–525. [Google Scholar] [CrossRef]
- Liu, Z.; Cheng, Y.; Jiang, J.; Li, W.; Jin, K. Interactions between Coal Seam Gas Drainage Boreholes and the Impact of Such on Borehole Patterns. J. Nat. Gas Sci. Eng. 2017, 38, 597–607. [Google Scholar] [CrossRef] [Green Version]
- Zhang, X.; Zou, J. Research on Collaborative Control Technology of Coal Spontaneous Combustion and Gas Coupling Disaster in Goaf Based on Dynamic Isolation. Fuel 2022, 321, 124123. [Google Scholar] [CrossRef]
- Wei, P.; Huang, C.; Li, X.; Peng, S.; Lu, Y. Numerical Simulation of Boreholes for Gas Extraction and Effective Range of Gas Extraction in Soft Coal Seams. Energy Sci. Eng. 2019, 7, 1632–1648. [Google Scholar] [CrossRef]
- Xia, T.; Zhou, F.; Liu, J.; Gao, F. Evaluation of the Pre-Drained Coal Seam Gas Quality. Fuel 2014, 130, 296–305. [Google Scholar] [CrossRef]
- Xu, Y.; Chen, X.; Zhao, W.; Chen, P. Effect of Water Intrusion on the Characteristics of Surface Morphology and Pore Fracture Spaces in Argillaceous Meagre Coal. J. Nat. Gas Sci. Eng. 2020, 81, 103404. [Google Scholar] [CrossRef]
- Xue, Y.; Gao, F.; Liu, X.; Li, X. Research on Damage Distribution and Permeability Distribution of Coal Seam with Slotted Borehole. Comput. Mater. Contin. 2015, 47, 127–141. [Google Scholar]
- Zhang, K.; Sun, K.; Yu, B.; Gamage, R.P. Determination of Sealing Depth of in-Seam Boreholes for Seam Gas Drainage Based on Drilling Process of a Drifter. Eng. Geol. 2016, 210, 115–123. [Google Scholar] [CrossRef]
- Chen, X.; Zhang, L.; Shen, M. Experimental Research on Desorption Characteristics of Gas-Bearing Coal Subjected to Mechanical Vibration. Energy Explor. Exploit. 2020, 38, 1454–1466. [Google Scholar] [CrossRef]
- Zheng, C.; Chen, Z.; Kizil, M.; Aminossadati, S.; Zou, Q.; Gao, P. Characterisation of Mechanics and Flow Fields around in-Seam Methane Gas Drainage Borehole for Preventing Ventilation Air Leakage: A Case Study. Int. J. Coal Geol. 2016, 162, 123–138. [Google Scholar] [CrossRef] [Green Version]
- Zuo, S.; Zhang, L.; Deng, K. Experimental Study on Gas Adsorption and Drainage of Gas-Bearing Coal Subjected to Tree-Type Hydraulic Fracturing. Energy Rep. 2022, 8, 649–660. [Google Scholar] [CrossRef]
- Brown, E.T.; Bray, J.W.; Ladanyi, B.; Hoek, E. Ground Response Curves for Rock Tunnels. J. Geotech. Eng. 1983, 109, 15–39. [Google Scholar] [CrossRef]
- Hoek, E.; Brown, E.T. The Hoek–Brown Failure Criterion and Gsi—2018 Edition. J. Rock Mech. Geotech. Eng. 2019, 11, 445–463. [Google Scholar] [CrossRef]
- Jayanthu, S.; Singh, T.N.; Singh, D.P. Stress Distribution During Extraction of Pillars in a Thick Coal Seam. Rock. Mech. Rock Eng. 2004, 37, 171–192. [Google Scholar]
- Li, X.; Gong, F.; Tao, M.; Dong, L.; Du, K.; Ma, C.; Zhou, Z.; Yin, T. Failure Mechanism and Coupled Static-Dynamic Loading Theory in Deep Hard Rock Mining: A Review. J. Rock Mech. Geotech. Eng. 2017, 9, 767–782. [Google Scholar] [CrossRef]
- Xiao, S.; Ren, Q.; Cheng, Y.; Zhao, H.; Cao, S.; Zhang, L.; Chen, B.; Meng, X. Damage and Fracture Characteristics of Rocks with Different Structures under High-Velocity Water Jet Impact. Eng. Fract. Mech. 2021, 256, 107961. [Google Scholar] [CrossRef]
- Zhao, Y.; Lin, B.; Liu, T.; Kong, J.; Zheng, Y. Gas Flow in Hydraulic Slotting-Disturbed Coal Seam Considering Stress Relief Induced Damage. J. Nat. Gas Sci. Eng. 2020, 75, 103160. [Google Scholar] [CrossRef]
- Zhao, Y.; Wang, Y.; Wang, W.; Wan, W.; Tang, J. Modeling of Non-Linear Rheological Behavior of Hard Rock Using Triaxial Rheological Experiment. Int. J. Rock Mech. Min. Sci. 2017, 93, 66–75. [Google Scholar] [CrossRef]
- Hoek, E.; Carranza-Torres, C.; Corkum, B. Hoek-Brown Failure Criterion-2002 Edition. In Proceedings of the NARMS-Tac 1, Toronto, ON, Canada, 7–10 July 2002; pp. 267–273. [Google Scholar]
- Barton, N. The influence of joint properties in modelling jointed rock masses. In Proceedings of the 8th ISRM Congress 1995, Tokyo, Japan, 25–30 September 1995. [Google Scholar]
- Barton, N.; Bandis, S. Effects of block size on the shear behavior of jointed rock. In Proceedings of the 23rd US Symposium on Rock Mechanics (USRMS) 1982, Berkeley, CA, USA, 25–27 August 1982. [Google Scholar]
- Belem, T.; Homand-Etienne, F.; Souley, M. Quantitative Parameters for Rock Joint Surface Roughness. Rock Mech. Rock Eng. 2000, 33, 217–242. [Google Scholar] [CrossRef]
- Fardin, N.; Stephansson, O.; Jing, L. The Scale Dependence of Rock Joint Surface Roughness. Int. J. Rock Mech. Min. Sci. 2001, 38, 659–669. [Google Scholar] [CrossRef]
- Kulatilake, P.H.S.W.; Balasingam, P.; Park, J.; Morgan, R. Natural Rock Joint Roughness Quantification through Fractal Techniques. Geotech. Geol. Eng. 2006, 24, 1181–1202. [Google Scholar] [CrossRef]
- Lee, Y.H.; Carr, J.R.; Barr, D.J.; Haas, C.J. The Fractal Dimension as a Measure of the Roughness of Rock Discontinuity Profiles. Int. J. Rock Mech. Min. Sci. Geomech. Abstr. 1990, 26, 453–464. [Google Scholar] [CrossRef]
- Maerz, N.H.; Franklin, J.A.; Bennett, C.P. Joint Roughness Measurement Using Shadow Profilometry. Int. J. Rock Mech. Min. Sci. Geomech. Abstr. 1990, 27, 329–343. [Google Scholar] [CrossRef]
- Myers, N.O. Characterization of Surface Roughness. Wear 1962, 5, 182–189. [Google Scholar] [CrossRef]
- Yang, Z.Y.; Lo, S.C.; Di, C.C. Reassessing the Joint Roughness Coefficient (Jrc) Estimation Using Z2. Rock Mech. Rock Eng. 2001, 34, 243–251. [Google Scholar] [CrossRef]
- Yu, X.; Vayssade, B. Joint Profiles and Their Roughness Parameters. Int. J. Rock Mech. Min. Sci. Geomech. Abstr. 1991, 28, 333–336. [Google Scholar] [CrossRef]
- Zhang, G.; Karakus, M.; Tang, H.; Ge, Y.; Zhang, L. A New Method Estimating the 2d Joint Roughness Coefficient for Discontinuity Surfaces in Rock Masses. Int. J. Rock Mech. Min. Sci. 2014, 72, 191–198. [Google Scholar] [CrossRef]
- Fardin, N.; Feng, Q.; Stephansson, O. Application of a New in Situ 3d Laser Scanner to Study the Scale Effect on the Rock Joint Surface Roughness. Int. J. Rock Mech. Min. Sci. 2004, 41, 329–335. [Google Scholar] [CrossRef]
- Barton, N.; Choubey, V. The Shear Strength of Rock Joints in Theory and Practice. Rock Mech. 1977, 10, 1–54. [Google Scholar] [CrossRef]
- Sonmez, H.; Ulusay, R. Modifications to the Geological Strength Index (Gsi) and Their Applicability to Stability of Slopes. Int. J. Rock Mech. Min. Sci. 1999, 36, 743–760. [Google Scholar] [CrossRef]
- Marinos, P.; Hoek, E. Gsi: A geologically friendly tool for rock mass strength estimation. In Proceedings of the ISRM International Symposium 2000, Melbourne, Australia, 19–24 November 2000; pp. 1422–1442. [Google Scholar]
- Cai, M.; Kaiser, P.K.; Uno, H.; Tasaka, Y.; Minami, M. Estimation of Rock Mass Deformation Modulus and Strength of Jointed Hard Rock Masses Using the Gsi System. Int. J. Rock Mech. Min. Sci. 2004, 41, 3–19. [Google Scholar] [CrossRef]
- Cai, M. Rock Mechanics and Engineering; Beijing Science Press: Beijing, China, 2013. [Google Scholar]
- Chang, Z. Study on New Inorganic Sealing Materials and Technology; China University of Mining and Technology: Beijing, China, 2014. [Google Scholar]
- Ruiqing, B. Study on Sealing Parameters and Sealing Material Performance of Gas Drainage Borehole; China University of Geosciences: Beijing, China, 2019. [Google Scholar]
Figure 1.
Schematic diagram of gas leakage fracture field of gas extraction borehole.

Figure 2.
Schematic diagram of gas leakage mechanism of gas extraction borehole. (a) Air leakage of sealing material; (b) air leakage from the loosened circle of the drill hole; (c) Air leakage from the coal mass pressure relief zone.
Figure 2.
Schematic diagram of gas leakage mechanism of gas extraction borehole. (a) Air leakage of sealing material; (b) air leakage from the loosened circle of the drill hole; (c) Air leakage from the coal mass pressure relief zone.

Figure 3.
Permeability change during full stress-strain of coal rock.

Figure 4.
The location of mine.

Figure 5.
Numerical simulation model.

Figure 6.
Stress distribution cloud: (a) X direction; (b) Y direction; (c) Z direction.


Figure 7.
Stress distribution result.

Figure 8.
Curve of relative permeability and relative permeability change rate after excavation of the roadway.
Figure 8.
Curve of relative permeability and relative permeability change rate after excavation of the roadway.

Figure 9.
Schematic diagram of field test. 1—Fracture and free surface penetration zone. 2—Fracture and free surface non-penetration zone. 3—Coal seam. 4—Gas injection pipe. 5—Water injection pipe. 6—Liquid injection pipe. 7—Capsule. 8—Borehole. 9—Mucilage.
Figure 9.
Schematic diagram of field test. 1—Fracture and free surface penetration zone. 2—Fracture and free surface non-penetration zone. 3—Coal seam. 4—Gas injection pipe. 5—Water injection pipe. 6—Liquid injection pipe. 7—Capsule. 8—Borehole. 9—Mucilage.

Figure 10.
Schematic diagram of the structure of hole sealing device. 1—water injection thin tube. 2—35 mm O.D. capsule. 3—quarter pipe hoop. 4—quarter pipe. 5—M10 pair of wire. 6—38 mm O.D. capsule. 7—M14 pair of wire. 8—9 mm O.D. pipe line. A—piezometer pipe. B—support pipe hoop. C—grouting pipe.
Figure 10.
Schematic diagram of the structure of hole sealing device. 1—water injection thin tube. 2—35 mm O.D. capsule. 3—quarter pipe hoop. 4—quarter pipe. 5—M10 pair of wire. 6—38 mm O.D. capsule. 7—M14 pair of wire. 8—9 mm O.D. pipe line. A—piezometer pipe. B—support pipe hoop. C—grouting pipe.

Figure 11.
Physical photo of hole sealing device.

Figure 12.
XP-1A qualitative leak detector.

Figure 13.
Pressure curve graph.

Figure 14.
Coal tunnel field test photo: (a) photo of borehole sealing device; (b) photo of site operation; (c) photo of completed borehole sealing.
Figure 14.
Coal tunnel field test photo: (a) photo of borehole sealing device; (b) photo of site operation; (c) photo of completed borehole sealing.


Figure 15.
Rock tunnel field test photo: (a) photo of borehole sealing device; (b) photo of site operation; (c) photo of completed borehole sealing.
Figure 15.
Rock tunnel field test photo: (a) photo of borehole sealing device; (b) photo of site operation; (c) photo of completed borehole sealing.

Figure 16.
Pressure curve graph.


Table 1.
Distribution of top and bottom rock layers of coal seam.
| Geological Group Color | Stratigraphic Number | Rockiness | Thickness (m) | Depth (m) |
|---|---|---|---|---|
 | 1 | Fine Sandstone | 4.5 | 782.3 |
 | 2 | Sandy mudstone | 13.2 | 786.8 |
 | 3 | E8 coal seam | 2.2 | 800 |
 | 4 | Sandy mudstone | 6 | 806 |
 | 5 | Siltstone | 2.4 | 808.4 |
Table 2.
Mechanical parameters of coal and rock.
| Rockiness | Bulk Modulus (GPa) | Shear Modulus (GPa) | Modulus of Elasticity (GPa) | Poisson’s Ratio | Tensile Strength (MPa) | Density (kg/m3) |
|---|---|---|---|---|---|---|
| Fine Sandstone | 18.49 | 14.45 | 34.4 | 0.19 | 4.16 | 2699 |
| Sandy mudstone | 10.73 | 8.05 | 19.32 | 0.2 | 2.24 | 2511 |
| E8 coal seam | 12.47 | 8.96 | 21.69 | 0.21 | 0.21 | 1421 |
| Sandy mudstone | 10.18 | 7.63 | 18.32 | 0.2 | 1.23 | 2595 |
| Siltstone | 13.22 | 9.92 | 23.8 | 0.2 | 2.24 | 2622 |
Publisher’s Note: MDPI stays neutral with regard to jurisdictional claims in published maps and institutional affiliations. |
© 2022 by the authors. Licensee MDPI, Basel, Switzerland. This article is an open access article distributed under the terms and conditions of the Creative Commons Attribution (CC BY) license (https://creativecommons.org/licenses/by/4.0/).
Share and Cite
MDPI and ACS Style
Bi, R.; Chen, X.; Zhang, L.; Wang, S.; Liu, X.; Hua, S. Refinement Study on Pressure Relief Zone of Gas Extraction Borehole Considering Roughness. Sustainability 2022, 14, 9541. https://doi.org/10.3390/su14159541
AMA Style
Bi R, Chen X, Zhang L, Wang S, Liu X, Hua S. Refinement Study on Pressure Relief Zone of Gas Extraction Borehole Considering Roughness. Sustainability. 2022; 14(15):9541. https://doi.org/10.3390/su14159541
Chicago/Turabian StyleBi, Ruiqing, Xuexi Chen, Liang Zhang, Shuangyan Wang, Xiaohui Liu, and Shuai Hua. 2022. "Refinement Study on Pressure Relief Zone of Gas Extraction Borehole Considering Roughness" Sustainability 14, no. 15: 9541. https://doi.org/10.3390/su14159541
Note that from the first issue of 2016, this journal uses article numbers instead of page numbers. See further details here.