
Perceived Walkability and Respective Urban Determinants: Insights from Bologna and Porto

 , , , , ,
  and
and
Abstract
:1. Introduction
2. Literature Review
3. Method and Data
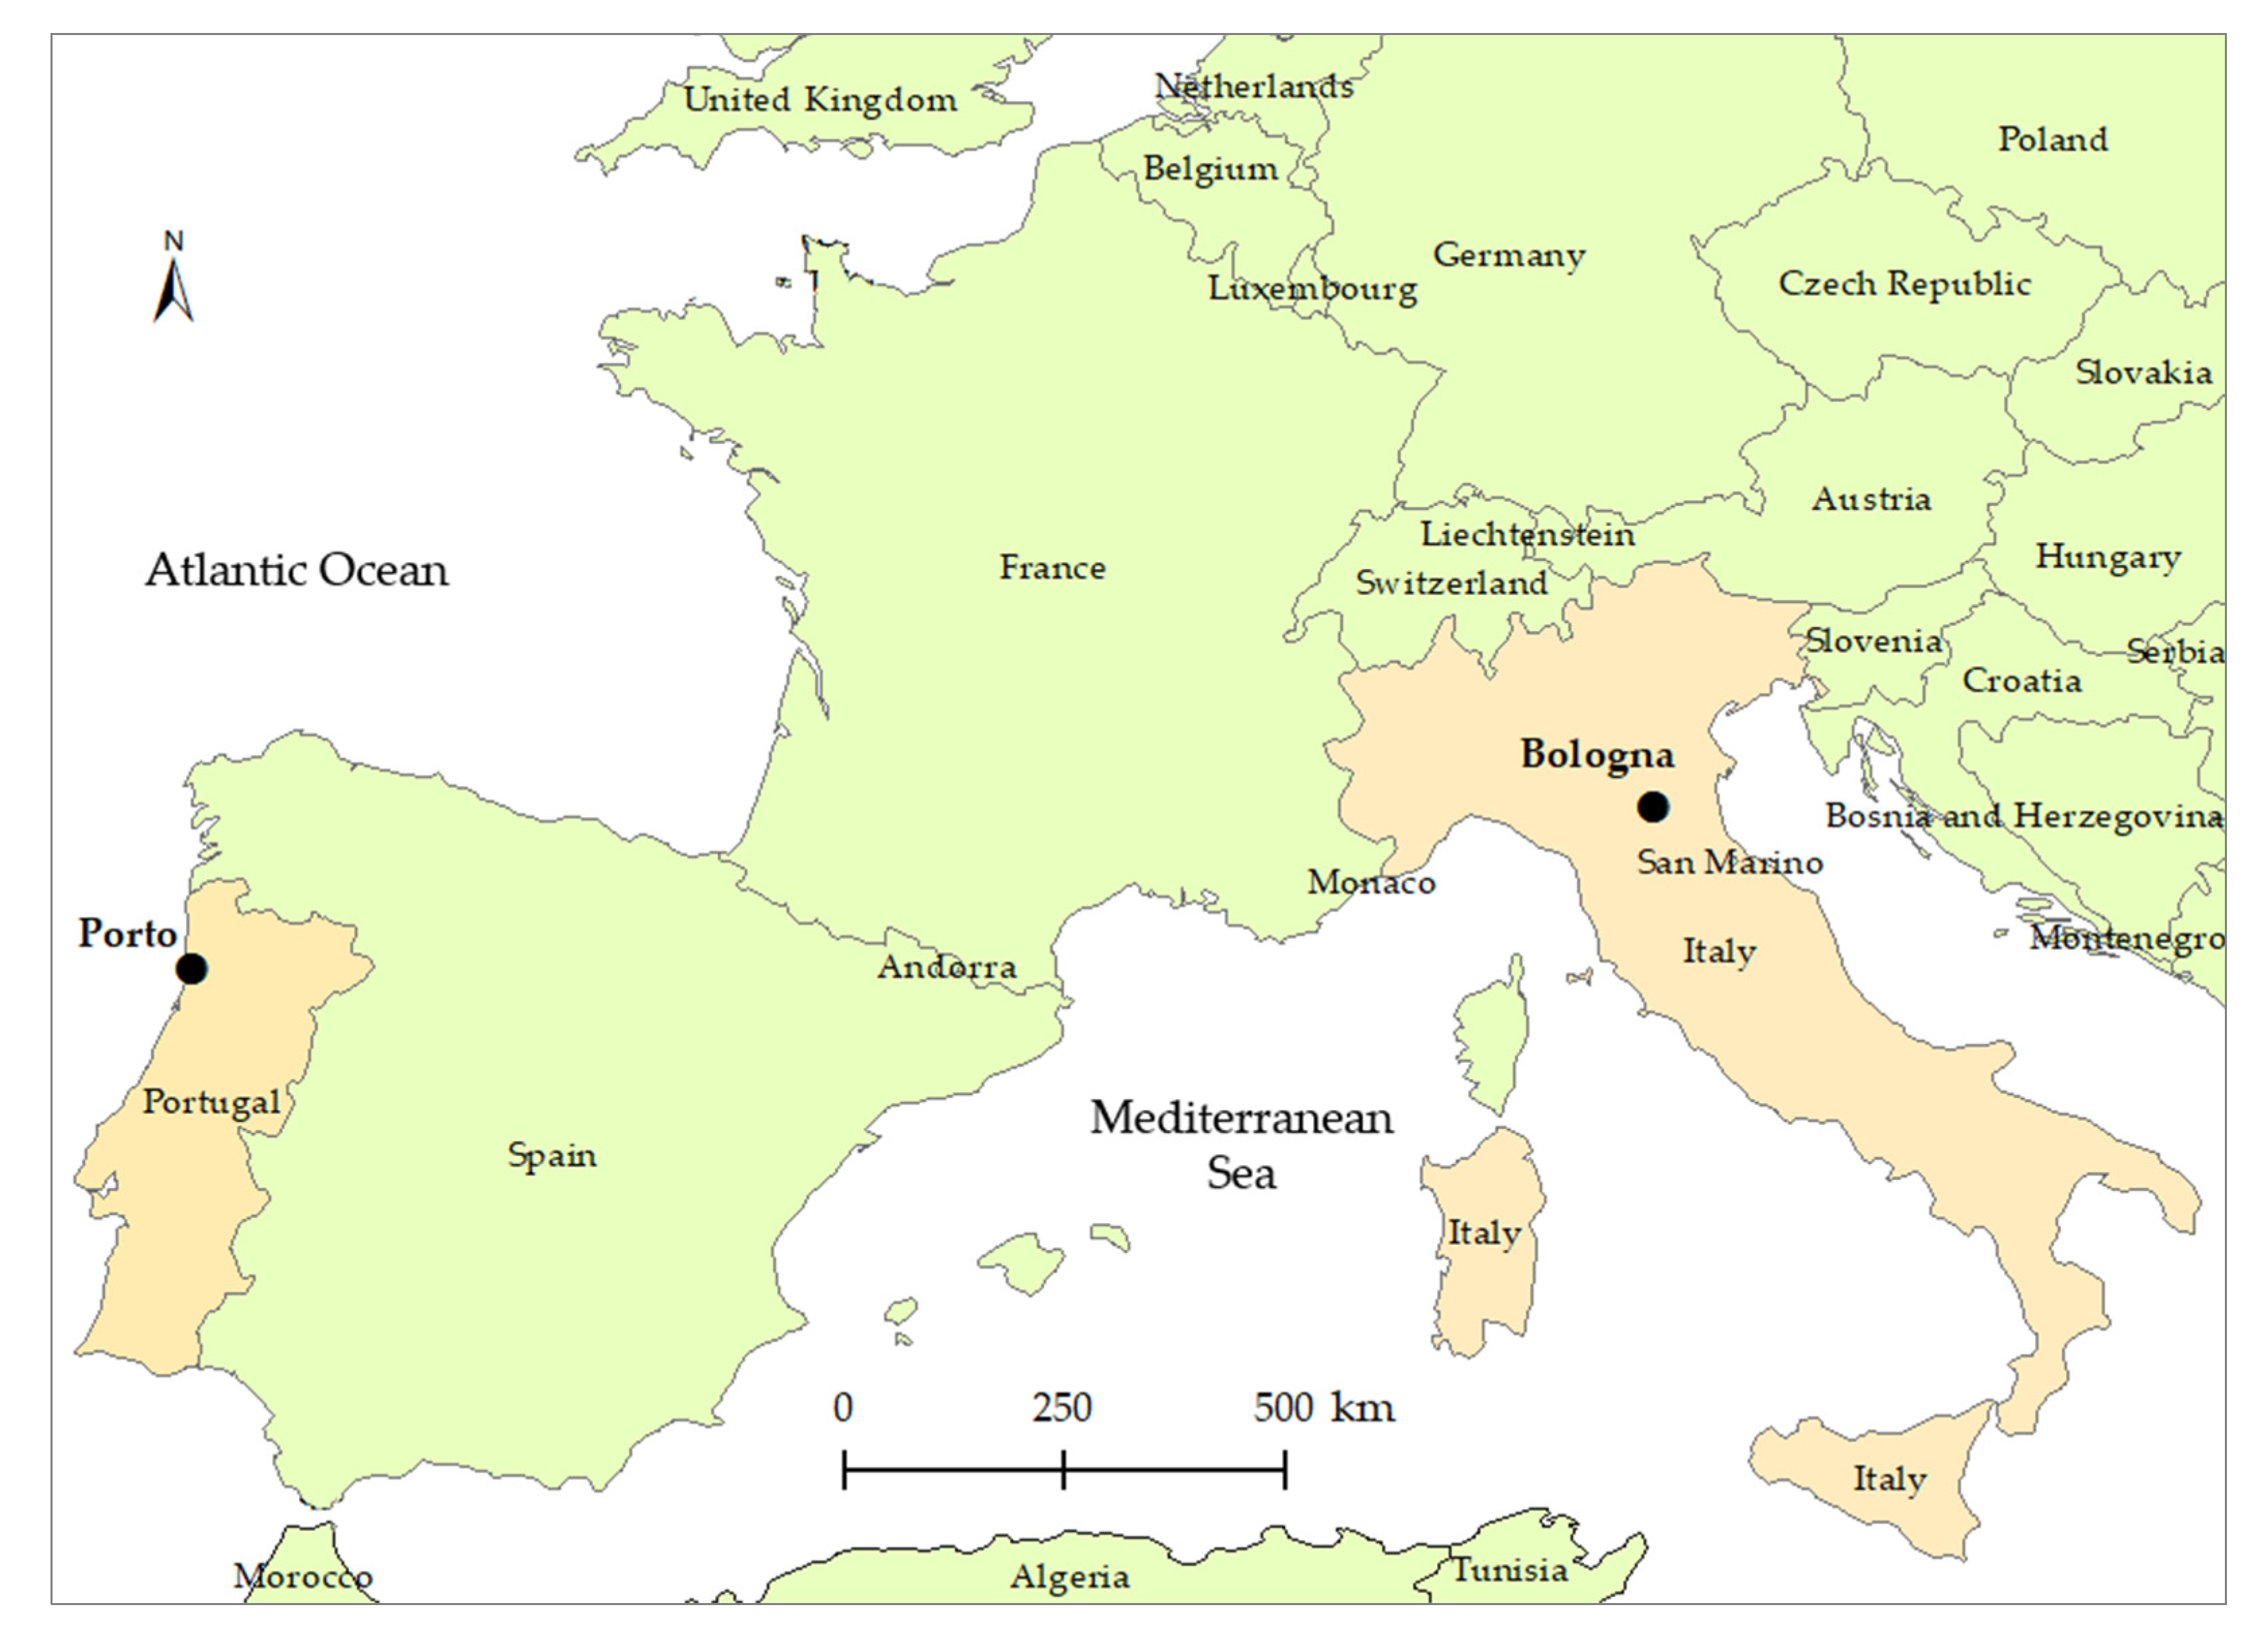
3.1. Study Areas
3.2. Data Collection
3.3. Data Analysis
4. Results
4.1. Sample Description
4.2. Sample Description
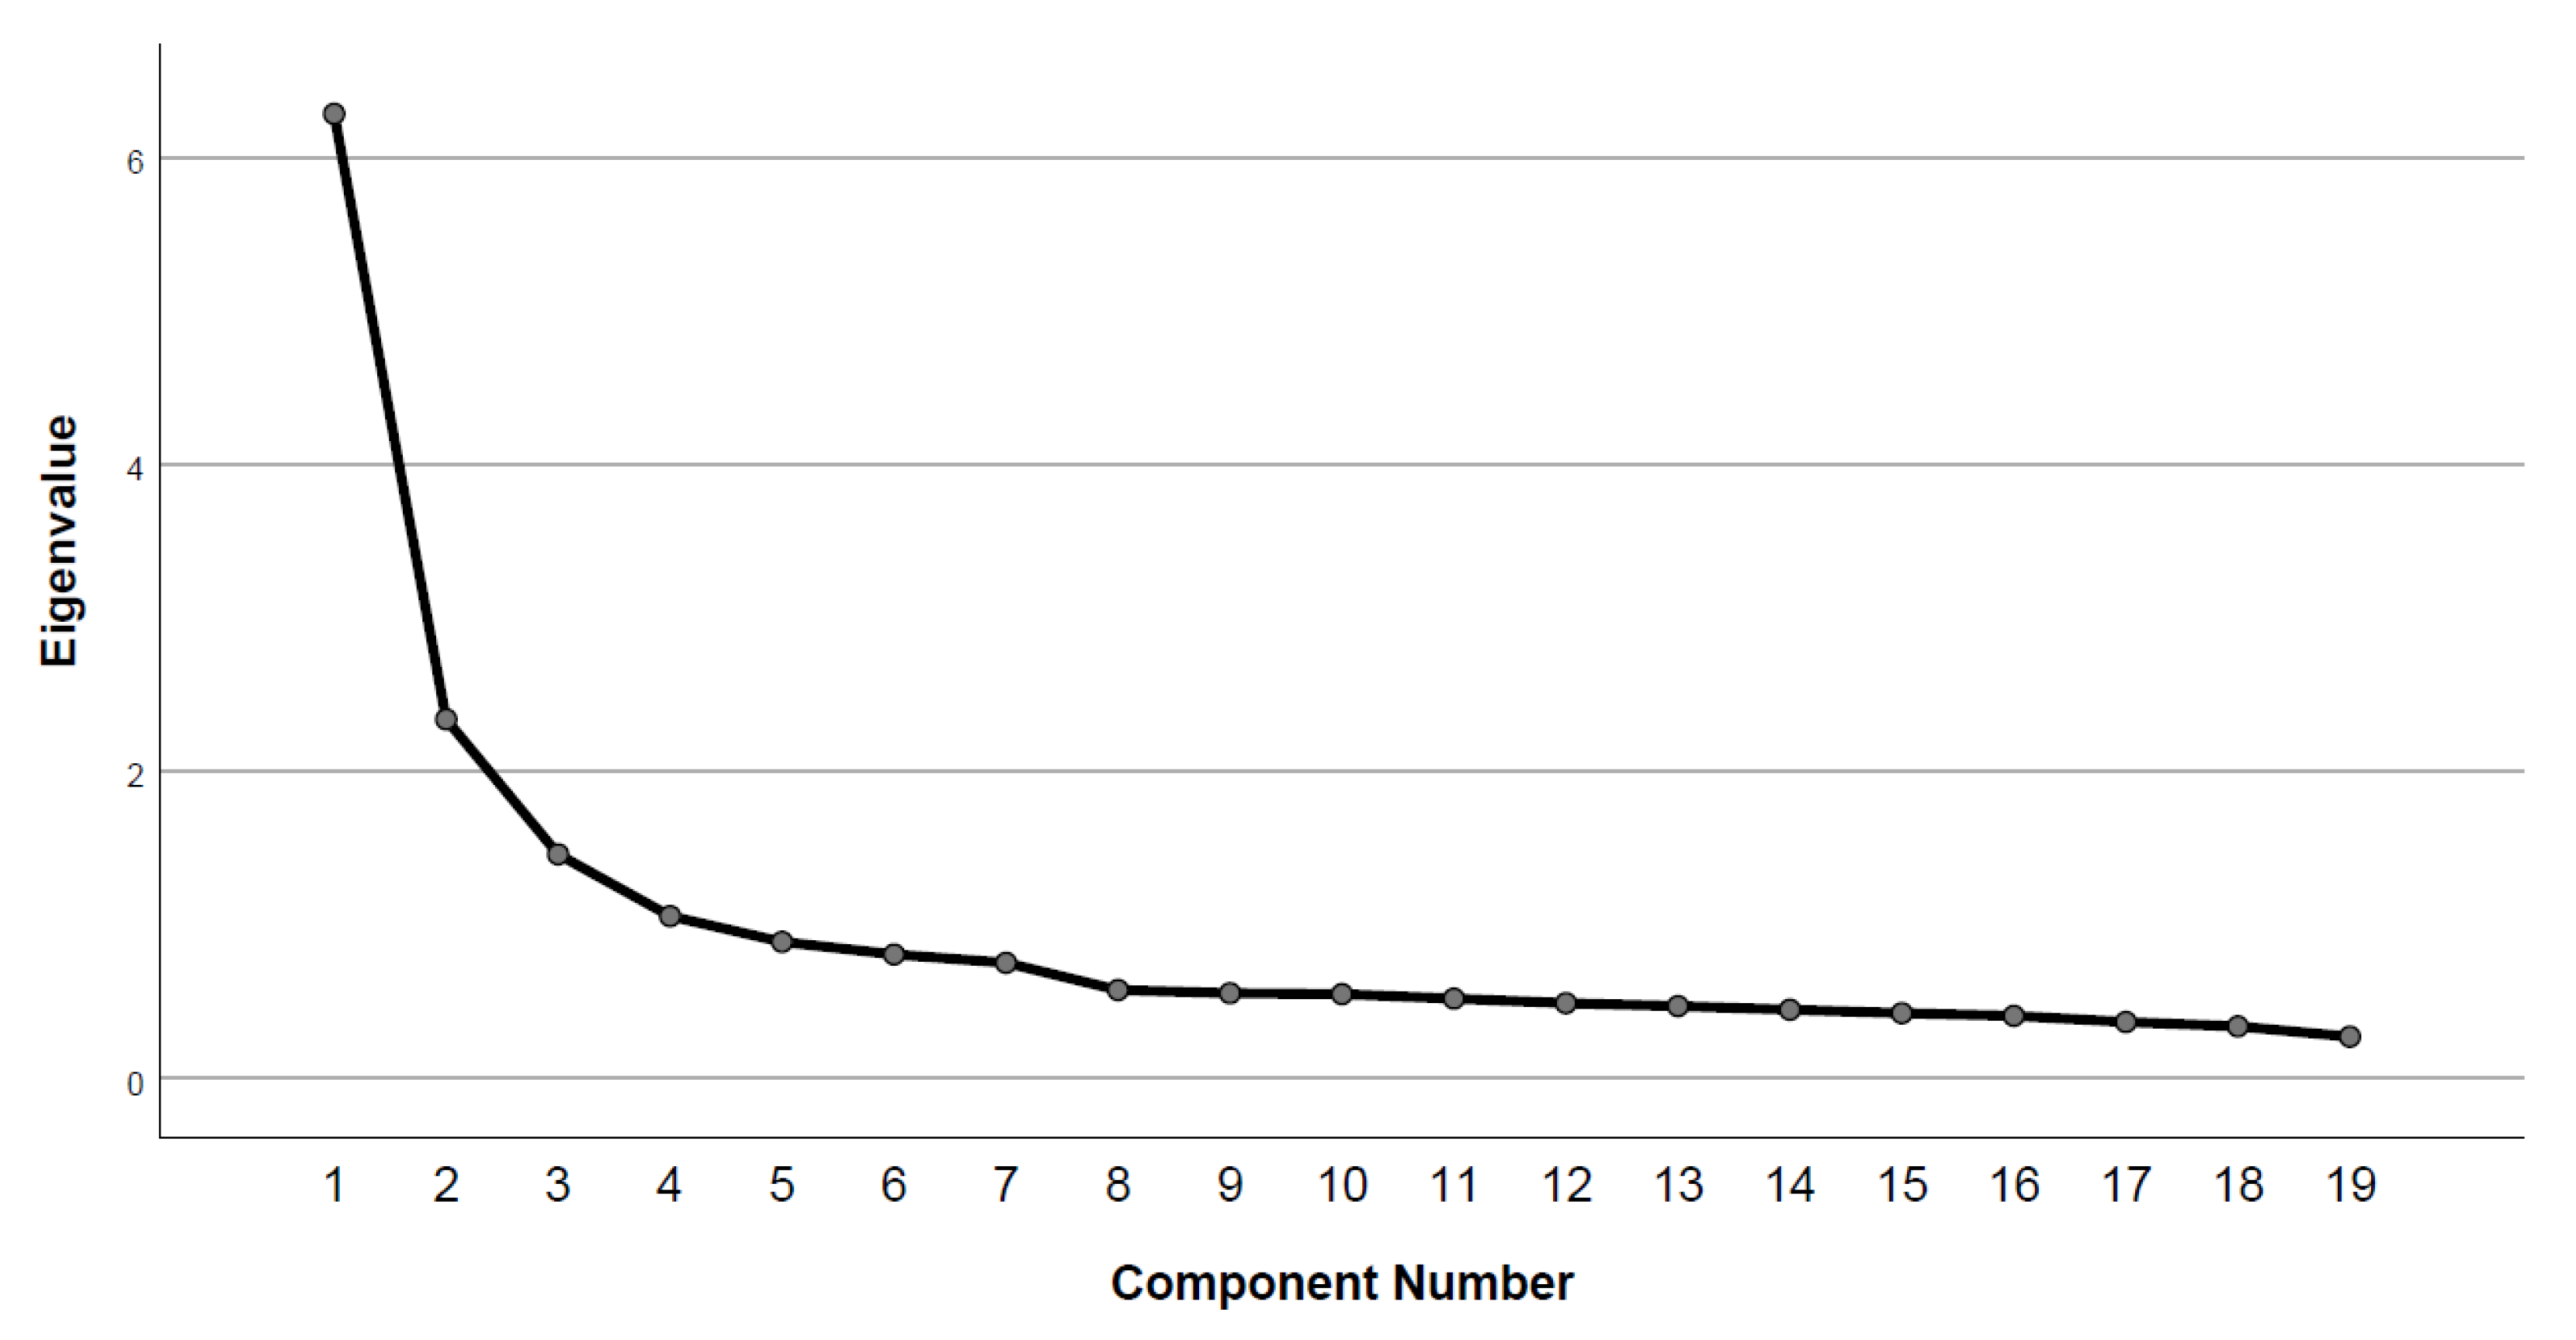
4.3. Factor Analysis
5. Discussion
6. Conclusions
Author Contributions
Funding
Institutional Review Board Statement
Informed Consent Statement
Data Availability Statement
Conflicts of Interest
References
- Bassett, D.R.; Pucher, J.; Buehler, R.; Thompson, D.; Crouter, S. Walking, Cycling, and Obesity Rates in Europe, North America, and Australia. J. Phys. Act. Health 2008, 5, 795–814. [Google Scholar] [CrossRef] [PubMed]
- Keall, M.D.; Shaw, C.; Chapman, R.; Howden-Chapman, P. Reductions in carbon dioxide emissions from an intervention to promote cycling and walking: A case study from New Zealand. Transp. Res. Part D Transp. Environ. 2018, 65, 687–696. [Google Scholar] [CrossRef]
- Ribeiro, P.J.; Fonseca, F. Students’ home-university commuting patterns: A shift towards more sustainable modes of transport. Case Stud. Transp. Policy 2022, 10, 954–964. [Google Scholar] [CrossRef]
- Arellana, J.; Saltarín, M.; Larrañaga, A.M.; Alvarez, V.; Henao, C.A. Urban walkability considering pedestrians’ perceptions of the built environment: A 10-year review and a case study in a medium-sized city in Latin America. Transp. Rev. 2020, 40, 183–203. [Google Scholar] [CrossRef]
- Fonseca, F.; Ribeiro, P.J.G.; Conticelli, E.; Jabbari, M.; Papageorgiou, G.; Tondelli, S.; Ramos, R.A.R. Built environment attributes and their influence on walkability. Int. J. Sustain. Transp. 2021, 16, 660–679. [Google Scholar] [CrossRef]
- Habibian, M.; Hosseinzadeh, A. Walkability index across trip purposes. Sustain. Cities Soc. 2018, 42, 216–225. [Google Scholar] [CrossRef]
- Forsyth, A. What is a walkable place? The walkability debate in urban design. Urban Des. Int. 2015, 20, 274–292. [Google Scholar] [CrossRef]
- Dovey, K.; Pafka, E. What is walkability? The urban DMA. Urban Stud. 2019, 57, 93–108. [Google Scholar] [CrossRef]
- Dörrzapf, L.; Kovács-Gyóri, A.; Resch, B.; Zeile, P. Defining and assessing walkability: An concept for an integrated approach using surveys, biosensors and geospatial analysis. Urban Dev. Issues 2019, 62, 5–15. [Google Scholar] [CrossRef] [Green Version]
- Cervero, R.; Kockelman, K. Travel demand and the 3Ds: Density, diversity, and design. Transp. Res. Part D Transp. Environ. 1997, 2, 199–219. [Google Scholar] [CrossRef]
- Ewing, R.; Cervero, R. Travel and the Built Environment: A meta-analysis. J. Am. Plan. Assoc. 2010, 76, 265–294. [Google Scholar] [CrossRef]
- Frank, L.D.; Schmid, T.L.; Sallis, J.F.; Chapman, J.; Saelens, B.E. Linking objectively measured physical activity with objectively measured urban form: Findings from SMARTRAQ. Am. J. Prev. Med. 2005, 28, 117–125. [Google Scholar] [CrossRef] [PubMed]
- Frank, L.D.; Sallis, J.F.; Saelens, B.E.; Leary, L.; Cain, K.; Conway, T.L.; Hess, P.M. The development of a walkability index: Application to the Neighborhood Quality of Life Study. Br. J. Sports Med. 2010, 44, 924–933. [Google Scholar] [CrossRef] [PubMed]
- Moran, M.R.; Eizenberg, E.; Plaut, P. Getting to Know a Place: Built Environment Walkability and Children’s Spatial Representation of Their Home-School (h–s) Route. Int. J. Environ. Res. Public Health 2017, 14, 607. [Google Scholar] [CrossRef] [Green Version]
- Williams, G.C.; Borghese, M.M.; Janssen, I. Neighborhood walkability and objectively measured active transportation among 10–13 year olds. J. Transp. Health 2018, 8, 202–209. [Google Scholar] [CrossRef]
- Iroz-Elardo, N.; Adkins, A.; Ingram, M. Measuring perceptions of social environments for walking: A scoping review of walkability surveys. Health Place 2020, 67, 102468. [Google Scholar] [CrossRef]
- Koohsari, M.J.; Badland, H.; Sugiyama, T.; Mavoa, S.; Christian, H.; Giles-Corti, B. Mismatch between Perceived and Objectively Measured Land Use Mix and Street Connectivity: Associations with Neighborhood Walking. J. Hered. 2014, 92, 242–252. [Google Scholar] [CrossRef] [Green Version]
- Andrews, G.J.; Hall, E.; Evans, B.; Colls, R. Moving beyond walkability: On the potential of health geography. Soc. Sci. Med. 2012, 75, 1925–1932. [Google Scholar] [CrossRef]
- Jensen, W.; Stump, T.; Brown, B.; Werner, C.; Smith, K. Walkability, complete streets, and gender: Who benefits most? Health Place 2017, 48, 80–89. [Google Scholar] [CrossRef]
- Wallmann, B.; Bucksch, J.; Froboese, I. The association between physical activity and perceived environment in German adults. Eur. J. Public Health 2011, 22, 502–508. [Google Scholar] [CrossRef] [Green Version]
- Shashank, A.; Schuurman, N. Unpacking walkability indices and their inherent assumptions. Health Place 2018, 55, 145–154. [Google Scholar] [CrossRef] [PubMed]
- Liao, B.; Berg, P.E.V.D.; van Wesemael, P.; Arentze, T.A. Individuals’ perception of walkability: Results of a conjoint experiment using videos of virtual environments. Cities 2022, 125, 103650. [Google Scholar] [CrossRef]
- Adkins, A.; Barillas-Longoria, G.; Martínez, D.N.; Ingram, M. Differences in social and physical dimensions of perceived walkability in Mexican American and non-hispanic white walking environments in Tucson, Arizona. J. Transp. Health 2019, 14. [Google Scholar] [CrossRef] [PubMed]
- Jun, H.-J.; Hur, M. The relationship between walkability and neighborhood social environment: The importance of physical and perceived walkability. Appl. Geogr. 2015, 62, 115–124. [Google Scholar] [CrossRef]
- Perry, C.; Herting, J.; Berke, E.; Nguyen, H.; Vernez, A.; Beresford, S.; Ockene, J.; Manson, J.; LaCroix, A. Does neighborhood walkability moderate the effects of intrapersonal characteristics on amount of walking in post-menopausal women? Health Place 2013, 21, 39–45. [Google Scholar] [CrossRef] [Green Version]
- Dörrzapf, L.; Zeile, P.; Brocza, U.; Schwomma, Y.; Resch, B.; Kovács-Győri, A.; Berger, M. New integrated walkability research approach. In Proceedings of the REAL CORP 2019, Karlsruhe, Germany, 2–4 April 2019. [Google Scholar]
- Fancello, G.; Congiu, T.; Tsoukiàs, A. Mapping walkability. A subjective value theory approach. Socio-Economic Plan. Sci. 2020, 72, 100923. [Google Scholar] [CrossRef]
- Saadi, I.; Aganze, R.; Moeinaddini, M.; Asadi-Shekari, Z.; Cools, M. A Participatory Assessment of Perceived Neighbourhood Walkability in a Small Urban Environment. Sustainability 2021, 14, 206. [Google Scholar] [CrossRef]
- Molina-García, J.; Campos, S.; García-Massó, X.; Herrador-Colmenero, M.; Gálvez-Fernández, P.; Molina-Soberanes, D.; Queralt, A.; Chillón, P. Different neighborhood walkability indexes for active commuting to school are necessary for urban and rural children and adolescents. Int. J. Behav. Nutr. Phys. Act. 2020, 17, 1–11. [Google Scholar] [CrossRef]
- Saelens, B.E.; Sallis, J.F.; Black, J.B.; Chen, D. Neighborhood-Based Differences in Physical Activity: An Environment Scale Evaluation. Am. J. Public Health 2003, 93, 1552–1558. [Google Scholar] [CrossRef]
- Taleai, M.; Amiri, E.T. Spatial multi-criteria and multi-scale evaluation of walkability potential at street segment level: A case study of tehran. Sustain. Cities Soc. 2017, 31, 37–50. [Google Scholar] [CrossRef]
- Forsyth, A.; Oakes, J.; Schmitz, K.; Hearst, M. Does residential density increase walking and other physical activity? Urban Stud. 2007, 44, 679–697. [Google Scholar] [CrossRef]
- Huang, R.; Moudon, A.; Zhou, C.; Saelens, B. Higher residential and employment densities are associated with more objectively measured walking in the home neighbourhood. J. Transp. Health 2019, 12, 142–151. [Google Scholar] [CrossRef] [PubMed]
- Ribeiro, A.I.; Hoffimann, E. Development of a Neighbourhood Walkability Index for Porto Metropolitan Area. How Strongly Is Walkability Associated with Walking for Transport? Int. J. Environ. Res. Public Health 2018, 15, 2767. [Google Scholar] [CrossRef] [PubMed] [Green Version]
- Clark, A.; Scott, D.M.; Yiannakoulias, N. Examining the relationship between active travel, weather, and the built environment: A multilevel approach using a GPS-enhanced dataset. Transportation 2013, 41, 325–338. [Google Scholar] [CrossRef] [Green Version]
- Shammas, T.; Escobar, F. Comfort and time-based walkability index design: A GIS-based proposal. Int. J. Environ. Res. Public Health 2019, 16, 2850. [Google Scholar] [CrossRef] [Green Version]
- Wang, C.; Chen, N.; Tian, G. Do accessibility and clustering affect active travel behavior in Salt Lake City? Transp. Res. Part D 2021, 90, 1026552021. [Google Scholar] [CrossRef]
- Vale, D. Does commuting time tolerance impede sustainable urban mobility? Analysing the impacts on commuting behaviour as a result of workplace relocation to a mixed-use centre in Lisbon. J. Transp. Geogr. 2013, 32, 38–48. [Google Scholar] [CrossRef]
- Moreno, C.; Allam, Z.; Chabaud, D.; Gall, C.; Pratlong, F. Introducing the “15-Minute City”: Sustainability, Resilience and Place Identity in Future Post-Pandemic Cities. Smart Cities 2021, 4, 93–111. [Google Scholar] [CrossRef]
- Jabbari, M.; Fonseca, F.; Ramos, R. Combining multi-criteria and space syntax analysis to assess a pedestrian network: The case of Oporto. J. Urban Des. 2017, 23, 23–41. [Google Scholar] [CrossRef]
- Boulange, C.; Pettit, C.; Gunn, L.; Giles-Corti, B.; Badland, H. Improving planning analysis and decision making: The development and application of a Walkability Planning Support System. J. Transp. Geogr. 2018, 69, 129–137. [Google Scholar] [CrossRef]
- Cruise, S.; Hunter, R.F.; Kee, F.; Donnelly, M.; Ellis, G.; Tully, M.A. A comparison of road- and footpath-based walkability indices and their associations with active travel. J. Transp. Health 2017, 6, 119–127. [Google Scholar] [CrossRef] [Green Version]
- Ferrer, S.; Ruiz, T.; Mars, L. A qualitative study on the role of the built environment for short walking trips. Transp. Res. Part F: Traffic Psychol. Behav. 2015, 33, 141–160. [Google Scholar] [CrossRef]
- Herrmann-Lunecke, M.G.; Mora, R.; Vejares, P. Perception of the built environment and walking in pericentral neighbourhoods in Santiago, Chile. Travel Behav. Soc. 2021, 23, 192–206. [Google Scholar] [CrossRef]
- Taleai, M.; Yameqani, A.S. Integration of GIS, remote sensing and Multi-Criteria Evaluation tools in the search for healthy walking paths. KSCE J. Civ. Eng. 2017, 22, 279–291. [Google Scholar] [CrossRef]
- Gaglione, F.; Cottrill, C.; Gargiulo, C. Urban services, pedestrian networks and behaviors to measure elderly accessibility. Transp. Res. Part D Transp. Environ. 2020, 90, 102687. [Google Scholar] [CrossRef]
- Ruiz-Padillo, A.; Pasqual, F.M.; Uriarte, A.M.L.; Cybis, H.B.B. Application of multi-criteria decision analysis methods for assessing walkability: A case study in Porto Alegre, Brazil. Transp. Res. Part D Transp. Environ. 2018, 63, 855–871. [Google Scholar] [CrossRef]
- Giles-Corti, B.; Wood, G.; Pikora, T.; Learnihan, V.; Bulsara, M.; Van Niel, K.; Timperio, A.; McCormack, G.; Villanueva, K. School site and the potential to walk to school: The impact of street connectivity and traffic exposure in school neighborhoods. Health Place 2011, 17, 545–550. [Google Scholar] [CrossRef]
- Lovasi, G.; Jacobson, J.; Quinn, J.; Neckerman, K.; Ashby-Thompson, M.; Rundle, A. Is the environment near home and school associated with physical activity and adiposity of urban preschool children? J. Urban Health 2011, 88, 1143–1157. [Google Scholar] [CrossRef] [Green Version]
- Zhang, C.; Zhou, B.; Chen, G.; Chen, F. Quantitative analysis of pedestrian safety at uncontrolled multi-lane mid-block crosswalks in China. Accid. Anal. Prev. 2017, 108, 19–26. [Google Scholar] [CrossRef]
- Foster, S.; Wood, L.; Christian, H.; Knuiman, M.; Giles-Corti, B. Planning safer suburbs: Do changes in the built environment influence residents’ perceptions of crime risk? Soc. Sci. Med. 2013, 97, 87–94. [Google Scholar] [CrossRef]
- Ewing, R.; Handy, S. Measuring the Unmeasurable: Urban Design Qualities Related to Walkability. J. Urban Des. 2009, 14, 65–84. [Google Scholar] [CrossRef]
- Yin, L. Street level urban design qualities for walkability: Combining 2D and 3D GIS measures. Comput. Environ. Urban Syst. 2017, 64, 288–296. [Google Scholar] [CrossRef]
- Nichani, V.; Vena, J.E.; Friedenreich, C.M.; Christie, C.; McCormack, G.R. A population-based study of the associations between neighbourhood walkability and different types of physical activity in Canadian men and women. Prev. Med. 2019, 129, 105864. [Google Scholar] [CrossRef] [PubMed]
- Fonseca, F.; Conticelli, E.; Papageorgiou, G.; Ribeiro, P.; Jabbari, M.; Tondelli, S.; Ramos, R. Levels and characteristics of utilitarian walking in the cities of Bologna and Porto. Sustainability 2021, 13, 3064. [Google Scholar] [CrossRef]
- Fonseca, F.; Conticelli, E.; Papageorgiou, G.; Ribeiro, P.; Jabbari, M.; Tondelli, S.; Ramos, R. Use and Perceptions of Pedestrian Navigation Apps: Findings from Bologna and Porto. ISPRS Int. J. Geo-Inform. 2021, 10, 446. [Google Scholar] [CrossRef]
- Jam, A.S.; Tabatabaei, M.R.; Mosaffaie, J.; Soltani, M.J.; Shadmani, A. Barriers to participatory implementation of soil conservation projects: Perspectives and priorities. Environ. Sci. Policy 2022, 131, 36–45. [Google Scholar] [CrossRef]
- ISTAT-Istituto Nazionale di Statistica. Annual Estimated Population. 2019. Available online: www.istat.it (accessed on 1 February 2022).
- SP-Statistics Portugal. Annual Estimated Population. 2019. Available online: www.ine.pt (accessed on 1 February 2022).
- Herian, M.; Tomkins, A. Citizen satisfaction survey data: A mode comparison of the derived importance-perfomance approach. Am. Rev. Public Adm. 2012, 42, 66–86. [Google Scholar] [CrossRef]
- Agyeman, S.; Kwarteng, R.A.; Zurkalnaine, S. Principal component analysis of driver challenges in the shared taxi market in Ghana. Case Stud. Transp. Policy 2018, 7, 73–86. [Google Scholar] [CrossRef]
- Martínez, O.; Ramírez, A. Walkability and the built environment: Validation of the Neighborhood Environment Walkability Scale (NEWS) for urban areas in Mexico. Qual. Quant. 2018, 52, 703–718. [Google Scholar] [CrossRef]
- Shrestha, N. Factor Analysis as a Tool for Survey Analysis. Am. J. Appl. Math. Stat. 2021, 9, 4–11. [Google Scholar] [CrossRef]
- Zavareh, M.; Mehdizadeh, M.; Nordfjærn, T. “If I know when you will arrive, I will let you walk to school:” The role of information technology. J. Saf. Res. 2020, 72, 267–277. [Google Scholar] [CrossRef] [PubMed]
- Mohanty, R.N.; Chani, P.S.; Mohanta, A. Measuring the impact of the built environment on pedestrians in the old Bhubaneswar precinct. J. Heritage Tour. 2020, 16, 181–200. [Google Scholar] [CrossRef]
- Lindelöw, D.; Svensson, Å.; Brundell-Freij, K.; Hiselius, L.W. Satisfaction or compensation? The interaction between walking preferences and neighbourhood design. Transp. Res. Part D Transp. Environ. 2017, 50, 520–532. [Google Scholar] [CrossRef]
- Kissi, E.; Boateng, E.B.; Adjei-Kumi, T.; Badu, E. Principal component analysis of challenges facing the implementation of value engineering in public projects in developing countries. Int. J. Constr. Manag. 2016, 17, 142–150. [Google Scholar] [CrossRef]
- Thibaud, J.-P. The Sensory Fabric of Urban Ambiances. Senses Soc. 2011, 6, 203–215. [Google Scholar] [CrossRef] [Green Version]
- Ramezani, S.; Laatikainen, T.; Hasanzadeh, K.; Kyttä, M. Shopping trip mode choice of older adults: An application of activity space and hybrid choice models in understanding the effects of built environment and personal goals. Transportation 2019, 48, 505–536. [Google Scholar] [CrossRef] [Green Version]
- Yin, L.; Wang, Z. Measuring visual enclosure for street walkability: Using machine learning algorithms and Google Street View imagery. Appl. Geogr. 2016, 76, 147–153. [Google Scholar] [CrossRef]
- Bahrainy, H.; Khosravi, H. The impact of urban design features and qualities on walkability and health in under-construction environments: The case of Hashtgerd New Town in Iran. Cities 2013, 31, 17–28. [Google Scholar] [CrossRef]
- Vural-Arslan, T.; Dostolu, N.; Köprülü-Babanci, Ö.; Aknctürk, N. Sustainable revitalisation as a tool for regenerating the attractiveness of an inner-city historic commercial district: Han district as a case. Urban Des. Int. 2011, 16, 188–201. [Google Scholar] [CrossRef]
- Corazza, M.V.; Di Mascio, P.; Moretti, L. Managing sidewalk pavement maintenance: A case study to increase pedestrian safety. J. Traffic Transp. Eng. English Ed. 2016, 3, 203–214. [Google Scholar] [CrossRef] [Green Version]
- ISTAT-Istituto Nazionale di Statistica. 15th Population and Housing Census 2011. Available online: www.istat.it (accessed on 11 March 2022).
- SP-Statistics Portugal. Census 2011 Data. Available online: www.ine.pt (accessed on 11 March 2022).
- Golan, Y.; Wilkinson, N.; Henderson, J.M.; Weverka, A. Gendered walkability: Building a daytime walkability index for women. J. Transp. Land Use 2019, 12. [Google Scholar] [CrossRef]
- Kweon, B.-S.; Rosenblatt-Naderi, J.; Ellis, C.; Shin, W.-H.; Danies, B. The Effects of Pedestrian Environments on Walking Behaviors and Perception of Pedestrian Safety. Sustainability 2021, 13, 8728. [Google Scholar] [CrossRef]
- Saloniki, E.-C.; Malley, J.; Burge, P.; Lu, H.; Batchelder, L.; Linnosmaa, I.; Trukeschitz, B.; Forder, J. Comparing internet and face-to-face surveys as methods for eliciting preferences for social care-related quality of life: Evidence from England using the ASCOT service user measure. Qual. Life Res. 2019, 28, 2207–2220. [Google Scholar] [CrossRef] [PubMed] [Green Version]
- Szczepańska, A.; Pietrzyk, K. Seasons of the Year and Perceptions of Public Spaces. Landsc. J. 2021, 40, 19–35. [Google Scholar] [CrossRef]
- Lindau, L.A.; Hidalgo, D.; de Almeida Lobo, A. Barriers to planning and implementing Bus Rapid Transit systems. Res. Transp. Econ. 2014, 48, 9–15. [Google Scholar] [CrossRef]
- McClintock, H. Practitioners’ Take-up of Professional Guidance and Research Findings: Planning for Cycling and Walking in the UK. Plan. Pr. Res. 2001, 16, 193–203. [Google Scholar] [CrossRef]
- Sauter, D.; Pharoah, T.; Tight, M.; Martinson, R.; Wedderburn, M. International walking data standard, treatment of walking in travel surveys internationally standardized monitoring methods of walking and public space. Walk 21. Available online: http://www.measuring-walking.org/ (accessed on 3 May 2022).
- Mateo-Babiano, I. Pedestrian’s needs matters: Examining Manila’s walking environment. Transp. Policy 2016, 45, 107–115. [Google Scholar] [CrossRef]


| Type of Attribute | Description |
|---|---|
| Built environment | 1. Walk in areas in close proximity to public transport stops |
| Built environment | 2. Walk in areas in close proximity to car parking |
| Built environment | 3. Walk in areas with high street connectivity |
| Built environment | 4. Walk in areas in close proximity to community facilities |
| Streetscape | 5. Walk in streets with low traffic speed |
| Streetscape | 6. Walk in streets with ≤2 traffic lanes |
| Streetscape | 7. Walk in streets with wide sidewalks |
| Streetscape | 8. Walk on sidewalks in good condition |
| Streetscape | 9. Walk on unobstructed sidewalks |
| Streetscape | 10. Walk on sidewalks with street furniture |
| Streetscape | 11. Walk on sidewalks with low slopes |
| Streetscape | 12. Walk on sidewalks with trees/greenery |
| Streetscape | 13. Walk in streets with many pedestrians |
| Built environment | 14. Walk in shopping streets/areas |
| Built environment | 15. Walk in areas with high residential density |
| Built environment | 16. Walk in areas with mixed land uses |
| Streetscape | 17. Walk in streets providing enclosure |
| Streetscape | 18. Walk in streets with architectural and landscape diversity |
| Streetscape | 19. Walk in streets providing transparency |
| Variable | Attributes | Questionnaire | Population 2019 | ||||||
|---|---|---|---|---|---|---|---|---|---|
| Bologna | Porto | Bologna | Porto | ||||||
| Total | % | Total | % | Total | % | Total | % | ||
| Gender | Female | 507 | 58.6 | 341 | 59.5 | 206,589 | 52.7 | 119,228 | 55.0 |
| Male | 358 | 41.4 | 232 | 40.5 | 185,395 | 47.3 | 97,378 | 45.0 | |
| Age | ≤24 years old | 84 | 9.7 | 110 | 19.2 | 78,410 | 20.0 | 47,846 | 22.1 |
| 25–44 years old | 266 | 30.8 | 236 | 41.2 | 103,973 | 26.5 | 46,821 | 21.6 | |
| 45–64 years old | 477 | 55.1 | 214 | 37.3 | 112,554 | 28.7 | 60,223 | 27.8 | |
| ≥65 years old | 38 | 4.4. | 13 | 2.3 | 97,047 | 24.8 | 61,716 | 28.5 | |
| Education | Undergraduates | 562 | 64.9 | 308 | 53.8 | 308,816 | 78.8 | 163,621 | 75.5 |
| Graduates | 303 | 35.1 | 265 | 46.2 | 83,168 | 21.2 | 52,985 | 24.5 | |
| Occupation | Student | 111 | 12.8 | 155 | 27.0 | 51,054 | 15.6 | 42,089 | 20.9 |
| Employed | 735 | 85.0 | 402 | 70.2 | 165,768 | 50.5 | 88,452 | 43.8 | |
| Unemployed/retired | 19 | 2.2 | 16 | 2.8 | 111,414 | 33.9 | 71,235 | 35.3 | |
| Type of pedestrian | Resident | 480 | 55.5 | 377 | 65.8 | 391,984 | 100.0 | 216,606 | 100.0 |
| Commuter | 362 | 41.8 | 164 | 28.6 | - | - | - | - | |
| Tourist/visitor | 23 | 2.7 | 32 | 5.6 | - | - | - | - | |
| Attributes | Mean | Median | SD |
|---|---|---|---|
| 8. Walk on sidewalks in good condition | 4.47 | 5.00 | 0.83 |
| 9. Walk on unobstructed sidewalks | 4.37 | 5.00 | 0.90 |
| 7. Walk in streets with wide sidewalks | 4.22 | 4.00 | 0.95 |
| 12. Walk on sidewalks with trees/greenery | 4.14 | 4.00 | 0.93 |
| 10. Walk on sidewalks with street furniture | 4.08 | 4.00 | 0.99 |
| 4. Walk in areas closer to community facilities | 4.01 | 4.00 | 1.06 |
| 3. Walk in areas with high street connectivity | 3.95 | 4.00 | 1.10 |
| 5. Walk in streets with low traffic speed | 3.78 | 4.00 | 1.20 |
| 18. Walk in streets with architectural and landscape diversity | 3.57 | 4.00 | 1.06 |
| 1. Walk in areas closer to public transport stops | 3.51 | 4.00 | 1.33 |
| 13. Walk in streets with many pedestrians | 3.39 | 3.00 | 1.10 |
| 16. Walk in areas with mixed land uses | 3.21 | 3.00 | 1.06 |
| 11. Walk on sidewalks with low slopes | 3.19 | 3.00 | 1.24 |
| 14. Walk in shopping streets/areas | 3.04 | 3.00 | 1.19 |
| 19. Walk in streets providing transparency | 2.94 | 3.00 | 1.09 |
| 6. Walk in streets with ≤2 traffic lanes | 2.93 | 3.00 | 1.23 |
| 2. Walk in areas closer to car parking | 2.88 | 3.00 | 1.44 |
| 15. Walk in areas with high residential density | 2.67 | 3.00 | 1.08 |
| 17. Walk in streets providing enclosure | 2.40 | 2.00 | 1.06 |
| Kaiser–Meyer–Olkin Measure of Sampling Adequacy | 0.902 | |
|---|---|---|
| Bartlett’s Test of Sphericity | Approx. Chi-Square | 10,462.1 |
| df | 171 | |
| Sig. | 0.000 | |
| Built Environment and Streetscape Attributes | Initial | Extraction |
|---|---|---|
| 15. Walk in areas with high residential density | 1.000 | 0.659 |
| 1. Walk in areas closer to public transport stops | 1.000 | 0.647 |
| 4. Walk in areas closer to public facilities | 1.000 | 0.643 |
| 3. Walk in areas with high street connectivity | 1.000 | 0.631 |
| 8. Walk on sidewalks in good condition | 1.000 | 0.623 |
| 14. Walk in shopping streets/areas | 1.000 | 0.616 |
| 16. Walk in areas with mixed land uses | 1.000 | 0.616 |
| 19. Walk in streets providing transparency | 1.000 | 0.577 |
| 2. Walk in areas closer to car parking | 1.000 | 0.575 |
| 9. Walk on unobstructed sidewalks | 1.000 | 0.574 |
| 7. Walk in streets with wide sidewalks | 1.000 | 0.570 |
| 17. Walk in streets providing enclosure | 1.000 | 0.569 |
| 18. Walk in streets with architectural and landscape diversity | 1.000 | 0.548 |
| 13. Walk in streets with many pedestrians | 1.000 | 0.493 |
| 5. Walk in streets with low traffic speed | 1.000 | 0.469 |
| 10. Walk on sidewalks with street furniture | 1.000 | 0.466 |
| 11. Walk on sidewalks with low slopes | 1.000 | 0.458 |
| 12. Walk on sidewalks with trees/greenery | 1.000 | 0.386 |
| 6. Walk in streets with ≤2 traffic lanes | 1.000 | 0.247 |
| Component | Total | Initial Eigenvalues | Extraction Sums of Squared Loadings | Rotation Sums of Squared Loadings | |||||
|---|---|---|---|---|---|---|---|---|---|
| Variance % | Cumulative % | Total | Variance % | Cumulative % | Total | Variance % | Cumulative % | ||
| C1 | 6.285 | 33.078 | 33.078 | 6.285 | 33.078 | 33.078 | 4.159 | 21.889 | 21.889 |
| C2 | 2.339 | 12.312 | 45.390 | 2.339 | 12.312 | 45.390 | 3.193 | 16.807 | 38.696 |
| C3 | 1.460 | 7.683 | 53.072 | 1.460 | 7.683 | 53.072 | 1.977 | 10.403 | 49.099 |
| C4 | 1.057 | 5.561 | 58.634 | 1.057 | 5.561 | 58.634 | 1.812 | 9.535 | 58.634 |
| C5 | 0.889 | 4.678 | 63.311 | ||||||
| C6 | 0.807 | 4.248 | 67.560 | ||||||
| C7 | 0.752 | 3.959 | 71.519 | ||||||
| C8 | 0.575 | 3.027 | 74.546 | ||||||
| C9 | 0.554 | 2.918 | 77.464 | ||||||
| C10 | 0.548 | 2.887 | 80.351 | ||||||
| C11 | 0.519 | 2.732 | 83.083 | ||||||
| C12 | 0.490 | 2.577 | 85.660 | ||||||
| C13 | 0.470 | 2.476 | 88.136 | ||||||
| C14 | 0.447 | 2.351 | 90.487 | ||||||
| C15 | 0.424 | 2.234 | 92.721 | ||||||
| C16 | 0.407 | 2.142 | 94.863 | ||||||
| C17 | 0.367 | 1.930 | 96.793 | ||||||
| C18 | 0.338 | 1.779 | 98.572 | ||||||
| C19 | 0.271 | 1.428 | 100.000 | ||||||
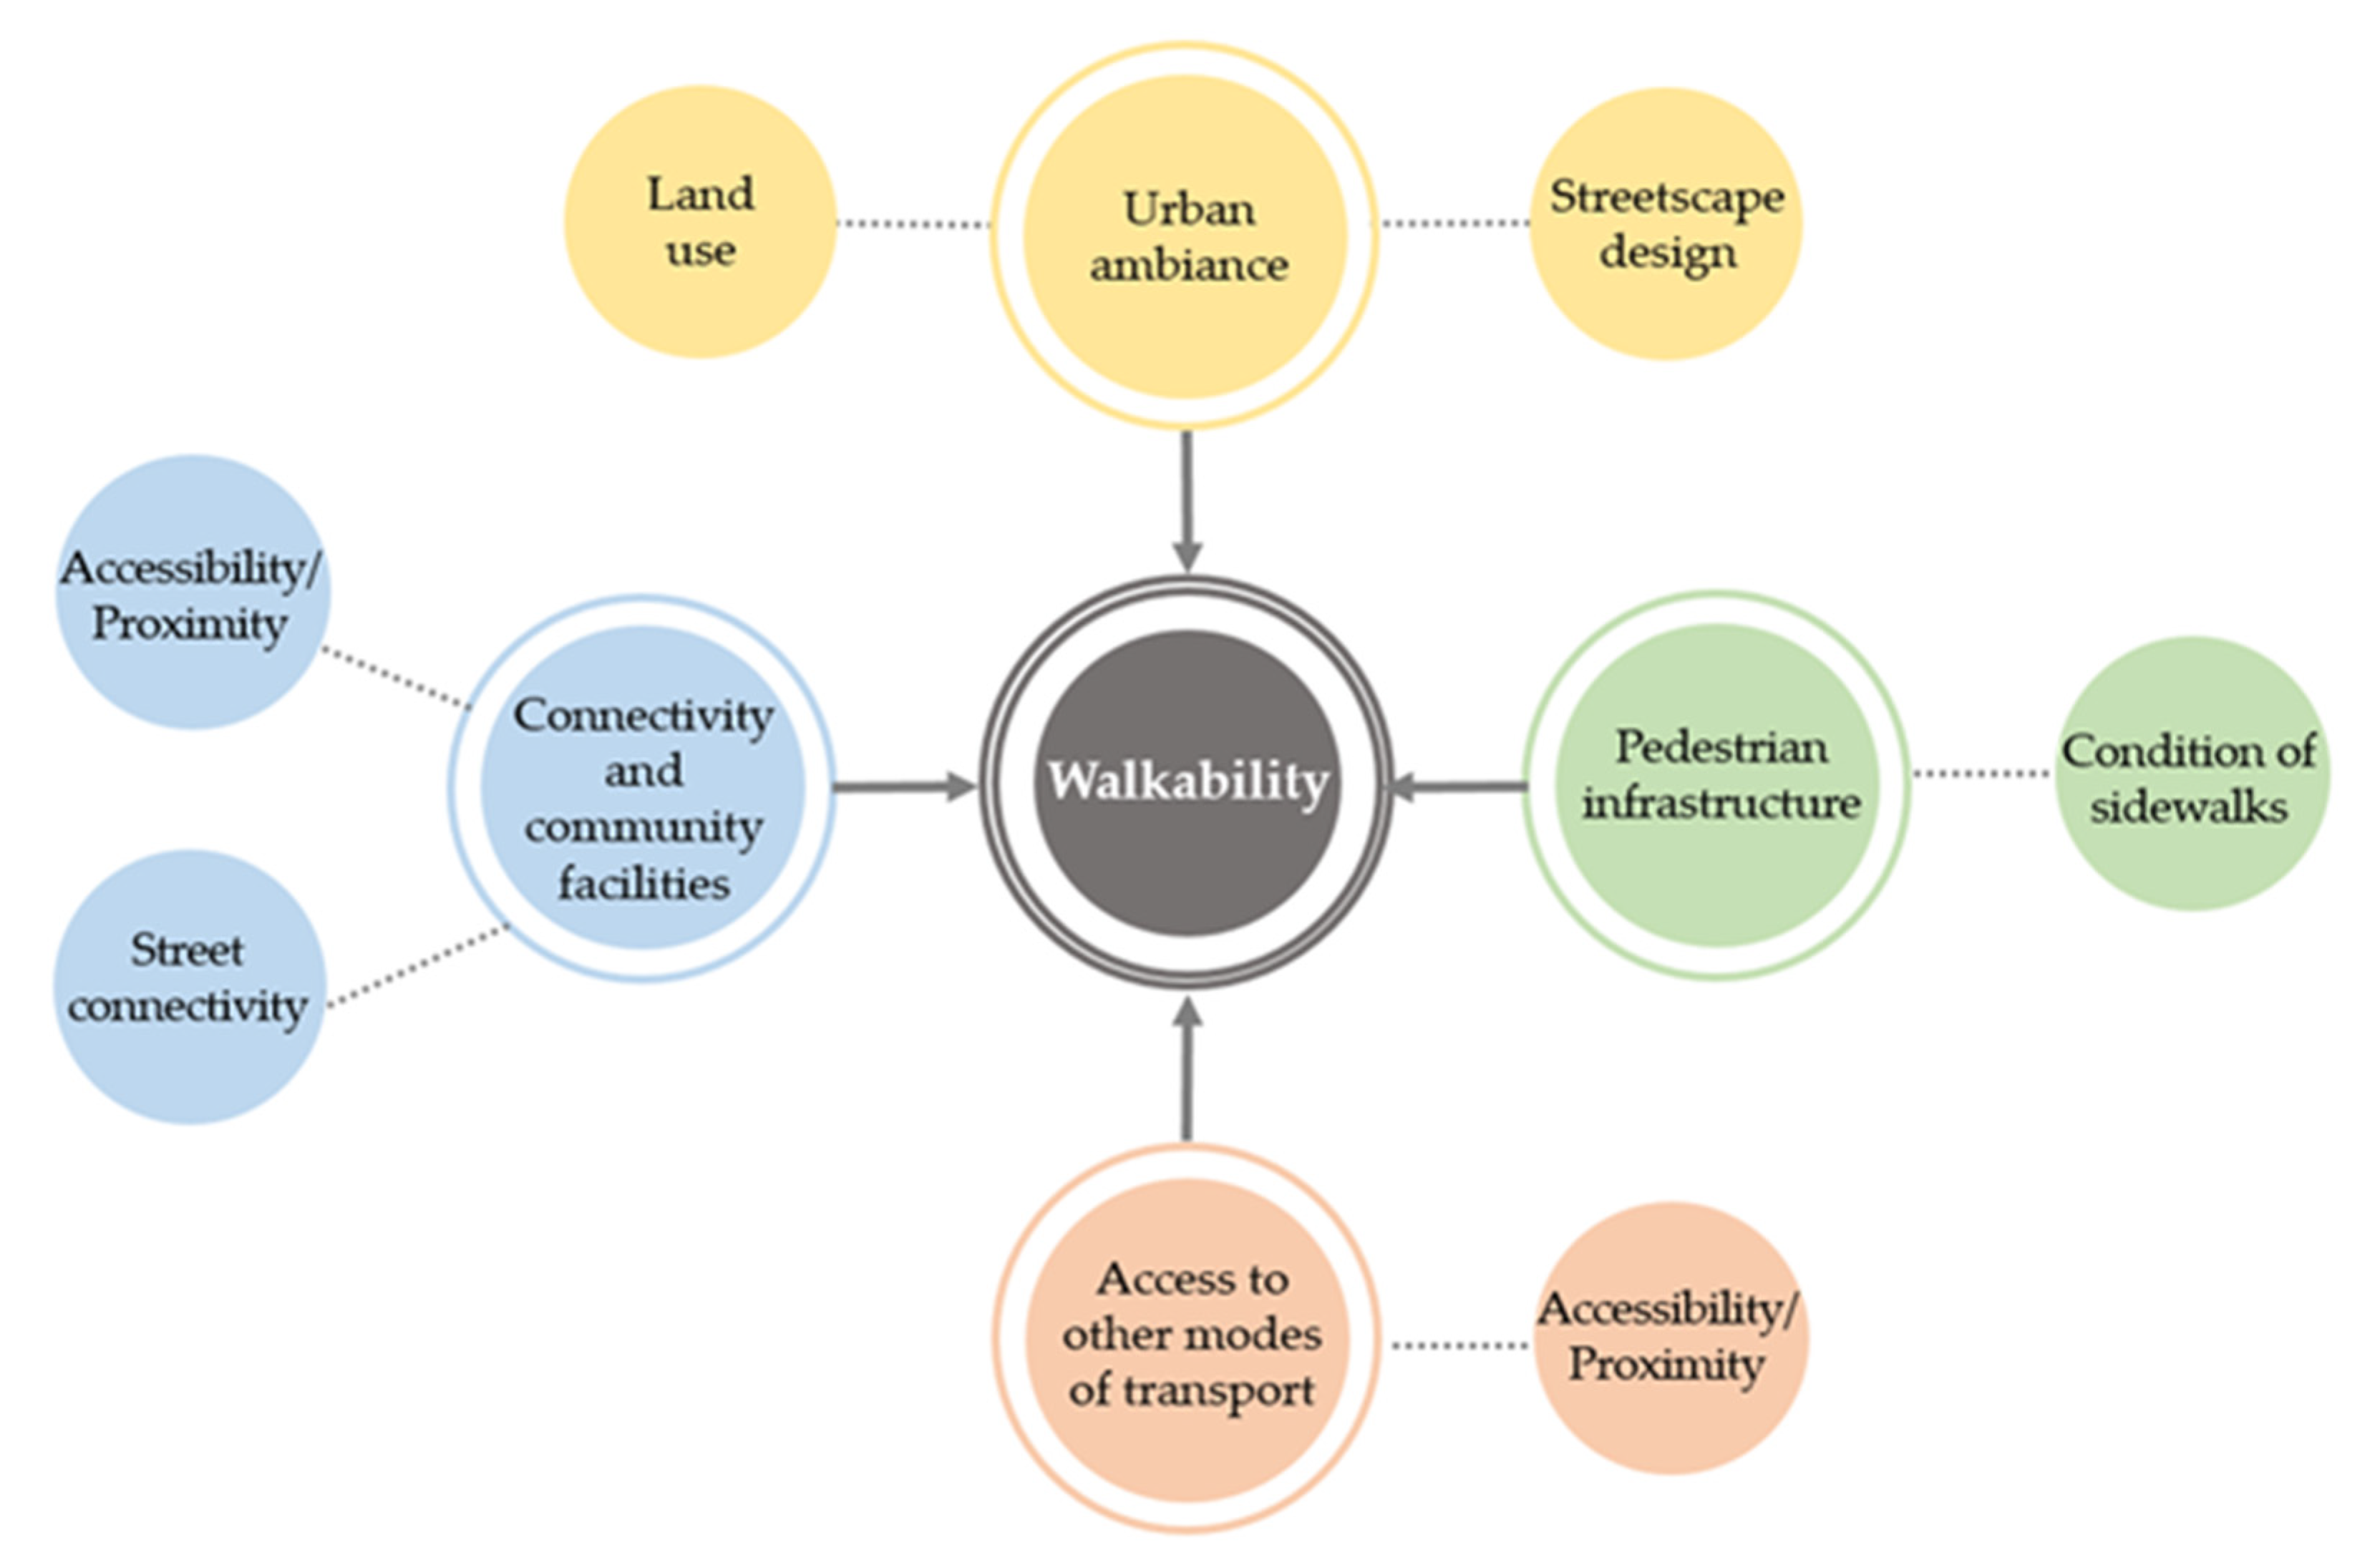
| Factors and Attributes | C1 | C2 | C3 | C4 |
|---|---|---|---|---|
| Urban Ambiance | ||||
| 15. Walk in areas with high residential density | 0.823 | |||
| 17. Walk in streets providing enclosure | 0.794 | |||
| 14. Walk in shopping streets/areas | 0.743 | |||
| 16. Walk in areas with mixed land uses | 0.729 | |||
| 19. Walk in streets providing transparency | 0.676 | |||
| 18. Walk in streets with architectural and landscape diversity | 0.557 | |||
| Pedestrian infrastructure | ||||
| 8. Walk on sidewalks in good condition | 0.795 | |||
| 9. Walk on unobstructed sidewalks | 0.770 | |||
| 7. Walk on streets with wide sidewalks | 0.730 | |||
| Connectivity and community facilities | ||||
| 4. Walk in areas closer to community facilities | 0.717 | |||
| 3. Walk in areas with high street connectivity | 0.705 | |||
| Access to other modes of transport | ||||
| 2. Walk in areas closer to car parking | 0.806 | |||
| 1. Walk in areas closer to public transport stops | 0.758 | |||
| Cronbach’s alpha (α) | 0.85 | 0.79 | 0.70 | 0.68 |
Publisher’s Note: MDPI stays neutral with regard to jurisdictional claims in published maps and institutional affiliations. |
© 2022 by the authors. Licensee MDPI, Basel, Switzerland. This article is an open access article distributed under the terms and conditions of the Creative Commons Attribution (CC BY) license (https://creativecommons.org/licenses/by/4.0/).
Share and Cite
Fonseca, F.; Papageorgiou, G.; Tondelli, S.; Ribeiro, P.; Conticelli, E.; Jabbari, M.; Ramos, R. Perceived Walkability and Respective Urban Determinants: Insights from Bologna and Porto. Sustainability 2022, 14, 9089. https://doi.org/10.3390/su14159089
Fonseca F, Papageorgiou G, Tondelli S, Ribeiro P, Conticelli E, Jabbari M, Ramos R. Perceived Walkability and Respective Urban Determinants: Insights from Bologna and Porto. Sustainability. 2022; 14(15):9089. https://doi.org/10.3390/su14159089
Chicago/Turabian StyleFonseca, Fernando, George Papageorgiou, Simona Tondelli, Paulo Ribeiro, Elisa Conticelli, Mona Jabbari, and Rui Ramos. 2022. "Perceived Walkability and Respective Urban Determinants: Insights from Bologna and Porto" Sustainability 14, no. 15: 9089. https://doi.org/10.3390/su14159089