Article

Towards a Sustainable Grain Production Network: An Empirical Study from Northeast China

School of Geographical Sciences, Northeast Normal University, Changchun 130000, China
*
Author to whom correspondence should be addressed.
Sustainability 2022, 14(14), 8849; https://doi.org/10.3390/su14148849
Submission received: 2 June 2022 / Revised: 17 July 2022 / Accepted: 18 July 2022 / Published: 19 July 2022

Abstract

:
As an important grain-producing area in China, research on the spatial correlation network of grain production in Northeast China is of great significance to ensure food security and realize the sustainable development of grain production. Based on the data of 40 cities in Northeast China from 1999 to 2019, we used the modified gravity model and social network analysis method to explore the structural characteristics of the spatial correlation network of grain production. Then, we divided the network into four blocks—net spillover block, main beneficial block, broker block, and bidirectional spillover block—and explored the interactive relationships and spillover effects between blocks. On this basis, corresponding policy recommendations were put forward. The results are as follows. (1) The spatial correlation network of grain production in Northeast China presents a complicated development trend, but the overall tightness of the network still needs to be improved. (2) The spatial correlation network of grain production is characterized by multi-center distribution, in which important nodes not only play the role of central actors but also act as intermediaries and bridges in the network. (3) There are obvious spatial correlations and spillover effects between blocks, and it is in the agglomeration stage of the agglomeration–diffusion effect.

1. Introduction

Food security is an important goal in achieving the United Nations 2030 Sustainable Development Goals. According to the latest issue of the State of Food Security and Nutrition in the World report, countries need to make great efforts and take immediate action to promote the transformation of the agricultural food system to realize the commitment to eradicate hunger by 2030. The safety and sustainable development of food supply all over the world has always been a concern. As early as the 1980s, some scholars pointed out that the reality of the basic distribution of the world’s population, wealth, and agricultural production is not conducive to the automatic stabilization process of the world’s hungry people, and it is more urgent to improve the grain production capacity and production conditions of developing countries [1,2,3]. At the same time, as a largely agricultural country, China has made positive contributions to safeguarding world food security in the past decades [4]. In fact, the pattern of grain production in China has changed significantly in space and time since 1980 [5,6]. The production center of gravity has shifted northward, crossing the Yellow River, and grain production has been transferred to the marginal areas with low land productivity and high natural risk—Northeast and Northwest China have become the main contributors to increase production [7]. Although China’s grain output continues to increase, the grain production system is more fragile and unstable than before, with uneven and low overall grain efficiency, facing the dual challenges of lack of motivation and limited room for growth [8,9,10,11].
Due to the importance of food security, the research on the overall and regional evolution characteristics of grain production space and its causes is constantly deepening. In terms of research methods, the early descriptive discussion and simple econometric analysis have gradually transitioned to spatial data analysis methods and spatial econometric methods. Meanwhile, research covers different scales of the whole country, river basins, provinces, and counties [12,13,14,15]. For example, some Chinese scholars conducted in-depth discussions on the Central Plains Economic Zone, the Huang-Huai-Hai Plain, and the Yangtze River Economic Belt, and found that most of the regional grain production spatial patterns tend to shift and change, with significant spatial correlation, agglomeration, and spillover effects, and the spatial agglomeration continues to increase [16,17,18]. These abundant studies are mostly based on “attribute characteristics”. However, with the reform of agricultural marketization in China, the urban–rural dual structure is constantly disintegrating. Then, the agricultural production factors and agricultural products can flow freely, interact, and trade between regions, so that grain production gradually forms networked “relation characteristics” in space [19,20,21]. With the existing traditional ESDA (Exploratory Spatial Data Analysis) method and spatial measurement technology, it is difficult to fully reveal the overall network structure and spatial clustering mode based on “relation data” in grain production. However, the social network research method can just meet this demand. Its core lies in exploring the social structure and social action from the perspective of “relation”, which has been widely used in natural and social sciences, especially in the research of geography and economics [22,23].
Scholars have introduced social network research methods into the study of the grain trade network, and they found that the global grain trade network becomes more complex [24]. The network density, trade scale, and agglomeration degree increased, showing an increasingly “small-world” characteristic [25]. The network pattern evolved from the unbalanced pattern of United States dominance and few discrete cores to the balanced pattern of multi-core agglomeration with Russia, the United States, Thailand, and other important grain-exporting countries [26,27]. In addition, Ying et al. [28] previously presented a useful demonstration. Based on the revised gravity model, authors used the social network analysis method to explore the correlation characteristics and causes of China’s grain production spatial correlation network and found that the main grain-producing areas are at the core of the network, while the main grain-marketing areas and balance areas are at the periphery. The network structure presents suitable stability and accessibility in China, and the joint action of natural conditions and socio-economic factors has promoted the formation of the spatial correlation network of grain production. On the other hand, Brazilian scholars used social network analysis to measure the relation between participant regions and grain types. They found that the mid-west and south of Brazil were the regions with the highest yields and developed technology and also had the greatest genetic potential for new planting forms. The results also suggested that a new form of agricultural planning could be executed based on the centrality of the social network analysis method, and the application of resources and enhanced technology could be adopted in the region with the highest centrality to help producers plan agricultural production and increase the effectiveness of grain output [29].
Generally speaking, with the development of Chinese society and economy, the spatial connection of grain production has gradually formed a “relational data” network between regions, and the networked grain production structure has higher security and economy, which can better deal with crises and uncertain factors, improve the diversity of grain products, and reduce the adverse impact on the environment. However, there is still a lack of regional empirical research in this regard. At the same time, Northeast China is known as the “grain market stabilizer of China” and plays an important role in maintaining national food stability [30]. It is of great real-world significance to explore the grain correlation characteristics in Northeast China from the perspective of the network. Therefore, taking 40 cities as research units, the main work of this paper is to explore the temporal and spatial evolution law of grain production structure in Northeast China from 1999 to 2019, to provide a scientific basis for the optimization of grain production network. Furthermore, this paper attempts to explore the following questions: What are the differences between network and traditional research methods of grain production pattern? What advantages does the spatial correlation network of food production have and is it more sustainable? How should Northeast China implement countermeasures in the future? Answering the above questions will help to better allocate agricultural production resources, optimize the pattern of grain production, and ensure China’s food security.

2. Study Area and Methods
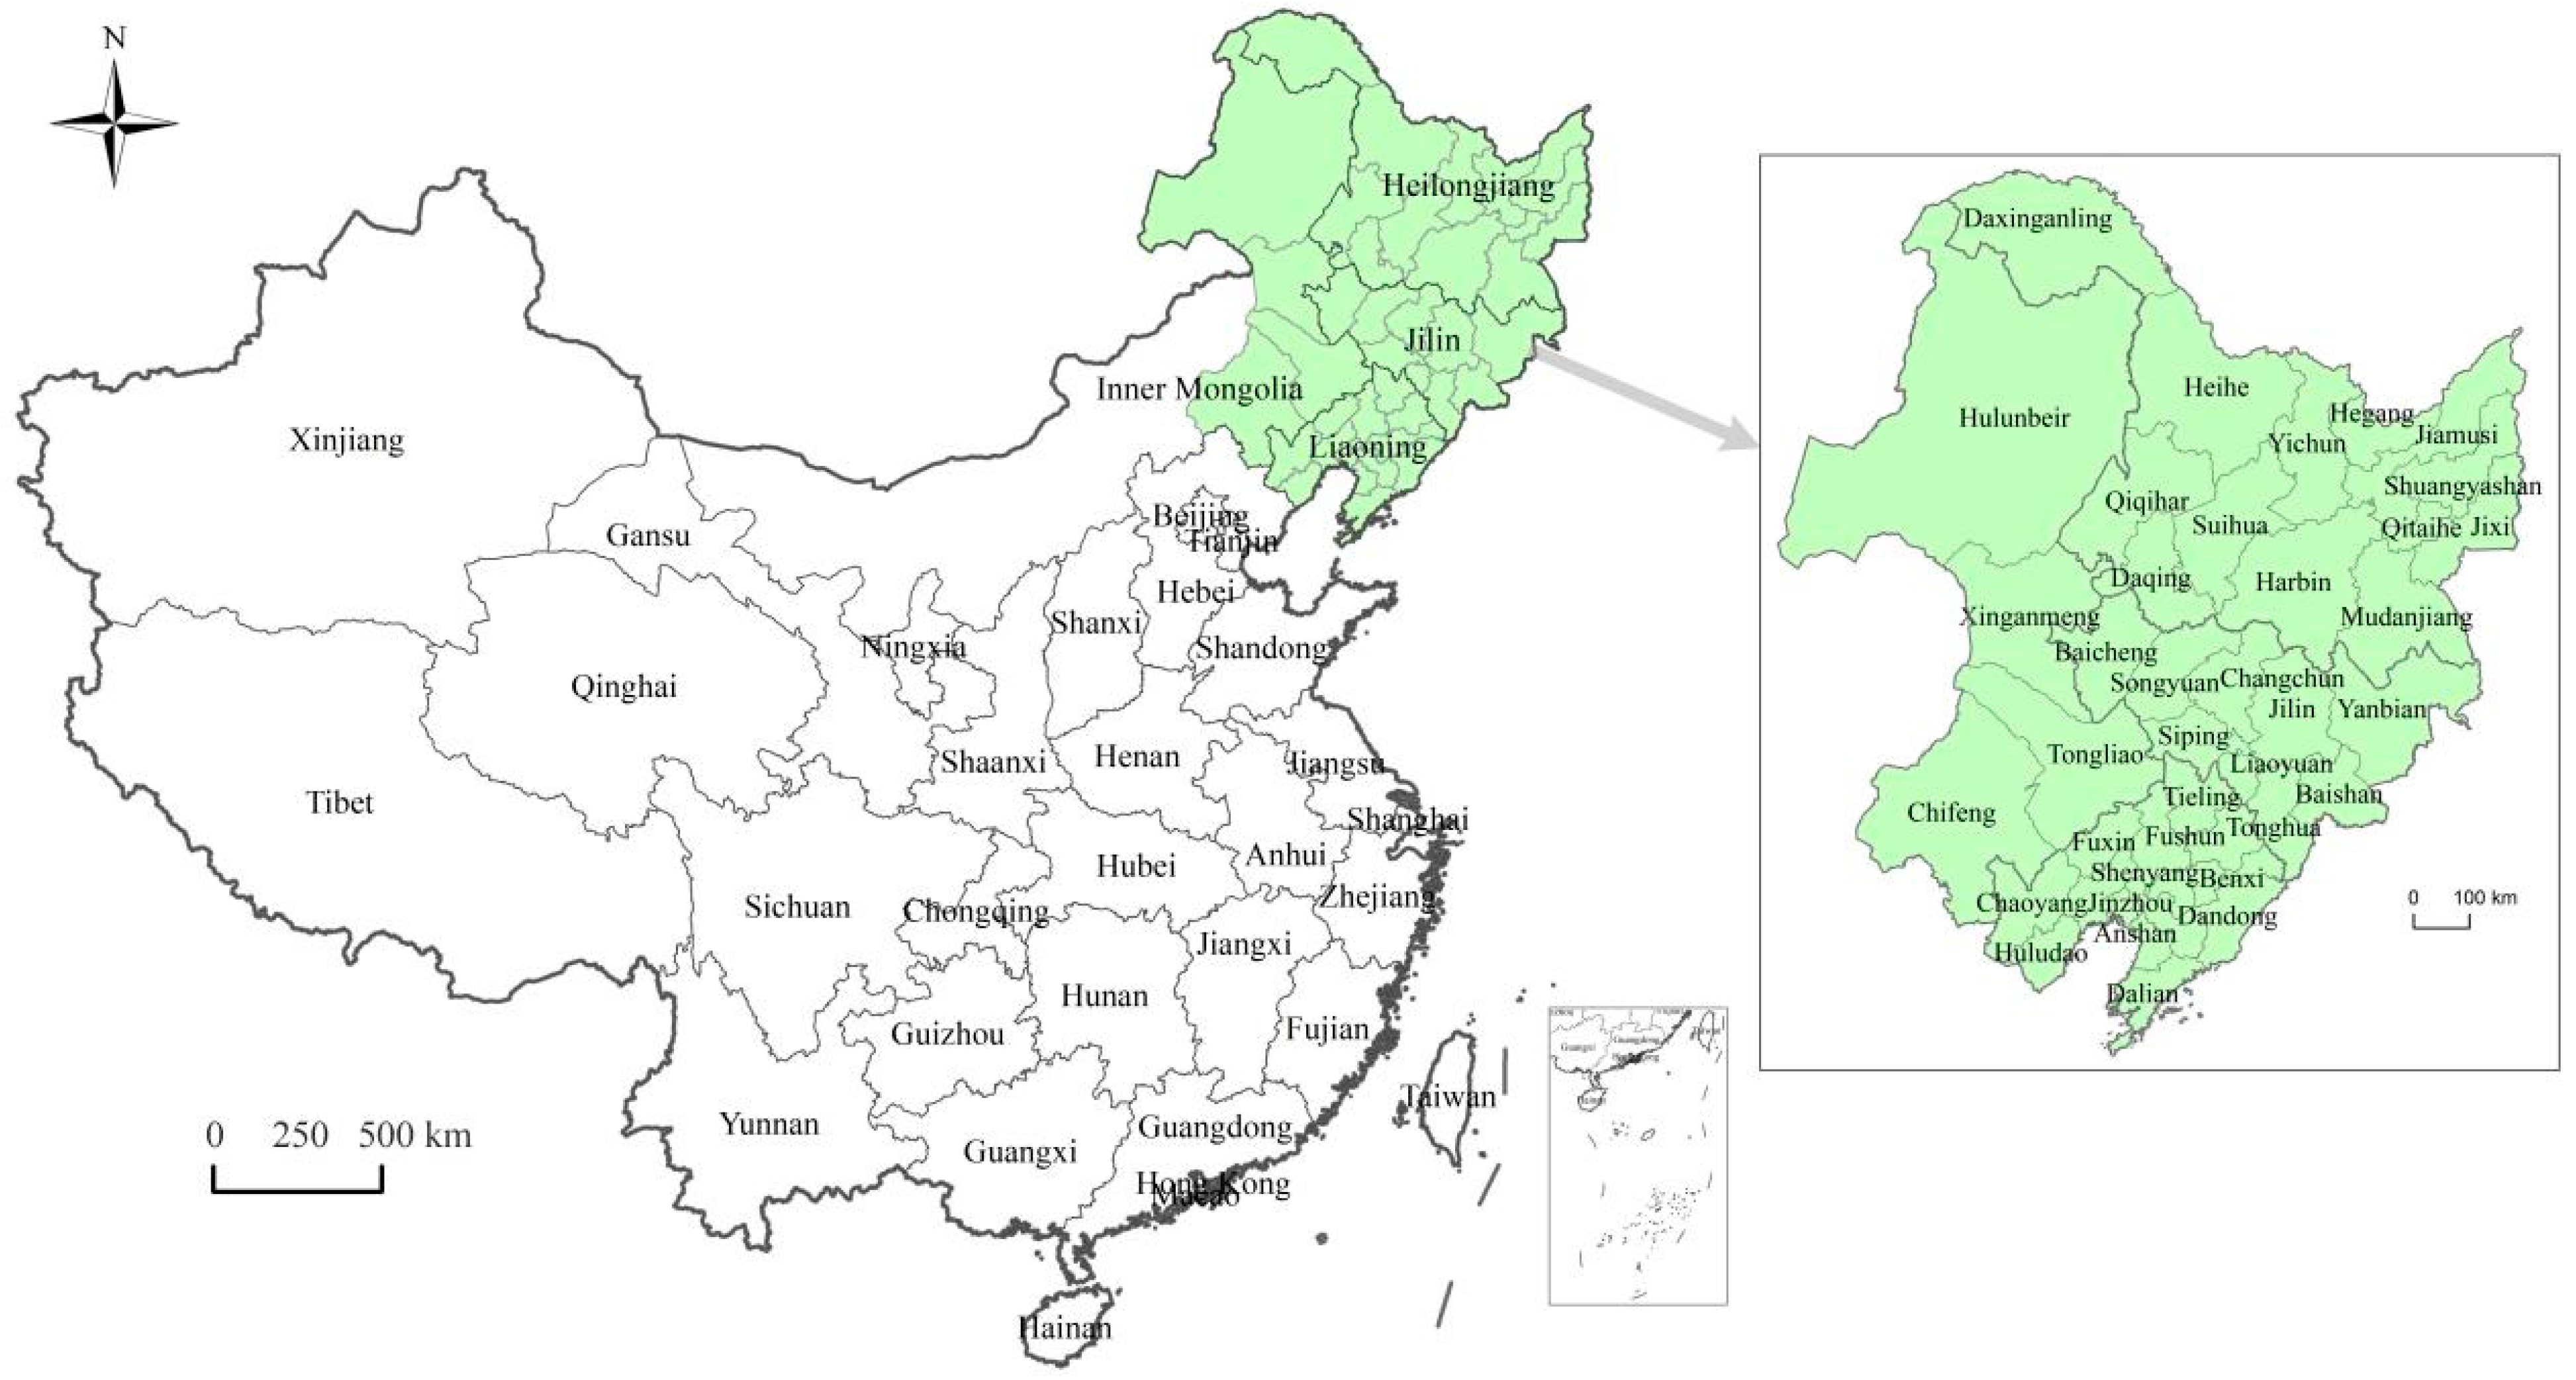
2.1. Study Area

As can be seen from Figure 1, Northeast China includes three northeastern provinces and four cities in eastern Inner Mongolia, including 40 prefecture-level cities: 14 in Liaoning Province, 9 in Jilin Province, 13 in Heilongjiang Province, and 4 in Inner Mongolia. It has long been an important base for commodity grain production, grain transportation, and commodity grain reserve in China.
Northeast China is one of the three black soil distribution areas in the world, with the largest area of black soil in Asia, and has 16.8% of China’s cultivated land. Its Songnen Plain and Sanjiang Plain provide basic conditions for grain production, and the per capita arable land is twice that of China. From 1999 to 2019, the total grain output in Northeast China had increased from 8500 tons to 16,574 tons, accounting for 25.0% of China from 16.7%. Moreover, its per capita grain output is relatively high, and the export of commercial grain is obvious. The commodity rate is as high as 50–60%, accounting for more than one-third of the total amount of commercial grain in China [31].
Following, we asked the questions: As the main grain-producing area in China, what are the characteristics and evolution of the spatial correlation network structure of grain production at the overall and individual levels? Are there spillover effects? Answering the above questions is of great theoretical significance and reference value for comprehensively understanding the changing law of the current grain production network pattern in Northeast China, understanding the spatial transmission mechanism of grain production between regions, grasping the coordinated development direction across regions, and formulating differentiated grain policies.
Considering the quantitative changes in grain yield and grain acreage (Figure 2), the change process of grain production in Northeast China from 1999 to 2019 can be divided into three stages (Table 1). Therefore, based on the time nodes of 1999, 2003, 2012, and 2019, the evolution characteristics of the grain production network were analyzed.

2.2. Methods

2.2.1. Revised Gravity Model

Referring to the previous research [28], the correlation between regional grain production is measured by the revised gravity model, which shows that if the gravity value is large, the correlation between regional grain production is close, and the calculation formula is:
F i j = k Q i Q j / d i j 2 d i j = K ij T ij
where Fij is the gravitational value of grain production between regions i and j. Qi and Qj are the scales of grain production in regions i and j, respectively, and k is the gravitational coefficient, usually taken as 1. dij is the distance between the centers of region i and j. Equation (1) shows that the spatial correlation of grain production between regions is proportional to its scale and inversely proportional to its distance. Considering the scientific of distance, geographic distance (Kij) and time–cost distance (Tij) are introduced. To overcome the non-directional problem of the traditional gravity model, the gravity coefficient (kij) is corrected by the proportion of grain production in a certain region to the sum of grain production in two related regions, and the scale of grain production is reflected in the two dimensions of grain yield and sown area. The calculation formula of the revised model is:
F i j = k i j G i A i G j A j D i j 2 k i j = G i G i + G j
where Gi and Gj are the grain output in regions i and j, respectively (104 tons). Ai and Aj are the grain acreage in regions i and j, respectively (103 hectares).

2.2.2. Social Network Analysis

The gravity matrix between regions can be obtained through the revised gravity model, which needs to be transformed into a relationship matrix for social network analysis. The method is as follows: take the average value of each row of the matrix after removing the extreme value as the critical value. If the gravity value is higher than the critical value for the row, it is recorded as 1, showing that that there is a correlation of grain production between the row city and column city. Otherwise, it will be recorded as 0, indicating that there is no association. Using the social network analysis method, we analyzed the structural characteristics of the grain production correlation network in Northeast China, including the overall network characteristics, individual network characteristics, and block model analysis [32].
The overall network characteristics study the relation and structure between all members of the network, including density, connectedness, hierarchy, and efficiency.
Density is defined as the ratio of the actual number of connections between nodes in the network to the maximum number of possible connections, reflecting the closeness of the relationship. The formula is:
D = L / n ( n 1 )
where D represents the density, n represents the number of nodes in the network, and L represents the actual number of connections that exist between nodes. The higher the density, the closer the connection between nodes.
Connectedness is used to measure the degree of direct or indirect accessibility between two nodes in the network.
C = 1 V / ( n × ( n 1 ) / 2 )
Here, C represents the connectedness and V is the number of unreachable node pairs in the network. The higher the connectedness, the stronger the robustness of the network structure.
Hierarchy is used to measure the degree to which network members are asymmetrically reachable.
H = 1 K / max ( K )
Here, H represents the hierarchy and K is the symmetrically reachable nodes in the network. The higher the hierarchy, the stricter the hierarchical structure, and a few members have leading roles in the network.
Efficiency indicates how many additional connections exist in the network when determining the number of connections between nodes.
E = 1 M / max ( M )
Here, E represents the efficiency and M is the number of redundant lines in the network. The lower the efficiency, the more spillover paths between nodes, and the more stable the spatial network will be.
The characteristics of the individual network study the position and role of node in the network through centrality, including degree centrality and betweenness centrality.
Degree centrality measures the status of nodes in the network according to the number of relations. The higher the degree centrality, the more prominent the central position in the network. It can be divided into out-degree centrality and in-degree centrality. The formulas are:
D C i = O C i + I C i
O C i = j = 1 n l i j / ( n 1 )
I C i = j = 1 n l j i / ( n 1 )
In Equations (7)–(9), DCi, OCi, and ICi represent the degree centrality, out-degree centrality, and in-degree centrality of node i, respectively. lij is the relation sent by node i to j, and lji is the relation that node i receives directly from j. A high out-degree centrality indicates large spillover ability, while a high in-degree centrality indicates strong cohesion and attractiveness.
Betweenness centrality reflects the extent to which a node controls the relation between other nodes. The higher the value, the stronger the node’s ability to control and influence other nodes. The formula is:
B C i = j n k n g j k ( i ) / g j k , j k i , j < k
In Equation (10), BCi represents the betweenness centrality of node i, gjk is the number of shortcuts between node j and k, and gjk(i) is the number of shortcuts that must pass through city i between node j and k.
The block model is a method to study the location of network members, which form a block by clustering with high correlation in the network. It breaks through the limitations of traditional spatial measurement methods, so that the occurrence of spillover effect is not limited to geographically adjacent areas [33]. The method of the block model assumes that there are n members in the network, and there are nk members in block Bk; then, the maximum number of relations that block Bk may have is nk(nk − 1), and the number of all possible relations of block Bk in the entire network is nk(n − 1). Then, the expected internal relation ratio of the block is nk − 1/n − 1, which can be used to divide the block into four types. The first is net spillover block, in which there are more spillover relations from members inside the block to members outside the block, while relatively few relations within the block. The second is main beneficial block, which is characterized by a large proportion of block members in the relations within the block, and a relatively small proportion of relations that spill over to the outside. The third is broker block, which is characterized by members in the block not only sending relations to the outside but also accepting spillover relations from other blocks, and there are few internal relations in the block, which mainly act as an intermediary and bridge. The fourth is bidirectional spillover block, which is characterized by the members in the block having both the spillover relation inside and outside of the block, but seldom receiving the overflow relation of other blocks.

2.3. Data Sources

The data involved in this paper are used to calculate the revised gravity model, including the grain output, grain acreage, geographical and time–cost distance between cities. Among them, the data of grain output and grain acreage of 40 cities are obtained from Liaoning Statistical Yearbook, Jilin Statistical Yearbook, Heilongjiang Statistical Yearbook, China Regional Economic and Social Statistical Yearbook, China Agricultural Statistical Yearbook, municipal statistical bulletins, and government websites from 2000 to 2019. The grain crops counted by them mainly include wheat, corn and rice. The geographical distance is represented by the longitude and latitude distance of the geometric center of gravity between cities, which is calculated with the help of ArcGIS tools. The time–cost distance is calculated by dividing the shortest road mileage between cities by the average speed, which is obtained from Baidu map.

3. Results

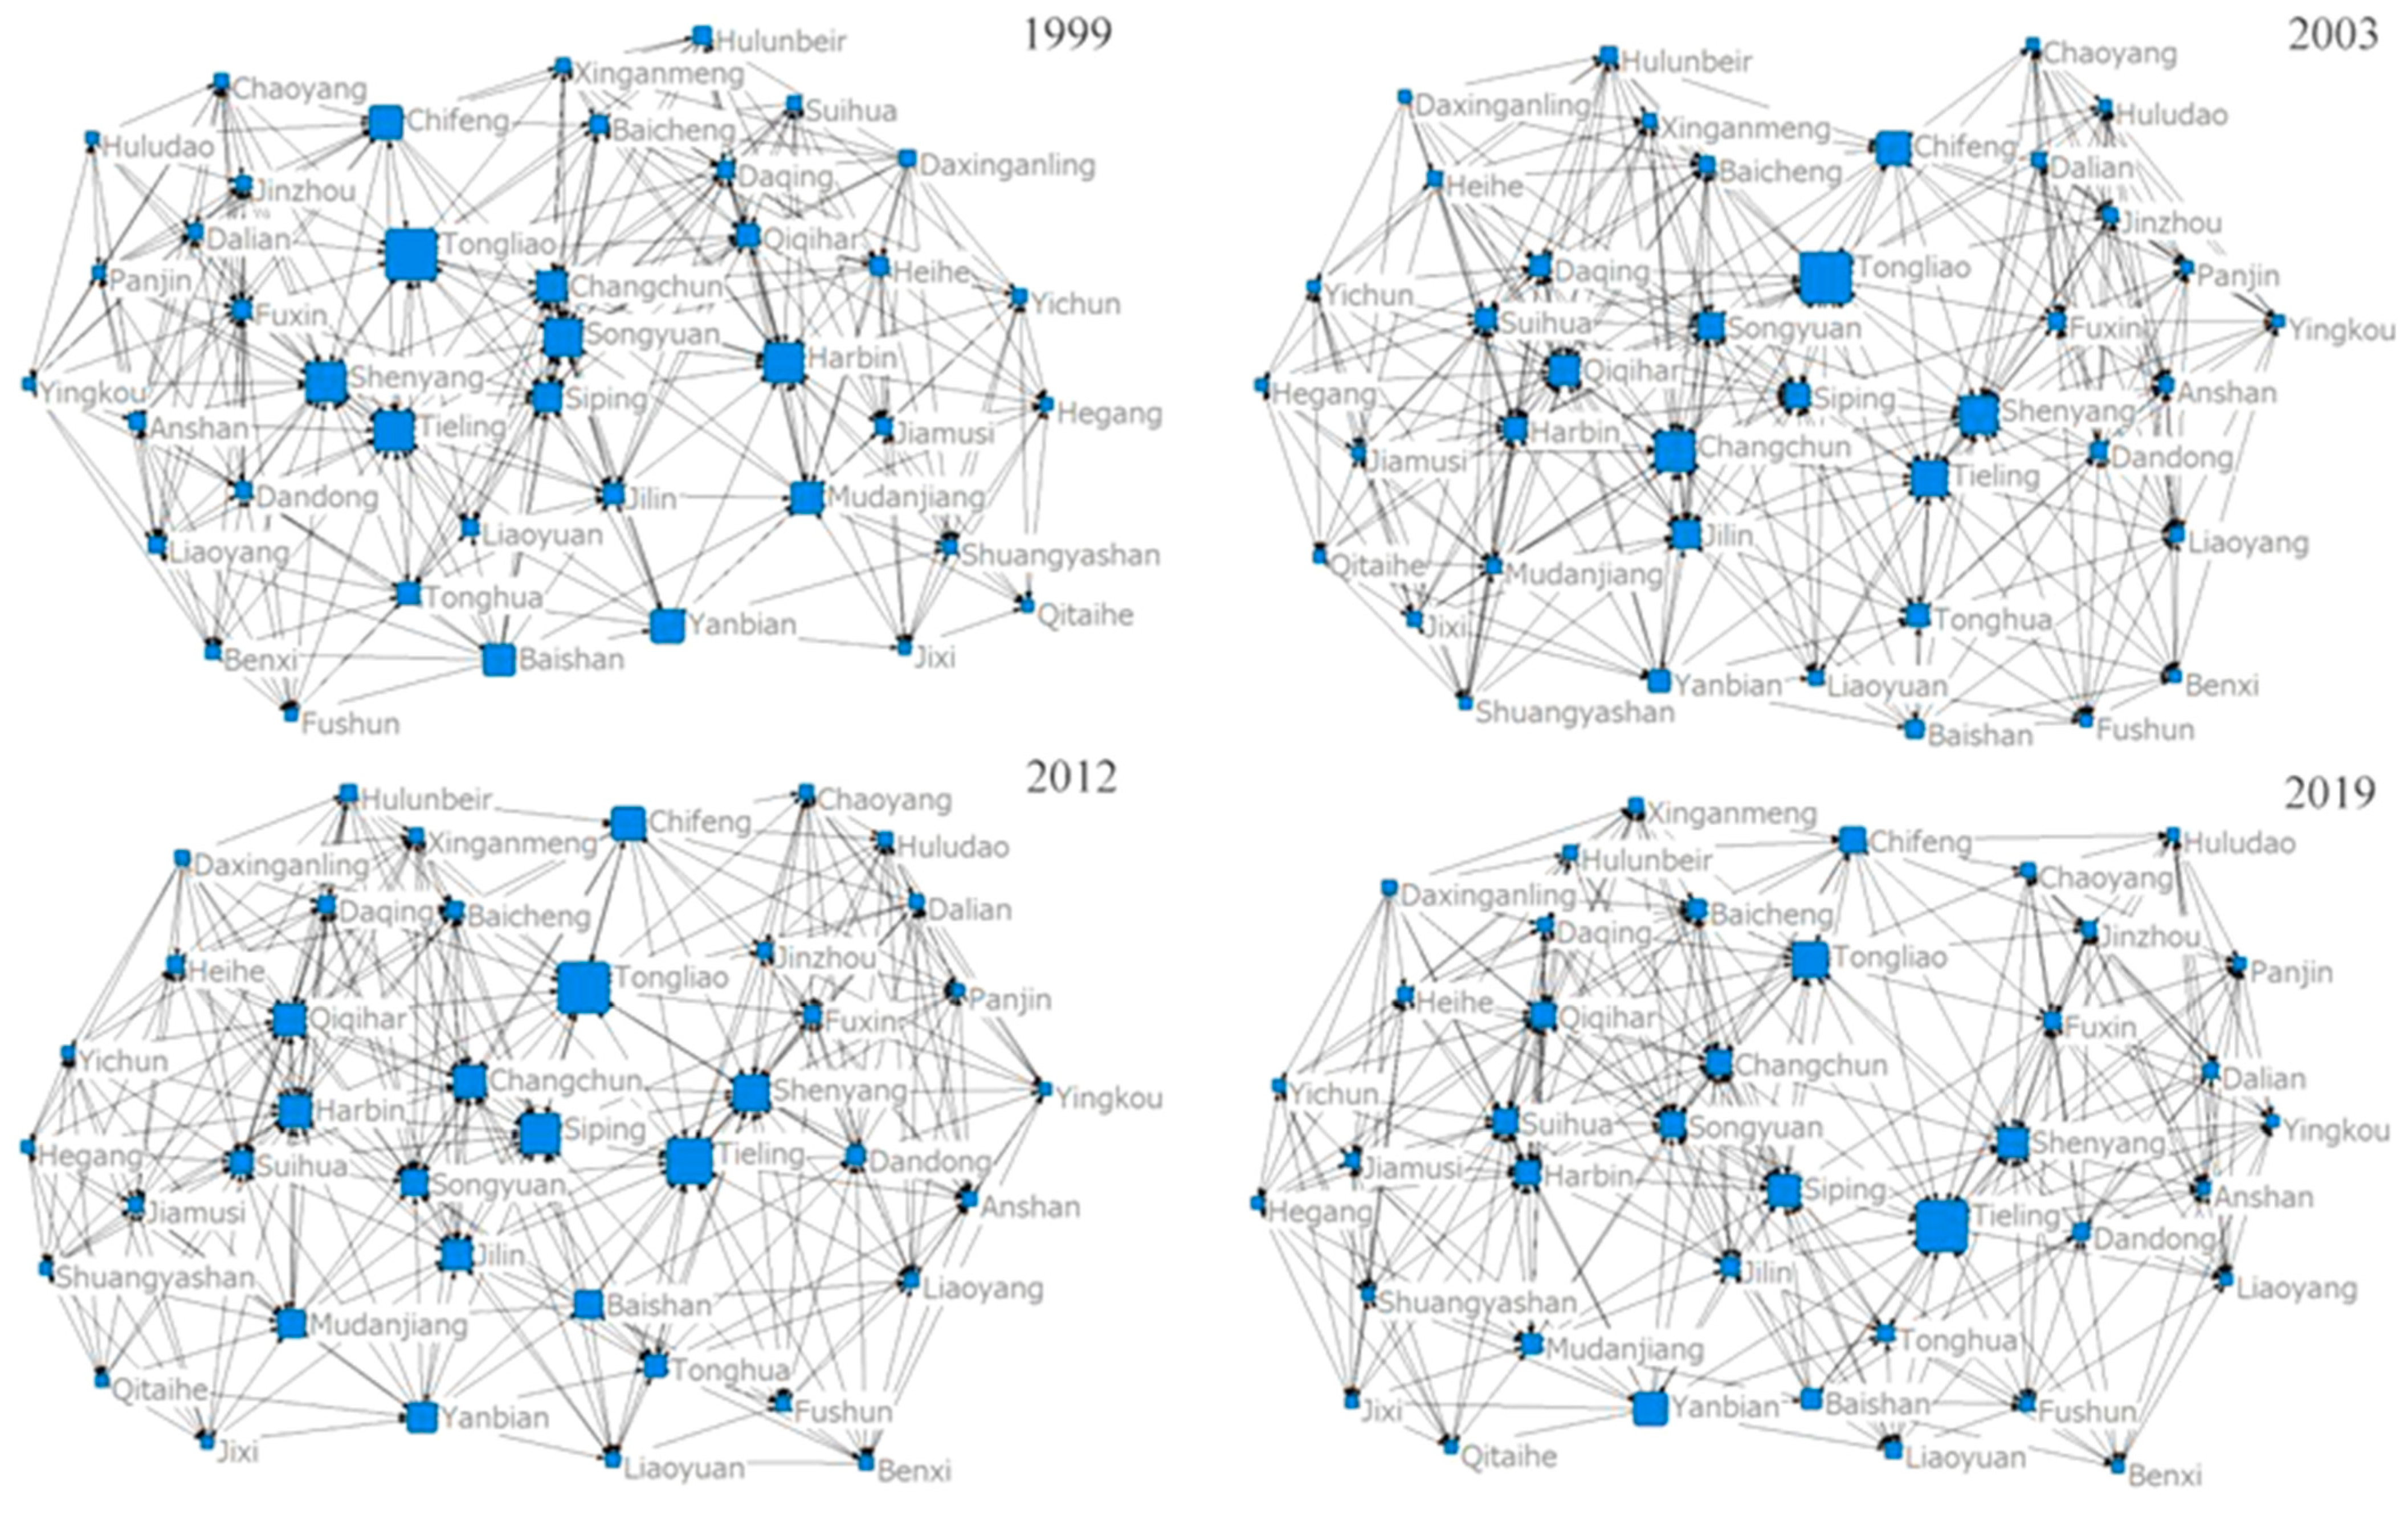
3.1. Characteristics and Evolution of Spatial Correlation Network

The spatial correlation network characteristics of grain production in Northeast China were measured and analyzed in terms of four aspects: density, connectivity, hierarchy, and efficiency.

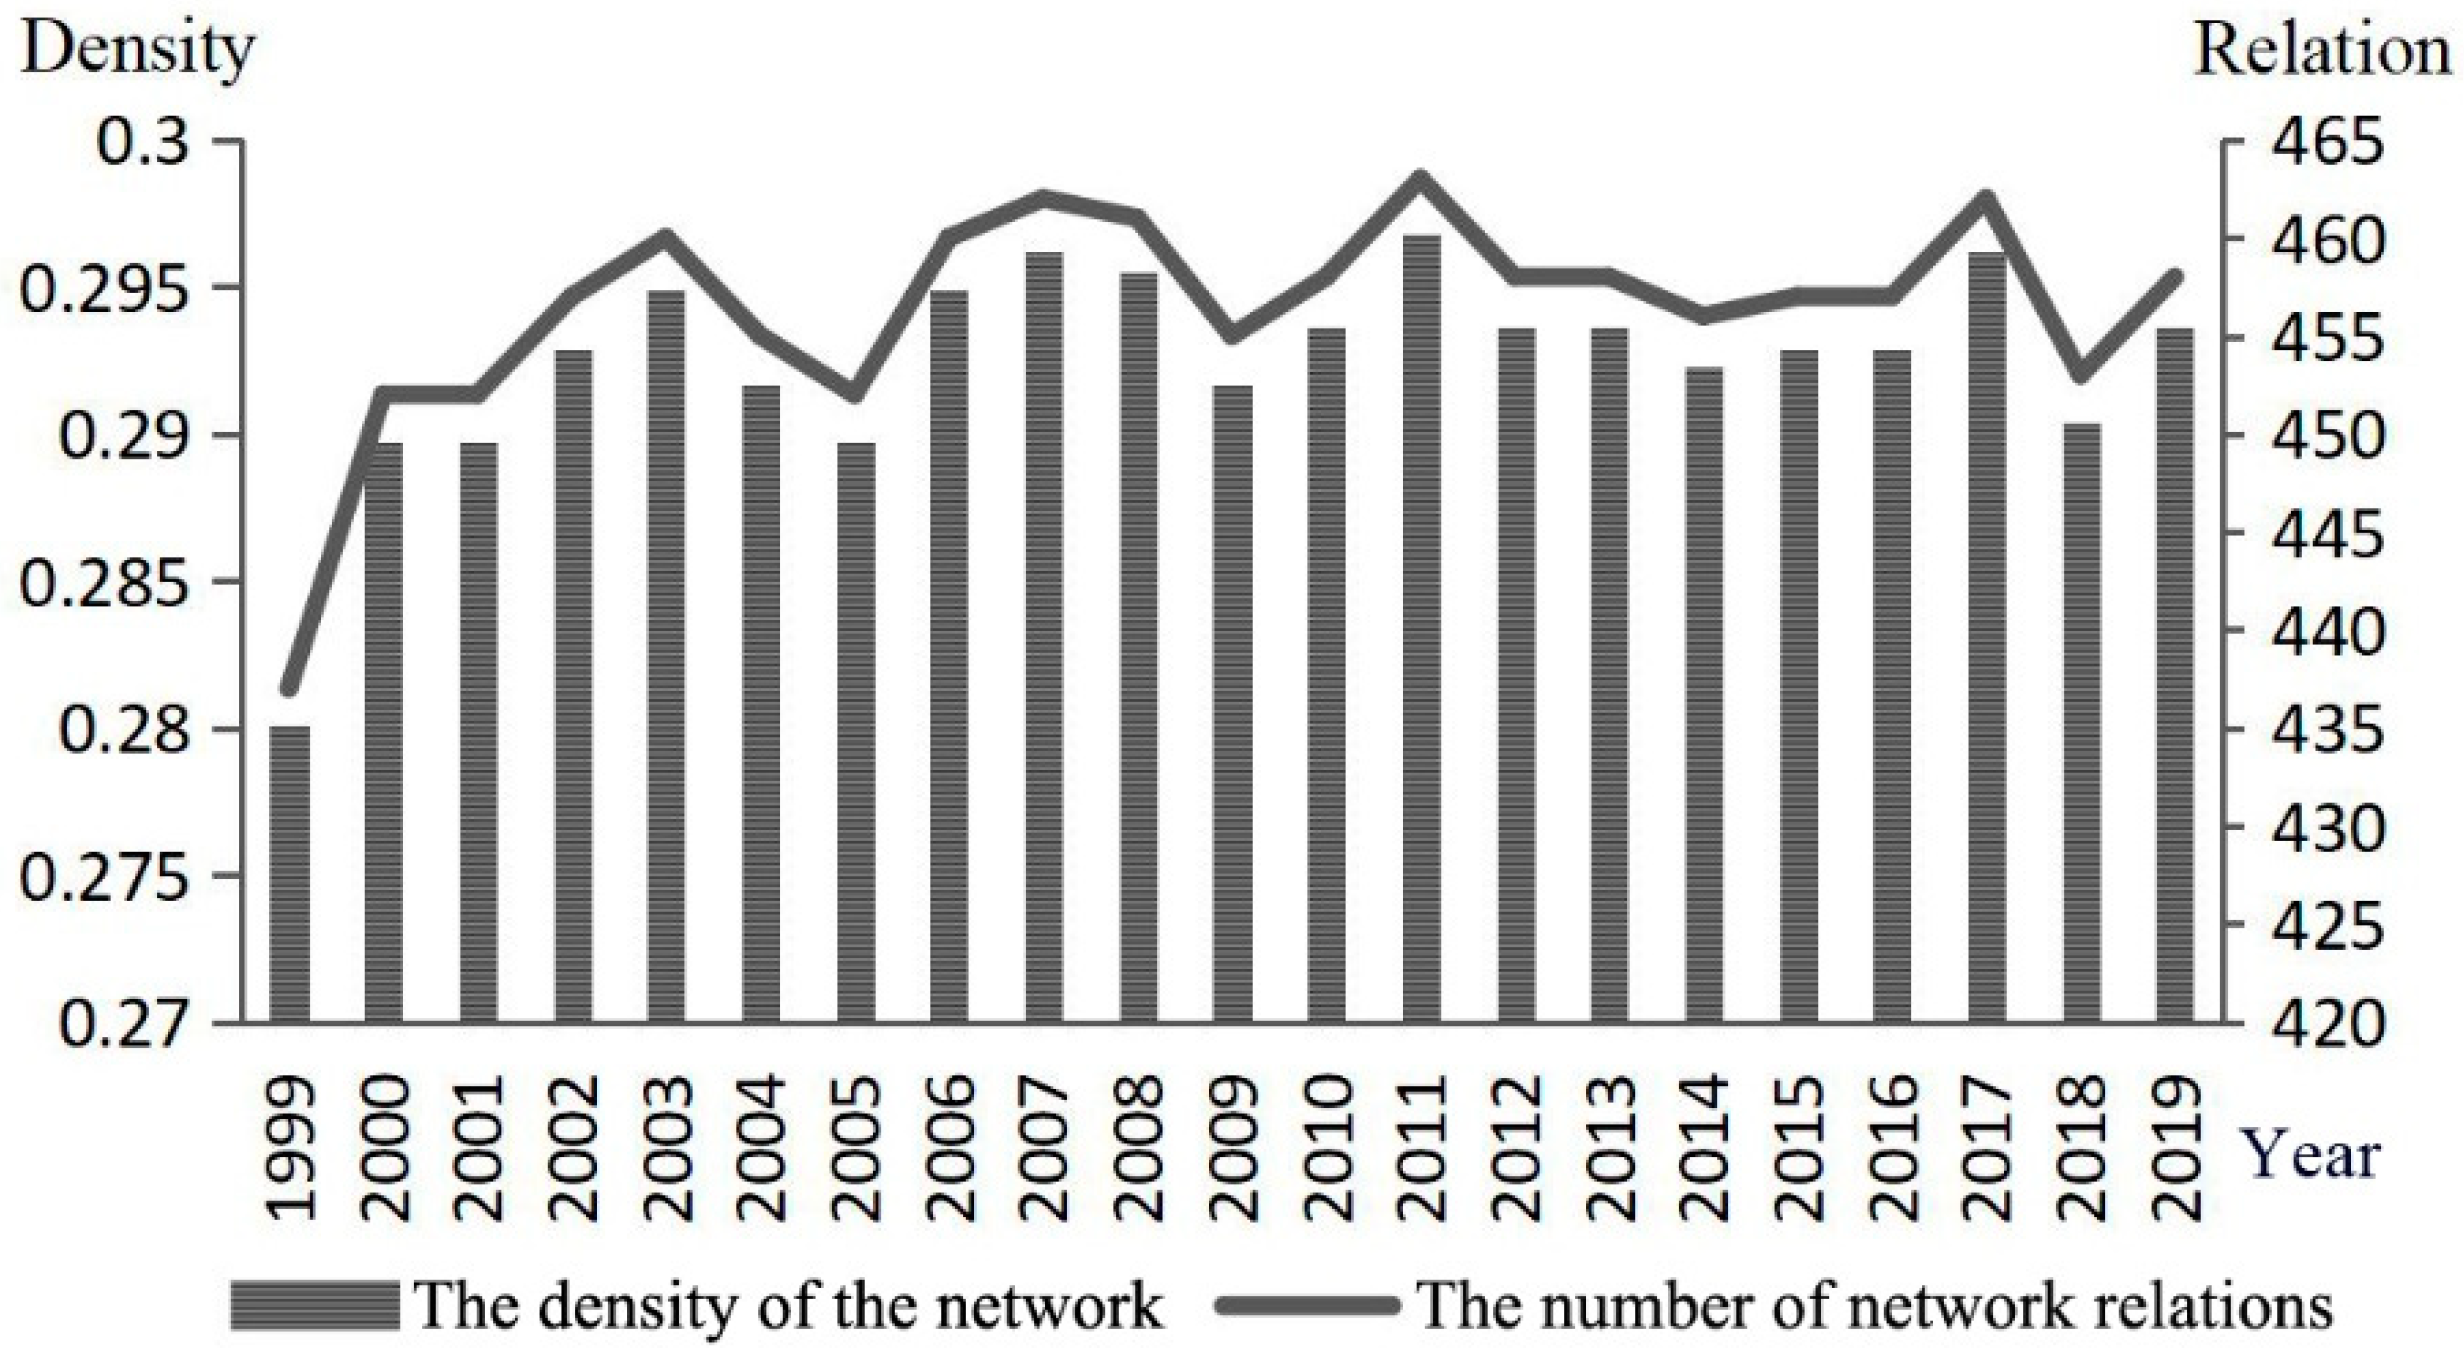
3.1.1. The Density of the Network

Firstly, the density value and the relation number of spatial correlation network of grain production in Northeast China were calculated (Figure 3). Their changes remained consistent as a whole, showing an upward trend of fluctuation. The density of the network increased from 0.280 in 1999 to 0.293 in 2019, and the number of network relations increased from 437 in 1999 to 458 in 2019, indicating that the overall spatial correlation of grain production was strengthened. The grain production in Northeast China declined due to the adjustment of grain acreage from 1999 to 2003, but this did not hinder the flow of agricultural production factors between regions. This time was a period of rapid growth in the density of the grain production network; the network had not yet developed until it reached its peak of density in 2011, and has tended to stabilize gradually since 2012. In addition, although the density of the network has increased, on the whole, the maximum value is only 0.293, indicating that the spatial correlation of grain production in Northeast China is still low, and closer exchanges and cooperation are needed in the future.

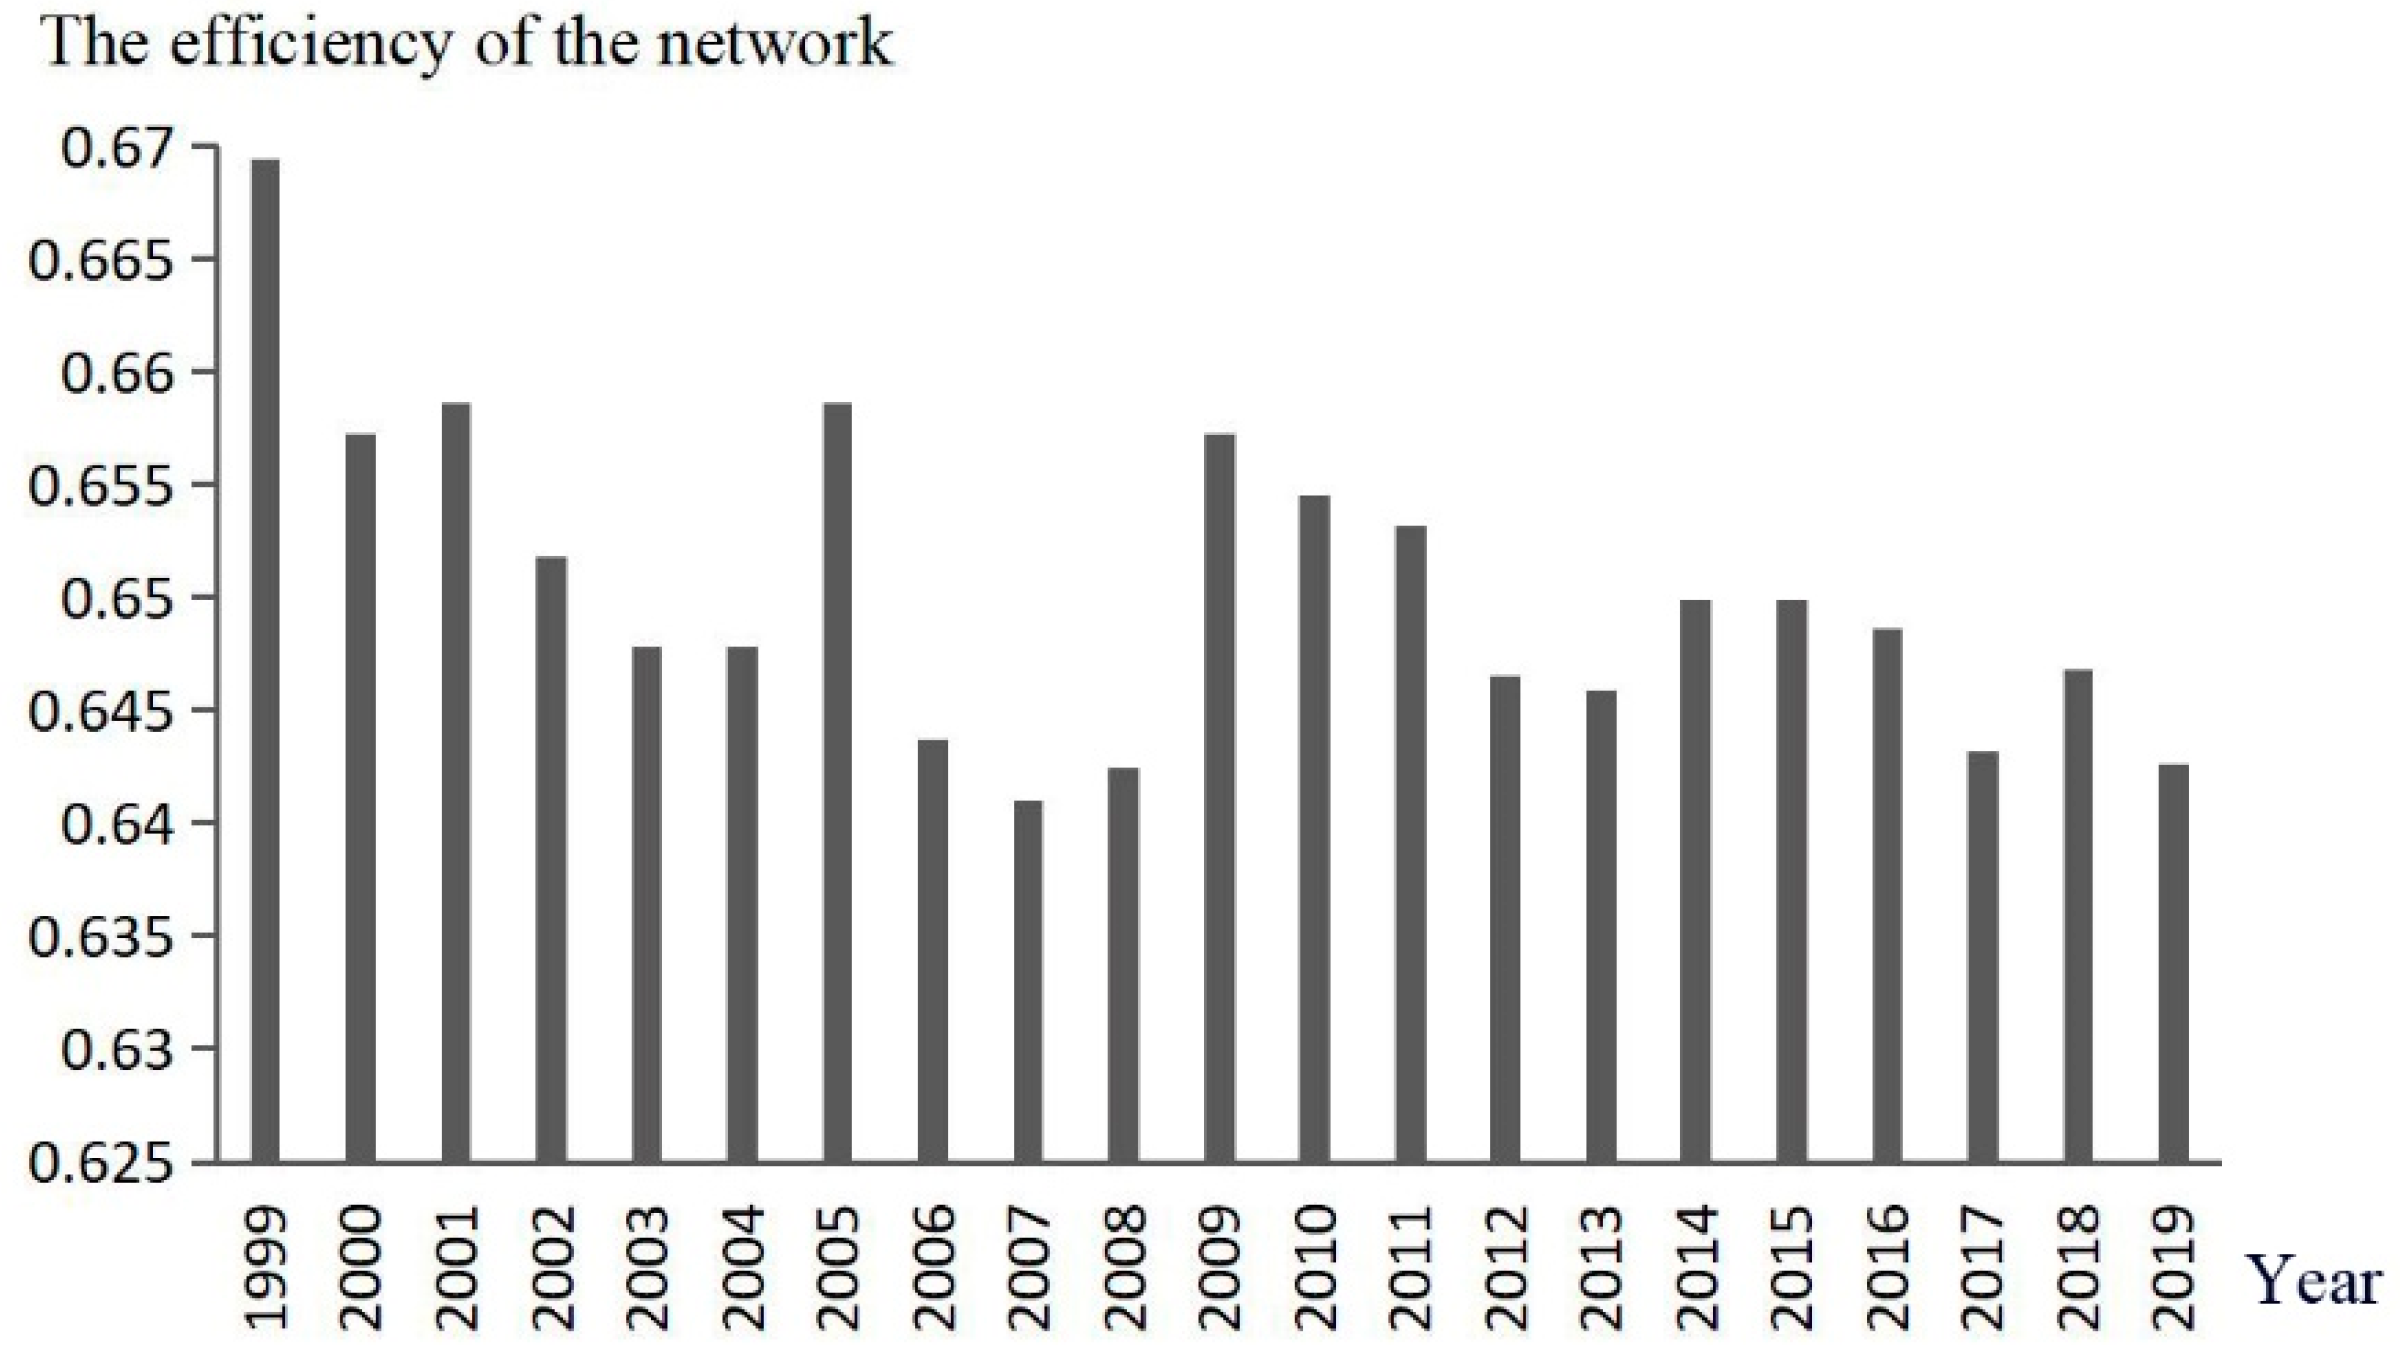
3.1.2. The Correlation Degree of the Network

The network correlation degree of grain production space in Northeast China was further analyzed by calculating connectedness, hierarchy, and efficiency. From 1999 to 2019, the correlation degree of the grain production network was always 1, showing that the network had good accessibility, and the spatial correlation and spillover effect were significant. The hierarchy was relatively stable at 0.2, suggesting that the network structure of grain production in Northeast China was not strict, which was more conducive to the formation of the trend of coordinated development and cooperation of grain production between regions.
Observing Figure 4, it can be seen that the efficiency of the network in Northeast China experienced a fluctuating process of first decreasing, then increasing, and then slightly decreasing. From 1999 to 2007, the decline in network efficiency was obvious. During this period, China put forward the decision to completely abolish agricultural tax in 2006, which advanced the spatial flow and cooperation of grain production factors, and the network structure tended to be stable. However, as a result of the 2008 financial crisis, the network efficiency increased, and there were more redundant connections in the network, which had affected its stability and had a temporary negative impact on spatial correlation. In the later period, the efficiency of the network gradually decreased again, and the spillover paths in the network increased, indicating that its stability was improving in volatility. Therefore, the spatial correlation network of grain production has a development trend and space for continuous intensification in Northeast China.
The characteristics and evolution of the overall correlation network show that the policy of the “grain subsidy policy” and the “Northeast Revitalization” in 2003 accelerated the formation of the grain production network in Northeast China, while the impact of the financial crisis in 2008 brought about a structural adjustment of agriculture. Since 2012, along with the stability of the national grain policy, the agricultural market system in Northeast China has matured, further enhancing the stability of the network structure. In general, the grain production among cities in Northeast China has gradually moved from independent to interrelated, and the spatial transfer and cross-regional cooperation such as rural labor and agricultural machinery became more extensive. Moreover, the grain transaction cost has been reduced, the spatial correlation between regions has increased gradually, and the coordinated development and spillover effects have become increasingly prominent.

3.2. Individual Network Characteristics of Spatial Association

By measuring the degree centrality and betweenness centrality of 40 cities in Northeast China, the centrality characteristics were analyzed to reveal the position and role of cities in the grain production network.

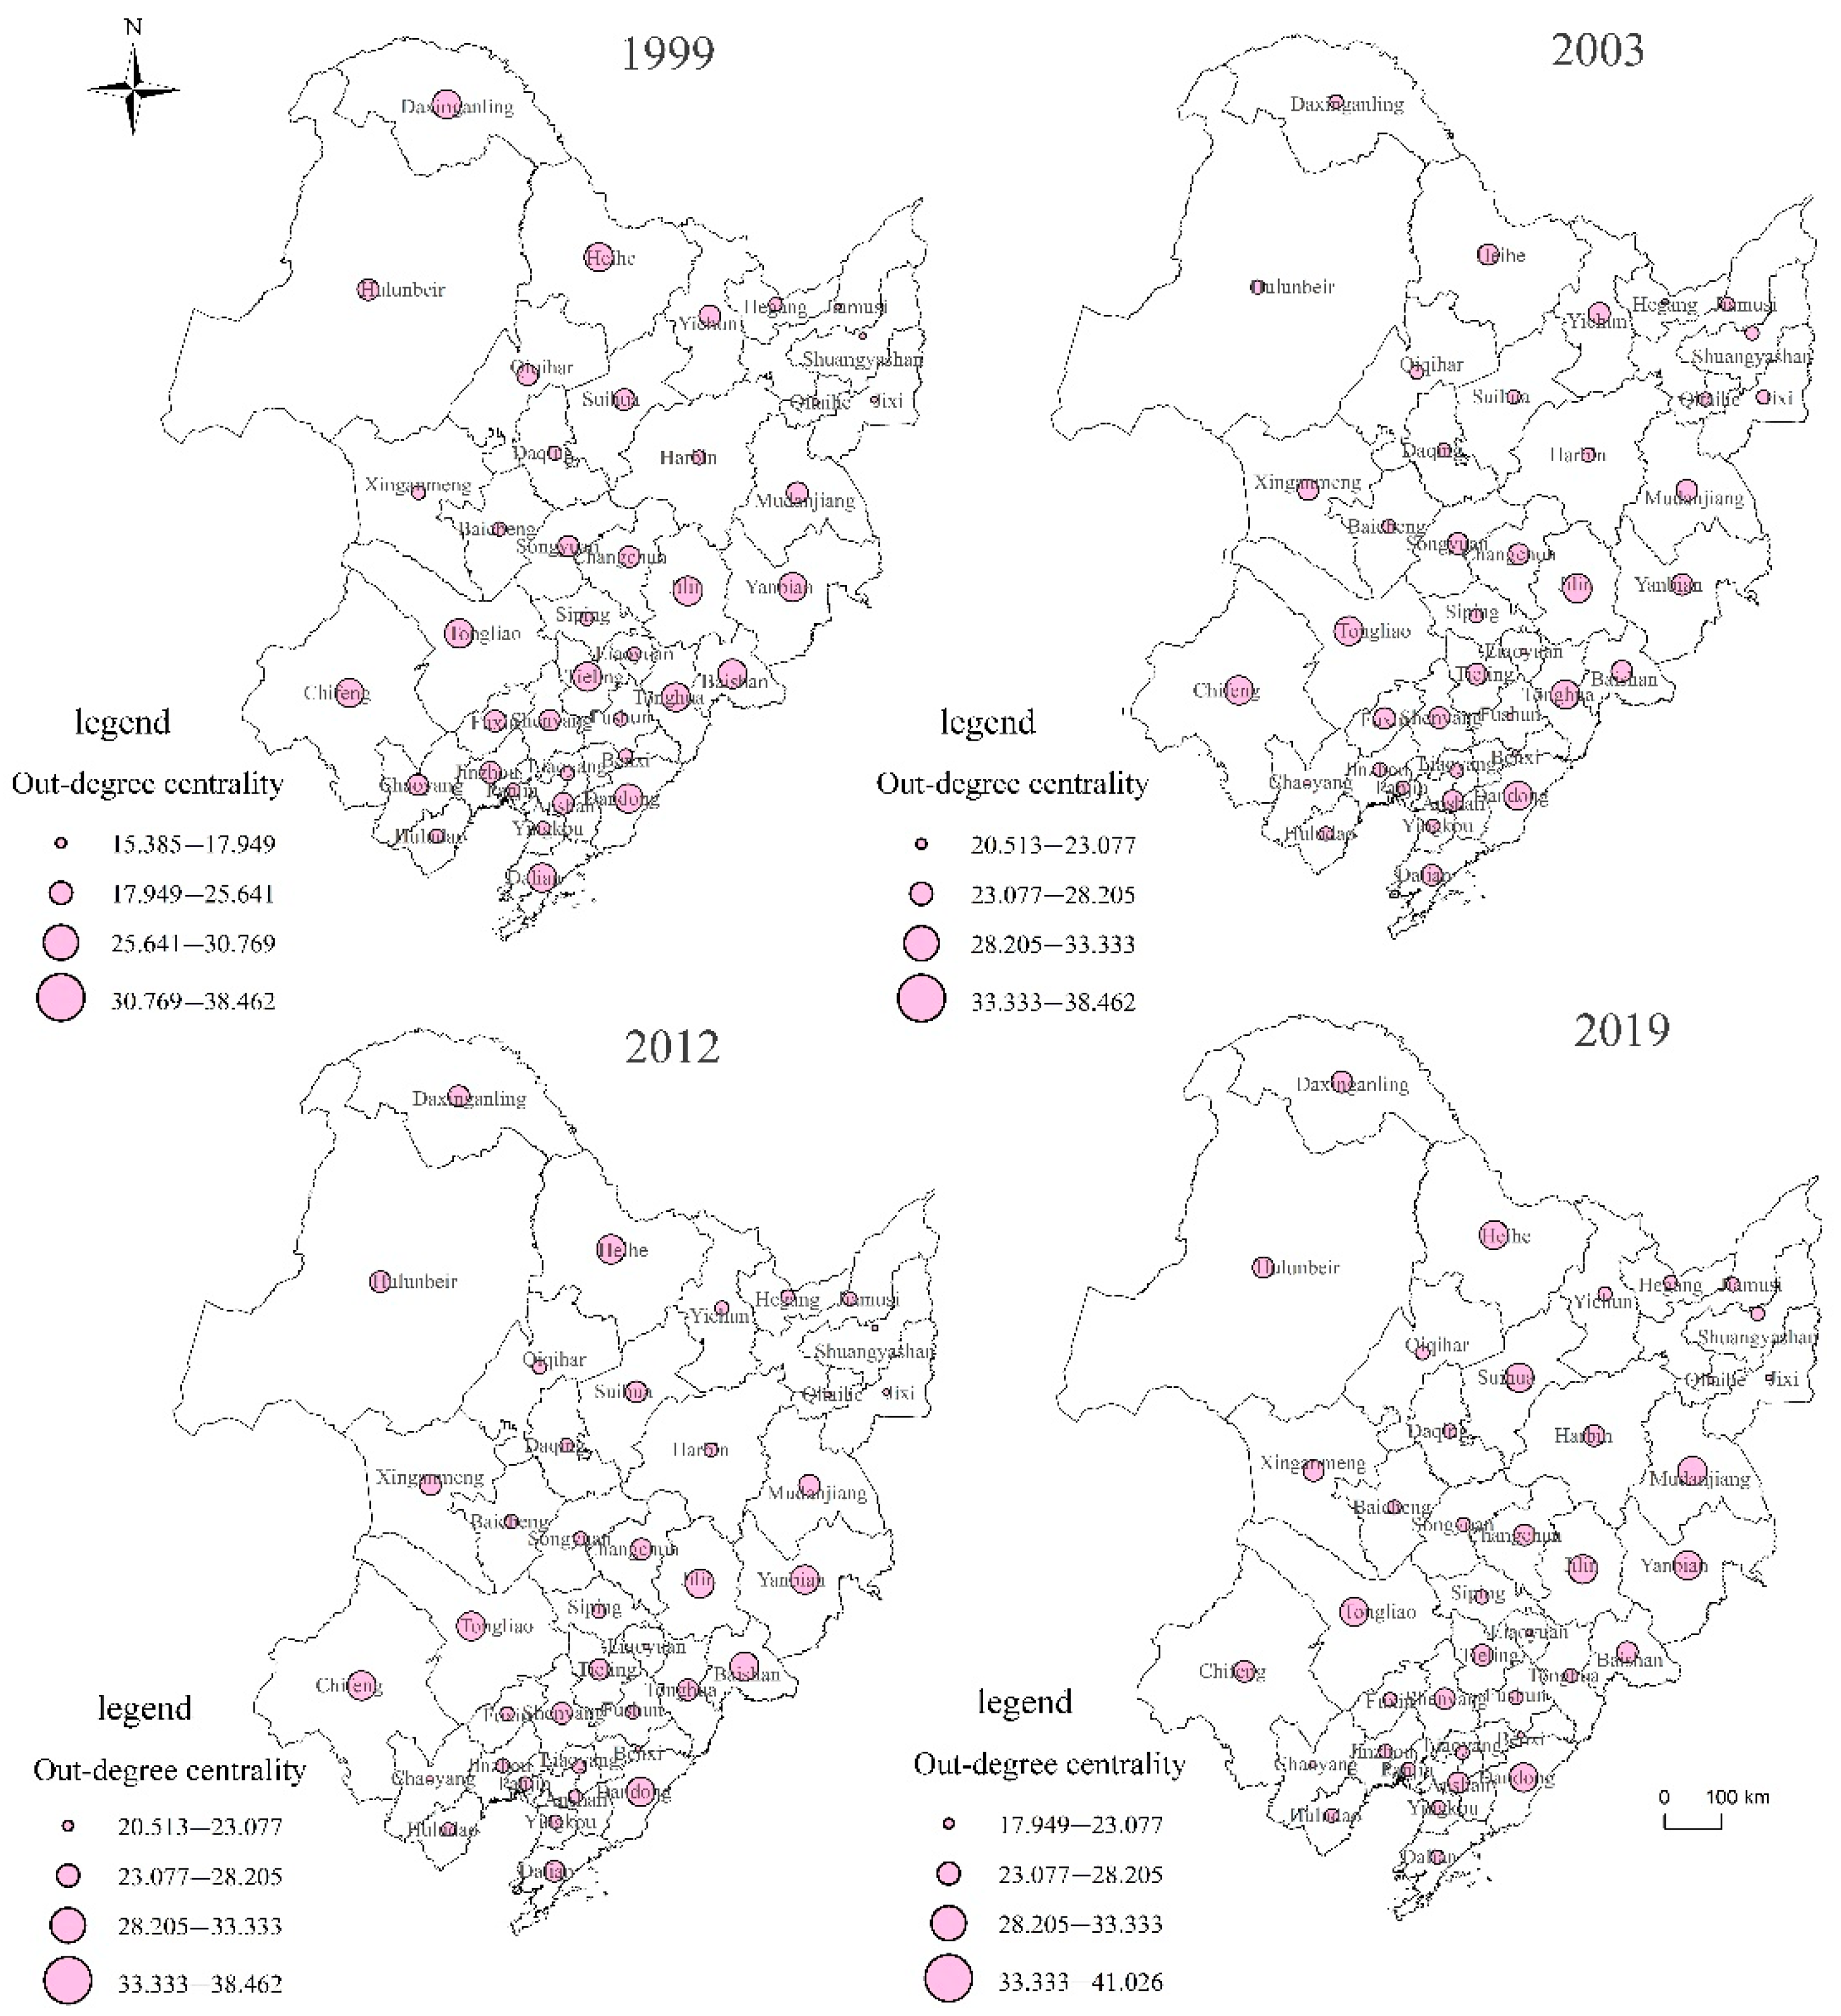
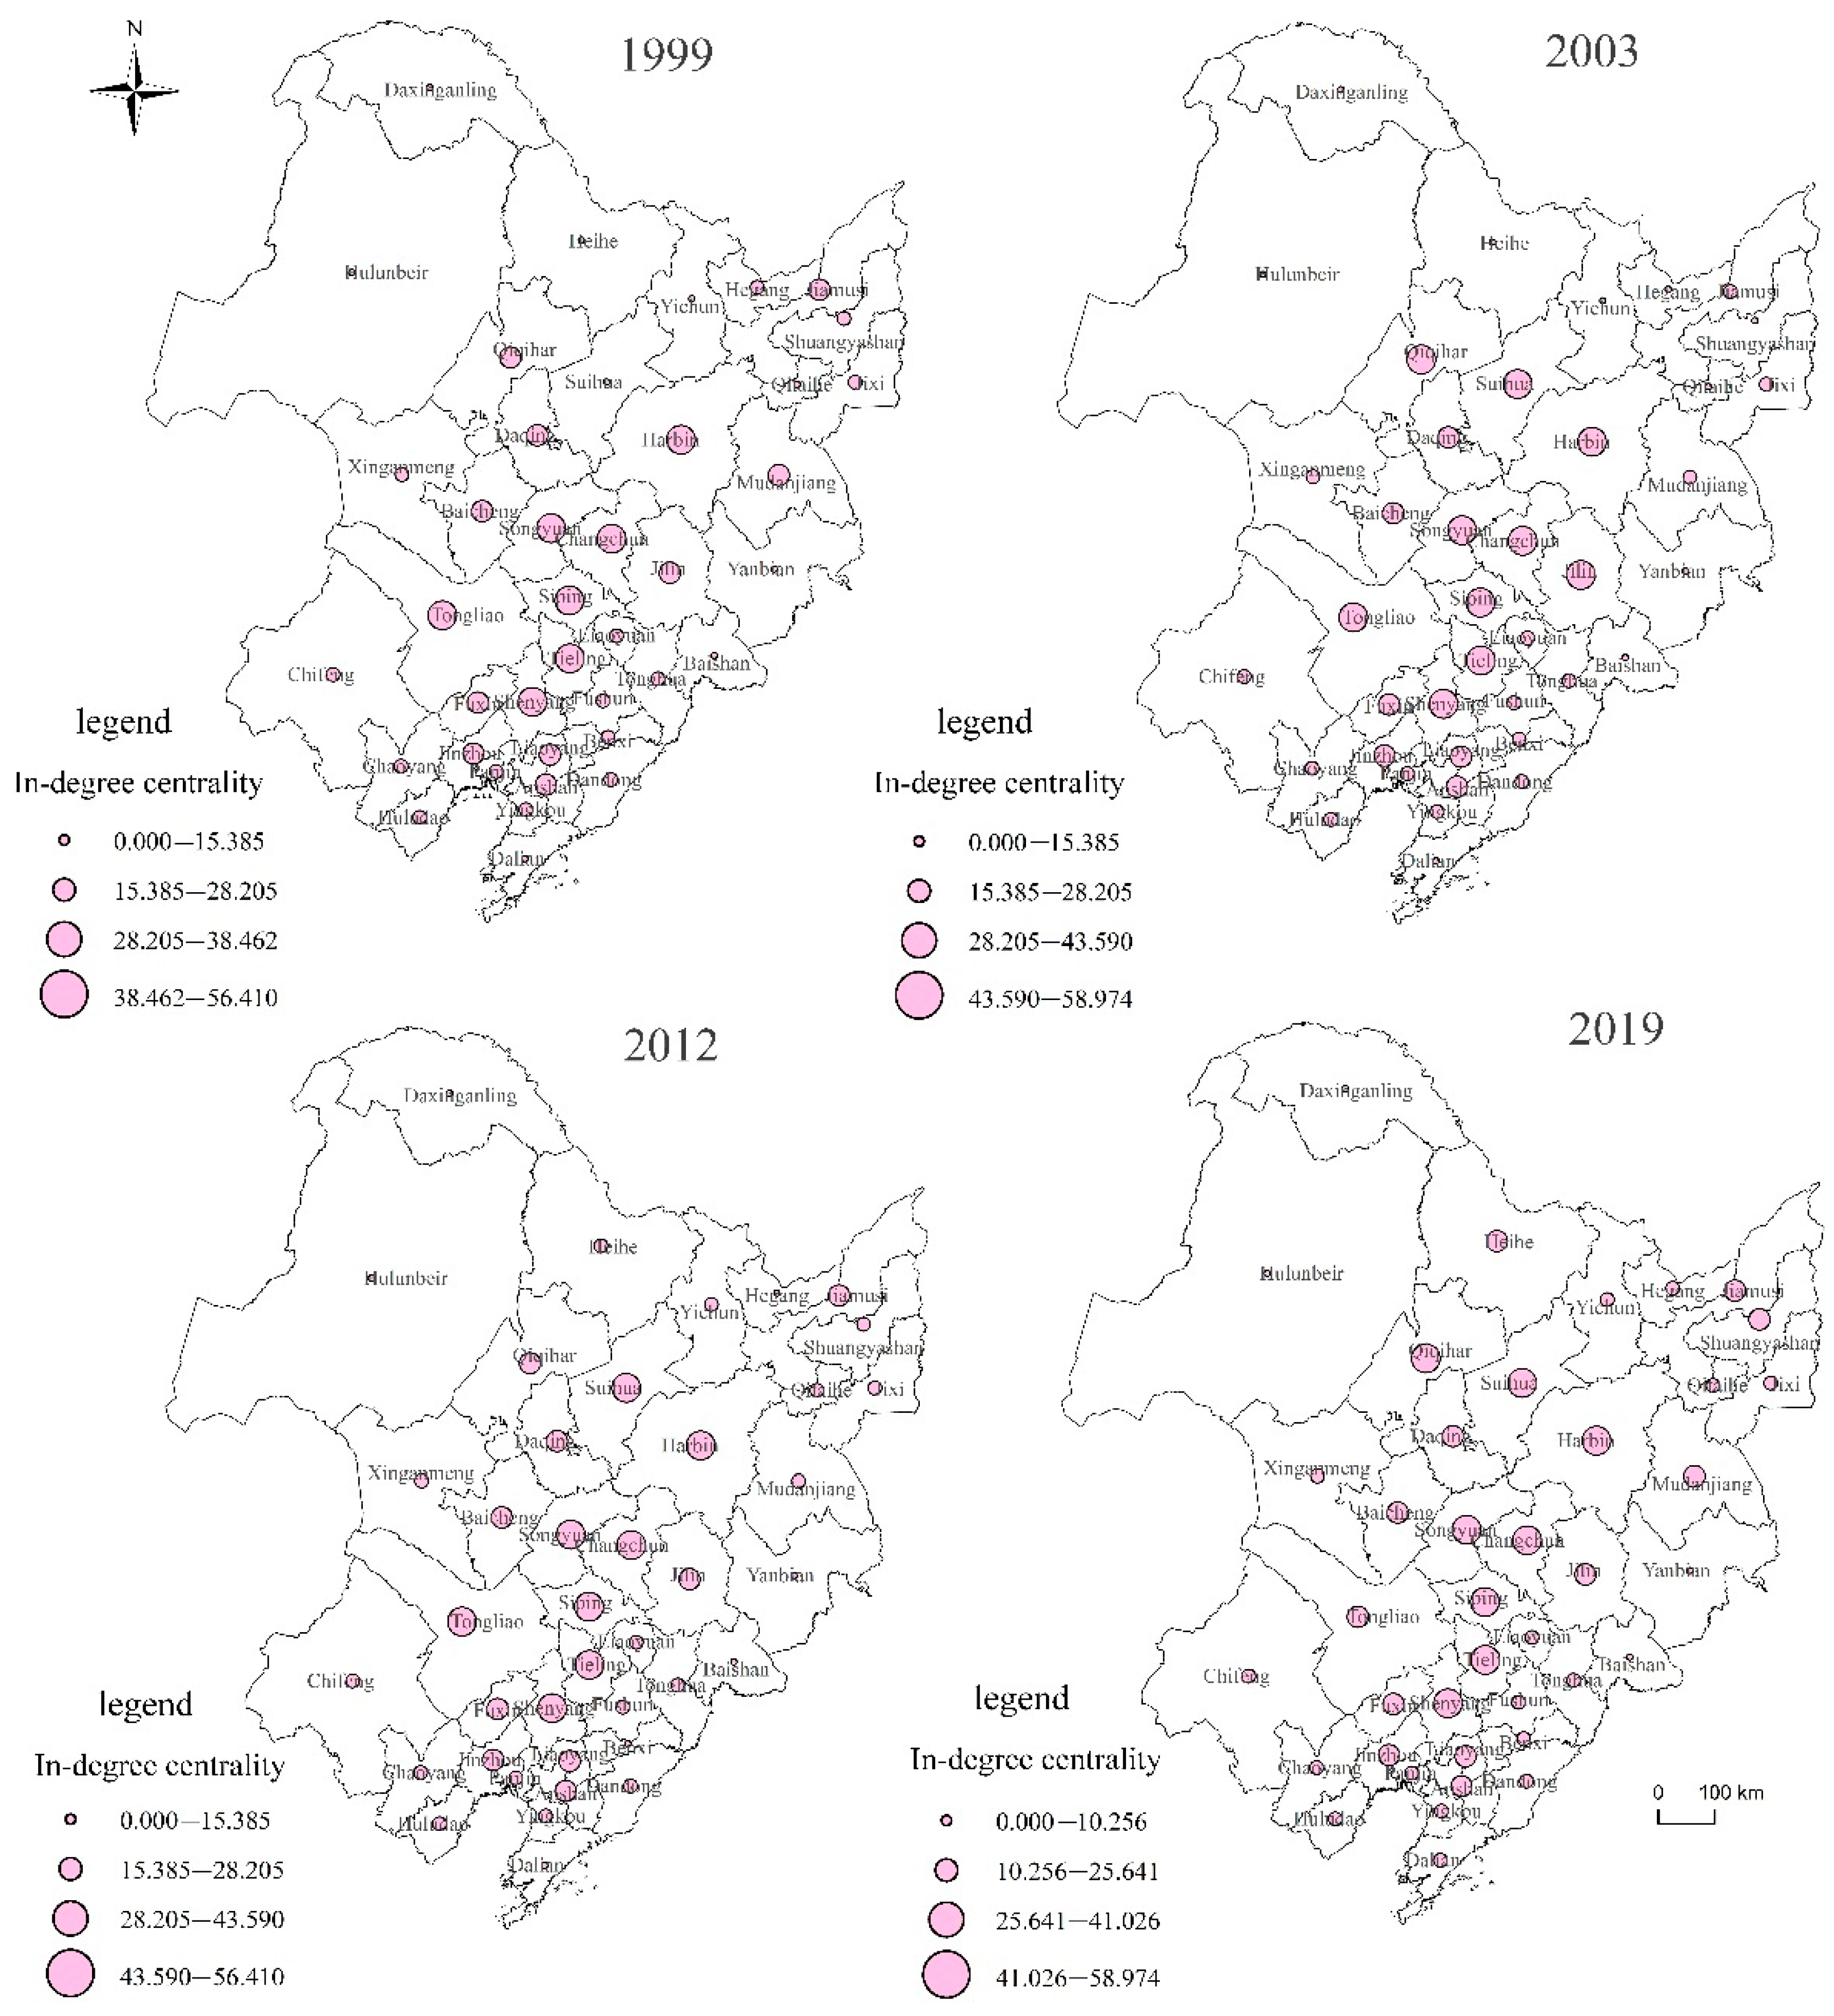
3.2.1. Degree Centrality

The degree centrality is shown in Table 2. According to calculations, the average degree centrality values of the grain production correlation network in 1999, 2003, 2012, and 2019 were 56.026, 58.977, 58.725, and 58.724, with little overall change. Over the past 20 years, cities such as Tieling, Harbin, Tongliao, Shenyang, Changchun, Siping, Songyuan, Qiqihar, and Jilin have been at the forefront and higher than the average of degree centrality, indicating that they play leading roles in the grain production network. Most of these cities are on a large scale or areas with rich black land resources and intensive grain production conditions, such as the Sanjiang Plain and Songnen Plain. Their spatial correlation of grain production is relatively concentrated, other cities have more direct relations with these regions, and the stability of the overall network structure depends on these cities to a high extent. In the four research years, Tieling has the highest mean degree centrality with 87.820; that is, Tieling occupies a central position in the spatial pattern of grain production in Northeast China, and there are spatial correlations and spillover effects between it and another 34 cities. On the other hand, the degree centrality of Daxinganling, Benxi, Baishan, and other cities in the correlation network is in a low position. On the whole, they have less correlation with other cities, and the production scale is relatively small. The status of grain production is not prominent, so they are in a subordinate position in the network.
From the view of out-degree centrality, the temporal and spatial distribution is shown in Figure 5; it increased from 28.013 to 29.488 from 1999 to 2019 in Northeast China, indicating that its external radiation driving ability has been enhanced as a whole. In the past 20 years, the cities with higher-than-average centrality have shifted from five in Jilin Province, three in Heilongjiang, five in Liaoning, and two in Inner Mongolia to four in Jilin Province, five in Heilongjiang, four in Liaoning, and four in Inner Mongolia. The proportion of cities with above-average centrality from Heilongjiang and Eastern Inner Mongolia has gradually increased, indicating that their radiation power and the spillover effects of grain production have gradually enhanced. The cities with the highest out-degree centrality in the four research years are Tongliao, Heihe, Jilin, and Dandong, and they were the main spillovers in the spatial correlation network of grain production. The cities near the bottom are Jixi, Chaoyang, Qitaihe, and so on, which are mainly concentrated in marginal areas and have weak external radiation capabilities.
From the perspective of in-degree centrality, the temporal and spatial distribution is shown in Figure 6. Tieling, Tongliao, Harbin, and Shenyang ranked high for a long time, indicating that they have a strong ability to absorb agricultural resources. In the comparison of out-degree centrality and in-degree centrality, the out-degree centrality of Heihe, Dalian, and other cities is larger than their in-degree centrality, which plays a greater role in the spillover effects. The in-degree centrality of Harbin, Shenyang, and other cities is greater than their out-degree centrality, which benefits more than the spillover in the associated network.
At the same time, it can be found that for the cities with large degree centrality, their in-degree is usually larger than the out-degree, demonstrating that the cities occupying the central position in the grain network production have stronger cohesion, which also reveals that the grain production factors in Northeast China are still in the process of agglomeration, and the diffusion capacity remains to be tapped. It is noteworthy that Tongliao has high out-degree centrality and high in-degree centrality, which signifies that it could not only benefit from the network but also overflow into the network. It can be said that Tongliao has strengthened its connection with other cities by relying on its geographical conditions and production environment, attracting agricultural resources and elements to the area, and continuously integrating and utilizing external resources for diffusion.

3.2.2. Betweenness Centrality

In the social network, the betweenness centrality measures the extent to which a point participates in the transmission of information in the network. In terms of time, the average betweenness centrality values of cities in 1999, 2003, 2012, and 2019 were 3.304, 3.215, 3.237, and 1.943, showing that it has mainly weakened in the past 20 years. As shown in Figure 7, the number of cities acting as intermediaries in the network has been reduced, the links between cities are closer and more direct, and the dependence on intermediary cities is no longer so intense. It shows that the spatial correlation of grain production in Northeast China is prone to be balanced, and the network structure tends to be stable.
From a spatial point of view, within Heilongjiang Province and Liaoning Province, a core-edge structure with Harbin, Shenyang, and Qiqihar as the core and small cities as the edge has been formed. The direct effect is more significant, and the intermediary effect is not obvious in Jilin Province and Eastern Inner Mongolia. At the same time, Tongliao has the highest average betweenness centrality of 48.51% in the four research years, which shows that the shortest connections of nearly half of the nodes in the network need to pass through Tongliao, fully demonstrating the city’s important hub status in the network. Cities such as Changchun, Shenyang, and Tieling with higher degree centrality also have higher intermediary centrality, indicating that they play the role of central actors, can connect with other cities more quickly and effectively in the network, and have strong control capabilities over them. However, cities such as Panjin, Huludao, Hegang, and Yichun have low betweenness centrality, revealing that these cities are limited by their small scale of grain production or poor geographical location, and act as marginal actors in the correlation network. They are vulnerable to the influence of cities with large betweenness centrality and it is difficult for them to dominate the grain production in other regions.

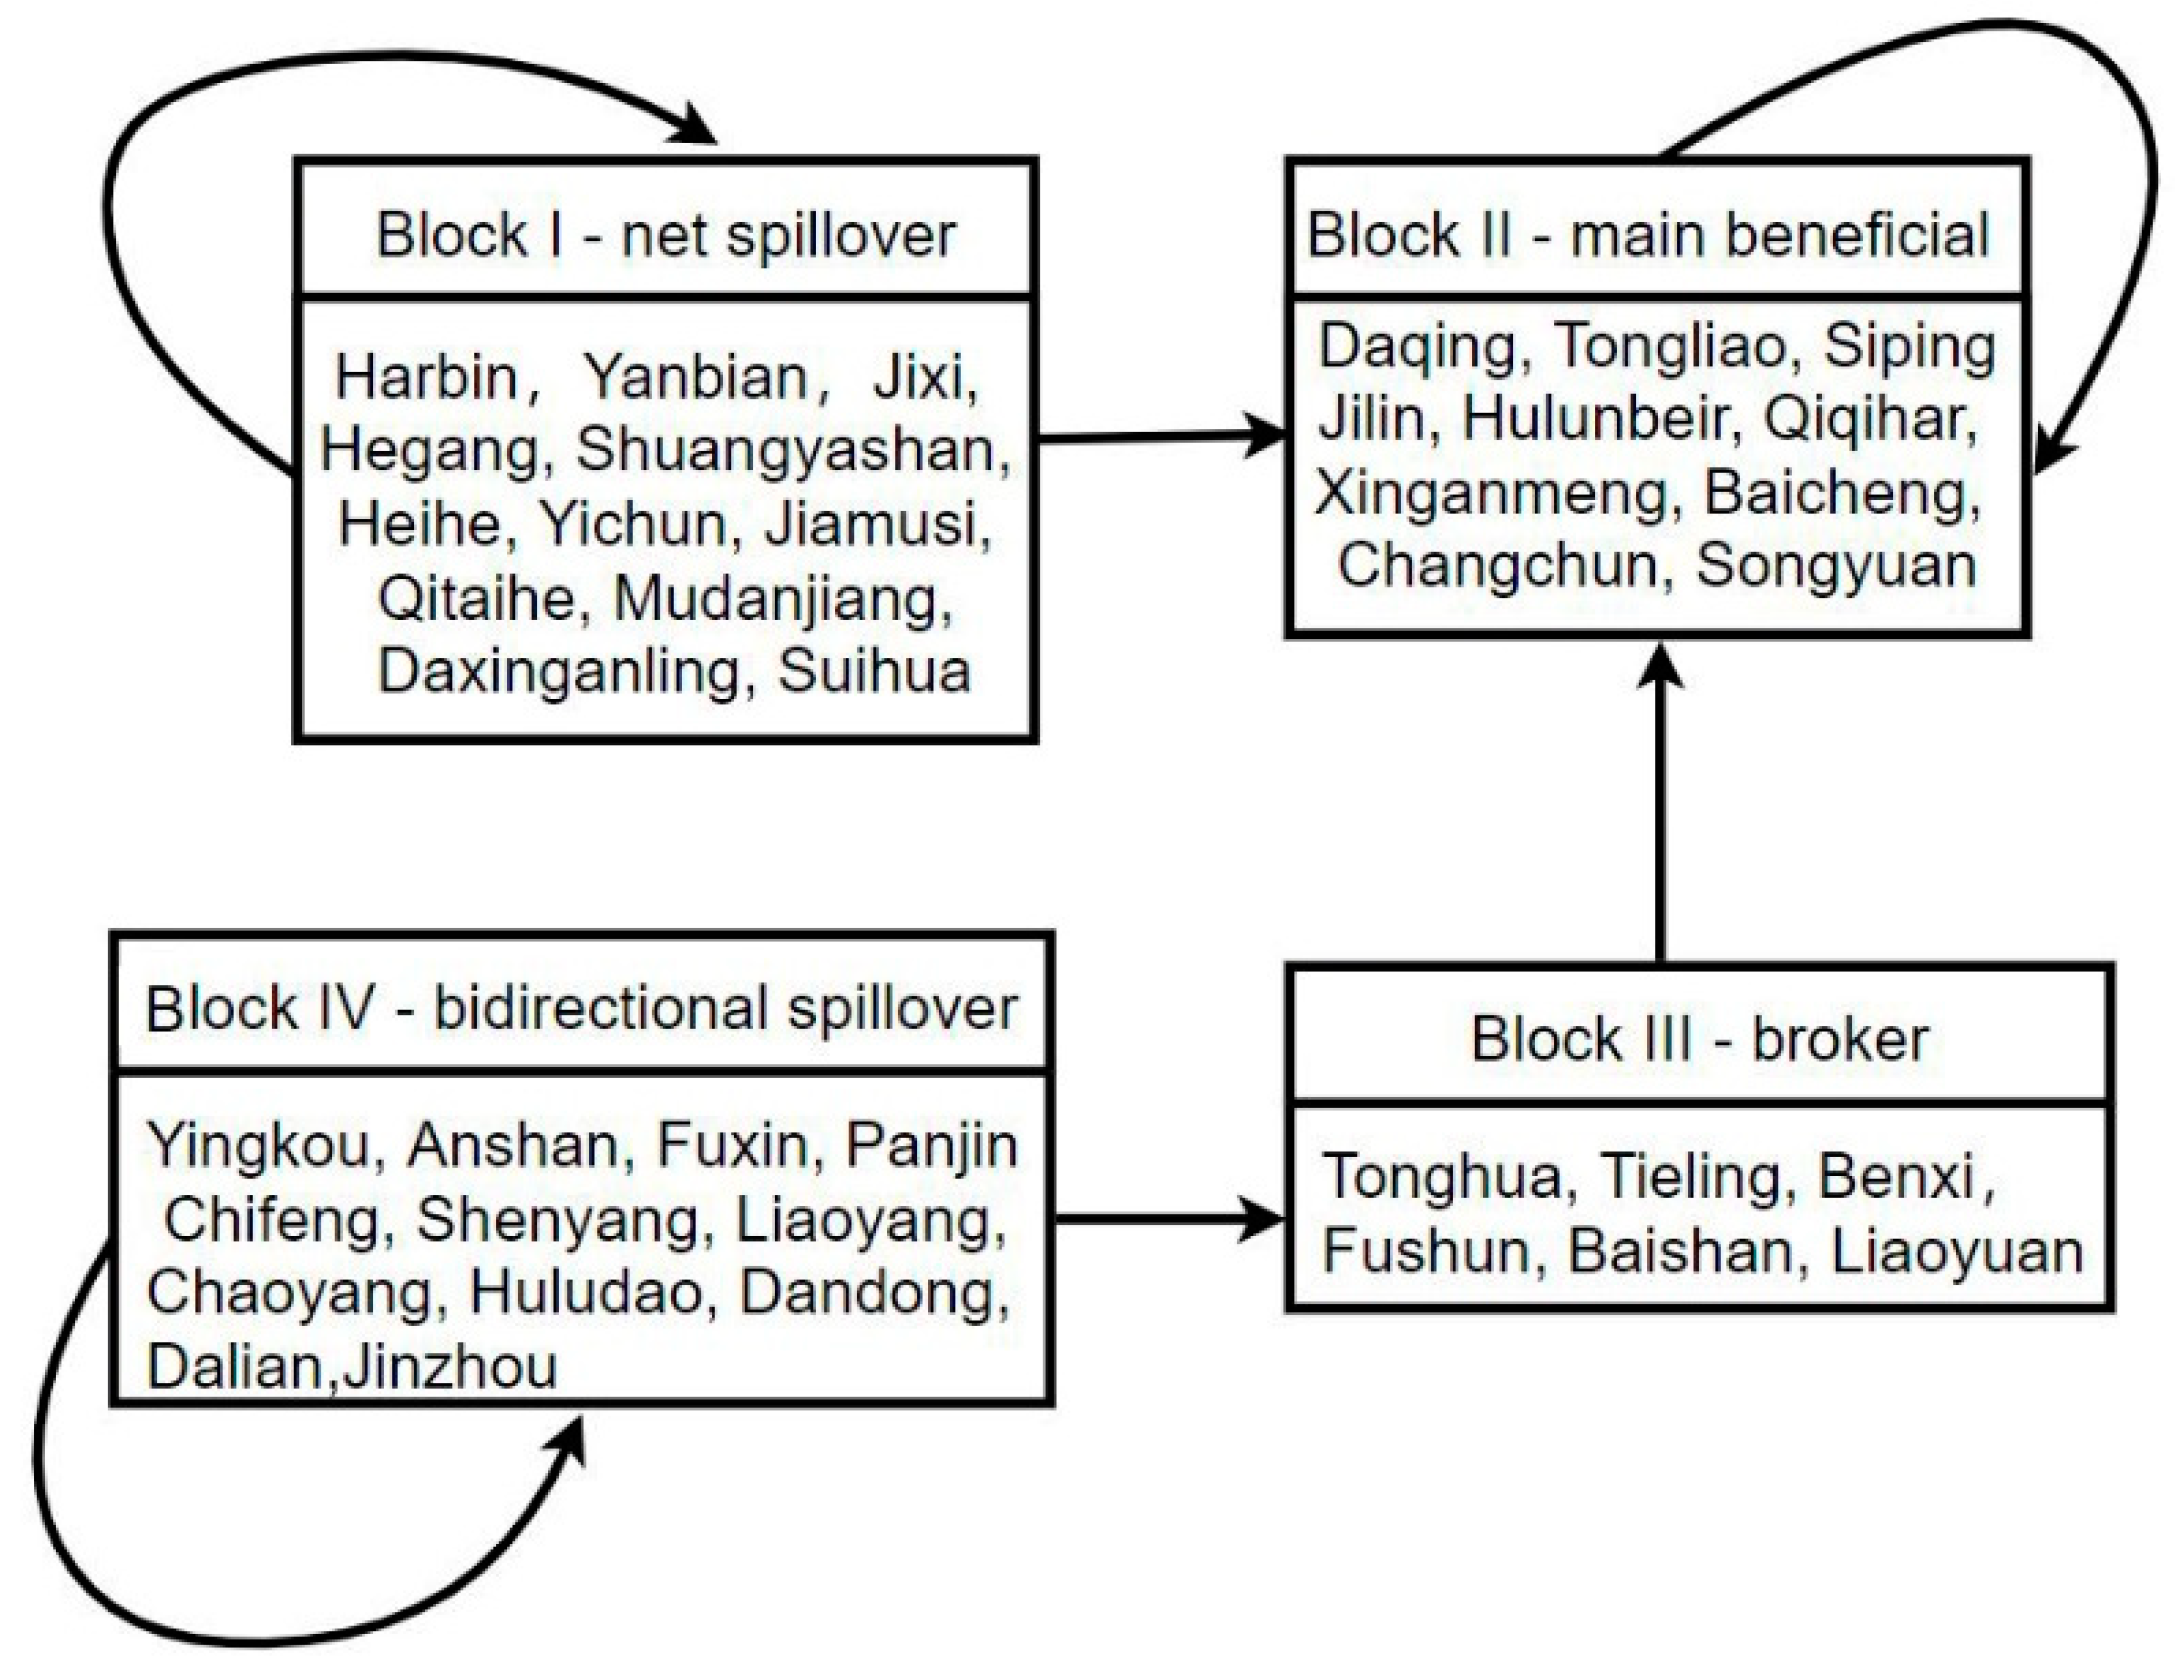
3.3. Block Model Analysis

Using Ucinet 6.0 software for block model analysis, we set the maximum segmentation depth to 2 and the concentration standard to 0.2. The spatial correlation network of grain production in Northeast China can be divided into net spillover block, main beneficial block, broker block, and bidirectional spillover block. Based on the results of the research years, the composition of the blocks is relatively stable. Therefore, taking 2019 as an example, the total number of correlations is 407, the number of relations within the four blocks is 244, and the number of relations between blocks is 163, which indicates that there are obvious spatial correlations and spillover effects in grain production between blocks (Table 3).
There are 12 cities in block I: Harbin, Yanbian, Jixi, Hegang, Shuangyashan, Heihe, Yichun, Jiamusi, Qitaihe, Mudanjiang, Daxinganling, and Suihua. The cities that make up block I are mainly the central cities of urban agglomeration. There are 93 relations generated within the block, 47 relations sent outside the block, and 31 relations received from the external block. The expected proportion of internal relations is 28.205%, and the actual proportion of internal relations is 47.778%. The net spillover effects of block I are obvious, so it belongs to the “net spillover block”. It shows that the members of block I can not only achieve self-sufficiency in grain production but also overflow grain factor resources to other regions.
There are 10 cities in block II: Daqing, Changchun, Jilin, Siping, Hulunbeir, Xinganling, Tongliao, Songyuan, Baicheng, and Qiqihar. The members of block II are mainly cities in eastern Inner Mongolia and Central Jilin Province, generating 72 internal relations, 49 relations sent outside the block, and 76 external relations received by the block. The expected internal relation ratio is 23.077%, and the actual is 59.504%; that is, the number of relations received by the block from other blocks is significantly higher than spilled out. Therefore, it belongs to the “main beneficial block”, indicating that they can gather and attract the entire grain production network. Factors of production tend to flow into the block and concentrate internally, giving the block members an advantageous position in the grain production network.
Block III consists of Tonghua, Tieling, Benxi, Fushun, Baishan, and Liaoyuan, which are mostly located in the center of Northeast China. There are 22 relations generated within the block, 31 relations sent to the outside, and 27 relations received from the external block. The expected internal relation proportion is 22.820%, and the actual is 34.921%. It can be found that block III not only spills outward, but also receives spillover from other blocks, and the number of internal relations is the same as spillover relations, so it is classified as the “broker block”. The members of block III are at the core of the network, with obvious advantages in grain production scale and policy, and can play the role of “intermediary” and “bridge”.
There are 12 cities in block IV, which is composed of Shenyang, Anshan, Fuxin, Yingkou, Panjin, Dalian, Chaoyang, Huludao, Liaoyang, Dandong, Jinzhou, and Chifeng, most of which belong to Liaoning Province. There are 57 relations generated within the block, 26 relations sent to the outside, and 29 received externally. The expected internal ratio is 28.205%, and the actual is 68.675%, so it is classified as the “bidirectional spillover block”. That is, the block not only receives spillovers from other blocks but also produces more spillover effects on other blocks. It shows that the grain production factors of the members of block IV can meet self-sufficiency and overflow to other regions.
Furthermore, according to the conversion rules, the density value of the entire correlation network in 2019 is 0.294. If the block density is greater than 0.294, it is specified as 1; otherwise, it is specified as 0. Therefore, the network density matrix can be converted into an image matrix (Table 4) to determine the correlation between blocks and reflect its overflow path.
In the image matrix, it can be seen that all the elements on the diagonal equal 1, showing that the internal correlation of grain production in the blocks is strong, and the agglomeration effect is produced. Combined with the diagram of the relation between the four major grain production blocks in Northeast China (Figure 8), it can be found that in addition to the internal correlation, block IV also has spillover effects on block III, and block III has spillover effects on block II. Therefore, block III plays an intermediary role in the correlation network. Block IV establishes the spillover relation with block II through the transmission of block III, while block I produces spillover effects on block II directly. The matrix shows that there are structural characteristics of transitive relations between block II, block III, and block IV. The above transmission process also shows that the grain production network has obvious spillover characteristics. Among them, the beneficial effect of the second block is significant, and the “centralized trend” structure appears in it.
On the whole, led by large cities such as Harbin, the internal cities of Heilongjiang Province mainly constitute the net spillover block, which may be due to its rich agricultural resources and the smaller distance between cities. Therefore, the number of relations within the block is obvious. The central part of Jilin Province and the cities of eastern Inner Mongolia, mainly Changchun and Tongliao, constitute the main beneficial block. These members usually have a large scale of grain production and a high degree of centrality, giving them stronger absorption of agricultural resources. Moreover, the beneficial effect is more significant, and a closer relation of grain production is formed between cities. Regional central cities such as Tonghua and Tieling are geographically connected to major nodes in the network and act as intermediaries to promote the flow of grain resources in space. In addition, with Shenyang in Liaoning Province as the core, the bidirectional spillover block is formed, which contains the radiation effect of the central city on the edge cities, and the spatial correlation is quite complex.

4. Discussion

Close network cooperation is of great significance for ensuring grain production in developing countries. Taking as a case study Northeast China, the main grain-producing area in China, we used the social network analysis method to study its grain production patterns and analyze the spillover effects brought by networked grain production. The results are generalizable and can provide reference for promoting the networked development of grain production in similar agricultural areas in other countries.

4.1. What Are the Differences between Network and Traditional Research Methods of Grain Production Pattern?

Different from the methods of previous studies, traditional studies mostly use attribute data to examine the patterns of grain production and specifically use relevant methods such as the center of gravity migration, coefficient of variation, hotspot analysis, and spatial autocorrelation [34,35]. Although these methods can characterize the distribution of attribute data, they ignore the correlation existing in the space of grain production in different regions, rely on geographical proximity, limit the connection within the region or administrative boundary, and cannot explain the role of cross-regional cooperation [36]. As an economic activity, grain production must have some connection in different regions due to the cross-regional flow of agricultural products, agricultural labor, and other factors. The traditional research methods for grain production patterns have limited ability to characterize this connection. The emergence of the social network analysis method provides the possibility to make up for this defect. It is originally a sociological research method to analyze the relationship between social actors and network structure. Previously, it has been widely used in the research of transportation network, urban network, and enterprise network in geography and economics [37,38,39]. While the research applied to the grain production network still needs to be improved, many studies on grain production patterns ignore the existing form of the network. In general, with the development of social economy, networked space is surpassing geographic space to become a new form of spatial organization. It is more practical to discuss the position of a region in the network than to talk about the region alone. Therefore, social network analysis is used to explore the deep logic of grain production connection and spatial organization in Northeast China, which can be said to be an expansion and improvement of research methods to some extent.

4.2. Compared with the Previous Research on Grain Production, What Are the Improvements of the Results Obtained by Spatial Correlation Network Method?

In terms of grain production patterns in Northeast China, Chinese scholars studied the grain production levels with attribute data and found that more productive areas are mainly distributed in the western part of Jilin Province and Heilongjiang Province; Liaoning Province, and the middle and eastern parts of Jilin Province are relatively low [40]. The research results based on “attribute data” and “relation data” will have certain similarities and differences. Based on this paper, we can infer that the overall spatial correlation of grain production is on the rise, and the radiation and spillover effects of grain production in Heilongjiang and eastern Inner Mongolia are gradually increasing. In the future, network production can be further promoted to drive grain production in the central and eastern parts of Jilin Province and Liaoning Province. Moreover, the network structure of grain production in Northeast China is not strict, and the dominant position of members is weak, which is more conducive to the formation of the trend of coordinated development and cooperation between regions. In terms of grain production blocks and spillover effects, it has been found that the spatial correlation network of grain production in China can be divided into four blocks, and the spillover effects between blocks have gradient transmission characteristics [28]. We further discovered that grain production in Northeast China has also formed four homologous stable blocks. The spatial correlation and spillover effect between blocks are obvious, and they are still in the agglomeration stage of the agglomeration–diffusion effect. That is to say, some cities, based on innate advantages such as agricultural location, resources, and policies, attract the inflow of superior resources from other blocks, thereby realizing the development and upgrading of the grain industry. In order to develop the diffusion effect and avoid the excessive Matthew Effect, the marginal areas should be assisted to seek the development of grain production and turn a zero-sum game into win-win cooperation.

4.3. What Are the Advantages of the Spatial Correlation Network of Food Production and Is It More Sustainable?

As a new grain production mode, the formation of a grain production spatial correlation network does not only depend on physical boundaries, surmounting the traditional agricultural location theory centered on geographical distance. It can also be said that it breaks the market segmentation and administrative barriers, makes the agricultural resources and technologies interconnected and complementary, and could realize large-scale production and cross-regional services, promoting the transformation of agricultural research from a static hierarchical structure to a dynamic bi-directional network system. The reason why we believe that the network spatial structure has higher sustainable implications is because of the existence of externality, which can realize the integrated development of grain production by reducing the matching and transaction costs and promoting industrial division and cooperation [41,42,43,44,45]. This can improve the efficiency of food production and strengthen the resilience of food supply to better ensure the sustainability and security of grain production in developing countries. Therefore, in the formulation of China’s grain production strategy, it is necessary to consider the impact of the development of the spatial correlation network, and make full use of the externality and stability of the network to ensure grain supply. For Northeast China, the future network optimization of grain production should take advantage of national policies and financial support, implement linkage grain production and marketing strategies, build a grain-trading platform to share information and resources, strengthen the construction of the grain circulation network and infrastructure, reduce the cost of circulation, and transform the comparative advantages of grain production into agricultural economic advantages. Through the cooperation of the space network for grain production, this can improve the diversity of agriculture and the resilience when dealing with risks, enhance the competitiveness of the regional grain industry, and effectively guarantee the sustainable development of national food supply.

4.4. In Order to Optimize the Spatial Correlation Network of Grain Production, How Should Members of Different Blocks Develop in the Future?

The following suggestions are put forward according to the different positions of each block in the grain production network. (1) The net spillover block should pay attention to the motivation to stimulate the spatial spillover effect, increase the construction of channels and the number of network connections between regions, provide more opportunities for elements to flow across regions, and realize the interconnection between nodes. Moreover, the net spillover block should continue to strengthen the transmission of agricultural labor, agricultural capital, and other resource elements. Additionally, the net spillover block should pay attention to the ecological and high-quality development of agriculture; introduce and apply modern information, agricultural technology, and equipment; improve the efficiency of resource utilization, and form a bilateral circulation of agricultural economic growth and grain production network improvement. (2) For the main beneficial block, we should fully display the income advantages of node cities in the grain production network, strengthen the influence and distribution capacity of agricultural resources, continue to promote the accumulation and protection of regional agricultural capital, and realize the transformation from quantitative to qualitative changes in agricultural development as soon as possible. At the same time, the main beneficial block should give full play to the advantages of local resources, take the majorization and adjustment of grain crop structure as the core of improving resource allocation, promote the refinement and intensive production of grain, and vigorously advance the development of agriculture with distinctive characteristics. (3) For cities in the broker block, attention should be paid to fostering strengths and avoiding weaknesses, making full use of the intermediary adjustment capabilities of node cities in regional grain division and cooperation, and providing a transit and acceptance platform for beneficial areas and spillover areas. The broker block should also prioritize the development of the agricultural resource control capabilities of important node cities, and further enhance and exert the transmission function to increase the frequency of spillover effects in the network. Moreover, it should give priority to the development of important node cities’ abilities to control agricultural elements and further enhance the transmission function to increase the frequency of spillover effects in the network. In the meantime, it is necessary to eliminate the existence of too many intermediary cities through regulation and control to reduce the loss and redundancy in the flow and allocation of grain production factors. (4) Cities in the bidirectional spillover block should improve the capacity of overflow, promote the improvement of agricultural infrastructure construction, break down the barriers of administrative boundaries, and reduce the flow and transportation costs in space. Furthermore, the bidirectional spillover block should strengthen the accessibility and structure of the network to be embedded in the higher-level grain production network and enhance the position of power and influence, while enhancing the radiating and driving role of core nodes and promoting the transformation of node cities in the subordinate position of grain production to the equal status of bidirectional connection, which narrows the gap in technology and talents of grain production within the block and improves the stability of the grain production network.

5. Conclusions

5.1. The Spatial Correlation Network of Grain Production in Northeast China Shows a Complex Trend and the Structure Is Not Strict

In terms of overall characteristics, the density value and network relation number of the grain production network show a fluctuating and rising evolution trend, indicating a continuous close and complex development, but the degree is still not high, indicating that closer communication and cooperation are needed in the future. Moreover, the network structure of grain production in Northeast China is not strict, and the dominant position of members is weak, which provides favorable conditions for the coordinated development and cooperation of grain production between regions in the future.

5.2. The Spatial Correlation Network of Grain Production in Northeast China Presents a Multi-Center Distribution and the Connection Is More Direct

The spatial correlation network of grain production is characterized by multi-center distribution in light of individual characteristics. Tieling, Tongliao, Changchun, Harbin, and other cities have had leading roles as important nodes in the past 20 years. These important nodes not only occupy the status of central actors, but also play the roles of intermediary and bridge, illustrate that they can connect with other cities more quickly and effectively, and have a significant impact on the spatial correlation of grain production in other cities. Meanwhile, the gap in the intermediary role between cities has been narrowing gradually, and the dependence on intermediary cities is decreasing, signifying that the connection between cities is closer and more direct, and the spatial correlation structure of grain production in Northeast China tends to be balanced and stable.

5.3. The Four Grain Production Blocks in Northeast China Have Obvious Flows of Agricultural Factors and Are in the Stage of Agglomeration

As far as the block characteristics and spillover effects are concerned, grain production in Northeast China has formed four stable blocks. Under the leadership of Harbin, the cities of Heilongjiang mainly constitute the net spillover block. The central part of Jilin Province and the eastern Inner Mongolia, dominated by Changchun and Tongliao, make up the main beneficial block. The broker block is composed of Tonghua, Tieling, and other regional central cities. Taking Shenyang as the core city, it forms the bidirectional spillover block with cities mainly in Liaoning Province. There is an active flow of agricultural factors between the four functional blocks, and the spatial correlations and spillover effects are obvious. In addition, agricultural resources flow to areas with high degrees of centrality, indicating that they are still in the agglomeration stage in the process of agglomeration–diffusion. In the future, policy regulation should be used to achieve the optimal development of the spatial correlation network of grain production in Northeast China.

5.4. Analysis of the Shortcomings and Research Prospects

The shortcomings of this paper must be addressed. First, in the absence of direct data on regional grain production and circulation, the gravity model is used to describe the grain production network. Even if it is intuitive and representative, it is only an idealized grain production network, and the results were obtained by inferring their exchanges and economic connections through indicators such as geographical distance, grain output, and grain planting area, and thus could not be fully consistent with the actual situation. Second, the multi-dimensional description of the construction of the grain production network is not detailed enough. Existing studies have shown that corn, rice, and soybeans planted in Northeast China have different spatial layout [46], and the structural characteristics of their network have not been explored. This should be taken as the starting point of future work, to further consider the specific conditions of different grain crops, which is of great significance to the industrialization and refined development of grain crops. Third, we have not conducted an in-depth analysis of the driving factors of the grain production network. In the future, the driving mechanism affecting the evolution of the grain production network should be explored, and a long-term and multi-scale extension study should be carried out.

Author Contributions

Conceptualization: H.G. and Y.Z.; formal analysis, H.G. and Y.Z.; investigation, H.G., C.X. and Y.Y.; data curation, H.G., C.X. and Y.Y.; writing—original draft preparation, H.G.; writing—review and editing, H.G. and Y.Z.; supervision, Y.Z; project administration, Y.Z.; funding acquisition, Y.Z. All authors have read and agreed to the published version of the manuscript.

Funding

This research was supported by the National Natural Science Foundation of China, grant number 41571115.

Institutional Review Board Statement

Not applicable.

Informed Consent Statement

Not applicable.

Data Availability Statement

Not applicable.

Acknowledgments

We thank all reviewers and editors for their constructive suggestions and comments.

Conflicts of Interest

The authors declare no conflict of interest.

References

  1. Barr, T.N. The world food situation and global grain prospects. Science 1981, 214, 1087–1095. [Google Scholar] [CrossRef] [PubMed]
  2. Lingling, W. Reviews on the Study of Grain Production Efficiency. Sci. Technol. Ind. 2012, 12, 29–33. [Google Scholar]
  3. Bonilla-Cedrez, C.; Chamberlin, J.; Hijmans, R.J. Fertilizer and grain prices constrain food production in sub-Saharan Africa. Nat. Food 2021, 2, 766. [Google Scholar] [CrossRef]
  4. Xiaoyun, Z. The Idea of Rural Revitalization on Law on Safeguarding Food Security. J. Northwest Minzu Univ. 2020, 5, 126–135. [Google Scholar]
  5. Li, F.; Qin, Z.; Liu, X.; Chen, Z.; Wei, X.; Zhang, Q.; Lei, M. Grain production space reconstruction and land system function tradeoffs in China. Geogr. Sustain. 2021, 2, 22–30. [Google Scholar] [CrossRef]
  6. Jin, T.; Fang, Z. Changing Grain Production in China: Perspective on Changing Grain Acreage. In Proceedings of the Third International Conference on Agro-Geoinformatics, Beijing, China, 11–14 August 2014; pp. 484–488. [Google Scholar]
  7. Feng, B.Y.; Sun, J.B.; Zhao, Z. Assessing the Main Grain Production and Risk during 1995–2012. Adv. Intel. Sys. Res. 2014, 102, 139–144. [Google Scholar]
  8. He, Y.-F.; Ma, C.-Q.; Yang, H.-J. Food security based on the spatial temporal feature of grain production. Asian Agric. Res. 2009, 1, 9–13. [Google Scholar]
  9. Wu, G.; Zhang, Q.; Zhang, F.; Mai, Q. Research on Grain Production Efficiency and Its Spatial Spillover Effects in China. Econ. Geogr. 2019, 39, 207–212. [Google Scholar]
  10. Bao, B.; Jiang, A.; Jin, S.; Zhang, R. The Evolution and Influencing Factors of Total Factor Productivity of Grain Production Environment: Evidence from Poyang Lake Basin, China. Land 2021, 10, 606. [Google Scholar] [CrossRef]
  11. Hou, M.; Deng, Y.; Yao, S. Coordinated relationship between urbanization and grain production in China: Degree measurement, spatial differentiation and its factors detection. J. Clean Prod. 2022, 331, 129957. [Google Scholar] [CrossRef]
  12. Dali, W.; Bing, L.; Wenli, D. Analysis on the Evolution and Influencing Factors of Spatial Pattern of Grain Production in Yunnan Province. Inq. Econ. Issues 2021, 12, 136–148. [Google Scholar]
  13. Shaoqi, P.; Yating, L.; Changhong, M. Evolvement of Spatial Pattern of Per Capita Grain Possession at County Level in Henan Province. Areal Res. Dev. 2015, 34, 132–137. [Google Scholar]
  14. Congjia, Z.; Xiaoguang, D.; Haifan, W.; Yang, W.; Jiawei, Z. Spatial-temporal pattern changes and its driving factors of grain yield in Henan Province. J. Henan Agric. Univ. 2021, 55, 1–13. [Google Scholar]
  15. Yu, L.; Yansui, L.; Liying, G. Evolvement of Spatial Pattern of Per Capita Grain Possession at County Level in the Area along BohaiRim of China. Sci. Geogr. Sin. 2011, 31, 102–109. [Google Scholar]
  16. Xiaoyang, L.; Xinguang, Z.; Yuge, Z.; Songtao, J.; Jingfeng, B. Spatial-temporal changes analysis of grain production in central plains economic zone in recent 30 years. J. Nanyang Norm. Univ. 2016, 15, 53–57. [Google Scholar]
  17. Zhou, C.; Zhang, R.; Ning, X.; Zheng, Z. Spatial-Temporal Characteristics in Grain Production and Its Influencing Factors in the Huang-Huai-Hai Plain from 1995 to 2018. Int J. Environ. Res. Public Health 2020, 17, 9193. [Google Scholar] [CrossRef]
  18. Jingfen, W.; Ding, L.; Xiaojie, L.; Renrong, X.; Yulin, Q. The spatio-temporal evolving pattern and the influencing factors of grain production in the Yangtze River Economic Belt. Res. Agric. Mod. 2021, 42, 407–417. [Google Scholar]
  19. Davoudi, S.; Stead, D. Urban-rural relationships: An introduction and brief history. Built Environ. 2002, 28, 269–277. [Google Scholar]
  20. Li, Y. Urban–rural interaction patterns and dynamic land use: Implications for urban–rural integration in China. Reg. Environ. Chang. 2012, 12, 803–812. [Google Scholar] [CrossRef]
  21. Zhizhong, N.; Qi, Z. Urban and rural element mobility and allocation optimization under the background of rural priority development. Geogr. Res. 2020, 39, 2201–2213. [Google Scholar]
  22. Oliveira, M.; Gama, J. An overview of social network analysis. Wires Data Min. Knowl. 2012, 2, 99–115. [Google Scholar] [CrossRef] [Green Version]
  23. Trezzini, B. Concepts and methods in social network analysis: An overview of recent developments. Z. Soziol. 1998, 27, 378. [Google Scholar] [CrossRef] [Green Version]
  24. Linqing, L.; Xiaofei, Y. Research on the Formation Mechanism of Clustered Structure with Multi-Hubs of the International Cereal Trade Network. J. Huazhong Agric. Univ. 2021, 4, 47–59. [Google Scholar]
  25. Changle, N.; Haining, J.; Jian, D. Spatial Pattern Evolution of Global Grain Trade Network Since the 21st Century. Econ. Geogr. 2021, 41, 119–127. [Google Scholar]
  26. Duan, J.; Nie, C.; Wang, Y.; Yan, D.; Xiong, W. Research on Global Grain Trade Network Pattern and Its Driving Factors. Sustainability 2021, 14, 245. [Google Scholar] [CrossRef]
  27. Zhiliang, D.; Qiaoran, Y. Analysis on the Robustness of International Grain Trade Network. Contemp. Econ. Manag. 2021, 43, 73–78. [Google Scholar]
  28. Ying, F.; Mengyang, H.; Shunbo, Y. Structural characteristics and formation mechanism of spatial correlation network of grain production in China. Acta Geogr. Sin. 2020, 75, 2380–2395. [Google Scholar]
  29. Costabile, L.T.; Vendrametto, O.; Neto, G.C.D.; Neto, M.M.; Shibuya, M.K. Social Network Analysis on Grain Production in the Brazilian Scenario. Advances in Production Management Systems: Innovative Production Management towards Sustainable Growth. In Proceedings of the IFIP International Conference on Advances in Production Management Systems, Austin, TX, USA, 1–5 September 2015; Volume 459, pp. 36–44. [Google Scholar]
  30. Shi, Q.; Lin, Y.; Zhang, E.; Yan, H.; Zhan, J. Impacts of Cultivated Land Reclamation on the Climate and Grain Production in Northeast China in the Future 30 Years. Adv. Meteorol. 2013, 1, 153–156. [Google Scholar] [CrossRef] [Green Version]
  31. Ying, N.; Ying, X. Changes and influencing factors of grain production capacity in Northeast China. Econ. Rev. J. 2016, 4, 70–76. [Google Scholar]
  32. Scott, J.; Carrington, P.J. The SAGE Handbook of Social Network Analysis; SAGE: London, UK; Thousand Oaks, CA, USA, 2011. [Google Scholar]
  33. White, H.C.; Boorman, S.A.; Breiger, R.L. Social-Structure from Multiple Networks.1. Blockmodels of Roles and Positions. Am. J. Sociol. 1976, 81, 730–780. [Google Scholar] [CrossRef]
  34. Hongfu, Z.; Shenglu, Z.; Shaohua, W.; Guanghui, Z.; Sheng, H.; Li, L. Temporal and Spatial Variation of Grain Production in Jiangsu Province and Its Influencing Factors. J. Nat. Resour. 2011, 26, 319–327. [Google Scholar]
  35. Changsheng, Y.; Chuanmin, Z. Regional Pattern Changes of County Grain Production in Jiangxi Province. Res. Agric. Mod. 2011, 32, 315–319. [Google Scholar]
  36. Bingquan, L.; Renxu, G.; Junsong, W.; Xuecheng, B. From Agglomeration Externalities to Network Externalities of Crossing Borders: Frontier Progress of Agglomeration Economics. Urban Dev. Stud. 2018, 25, 82–89. [Google Scholar]
  37. Derudder, B.; Taylor, P.J.; Witlox, F.; Catalano, G. Hierarchical tendencies and regional patterns in the world city network: A global urban analysis of 234 cities. Reg. Stud. 2003, 37, 875–886. [Google Scholar] [CrossRef]
  38. Taylor, P.J.; Hoyler, M.; Verbruggen, R. External Urban Relational Process: Introducing Central Flow Theory to Complement Central Place Theory. Urban Stud. 2010, 47, 2803–2818. [Google Scholar] [CrossRef] [Green Version]
  39. Castells, M. Globalisation, Networking, Urbanisation: Reflections on the Spatial Dynamics of the Information Age. Urban Stud. 2010, 47, 2737–2745. [Google Scholar] [CrossRef]
  40. Jie, L.; Qingshan, Y.; Xiaojun2, J.; Jian, L. Relationship Type and Regional Pattern Between Grain Production and Economic Development in Northeast China. Econ. Geogr. 2021, 41, 39–48+57. [Google Scholar]
  41. Capello, R. The city network paradigm: Measuring urban network externalities. Urban Stud. 2000, 37, 1925–1945. [Google Scholar] [CrossRef]
  42. Jun, L.; Wen-Feng, M. The Rise of Urban Network Externalities: A New Mechanism for the High-quality Integrated Development of Regional Economy. Economist 2020, 12, 62–70. [Google Scholar]
  43. Huang, Y.; Hong, T.; Ma, T. Urban network externalities, agglomeration economies and urban economic growth. Cities 2020, 107, 102882. [Google Scholar] [CrossRef]
  44. Qinan, Z.; Fanfan, Z.; Qiang, M.; Guoyong, W. Spatial spillover networks and enhancement paths of grain production efficiency in China. Acta Geogr. Sin. 2022, 77, 996–1008. [Google Scholar]
  45. Beaverstock, J.V.; Smith, R.G.; Taylor, P.J. World-city network: A new metageography? Ann. Assoc. Am. Geogr. 2019, 90, 123–134. [Google Scholar] [CrossRef] [Green Version]
  46. Daqian, L.; Shiwei, L.; Xin, W. Spatial-Temporal Evolution of Grain Production Structure in Northeast China. Econ. Geogr. 2019, 39, 163–170. [Google Scholar]
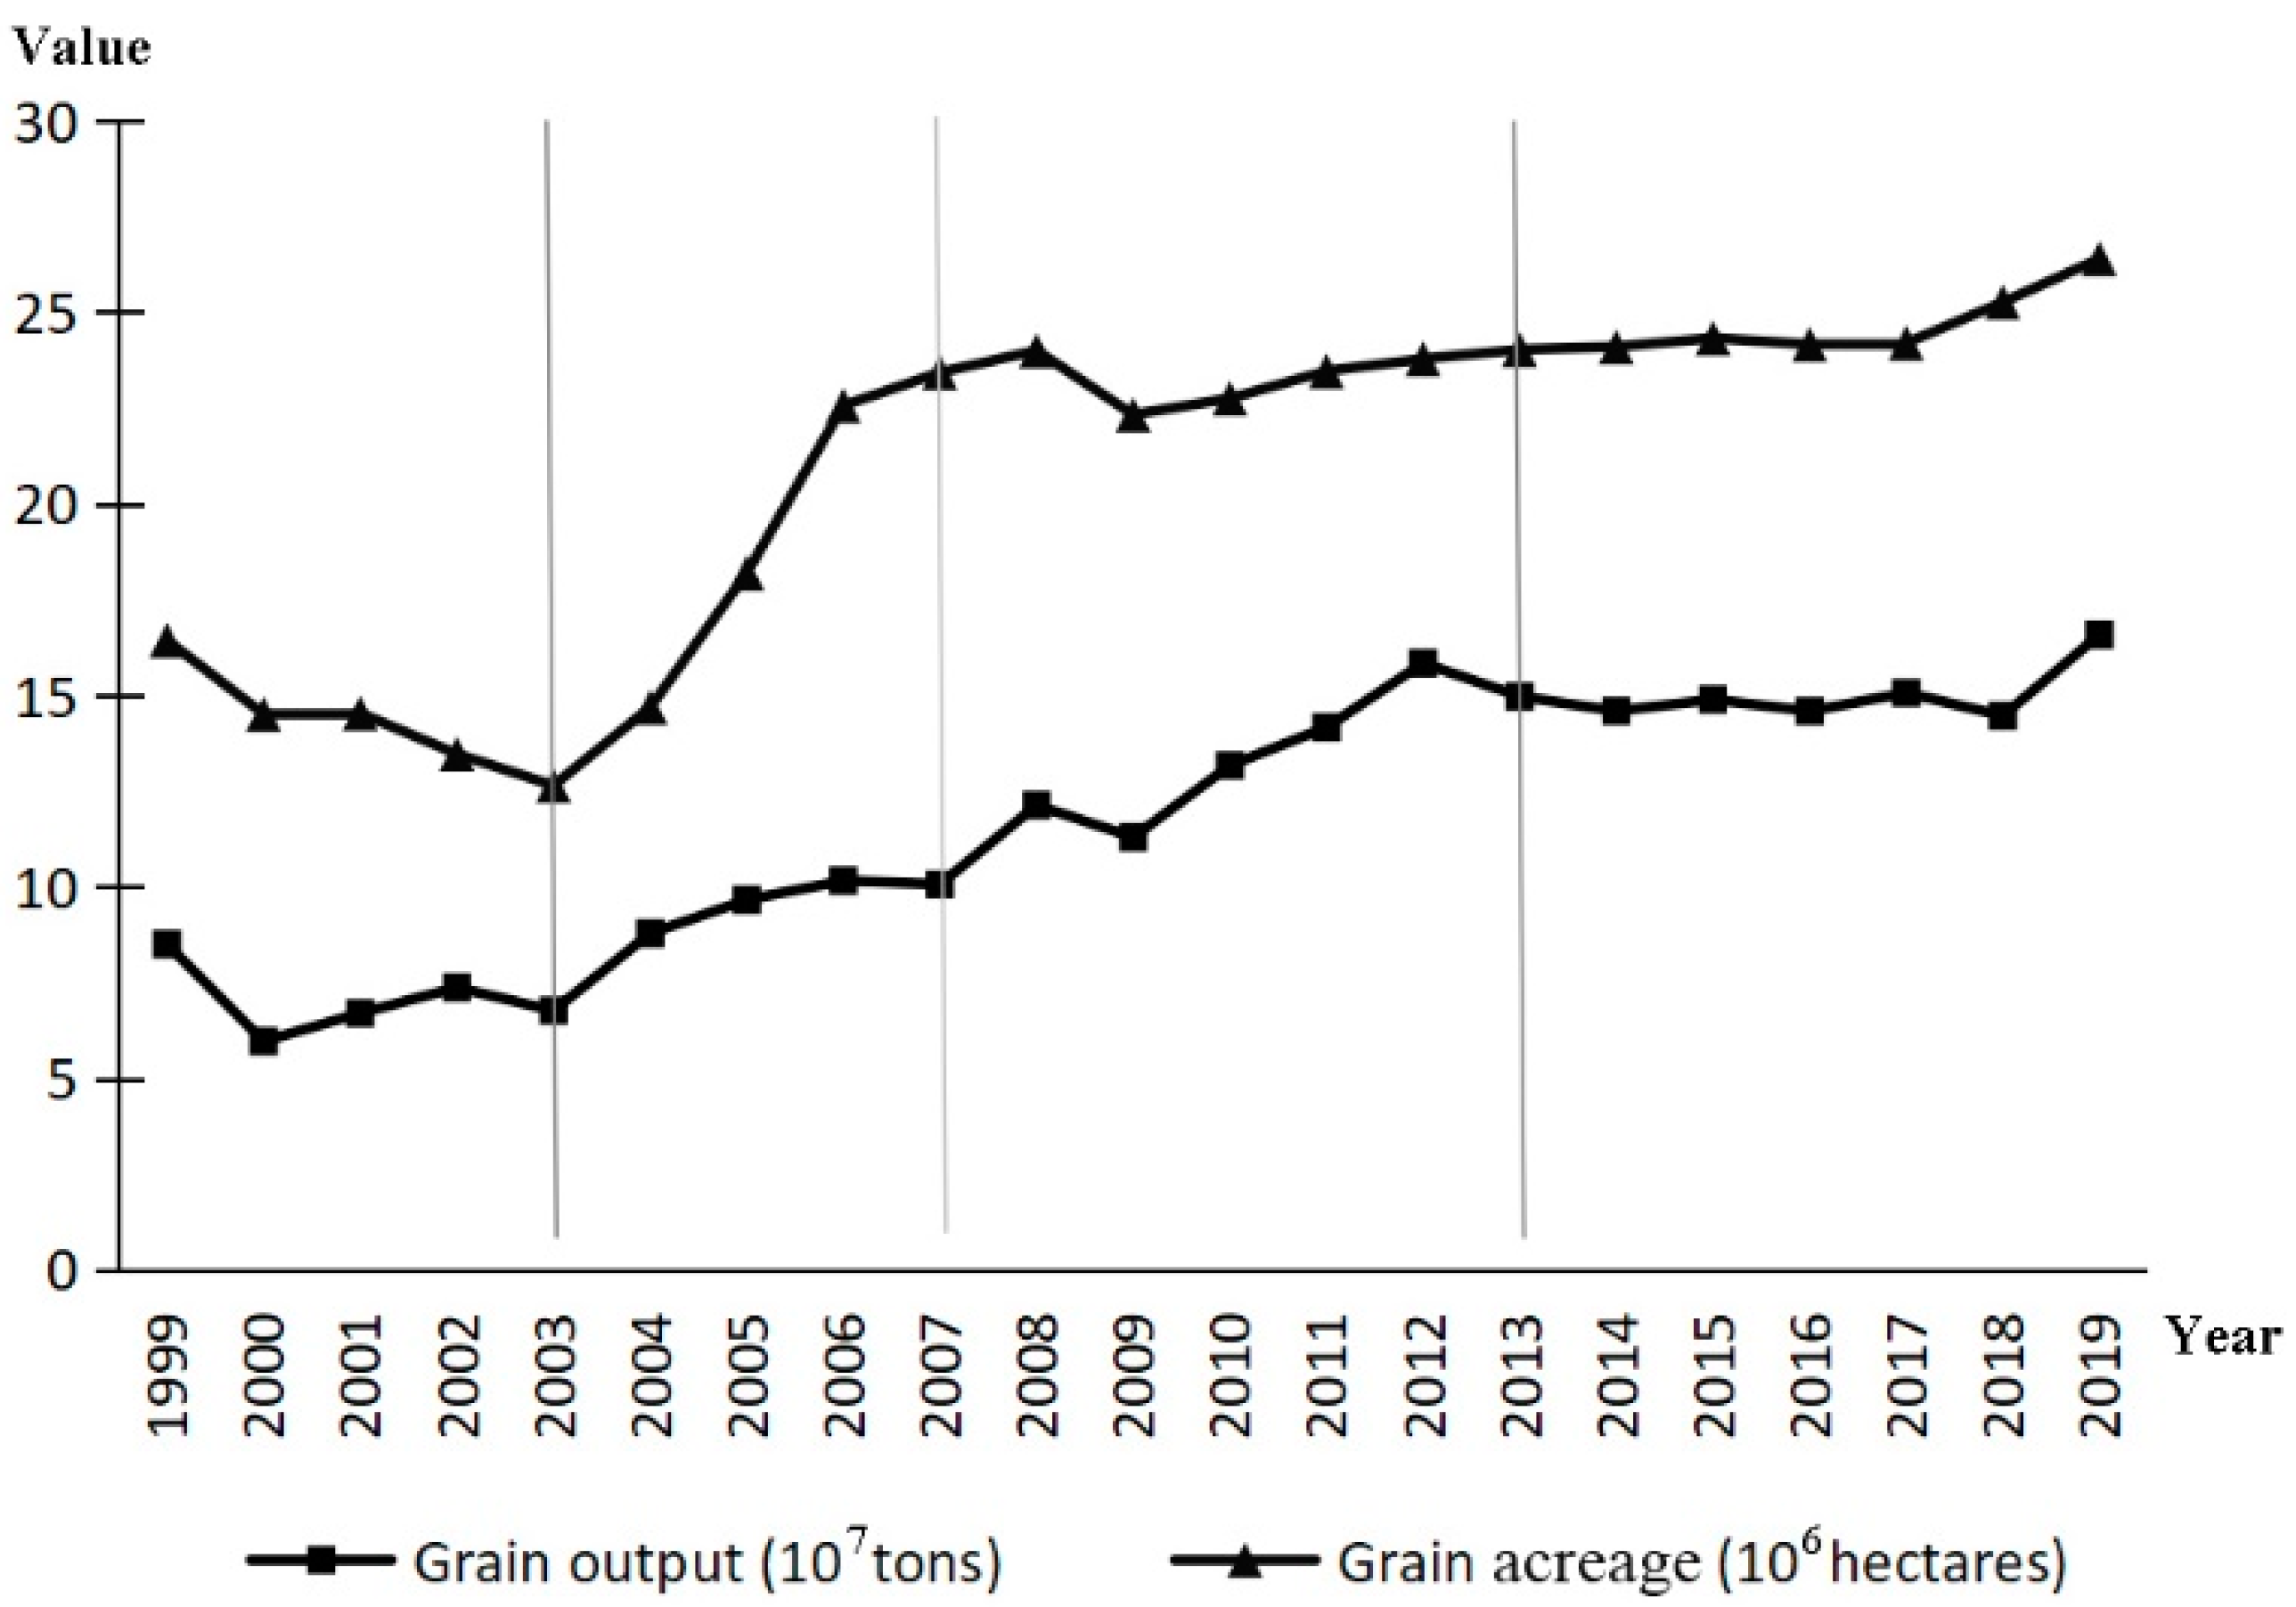
Figure 1. Location map of Northeast China.
Sustainability 14 08849 g001
Figure 2. Grain yield and grain acreage in Northeast China from 1999 to 2019.
Sustainability 14 08849 g002
Figure 3. The density of the network and the number of network relations of grain production in Northeast China.
Sustainability 14 08849 g003
Figure 4. The efficiency of spatial correlation network of grain production in Northeast China.
Sustainability 14 08849 g004
Figure 5. Temporal and spatial distribution of out-degree centrality in Northeast China.
Sustainability 14 08849 g005
Figure 6. Temporal and spatial distribution of in-degree centrality in Northeast China.
Sustainability 14 08849 g006
Figure 7. Temporal and spatial distribution of betweenness centrality in Northeast China.
Sustainability 14 08849 g007
Figure 8. Relation between four blocks of grain production in Northeast China.
Sustainability 14 08849 g008
Table 1. Stage characteristics of grain production development in Northeast China from 1999 to 2019.
YearStageCharacteristic
1999–2003Fluctuating periods of decline in grain production and grain acreageGrain yield and grain acreage showed a downward trend, and the decline rate of grain acreage is higher than that of grain yield.
2003–2012Fluctuating periods of growth in grain production and grain acreageIt can be divided into two stages. From 2003 to 2007, the grain yield and grain acreage increased rapidly, and the growth rate of grain acreage was higher than that of grain yield. From 2007 to 2012, the sown area of grain was relatively stable, and the growth rate of grain output was obvious.
2012–2019Periods of flat changes in grain production and grain acreage Grain yield and grain acreage were at relatively stable levels.
Table 2. Degree centrality (DC) of spatial correlation network of grain production in Northeast China.
Ranking1999DC2003DC2012DC2019DC
1Tieling87.179Tongliao92.307Changchun87.179Suihua92.308
2Tongliao84.615Changchun89.743Tieling87.179Tieling89.743
3Shenyang84.615Tieling87.179Tongliao84.616Harbin87.179
4Songyuan79.487Shenyang87.179Shenyang84.615Tongliao82.052
5Changchun79.487Jilin84.616Suihua82.051Shenyang82.051
6Harbin79.487Harbin82.051Siping82.051Changchun82.051
7Siping71.795Songyuan79.487Harbin82.051Siping82.051
8Fuxin69.231 Qiqihar79.487Songyuan76.923Songyuan76.923
9Anshan69.231Suihua74.359Jilin74.359Qiqihar74.359
10 Qiqihar66.667Siping74.359Qiqihar71.795Jilin69.231
11Jilin66.666Anshan71.795Anshan64.192Fuxin64.192
12Mudanjiang64.102Daqing69.231Fuxin64.192Heihe64.102
13Liaoyang61.538Fuxin66.666Daqing61.628Mudanjiang64.102
14Chifeng58.974Baicheng64.192Heihe61.538Anshan64.102
15Jinzhou58.974Chifeng61.539Mudanjiang61.538Daqing61.628
16Daqing58.974Liaoyang61.538Liaoyang61.538Baicheng61.628
17Baicheng58.974Dandong58.975Baicheng61.538Jinzhou58.974
18Dandong56.41Tonghua58.974Dandong58.975Jiamusi58.974
19Tonghua56.41Jinzhou58.974Tonghua58.974Dandong56.41
20Heihe53.847Mudanjiang56.41Jinzhou58.974Xinganmeng56.41
21Chaoyang53.846Xinganmeng56.41Jiamusi58.974Liaoyang56.41
22Panjin53.846Jiamusi53.846Chifeng56.41Tonghua53.846
23Yingkou51.282Panjin53.846Xinganmeng53.846Shuangyashan53.846
24Jiamusi51.282Huludao51.282Panjin53.846Chifeng51.282
25Xinganmeng48.718Yingkou51.282Yanbian51.282Panjin51.282
26Liaoyuan48.718Liaoyuan48.718Huludao48.718Yanbian48.718
27Dalian48.718Chaoyang48.718Fushun48.718Yingkou48.718
28Fushun46.154Fushun46.154Chaoyang46.154Fushun48.718
29Huludao43.59Dalian46.154Dalian46.154Hegang48.718
30Hegang43.59Yanbian46.154Yichun46.154Chaoyang48.718
31Benxi41.026Yichun46.154Yingkou46.154Liaoyuan46.154
32Shuangyashan41.026Jixi46.154Liaoyuan46.154Yichun46.154
33Suihua41.026Benxi41.026Hulunbeir43.589Huludao43.59
34Yichun41.026Hulunbeir41.026Shuangyashan41.026Dalian43.59
35Baishan41.025Shuangyashan41.026Qitaihe41.026Hulunbeir43.589
36Yanbian41.025Qitaihe41.026Jixi41.026Jixi41.026
37Hulunbeir38.461Heihe41.025Hegang41.026Qitaihe38.462
38Jixi35.898Hegang35.898Baishan41.025Baishan38.461
39Daxinganling33.333Baishan35.897Benxi38.462Benxi35.898
40Qitaihe30.77Daxinganling28.205Daxinganling33.333Daxinganling33.333
Table 3. Network spillover effects of grain production in Northeast China in 2019.
Block Number of Received Relations within the Block Outside the Block Number of Sent Relations within the Block Outside the Block The Expected Proportion of Internal RelationsThe Actual Proportion of Internal RelationsBlock Characteristic
Block I4331434728.20547.778net spillover block
Block II7276724923.07759.504main beneficial block
Block III2227223122.82034.921broker block
Block IV5729572628.20568.675bidirectional spillover block
Table 4. Density matrix and image matrix of each block of grain production spatial correlation network in Northeast China in 2019.
Density MatrixImage Matrix
Block IBlock IIBlock IIIBlock IVBlock IBlock IIBlock IIIBlock IV
Block I0.7050.3580.0560.0001100
Block II0.2330.8000.2000.0750100
Block III0.0420.3000.7330.2780110
Block IV0.0000.1250.2920.7420011
Publisher’s Note: MDPI stays neutral with regard to jurisdictional claims in published maps and institutional affiliations.

