
An Assessment of Social Resilience against Natural Hazards through Multi-Criteria Decision Making in Geographical Setting: A Case Study of Sarpol-e Zahab, Iran

 ,
,  ,
,  , , and
Abstract
:1. Introduction
2. Literature Review
3. Materials and Methods
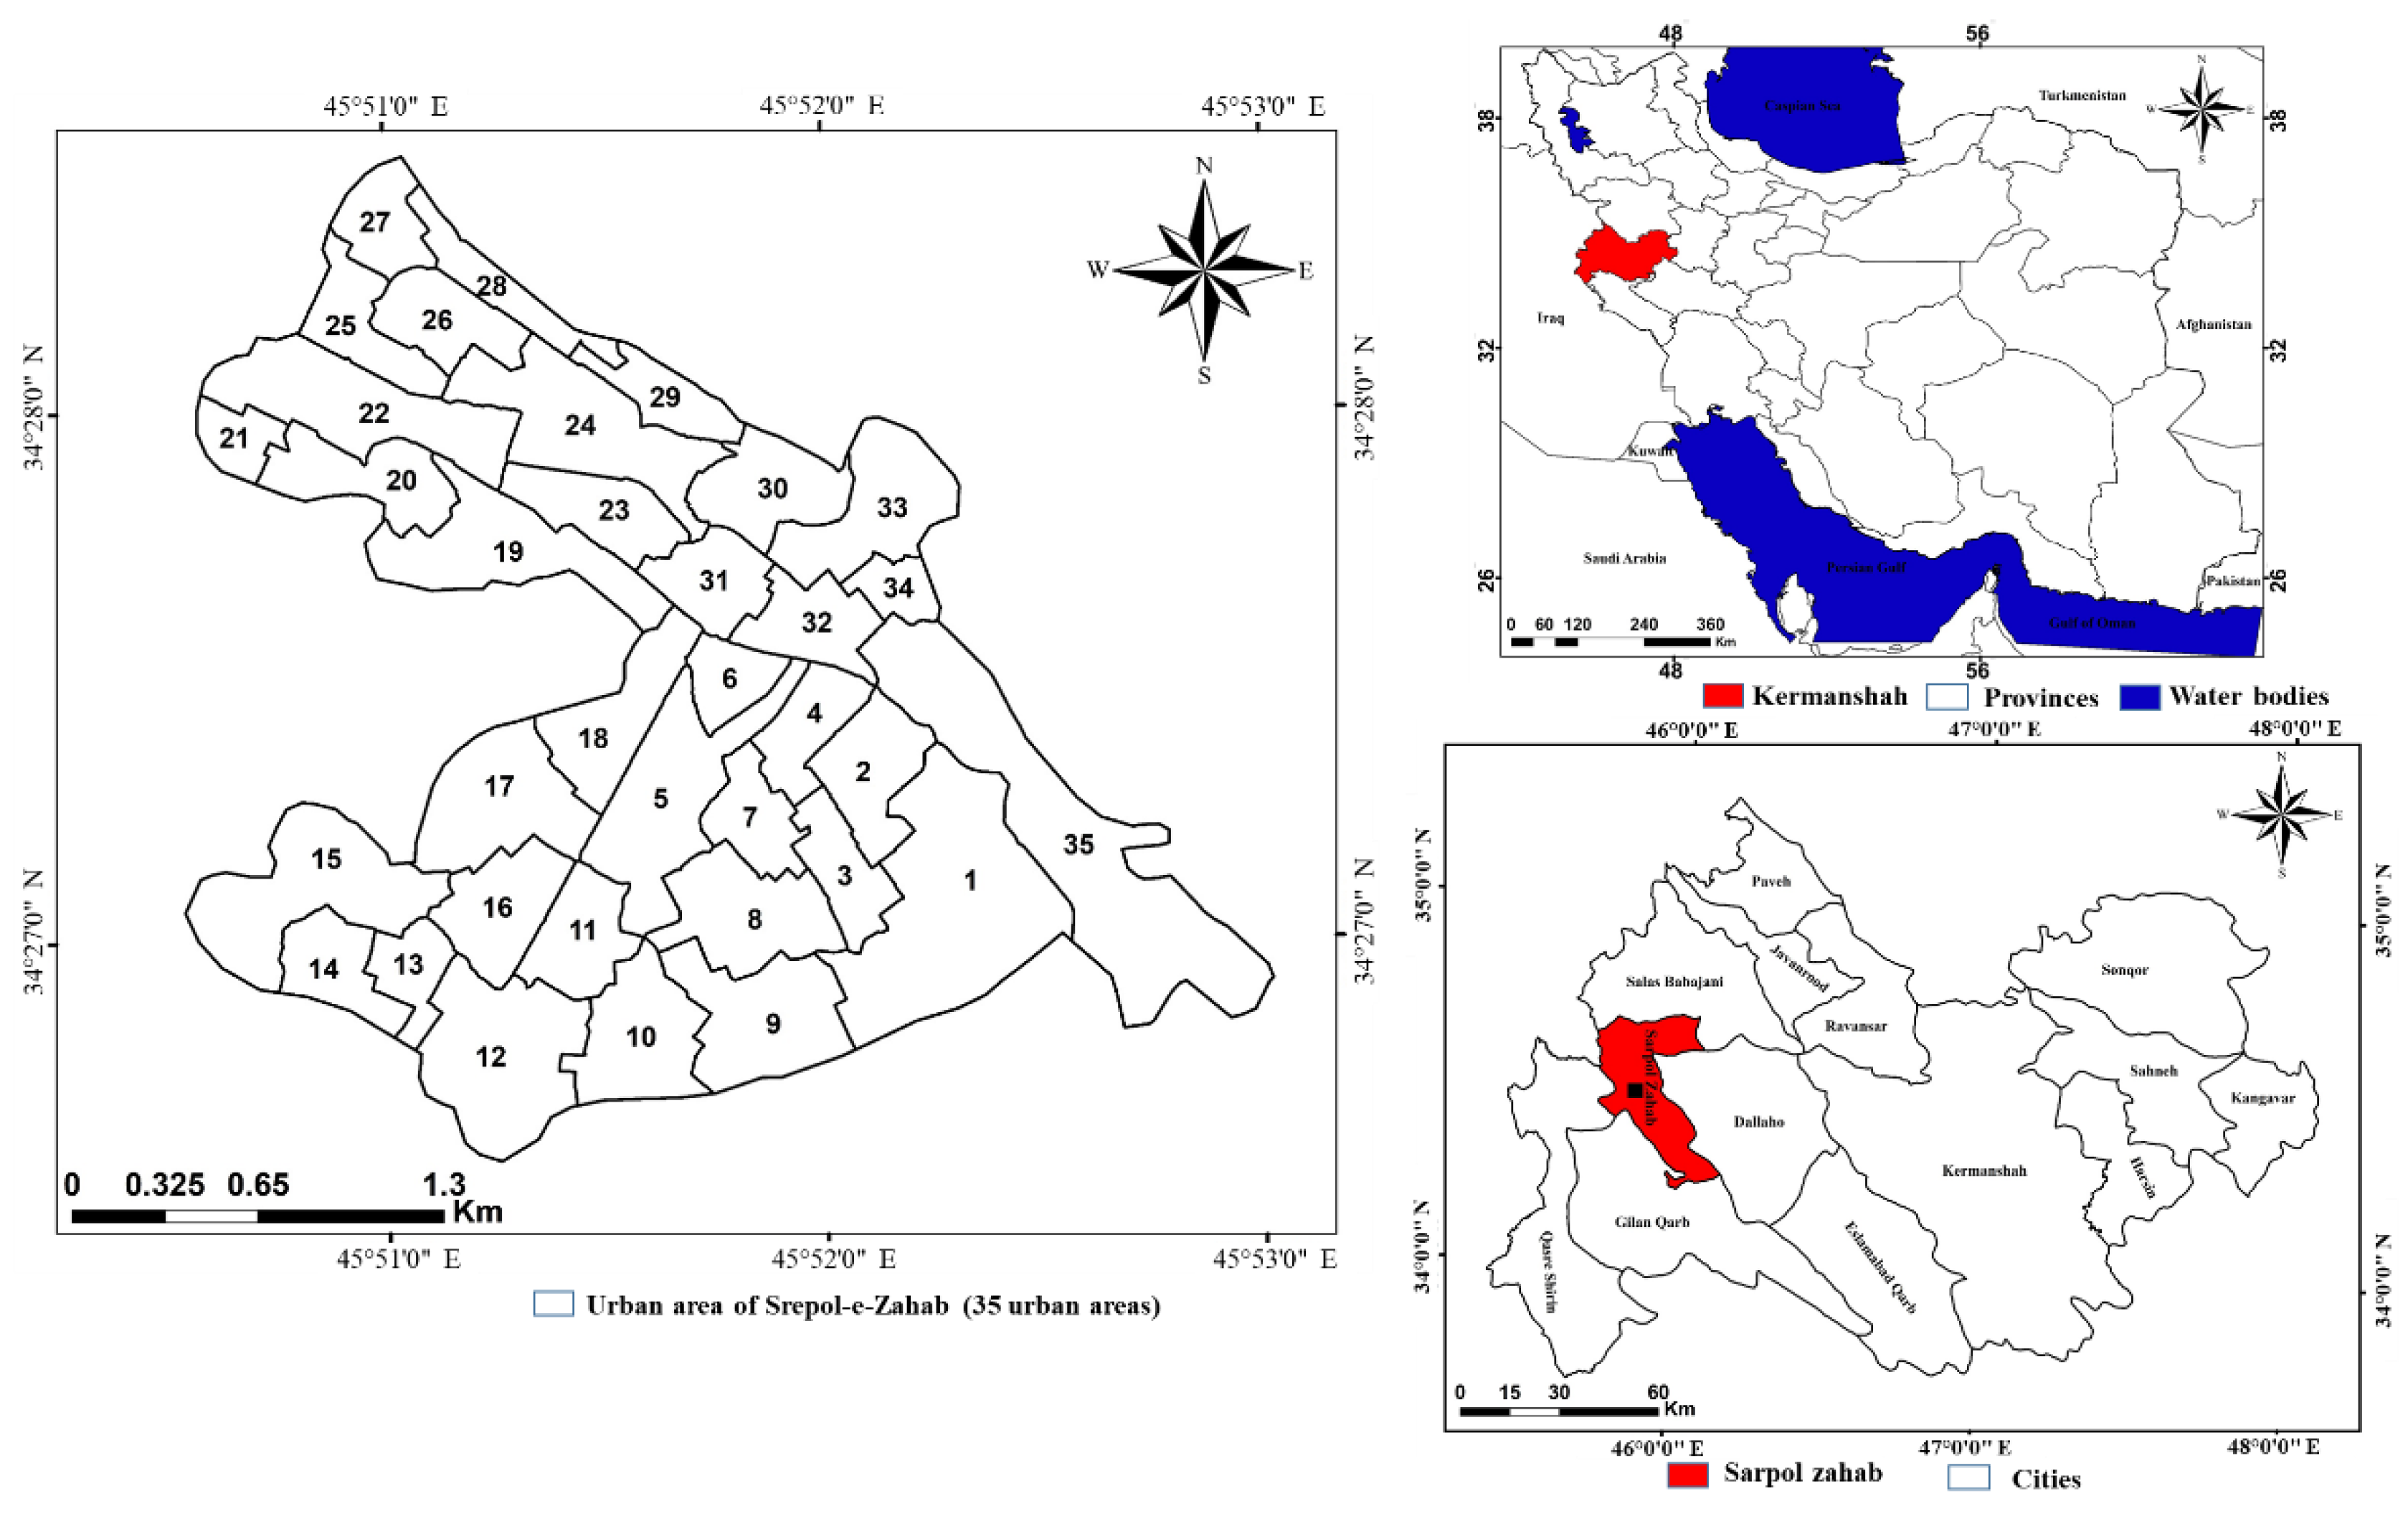
3.1. Study Area
3.2. Data Collection
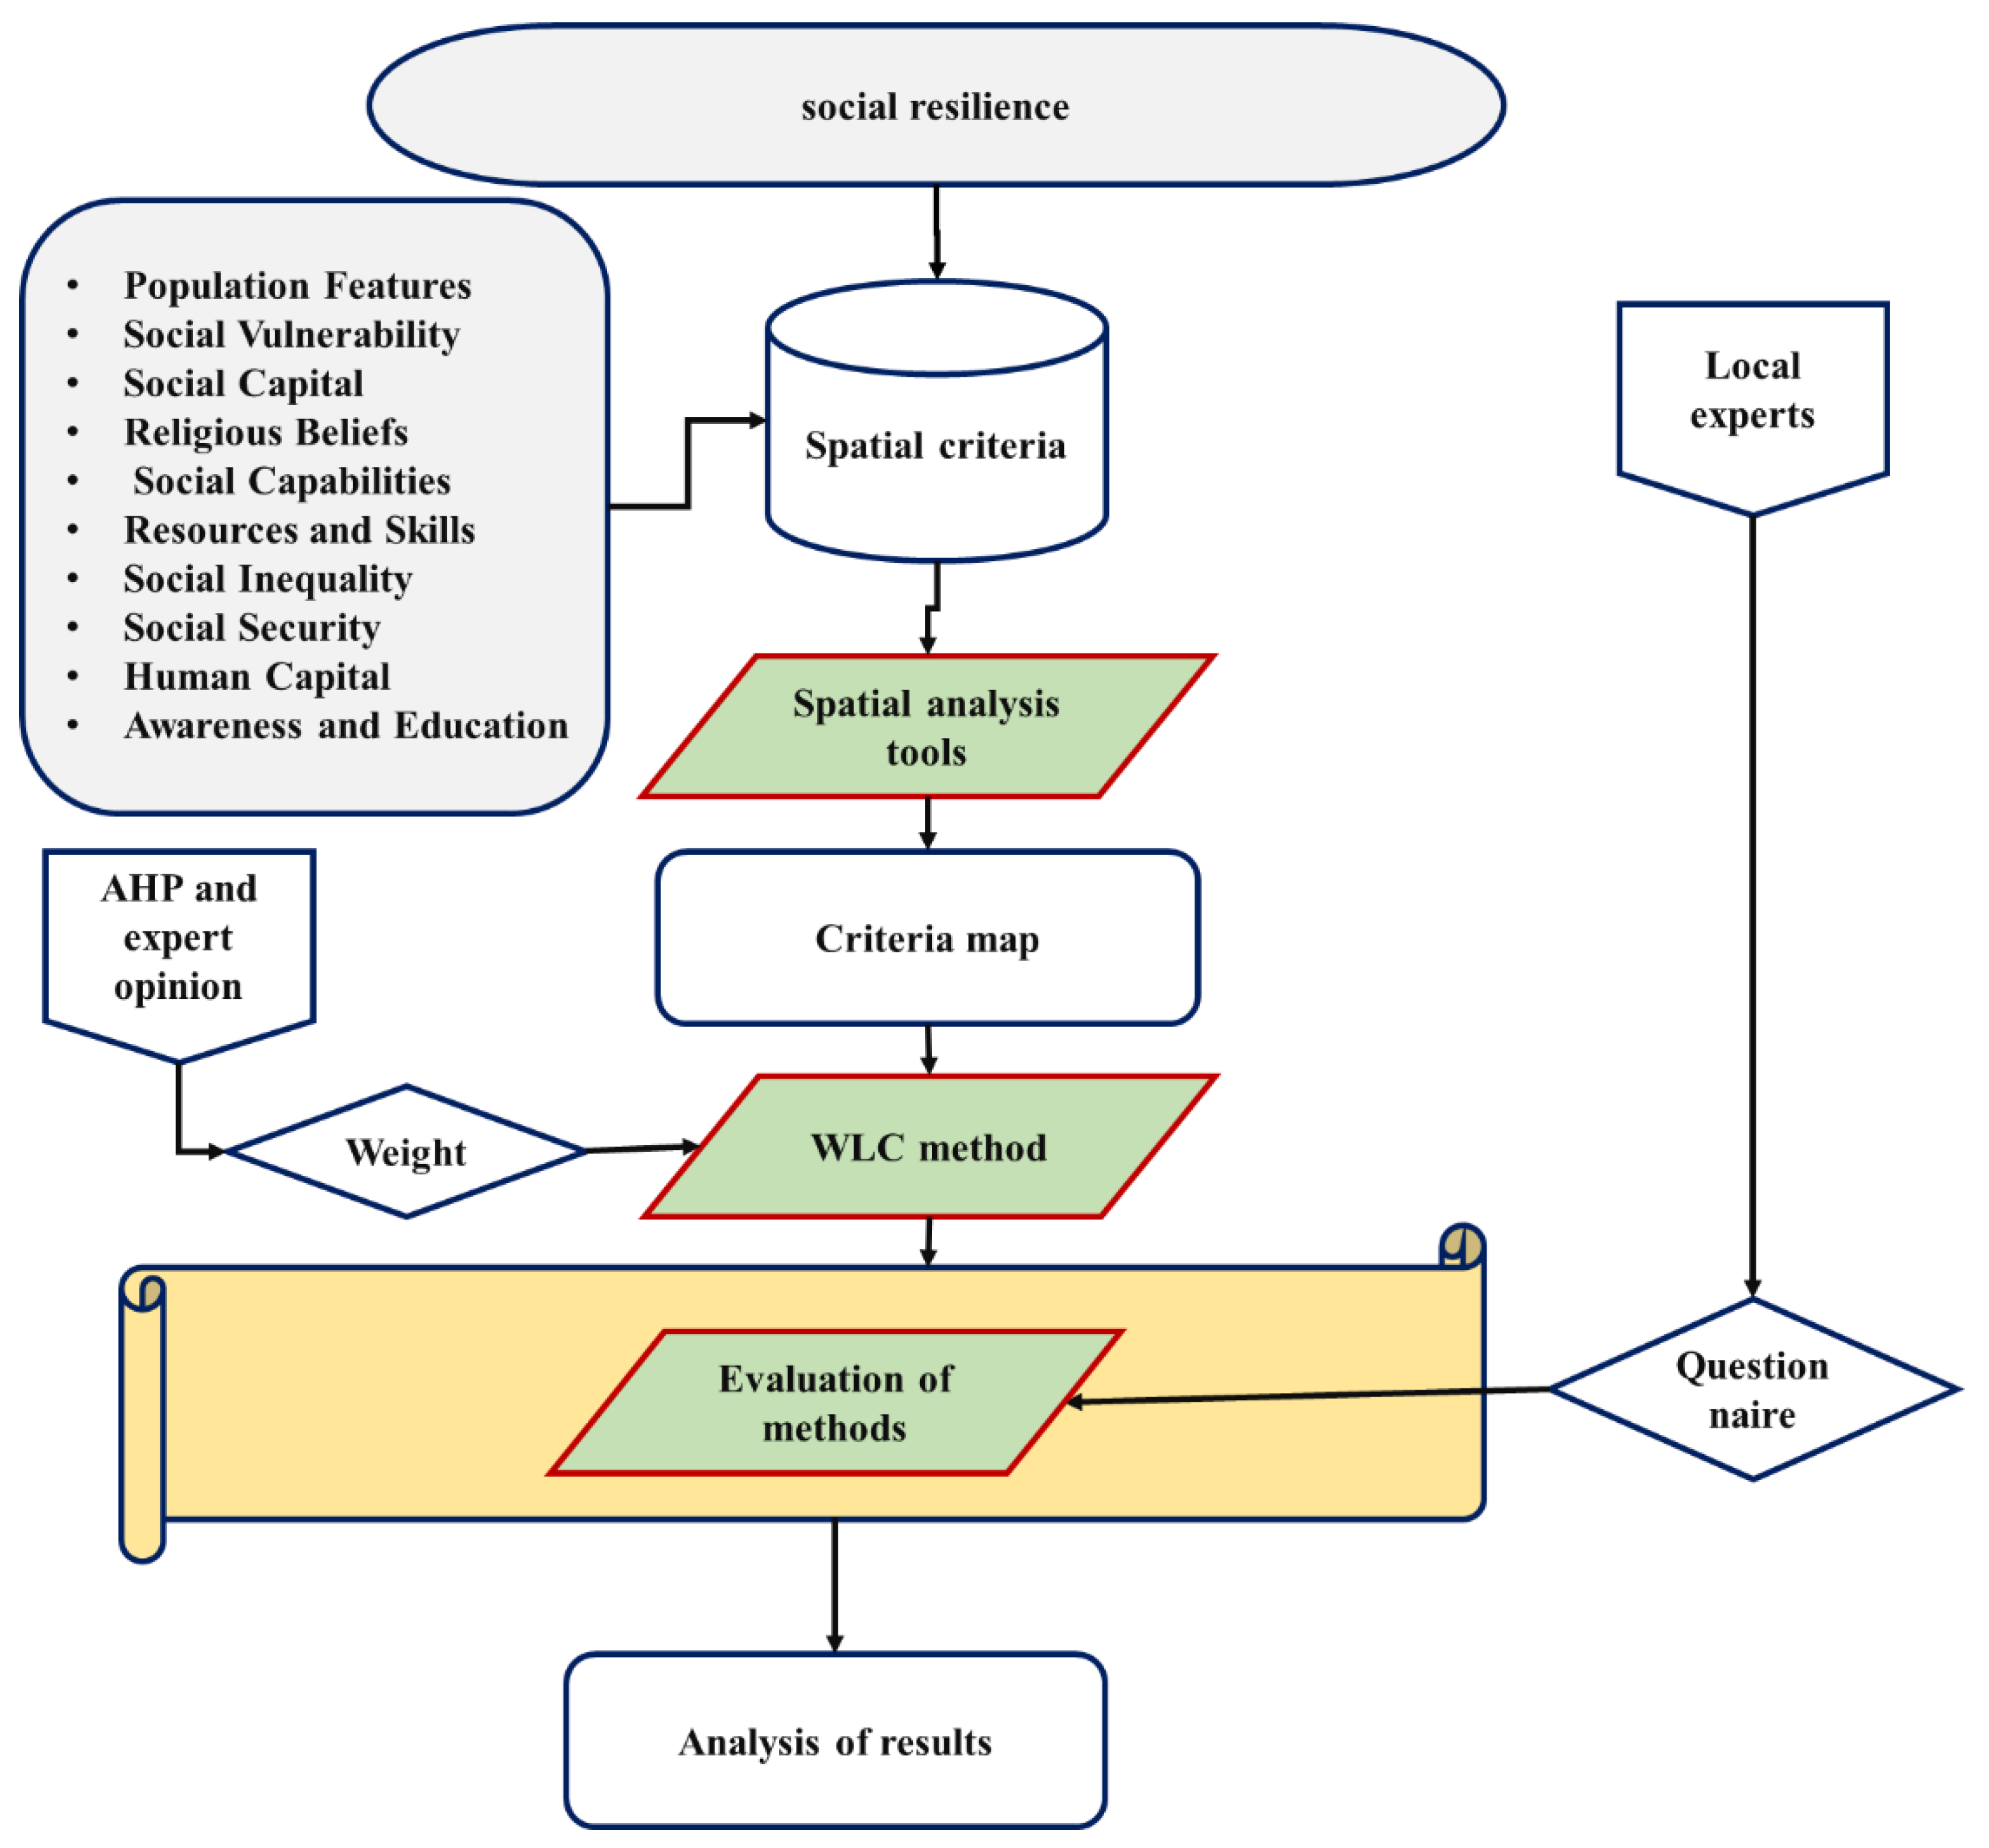
3.3. Overall Method
3.3.1. Variables Selection and Standardization
3.3.2. AHP Method
3.3.3. Weighted Linear Combination (WLC) Method
3.3.4. Evaluation of the Accuracy of the Proposed Model
4. Results
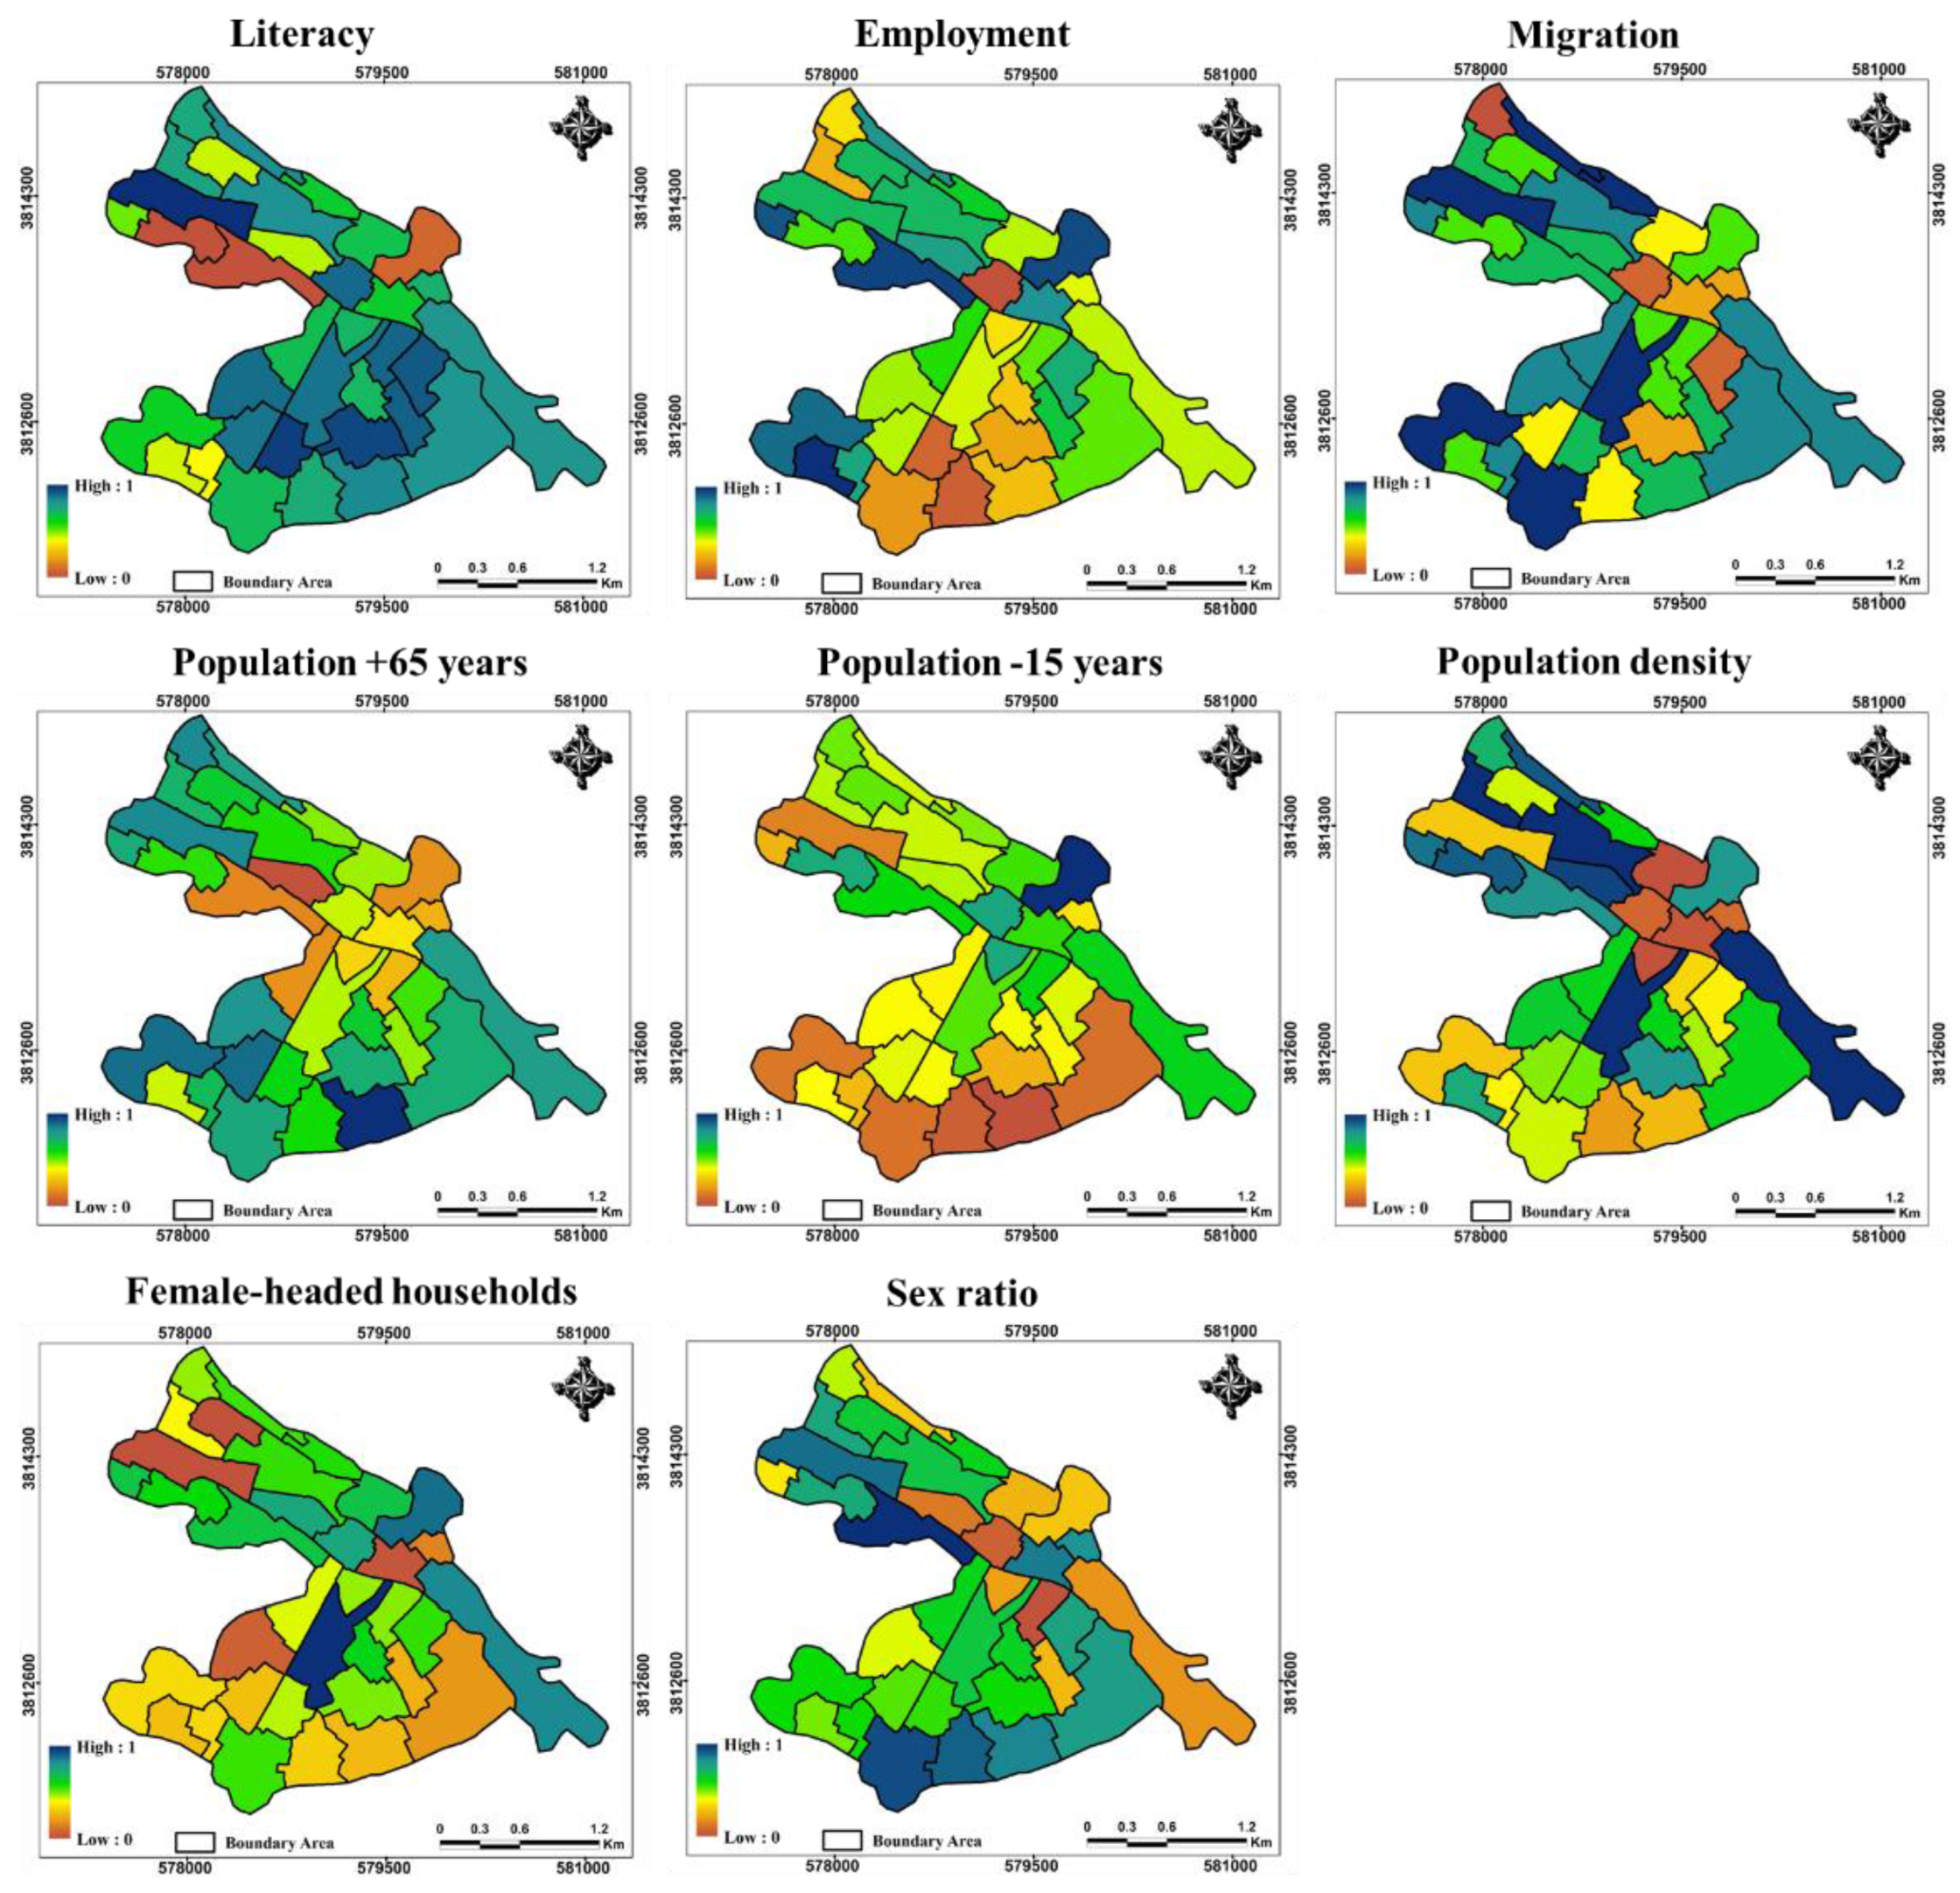
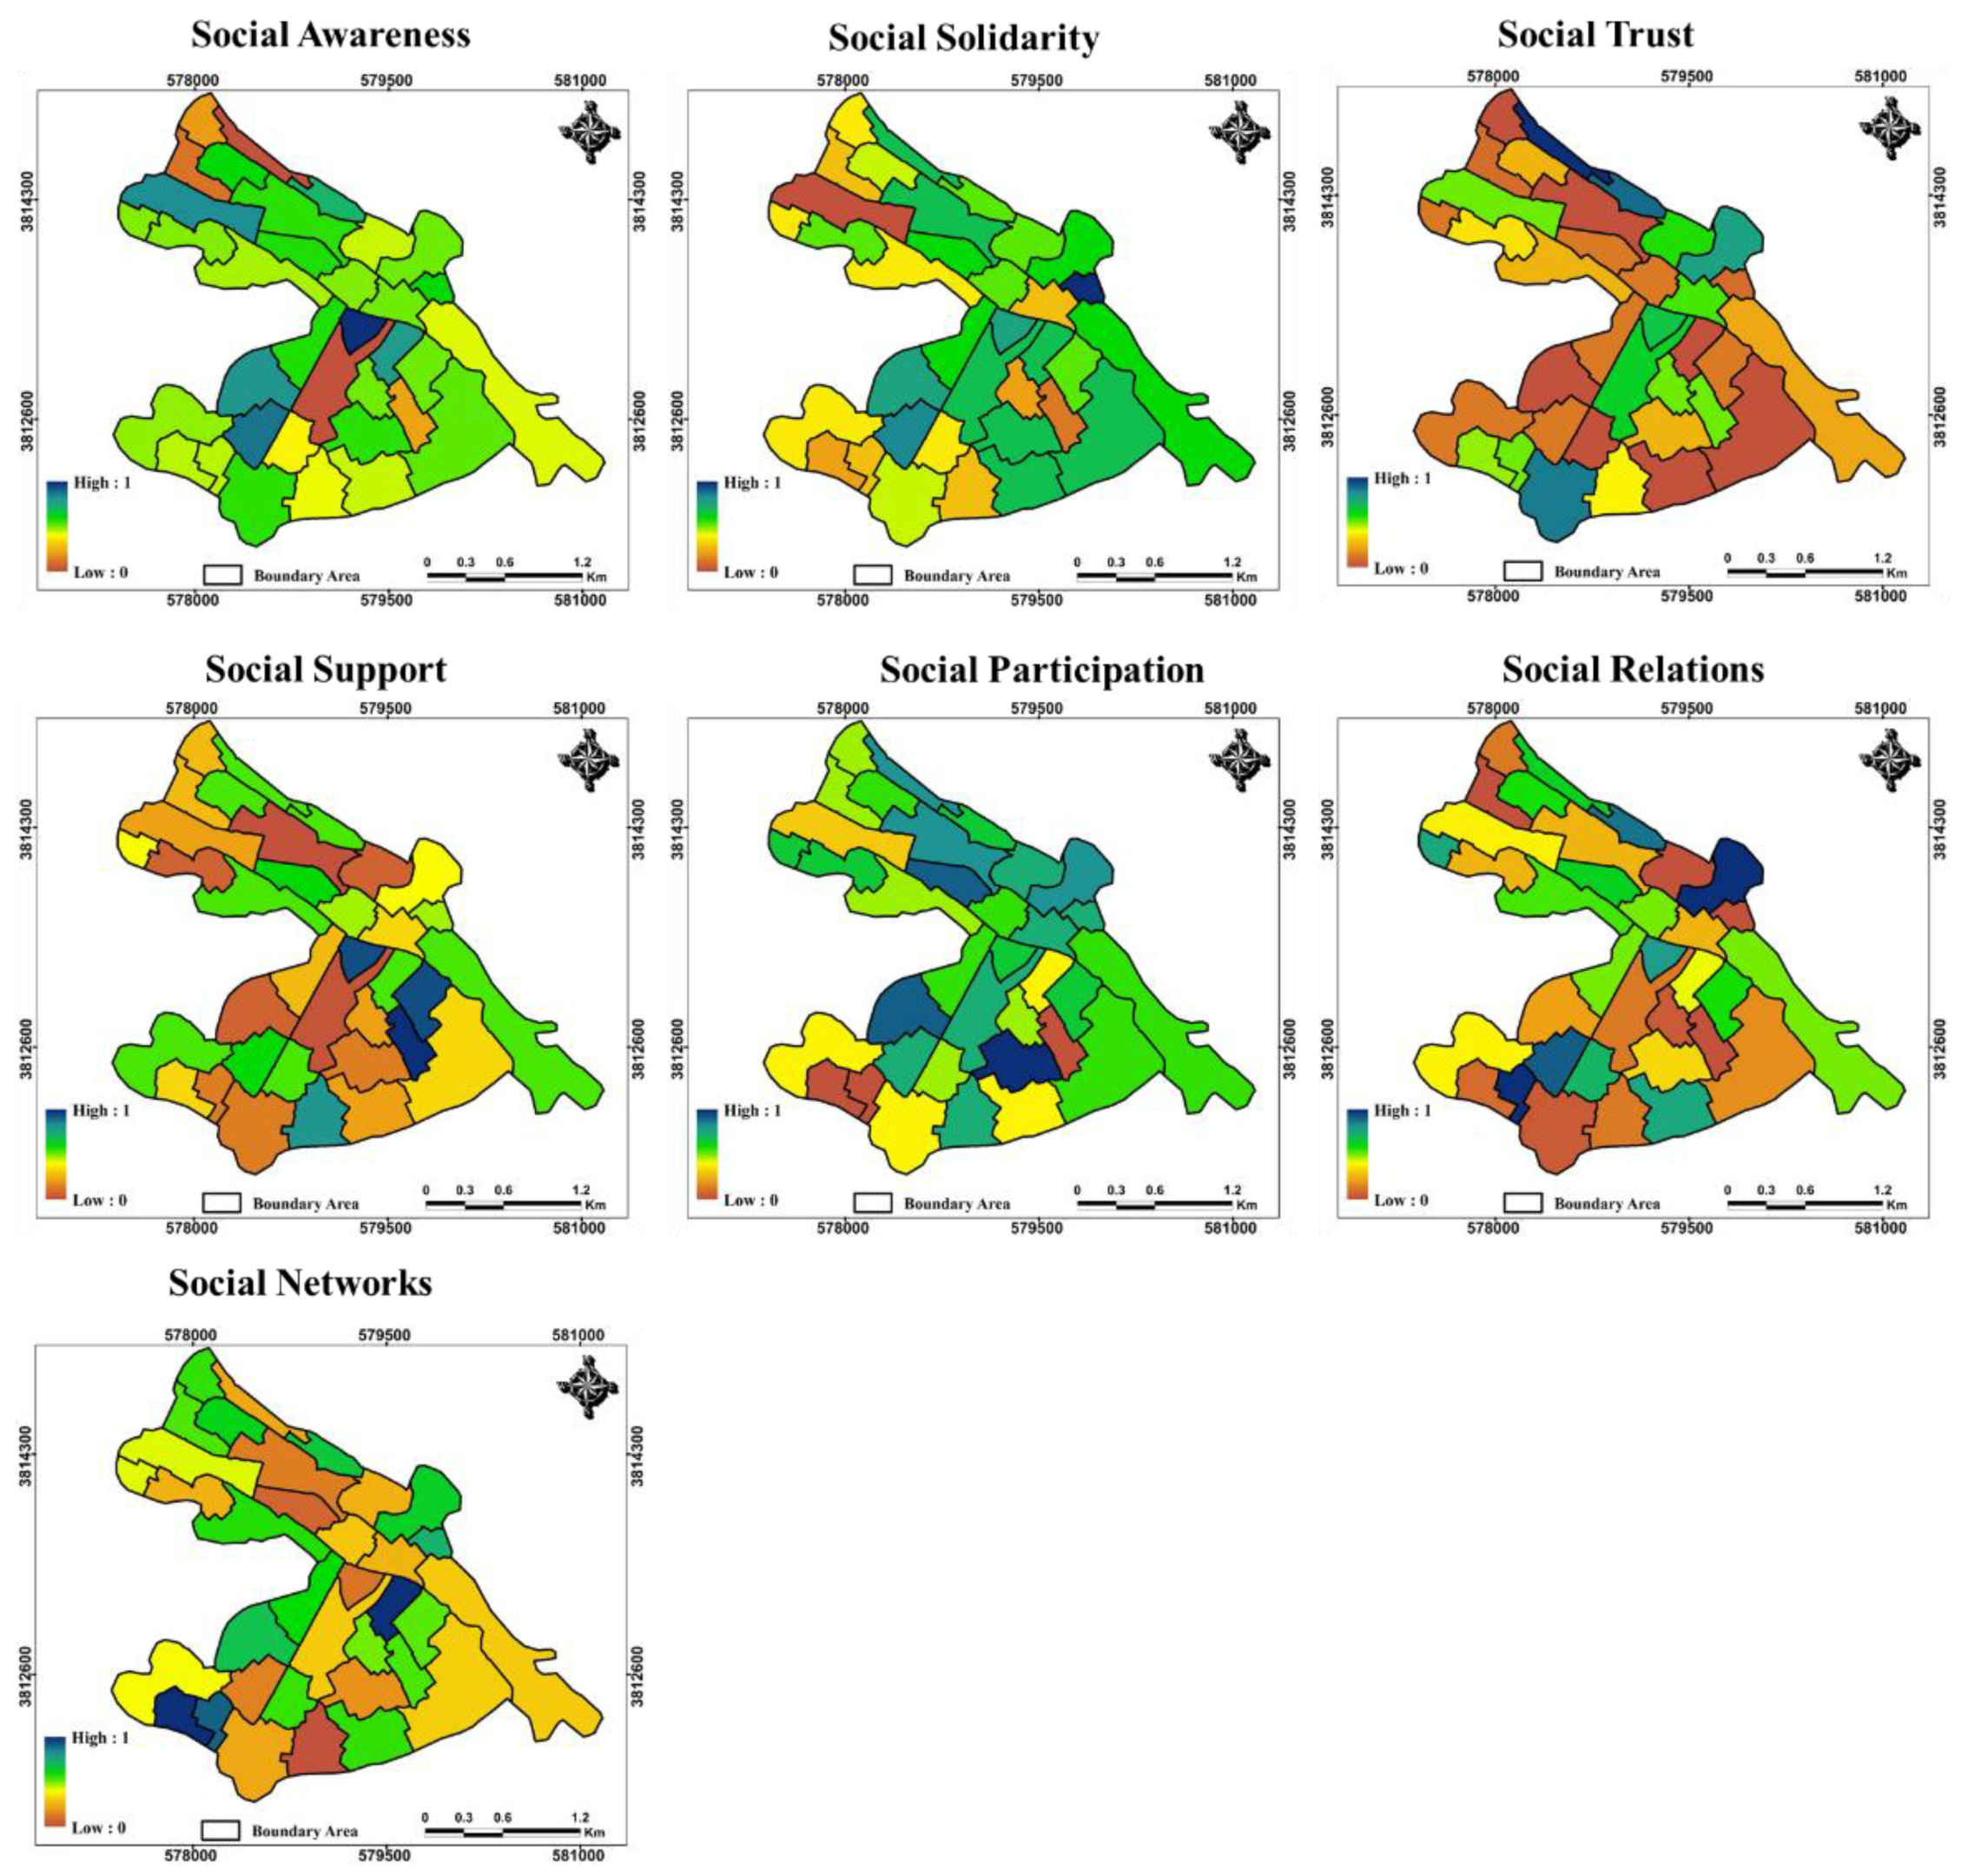
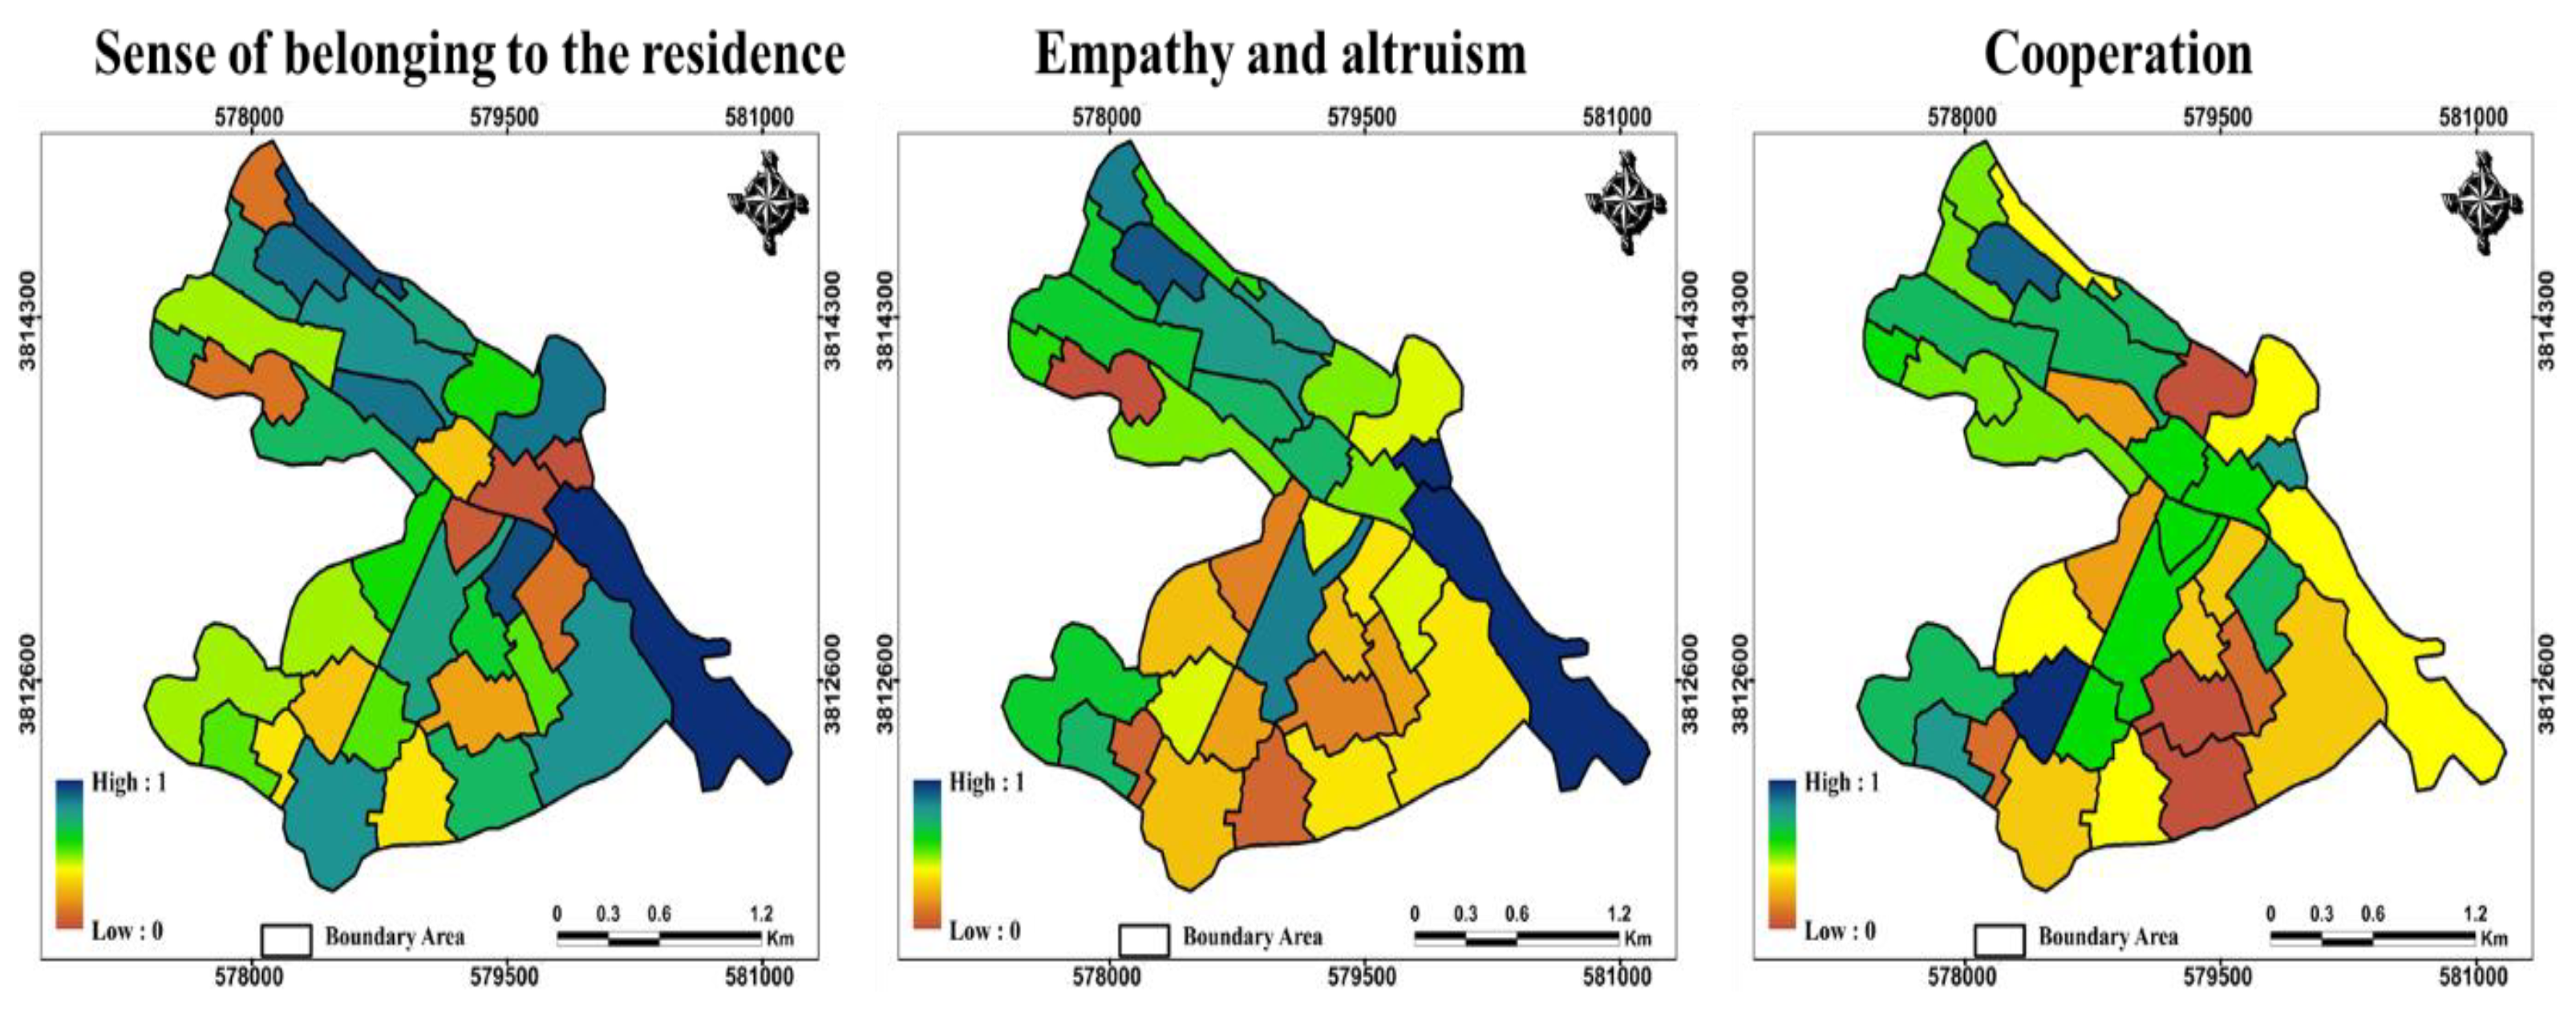
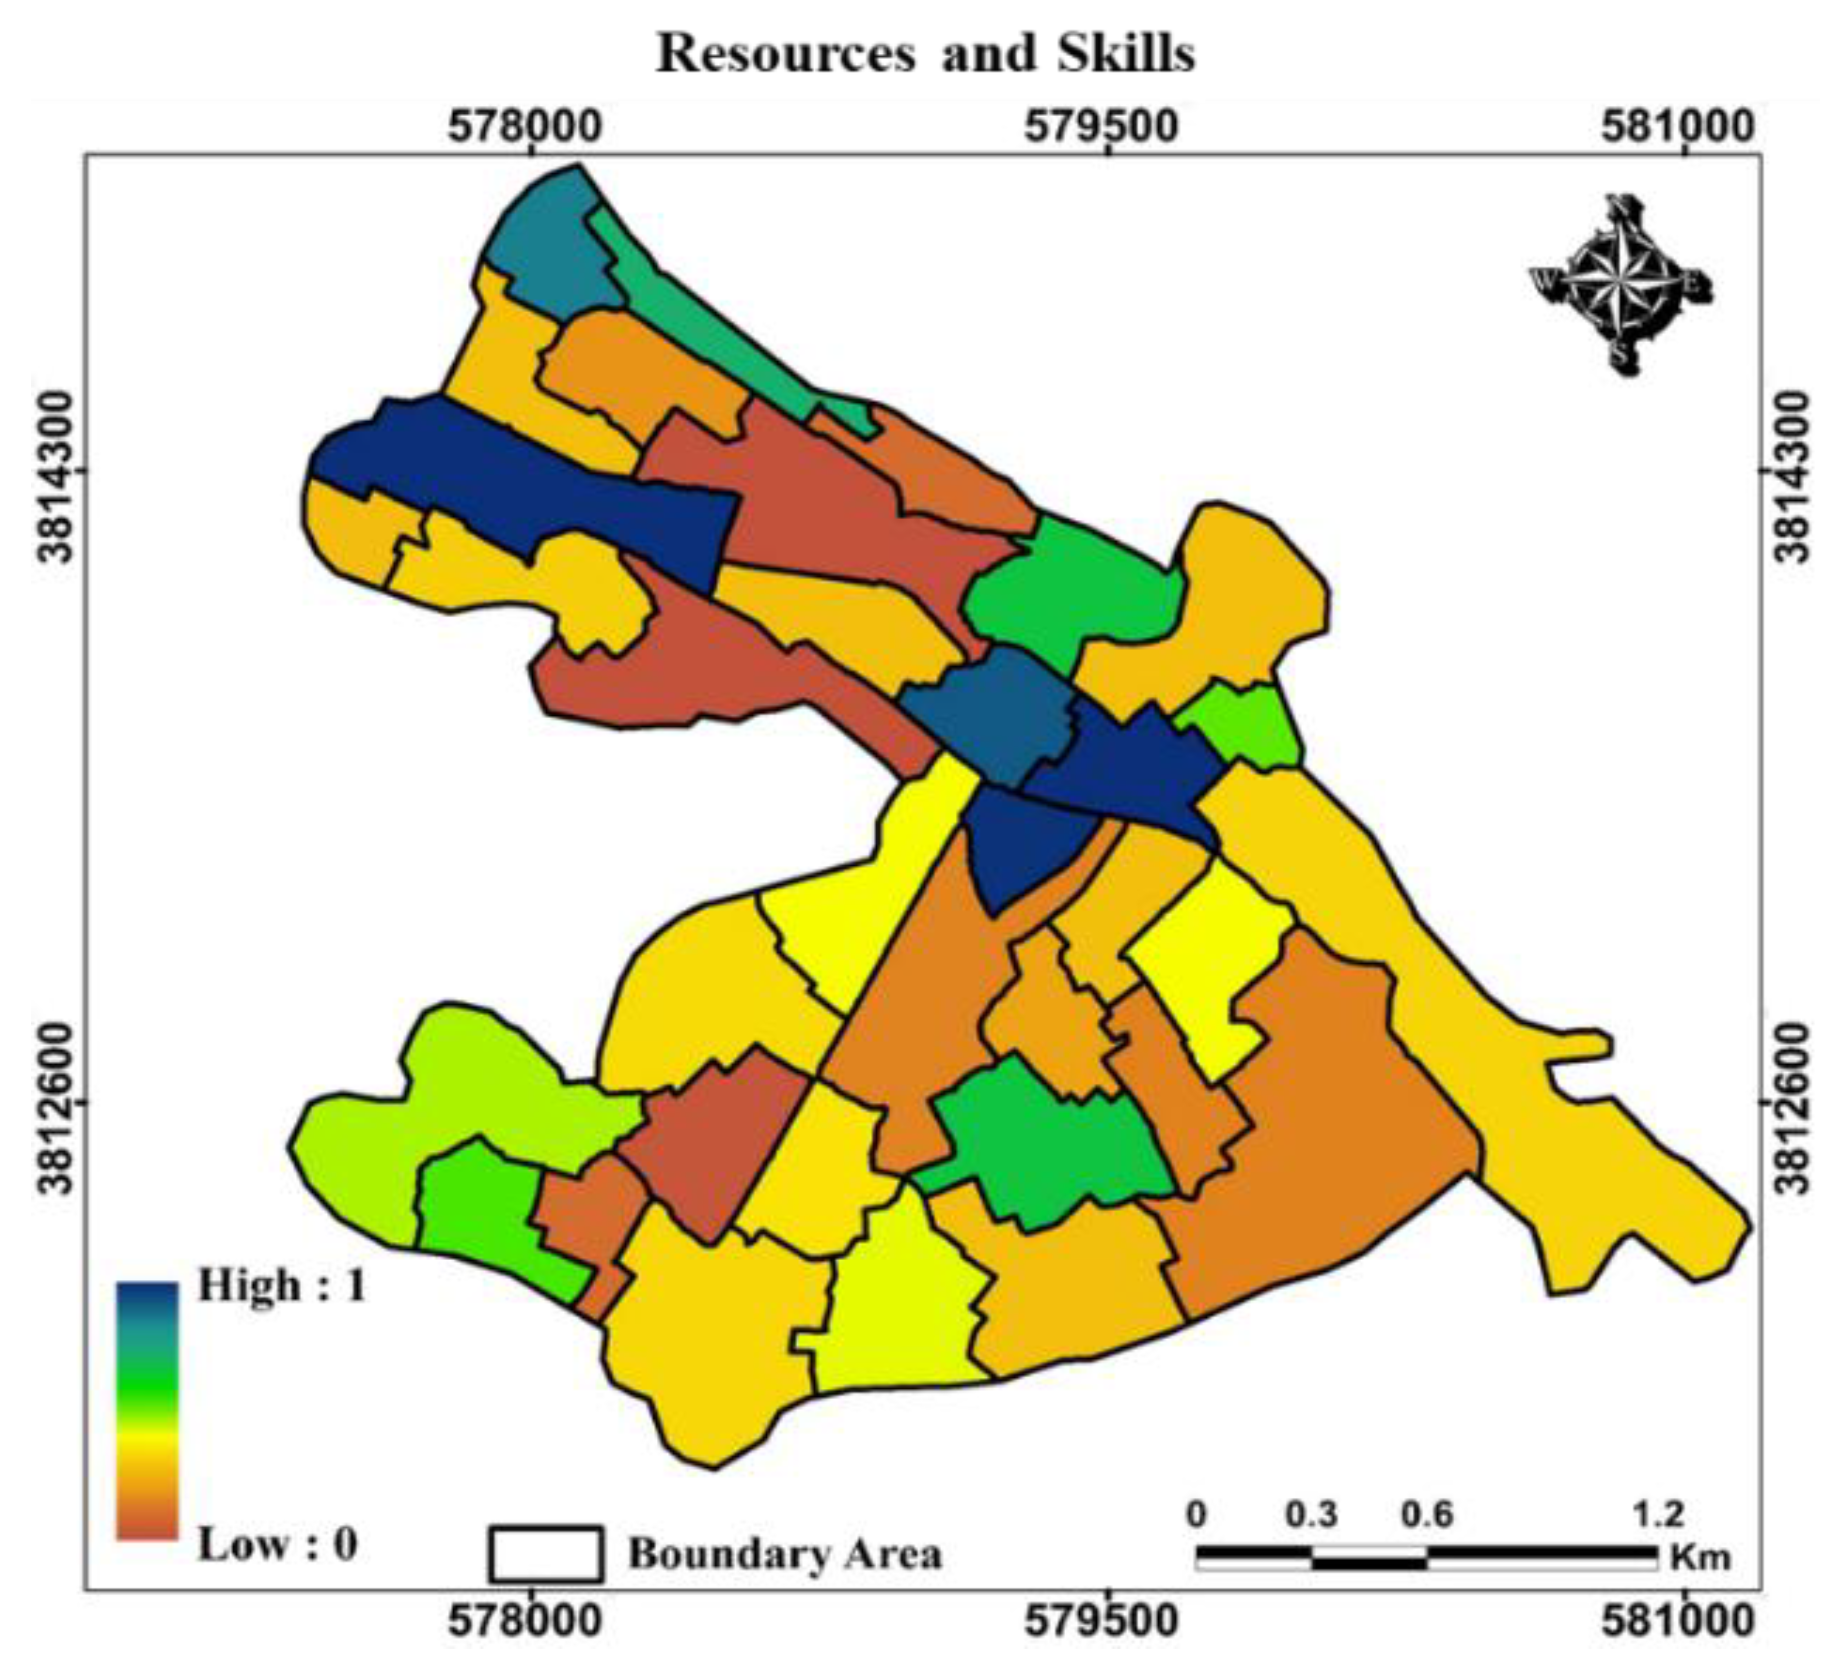
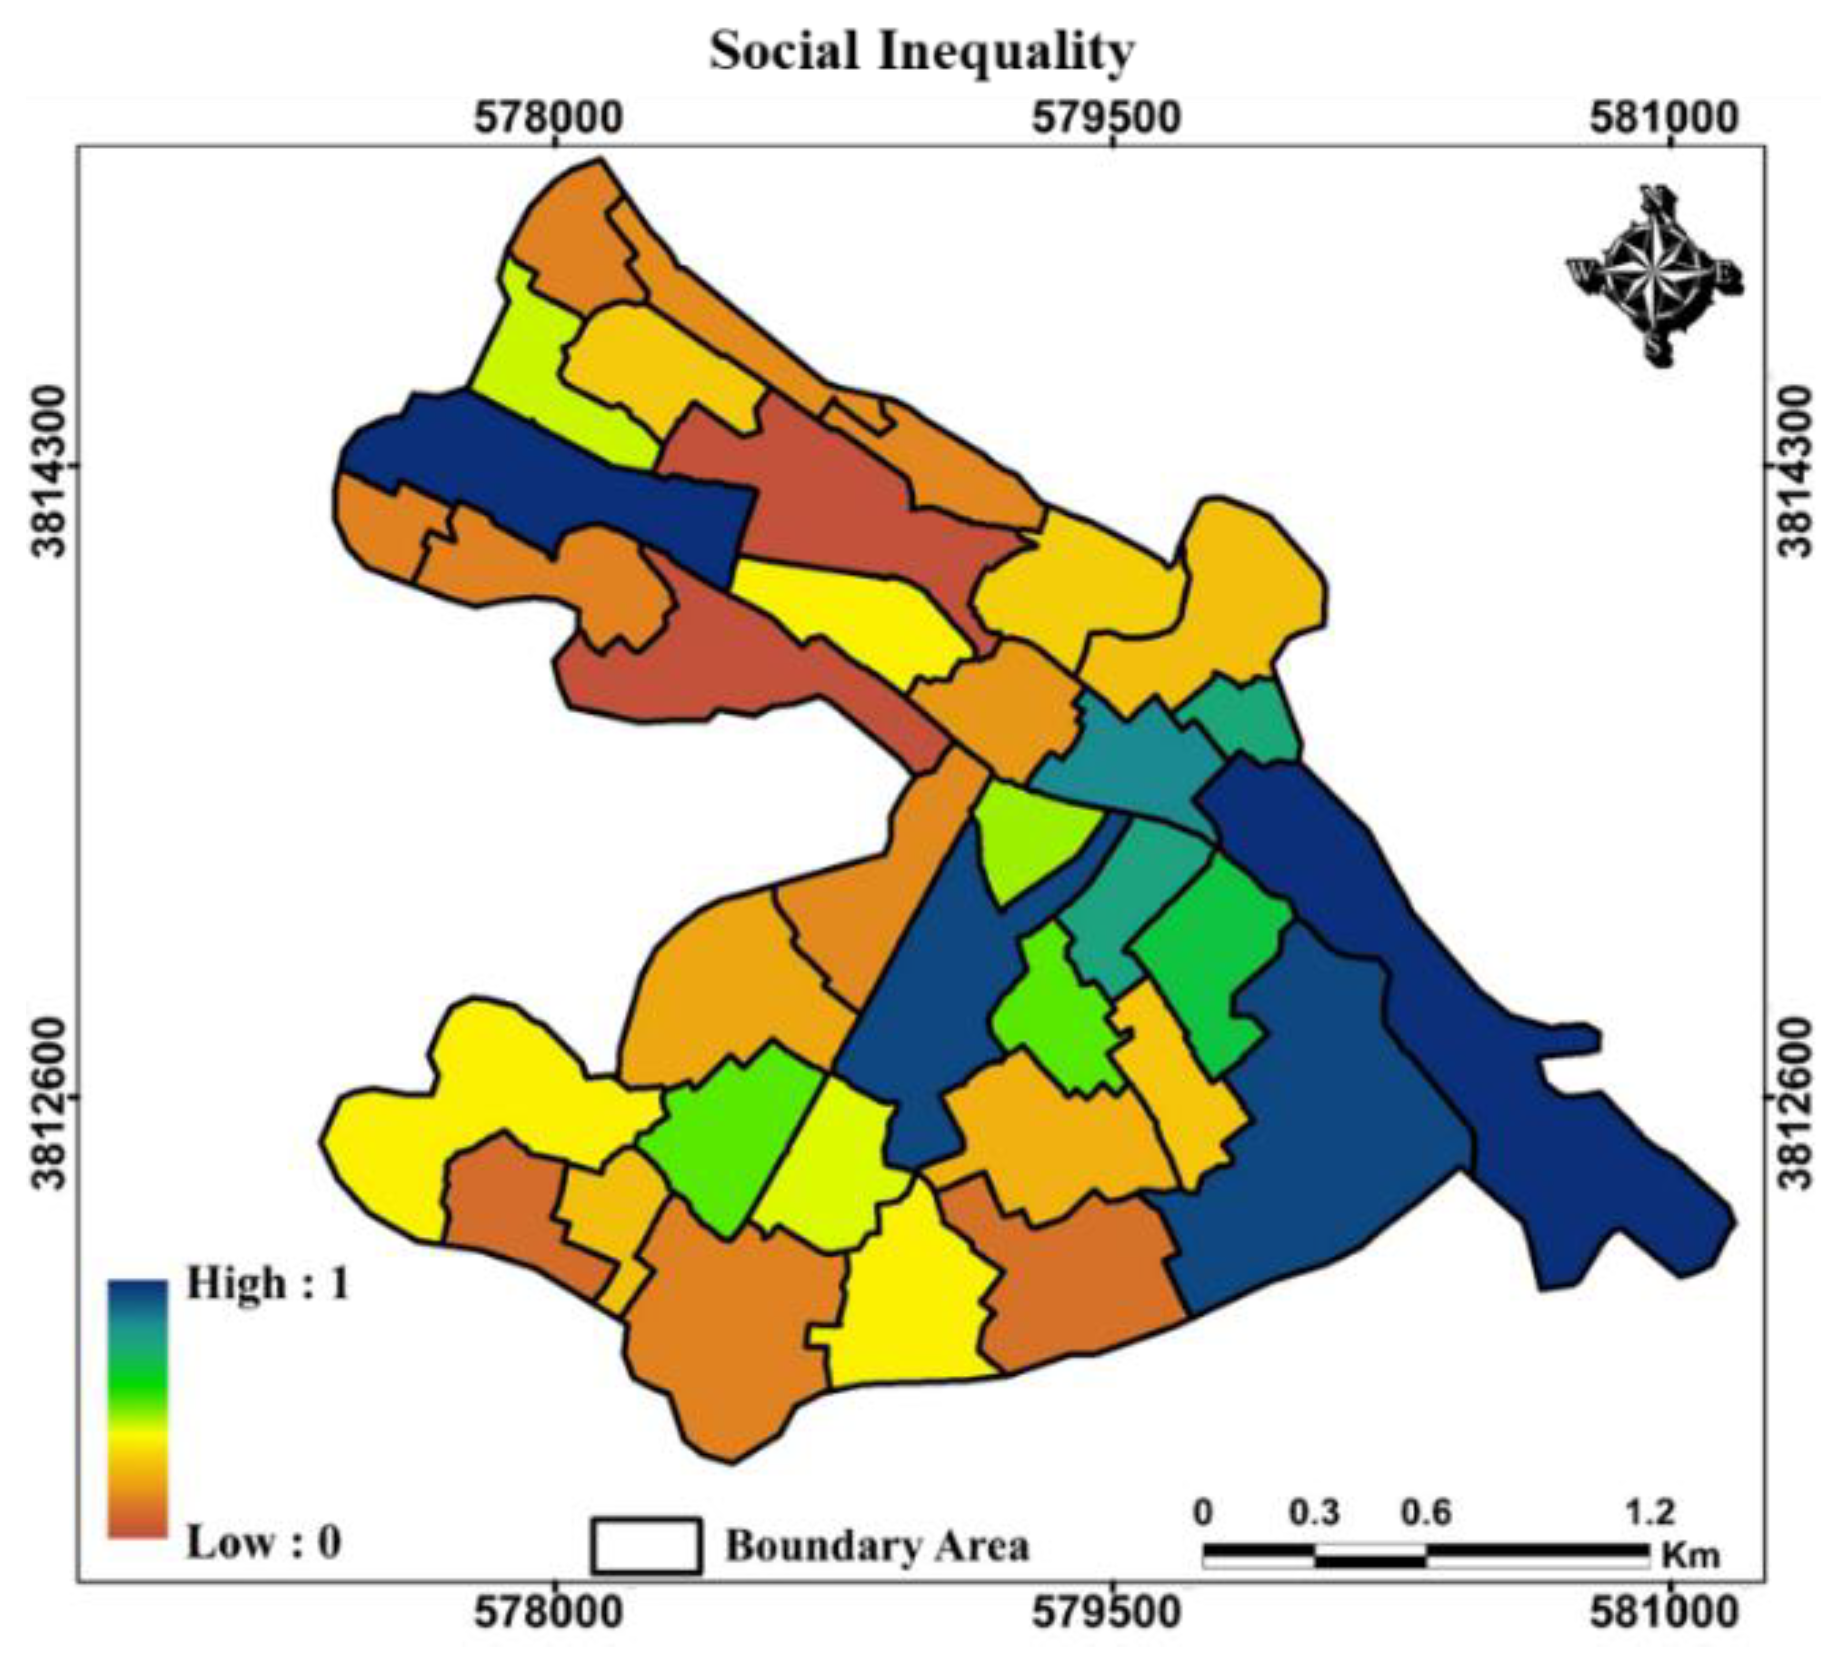
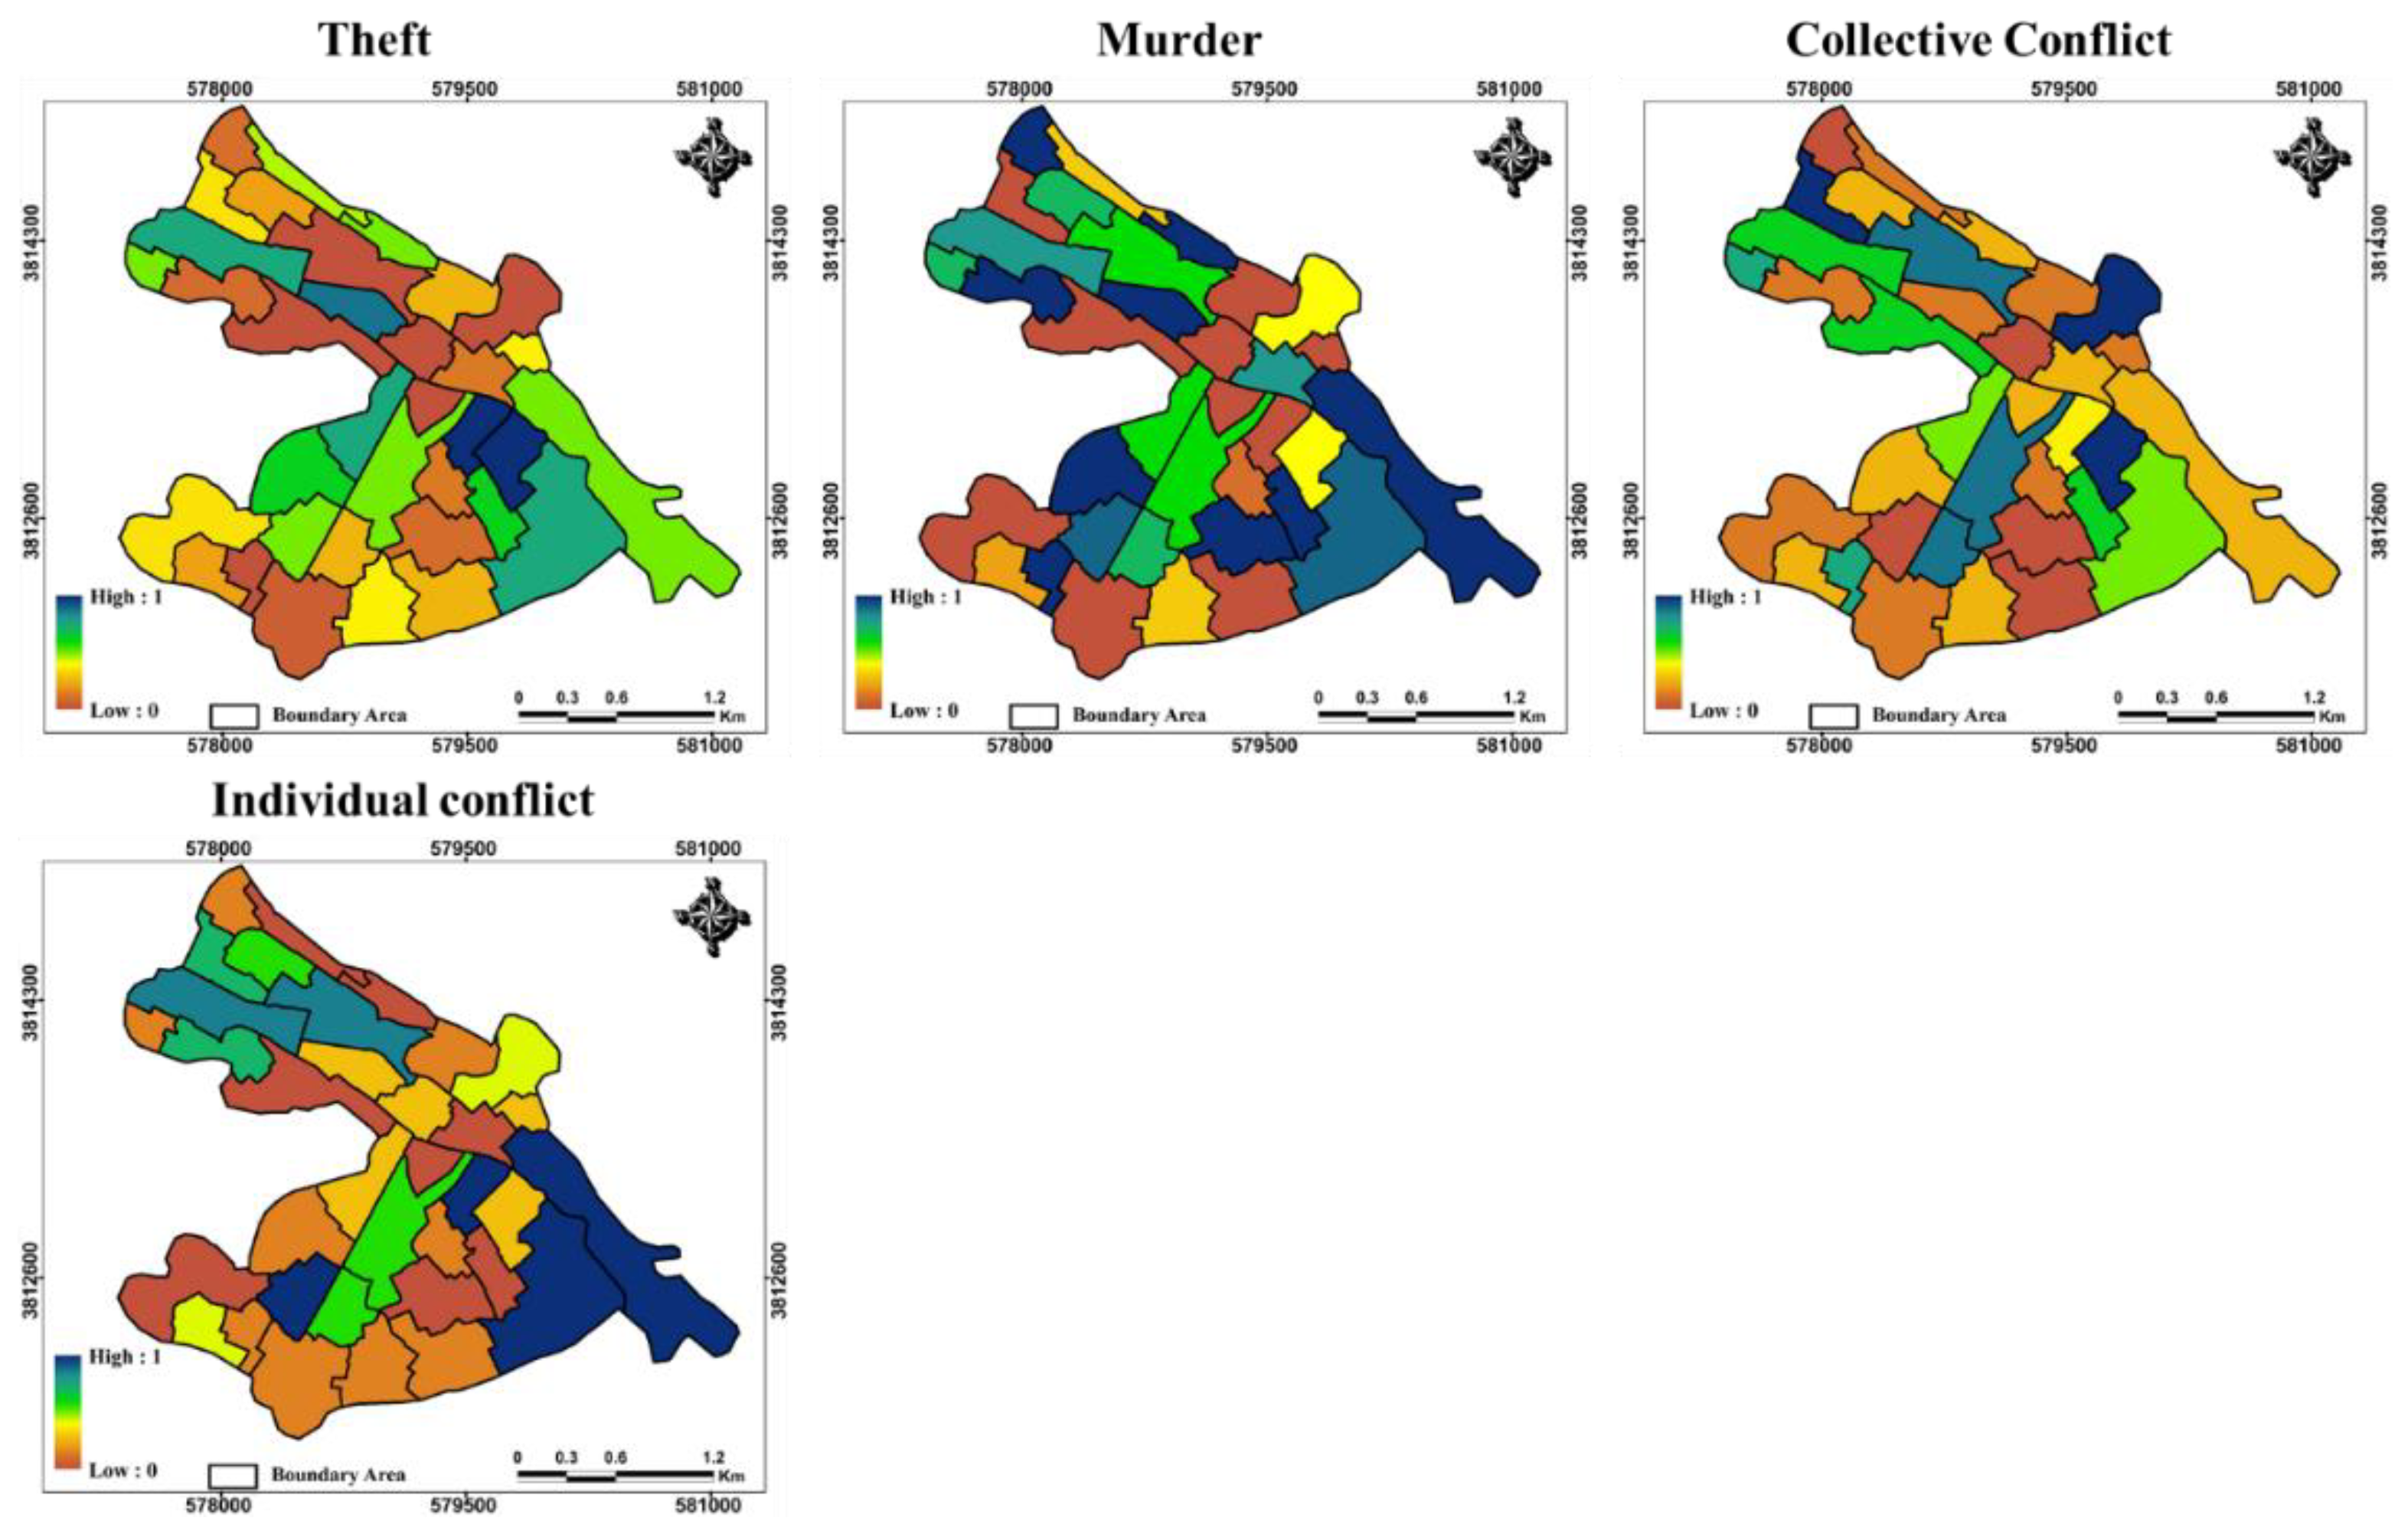
4.1. Locative Distribution of the Criteria Affecting Social Resilience
4.2. Accuracy Assessment
5. Discussion
6. Conclusions
Author Contributions
Funding
Informed Consent Statement
Data Availability Statement
Conflicts of Interest
References
- United Nations Department for Economic and Social Affairs. World Urbanization Prospects 2018; United Nations Department for Economic and Social Affairs: New York, NY, USA, 2018. [Google Scholar]
- Huck, A.; Monstadt, J.; Driessen, P. Building urban and infrastructure resilience through connectivity: An institutional perspective on disaster risk management in Christchurch, New Zealand. Cities 2020, 98, 102573. [Google Scholar] [CrossRef]
- Zhang, X.; Li, H. Urban resilience and urban sustainability: What we know and what do not know? Cities 2018, 72, 141–148. [Google Scholar] [CrossRef]
- Meerow, S.; Newell, J.P. Urban resilience for whom, what, when, where, and why? Urban Geogr. 2019, 40, 309–329. [Google Scholar] [CrossRef]
- White, G.F. Natural Hazards, Local, National, Global; Oxford University Press: Oxford, UK, 1974. [Google Scholar]
- White, G.F. Natural hazards research. In Directions in Geography; Routledge: London, UK, 2019; pp. 193–216. [Google Scholar]
- Adger, W.N.; Hodbod, J. Ecological and social resilience. In Handbook of Sustainable Development; Edward Elgar Publishing: Cheltenham, UK, 2014. [Google Scholar]
- Chen, C.; Xu, L.; Zhao, D.; Xu, T.; Lei, P. A new model for describing the urban resilience considering adaptability, resistance and recovery. Saf. Sci. 2020, 128, 104756. [Google Scholar] [CrossRef]
- Field, C.B.; Barros, V.; Stocker, T.F.; Dahe, Q. Managing the Risks of Extreme Events and Disasters to Advance Climate Change Adaptation: Special Report of the Intergovernmental Panel on Climate Change; Cambridge University Press: Cambridge, UK, 2012. [Google Scholar]
- Matarrita-Cascante, D.; Trejos, B. Community resilience in resource-dependent communities: A comparative case study. Environ. Plan. A 2013, 45, 1387–1402. [Google Scholar] [CrossRef]
- Saja, A.A.; Goonetilleke, A.; Teo, M.; Ziyath, A.M. A critical review of social resilience assessment frameworks in disaster management. Int. J. Disaster Risk Reduct. 2019, 35, 101096. [Google Scholar] [CrossRef]
- Adger, W.N. Social and ecological resilience: Are they related? Prog. Hum. Geogr. 2000, 24, 347–364. [Google Scholar] [CrossRef]
- Mitchell, T.; Harris, K. Resilience: A Risk Management Approach; ODI Background Note; Overseas Development Institute: London, UK, 2012; pp. 1–7. [Google Scholar]
- Meerow, S.; Newell, J.P.; Stults, M. Defining urban resilience: A review. Landsc. Urban Plan. 2016, 147, 38–49. [Google Scholar] [CrossRef]
- Shamsuddin, S. Resilience resistance: The challenges and implications of urban resilience implementation. Cities 2020, 103, 102763. [Google Scholar] [CrossRef]
- Brown, A.; Dayal, A.; Rumbaitis Del Rio, C. From practice to theory: Emerging lessons from Asia for building urban climate change resilience. Environ. Urban. 2012, 24, 531–556. [Google Scholar] [CrossRef] [Green Version]
- Maguire, B.; Hagan, P. Disasters and communities: Understanding social resilience. Aust. J. Emerg. Manag. 2007, 22, 16. [Google Scholar]
- Ozel, B.; Mecca, S. Rethinking the role of public spaces for urban resilience: Case study of Eco-village in Cenaia. In Proceedings of the Past Present and Future of Public Space Ð International Conference on Art, Architecture and Urban Design, Bologna, Italy, 25–27 June 2014. [Google Scholar]
- Sachdeva, M. Urban Resilience and Urban Sustainability. Master’s Thesis, Columbia University, New York, NY, USA, 2016. [Google Scholar]
- Fekete, A.; Asadzadeh, A.; Ghafory-Ashtiany, M.; Amini-Hosseini, K.; Hetkämper, C.; Moghadas, M.; Ostadtaghizadeh, A.; Rohr, A.; Kötter, T. Pathways for advancing integrative disaster risk and resilience management in Iran: Needs, challenges and opportunities. Int. J. Disaster Risk Reduct. 2020, 49, 101635. [Google Scholar] [CrossRef]
- Zengir, V.S.; Sobhani, B.; Asghari, S. Monitoring and investigating the possibility of forecasting drought in the western part of Iran. Arab. J. Geosci. 2020, 13, 1–12. [Google Scholar]
- Najafabadi, R.M.; Ramesht, M.H.; Ghazi, I.; Khajedin, S.J.; Seif, A.; Nohegar, A.; Mahdavi, A. Identification of natural hazards and classification of urban areas by TOPSIS model (case study: Bandar Abbas city, Iran). Geomat. Nat. Hazards Risk 2016, 7, 85–100. [Google Scholar] [CrossRef]
- Jelokhani-Niaraki, M. Web 2.0-Based Collaborative Multicriteria Spatial Decision Support System: A Case Study of Human-Computer Interaction Patterns. Ph.D. Thesis, University of Western Ontario, London, ON, Canada, 2013. [Google Scholar]
- Mohammadnazari, Z.; Mousapour Mamoudan, M.; Alipour-Vaezi, M.; Aghsami, A.; Jolai, F.; Yazdani, M. Prioritizing post-disaster reconstruction projects using an integrated multi-criteria decision-making approach: A case study. Buildings 2022, 12, 136. [Google Scholar] [CrossRef]
- Yalcin, M.; Gul, F.K. A GIS-based multi criteria decision analysis approach for exploring geothermal resources: Akarcay basin (Afyonkarahisar). Geothermics 2017, 67, 18–28. [Google Scholar] [CrossRef]
- Bacca, E.J.M.; Knight, A.; Trifkovic, M. Optimal land use and distributed generation technology selection via geographic-based multicriteria decision analysis and mixed-integer programming. Sustain. Cities Soc. 2020, 55, 102055. [Google Scholar] [CrossRef]
- Ristić, V.; Maksin, M.; Nenković-Riznić, M.; Basarić, J. Land-use evaluation for sustainable construction in a protected area: A case of Sara mountain national park. J. Environ. Manag. 2018, 206, 430–445. [Google Scholar] [CrossRef]
- Shahpari Sani, D.; Mahmoudian, H. Identifying and prioritizing of the effective factor on the tendency of immigration in abadan city using multi-criteria decision making techniques. J. Popul. Assoc. Iran 2019, 13, 89–118. [Google Scholar]
- Mijani, N.; Shahpari Sani, D.; Dastaran, M.; Karimi Firozjaei, H.; Argany, M.; Mahmoudian, H. Spatial modeling of migration using GIS-based multi-criteria decision analysis: A case study of Iran. Trans. GIS 2022, 26, 645–668. [Google Scholar] [CrossRef]
- Mijani, N.; Alavipanah, S.K.; Hamzeh, S.; Firozjaei, M.K.; Arsanjani, J.J. Modeling thermal comfort in different condition of mind using satellite images: An Ordered Weighted Averaging approach and a case study. Ecol. Indic. 2019, 104, 1–12. [Google Scholar] [CrossRef]
- Firozjaei, M.K.; Nematollahi, O.; Mijani, N.; Shorabeh, S.N.; Firozjaei, H.K.; Toomanian, A. An integrated GIS-based Ordered Weighted Averaging analysis for solar energy evaluation in Iran: Current conditions and future planning. Renew. Energy 2019, 136, 1130–1146. [Google Scholar] [CrossRef]
- Shorabeh, S.N.; Samany, N.N.; Minaei, F.; Firozjaei, H.K.; Homaee, M.; Boloorani, A.D. A decision model based on decision tree and particle swarm optimization algorithms to identify optimal locations for solar power plants construction in Iran. Renew. Energy 2022, 187, 56–67. [Google Scholar] [CrossRef]
- Moghadas, M.; Asadzadeh, A.; Vafeidis, A.; Fekete, A.; Kötter, T. A multi-criteria approach for assessing urban flood resilience in Tehran, Iran. Int. J. Disaster Risk Reduct. 2019, 35, 101069. [Google Scholar] [CrossRef]
- Bertilsson, L.; Wiklund, K.; de Moura Tebaldi, I.; Rezende, O.M.; Veról, A.P.; Miguez, M.G. Urban flood resilience–A multi-criteria index to integrate flood resilience into urban planning. J. Hydrol. 2019, 573, 970–982. [Google Scholar] [CrossRef]
- Karpouza, M.; Chousianitis, K.; Bathrellos, G.D.; Skilodimou, H.D.; Kaviris, G.; Antonarakou, A. Hazard zonation mapping of earthquake-induced secondary effects using spatial multi-criteria analysis. Nat. Hazards 2021, 109, 637–669. [Google Scholar] [CrossRef]
- Bonanno, G.A.; Romero, S.A.; Klein, S.I. The temporal elements of psychological resilience: An integrative framework for the study of individuals, families, and communities. Psychol. Inq. 2015, 26, 139–169. [Google Scholar] [CrossRef]
- Folke, C. Resilience: The emergence of a perspective for social–ecological systems analyses. Glob. Environ. Chang. 2006, 16, 253–267. [Google Scholar] [CrossRef]
- Bogardi, J. Resilience Building: From Knowledge to Action. Introduction to UNU-EHS. Presented at the UNU–EHS Summer Academy, Munich, Germany, 23–30 July 2006. [Google Scholar]
- Sapirstein, G. Social resilience: The forgotten dimension of disaster risk reduction. Jàmbá J. Disaster Risk Stud. 2006, 1, 54–63. [Google Scholar] [CrossRef] [Green Version]
- Ainuddin, S.; Routray, J.K. Earthquake hazards and community resilience in Baluchistan. Nat. Hazards 2012, 63, 909–937. [Google Scholar] [CrossRef]
- Cutter, L.; Barnes, L.; Berry, M.; Burton, C.; Evans, E.; Tate, E.; Webb, J. Community and Regional Resilience to Natural Disasters: Perspective from Hazards, Disasters and Emergency Management; CARRI Research Report 1; Community and Regional Resilience Institute: Oak Ridge, TN, USA, 2008. [Google Scholar]
- Dumenu, W.K.; Obeng, E.A. Climate change and rural communities in Ghana: Social vulnerability, impacts, adaptations and policy implications. Environ. Sci. Policy 2016, 55, 208–217. [Google Scholar] [CrossRef]
- Kulig, J.C.; Hegney, D.; Edge, D.S. Community resiliency and rural nursing: Canadian and Australian perspectives. In Rural Nursing: Concepts, Theory and Practice; Springer: New York, NY, USA, 2009; pp. 385–400. [Google Scholar]
- Matarrita-Cascante, D.; Trejos, B.; Qin, H.; Joo, D.; Debner, S. Conceptualizing community resilience: Revisiting conceptual distinctions. Community Dev. 2017, 48, 105–123. [Google Scholar] [CrossRef]
- Kuhlicke, C.; Steinführer, A.; Begg, C.; Bianchizza, C.; Bründl, M.; Buchecker, M.; De Marchi, B.; Tarditti, M.D.M.; Höppner, C.; Komac, B. Perspectives on social capacity building for natural hazards: Outlining an emerging field of research and practice in Europe. Environ. Sci. Policy 2011, 14, 804–814. [Google Scholar] [CrossRef]
- Norris, F.H.; Stevens, S.P.; Pfefferbaum, B.; Wyche, K.F.; Pfefferbaum, R.L. Community resilience as a metaphor, theory, set of capacities, and strategy for disaster readiness. Am. J. Community Psychol. 2008, 41, 127–150. [Google Scholar] [CrossRef] [PubMed]
- Twigg, J. Characteristics of a Disaster-Resilient Community: A Guidance Note (Version 2). 2009. Available online: https://discovery.ucl.ac.uk/id/eprint/1346086/1/1346086.pdf (accessed on 5 June 2022).
- Abesamis, N.P.; Corrigan, C.; Drew, M.; Campbell, S.; Samonte, G. Social Resilience: A Literature Review on Building Resilience into Human Marine Communities in and around MPA Networks. MPA Networks Learning Partnership, Global Conservation Program, USAID. 2006. Available online: http://www.reefresilience.org/pdf/Social_Resilience_Literature_Review.pdf (accessed on 5 June 2022).
- Ebadollahzadeh, M.S.; Khanloo, N.; Ziyari, K.; Shali, A.V. Prioritization of factors affecting social resilience against natural hazards with emphasis on earthquakes. Hoviateshahr 2019, 13, 45–58. [Google Scholar]
- Voss, M. The vulnerable can’t speak. An integrative vulnerability approach to disaster and climate change research. Behemoth-A J. Civilis. 2008, 1, 39–56. [Google Scholar] [CrossRef]
- Saja, A.A.; Teo, M.; Goonetilleke, A.; Ziyath, A.M. An inclusive and adaptive framework for measuring social resilience to disasters. Int. J. Disaster Risk Reduct. 2018, 28, 862–873. [Google Scholar] [CrossRef]
- Moher, D.; Liberati, A.; Tetzlaff, J.; Altman, D.G.; Group, P. Preferred reporting items for systematic reviews and meta-analyses: The PRISMA statement. PLoS Med. 2009, 6, e1000097. [Google Scholar] [CrossRef] [Green Version]
- Godschalk, D. Functions and phases of emergency management. In Emergency Management: Principles and Practice for Local Government; ICMA Press: Zurich, Switzerland, 2007; pp. 87–112. [Google Scholar]
- Sanders, A.E.; Lim, S.; Sohn, W. Resilience to urban poverty: Theoretical and empirical considerations for population health. Am. J. Public Health 2008, 98, 1101–1106. [Google Scholar] [CrossRef]
- Shaw, D.; Scully, J.; Hart, T. The paradox of social resilience: How cognitive strategies and coping mechanisms attenuate and accentuate resilience. Glob. Environ. Chang. 2014, 25, 194–203. [Google Scholar] [CrossRef]
- Arefi, M. Design for resilient cities: Reflections from a studio. In Companion to Urban Design; Routledge: London, UK, 2011; pp. 688–699. [Google Scholar]
- Béné, C.; Newsham, A.; Davies, M.; Ulrichs, M.; Godfrey-Wood, R. Resilience, poverty and development. J. Int. Dev. 2014, 26, 598–623. [Google Scholar] [CrossRef]
- Bastaminia, A.; Fakhraie, O.; Alizadeh, M.; Asadi, A.B.; Dastoorpoor, M. Social capital and quality of life among university students of Yasuj, Iran. Int. J. Soc. Sci. Stud. 2016, 4, 9. [Google Scholar] [CrossRef] [Green Version]
- Cutter, S.L.; Barnes, L.; Berry, M.; Burton, C.; Evans, E.; Tate, E.; Webb, J. A place-based model for understanding community resilience to natural disasters. Glob. Environ. Chang. 2008, 18, 598–606. [Google Scholar] [CrossRef]
- Aldrich, D.P.; Meyer, M.A. Social capital and community resilience. Am. Behav. Sci. 2015, 59, 254–269. [Google Scholar] [CrossRef]
- Kimhi, S. Levels of resilience: Associations among individual, community, and national resilience. J. Health Psychol. 2016, 21, 164–170. [Google Scholar] [CrossRef]
- Qasim, S.; Qasim, M.; Shrestha, R.P.; Khan, A.N.; Tun, K.; Ashraf, M. Community resilience to flood hazards in Khyber Pukhthunkhwa province of Pakistan. Int. J. Disaster Risk Reduct. 2016, 18, 100–106. [Google Scholar] [CrossRef]
- Freitag, R.C.; Abramson, D.B.; Chalana, M.; Dixon, M. Whole community resilience: An asset-based approach to enhancing adaptive capacity before a disruption. J. Am. Plan. Assoc. 2014, 80, 324–335. [Google Scholar] [CrossRef]
- Berkes, F.; Ross, H. Community resilience: Toward an integrated approach. Soc. Nat. Resour. 2013, 26, 5–20. [Google Scholar] [CrossRef]
- Ross, H.; Cuthill, M.; Maclean, K.; Jansen, D.; Witt, B. Understanding, Enhancing and Managing for Social Resilience at the Regional Scale: Opportunities in North Queensland; Report to the Marine and Tropical Sciences Research Facility; Reef and Rainforest Research Centre Limited: Cairns, Australia, 2010. [Google Scholar]
- Cinner, J.; Fuentes, M.M.; Randriamahazo, H. Exploring social resilience in Madagascar’s marine protected areas. Ecol. Soc. 2009, 14, 41. [Google Scholar] [CrossRef] [Green Version]
- Magis, K. Community resilience: An indicator of social sustainability. Soc. Nat. Resour. 2010, 23, 401–416. [Google Scholar] [CrossRef]
- Obrist, B.; Pfeiffer, C.; Henley, R. Multi-layered social resilience: A new approach in mitigation research. Prog. Dev. Stud. 2010, 10, 283–293. [Google Scholar] [CrossRef]
- Becker, P. The importance of integrating multiple administrative levels in capacity assessment for disaster risk reduction and climate change adaptation. Disaster Prev. Manag. Int. J. 2012, 21, 226–233. [Google Scholar] [CrossRef]
- Mayunga, J.S. Understanding and applying the concept of community disaster resilience: A capital-based approach. Summer Acad. Soc. Vulnerability Resil. Build. 2007, 1, 1–16. [Google Scholar]
- Morrow, B.H. Community Resilience: A Social Justice Perspective; CARRI Research Report; Community and Regional Resilience Initiative: Oak Ridge, TN, USA, 2008. [Google Scholar]
- Cutter, S.L.; Burton, C.G.; Emrich, C.T. Disaster resilience indicators for benchmarking baseline conditions. J. Homel. Secur. Emerg. Manag. 2010, 7, 51. [Google Scholar] [CrossRef]
- Keeley, B. Human Capital: How What You Know Can Shape Your Life; Danvers, M.A., Ed.; Organization for Economic Co-Operation and Development (OECD): Paris, France, 2007. [Google Scholar]
- Boloorani, A.D.; Kazemi, Y.; Sadeghi, A.; Shorabeh, S.N.; Argany, M. Identification of dust sources using long term satellite and climatic data: A case study of Tigris and Euphrates basin. Atmos. Environ. 2020, 224, 117299. [Google Scholar] [CrossRef]
- Saaty, T.L. Axiomatic foundation of the analytic hierarchy process. Manag. Sci. 1986, 32, 841–855. [Google Scholar] [CrossRef]
- Pohekar, S.D.; Ramachandran, M. Application of multi-criteria decision making to sustainable energy planning—A review. Renew. Sustain. Energy Rev. 2004, 8, 365–381. [Google Scholar] [CrossRef]
- Mijani, N.; Samani, N.N. Comparison of fuzzy-based models in landslide hazard mapping. Int. Arch. Photogramm. Remote Sens. Spat. Inf. Sci. 2017, 42, 407–416. [Google Scholar] [CrossRef] [Green Version]
- Saaty, T.L. Decision making with the analytic hierarchy process. Int. J. Serv. Sci. 2008, 1, 83–98. [Google Scholar] [CrossRef] [Green Version]
- Mekonnen, A.D.; Gorsevski, P.V. A web-based participatory GIS (PGIS) for offshore wind farm suitability within Lake Erie, Ohio. Renew. Sustain. Energy Rev. 2015, 41, 162–177. [Google Scholar] [CrossRef] [Green Version]
- Qureshi, S.; Shorabeh, S.N.; Samany, N.N.; Minaei, F.; Homaee, M.; Nickravesh, F.; Firozjaei, M.K.; Arsanjani, J.J. A new integrated approach for municipal landfill siting based on urban physical growth prediction: A case study mashhad metropolis in Iran. Remote Sens. 2021, 13, 949. [Google Scholar] [CrossRef]
- Shorabeh, S.N.; Firozjaei, M.K.; Nematollahi, O.; Firozjaei, H.K.; Jelokhani-Niaraki, M. A risk-based multi-criteria spatial decision analysis for solar power plant site selection in different climates: A case study in Iran. Renew. Energy 2019, 143, 958–973. [Google Scholar] [CrossRef]
- Abdelkarim, A.; Al-Alola, S.S.; Alogayell, H.M.; Mohamed, S.A.; Alkadi, I.I.; Ismail, I.Y. Integration of GIS-based multicriteria decision analysis and analytic hierarchy process to assess flood hazard on the Al-shamal train pathway in Al-Qurayyat region, kingdom of Saudi Arabia. Water 2020, 12, 1702. [Google Scholar] [CrossRef]
- Malczewski, J. GIS and Multicriteria Decision Analysis; John Wiley & Sons: Hoboken, NJ, USA, 1999. [Google Scholar]
- Shahabi, H.; Keihanfard, S.; Ahmad, B.B.; Amiri, M.J.T. Evaluating Boolean, AHP and WLC methods for the selection of waste landfill sites using GIS and satellite images. Environ. Earth Sci. 2014, 71, 4221–4233. [Google Scholar] [CrossRef]
- Babalola, M.A. Application of GIS-based multi-criteria decision technique in exploration of suitable site options for anaerobic digestion of food and biodegradable waste in Oita City, Japan. Environments 2018, 5, 77. [Google Scholar] [CrossRef] [Green Version]
- Hajizadeh, F.; Poshidehro, M.; Yousefi, E. Scenario-based capability evaluation of ecotourism development—An integrated approach based on WLC, and FUZZY–OWA methods. Asia Pac. J. Tour. Res. 2020, 25, 627–640. [Google Scholar] [CrossRef]
- Tang, Z.; Yi, S.; Wang, C.; Xiao, Y. Incorporating probabilistic approach into local multi-criteria decision analysis for flood susceptibility assessment. Stoch. Environ. Res. Risk Assess. 2018, 32, 701–714. [Google Scholar] [CrossRef]
- Thill, J.-C. Spatial Multicriteria Decision Making and Analysis: A Geographic Information Sciences Approach; Routledge: London, UK, 2019. [Google Scholar]
- Schlossberg, M.; Shuford, E. Delineating “public” and “participation” in PPGIS. URISA J. 2005, 16, 15–26. [Google Scholar]
- Vanolya, N.M.; Jelokhani-Niaraki, M.; Toomanian, A. Validation of spatial multicriteria decision analysis results using public participation GIS. Appl. Geogr. 2019, 112, 102061. [Google Scholar] [CrossRef]
- Jha, A.K.; Bloch, R.; Lamond, J. Cities and Flooding: A Guide to Integrated Urban Flood Risk Management for the 21st Century; The World Bank: Washington, DC, USA, 2012. [Google Scholar]
- Jabareen, Y. Planning the resilient city: Concepts and strategies for coping with climate change and environmental risk. Cities 2013, 31, 220–229. [Google Scholar] [CrossRef]
- Peregrine, P.N. Political participation and long-term resilience in pre-Columbian societies. Disaster Prev. Manag. Int. J. 2017, 26, 314–329. [Google Scholar] [CrossRef]
- Beatley, T.; Newman, P. Biophilic cities are sustainable, resilient cities. Sustainability 2013, 5, 3328–3345. [Google Scholar] [CrossRef] [Green Version]
- Windle, G. What is resilience? A review and concept analysis. Rev. Clin. Gerontol. 2011, 21, 152. [Google Scholar] [CrossRef]
- Malczewski, J. On the use of weighted linear combination method in GIS: Common and best practice approaches. Trans. GIS 2000, 4, 5–22. [Google Scholar] [CrossRef]


| Variables | Sub-Variables | Description | References |
|---|---|---|---|
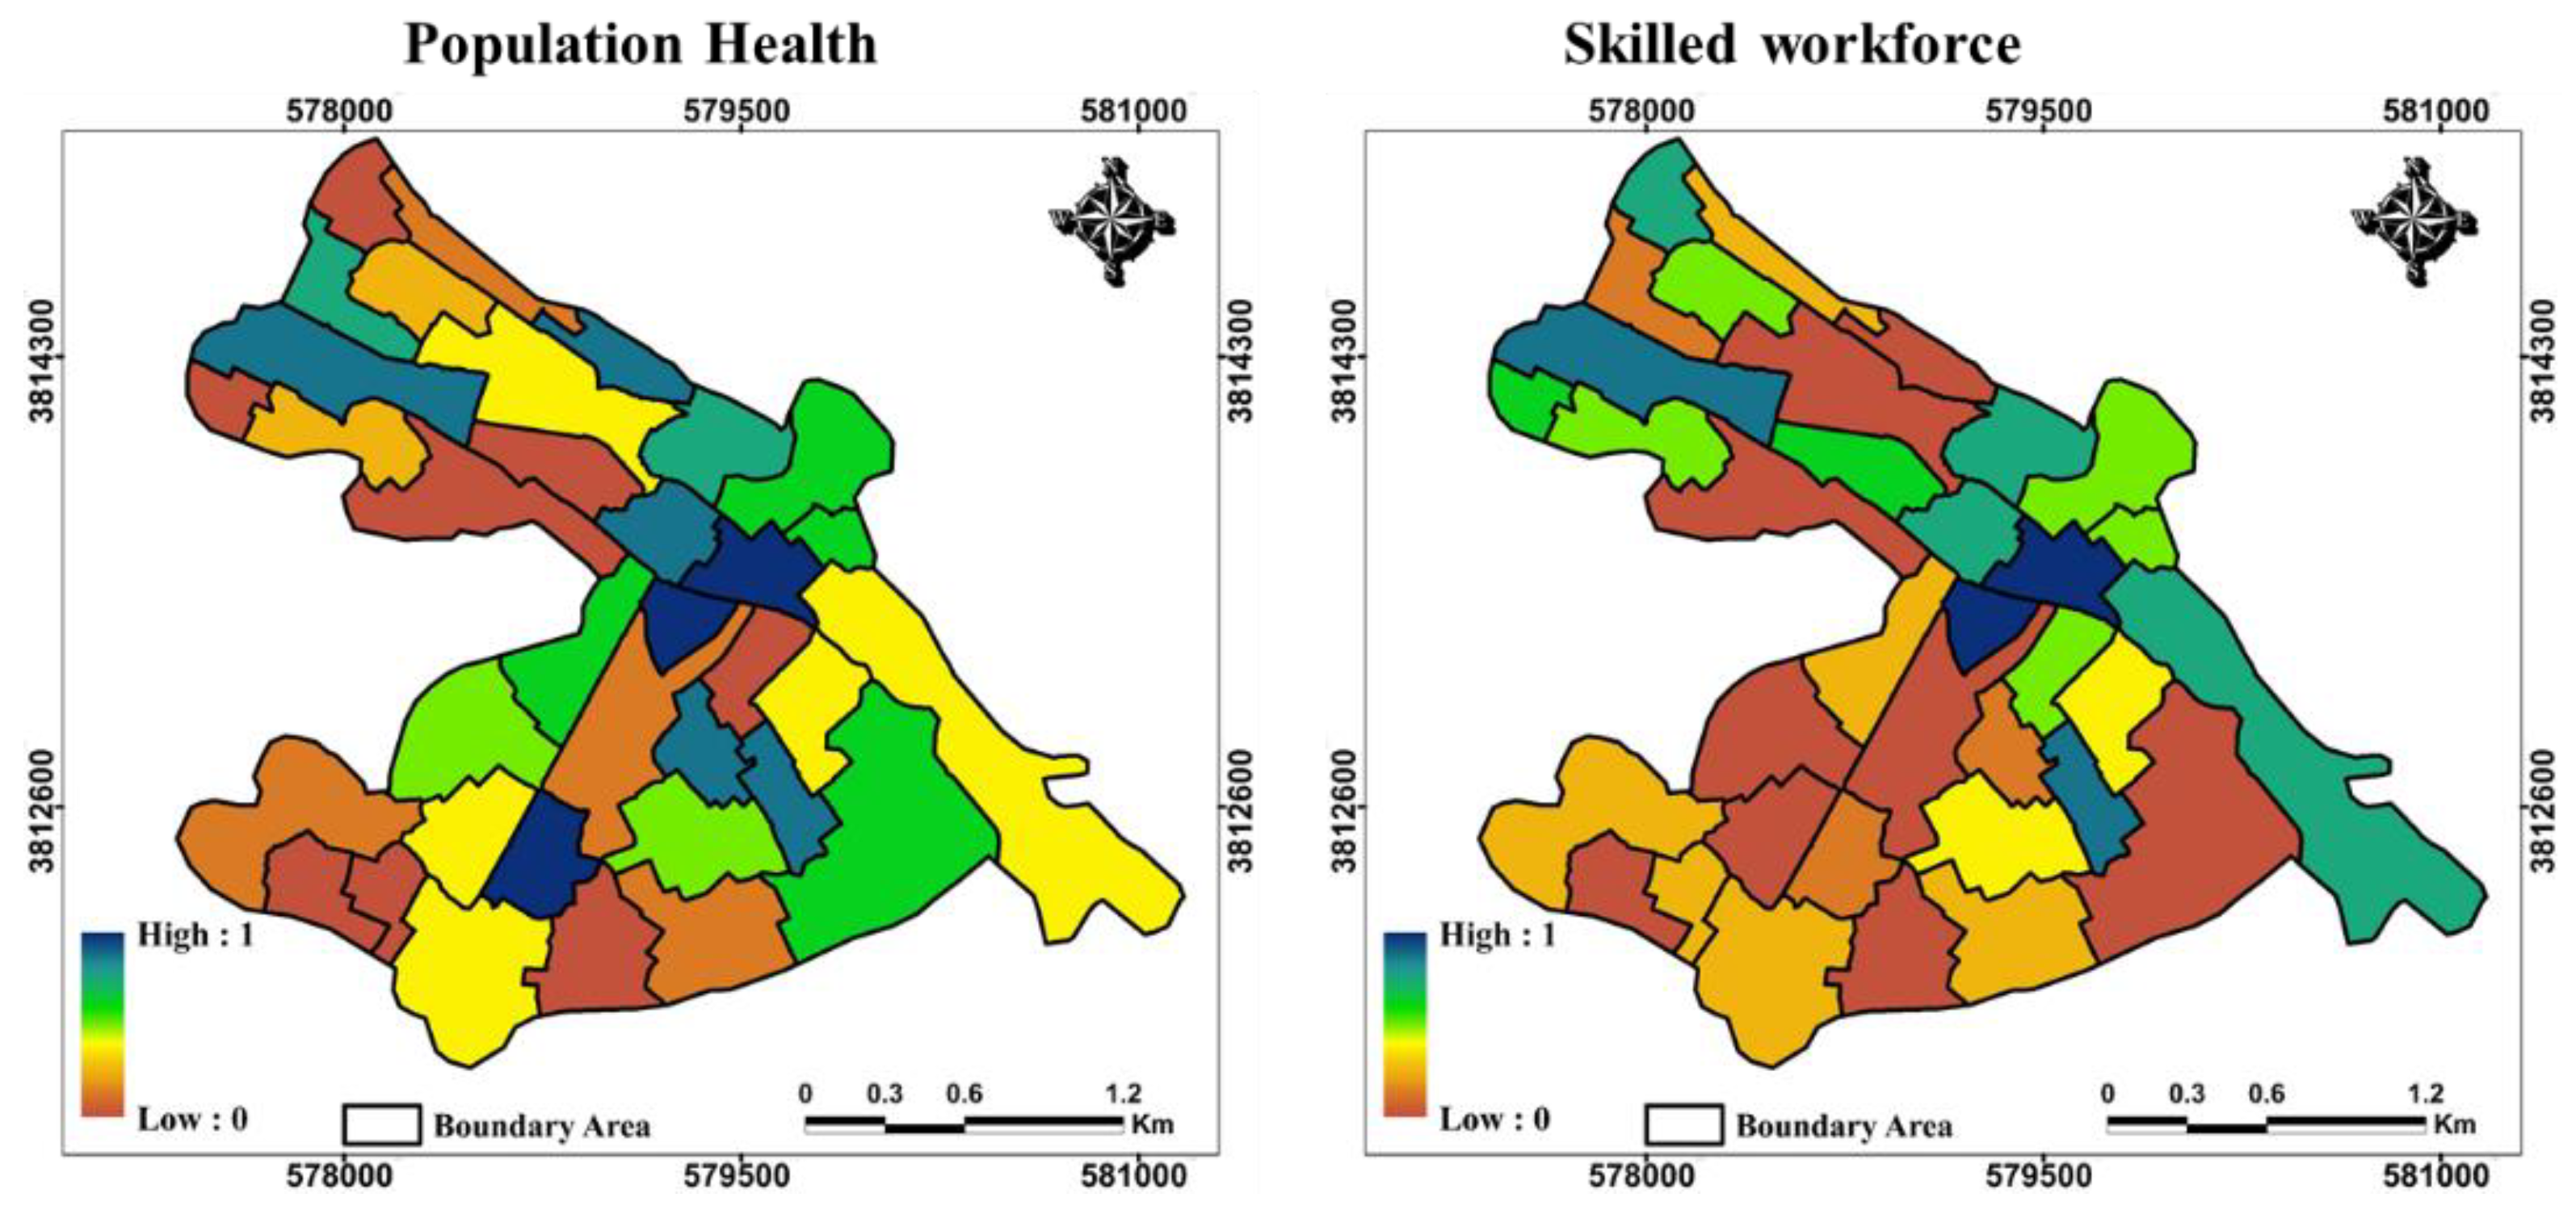
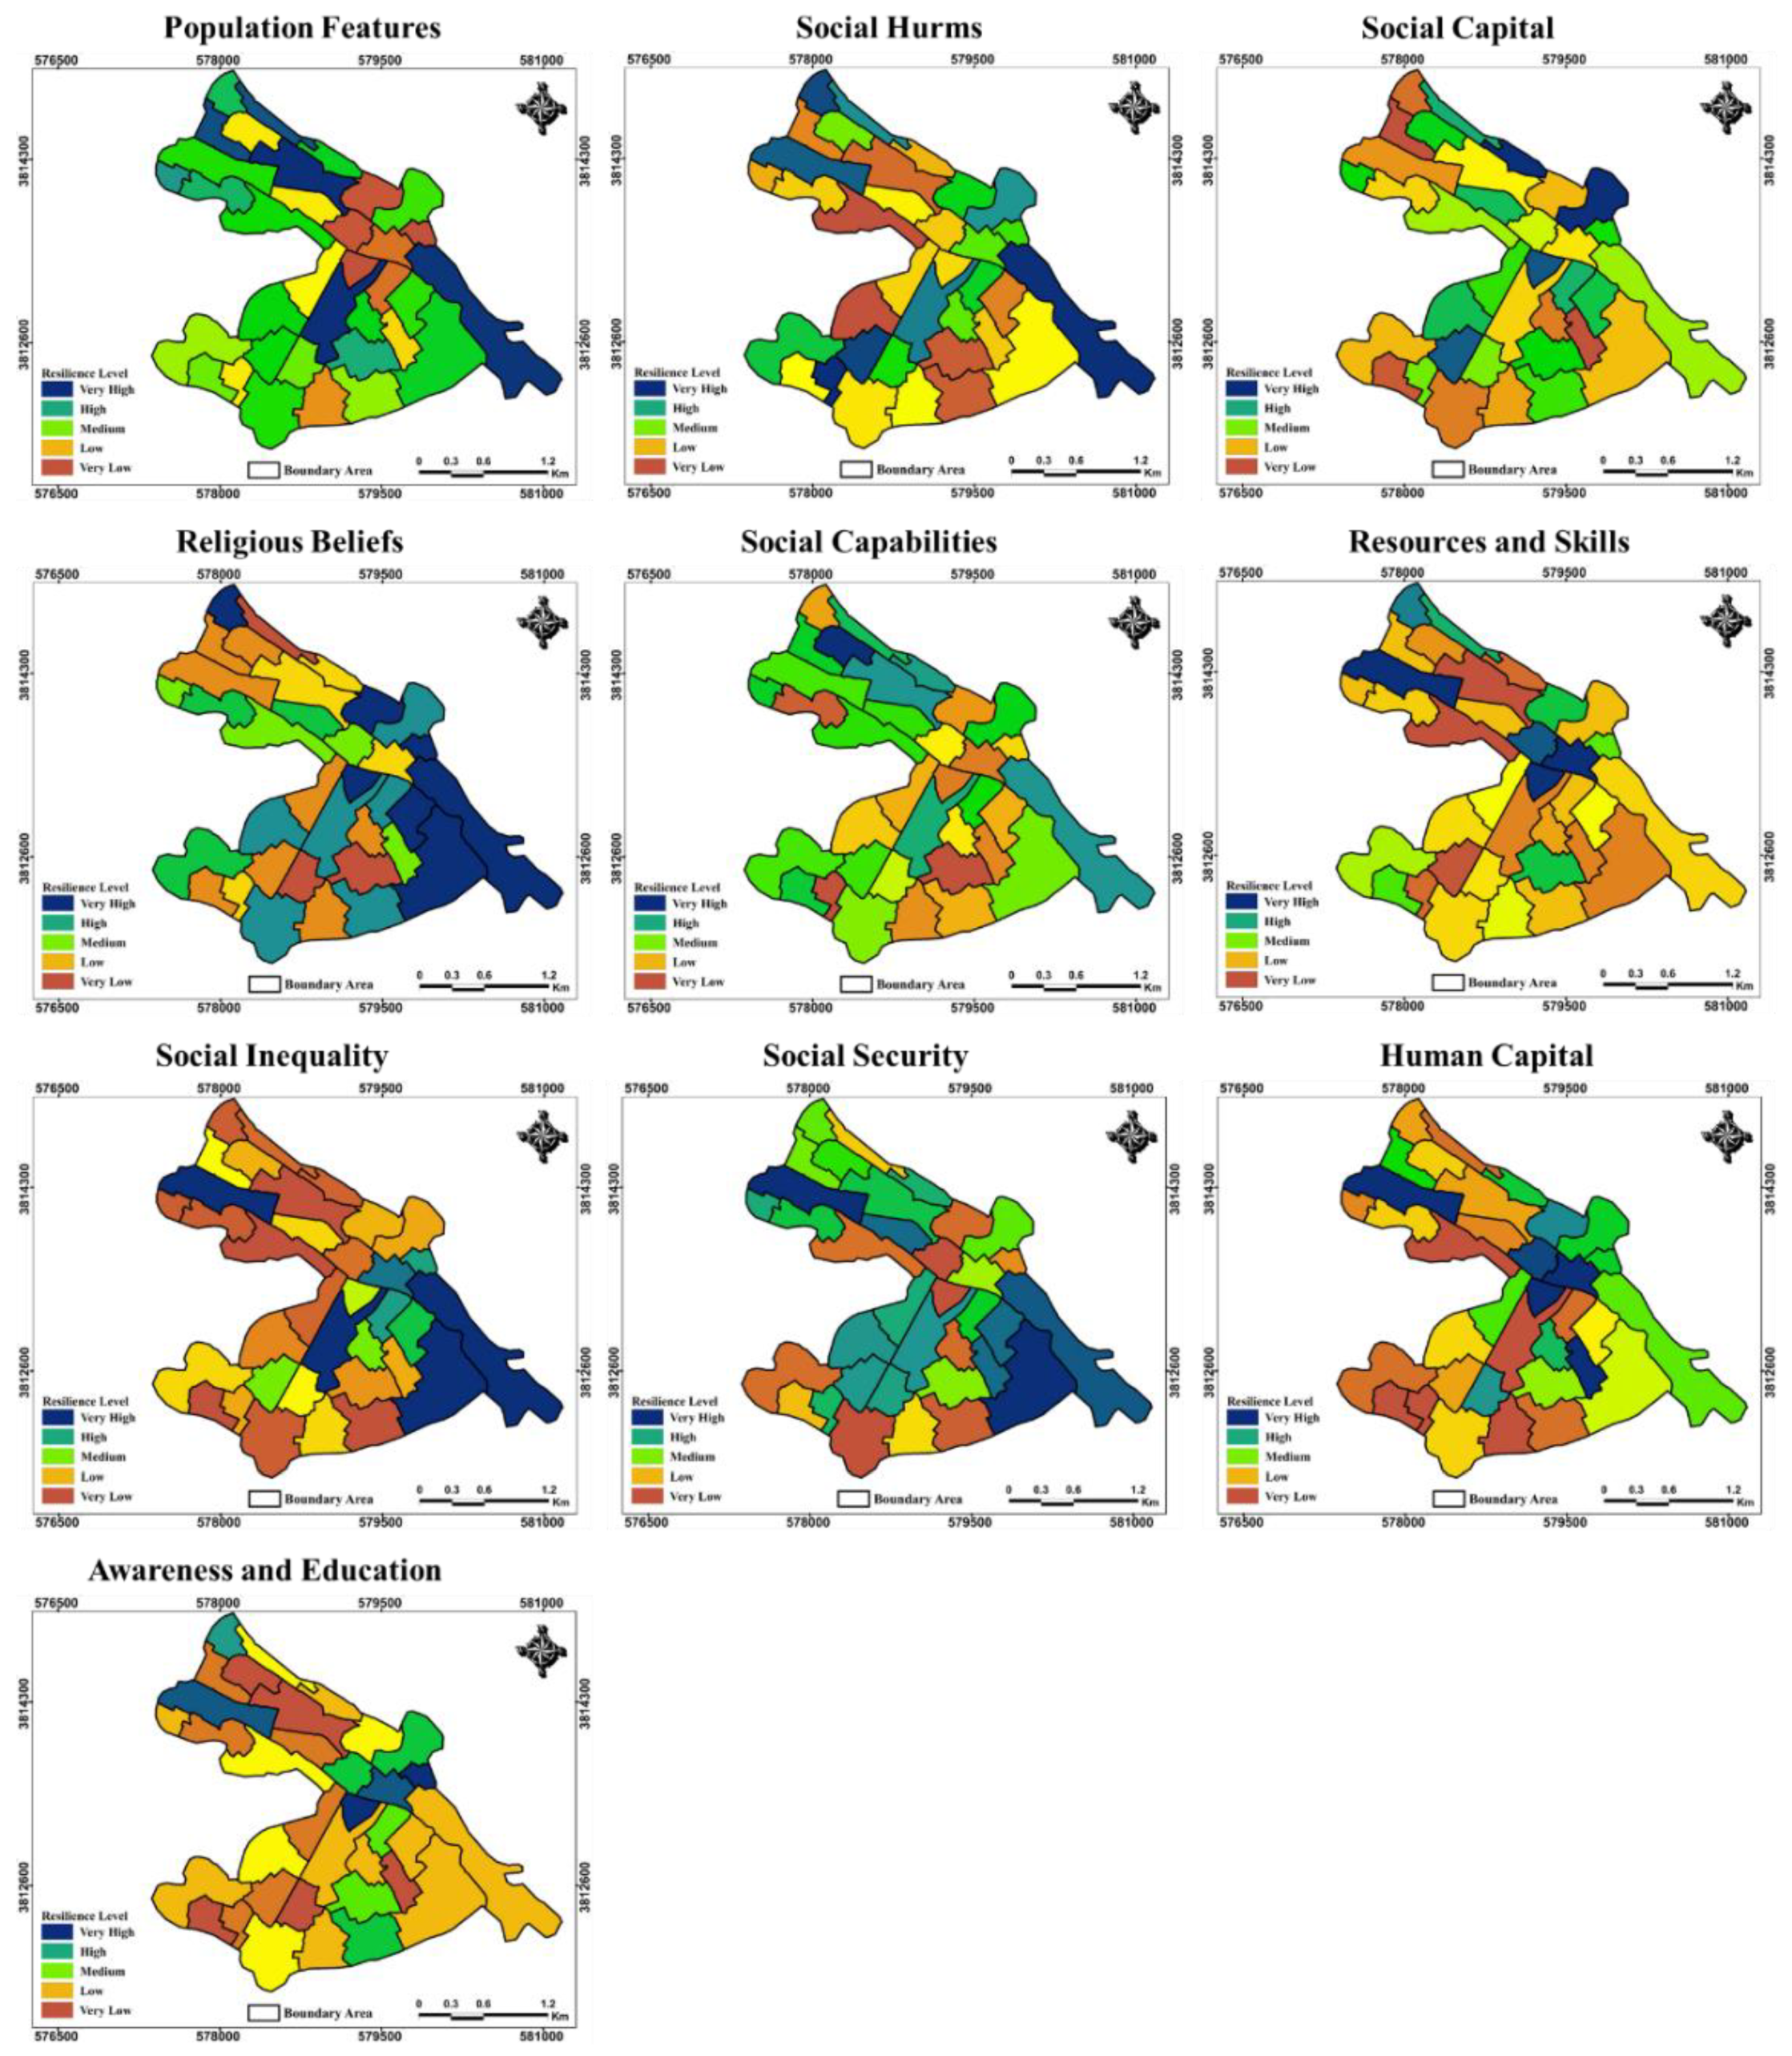
| Demographic Characteristics | Age Structure (population aged under 15 and over 65); Literacy Status; Gender (ratio); Population Density; Immigration; Female-headed households; Occupation Status | Population and its characteristics are among the most important criteria affecting the rate of resilience in a region. In order to achieve a resilient society, special attention should be given to the demographic structure and context of the regions and their changes. Accurate knowledge about the demographic structure of a region before, during and after the occurrence of hazards, is of particular importance. | [11,12,40,41,42,51,52,53] |
| Social harms | Poverty; Addiction; Suicide; Divorce | Social harms disturb relationships between members of the society, cause failures in social relations and lead to inability of society to integrate itself; this can be one of the important factors reducing the resilience of societies against crises. | [12,17,54,55,56,57] |
| Social Capital | Social Trust; Social Participation; Social Integrity; Social Awareness; Social Support; Social Networks; Social Relations | Social capital, referring to the social relations of individuals with each other, can have a very positive effect on social resilience and developing security in cities. The greater the amount of social capital in a region, the more resilient that region will be in the course of a crisis. | [12,46,51,58,59,60,61,62] |
| Religious Beliefs and Values | - | Beliefs are considered as an essential factor in strengthening the social resilience of societies against hazards, having an influential role in creating a sense of calmness, hope and returning to a pre-crisis state. | [43,44,63,64] |
| The General Capability of Local Community | Sense of Belonging to a Place; Sympathy and Altruism; Cooperation | Membership in the local community is one of the necessities for resilience and an important resource for encouraging community members to be efficiently capable when faced with challenges. With a sense of local community, participation in social networks takes form and capabilities of individuals increase capabilities of the community to use internal resources when encountering crises. | [12,45,46,47,65,66] |
| Resources and Skills | - | Resources and skills in a society are positively correlated with social resilience of that society against crises, because they promote the qualities of time and effort spent on planning | [10,12,44,65,67,68,69] |
| Social Inequality | - | Inequalities lead a society to mistrustfulness, isolation and lawlessness; strengthening such unfairness leads to forming a kind of anger caused by disparities in individuals. This will affect social ties and break individual and group relationships. | [45,46,50,62,65] |
| Social Security | Theft; Murder; Individual Conflicts; Group Conflicts | In a society that has maximum security, it will be easily possible to implement knowledge of design and construction related to encountering hazards, through strengthening these features to achieve resilience. | [12,48,49,54] |
| Human Assets | Public Health; Having Trained and Skilled Workforce | Human assets bring flexibility power, which is one of the principals of resilience. Having a sufficient, skilled and trained workforce is a prerequisite for economic development and capacity building. This means that the more human assets available in society, equals more capacity to develop better resilience. | [11,40,46,62,70,71,72] |
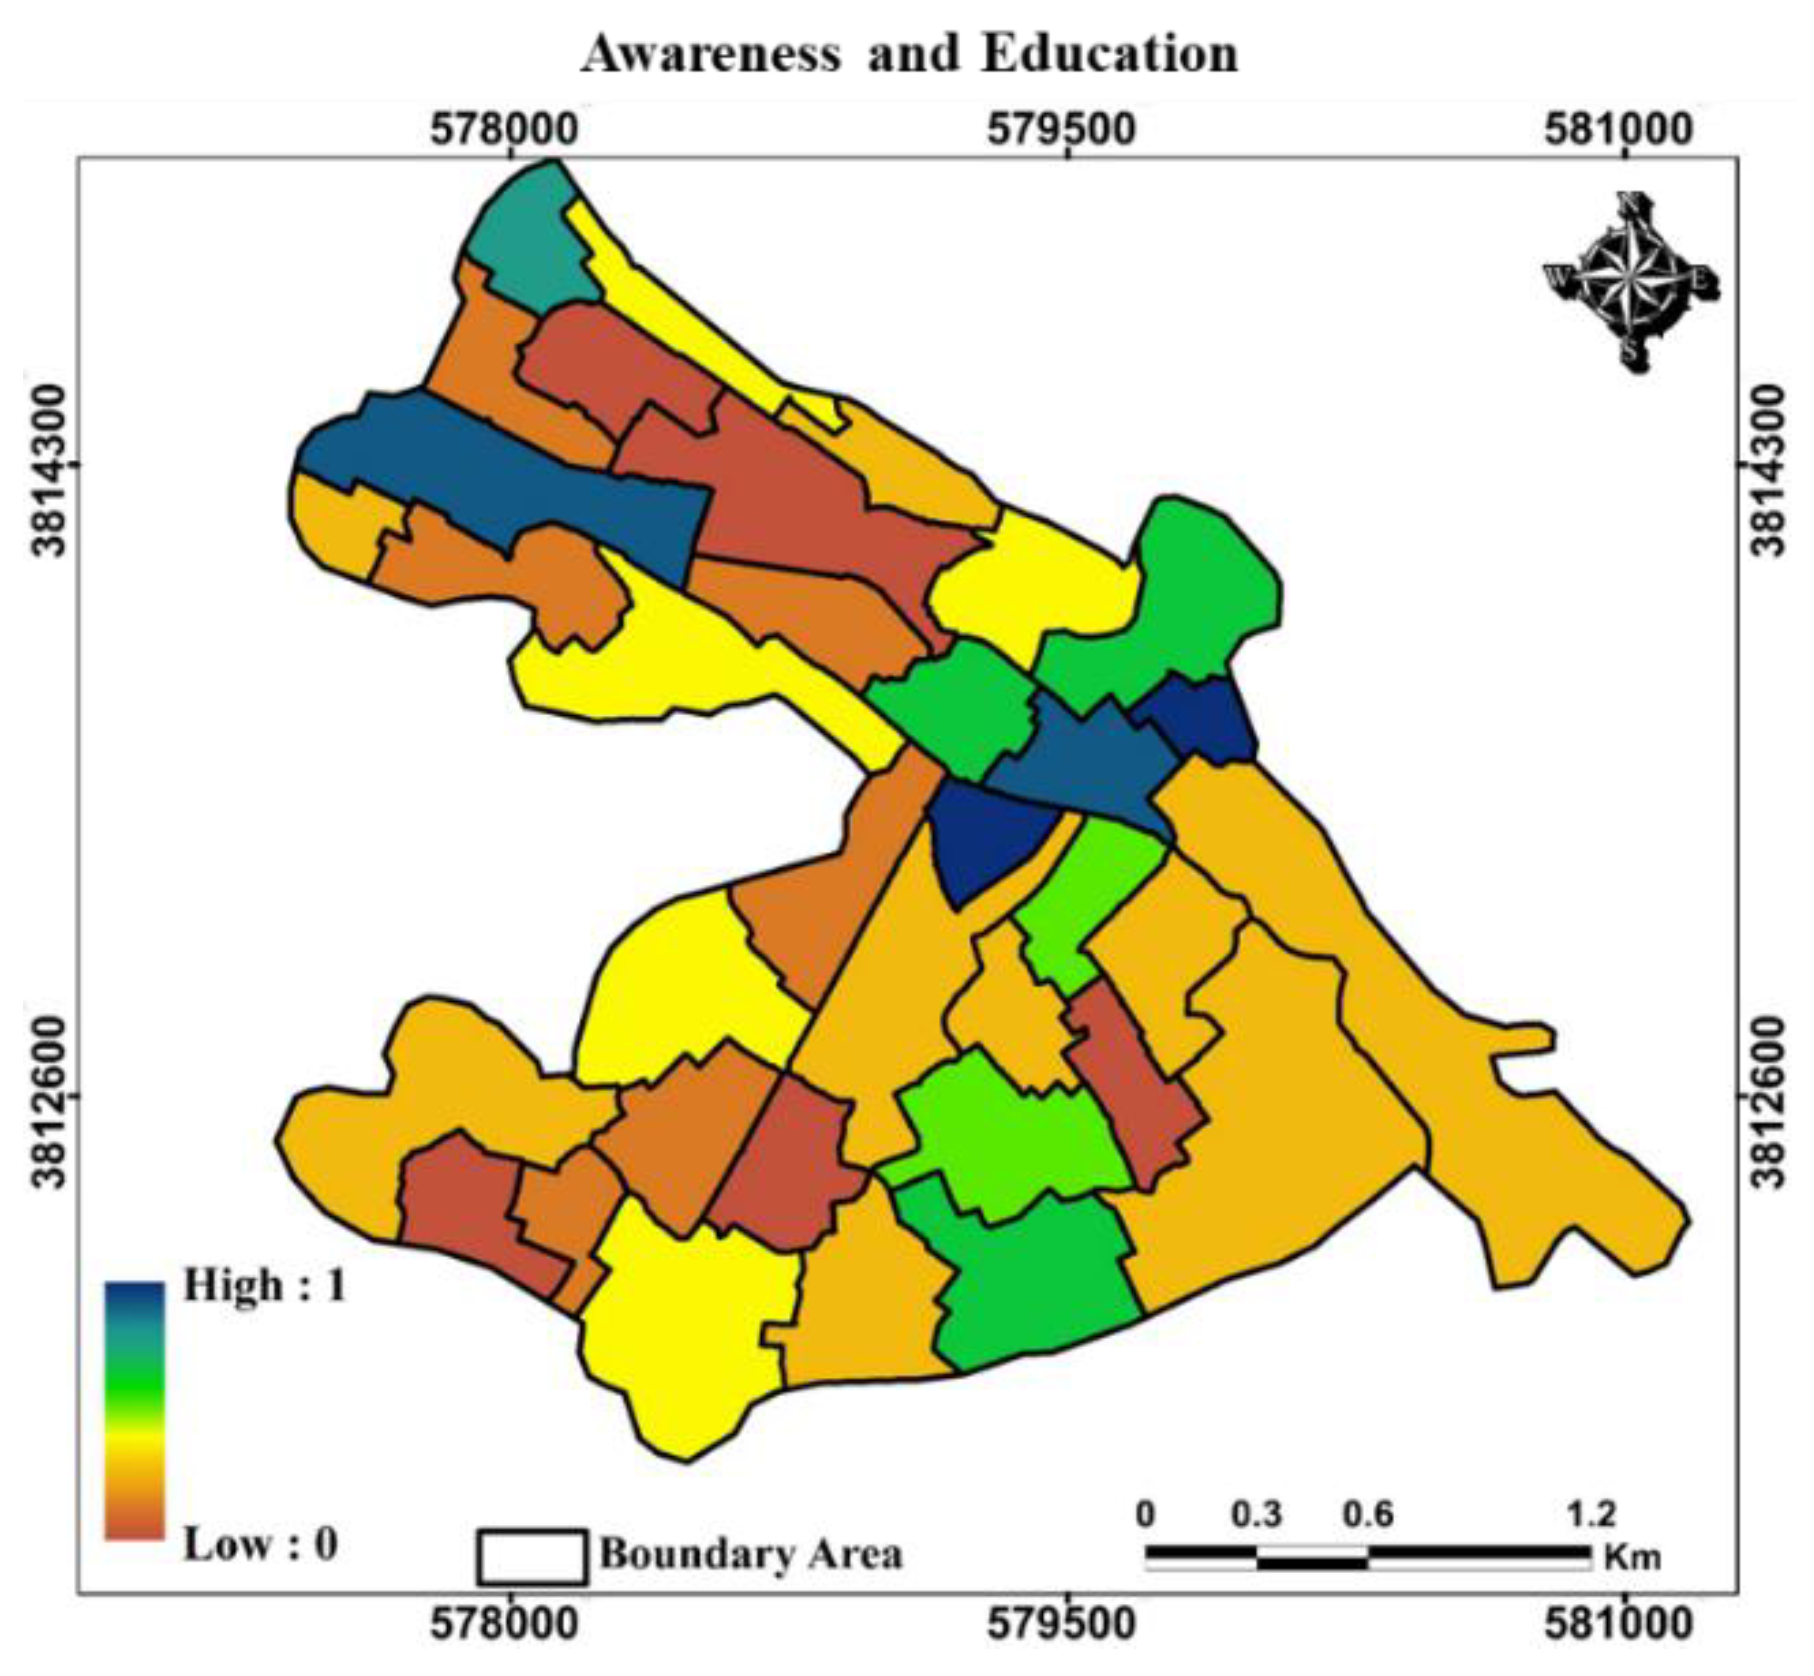
| Awareness and ducation | - | The level of public awareness and knowledge about the incidents that might threaten them is very effective in building resilience of society and for proper reaction to the events; thus, greatly reducing the damage inflicted. | [11,47,62,65,66,72,73] |
| Row | Data | Format | Source |
|---|---|---|---|
| 1 | Demographic Characteristics | Vector (polygon) | Civil Registration Organization and Statistics Center of Iran |
| 2 | Social harms | Vector (polygon) | National Plan for Family Conversations and Statistics Center of Iran |
| 3 | Social Capital | Vector (polygon) | Sarpol-e Zahab Health Center and Statistical Center of Iran |
| 4 | Religious Beliefs and Values | Vector (polygon) | Questionnaire |
| 5 | The General Capability of Local Community | Vector (polygon) | Questionnaire |
| 6 | Resources and Skills | Vector (polygon) | Questionnaire |
| 7 | Social Inequality | Vector (polygon) | Questionnaire |
| 8 | Social Security | Vector (polygon) | Sar-pol-e Zahab Police Force |
| 9 | Human Assets | Vector (polygon) | Questionnaire |
| 10 | Awareness and education | Vector (polygon) | Questionnaire |
| Equation | Applied Condition | Standardization Technique | |
|---|---|---|---|
| (1) | Minimum variables | Linear: Maximum-Minimum | |
| (2) | Maximum variables |
| Value | Status of Comparing i to j | Description |
|---|---|---|
| 1 | Similar Priority | Index i ranks similar to index j in terms of significance, or there is no priority. |
| 2 | A Little Prioritized | Index i slightly outranks index j in terms of significance. |
| 5 | Moderately Prioritized | Index i moderately outranks index j in terms of significance. |
| 7 | Highly Prioritized | Index i significantly outranks index j. |
| 9 | Absolutely Prioritized | Index i has absolute priority over index j. |
| 2-4-6-8 | In-between | These figures indicate “in-between” values; e.g., a value of 8, is higher in priority than 7, but lower than 9 for a given index (i). |
| Variables | Variable–Weight | CR * | Sub-Variables | Criterion Weight | CR | Criterion Type |
|---|---|---|---|---|---|---|
| Demographic Characteristics | 0.07 | 0.004 | Age Structure (population aged under 15 and over 65) | 0.23 | 0.002 | Minimum |
| Literacy Status | 0.19 | Maximum | ||||
| Gender (ratio) | 0.11 | Maximum | ||||
| Population Density | 0.28 | Minimum | ||||
| Immigration | 0.04 | Minimum | ||||
| Female-headed households | 0.07 | Minimum | ||||
| Occupation Status | 0.08 | Maximum | ||||
| Social Harms | 0.19 | Poverty | 0.31 | 0.008 | Minimum | |
| Addiction | 0.26 | Minimum | ||||
| Suicide | 0.24 | Minimum | ||||
| Divorce | 0.19 | Minimum | ||||
| Social Capital | 0.23 | Social Trust | 0.18 | 0.005 | Maximum | |
| Social Participation | 0.22 | Maximum | ||||
| Social Integrity | 0.12 | Maximum | ||||
| Social Awareness | 0.09 | Maximum | ||||
| Social Support | 0.08 | Maximum | ||||
| Social Networks | 0.16 | Maximum | ||||
| Social Relations | 0.15 | Maximum | ||||
| Religious Beliefs and Values | 0.01 | - | Maximum | |||
| The General Capability of Local Community | 0.05 | Sense of Belonging to a Place | 0.48 | 0.004 | Maximum | |
| Sympathy and Altruism | 0.13 | Maximum | ||||
| Cooperation | 0.39 | Maximum | ||||
| Resources and Skills | 0.09 | - | 0.001 | Maximum | ||
| Social Inequality | 0.14 | - | 0.005 | Minimum | ||
| Social Security | 0.11 | Theft | 0.28 | 0.005 | Minimum | |
| Murder | 0.37 | Minimum | ||||
| Individual Conflicts | 0.14 | Minimum | ||||
| Group Conflicts | 0.21 | Minimum | ||||
| Social Capital | 0.08 | Public Health | 0.68 | 0.008 | Maximum | |
| Having Trained and Skilled Workforce | 0.32 | Maximum | ||||
| Awareness and Education | 0.03 | - | 0.006 | Maximum | ||
Publisher’s Note: MDPI stays neutral with regard to jurisdictional claims in published maps and institutional affiliations. |
© 2022 by the authors. Licensee MDPI, Basel, Switzerland. This article is an open access article distributed under the terms and conditions of the Creative Commons Attribution (CC BY) license (https://creativecommons.org/licenses/by/4.0/).
Share and Cite
Shahpari Sani, D.; Heidari, M.T.; Tahmasebi Mogaddam, H.; Nadizadeh Shorabeh, S.; Yousefvand, S.; Karmpour, A.; Jokar Arsanjani, J. An Assessment of Social Resilience against Natural Hazards through Multi-Criteria Decision Making in Geographical Setting: A Case Study of Sarpol-e Zahab, Iran. Sustainability 2022, 14, 8304. https://doi.org/10.3390/su14148304
Shahpari Sani D, Heidari MT, Tahmasebi Mogaddam H, Nadizadeh Shorabeh S, Yousefvand S, Karmpour A, Jokar Arsanjani J. An Assessment of Social Resilience against Natural Hazards through Multi-Criteria Decision Making in Geographical Setting: A Case Study of Sarpol-e Zahab, Iran. Sustainability. 2022; 14(14):8304. https://doi.org/10.3390/su14148304
Chicago/Turabian StyleShahpari Sani, Davoud, Mohammad Taghi Heidari, Hossein Tahmasebi Mogaddam, Saman Nadizadeh Shorabeh, Saman Yousefvand, Anahita Karmpour, and Jamal Jokar Arsanjani. 2022. "An Assessment of Social Resilience against Natural Hazards through Multi-Criteria Decision Making in Geographical Setting: A Case Study of Sarpol-e Zahab, Iran" Sustainability 14, no. 14: 8304. https://doi.org/10.3390/su14148304