
Multi-Hazard Meteorological Disaster Risk Assessment for Agriculture Based on Historical Disaster Data in Jilin Province, China


Abstract
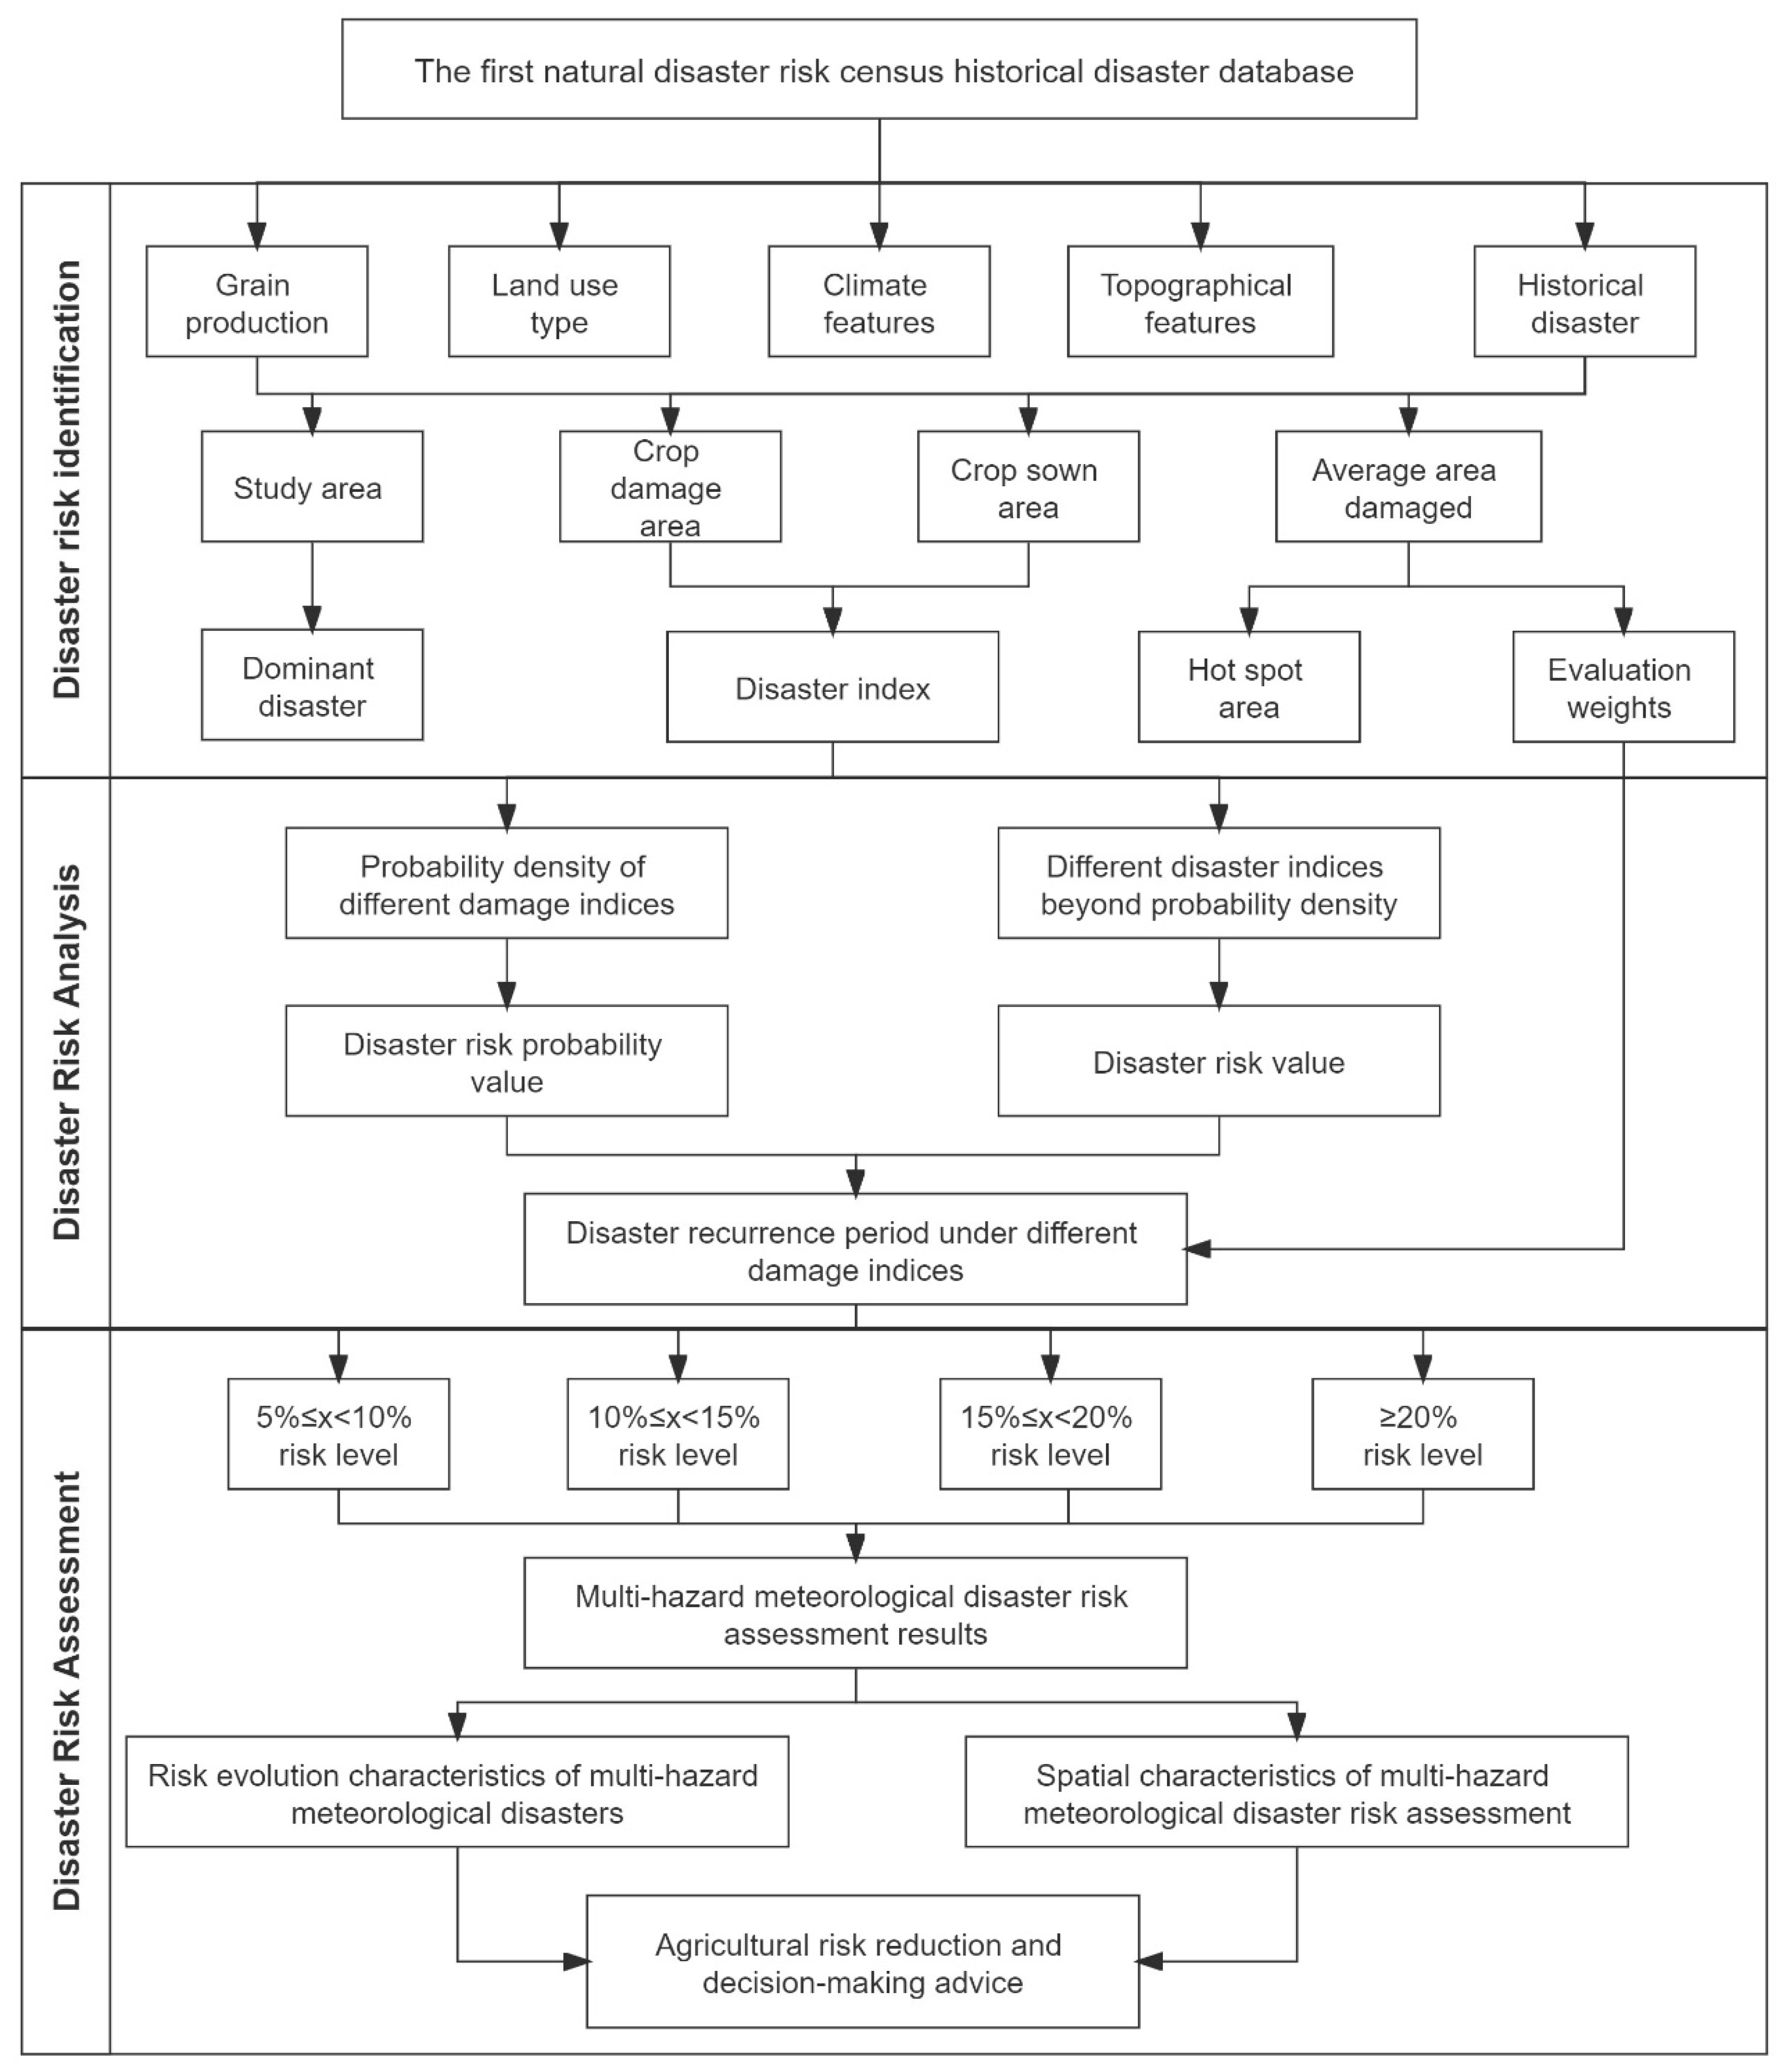
:1. Introduction
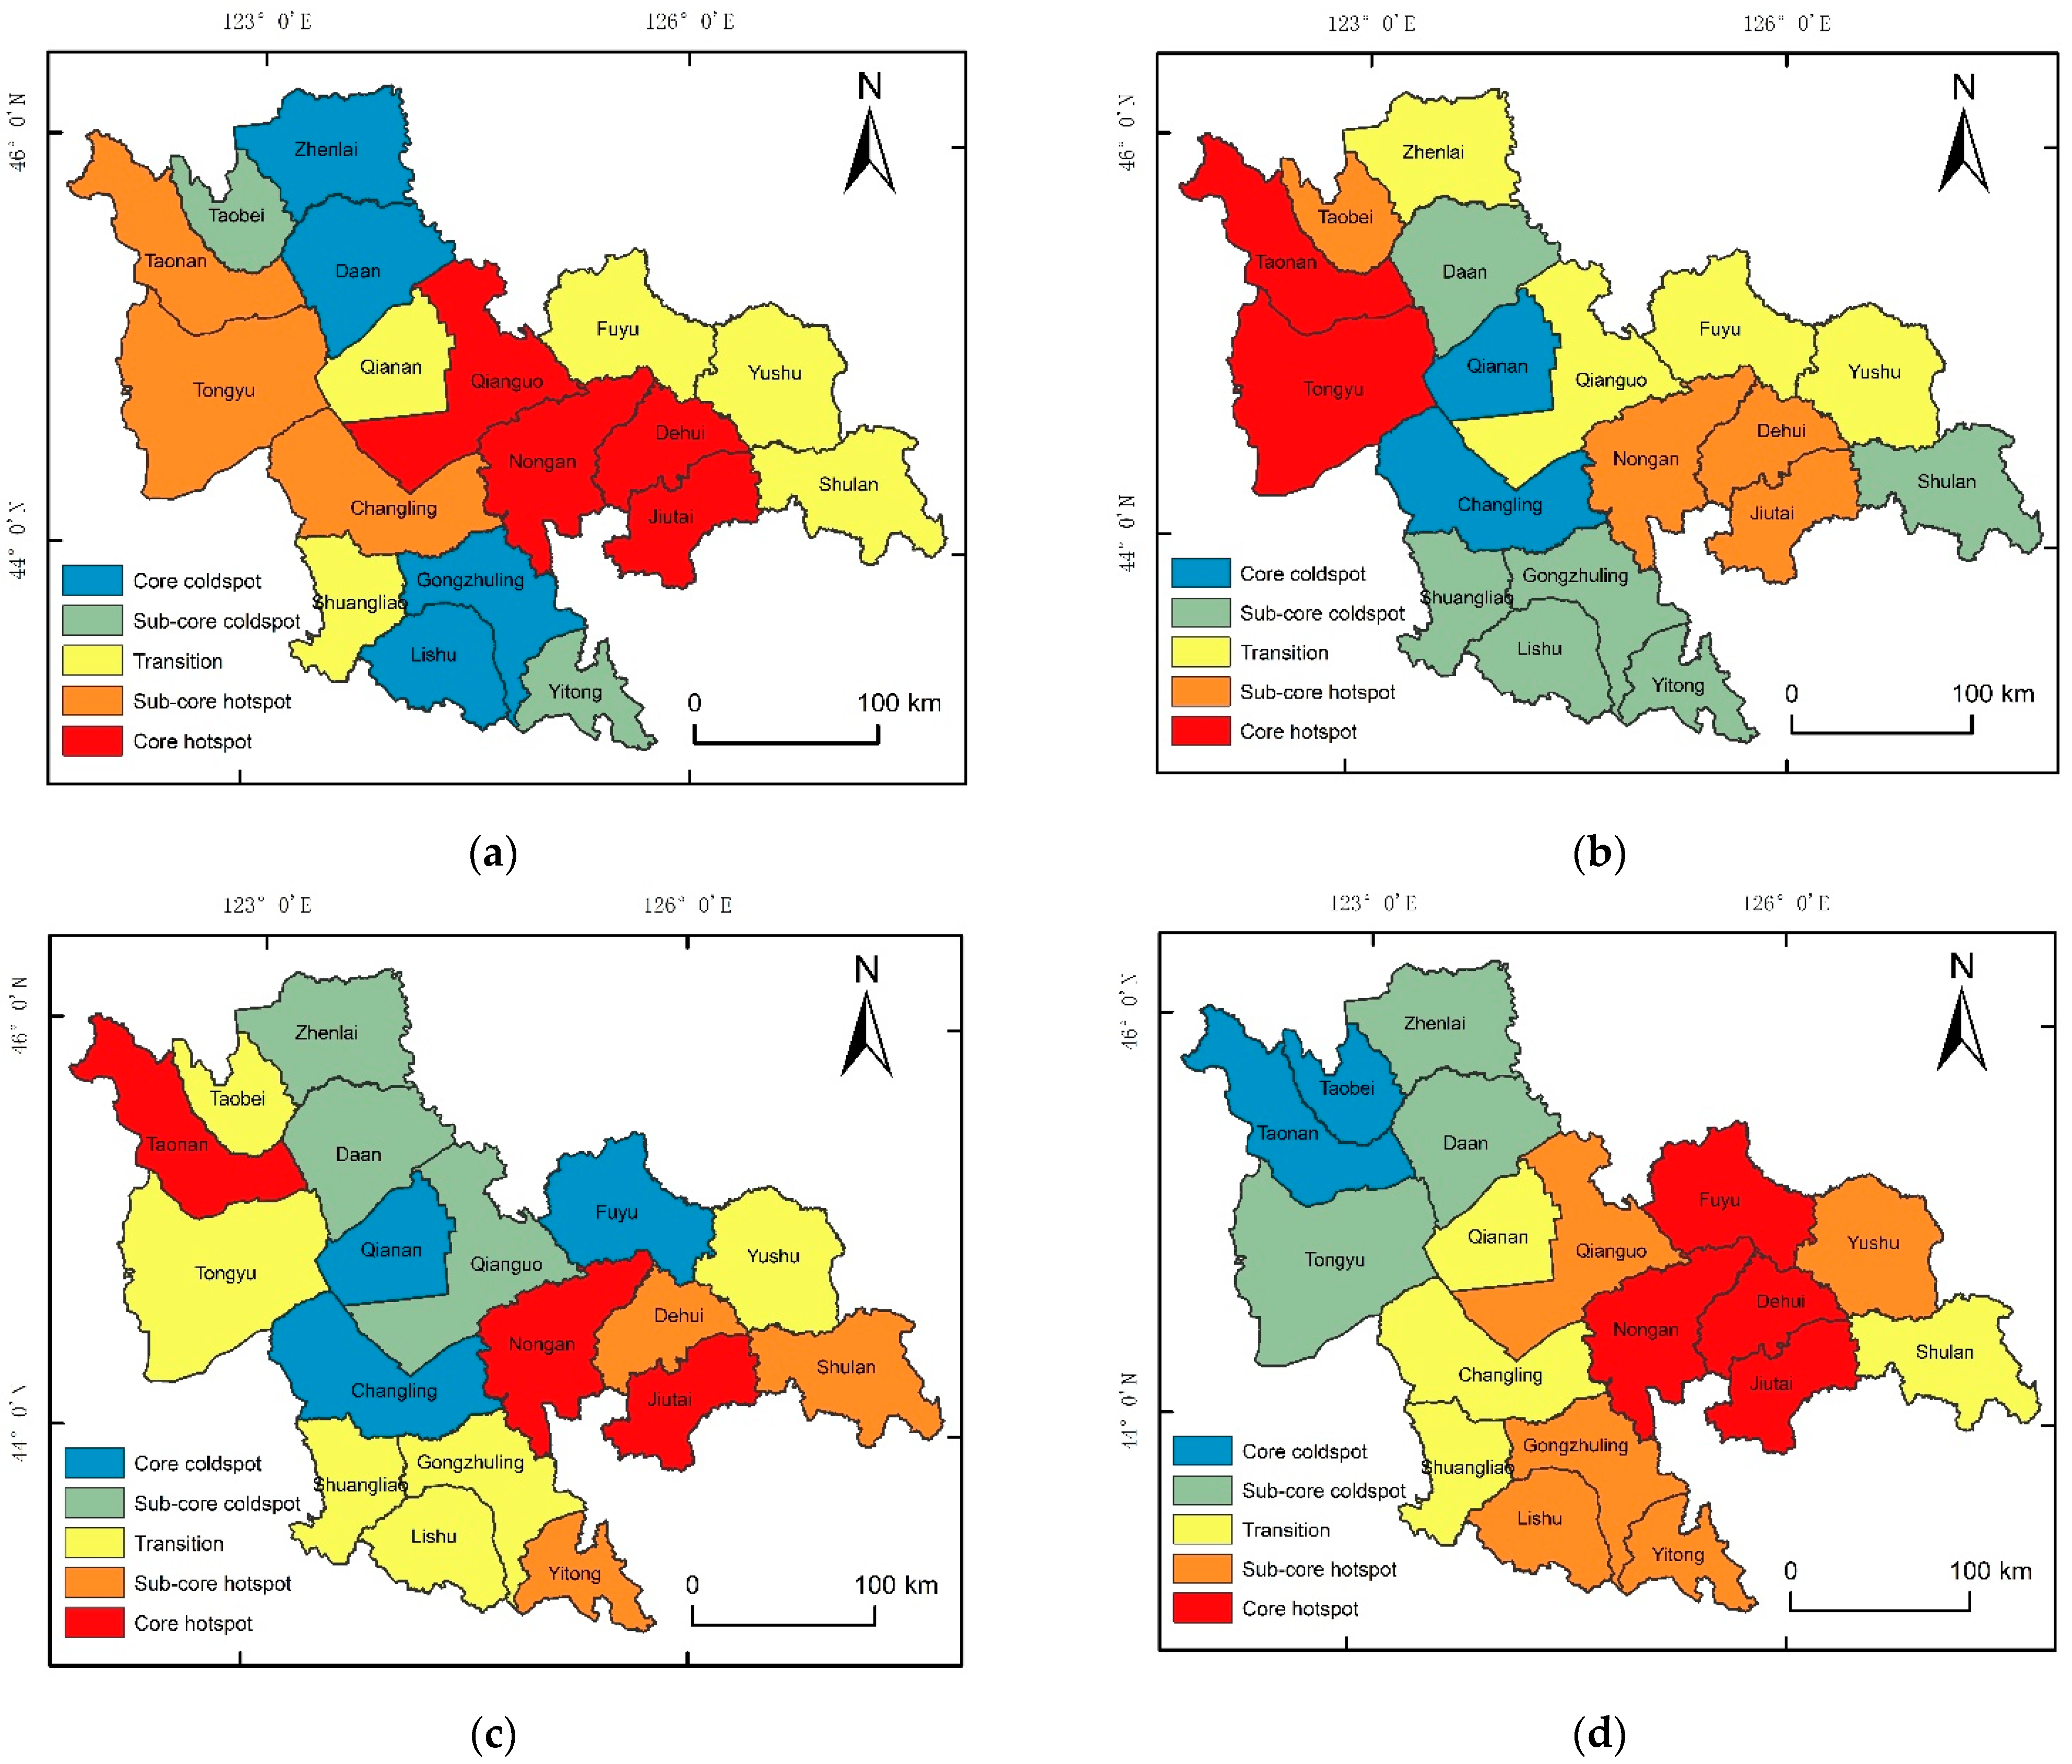
- Disaster risk identification: confirm the hotspots of various disasters in the study area;
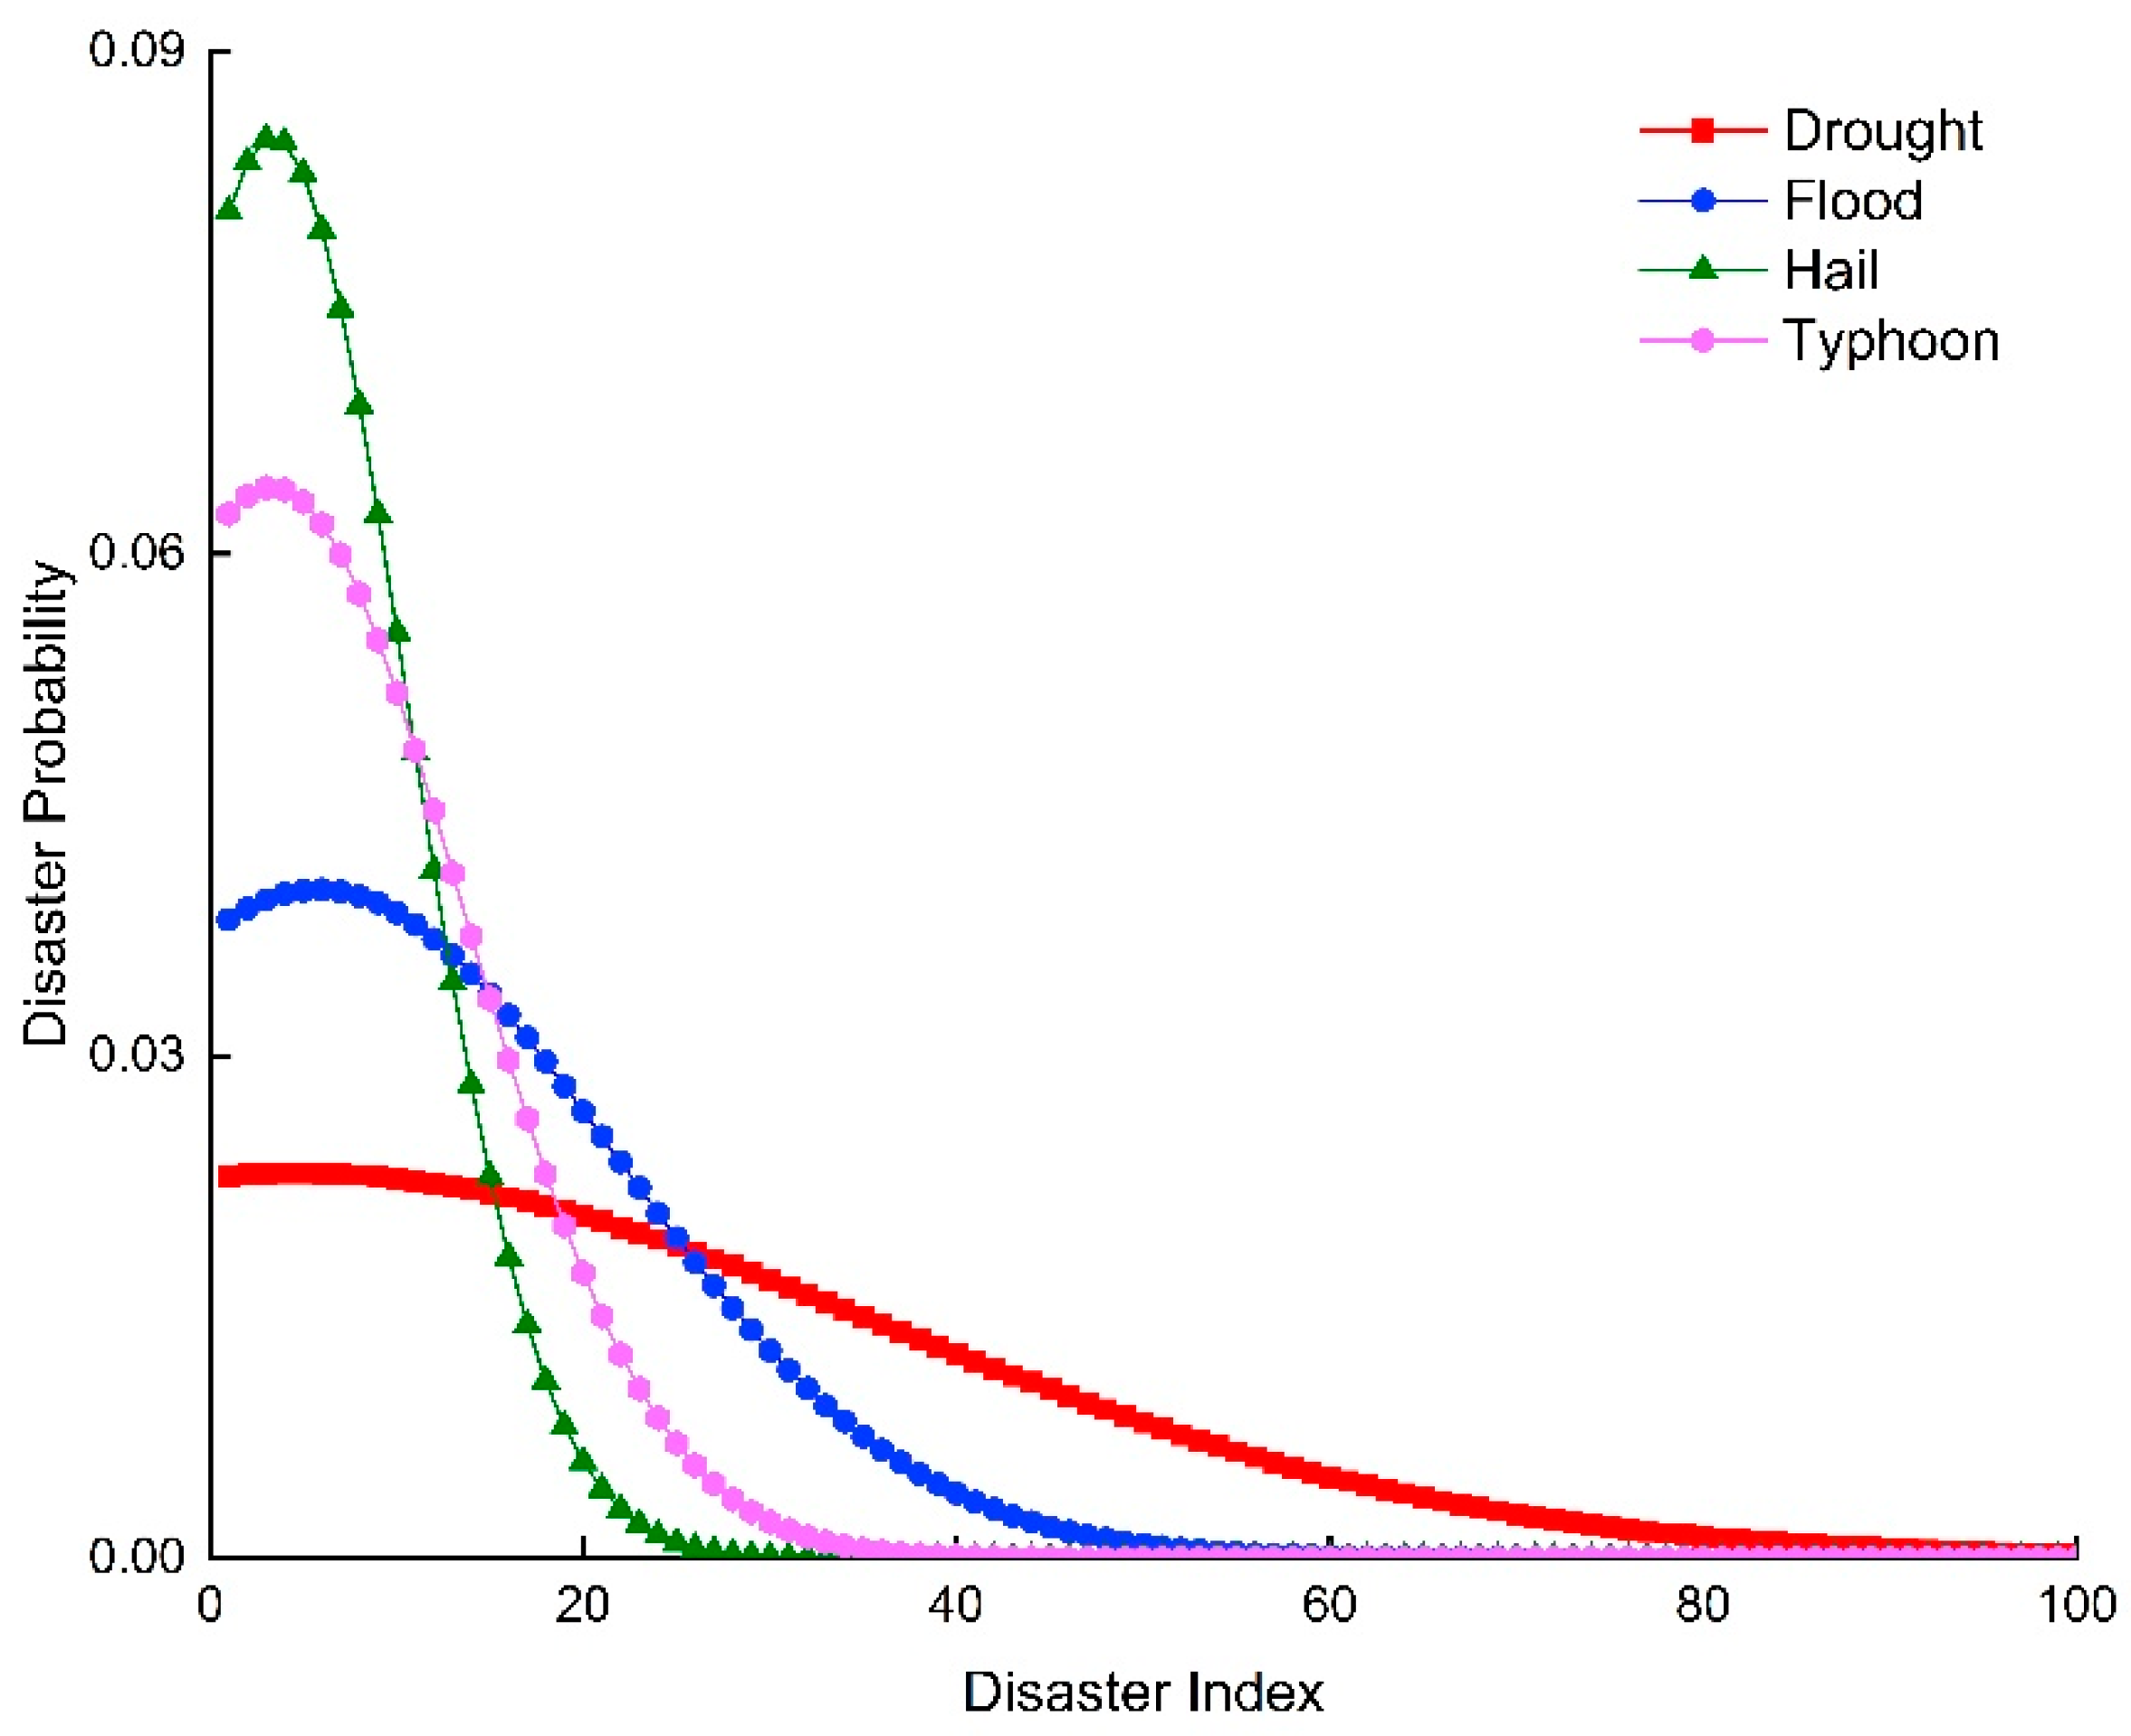
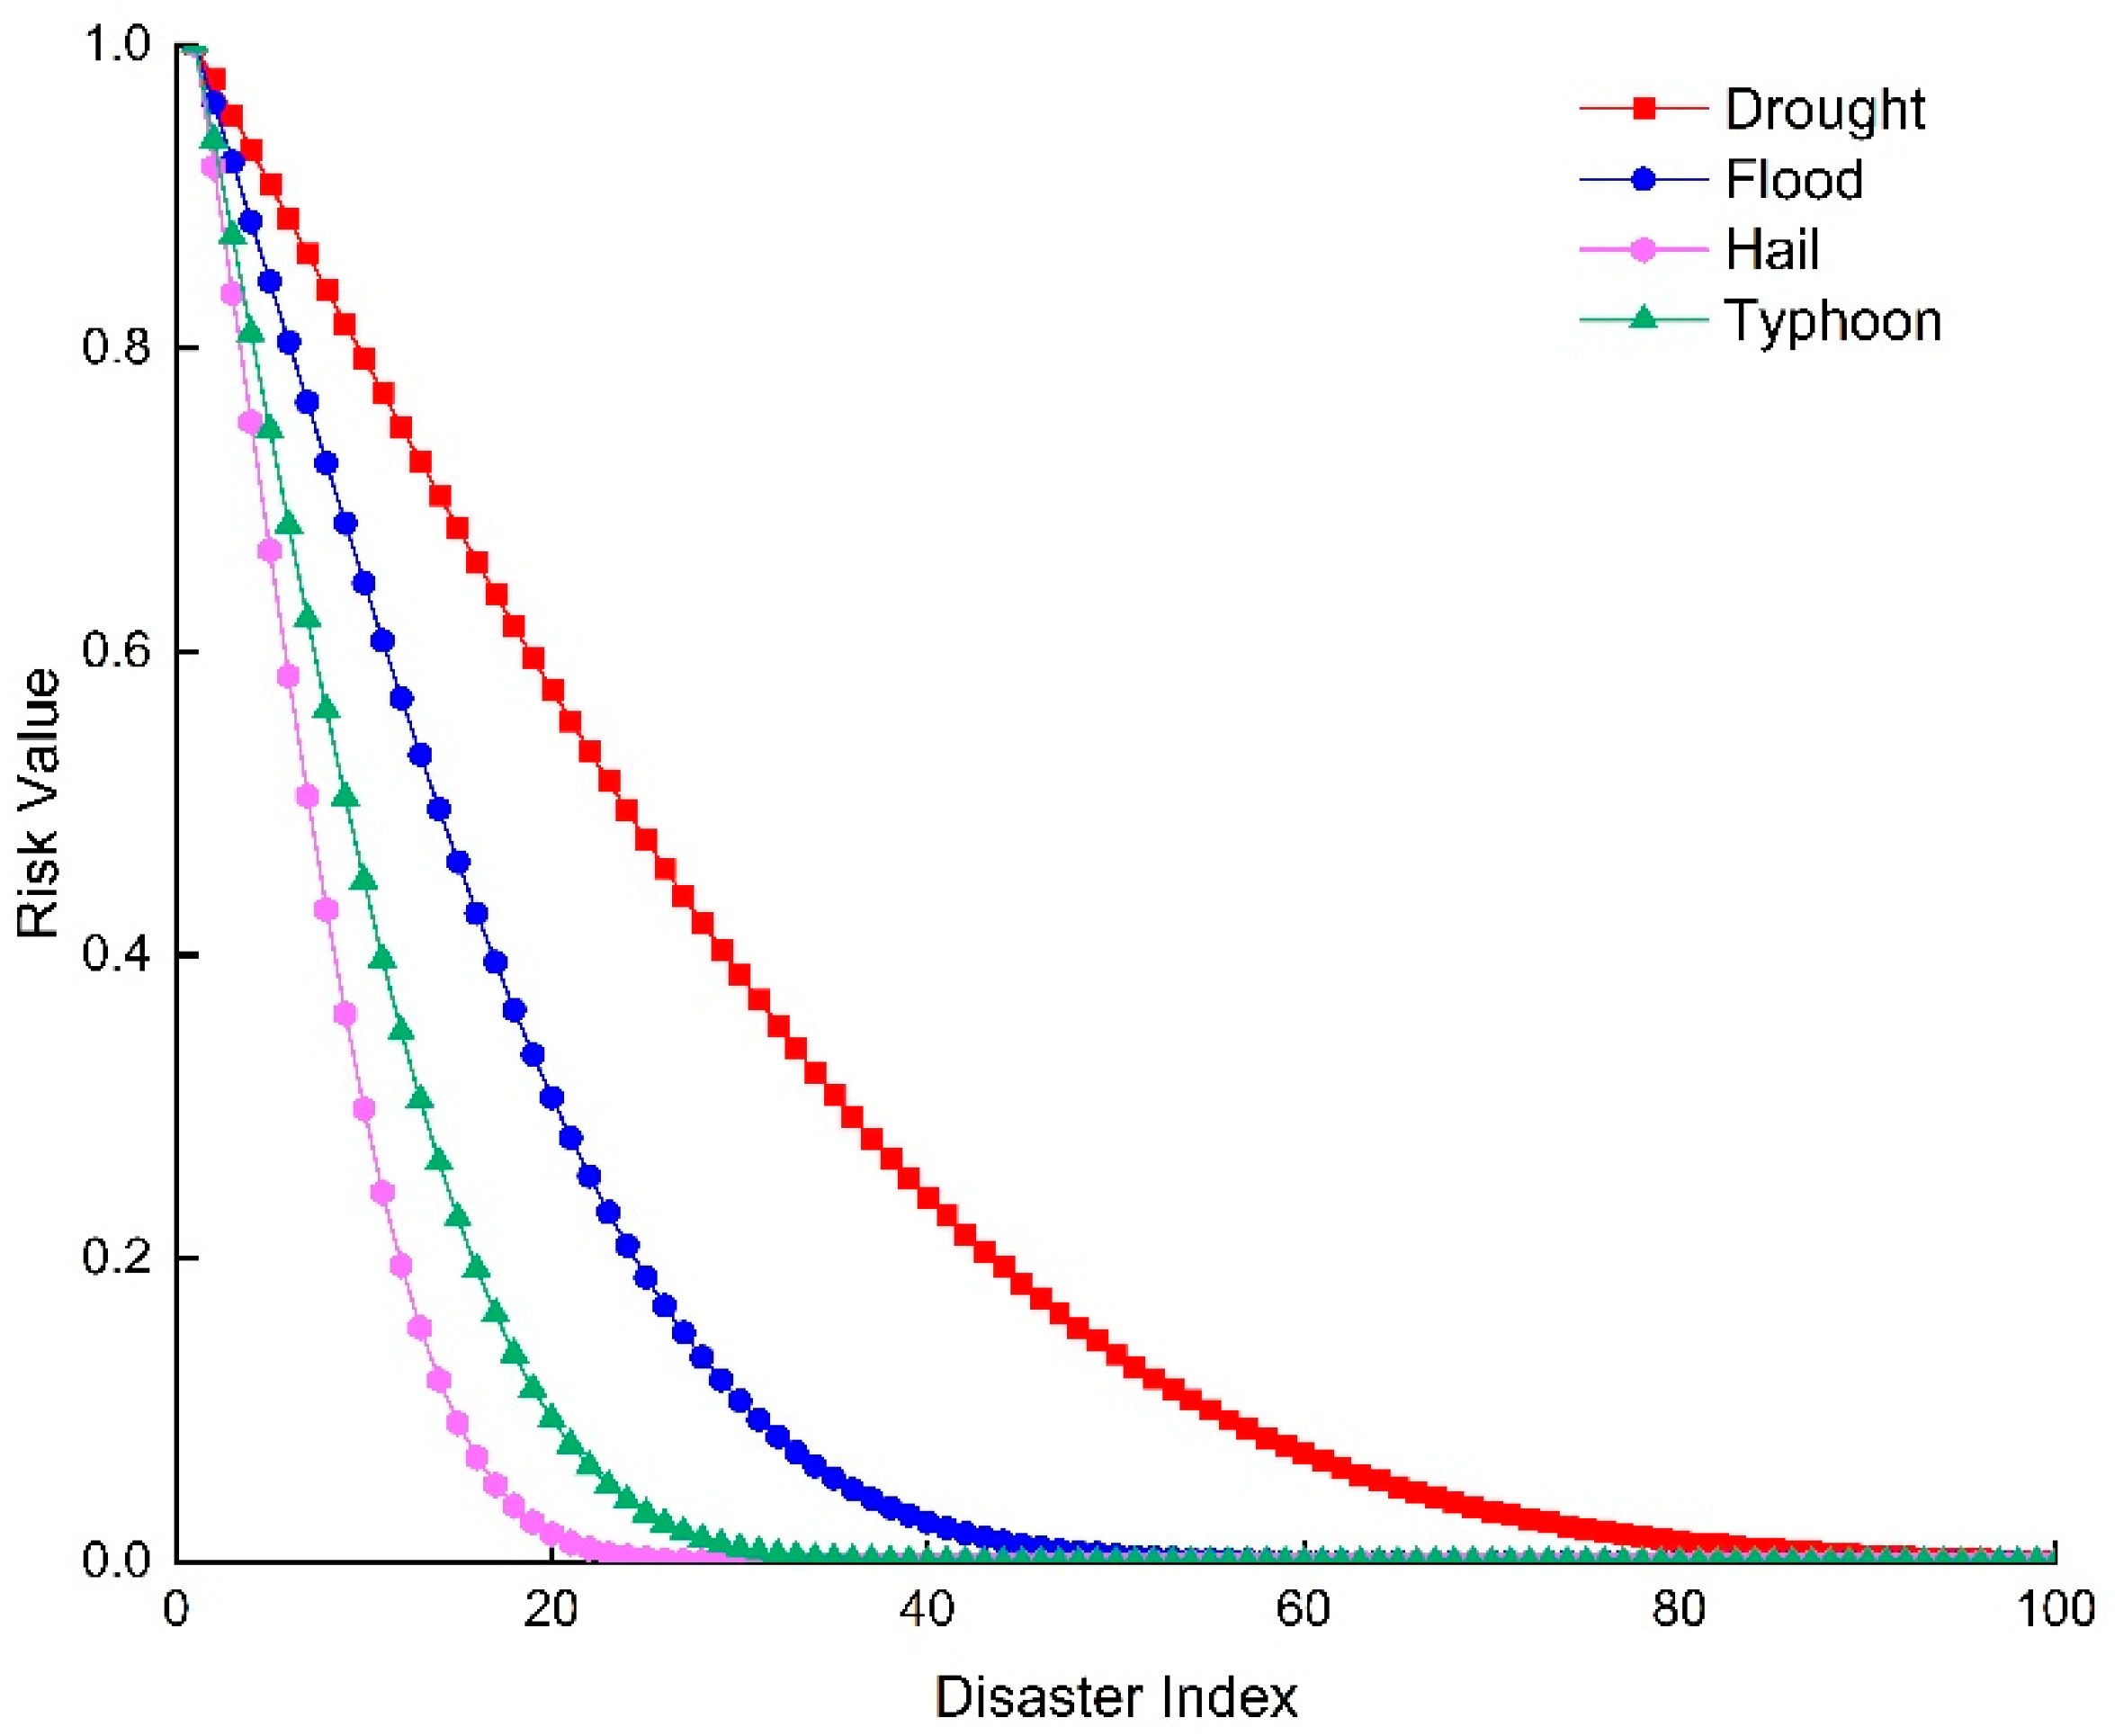
- Disaster risk analysis: calculate the meteorological disaster risk value of the study area and the weight of a single disaster risk in each region;
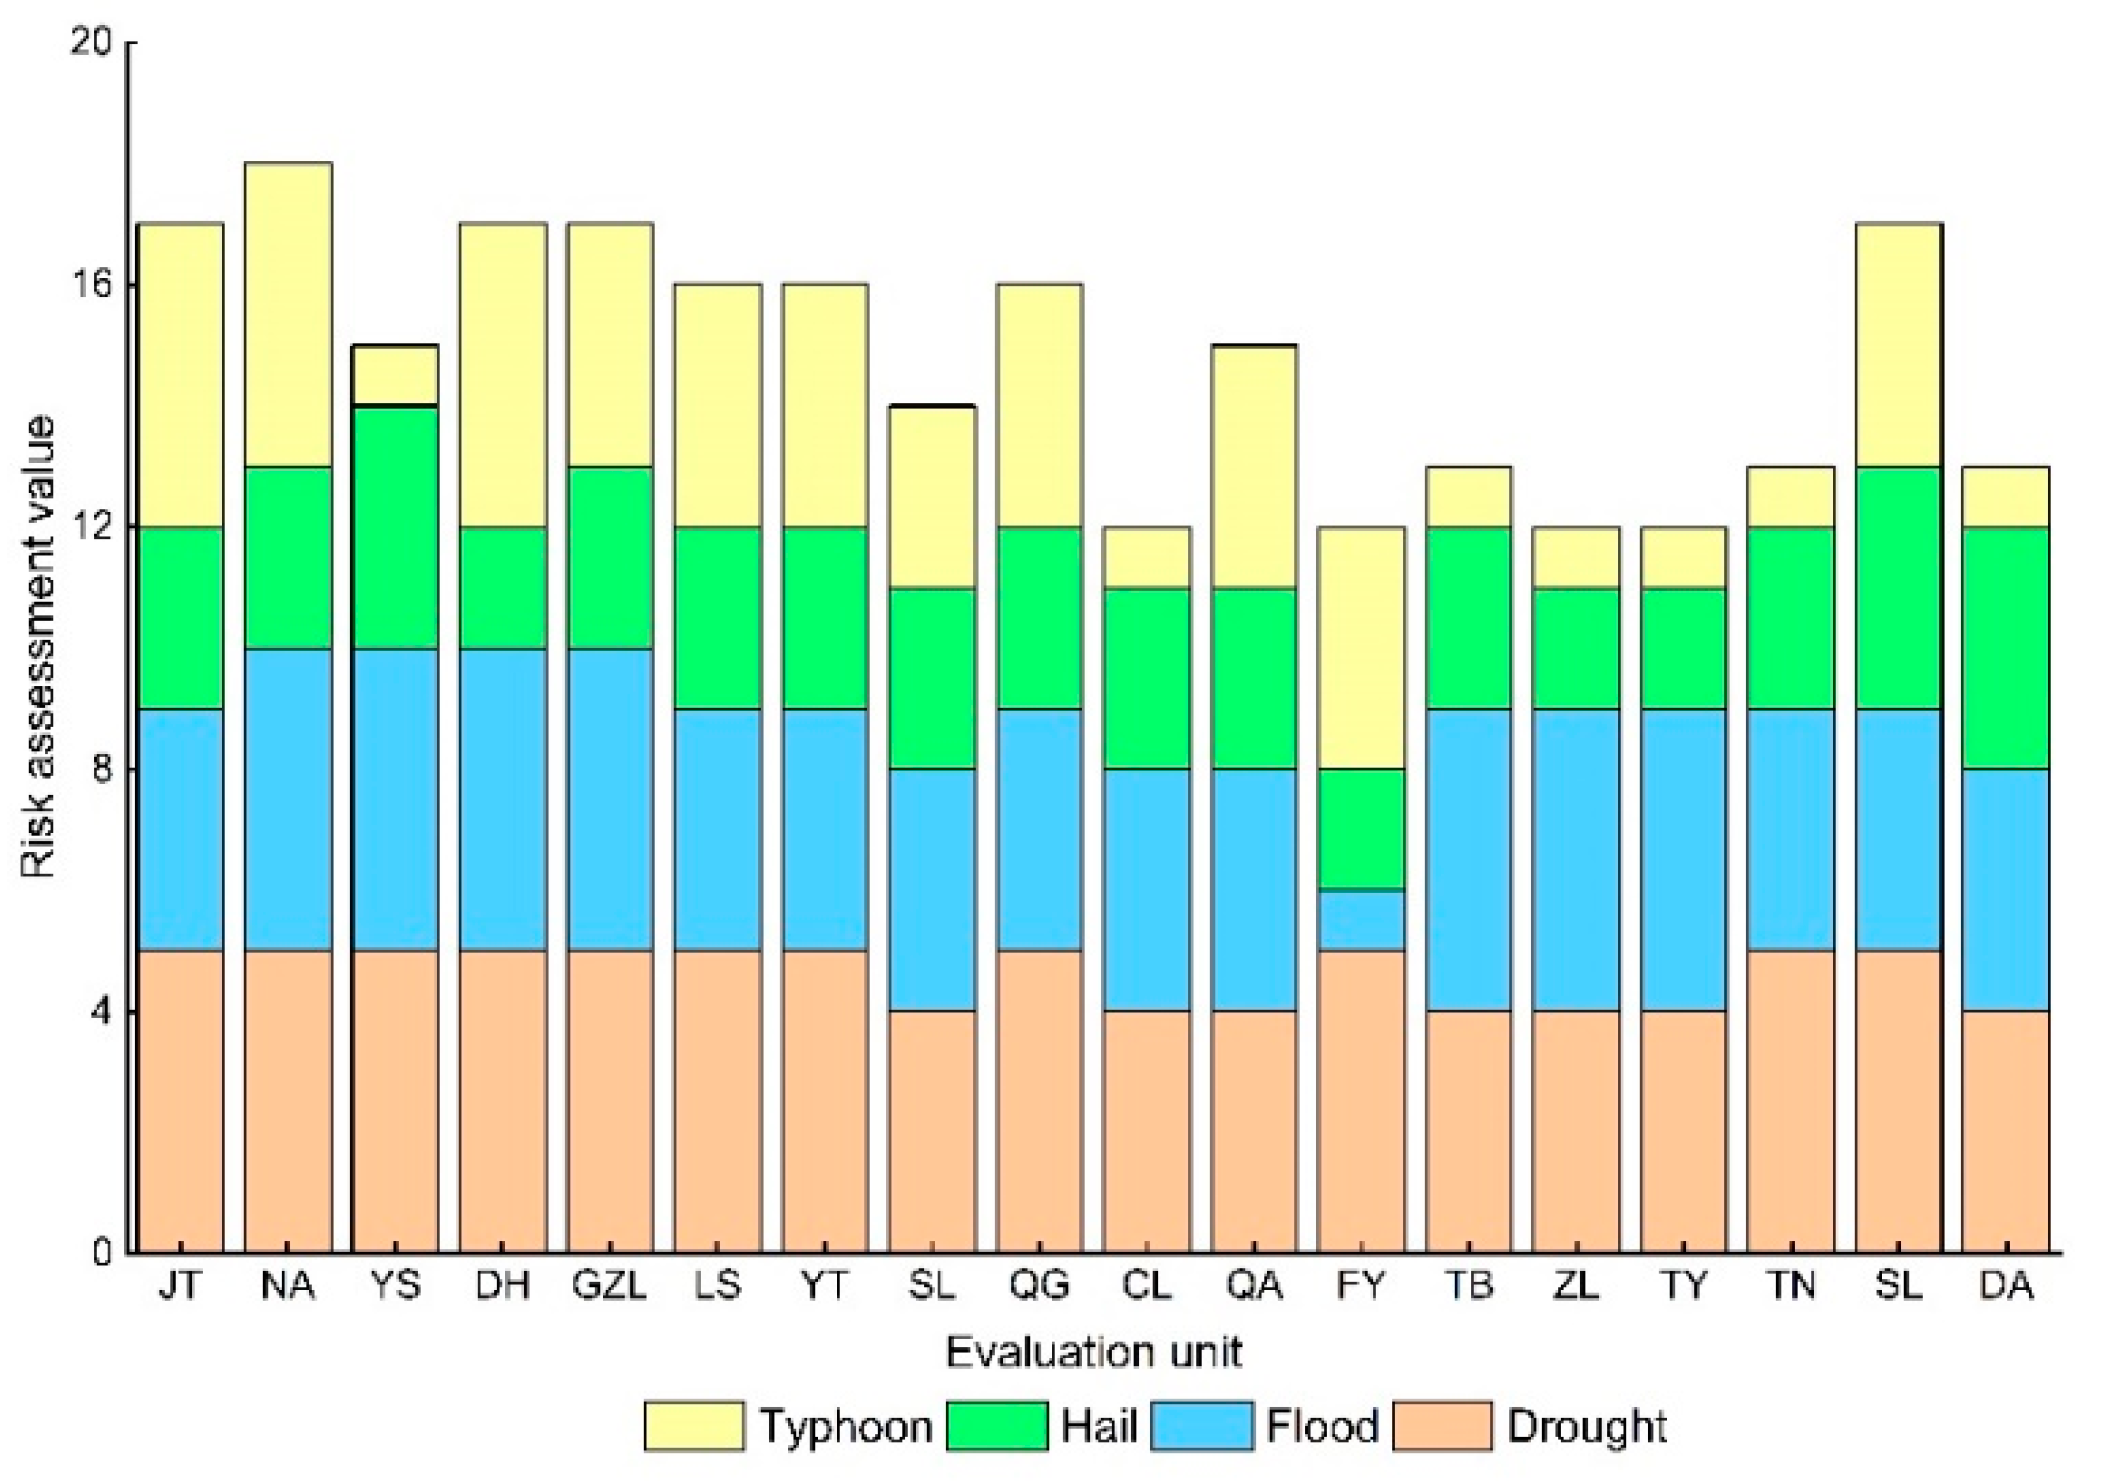
- Disaster risk assessment: determine the multi-hazard risk level and spatial differentiation in the study area;
- Disaster risk reduction: put forward three suggestions for the reduction of food safety production in the study area.
2. Materials and Methods
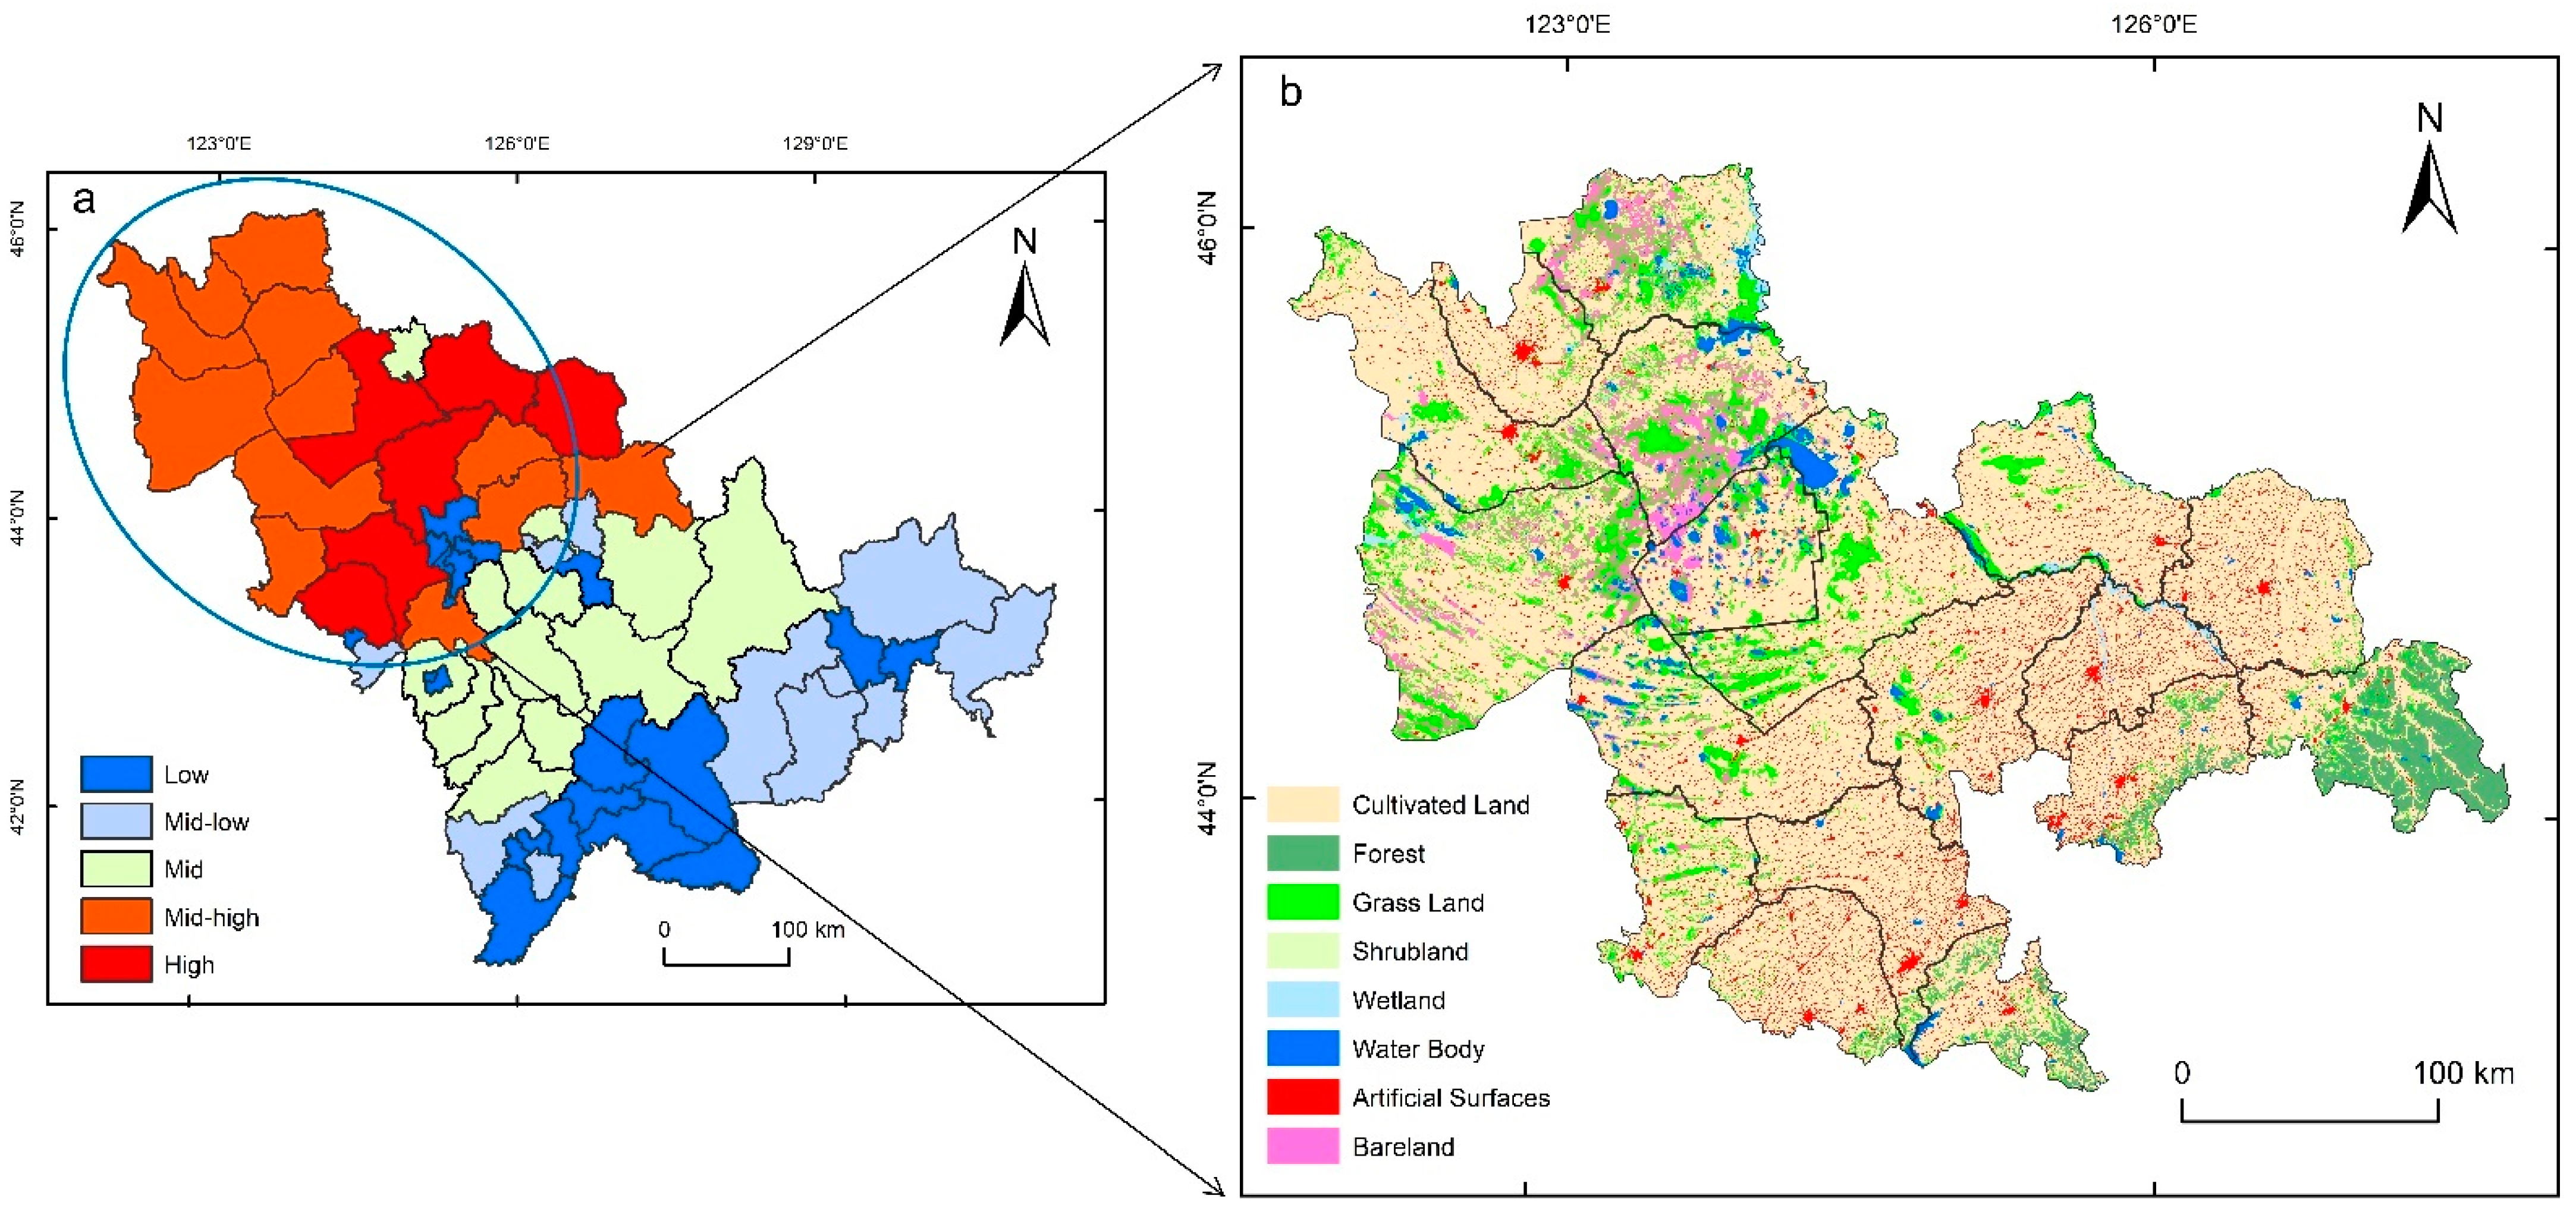
2.1. Study Area
2.2. Data Sources
2.3. Methodology
2.3.1. Fuzzy Risk Analysis Model
2.3.2. Entropy Weight Method
2.3.3. Hotspot Analysis
2.3.4. Ordinary Kriging
3. Results and Discussion
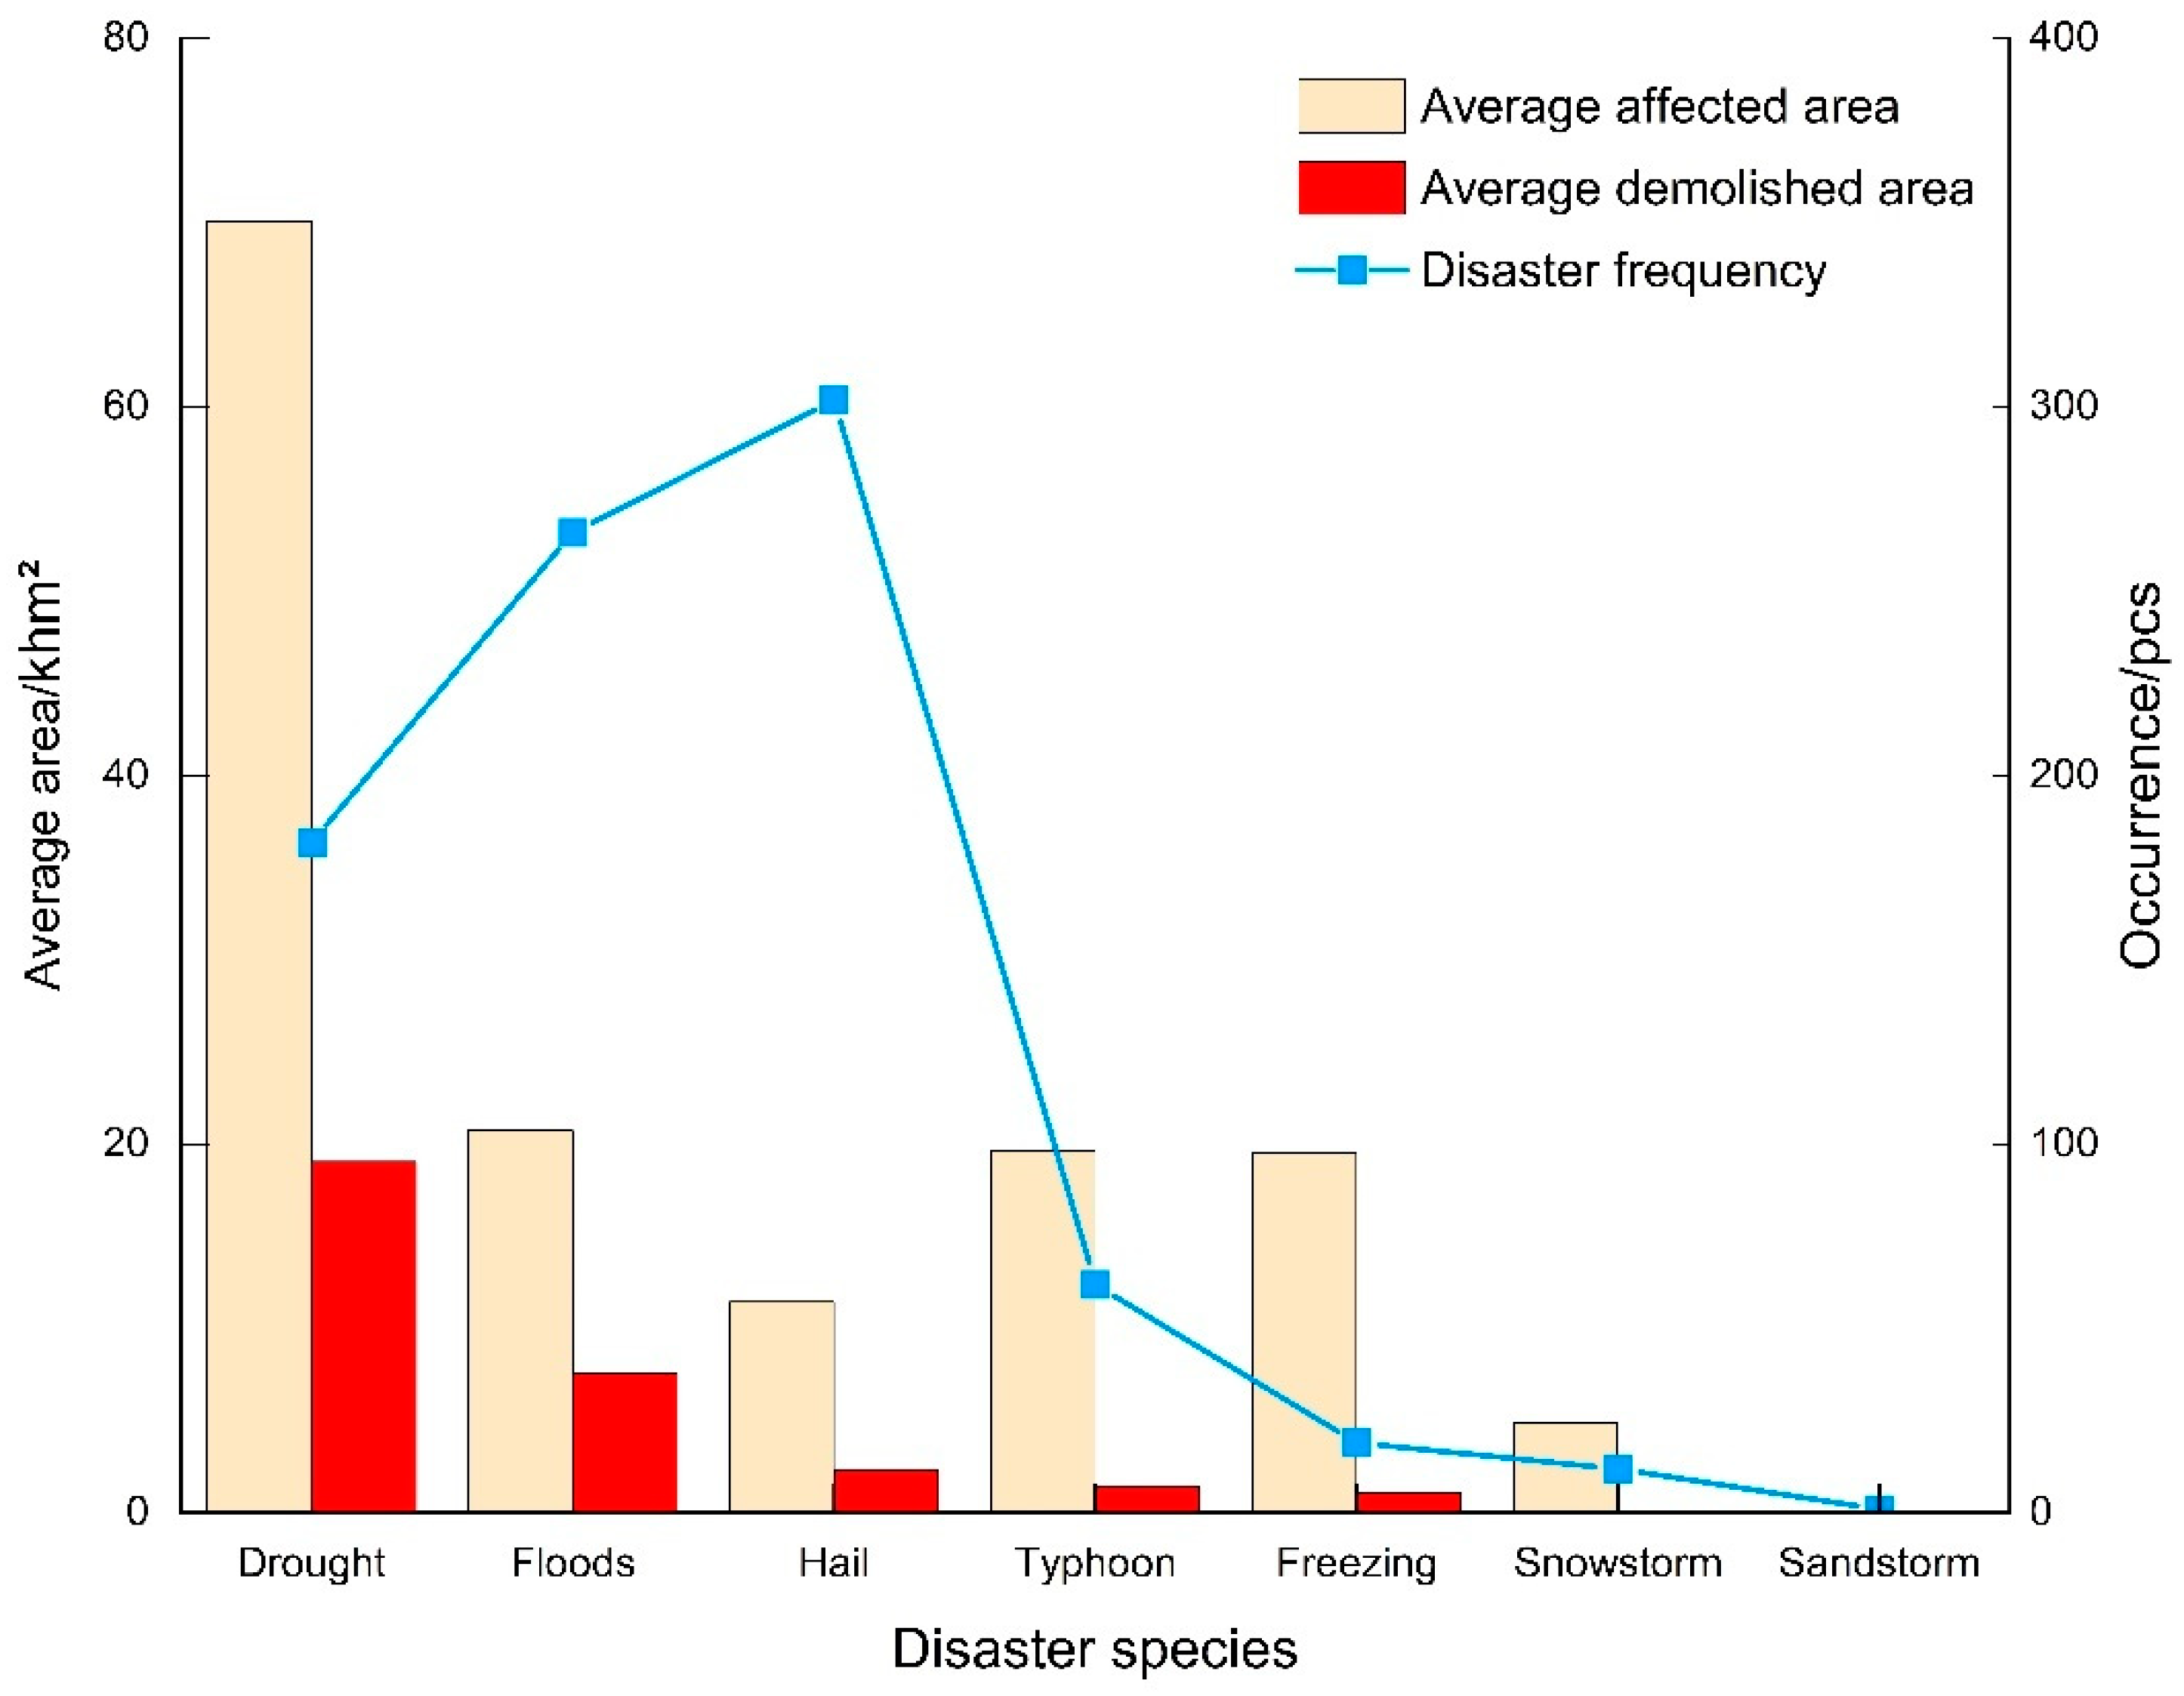
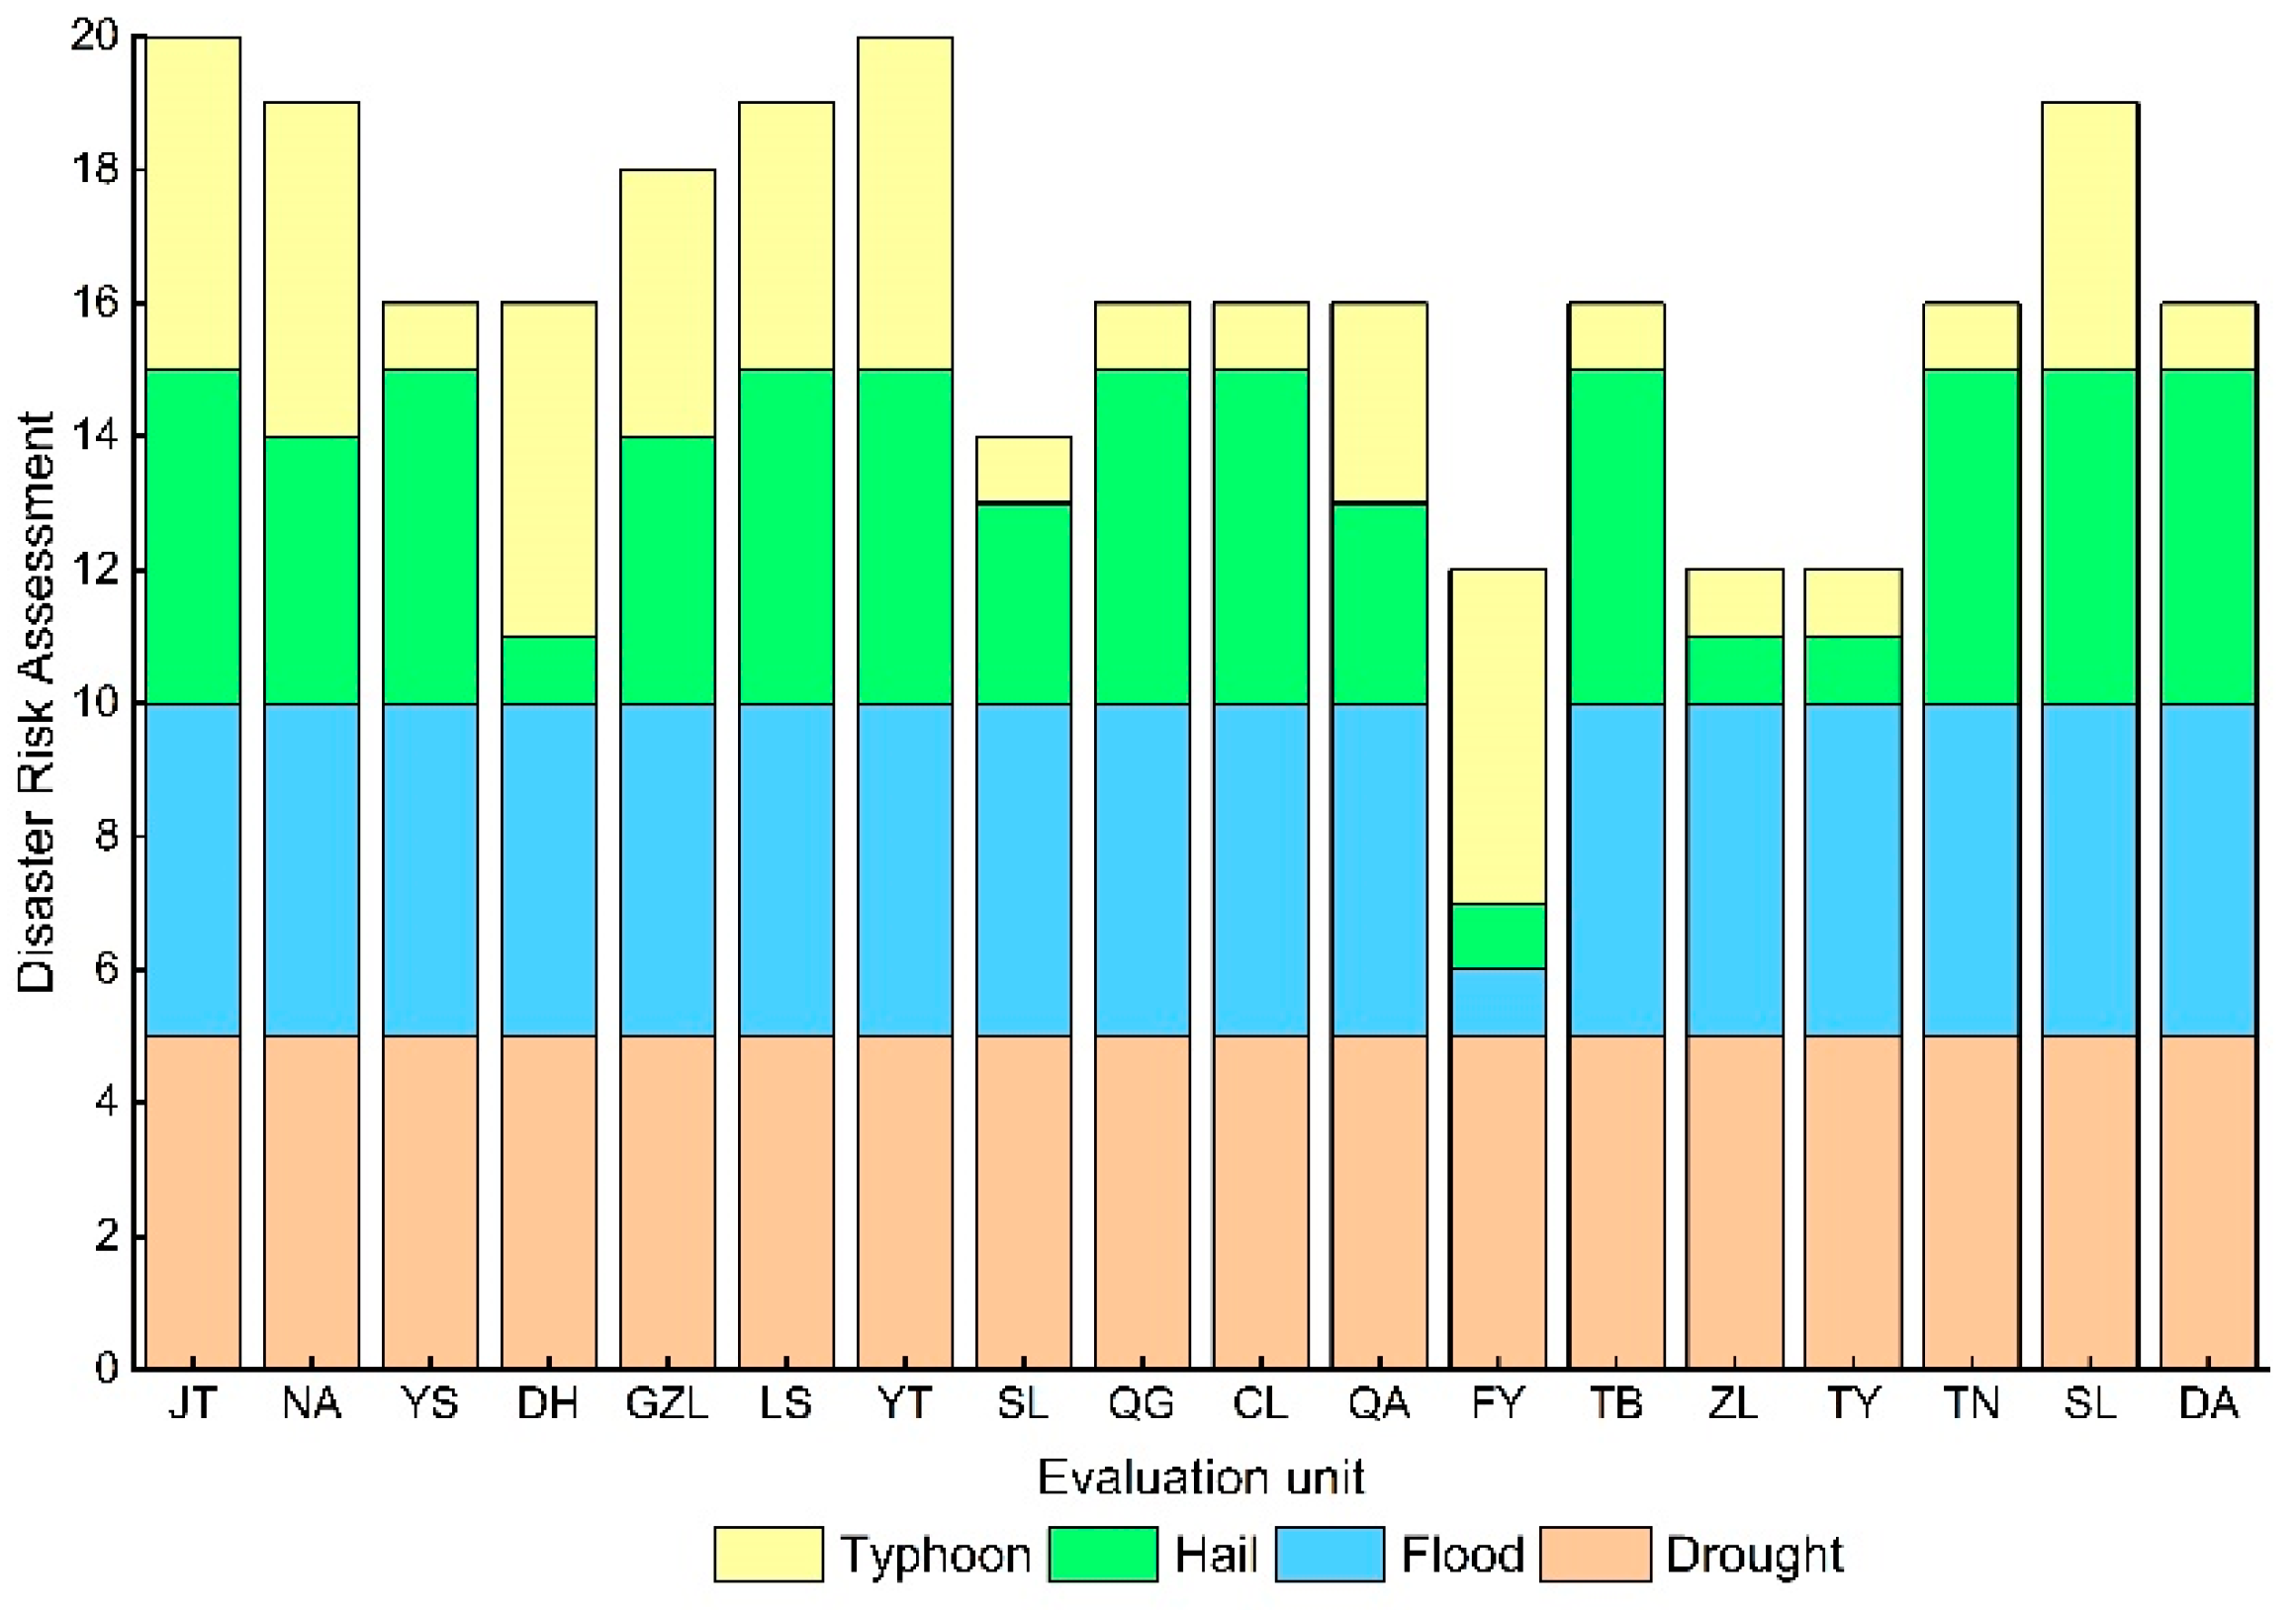
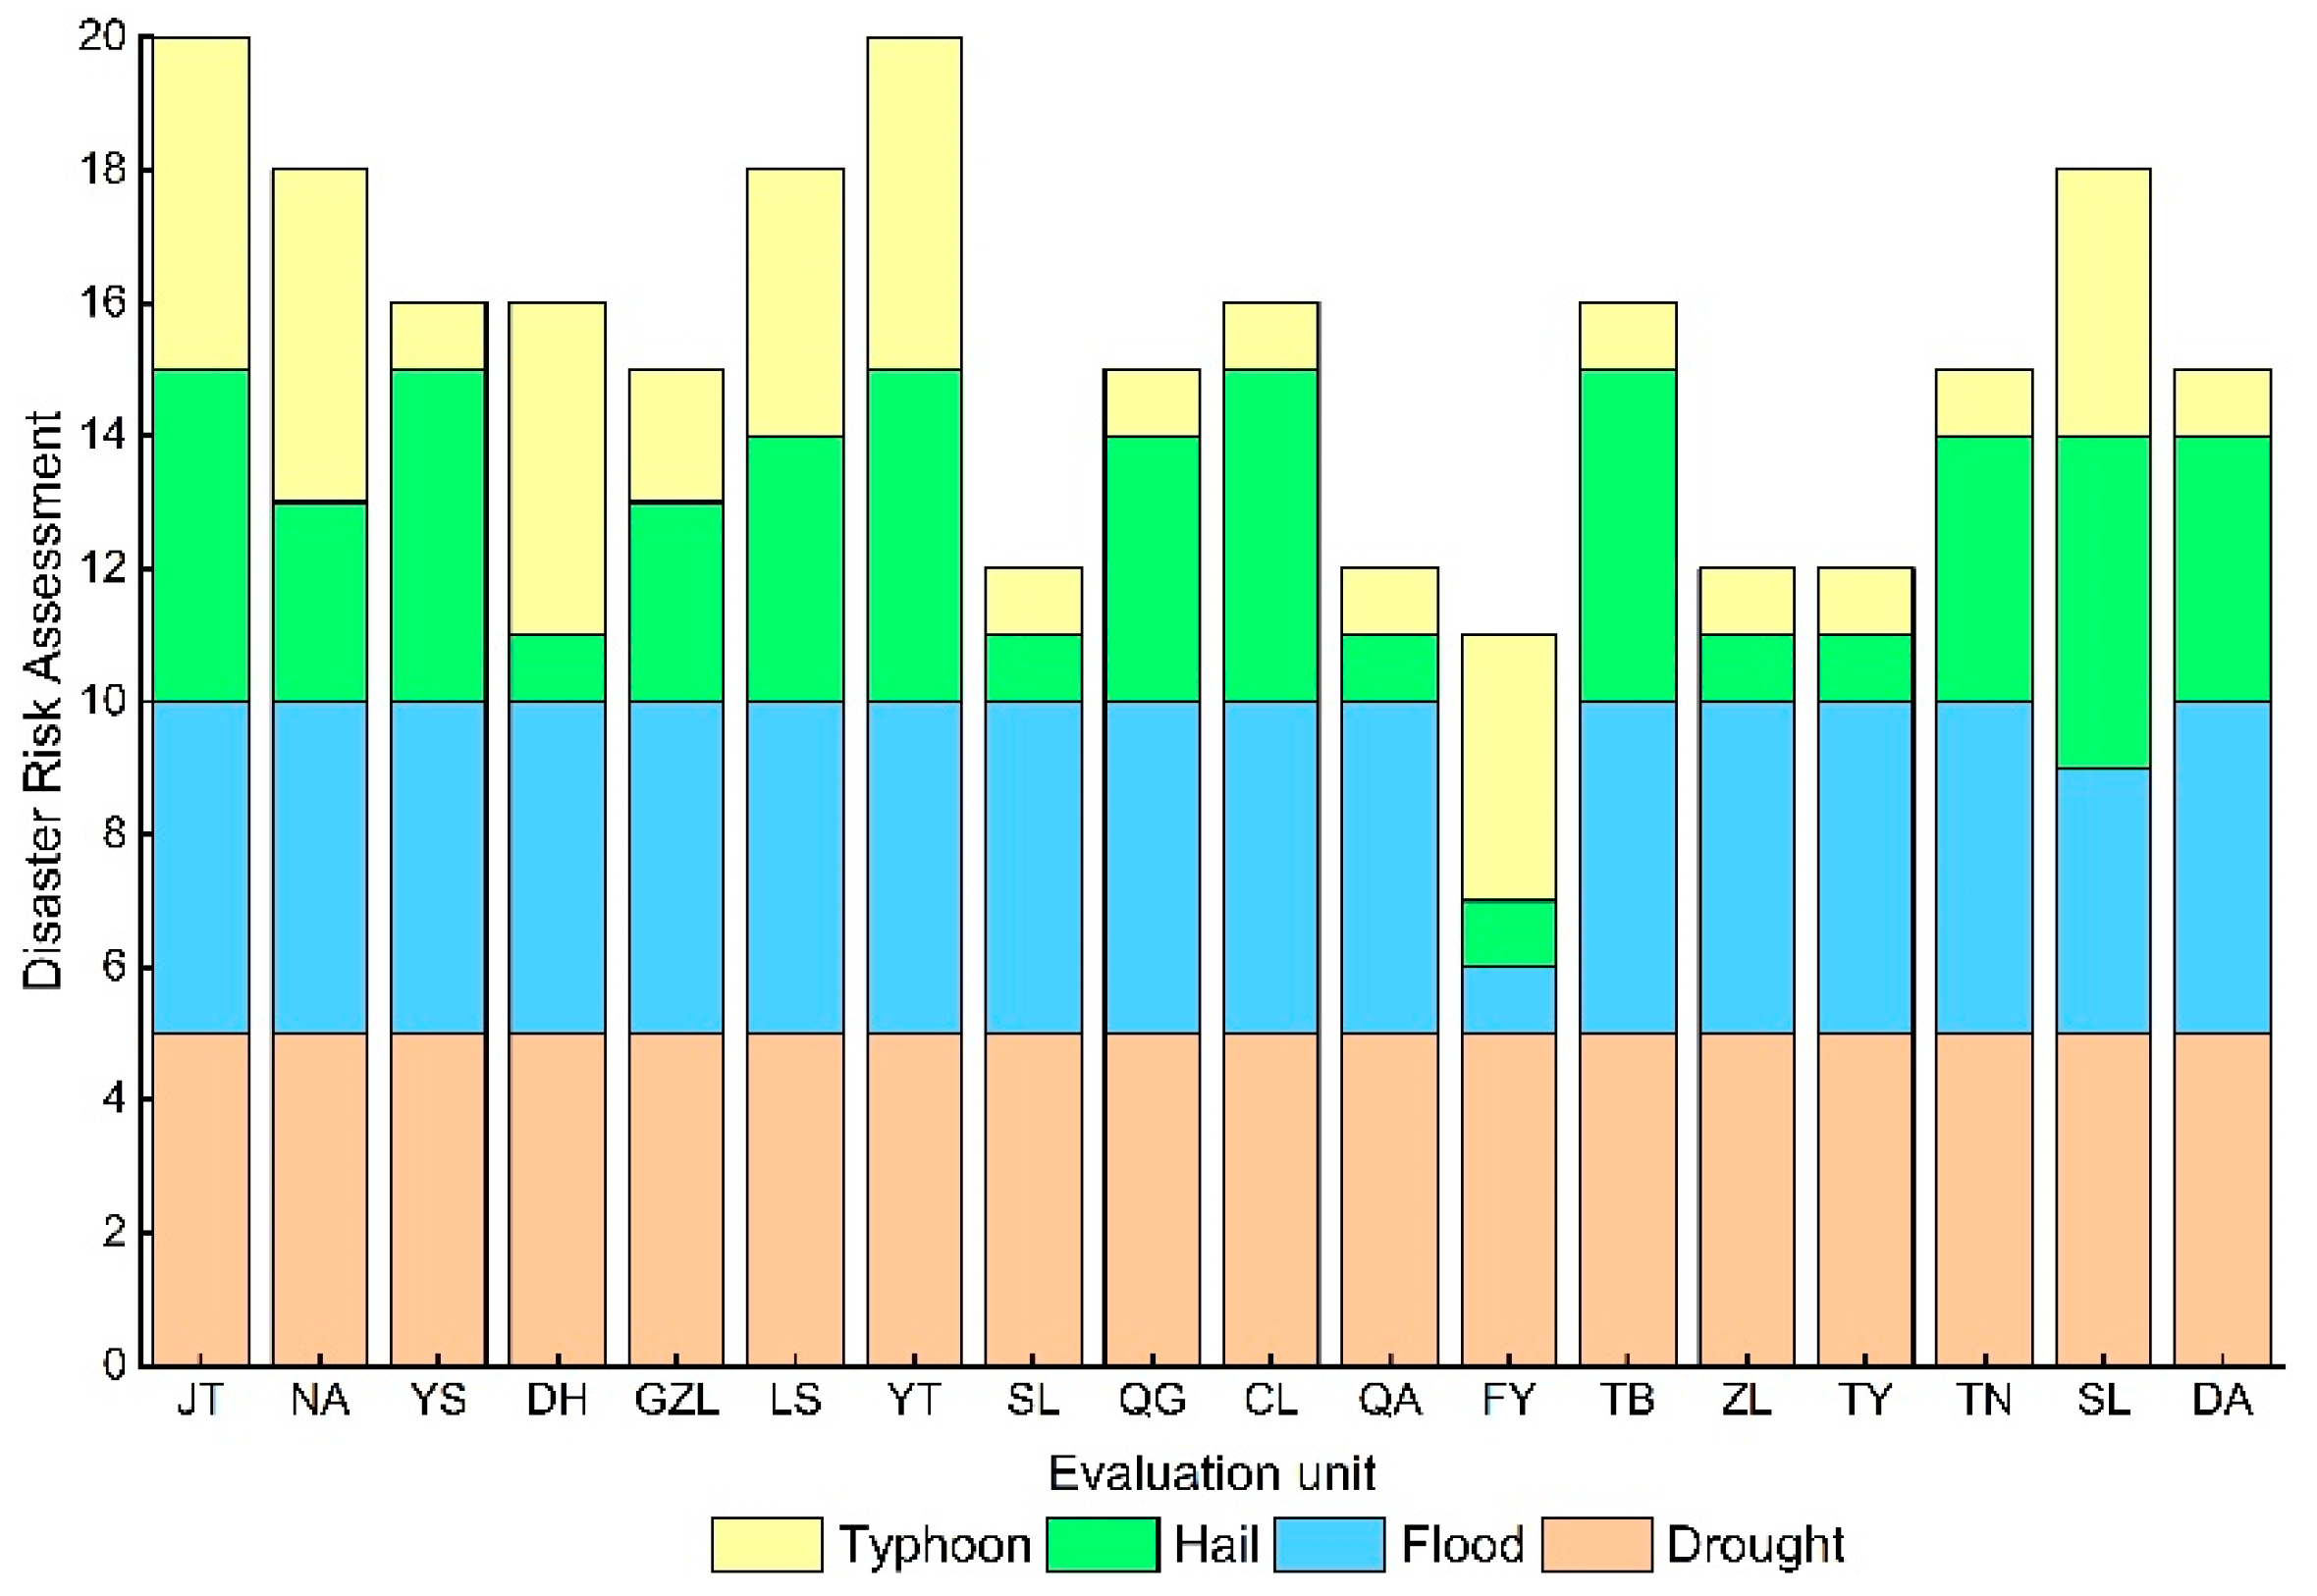
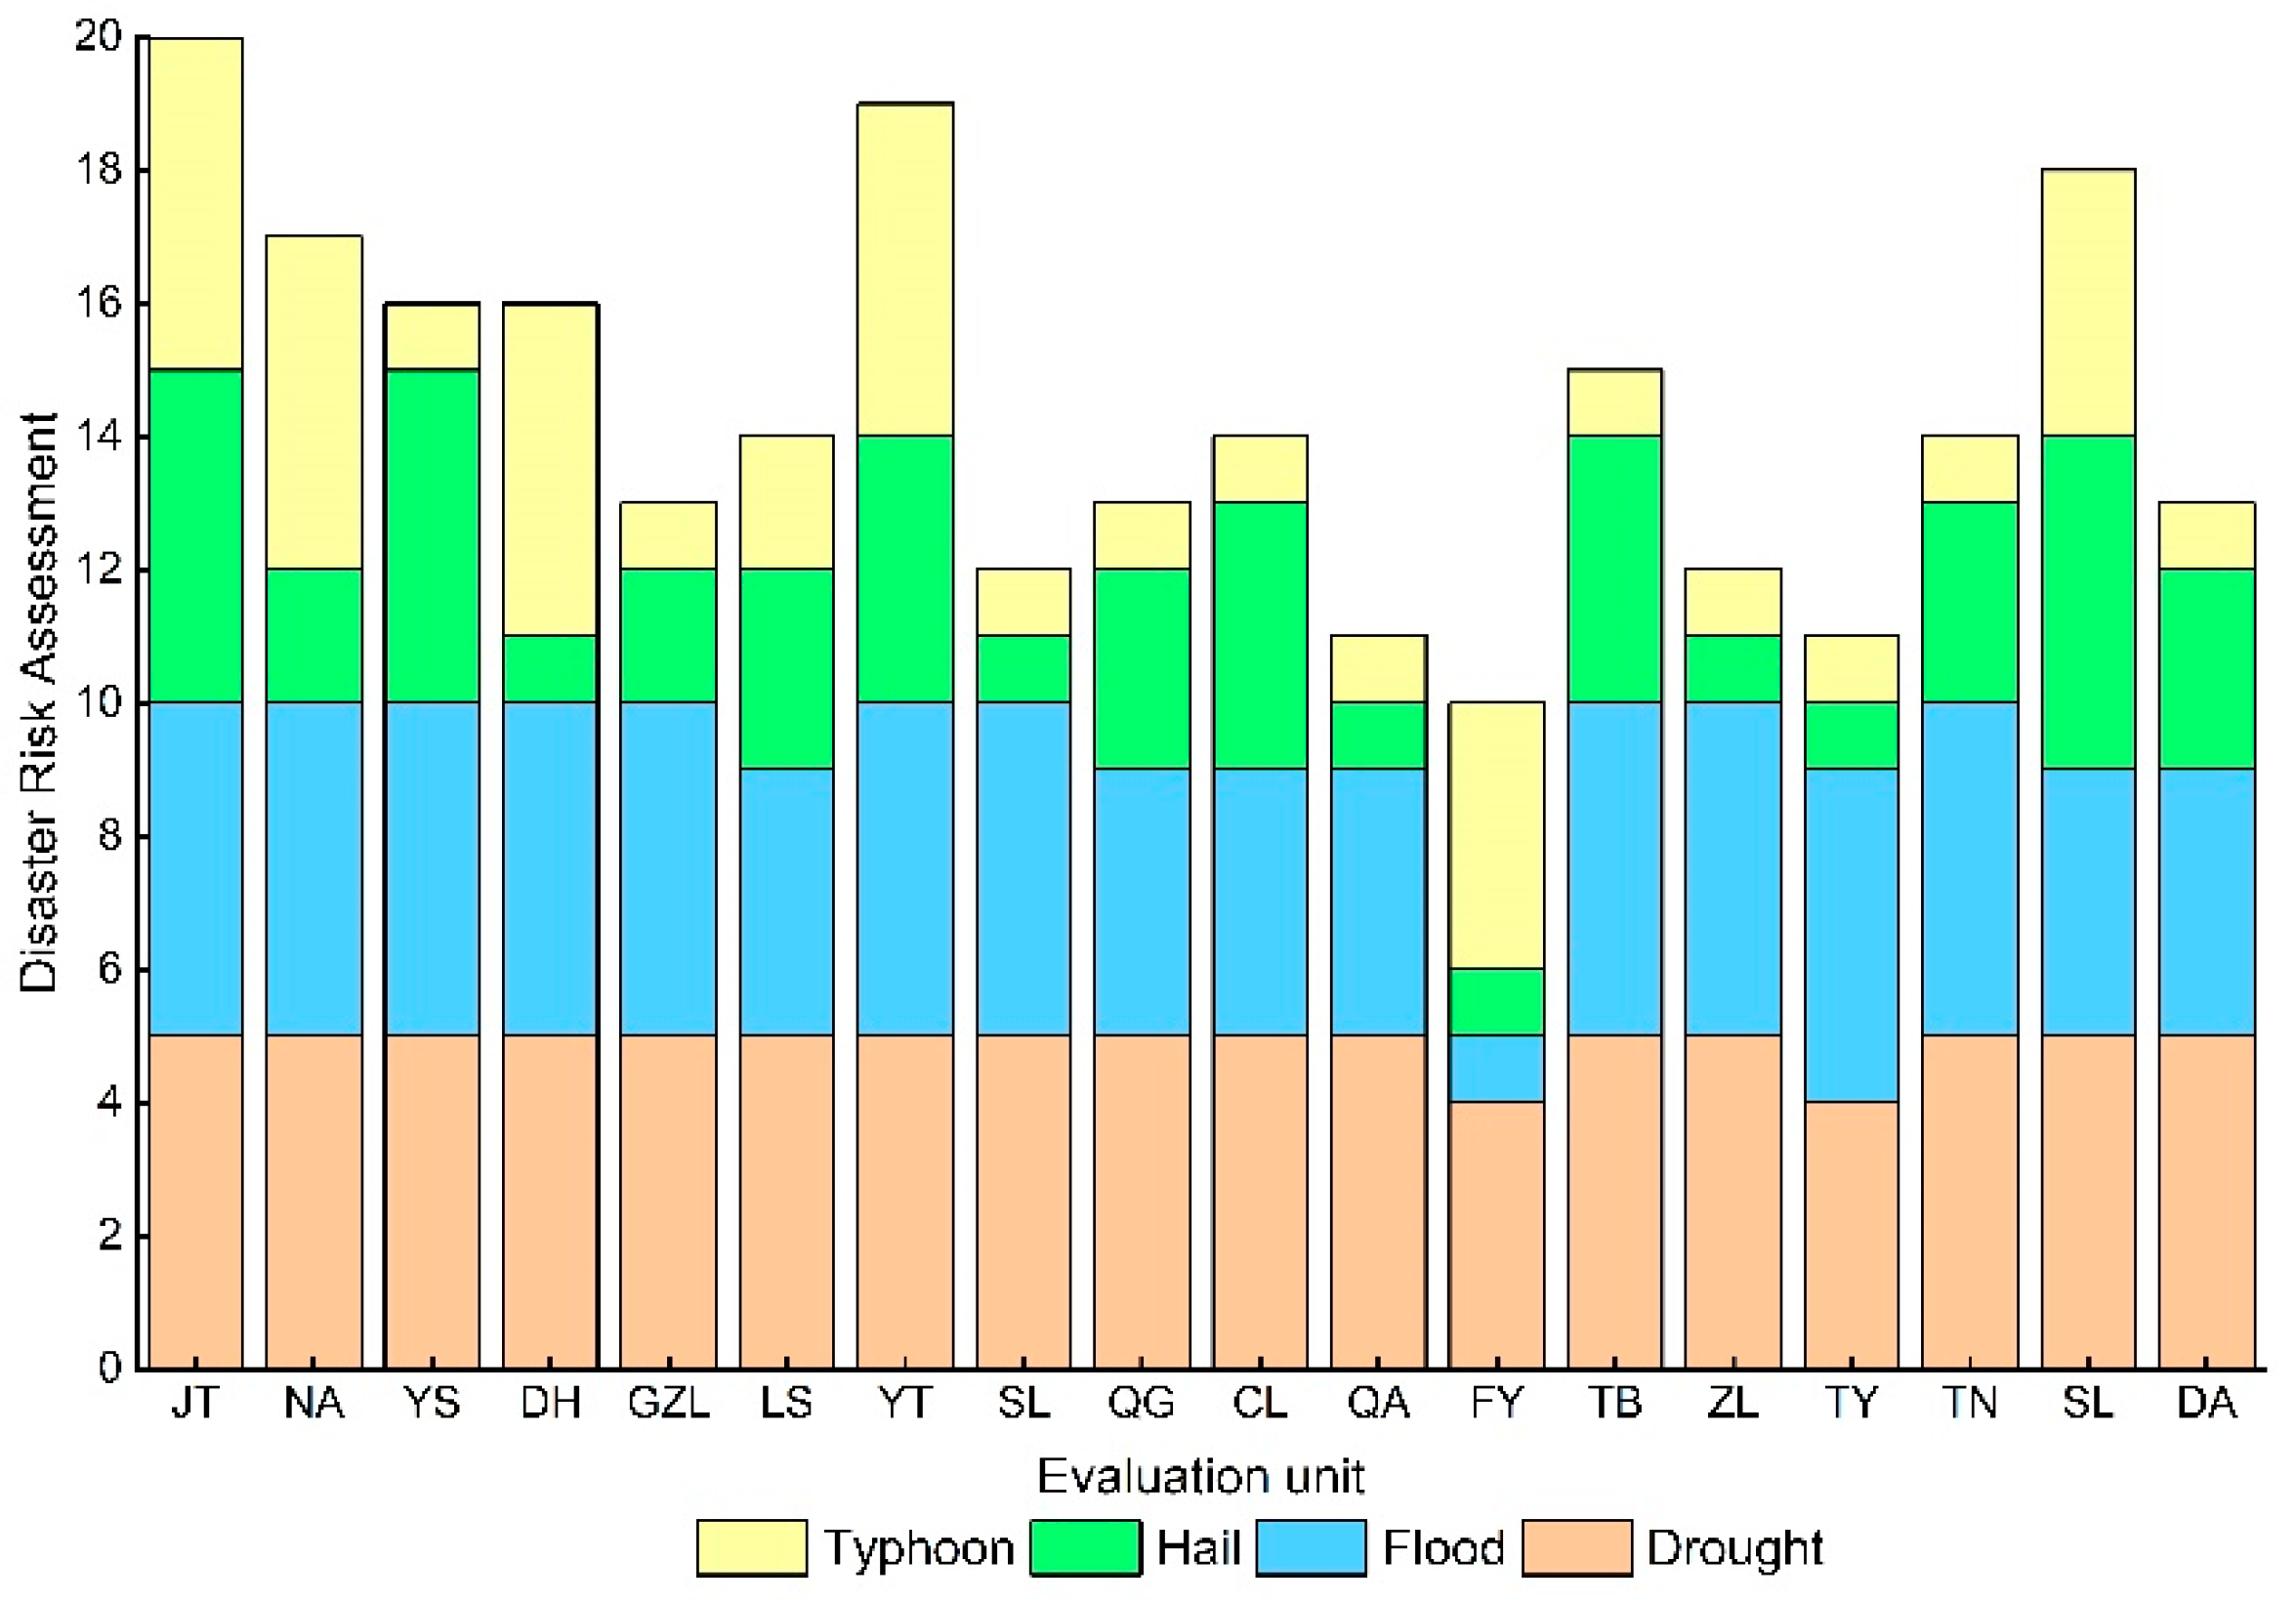
3.1. The Characteristics of Agricultural Multi-Hazard Meteorological Disasters
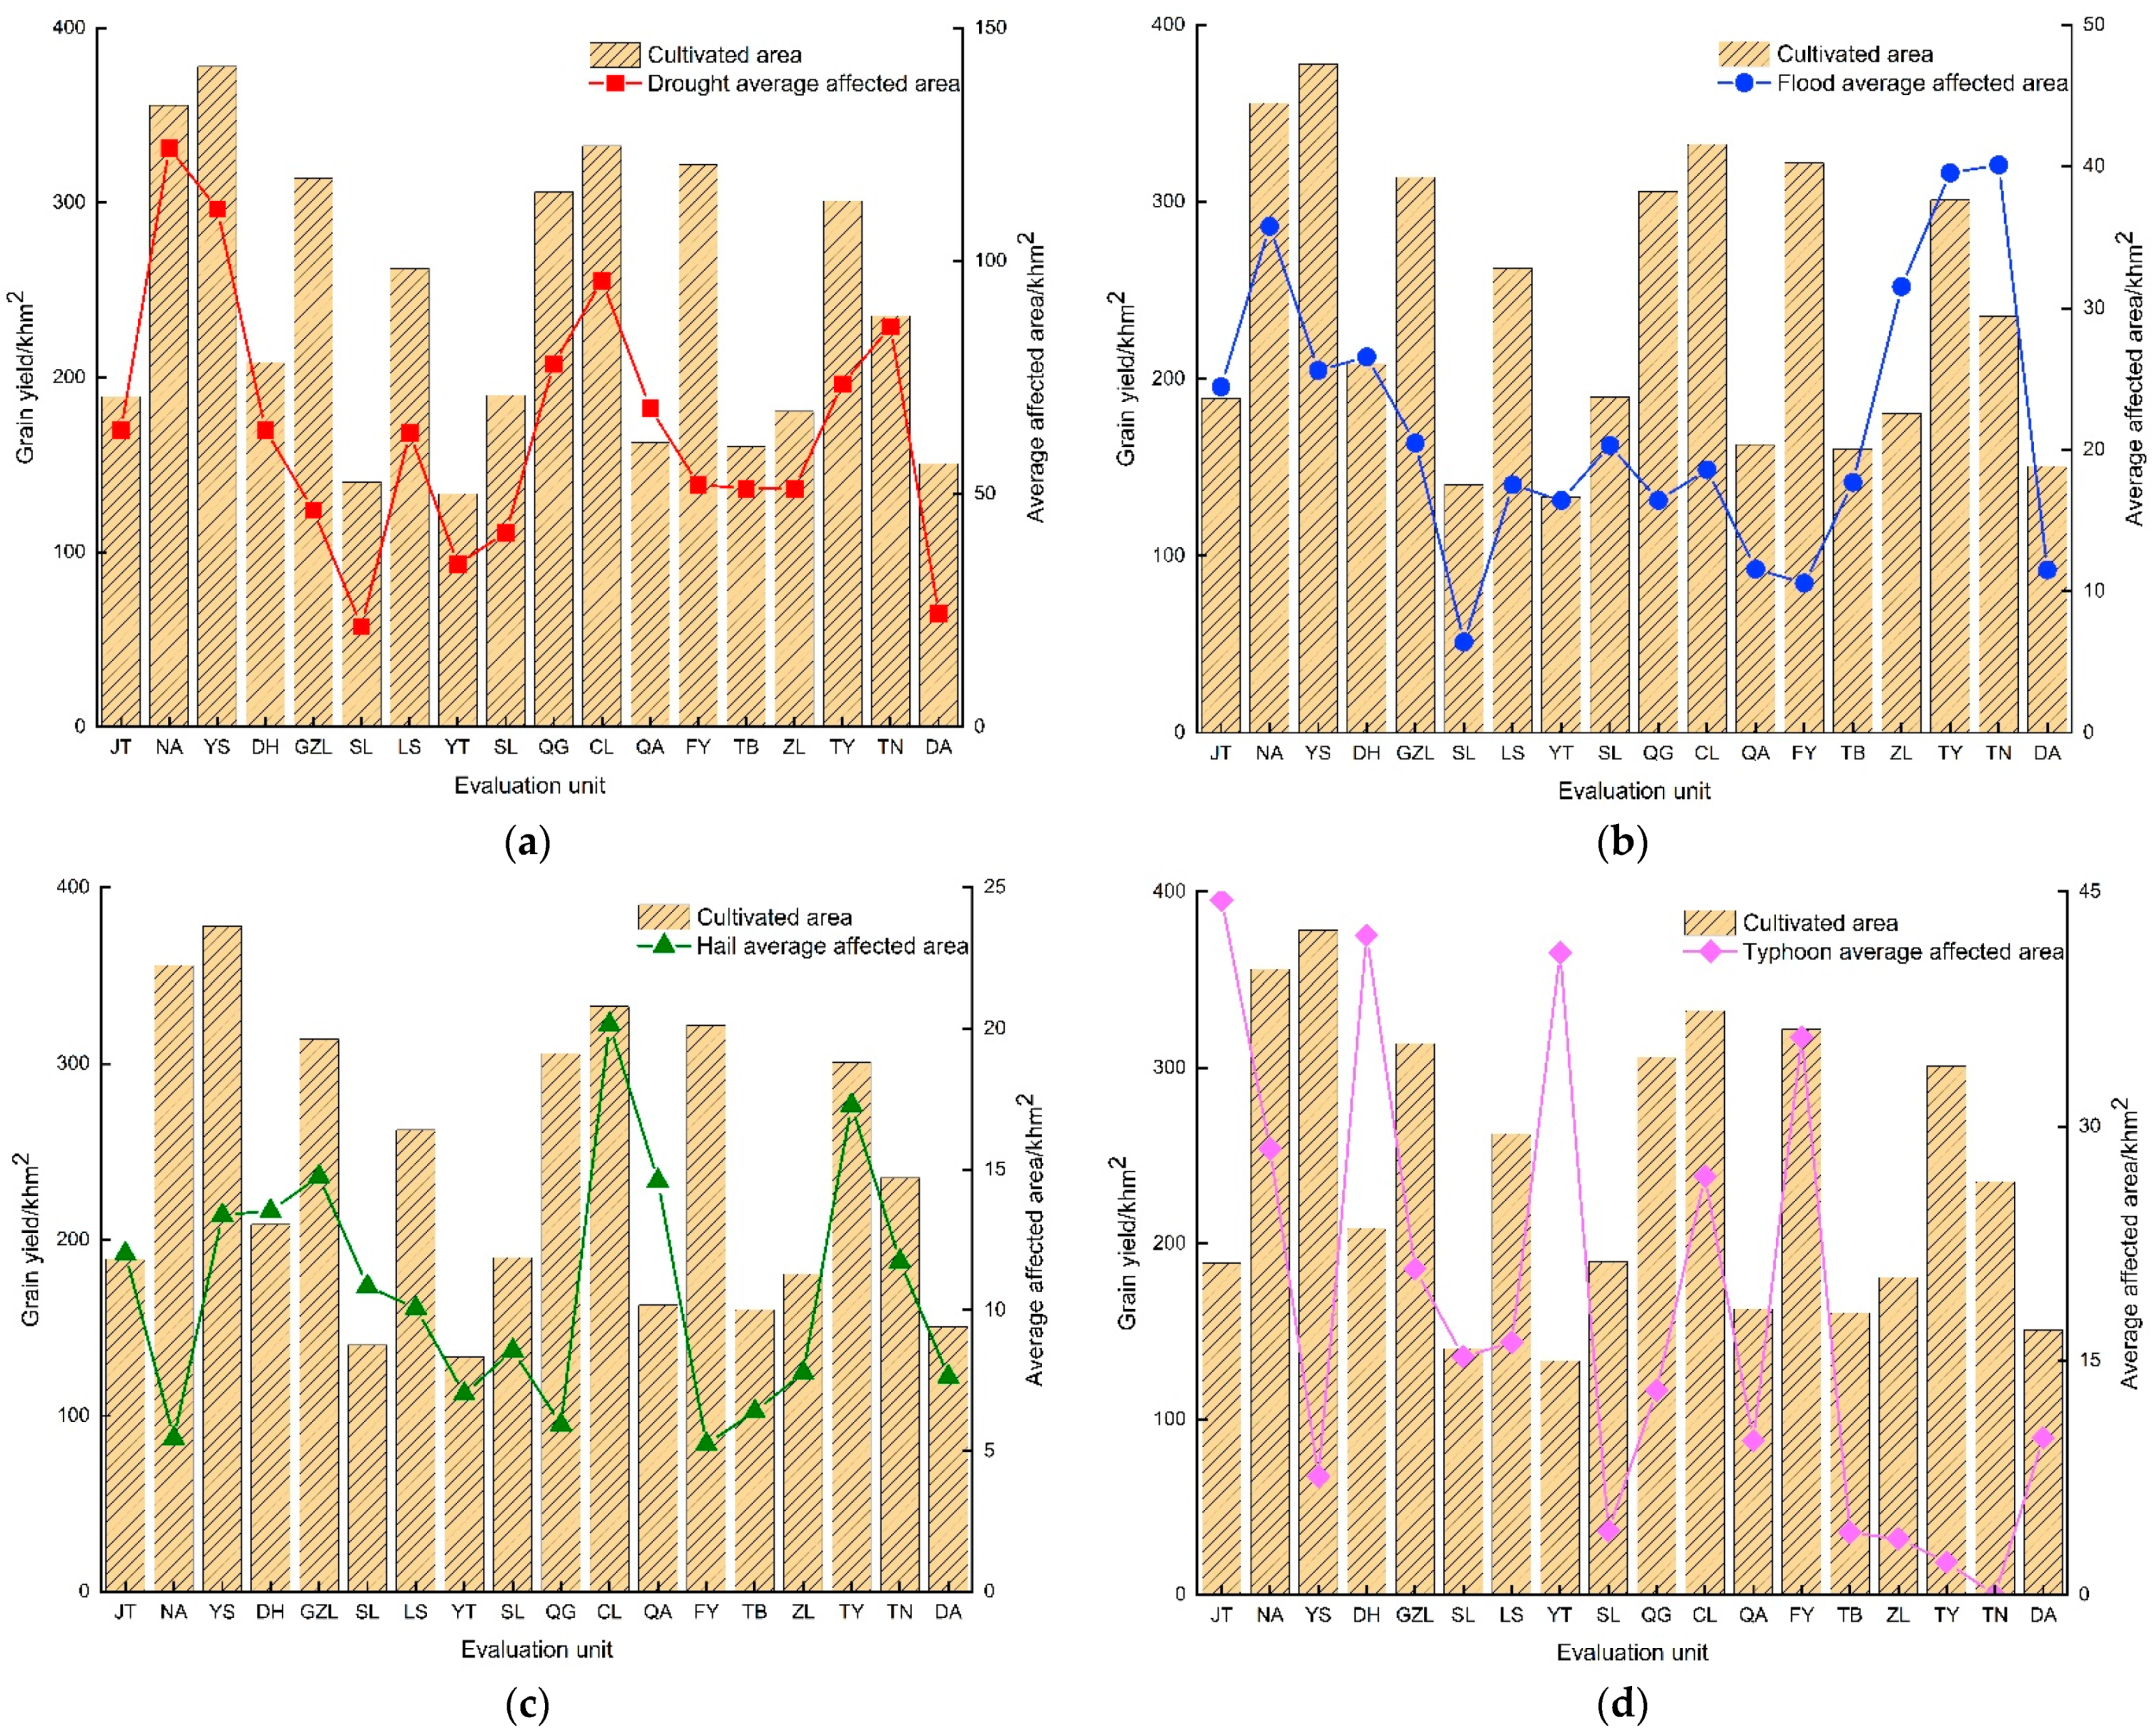
3.2. Multi-Hazard Meteorological Hazard Risk Analysis in Agriculture
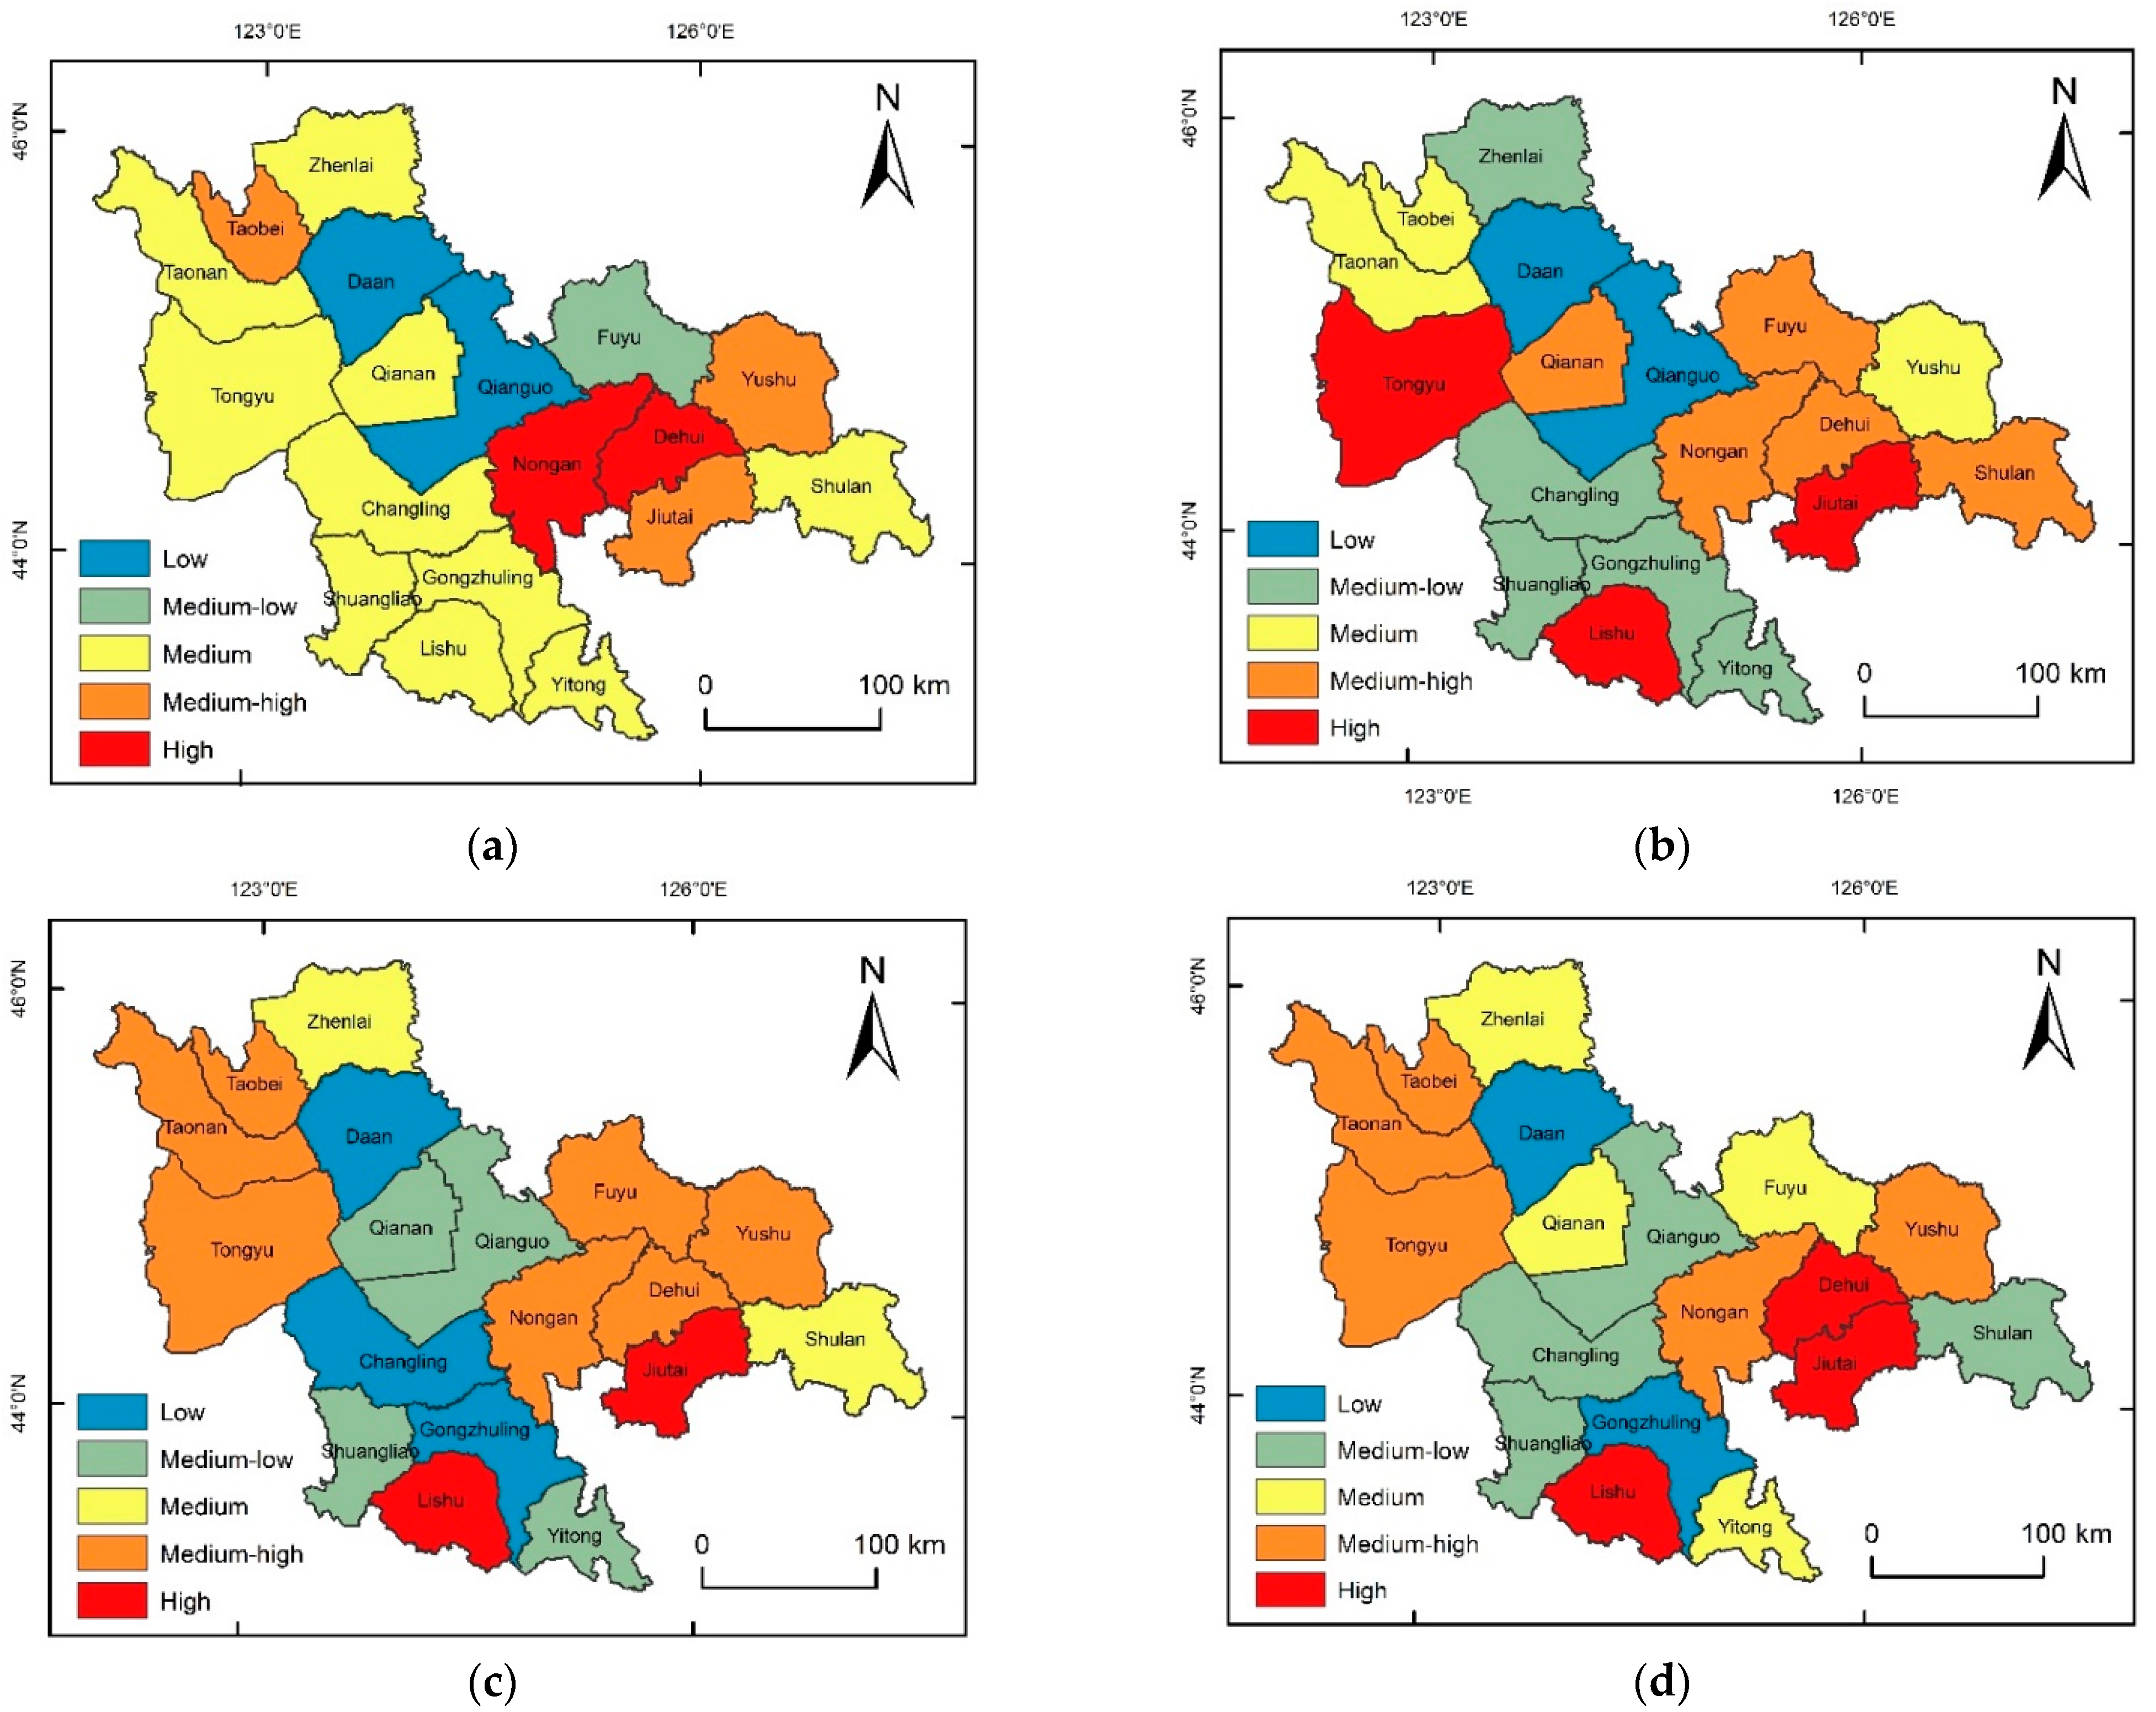
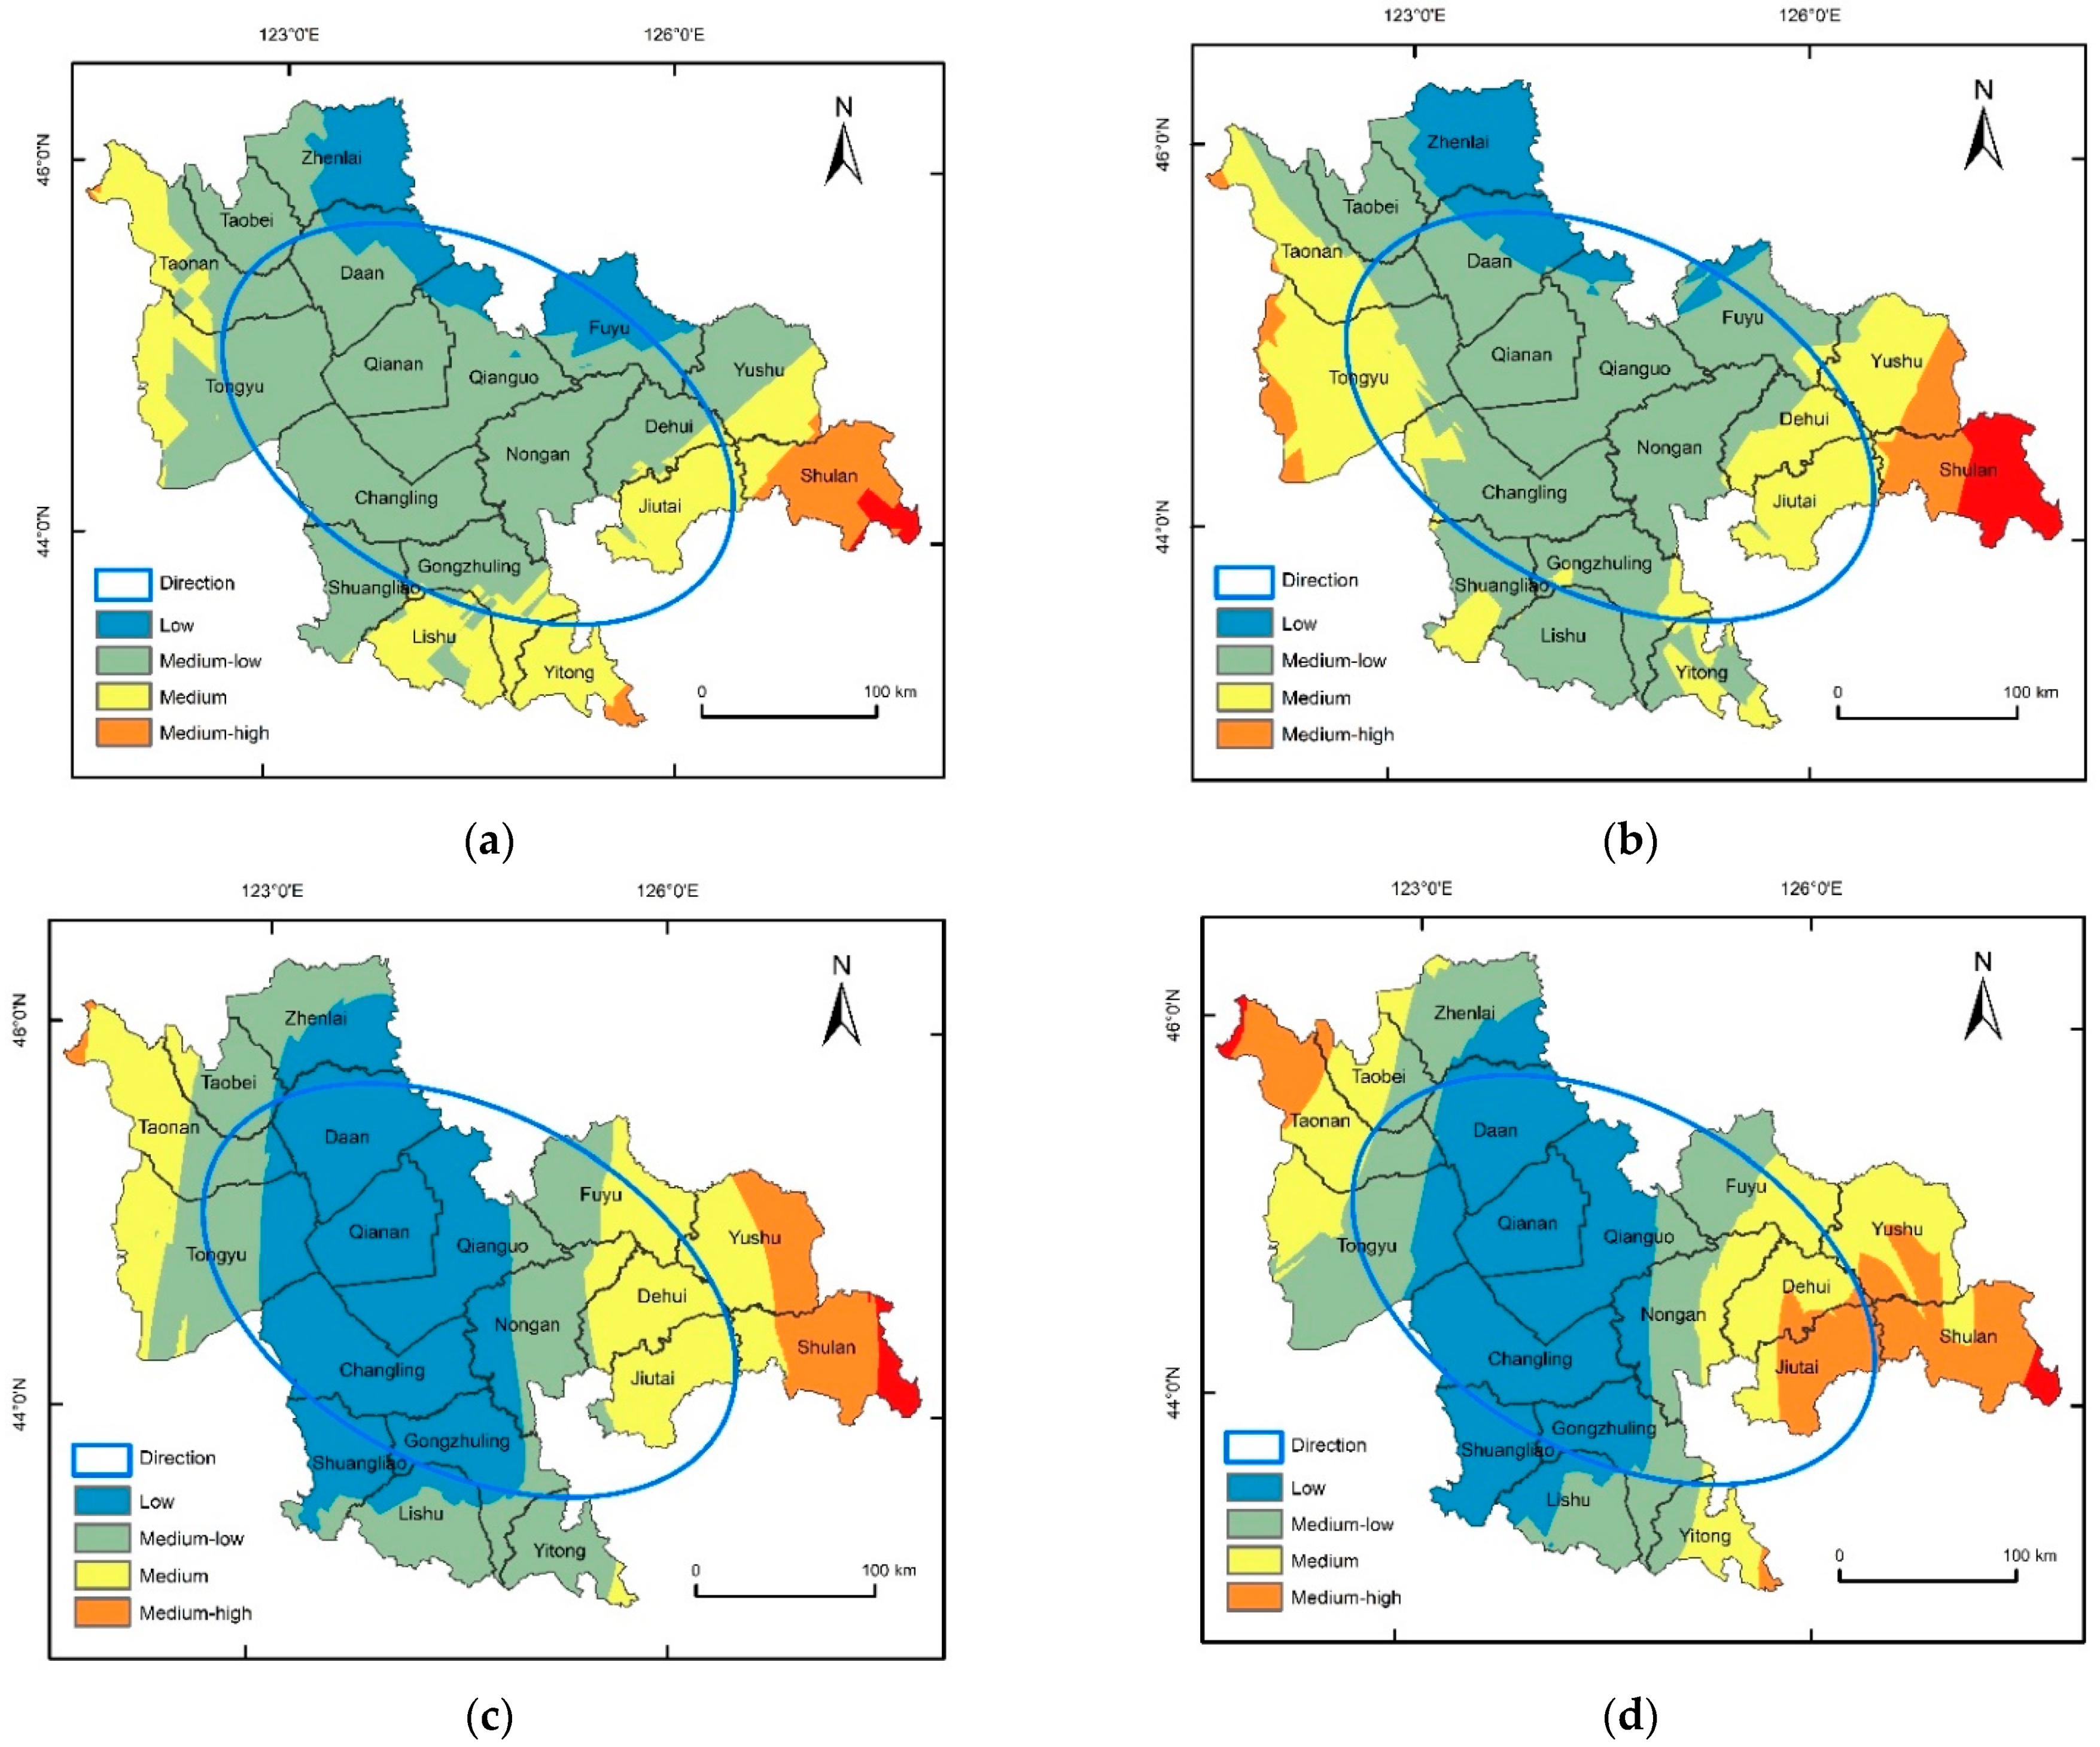
3.3. Risk Assessment and Spatial Distribution of Multi-Hazard Meteorological Hazards in Agriculture
3.4. Agricultural Multi-Hazard Meteorological Disaster Risk Reduction Recommendations
3.4.1. Improve Regional Agricultural Multi-Hazard Risk Reduction System Construction
3.4.2. Optimize Regional Agricultural Multi-Hazard Risk Management Models
3.4.3. Strengthened Regional Agricultural Multi-Hazard Risk Reduction Capacity
4. Conclusions
Author Contributions
Funding
Institutional Review Board Statement
Informed Consent Statement
Data Availability Statement
Conflicts of Interest
References
- Climate Change 2021—The Physical Science Basis. Available online: https://www.undrr.org/publication/sendai-framework-disaster-risk-reduction-2015–2030 (accessed on 4 May 2022).
- Mishra, A.; Bruno, E.; Zilberman, D. Compound natural and human disasters: Managing drought and COVID-19 to sustain global agriculture and food sectors. Sci. Total Environ. 2021, 754, 142210. [Google Scholar] [CrossRef] [PubMed]
- Weerasekara, S.; Wilson, C.; Lee, B.; Hoang, V.-N. Impact of natural disasters on the efficiency of agricultural production: An exemplar from rice farming in Sri Lanka. Clim. Dev. 2022, 14, 133–146. [Google Scholar] [CrossRef]
- Platania, F.; Hernandez, C.T.; Arreola, F. Social media communication during natural disasters and the impact on the agricultural market. Technol. Forecast. Soc. Change 2022, 179, 121594. [Google Scholar] [CrossRef]
- Albris, K.; Lauta, K.C.; Raju, E. Strengthening Governance for Disaster Prevention: The Enhancing Risk Management Capabilities Guidelines. Int. J. Disaster Risk Reduct. 2020, 47, 101647. [Google Scholar] [CrossRef]
- Kim, J.; Kim, D.; Lee, M.; Han, H.; Kim, H.S. Determining the Risk Level of Heavy Rain Damage by Region in South Korea. Water 2022, 14, 219. [Google Scholar] [CrossRef]
- Xiaobing, Y.; Chenliang, L.; Tongzhao, H.; Zhonghui, J. Information diffusion theory-based approach for the risk assessment of meteorological disasters in the Yangtze River Basin. Nat. Hazards 2020, 107, 2337–2362. [Google Scholar] [CrossRef]
- Shen, G.; Hwang, S.N. Spatial–Temporal snapshots of global natural disaster impacts Revealed from EM-DAT for 1900–2015. Geomat. Nat. Hazards Risk 2019, 10, 912–934. [Google Scholar] [CrossRef] [Green Version]
- Floresta, G.; Amata, E.; Barbaraci, C.; Gentile, D.; Turnaturi, R.; Marrazzo, A.; Rescifina, A. A Structure- and Ligand-Based Virtual Screening of a Database of “Small” Marine Natural Products for the Identification of “Blue” Sigma-2 Receptor Ligands. Mar. Drugs 2018, 16, 384. [Google Scholar] [CrossRef] [Green Version]
- Zhi-Yong, L.; Hong-Yan, L.; Huan, Y.; Chang-Jian, Z.; Hui, Y.; Huan-Huan, W.; Xin-Xin, C.; Ya-Wei, Z.; Zhen-Dong, S.; Wen-Chao, L.; et al. Pro54DB: A database for experimentally verified sigma-54 promoters. Bioinformatics 2017, 33, 467–469. [Google Scholar] [CrossRef]
- Welker, C.; Faust, E. Tropical cyclone-related socio-economic losses in the western North Pacific region. Nat. Hazards Earth Syst. Sci. 2013, 13, 115–124. [Google Scholar] [CrossRef]
- The First National Comprehensive Natural Disaster Risk Census. Available online: http://emerinfo.cn/zt/zrzhzhfxpc1/index.htm (accessed on 5 May 2022).
- Liu, Y.; Tong, L. Spatio-temporal Pattern and Driving Forces of Comprehensive Agricultural Productivity in Jilin Province, China. Chin. Geogr. Sci. 2020, 30, 493–504. [Google Scholar] [CrossRef]
- Zheng, X.; Qin, L.; He, H. Impacts of Climatic and Agricultural Input Factors on the Water Footprint of Crop Production in Jilin Province, China. Sustainability 2020, 12, 6904. [Google Scholar] [CrossRef]
- Li, Q.S.; Willardson, L.S.; Deng, W.; Li, X.J.; Liu, C.J. Crop water deficit estimation and irrigation scheduling in western Jilin province, Northeast China. Agric. Water Manag. 2005, 71, 47–60. [Google Scholar] [CrossRef]
- Li, Y.; Li, Q.; Guo, D.; Liang, S.; Wang, Y. Ecological stoichiometry homeostasis of Leymus chinensis in degraded grassland in western Jilin Province, NE China. Ecol. Eng. 2016, 90, 387–391. [Google Scholar] [CrossRef]
- Xu, L.; Zhang, Q.; Zhang, J.; Zhao, L.; Sun, W.; Jin, Y.-X. Extreme meteorological disaster effects on grain production in Jilin Province, China. J. Integr. Agric. 2017, 16, 486–496. [Google Scholar] [CrossRef]
- Zhang, Y.; Jiang, Y.; Jia, Z.; Qiang, R.; Gao, Q. Identifying the scale-controlling factors of soil organic carbon in the cropland of Jilin Province, China. Ecol. Indic. 2022, 139, 108921. [Google Scholar] [CrossRef]
- Zhang, Z.; Feng, B.; Shuai, J.; Shi, P. ENSO–climate fluctuation–crop yield early warning system—A case study in Jilin and Liaoning Province in Northeast China. Phys. Chem. Earth Parts A/B/C 2015, 87–88, 10–18. [Google Scholar] [CrossRef]
- Zou, T.; Chang, Y.; Chen, P.; Liu, J. Spatial-temporal variations of ecological vulnerability in Jilin Province (China), 2000 to 2018. Ecol. Indic. 2021, 133, 108429. [Google Scholar] [CrossRef]
- Xiaobing, Y.; Xianrui, Y.; Chenliang, L.; Zhonghui, J. Information diffusion-based risk assessment of natural disasters along the Silk Road Economic Belt in China. J. Clean. Prod. 2020, 244, 118744. [Google Scholar] [CrossRef]
- Pan, X.; Huang, C.; Pu, C. Comprehensive disposal plan design & polymerization disaster risk assessment based on information diffusion technology in Fujiang River basin in Sichuan. Environ. Res. 2020, 188, 109744. [Google Scholar] [CrossRef]
- Liu, Y.; You, M.; Zhu, J.; Wang, F.; Ran, R. Integrated risk assessment for agricultural drought and flood disasters based on entropy information diffusion theory in the middle and lower reaches of the Yangtze River, China. Int. J. Disaster Risk Reduct. 2019, 38, 101194. [Google Scholar] [CrossRef]
- Ma, S.; Lyu, S.; Zhang, Y. Weighted clustering-based risk assessment on urban rainstorm and flood disaster. Urban Clim. 2021, 39, 100974. [Google Scholar] [CrossRef]
- Li, Z.; Luo, Z.; Wang, Y.; Fan, G.; Zhang, J. Suitability evaluation system for the shallow geothermal energy implementation in region by Entropy Weight Method and TOPSIS method. Renew. Energy 2022, 184, 564–576. [Google Scholar] [CrossRef]
- Qin, Y.; Guan, K.; Kou, J.; Ma, Y.; Zhou, H.; Zhang, X. Durability evaluation and life prediction of fiber concrete with fly ash based on entropy weight method and grey theory. Constr. Build. Mater. 2022, 327, 126918. [Google Scholar] [CrossRef]
- Sidhu, A.S.; Singh, S.; Kumar, R. Bibliometric analysis of entropy weights method for multi-objective optimization in machining operations. Mater. Today Proc. 2022, 50, 1248–1255. [Google Scholar] [CrossRef]
- Wu, H.-W.; Li, E.-Q.; Sun, Y.-Y.; Dong, B.-T. Research on the operation safety evaluation of urban rail stations based on the improved TOPSIS method and entropy weight method. J. Rail Transp. Plan. Manag. 2021, 20, 100262. [Google Scholar] [CrossRef]
- Zhao, J.; Tian, J.; Meng, F.; Zhang, M.; Wu, Q. Safety assessment method for storage tank farm based on the combination of structure entropy weight method and cloud model. J. Loss Prev. Process Ind. 2022, 75, 104709. [Google Scholar] [CrossRef]
- Guerri, G.; Crisci, A.; Congedo, L.; Munafò, M.; Morabito, M. A functional seasonal thermal hot-spot classification: Focus on industrial sites. Sci. Total Environ. 2022, 806, 151383. [Google Scholar] [CrossRef]
- Kuznetsov, A.; Sadovskaya, V. Spatial variation and hotspot detection of COVID-19 cases in Kazakhstan, 2020. Spat. Spatio-Temporal Epidemiol. 2021, 39, 100430. [Google Scholar] [CrossRef] [PubMed]
- Liu, W.; Ma, L.; Smanov, Z.; Samarkhanov, K.; Abuduwaili, J. Clarifying Soil Texture and Salinity Using Local Spatial Statistics (Getis-Ord Gi* and Moran’s I) in Kazakh–Uzbekistan Border Area, Central Asia. Agronomy 2022, 12, 332. [Google Scholar] [CrossRef]
- Zhang, L.; Tao, Z.; Wang, G. Assessment and determination of earthquake casualty gathering area based on building damage state and spatial characteristics analysis. Int. J. Disaster Risk Reduct. 2022, 67, 102688. [Google Scholar] [CrossRef]
- Yang, Y.; Wang, P.; Brandenberg, S.J. An algorithm for generating spatially correlated random fields using Cholesky decomposition and ordinary kriging. Comput. Geotech. 2022, 147, 104783. [Google Scholar] [CrossRef]
- Zhong, X.; Kealy, A.; Duckham, M. Stream Kriging: Incremental and recursive ordinary Kriging over spatiotemporal data streams. Comput. Geosci. 2016, 90, 134–143. [Google Scholar] [CrossRef]
- Busayo, E.T.; Kalumba, A.M.; Afuye, G.A.; Olusola, A.O.; Ololade, O.O.; Orimoloye, I.R. Rediscovering South Africa: Flood disaster risk management through ecosystem-based adaptation. Environ. Sustain. Indic. 2022, 14, 100175. [Google Scholar] [CrossRef]
- Roopnarine, R.; Eudoxie, G.; Wuddivira, M.N.; Saunders, S.; Lewis, S.; Spencer, R.; Jeffers, C.; Haynes-Bobb, T.; Roberts, C. Capacity building in participatory approaches for hydro-climatic Disaster Risk Management in the Caribbean. Int. J. Disaster Risk Reduct. 2021, 66, 102592. [Google Scholar] [CrossRef]
- Khan, I.; Ali, A.; Waqas, T.; Ullah, S.; Ullah, S.; Shah, A.A.; Imran, S. Investing in disaster relief and recovery: A reactive approach of disaster management in Pakistan. Int. J. Disaster Risk Reduct. 2022, 75, 102975. [Google Scholar] [CrossRef]
- Howland, F.; Francois Le Coq, J. Disaster risk management, or adaptation to climate change? The elaboration of climate policies related to agriculture in Colombia. Geoforum 2022, 131, 163–172. [Google Scholar] [CrossRef]
- Asare-Donkor, N.K.; Ofosu, J.O.; Adimado, A.A. Hydrochemical characteristics of surface water and ecological risk assessment of sediments from settlements within the Birim River basin in Ghana. Environ. Syst. Res. 2018, 7, 9. [Google Scholar] [CrossRef] [Green Version]
- Garrigou, A.; Laurent, C.; Baldi, I.; Berthet, A.; Colosio, C.; Daubas-Letourneux, V.; Galey, L.; Goutille, F.; Jackson Filho, J.M.; Jas, N.; et al. Response from the authors of the article “Critical review of the role of personal protective Equipment (PPE) in the prevention of risks related to agricultural pesticide use” to the letter to the editor from the European crop protection association (ECPA) Occupational and bystander exposure expert group (OBEEG). Saf. Sci. 2021, 138, 105191. [Google Scholar] [CrossRef]
- Alam, A.S.A.F.; Begum, H.; Masud, M.M.; Al-Amin, A.Q.; Filho, W.L. Agriculture insurance for disaster risk reduction: A case study of Malaysia. Int. J. Disaster Risk Reduct. 2020, 47, 101626. [Google Scholar] [CrossRef]
- Guan, X.; Zang, Y.; Meng, Y.; Liu, Y.; Lv, H.; Yan, D. Study on spatiotemporal distribution characteristics of flood and drought disaster impacts on agriculture in China. Int. J. Disaster Risk Reduct. 2021, 64, 102504. [Google Scholar] [CrossRef]
- Wang, X.; Zhang, C.; Wang, C.; Liu, G.; Wang, H. GIS-based for prediction and prevention of environmental geological disaster susceptibility: From a perspective of sustainable development. Ecotoxicol. Environ. Saf. 2021, 226, 112881. [Google Scholar] [CrossRef] [PubMed]
- Zhang, Y.; Qu, H.; Yang, X.; Wang, M.; Qin, N.; Zou, Y. Cropping system optimization for drought prevention and disaster reduction with a risk assessment model in Sichuan Province. Glob. Ecol. Conserv. 2020, 23, e01095. [Google Scholar] [CrossRef]
- Mashi, S.A.; Oghenejabor, O.D.; Inkani, A.I. Disaster risks and management policies and practices in Nigeria: A critical appraisal of the National Emergency Management Agency Act. Int. J. Disaster Risk Reduct. 2019, 33, 253–265. [Google Scholar] [CrossRef]
- Muñoz, V.A.; Carby, B.; Abella, E.C.; Cardona, O.D.; López-Marrero, T.; Marchezini, V.; Meyreles, L.; Olivato, D.; Trajber, R.; Wisner, B. Success, innovation and challenge: School safety and disaster education in South America and the Caribbean. Int. J. Disaster Risk Reduct. 2020, 44, 101395. [Google Scholar] [CrossRef]
- Ba, R.; Deng, Q.; Liu, Y.; Yang, R.; Zhang, H. Multi-hazard disaster scenario method and emergency management for urban resilience by integrating experiment–simulation–field data. J. Saf. Sci. Resil. 2021, 2, 77–89. [Google Scholar] [CrossRef]
- Park, E.-S.; Yoon, D.K. The value of NGOs in disaster management and governance in South Korea and Japan. Int. J. Disaster Risk Reduct. 2022, 69, 102739. [Google Scholar] [CrossRef]
- Garrigou, A.; Laurent, C.; Berthet, A.; Colosio, C.; Jas, N.; Daubas-Letourneux, V.; Jackson Filho, J.M.; Jouzel, J.N.; Samuel, O.; Baldi, I.; et al. Critical review of the role of PPE in the prevention of risks related to agricultural pesticide use. Saf. Sci. 2020, 123, 104527. [Google Scholar] [CrossRef]
- Andriyanto, A.; Hidayati, R.N. Improving collaboration skills among nursing students through disaster preparedness simulation. Enfermería Clínica 2021, 31, S644–S648. [Google Scholar] [CrossRef]
- Qing, C.; Guo, S.; Deng, X.; Xu, D. Farmers’ disaster preparedness and quality of life in earthquake-prone areas: The mediating role of risk perception. Int. J. Disaster Risk Reduct. 2021, 59, 102252. [Google Scholar] [CrossRef]
- Kamari, M.; Ham, Y. AI-based risk assessment for construction site disaster preparedness through deep learning-based digital twinning. Autom. Constr. 2022, 134, 104091. [Google Scholar] [CrossRef]
- Cao, Y.; Bai, Y.; Zhang, L. The impact of farmland property rights security on the farmland investment in rural China. Land Use Policy 2020, 97, 104736. [Google Scholar] [CrossRef]
- Pu, G. Achieving agricultural revitalization: Performance of technical innovation inputs in farmland and water conservation facilities. Alex. Eng. J. 2022, 61, 2851–2858. [Google Scholar] [CrossRef]
- Wang, C.; Wang, G.; Feng, Z.; Ji, X.; Li, Q.; Zhang, Z.; Song, D. Strengthen Water Conservancy Construction, Use Water Resources Scientifically, and Develop Modern Agriculture. Procedia Environ. Sci. 2011, 10, 1595–1600. [Google Scholar] [CrossRef] [Green Version]
- Jiang, D.; Zhuang, D.; Fu, J.; Huang, Y.; Wen, K. Bioenergy potential from crop residues in China: Availability and distribution. Renew. Sustain. Energy Rev. 2012, 16, 1377–1382. [Google Scholar] [CrossRef]
- Liu, X.; Zhao, C.; Song, W. Review of the evolution of cultivated land protection policies in the period following China’s reform and liberalization. Land Use Policy 2017, 67, 660–669. [Google Scholar] [CrossRef]
- Luo, D.; Ye, L.; Sun, D. Risk evaluation of agricultural drought disaster using a grey cloud clustering model in Henan province, China. Int. J. Disaster Risk Reduct. 2020, 49, 101759. [Google Scholar] [CrossRef]
- Raikes, J.; Smith, T.F.; Baldwin, C.; Henstra, D. The influence of international agreements on disaster risk reduction. Int. J. Disaster Risk Reduct. 2022, 76, 102999. [Google Scholar] [CrossRef]
- Vučetić, M.; Brokešová, Z.; Hudec, M.; Pastoráková, E. Financial literacy and psychological disaster preparedness: Applicability of approach based on fuzzy functional dependencies. Inf. Processing Manag. 2022, 59, 102848. [Google Scholar] [CrossRef]
- Wang, J.-J.; Tsai, N.-Y. Factors affecting elementary and junior high school teachers’ behavioral intentions to school disaster preparedness based on the theory of planned behavior. Int. J. Disaster Risk Reduct. 2022, 69, 102757. [Google Scholar] [CrossRef]
- Zaremohzzabieh, Z.; Samah, A.A.; Roslan, S.; Shaffril, H.A.M.; D’Silva, J.L.; Kamarudin, S.; Ahrari, S. Household preparedness for future earthquake disaster risk using an extended theory of planned behavior. Int. J. Disaster Risk Reduct. 2021, 65, 102533. [Google Scholar] [CrossRef]


| Evaluation Unit | Drought | Flood | Typhoon | Hail |
|---|---|---|---|---|
| Jiutai (JT) | 0.390631 | 0.148485 | 0.235727 | 0.124041 |
| Nongan (NA) | 0.394813 | 0.116918 | 0.095588 | 0.038850 |
| Yushu (YS) | 0.343445 | 0.084944 | 0.021053 | 0.043148 |
| Dehui (DH) | 0.285873 | 0.122036 | 0.194169 | 0.031608 |
| Gongzhuling (GZL) | 0.175963 | 0.079955 | 0.066505 | 0.054757 |
| Shulan (SL) | 0.216273 | 0.070940 | 0.110332 | 0.123191 |
| Lishu (LS) | 0.302651 | 0.089038 | 0.081240 | 0.069131 |
| Yitong (YT) | 0.313006 | 0.161347 | 0.370114 | 0.084881 |
| Shuangliao (SL) | 0.300570 | 0.197455 | 0.026547 | 0.046671 |
| Qianguo (QG) | 0.346500 | 0.081293 | 0.042080 | 0.059420 |
| Changling (CL) | 0.383543 | 0.098864 | 0.080606 | 0.043555 |
| Qianan (QA) | 0.532736 | 0.131110 | 0.070101 | 0.044578 |
| Fuyu (FY) | 0.160851 | 0.034925 | 0.109651 | 0.020429 |
| Taobei (TB) | 0.479668 | 0.203550 | 0.026796 | 0.149567 |
| Zhenlai (ZL) | 0.442655 | 0.293019 | 0.020543 | 0.032686 |
| Tongyu (TY) | 0.254391 | 0.228752 | 0.006609 | 0.031698 |
| Taonan (TN) | 0.576323 | 0.274184 | 0.000000 | 0.084189 |
| Daan (DA) | 0.277935 | 0.123955 | 0.065271 | 0.078949 |
| Evaluation Unit | Drought | Flood | Hail | Typhoon |
|---|---|---|---|---|
| Jiutai (JT) | 0.11 | 0.13 | 0.38 | 0.39 |
| Nongan (NA) | 0.29 | 0.24 | 0.19 | 0.28 |
| Yushu (YS) | 0.36 | 0.22 | 0.32 | 0.10 |
| Dehui (DH) | 0.16 | 0.22 | 0.07 | 0.55 |
| Gongzhuling (GZL) | 0.11 | 0.18 | 0.38 | 0.33 |
| Lishu (LS) | 0.19 | 0.14 | 0.42 | 0.25 |
| Yitong (YT) | 0.06 | 0.14 | 0.12 | 0.68 |
| Shuangliao (SL) | 0.25 | 0.49 | 0.09 | 0.18 |
| Qianguo (QG) | 0.30 | 0.15 | 0.30 | 0.24 |
| Changling (CL) | 0.30 | 0.14 | 0.19 | 0.37 |
| Qianan (QA) | 0.44 | 0.14 | 0.11 | 0.32 |
| Fuyu (FY) | 0.18 | 0.07 | 0.01 | 0.73 |
| Taobei (TB) | 0.15 | 0.16 | 0.61 | 0.07 |
| Zhenlai (ZL) | 0.26 | 0.63 | 0.00 | 0.11 |
| Tongyu (TY) | 0.28 | 0.51 | 0.18 | 0.04 |
| Taonan (TN) | 0.25 | 0.38 | 0.37 | 0.00 |
| Shulan (SL) | 0.00 | 0.00 | 0.55 | 0.45 |
| Daan (DA) | 0.04 | 0.19 | 0.32 | 0.46 |
| Disaster Index | High | Medium–High | Medium | Medium–Low | Low |
|---|---|---|---|---|---|
| 5% ≤ x < 10% | T = 1 | 1 < T ≤ 2 | 2 < T ≤ 3 | 3 < T ≤ 4 | T > 4 |
| 10% ≤ x < 15% | 1 < T ≤ 2 | 2 < T ≤ 3 | 3 < T ≤ 4 | 4 < T ≤ 6 | T > 6 |
| 15% ≤ x < 20% | 1 < T ≤ 2 | 2 < T ≤ 4 | 4 < T ≤ 6 | 6 < T ≤ 10 | T > 10 |
| ≥20% | 1 < T ≤ 2 | 2 < T ≤ 5 | 5 < T ≤ 10 | 10 < T ≤ 20 | T > 20 |
Publisher’s Note: MDPI stays neutral with regard to jurisdictional claims in published maps and institutional affiliations. |
© 2022 by the authors. Licensee MDPI, Basel, Switzerland. This article is an open access article distributed under the terms and conditions of the Creative Commons Attribution (CC BY) license (https://creativecommons.org/licenses/by/4.0/).
Share and Cite
Zhang, J.; Wang, J.; Chen, S.; Tang, S.; Zhao, W. Multi-Hazard Meteorological Disaster Risk Assessment for Agriculture Based on Historical Disaster Data in Jilin Province, China. Sustainability 2022, 14, 7482. https://doi.org/10.3390/su14127482
Zhang J, Wang J, Chen S, Tang S, Zhao W. Multi-Hazard Meteorological Disaster Risk Assessment for Agriculture Based on Historical Disaster Data in Jilin Province, China. Sustainability. 2022; 14(12):7482. https://doi.org/10.3390/su14127482
Chicago/Turabian StyleZhang, Jiawang, Jianguo Wang, Shengbo Chen, Siqi Tang, and Wutao Zhao. 2022. "Multi-Hazard Meteorological Disaster Risk Assessment for Agriculture Based on Historical Disaster Data in Jilin Province, China" Sustainability 14, no. 12: 7482. https://doi.org/10.3390/su14127482