Next Article in Journal
Application of Intelligent Technology in Facade Style Recognition of Harbin Modern Architecture
Previous Article in Journal
Public Policy and Incentives for Socially Responsible New Business Models in Market-Driven Real Estate to Build Green Projects
 
 
sustainability-logo
Article Menu

Article Menu

Article

Indoor Thermal Comfort and Adaptive Thermal Behaviors of Students in Primary Schools Located in the Humid Subtropical Climate of India

Interdisciplinary Graduate School of Engineering Sciences, Kyushu University, Kasuga City 816-8580, Japan
*
Author to whom correspondence should be addressed.
Sustainability 2022, 14(12), 7072; https://doi.org/10.3390/su14127072
Submission received: 9 May 2022 / Revised: 27 May 2022 / Accepted: 7 June 2022 / Published: 9 June 2022
(This article belongs to the Topic Sustainable Built Environment)

Abstract

:
This study investigated children’s perceptions and adaptive behaviors related to indoor thermal conditions of classrooms in primary schools with no air-conditioning systems during both summer and winter in Dehradun City, Uttarakhand, India. Responses were collected from 5297 school children aged 6–13 years. During the measurement periods, 100% and 94% of the samples were obtained under conditions outside an 80% thermally acceptable comfort range in winter and summer, respectively. The analysis using receiver operating characteristics suggested that the students had the least sensitivity to the temperature variation for all scales of the thermal sensation vote (TSV). Approximately 95.1% of students were “very satisfied”, “satisfied”, or “slightly satisfied” with the thermal conditions under the condition of “extreme caution” or “danger” of heat risk. In contrast, adaptive thermal behaviors, such as adjusting clothing insulation ensembles, opening or closing classroom windows and doors, and utilizing ceiling fans, were found to be the most affordable options for optimizing indoor thermal comfort. Children’s reports of thermal sensations and thermal satisfaction did not correspond to the actual physical environment. This draws attention to the adequacy of applying widely used methods of TSV-based identification of the thermal comfort range in classrooms for children, especially in hot environments. The findings of this study are expected to serve as an evidence-based reference for local governments and authorities to take appropriate measures to mitigate heat risks for schoolchildren in the future.

1. Introduction

In recent decades, the increase in heatwaves and harsh summers due to global warming has increased the potential associated health risks, especially in children [1]. Thus, identifying the degree of heat-related risk in vulnerable population groups and finding measures to mitigate it is essential [2,3]. Moreover, healthy and comfortable educational buildings are important for children who conduct 30% of their daily activities there [4]. Inadequate indoor environmental conditions, such as high room air temperatures, noise disturbances, low illuminance, and poor indoor air quality in classrooms, can negatively influence students’ learning performance and cause health problems [5]. In particular, Mors et al. reported that compared to adults, 7- to 11-year-old students exhibit poorer physical adaptation to their surroundings, highlighting the importance of thermal comfort in primary schools for students’ physical and mental health [6].
Therefore, intensive research has been conducted on indoor comfort assessments of educational buildings in different climatic regions worldwide. Wargocki et al. [7] studied the effects of indoor classroom temperatures on academic performance in regular schoolwork by 10- to 12-year-old students in Denmark during the late summer period. They demonstrated that when the temperature was reduced from 25 °C to 20 °C, the students’ performance in numerical and language-based tests improved notably, indicating that increased indoor temperatures have a negative effect on students’ performance. Zomorodian et al. [8] presented a review of thermal comfort studies in schools, ranging from primary and secondary schools to universities. They adopted 48 papers published from 1969 to 2015 and pointed out that the number of studies on primary schools is smaller than that on other school categories, mostly conducted in Europe. In addition, they reported a comparison of the thermal sensation among different ages of children based on past surveys and pointed out a lower comfort temperature for primary school children. Table 1 summarizes past surveys on students’ thermal perception in classrooms of primary or secondary schools worldwide, mainly focusing on the temperature sensitivity of students. Most of them summarized the findings by using linear regression between indoor physical variables, such as operative temperature (Top) and students’ subjective thermal sensation. The optimized coefficients of these regression equations are diverse, probably due to the conditions specific to each survey, such as the age of students, outdoor running temperature, or flexibility of students’ thermal adaptation behaviors, as revealed by previous adaptive thermal comfort research.
Meanwhile, India, a developing country with a large population (26%) aged under 14 years, has been facing the severe impacts of climate change in the form of increasing heatwave events [9,10]. For instance, during the heat waves in Ahmedabad in 2010, the air temperature reached 46.8 °C, resulting in a 41% increase in the mortality of vulnerable groups such as children and senior residents [11]. The predicted increase in future heatwave events may cause severe health problems in children [12,13,14]. According to the latest report from the Ministry of Earth Science of India, 17 states (Punjab, Himachal Pradesh, Uttarakhand, Delhi, Haryana, Rajasthan, Uttar Pradesh, Gujarat, Madhya Pradesh, Maharashtra, Chhattisgarh, Bihar, Jharkhand, West Bengal, Odisha, Andhra Pradesh, and Telangana) are categorized in the core of the heatwave zone (CHZ), where severe heatwaves have frequently occurred in the last 50 years (1971–2019) [15]. Accordingly, understanding the indoor thermal conditions of children’s educational buildings located in the above-mentioned areas is crucial. However, research focusing on educational buildings and the thermal comfort of students, especially in primary schools located in the CHZ, remains limited. To address this research gap, this study intended to investigate adaptive thermal behaviors and thermal acceptability of students in primary school classrooms in the CHZ in India based on field surveys of thermal comfort. The objectives of this study were to (a) observe the indoor thermal environment in primary school classrooms, especially in the hot summer, (b) investigate the thermal perceptions of students in terms of acceptability and comfort, and (c) understand the thermal adaptation behaviors of students. To do this, the authors conducted questionnaire surveys in 12 primary school buildings located in Dehradun, Uttarakhand, during the summer and winter seasons. The results of this study can serve as an evidence-based reference for local governments and authorities to take appropriate measures to mitigate heat risks for schoolchildren in the future.

2. Materials and Methods

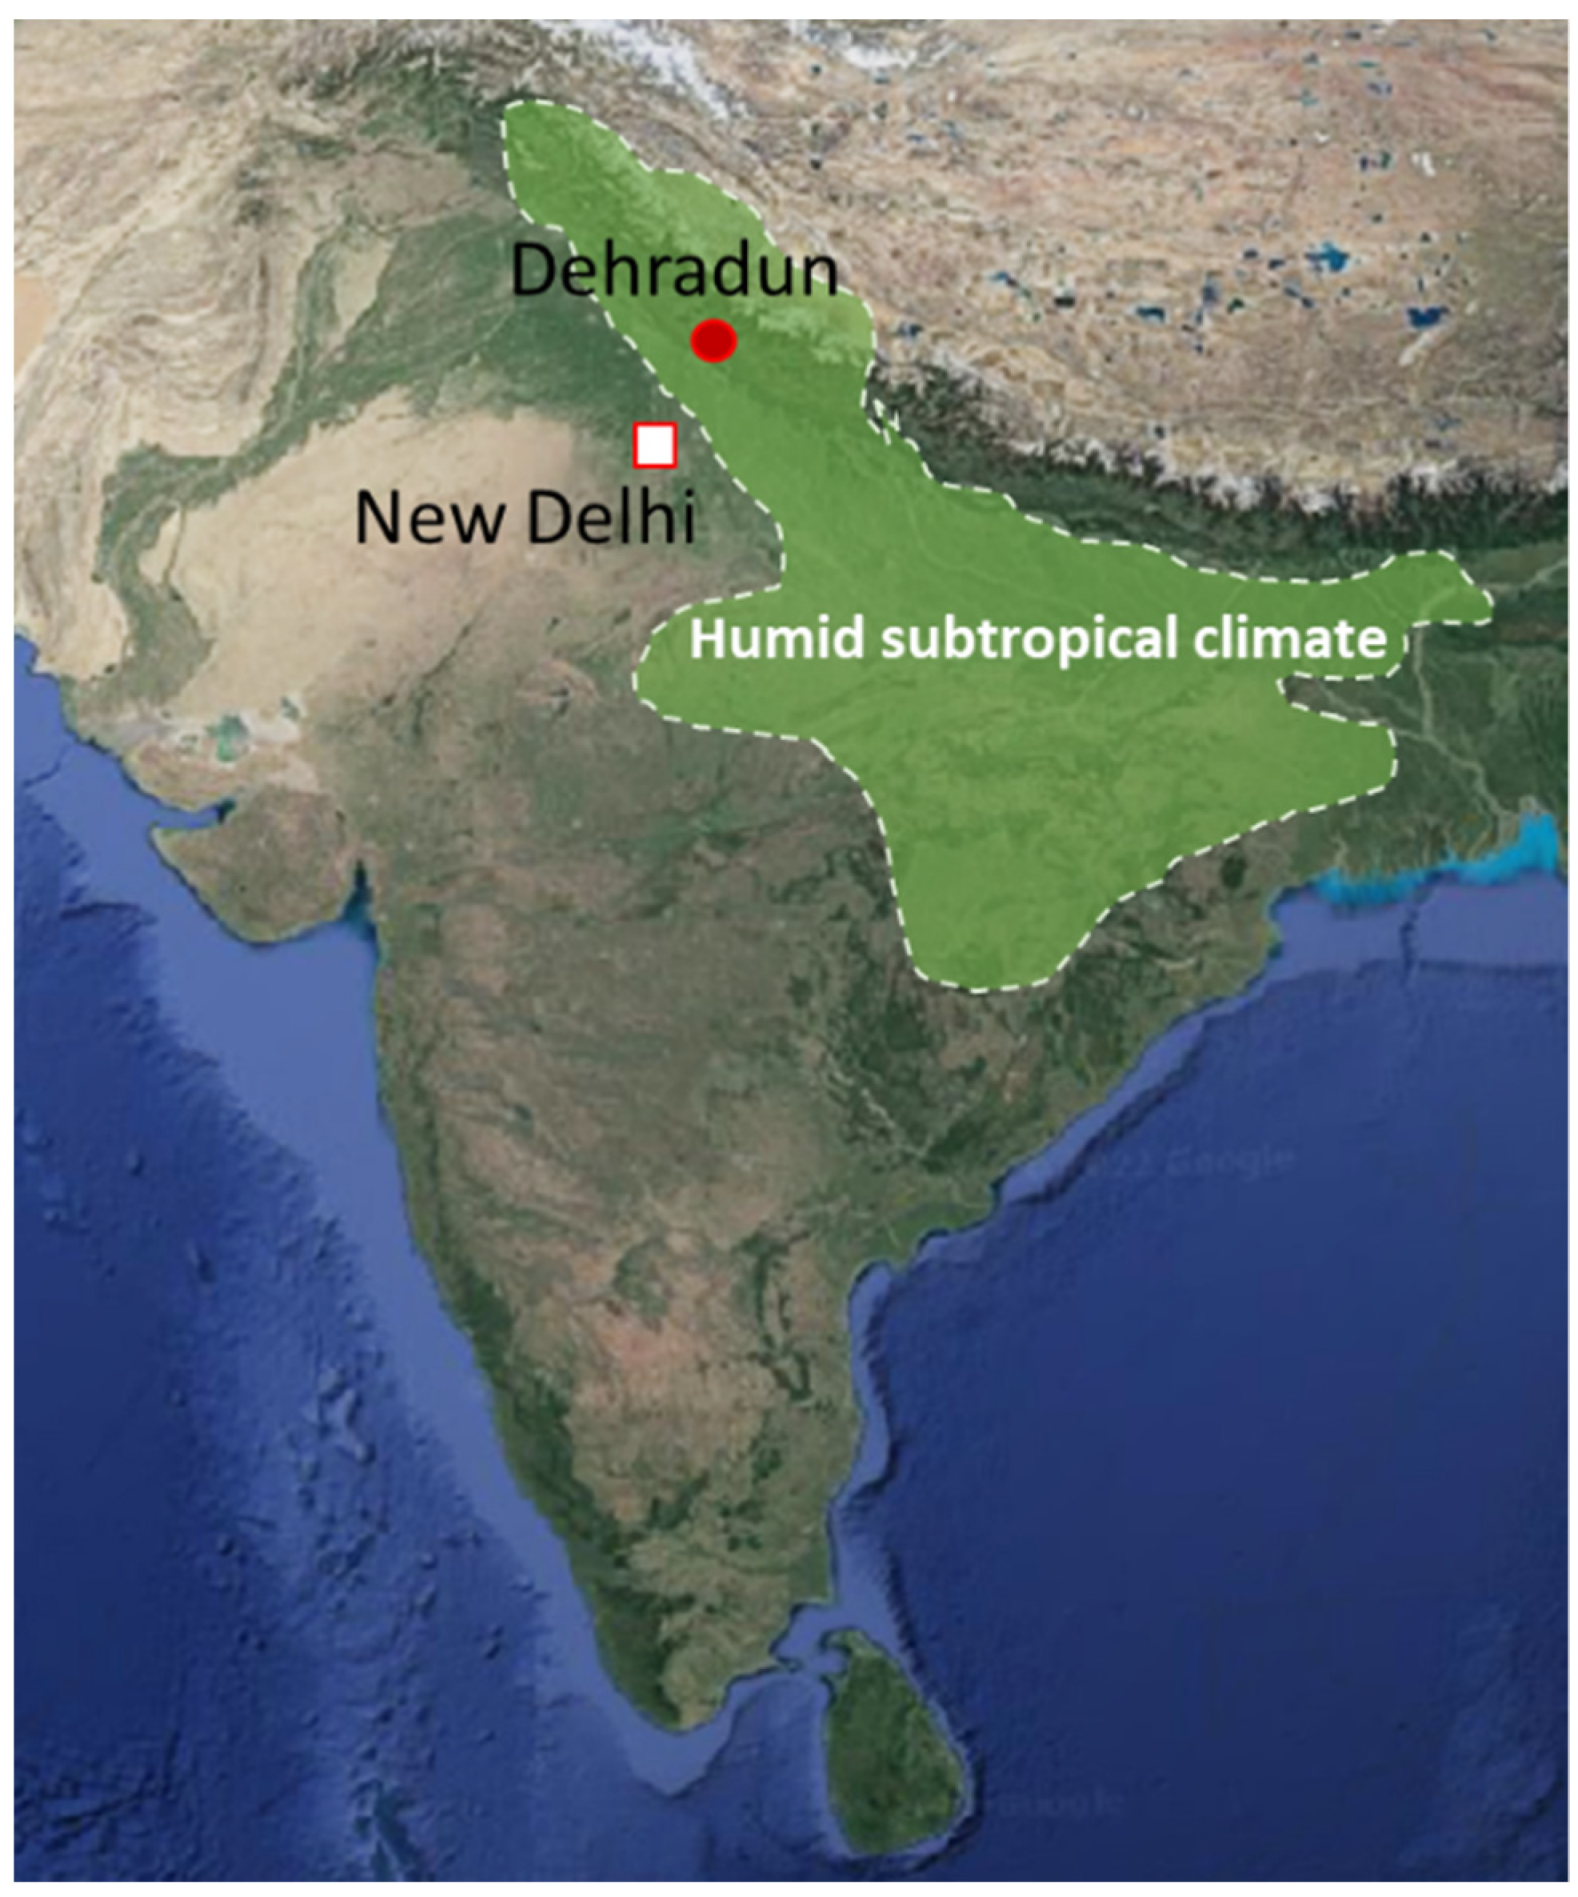
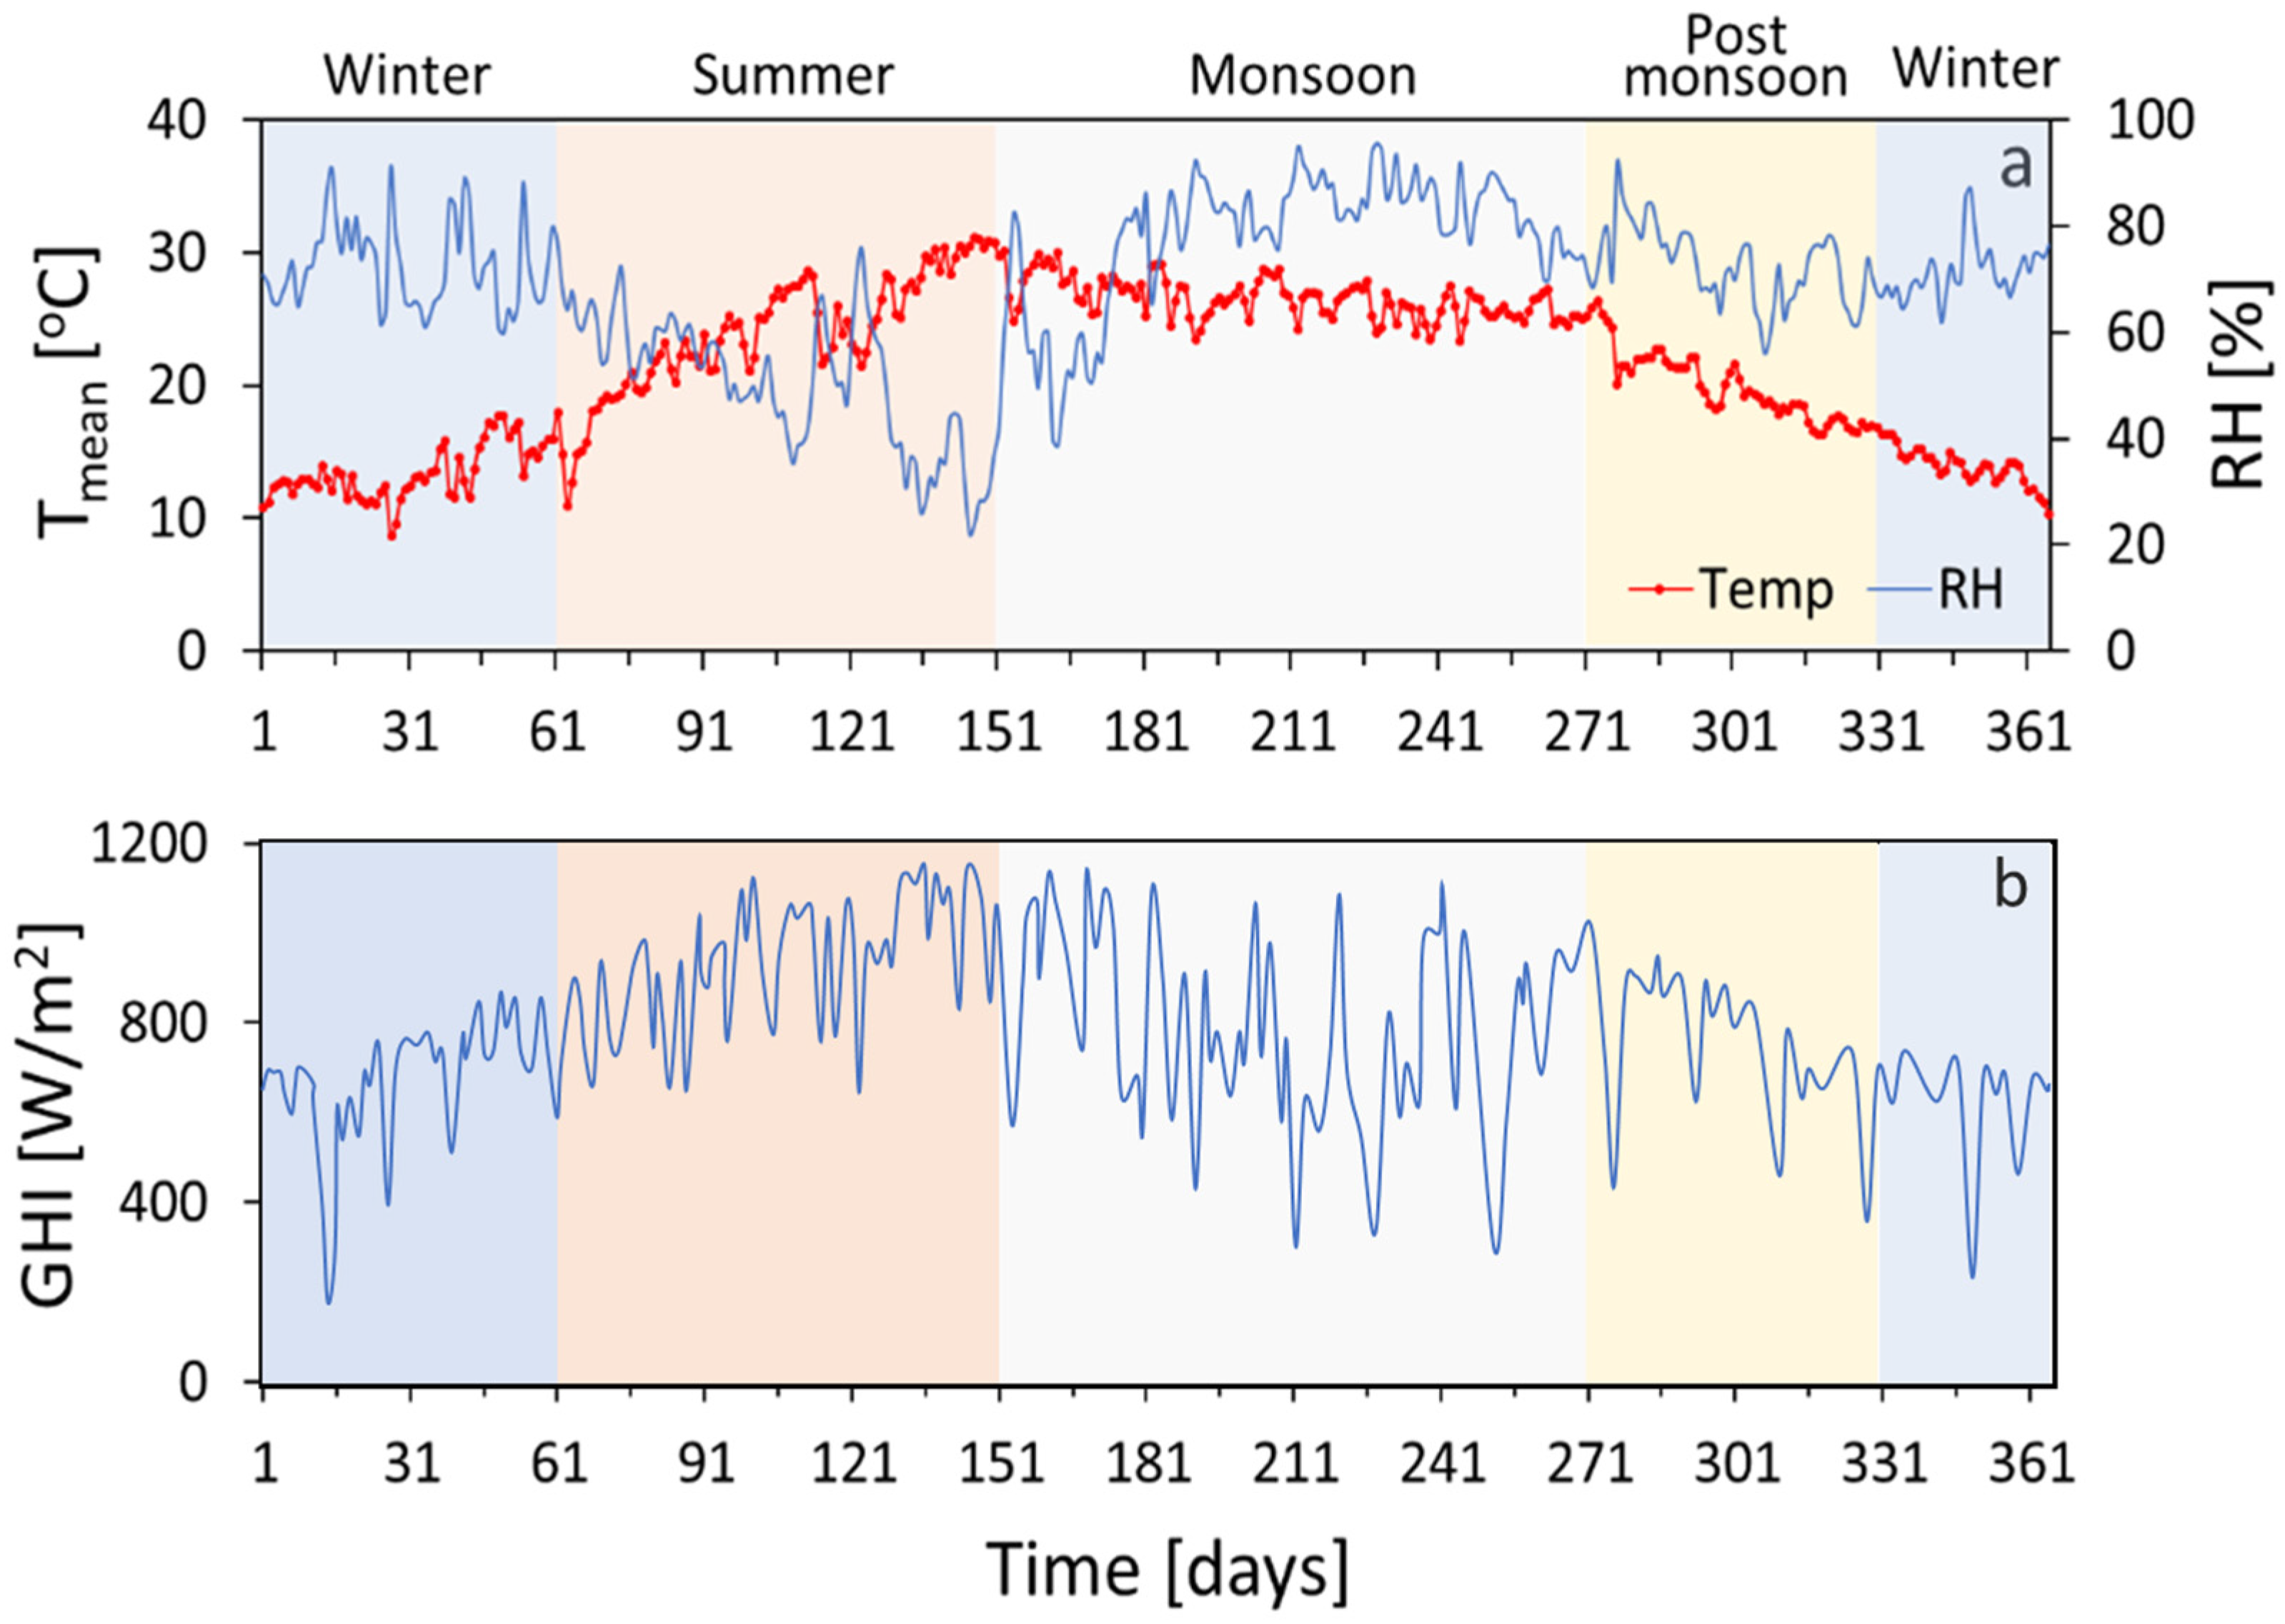
2.1. Study Area and Climatic Conditions

The survey was conducted at 12 primary schools in Dehradun City, Uttarakhand, India. The survey region is located in the Himalayan mountain range and lies between latitudes 29°58′ N and 31°2′ N and longitudes 77°34′ E and 78°18′ E. According to the Ministry of Home Affairs, during the 2011 census, Uttarakhand had a total population of 10 million, consisting of 50.9% males and 49.1% females. Furthermore, 69.8% of the population resided in rural areas. The school-age population (5–14 years) was the highest at 21.8% (Figure 1) [27]. In terms of climatic conditions, this region is categorized as having a humid subtropical climate (Cfa) in the Köppen–Geiger climate classification [28,29,30] (Figure 2). The seasons were classified into winter (December–February), summer (March–May), monsoon (June–September), and post-monsoon (October–November). Additionally, Figure 3 shows the annual trends of the daily mean temperature, relative humidity, and maximum global horizontal solar radiation in Dehradun City. In general, the summer in Dehradun is hot, with a maximum temperature of 44 °C and an average temperature ranging from 27 to 33 °C. Moreover, the daily maximum global solar radiation reaches 1180 W/m2. However, in winter, the daily average temperature ranges from 8 to 18 °C. Although it is not bitterly cold for the entire winter, the temperature may drop for a few days because of cold winds from the nearby Himalayan Mountains, resulting in the lowest temperature of approximately 0 °C [31].

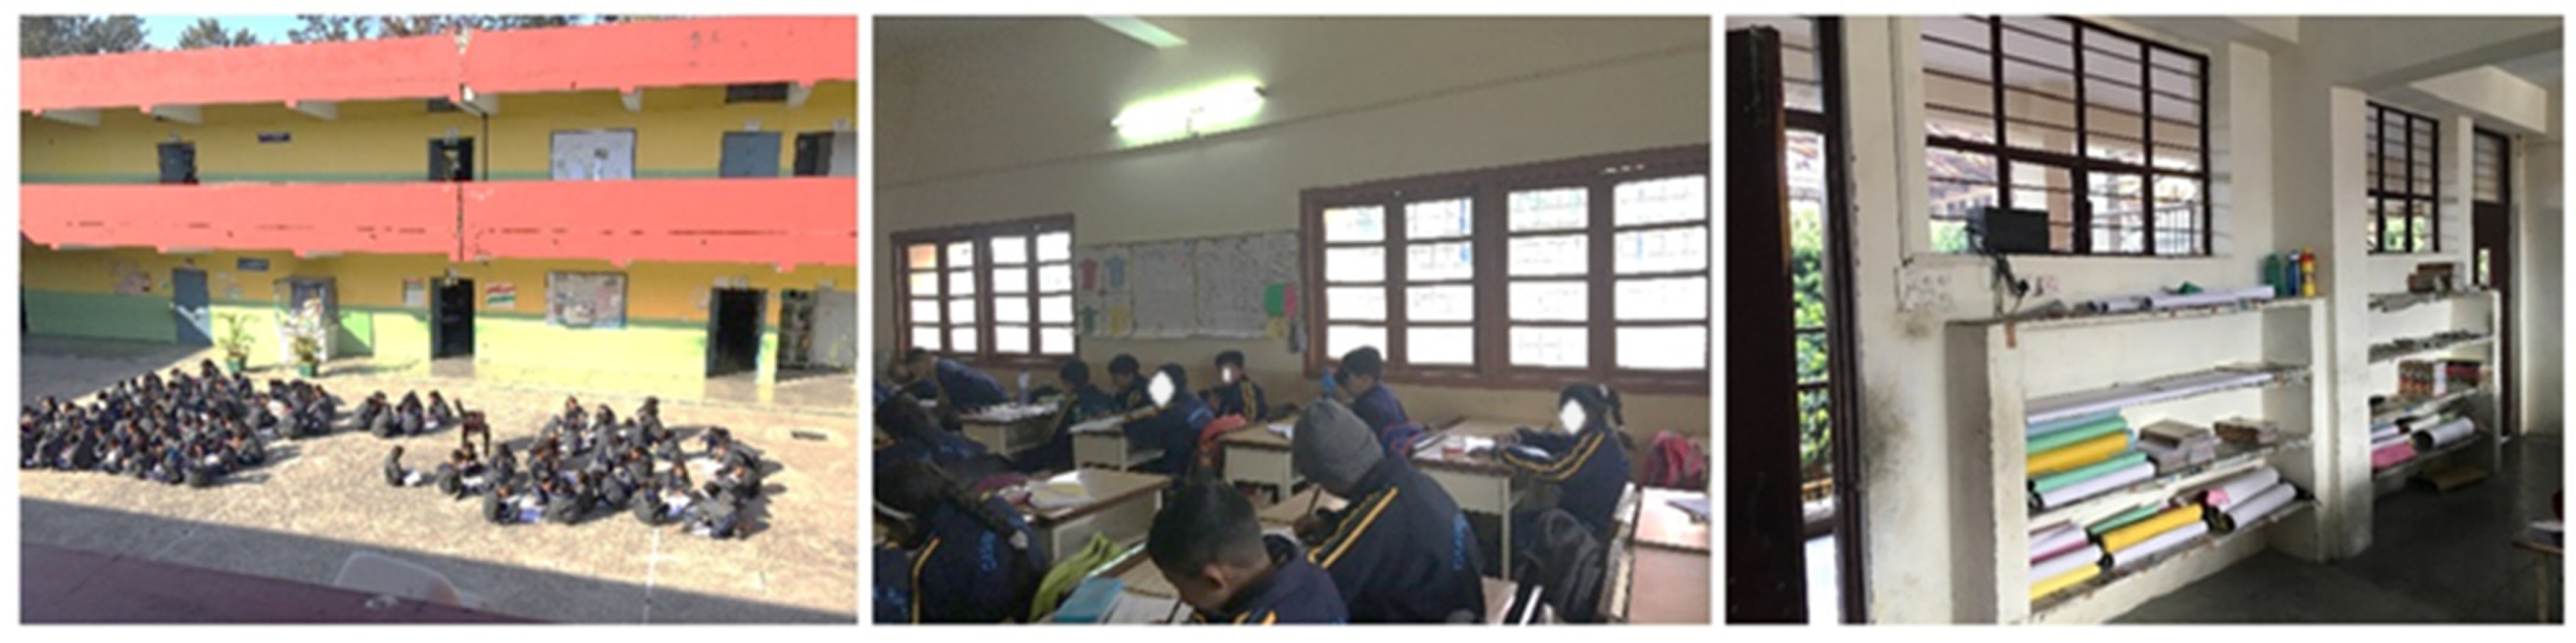
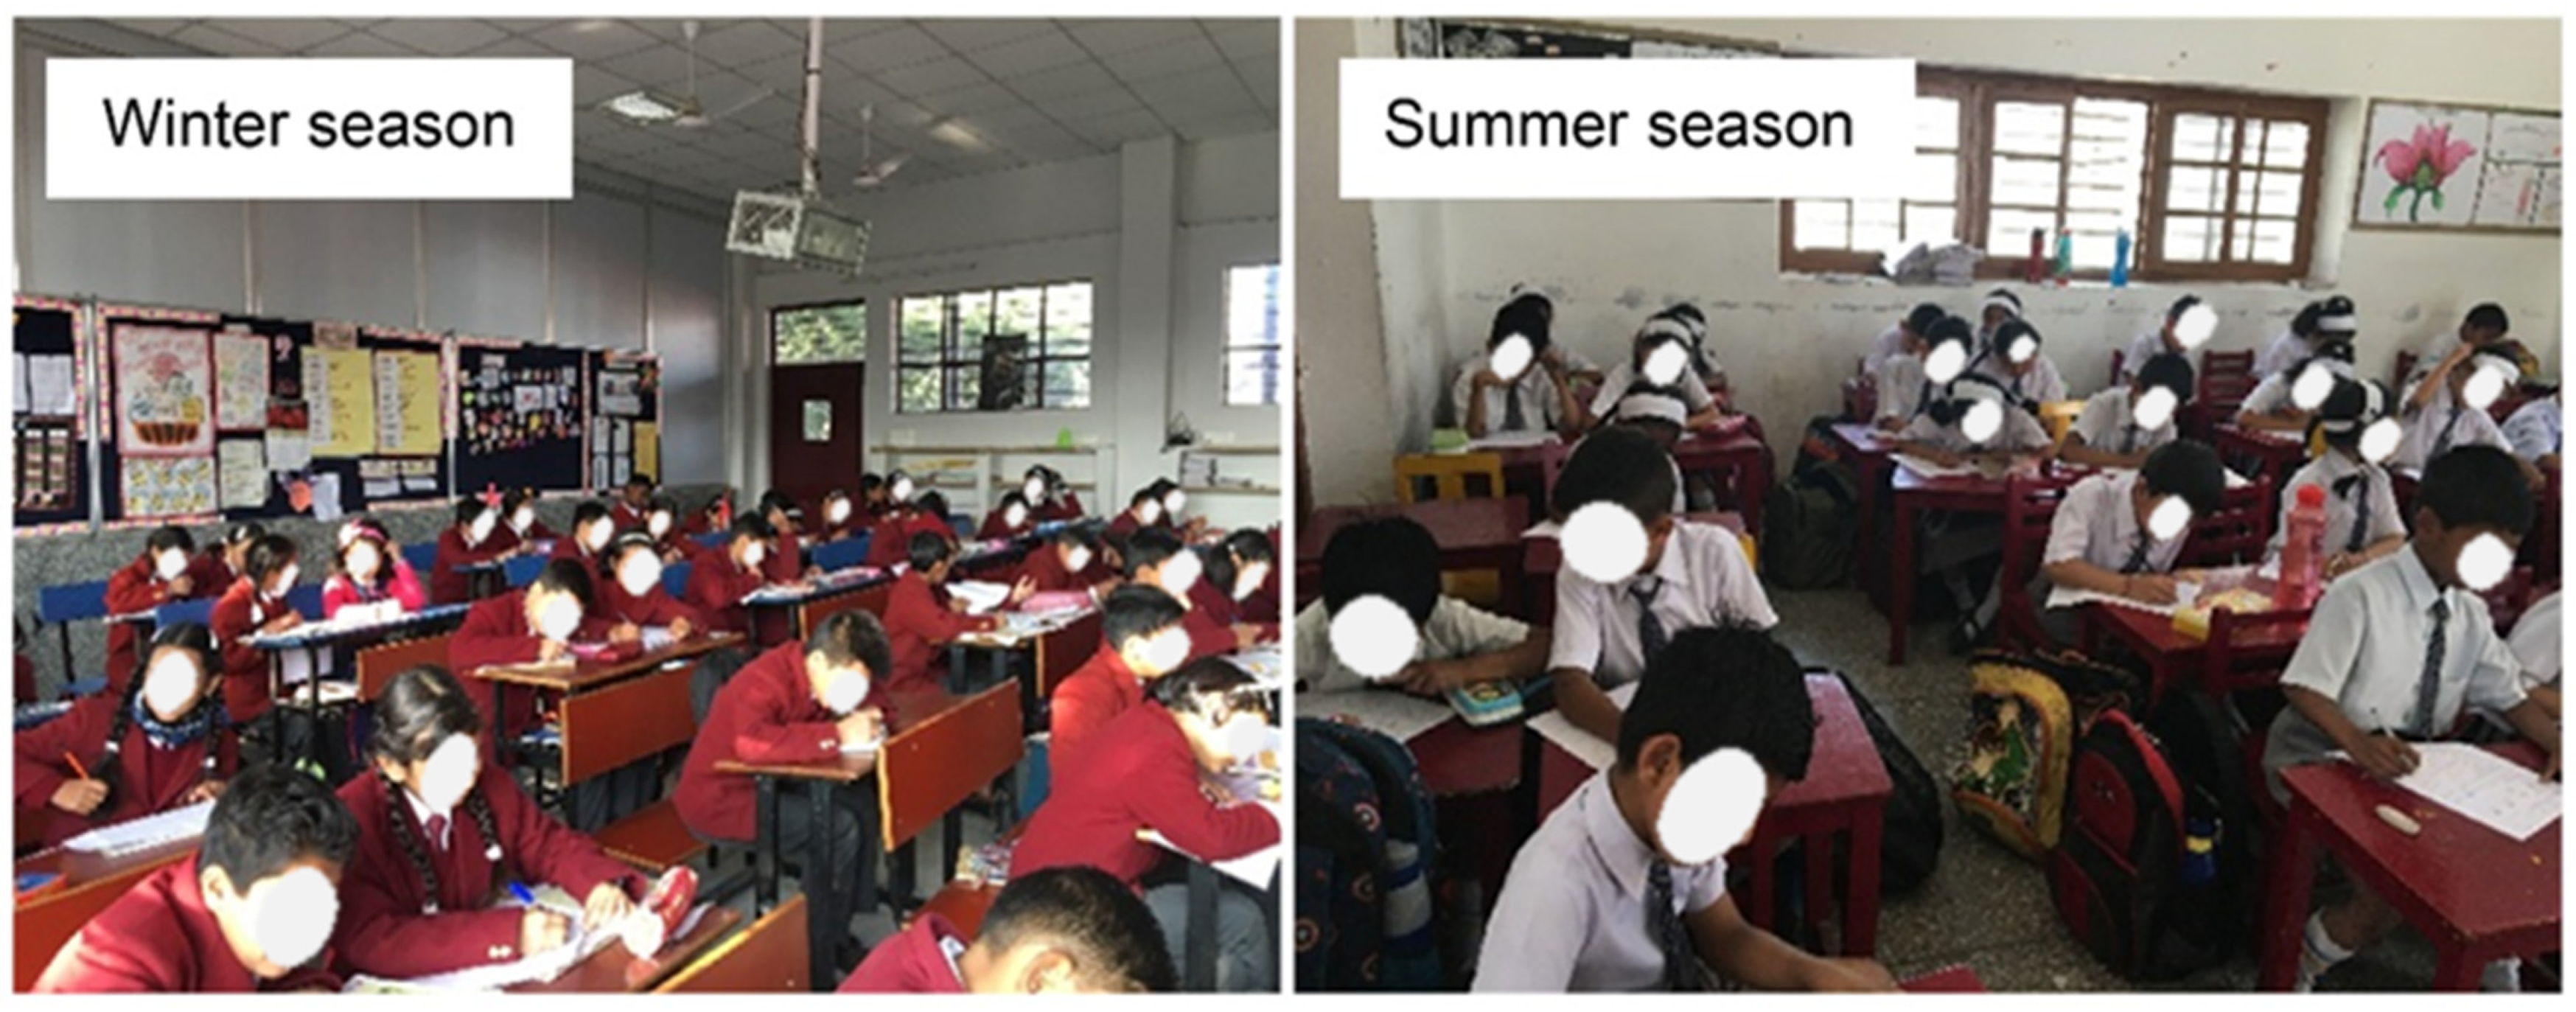
2.2. Observed School Buildings and Classrooms

Field surveys were conducted in 12 schools. Figure 4 illustrates the indoor and outdoor conditions of one of the school buildings observed in this study. Generally, the building construction materials of the surveyed buildings were similar, with a reinforced concrete (RCC) structure, walls made of bricks or concrete blocks with mortar plaster, and an RCC roof slab. Another common feature of these schools was that the building walls were not insulated. Most schools had an open courtyard plan, which is a popular campus plan for buildings in composite climates in India, to help with the cross ventilation of buildings [33].
All the investigated classrooms (14 classrooms in winter and 21 classrooms in summer) were categorized as free-running mode, and each classroom had sufficient artificial lighting along with four to five ceiling fans. This means that the classrooms were more thermally dynamic than the air-conditioned environments.

2.3. Thermal Comfort and Questionnaire Surveys

Questionnaire surveys were conducted during the winter and summer of 2019. The questionnaire survey for the winter season was conducted in five schools for three weeks, from 14 January to 1 February, while the summer season survey was conducted in seven schools for three weeks, from 29 April to 17 May. During these periods, 5297 questionnaire responses were collected from 3rd to 5th graders aged 6 to 13 years. It is noteworthy that surveyed schools had diverse ages among students in each grade owing to the merit-based education system of India. In the 3rd grade, the age of the students ranged from 6 to 9 years old, while in the 4th and 5th grade the age ranges were 9–10 and 11–13 years old respectively. Table 2 shows the number of responses classified by age and gender of respondents from all schools. A total of 2039 responses were obtained during the winter season, whereas 3258 respondents were obtained in the summer season.
The questionnaire was administered over one to five days for each school during the school hours between 8:30 am and 2:00 pm under sedentary conditions. To avoid a change in activities over a short duration that can affect students’ thermal perceptions and preferences, Goto et al. [34] recommend that respondents maintain a stable level of activity for at least 15–20 min to achieve optimal thermal responses. Accordingly, the authors conducted surveys after a preceding class during morning hours in winter (most likely the coldest time during the winter days) and from noon to afternoon during summer (the hottest time during the summer days). The surveys were not conducted immediately after a lunch break or sports activity, to exclude the effects of previous activities. Figure 5 shows the conditions under which students completed the questionnaire.
Questionnaire sheets are the most vital and fundamental factor in obtaining accurate answers regarding the thermal sensations of schoolchildren [26,27]. Therefore, to ensure that the children fully understood the questions and to avoid misunderstandings, the questionnaire sheets were written using simple English vocabulary and illustrations under the advice and guidance of a teacher working in a local primary school. Note that even though the mother language of the children was not English, the surveyed schools adopted English as a primary language in classrooms. In addition, a verbal explanation of each question was provided to the students while they were filling in the questionnaire sheets.
The questions included age, gender, a checklist of what clothing they were wearing, and a subjective thermal sensation vote (TSV) and thermal preference vote (TPV) based on a seven-point and five-point scale, respectively. Previous studies [35,36,37] recommended using a simple vocabulary to help children easily understand the meaning of each TSV scale. Thus, we used words that were modified from the original expressions used in ASHRAE 55, as shown in Table 3. Furthermore, questions related to perceptions of humidity, lighting, noise, thermal satisfaction, and adaptive behaviors were included in the sheets. The questionnaires did not include detailed personal information such as height, weight, ethnicity, and family income because of the assumption that primary school children would not be able to answer correctly. While the students filled in the questionnaire sheet, the indoor air temperature, relative humidity, and air speed were measured every two minutes. Details of the instruments used are listed in Table 4.

3. Results and Discussion

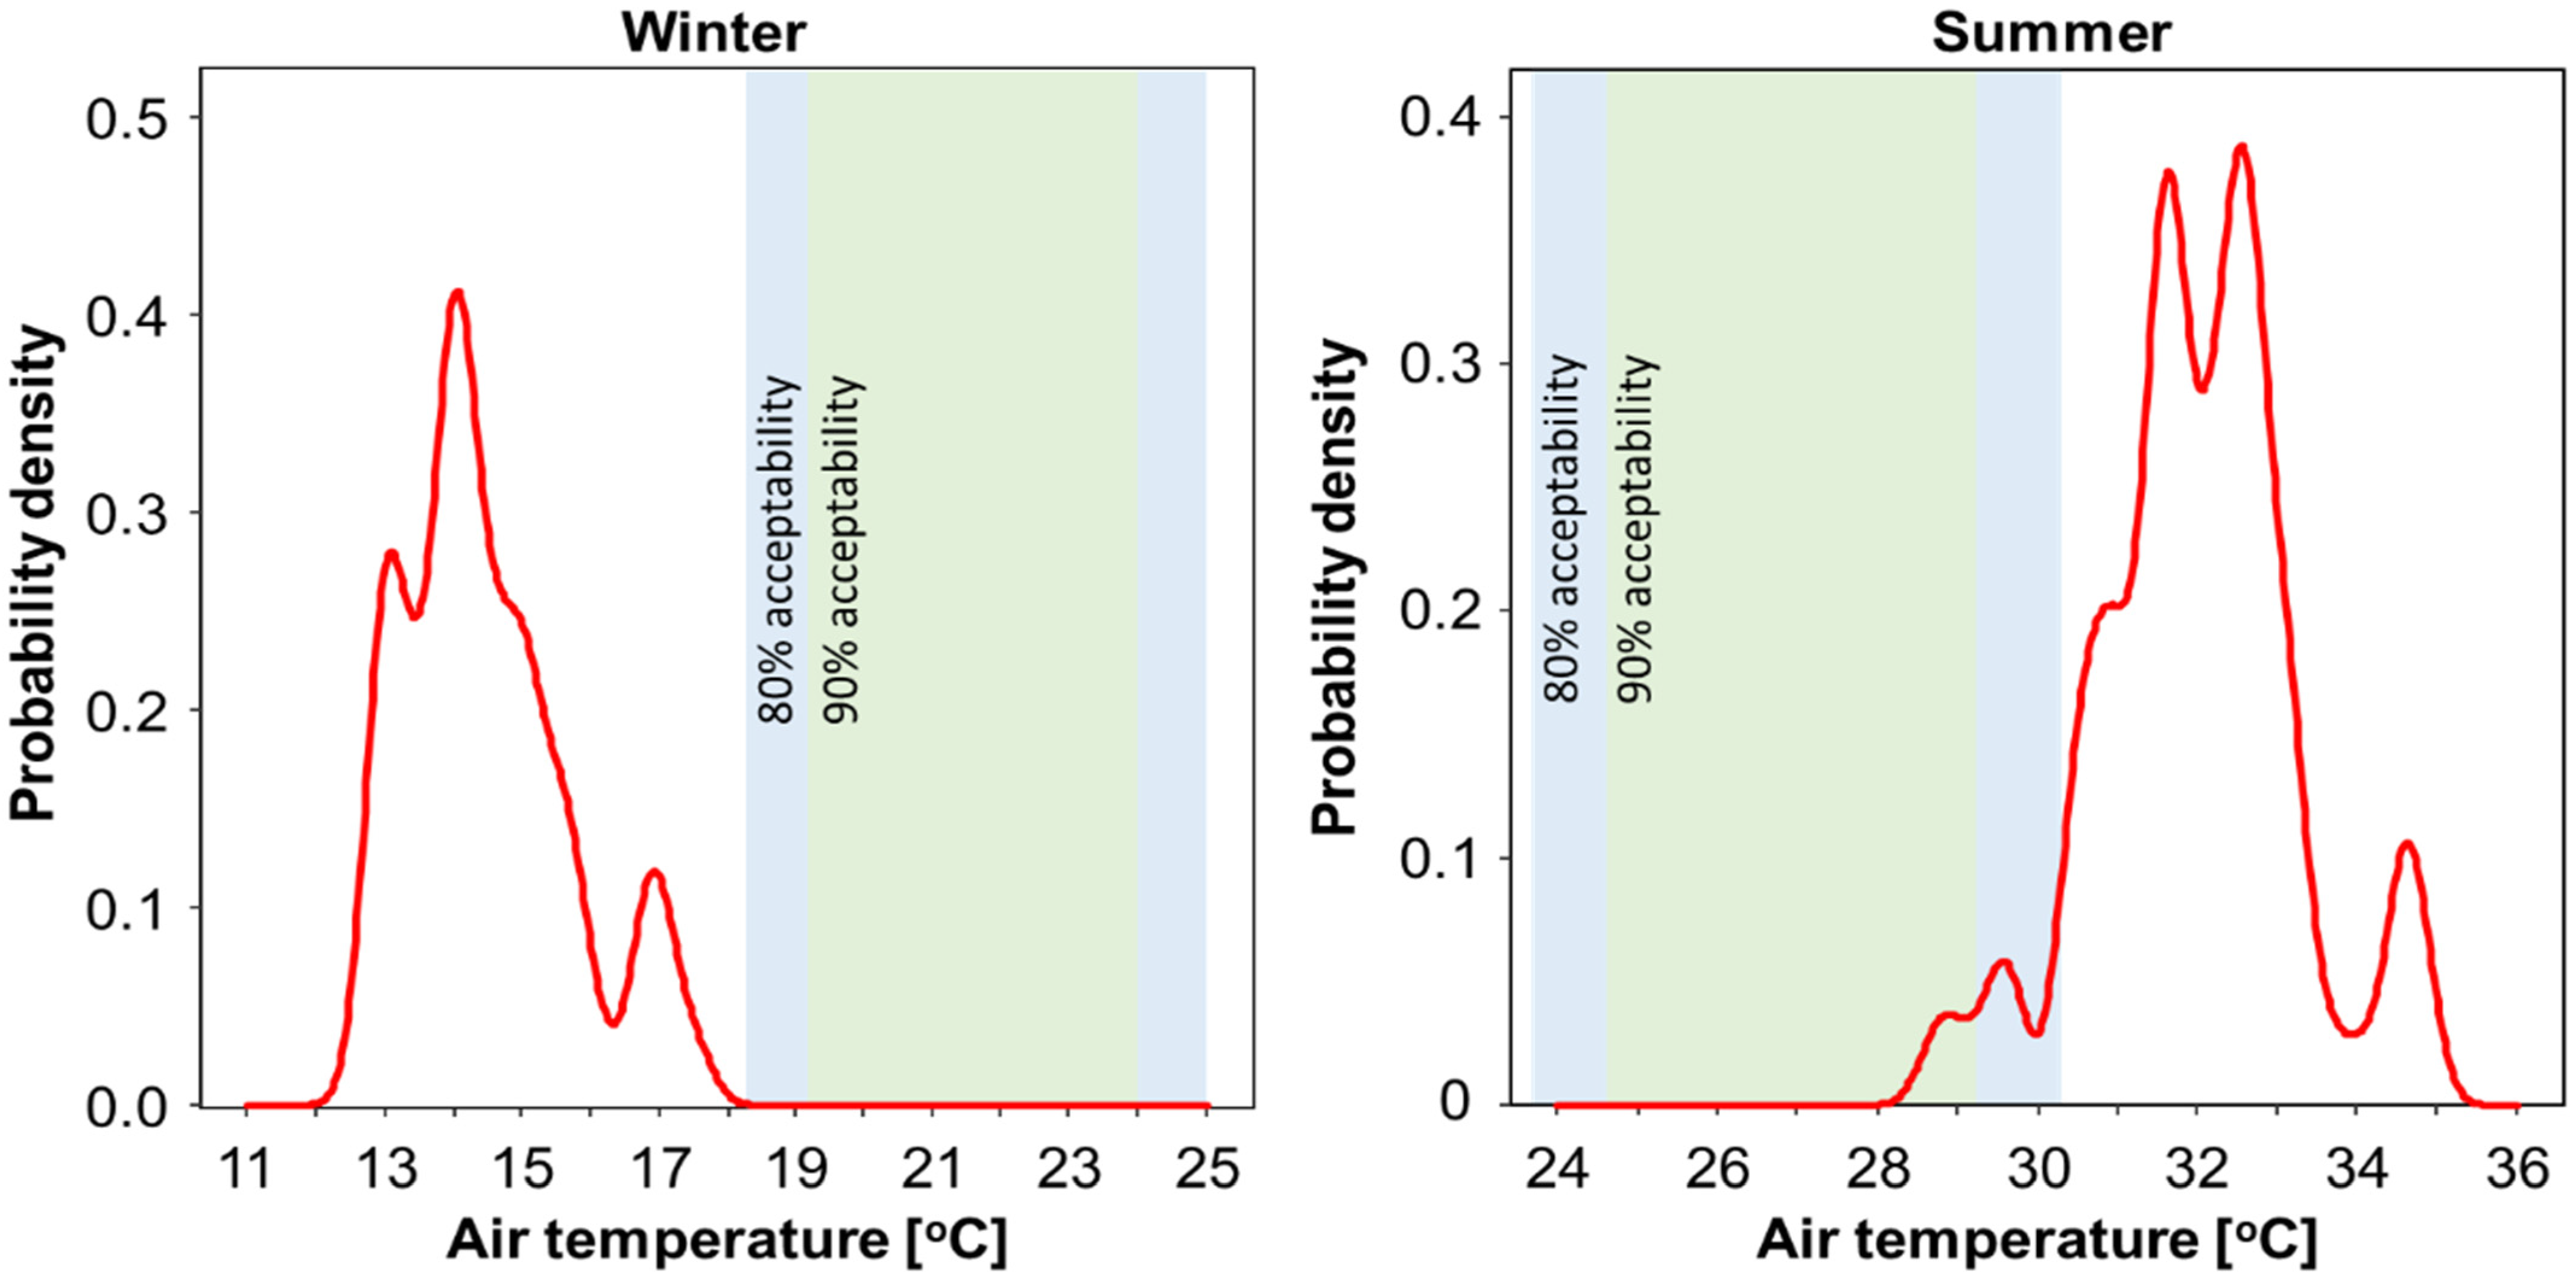
3.1. Indoor Thermal Conditions during Field Surveys

Figure 6 illustrates the probability density distributions (PDDs) of the measured indoor air temperatures of the classrooms during the questionnaire surveys during the winter and summer. As can be seen from the graphs, during the winter period, the indoor air temperature ranged from 12.8 °C to 17.2 °C, while in summer it ranged from 28.7 °C to 35.2 °C. In the winter season, the indoor thermal conditions of all surveyed classrooms did not fall within either the 80% or 90% acceptability limit of the acceptable thermal comfort range in naturally conditioned buildings indicated in ASHRAE 55 [38]. Furthermore, only 6.2% of the measured indoor air temperature data fell within the 90% acceptability limit during summer.
With regard to the summer data, to evaluate the potential thermal risk for the children rather than thermal comfort, we calculated the heat index (HI), an empirical index of discomfort and heat risk due to a hot environment, using the measured air temperature and relative humidity in the classrooms. HI is expressed as Equation (1) [39], where T is the air temperature (°F) and RH is the relative humidity (%).
HI = 42.379 + 2.04901523 × T + 10.14333127 × RH                         0.22475541 × T × RH 6.83783 × 10 3 T 2                         5.481717 × 10 2 × RH 2 + ( 1.22874 × 10 3 × T 2 × RH )                         + 8.5282 × 10 4 × T × RH 2 1.99 × 10 6 × T 2 × RH 2
Figure 7 shows the PDD of the HI during the summer survey period. Note that the National Oceanic and Atmospheric Administration [40] provides the bands of heat risk levels based on the HI, namely caution (81–90 °F or 27.2–32.2 °C), extreme caution (91–102 °F or 32.7–38.8 °C), and danger (above 103 °F or 39.4 °C). The PDD of the calculated HI suggests that the heat risk levels of the 21 classrooms surveyed in summer were evaluated as “caution” (2.5%), “extreme caution“ (95.3%), and “danger” (2.2%).

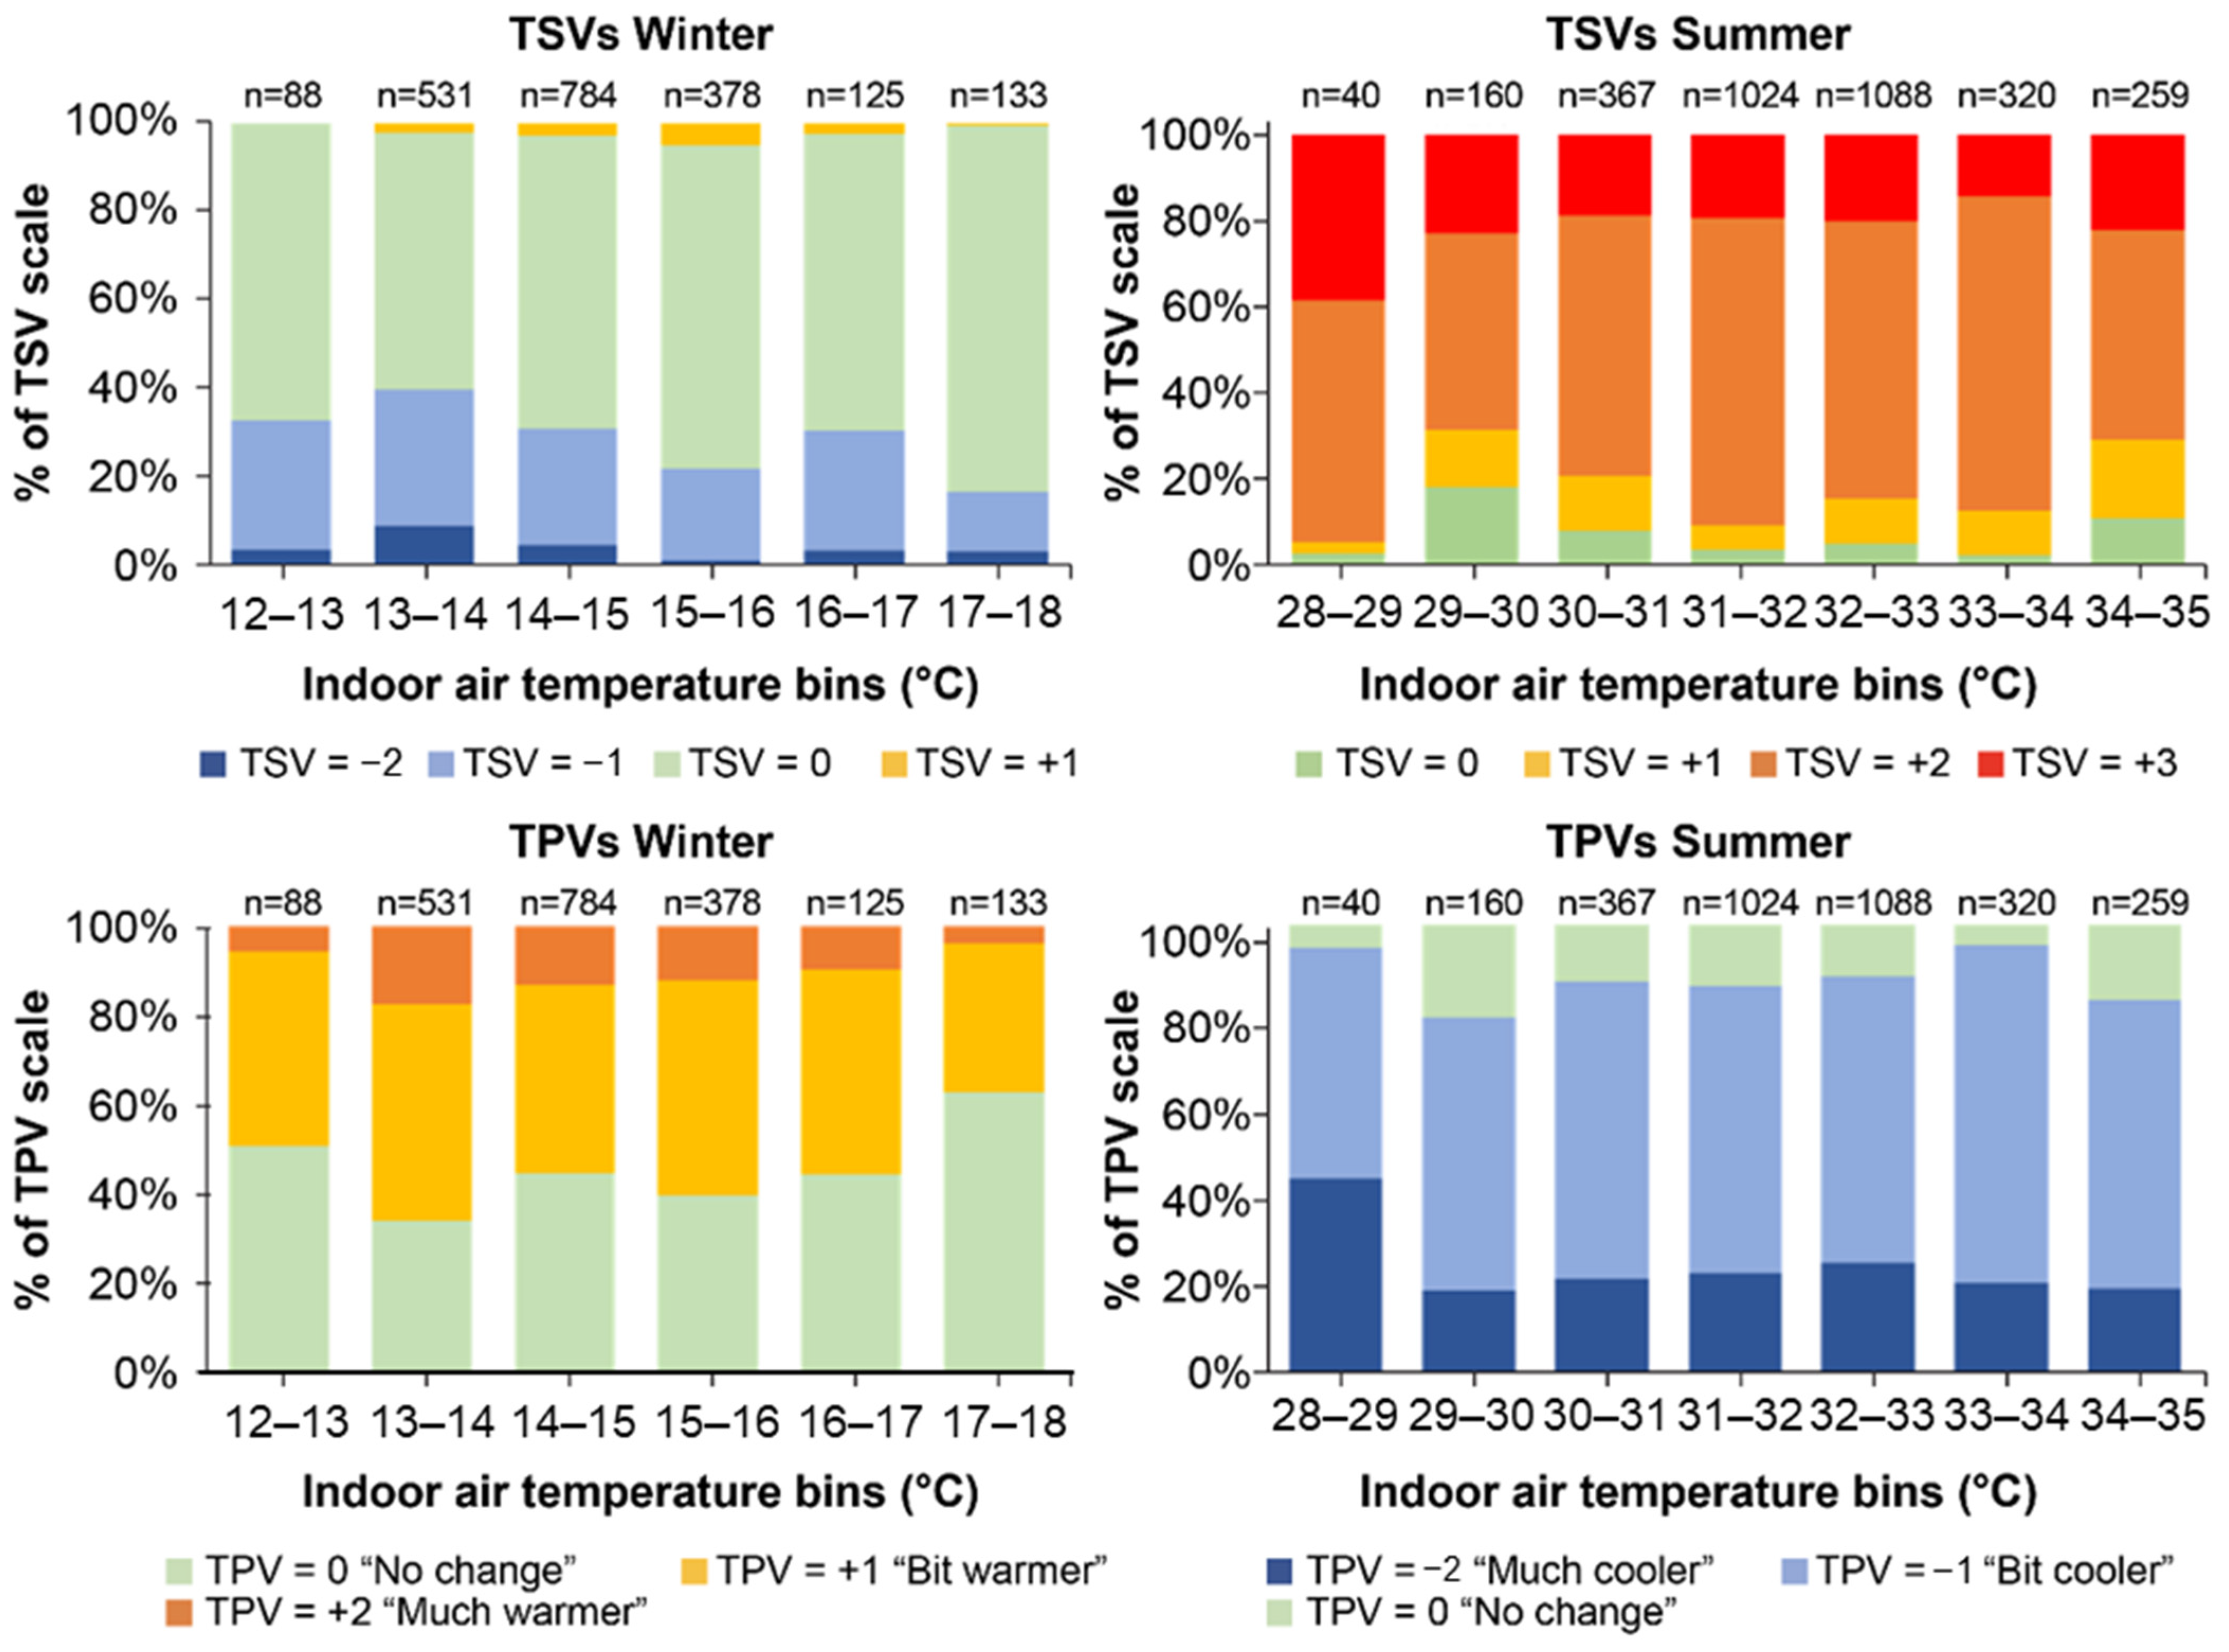
3.2. Students’ Thermal Sensations and Preferences

Figure 8 shows the distribution of TSVs and TPVs across the air temperature binned to 1 °C. In the winter period, more than half of the students selected responses indicating thermal neutrality (TSV = 0) in each bin within the temperature range from 12 °C to 18 °C, despite the fact that these temperature ranges were out of the 80% acceptability limit of ASHRAE 55, as shown in Figure 6. The ratio of TSV below −1 did not show a monotonic trend with temperature. Nevertheless, the highest and lowest fractions of TSV = 0 and TSV ≤ −1 were observed in the highest temperature range of 17–18 °C. The data of TPVs for summer also had no specific tendency in the relation between the ratio of TPV = 0 (“no change”) and air temperature except for the highest temperature range with the highest fraction of TPV = 0.
On the other hand, the TSV results for the summer data indicated that the majority (more than 80%) of students answered either hot or very hot (TSV = 2 or 3) at all temperature ranges. The percentage of students who responded thermally neutral (TSV = 0) ranged from 11% to 18%. The ratio of TSV over 2 for each temperature range varied; however, there was no specific relationship between these ratios and air temperature, similar to the winter results. The percentage of TPV ≥ 2 exceeded 80% at all temperatures. Interestingly, at the highest temperature binned (34–35 °C), the fraction of students who voted “neutral” and “no change” (TSV or TSV = 0) was relatively higher than that for the lower temperature binned in the summer. As a whole, Figure 8 shows that while the students’ TSV and TPV are temperature-sensitive to some extent, discrepancies between temperature and these metrics exist in some conditions. This suggests the need for further statistical analysis.

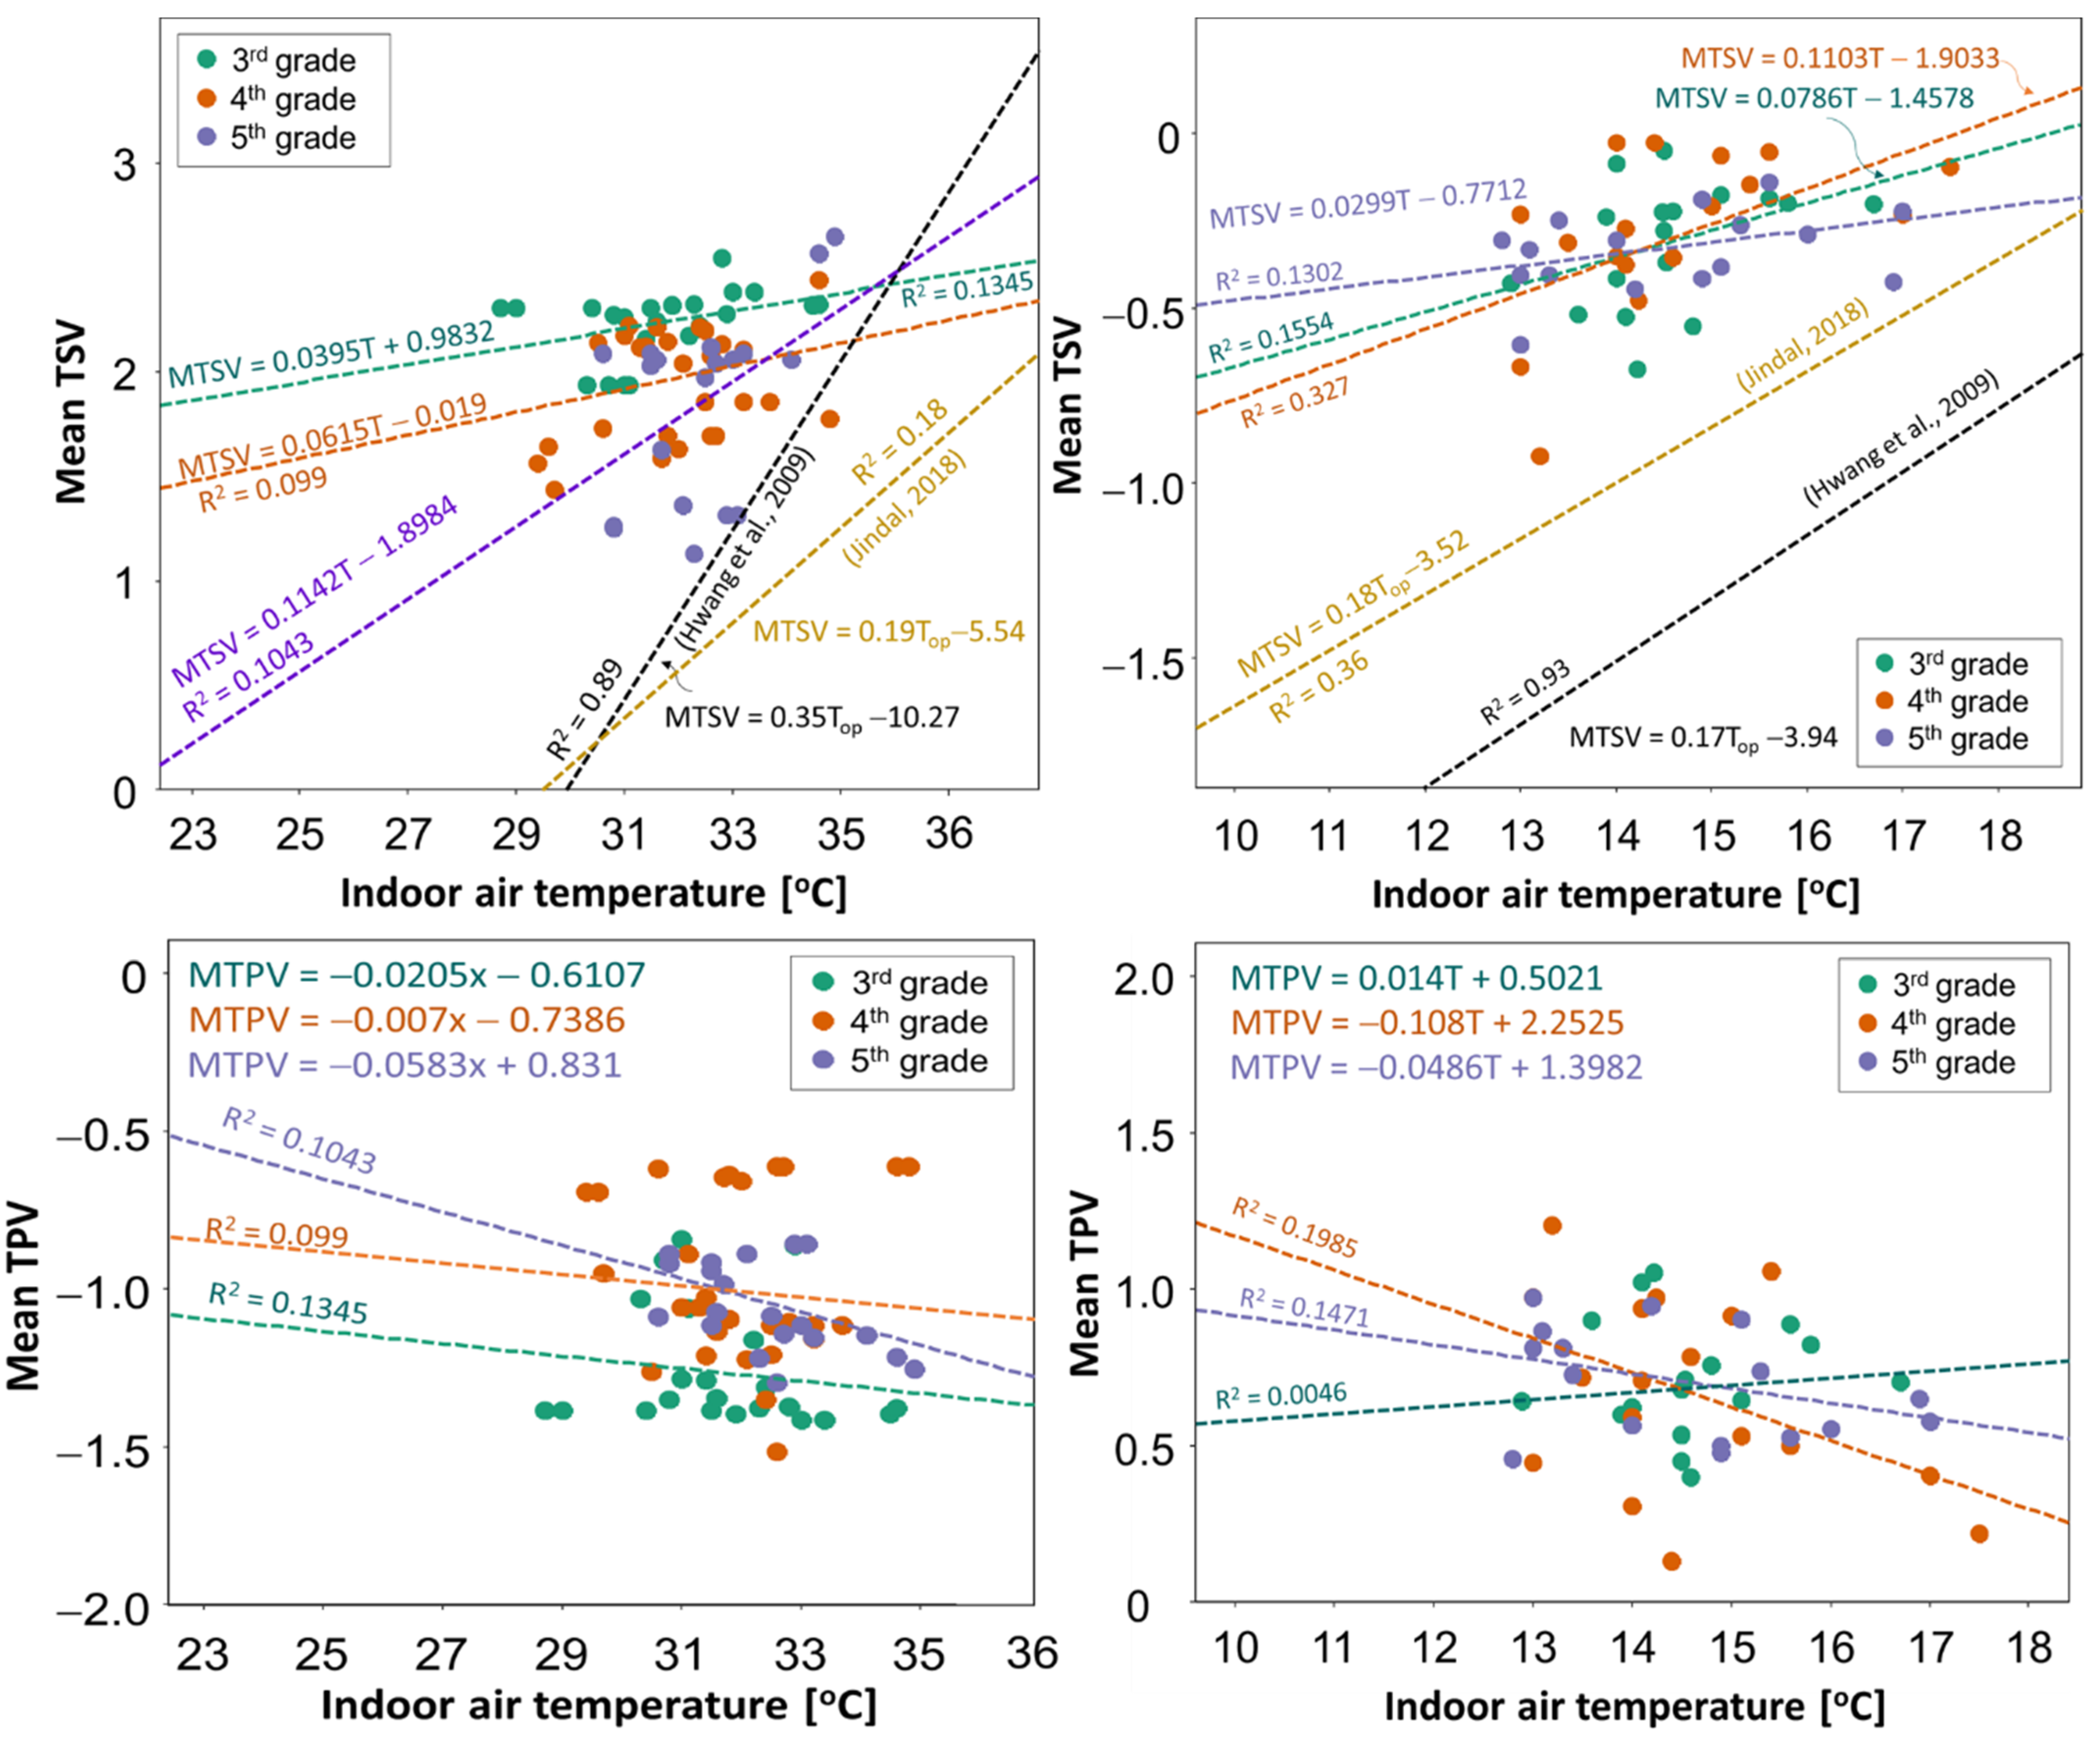
3.3. Relation between Mean Thermal Metrics of Each Class and Temperature

To further investigate students’ sensitivities to indoor air temperature, we applied linear regression between the mean values of TSVs and TPVs (hereafter MTSVs and MTPVs, respectively) from each class and indoor air temperature for the data classified by grade, as shown in Figure 9. Additionally, in Figure 9, we added the regression lines between MTSVs and Top reported in past surveys in naturally ventilated classrooms under similar outdoor climate conditions for reference. First is Hwang et al.’s [17] survey in Taiwan on children aged 11–17, and the other is Jindal’s [25] survey on children aged 10–18 years in a residential school of Ambala, India, with humid climatic and composite climatic zones. Note that these two studies used the ASHRAE 7-point TSV scale for the questionnaire, unlike this study. Therefore, we cannot simply compare the gradients. The regression lines of [17,25] ranged from 0.17/°C to 0.35/°C (R2 from 0.18 to 0.93, 95% confidence level), which is higher than that in the current study.
The data of the present surveys show positive linear trends of MTSVs for all grades in either the summer or winter season; however, it has a large scatter and relatively small R2 values, ranging from 0.005 to 0.327. These values are smaller than those reported by Jindal (R2 = 0.18–0.36) [25]. A possible reason for this is that the respondents of the current study were younger than those in the survey of [25].
In summer, the slope of the regression line for the fifth-graders was the highest, showing more sensitivity to temperature change than the regression line slope for the students in lower grades. In contrast, in the winter period, the result of fourth-graders indicated that they were the most sensitive to temperature compared to other graders. With regard to the MTPVs, the regression lines showed negative correlations, as expected; however, the winter third-grade data resulted in a positive regression line. This result can be interpreted as the limited capability to distinguish the temperature conditions and express the preference for younger children, especially for the lowest grade.

3.4. Students’ Temperature Sensitivity by Grade

To investigate the relationship between temperature and students’ responses, receiver operating characteristic (ROC) curves were applied for responses classified by class grade. The ROC can diagnose the true positive rate against false positives attributed to TSV scales and indoor air temperature. By calculating the area under the curve (AUC) with a value ranging from 0 to 1 for each TSV scale, the students’ sensitivity could be estimated [32,33]. A higher AUC represents an increased probability of students detecting the indoor air temperature threshold [41,42,43].
Figure 10 shows the ROC of each TSV scale voted by students from each grade against indoor air temperatures during the winter and summer. For the summer data, the AUC values of all TSV levels ranged from 0.46 to 0.70. In general, a lower TSV sensitivity to the indoor air temperatures was found among the students in the fifth grade, whereas students from the third grade showed the highest sensitivity, revealing that the older group had little sensitivity to different temperature conditions between 28 °C and 35 °C. In contrast, in the winter period with room air temperatures from 12 °C to 18 °C, the AUC showed higher values than in the summer period, ranging from 0.51 to 0.70. This implies that generally, the students could determine the temperature threshold of the “cool” and “cold” sensations in the winter more clearly than the thermal sensations of “warm” and “hot” in the summer. Furthermore, the AUC of the fourth and fifth grades for TSV = −2 (cold) was higher than that for those in the youngest grade (Grade 3), which is reasonable as senior students are expected to more clearly suggest the degree of coldness in the questionnaire. Considering the strength of the vocabulary used in the questionnaire options for thermal sensation, there is some rationality in the fact that the word “cold” (TSV = −2) had the highest AUC. Nevertheless, an AUC value over 0.7 has been generally recognized as a reasonable detector [44]. Thus, the AUC values in this study were statistically insignificant in terms of the students’ ability to discriminate thermal sensation levels for different temperature conditions.
Additionally, ROC analysis was applied to the TPV scales and indoor air temperature, as shown in Figure 11. It indicated a similar tendency as TSV, where the AUC values for the two seasons ranged between 0.50 and 0.62, suggesting a poor correlation with children’s thermal preference sensitivity to temperature levels. The highest sensitivity was found among fifth-graders in the winter period with TPV = 2 “much cooler”. Note that the majority (100% in winter and 94% in summer) of the samples in this survey were collected under conditions outside an 80% thermally acceptable comfort range, as determined by ASHRAE 55. Such temperature conditions may have made it challenging for children to detect differences in the degree of cold or hot, depending on the indoor temperature. Nevertheless, similar tendencies were observed in previous studies for both winter [45] and summer [37,38]. Therefore, the relatively low AUC values might also be related to both the immature thermal regulation function of children and the reduced ability to differentiate subtle differences in words expressing different degrees of hot and cold sensations compared to adults [39,40]. Moreover, according to Yun et al., children are more sensitive to changes in their metabolism than adults as well as their preferred physical environments, e.g., temperature [22]. If this is true, it would be necessary to consider the implications of the results of a general analysis method for estimating a comfortable temperature based on TSVs when targeting children, especially in summer.

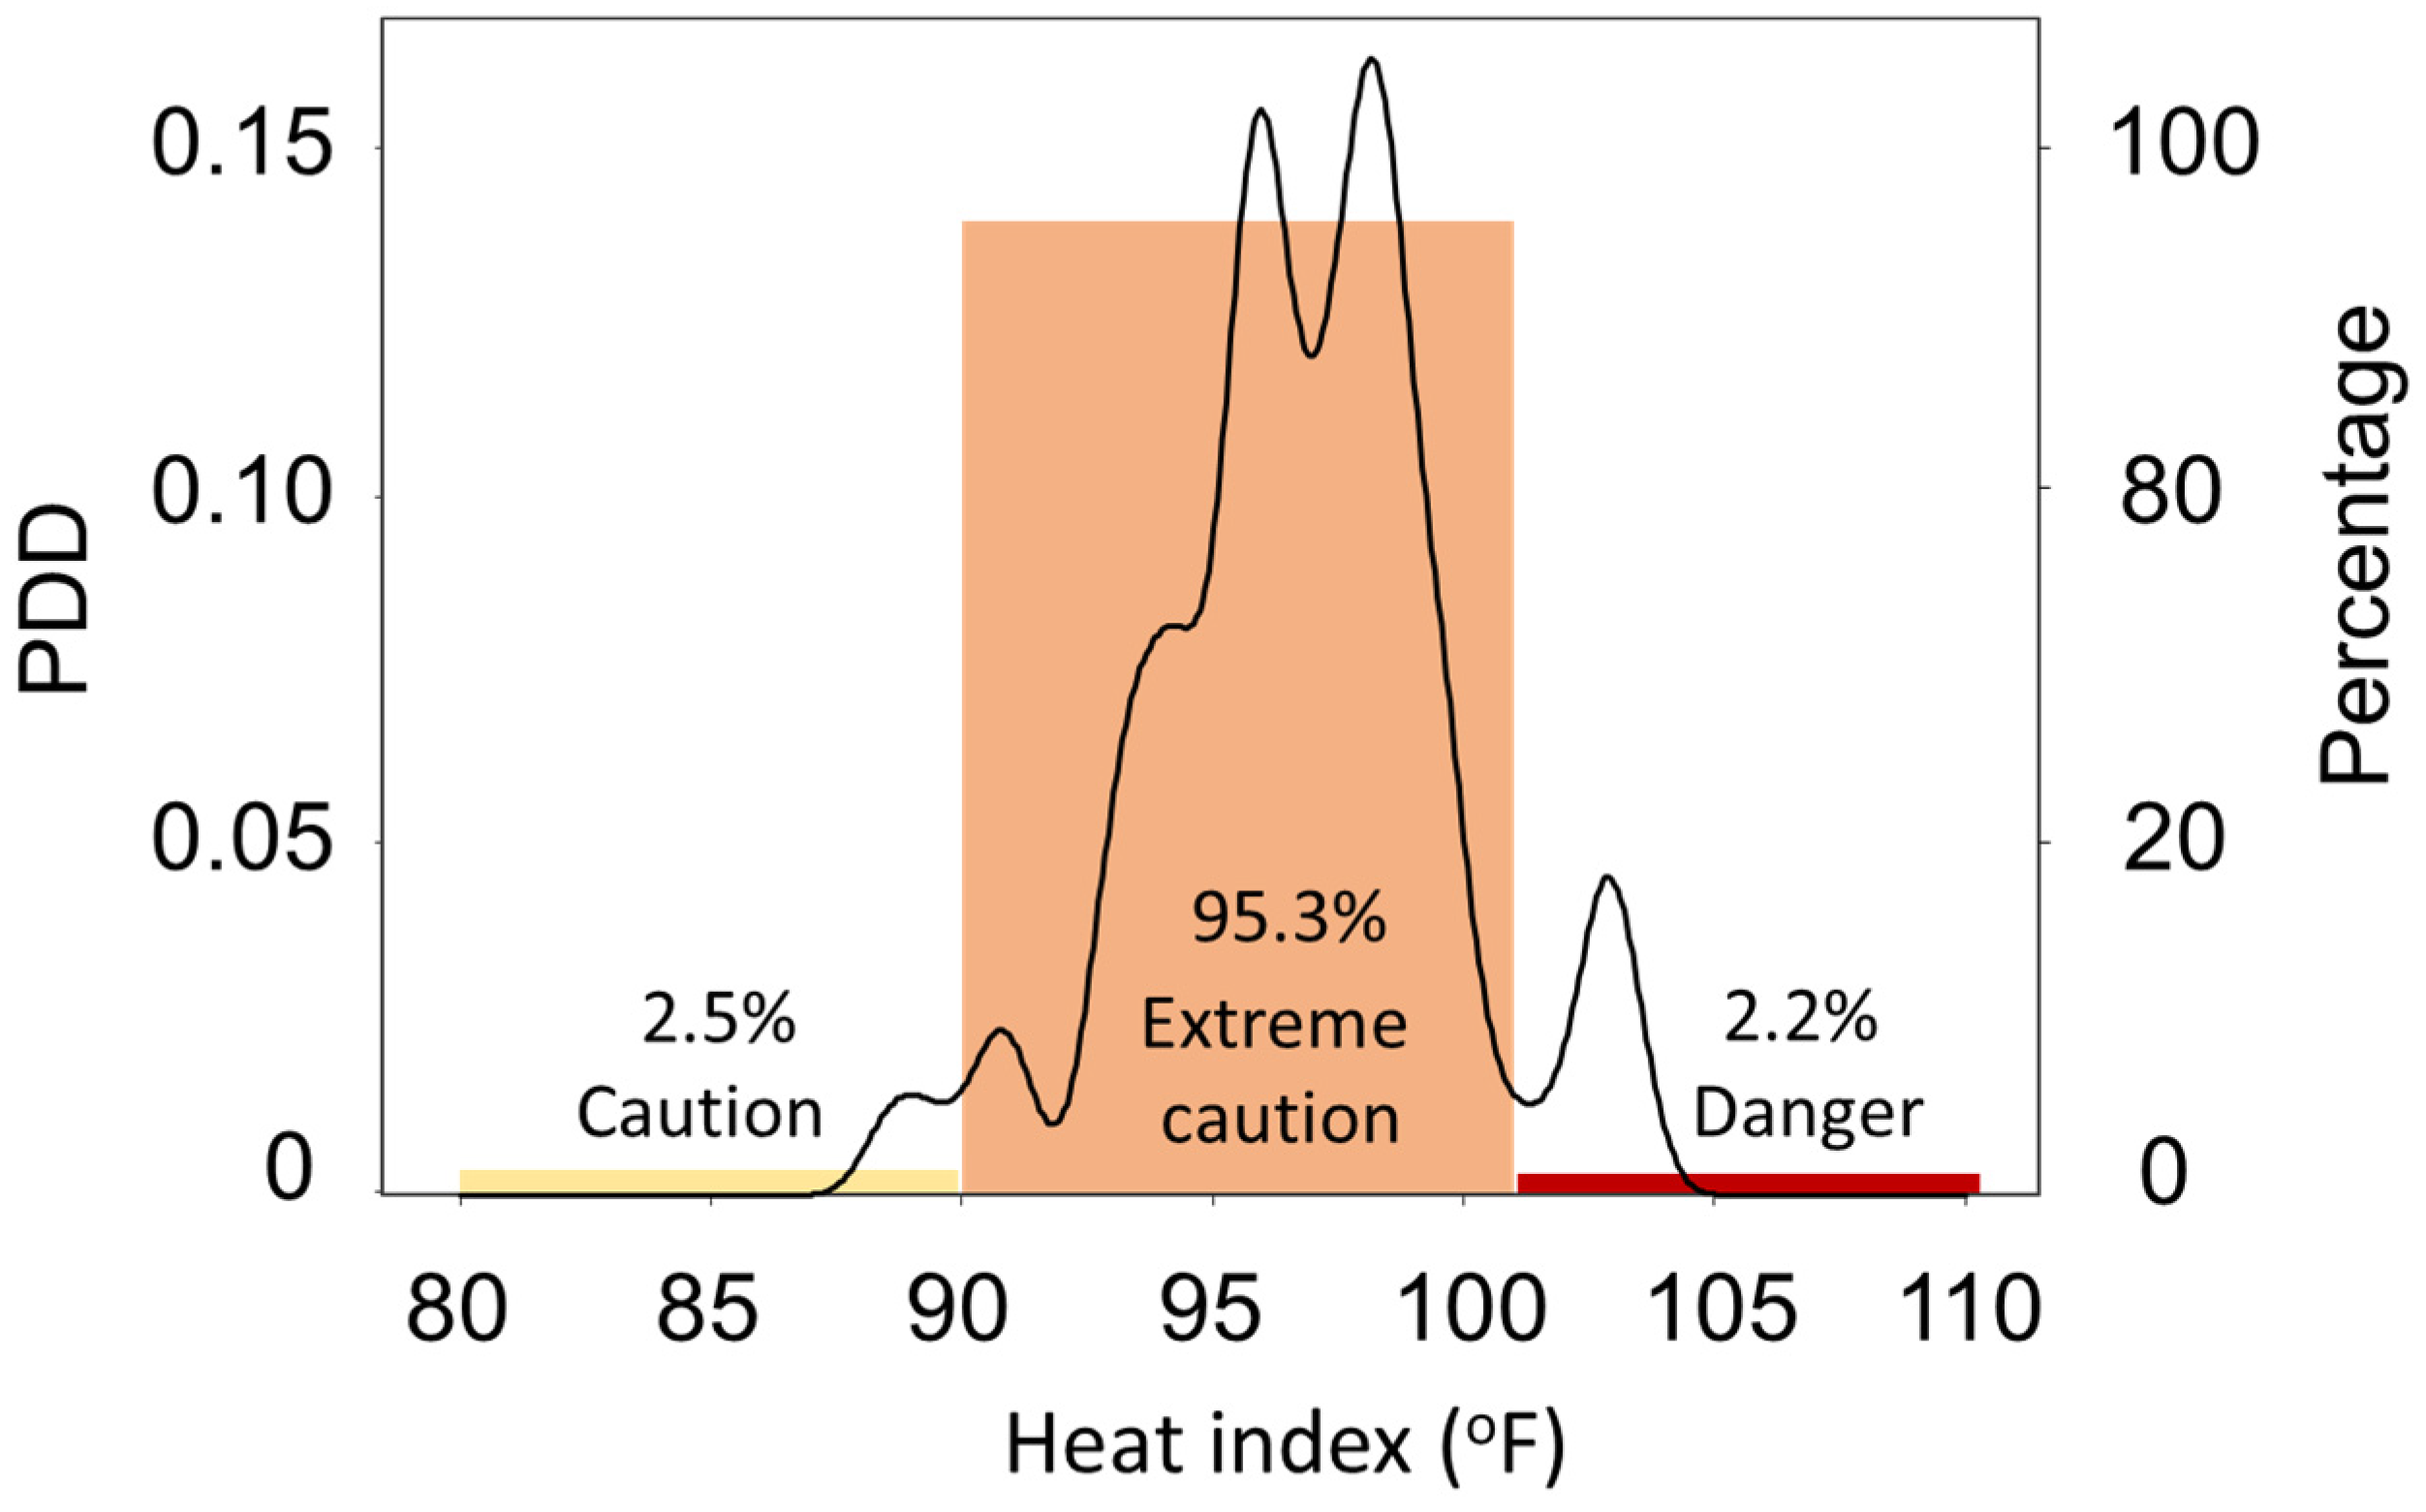
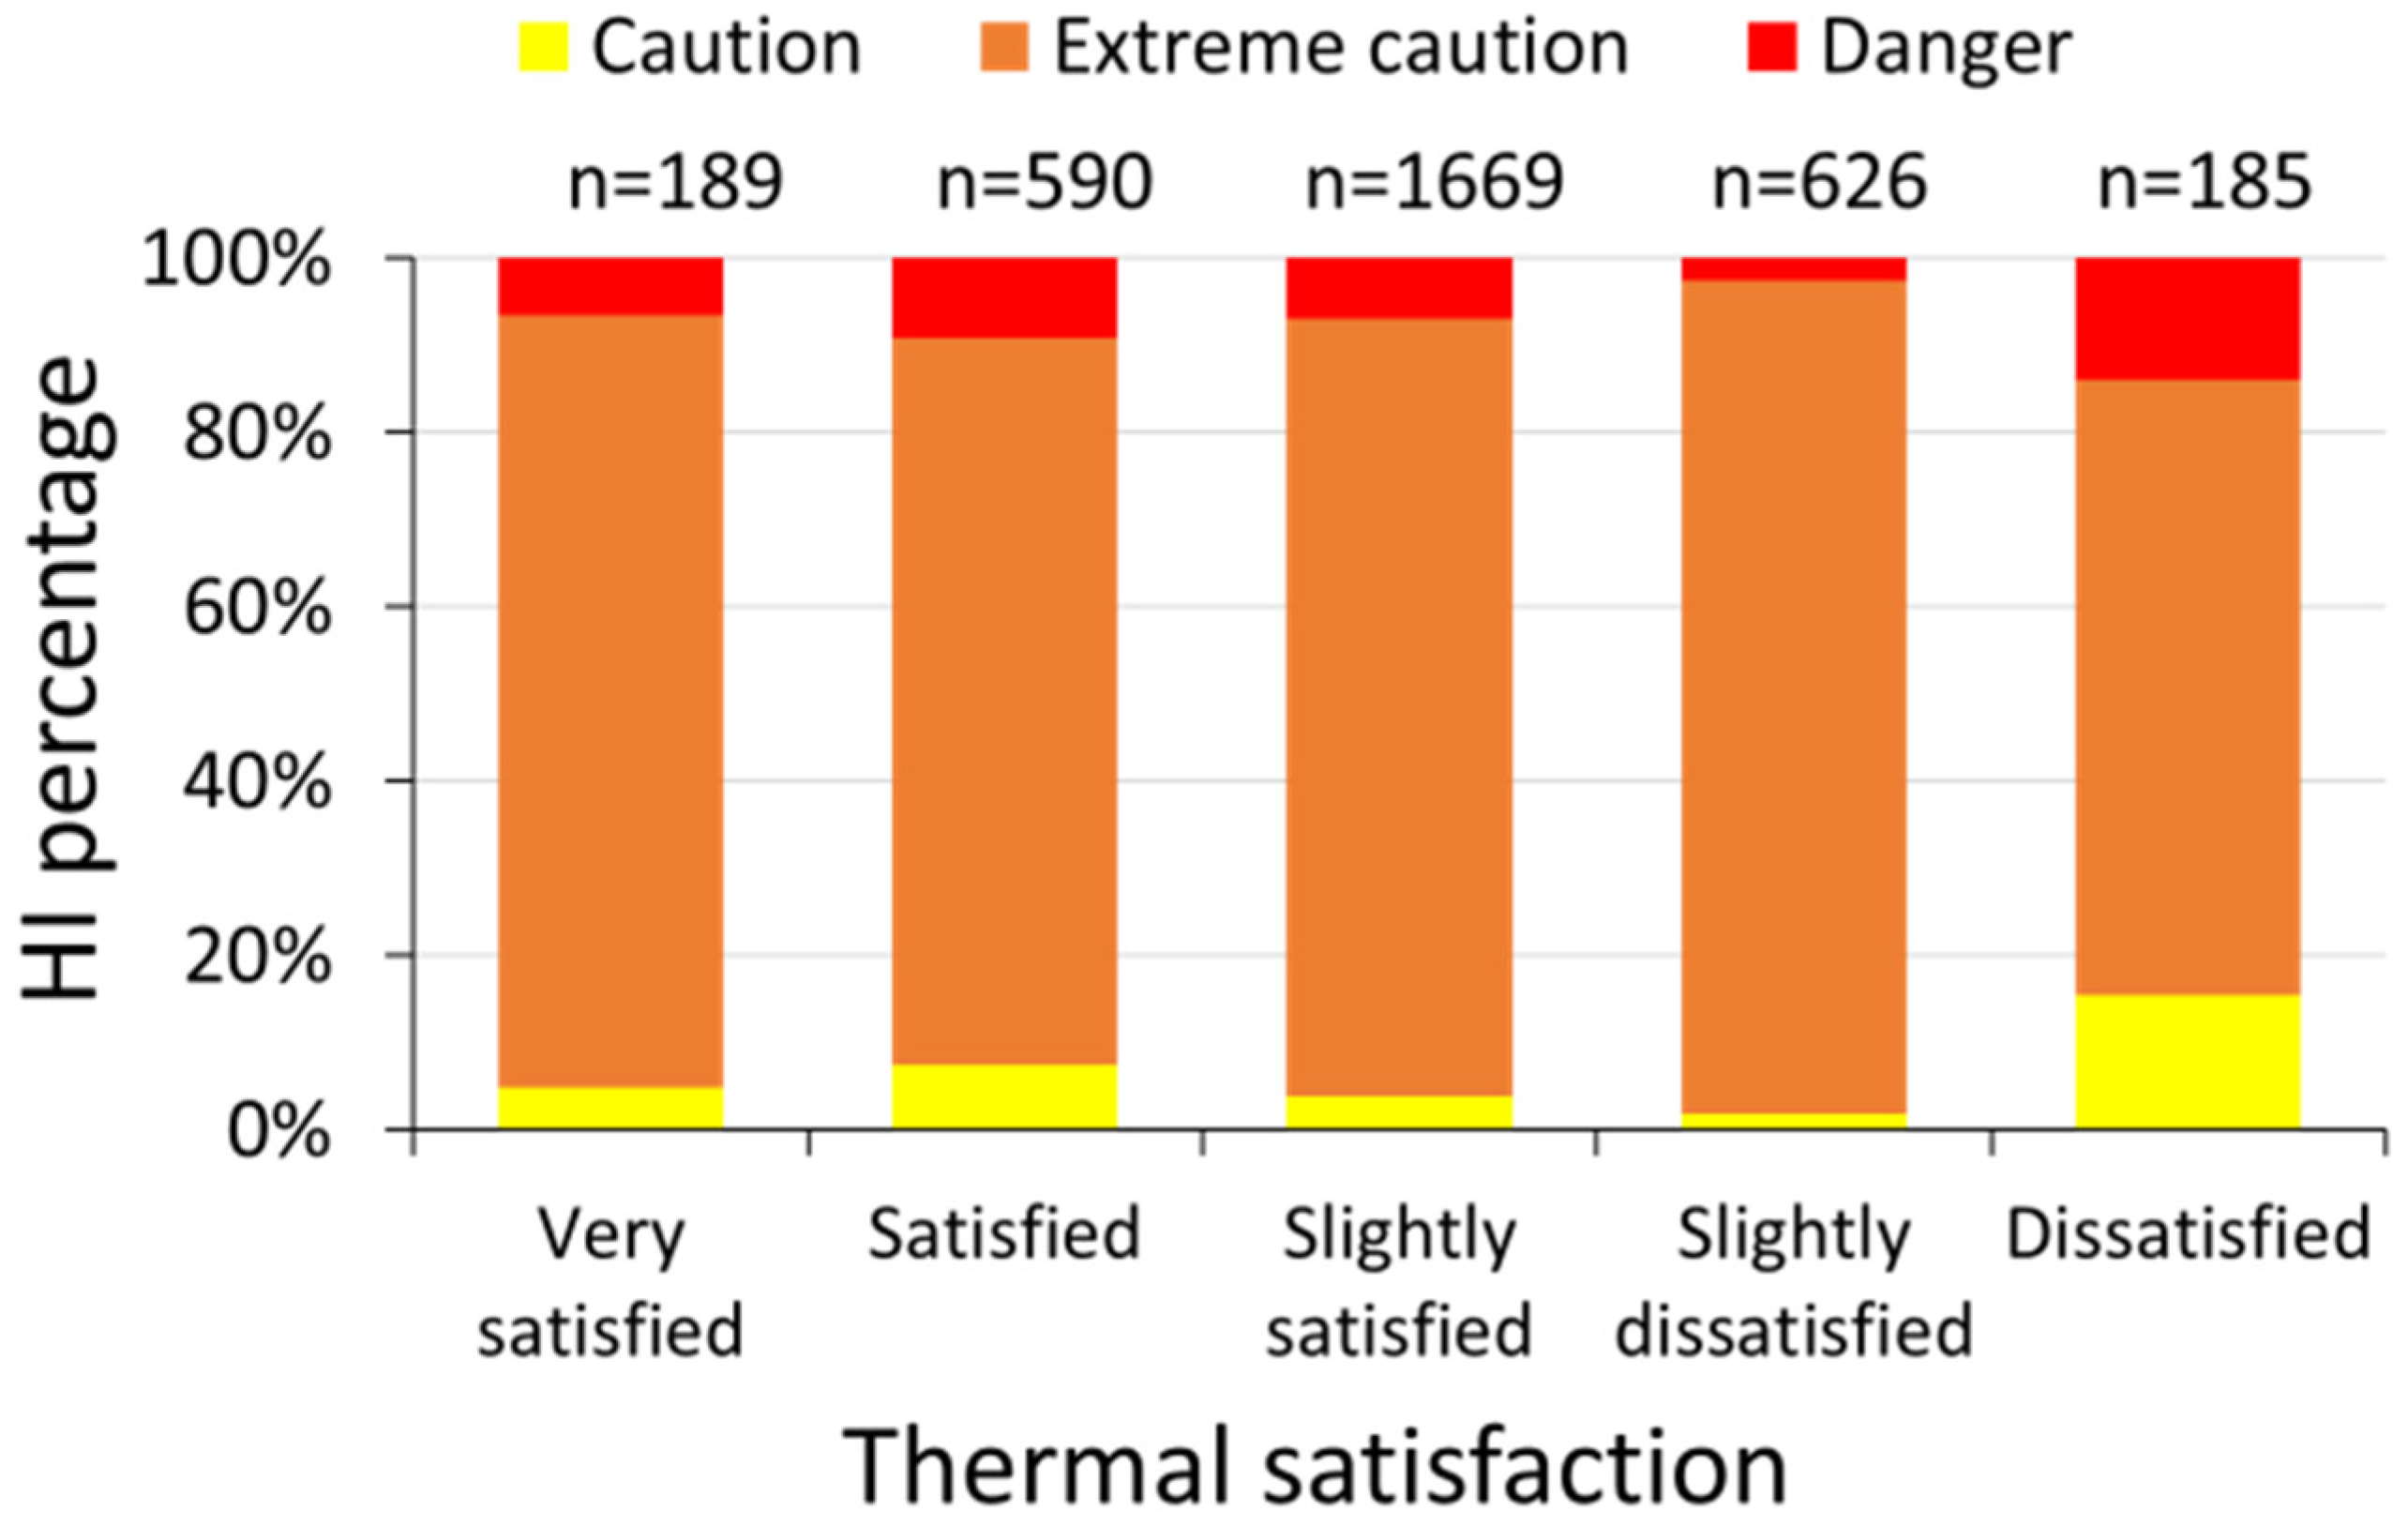
3.5. Students’ Thermal Satisfaction and Summer Heat Risk

In addition to the TSVs and TPVs, questions about students’ thermal satisfaction in their classrooms were also asked using five options: very satisfied, satisfied, slightly satisfied, slightly dissatisfied, and dissatisfied. Figure 12 shows the fraction of thermal satisfaction levels for each respondent group divided by the TSV response based on both summer and winter data. As can be seen from the figure, the fraction of satisfaction votes including “slightly satisfied”, “satisfied”, and “very satisfied” were the majority for all TSV scales. The highest percentage of satisfaction was for TSV = 0 (neutral) with 97.5% in the winter; this percentage comprised 24.3% of students voting “very satisfied”, 56.5% voting “satisfied”, and 16.7% voting “slightly satisfied”. A similar trend was observed in summer, with 75.1% of students voting “neutral” and being satisfied with the indoor thermal condition. In contrast, for TSV = +3 (very hot), 68.1% of the students surprisingly reported thermal satisfaction. In other words, although the indoor temperature conditions were outside the thermal comfort range, the majority of children answered that they were satisfied with the thermal conditions.
The breakdown of votes for thermal satisfaction collected in summer for the heat risk level determined by HI is shown in Figure 13. In total, 95.1% of the responses “very satisfied”, “satisfied”, or “slightly satisfied” were collected under the condition of “extreme caution” or “danger” in terms of heat risk. In light of the fact that the temperatures in the classrooms in the summer survey were high enough to increase the risk of heat stroke, the children’s report of being thermally satisfied should not be interpreted literally [46,47]. It is possible that many of the children were attached to their classroom as a whole (teachers, school friends, etc.); therefore, they were less likely to rate it negatively, even when the question was limited to their satisfaction with the thermal condition.

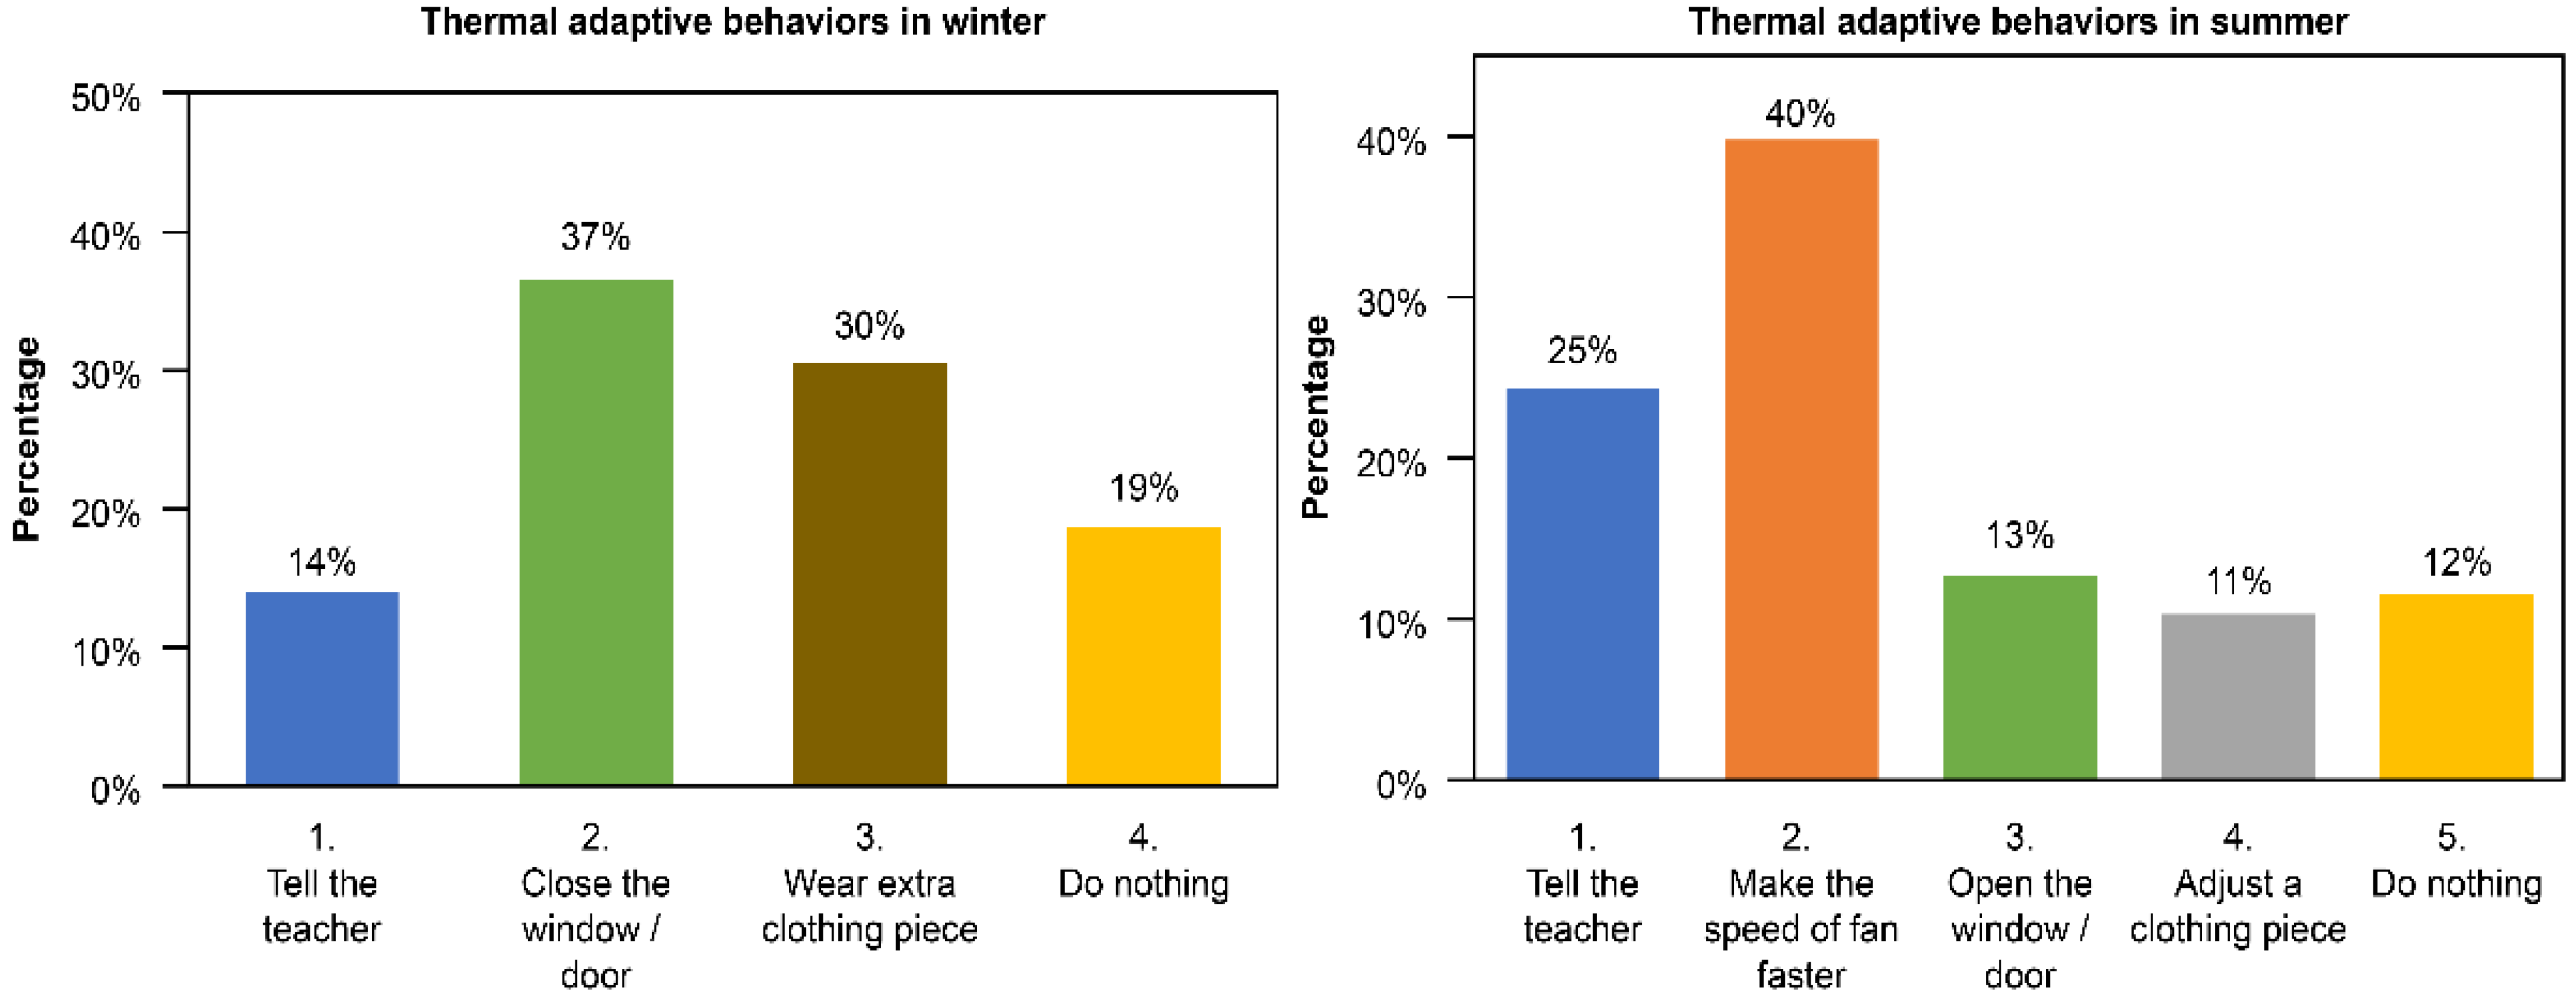
3.6. Students’ Thermal Adaptive Behaviors

To analyze students’ adaptive behaviors during the winter and summer seasons, we investigated clothing insulation adjustment because it seems to be the most convenient and effective personal thermal adaptation method [17,48,49] in school buildings without air-conditioning systems. Questions related to behavioral changes in the existing environment were also included. Figure 14 depicts a histogram of the students’ clothing insulation levels during the winter and summer periods. The ensembled clothing insulation worn by the students was estimated from the questionnaire as a clo value based on the ASHRAE standard 55 [38]. During the winter and summer survey periods, the estimated clo values ranged from 1.02 to 1.77 and 0.33 to 0.63 in the winter and summer survey periods, respectively. As can be seen from the graphs, during winter, the clo values of each student were more diverse than those during the summer season. Even though all schools had a formal regular uniform, such as blazers, shirts, ties, and pants, minor adjustments of clothing were found to be more dominant in the winter. For instance, we found that some students wore extra woolen caps or extra layers of warmers inside and stockings for females. This implies that clothing adjustment by wearing thicker garments is common for students to combat cold indoor air temperatures in classrooms.
Furthermore, Figure 15 shows students’ thermal adaptation in the context of behavioral changes inside the classroom. Since all the classrooms were naturally ventilated, the students had limited options to adjust and modify their behaviors during classes to achieve thermal comfort, such as telling the teachers that they felt cold or hot, opening or closing the windows, adjusting clothing ensembles, and making the speed of the fan faster (only in summer). In the winter survey period, 37% of the students requested closing the doors or windows, 30% wore an extra layer of clothing, and 14% reported that they felt cold. In contrast, in the summer season, 40% of students preferred increasing the speed of the fans, 25% informed the teacher of their discomfort due to the heat, and 13% and 11% opened windows for more ventilation and adjusted their clothes by loosening buttons or ties, respectively. Nonetheless, it may be noted that closing or opening windows may not only be linked to effective cross ventilation and cooling in summer and rejecting the cold air from outdoors in the winter, but also to preventing rainwater ingress and incorporating daylight into the learning spaces. Another possible reason could also be to filter out the acoustic interference caused by traffic noise from adjacent roads or noise from nearby playgrounds and sports activities.

4. Conclusions

This study reported the results of questionnaire surveys and indoor thermal measurements from 12 primary school buildings located in Dehradun City, Uttarakhand, India, during the summer and winter of 2019. The survey questions included students’ thermal sensations, thermal preferences, thermal satisfaction, and adaptive behavior in classrooms. The findings of this study are as follows:
  • According to ASHRAE 55, the indoor thermal conditions of the surveyed classrooms were outside of the comfort range during the winter survey for an 80% acceptability limit, whereas only 6% of the samples were collected under an 80% thermal acceptability range in the summer. Furthermore, 95.1% of the samples in the summer survey were under the condition of an HI over 91 °F, indicating a heat risk level of either “extreme caution” or “danger”.
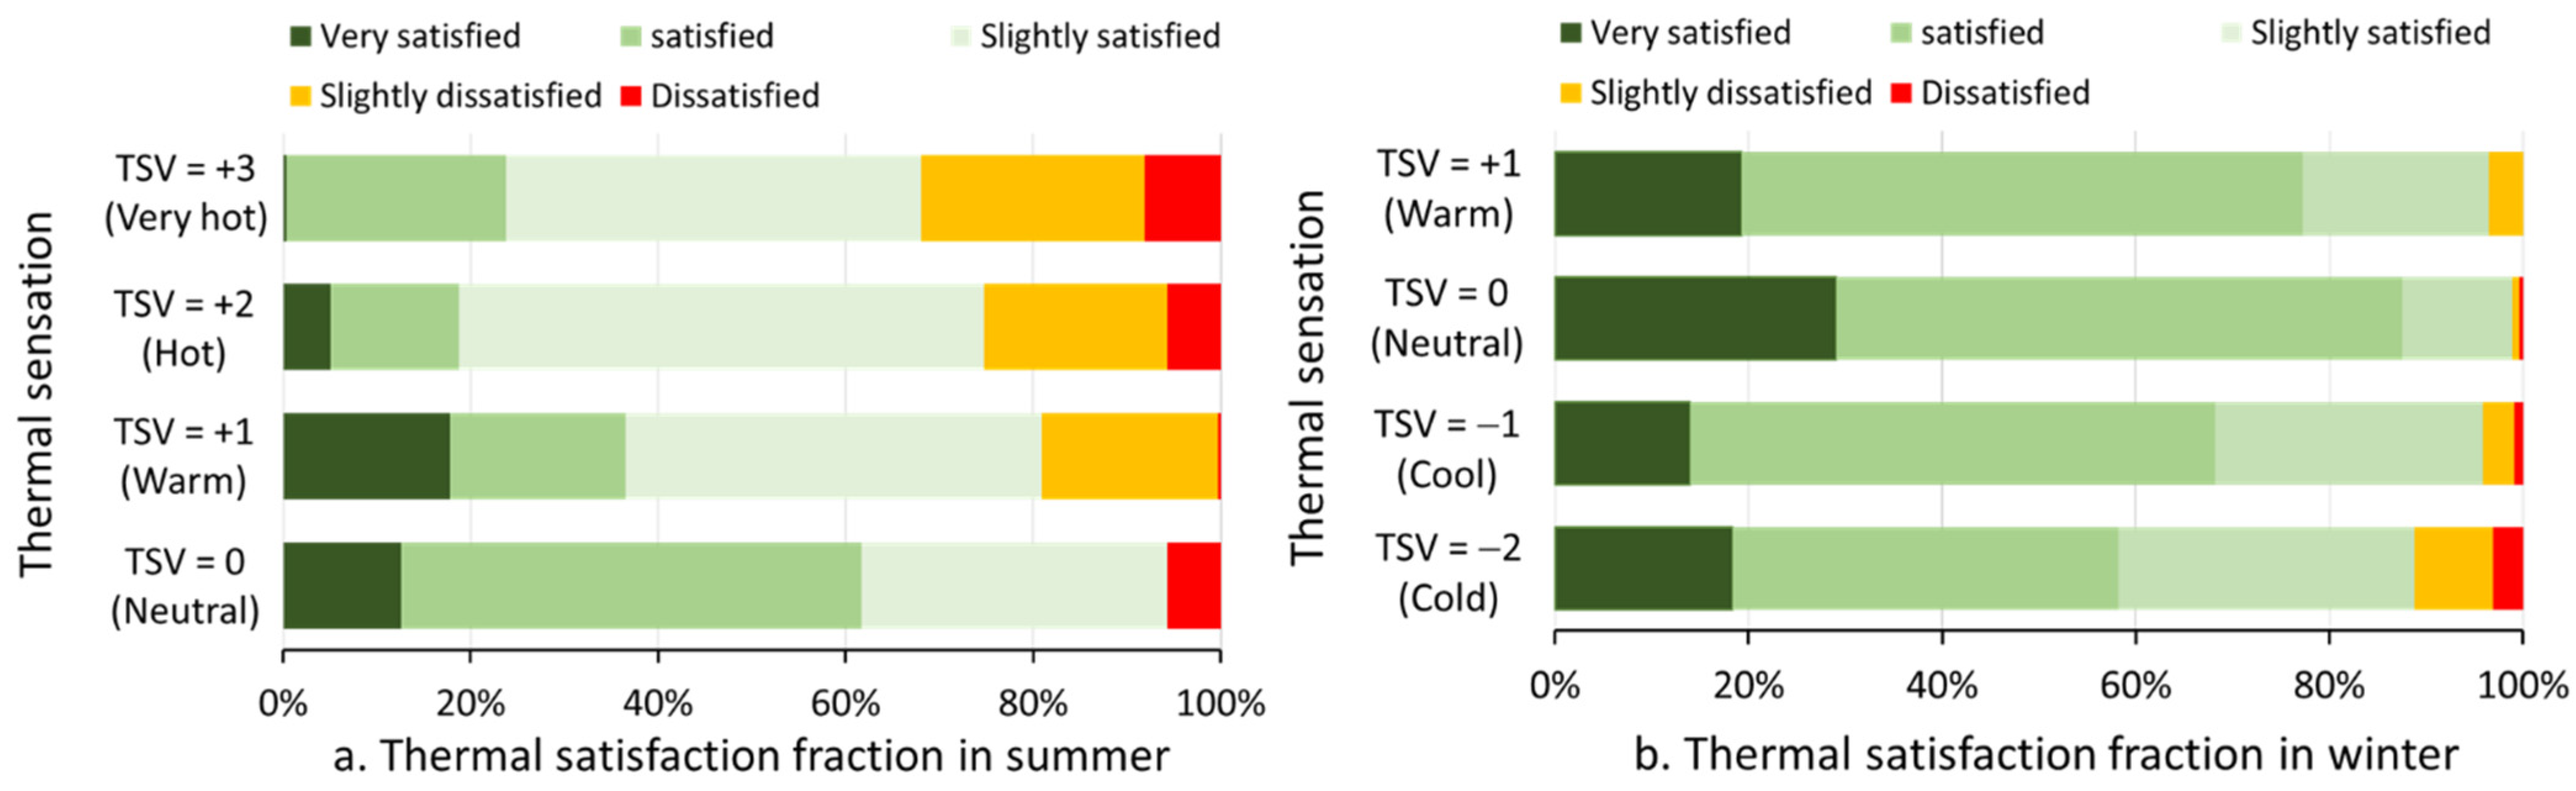
  • The votes on thermal satisfaction indicated that “slightly satisfied”, “satisfied”, and “very satisfied” made up the majority for all of the TSV scales for both summer and winter. The highest satisfaction was for TSV = 0 (neutral), with 97.5% and 75.2% satisfaction in winter and summer, respectively.
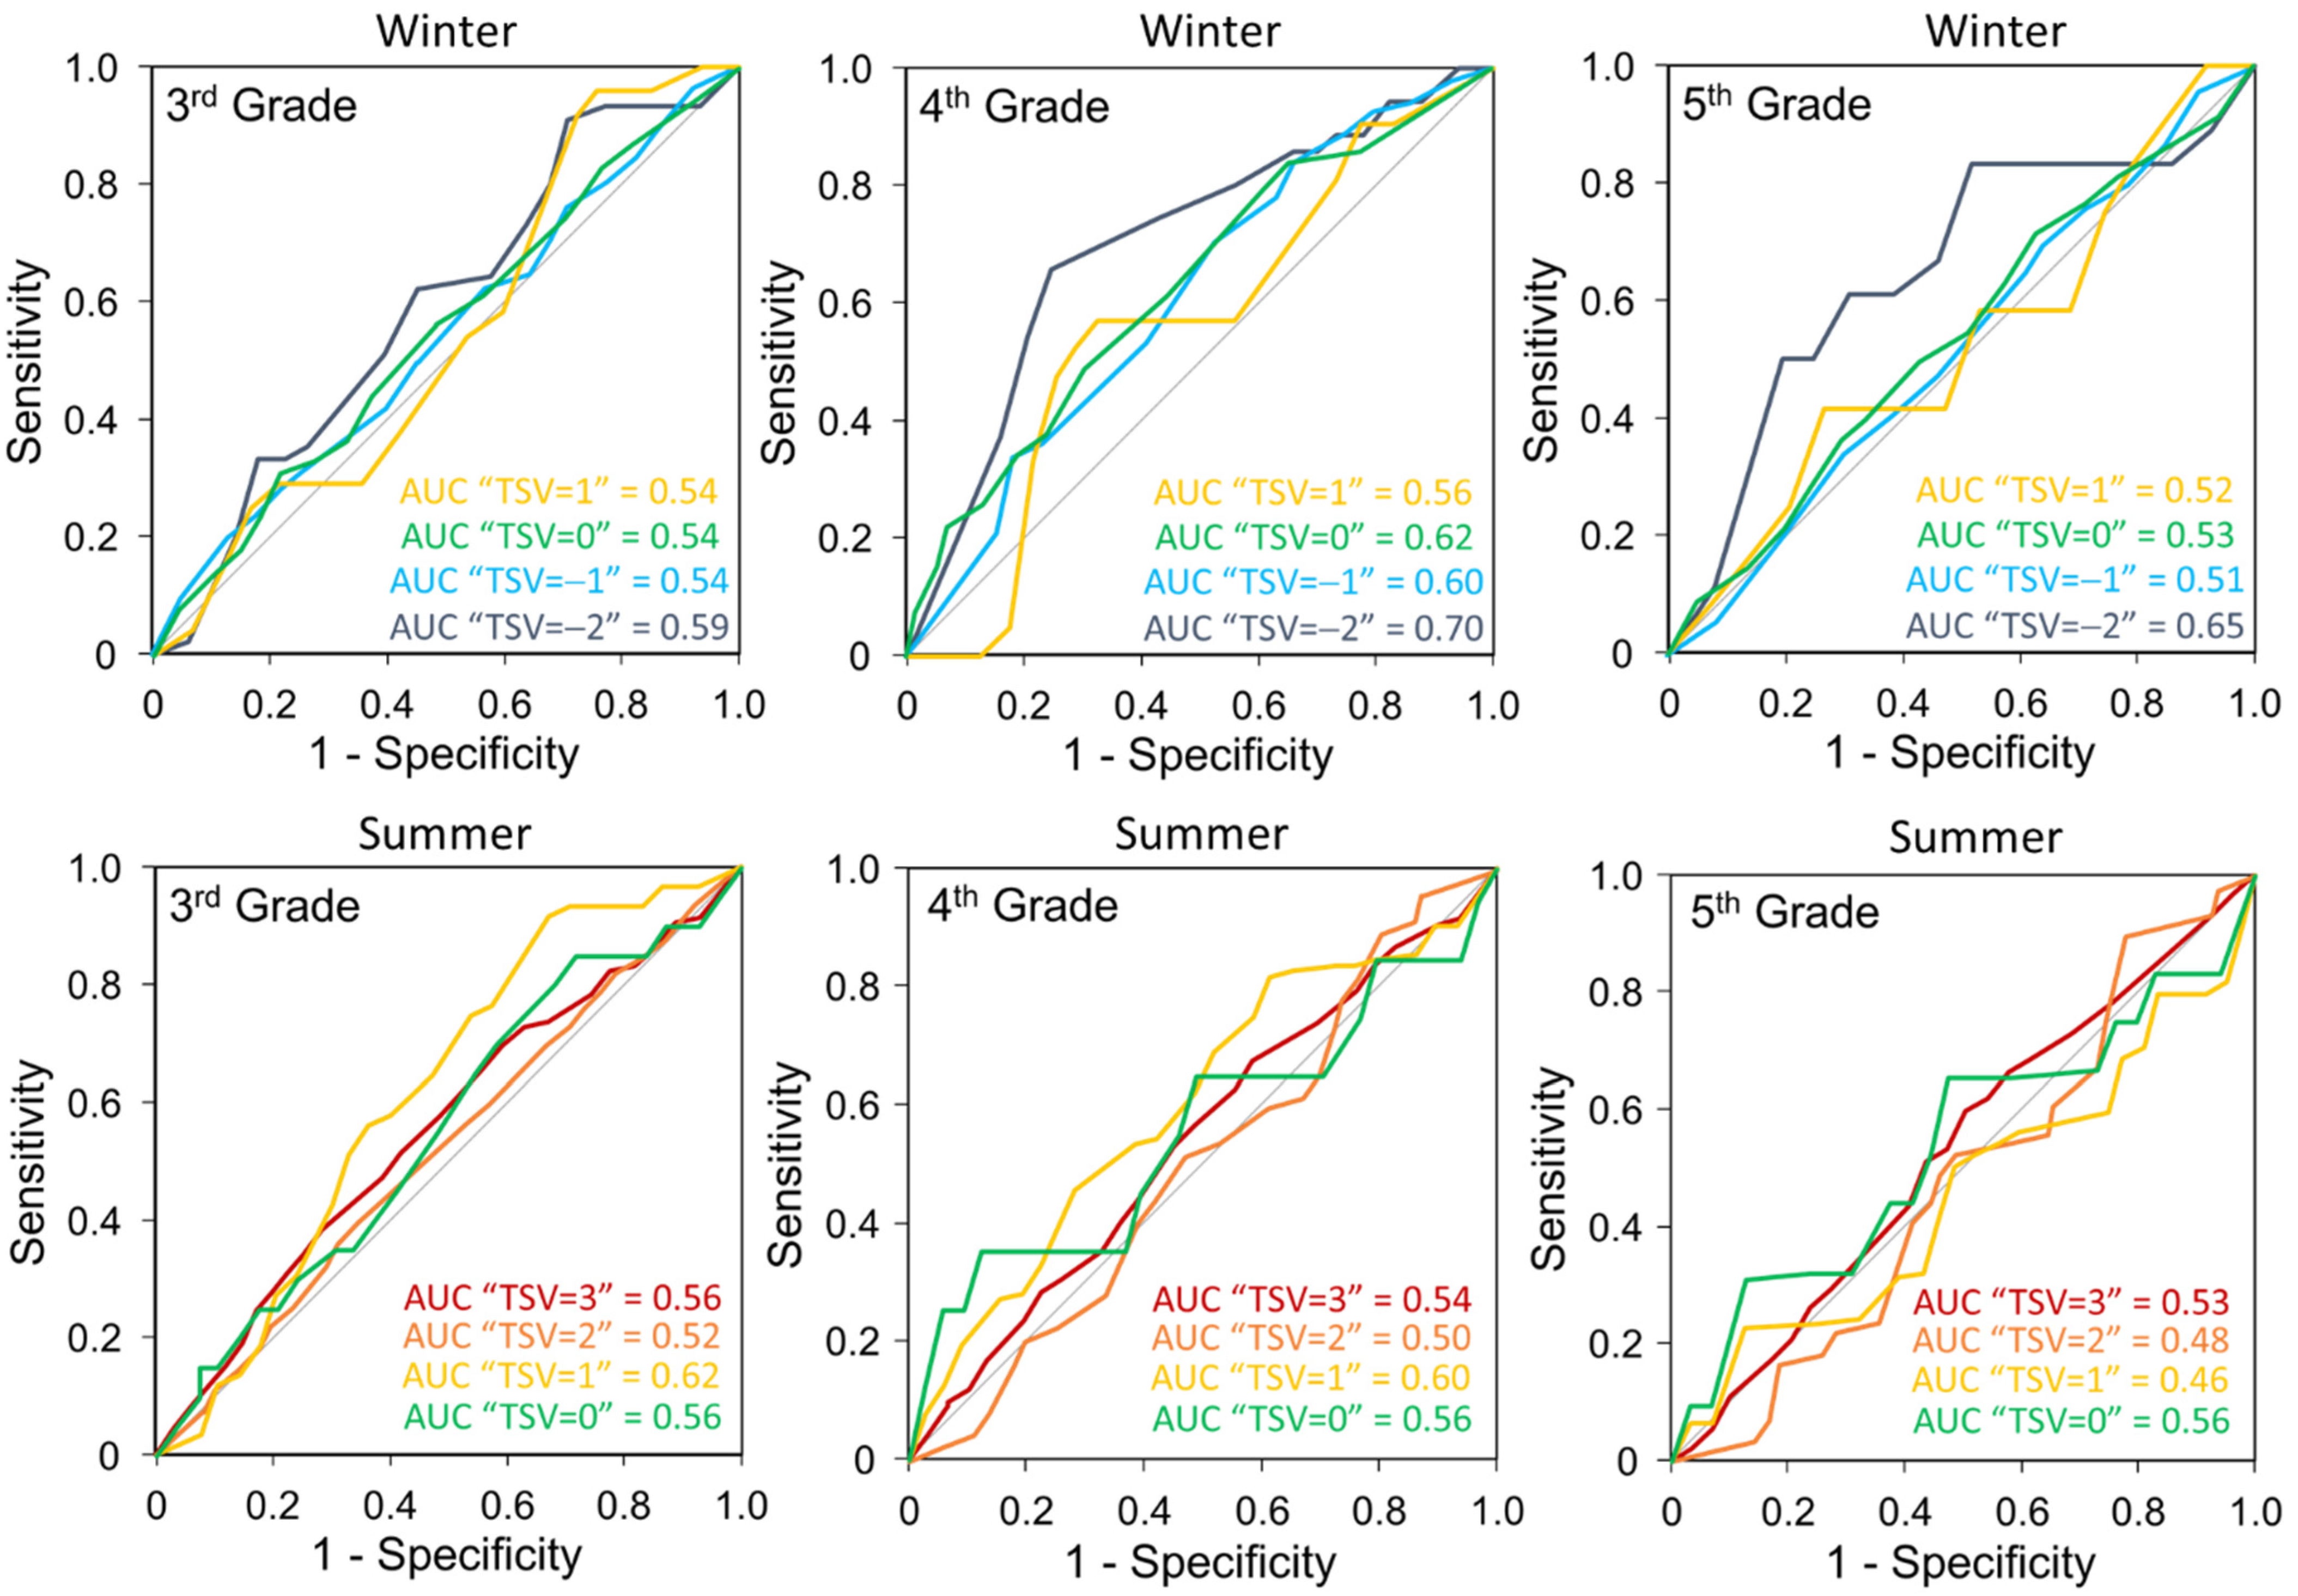
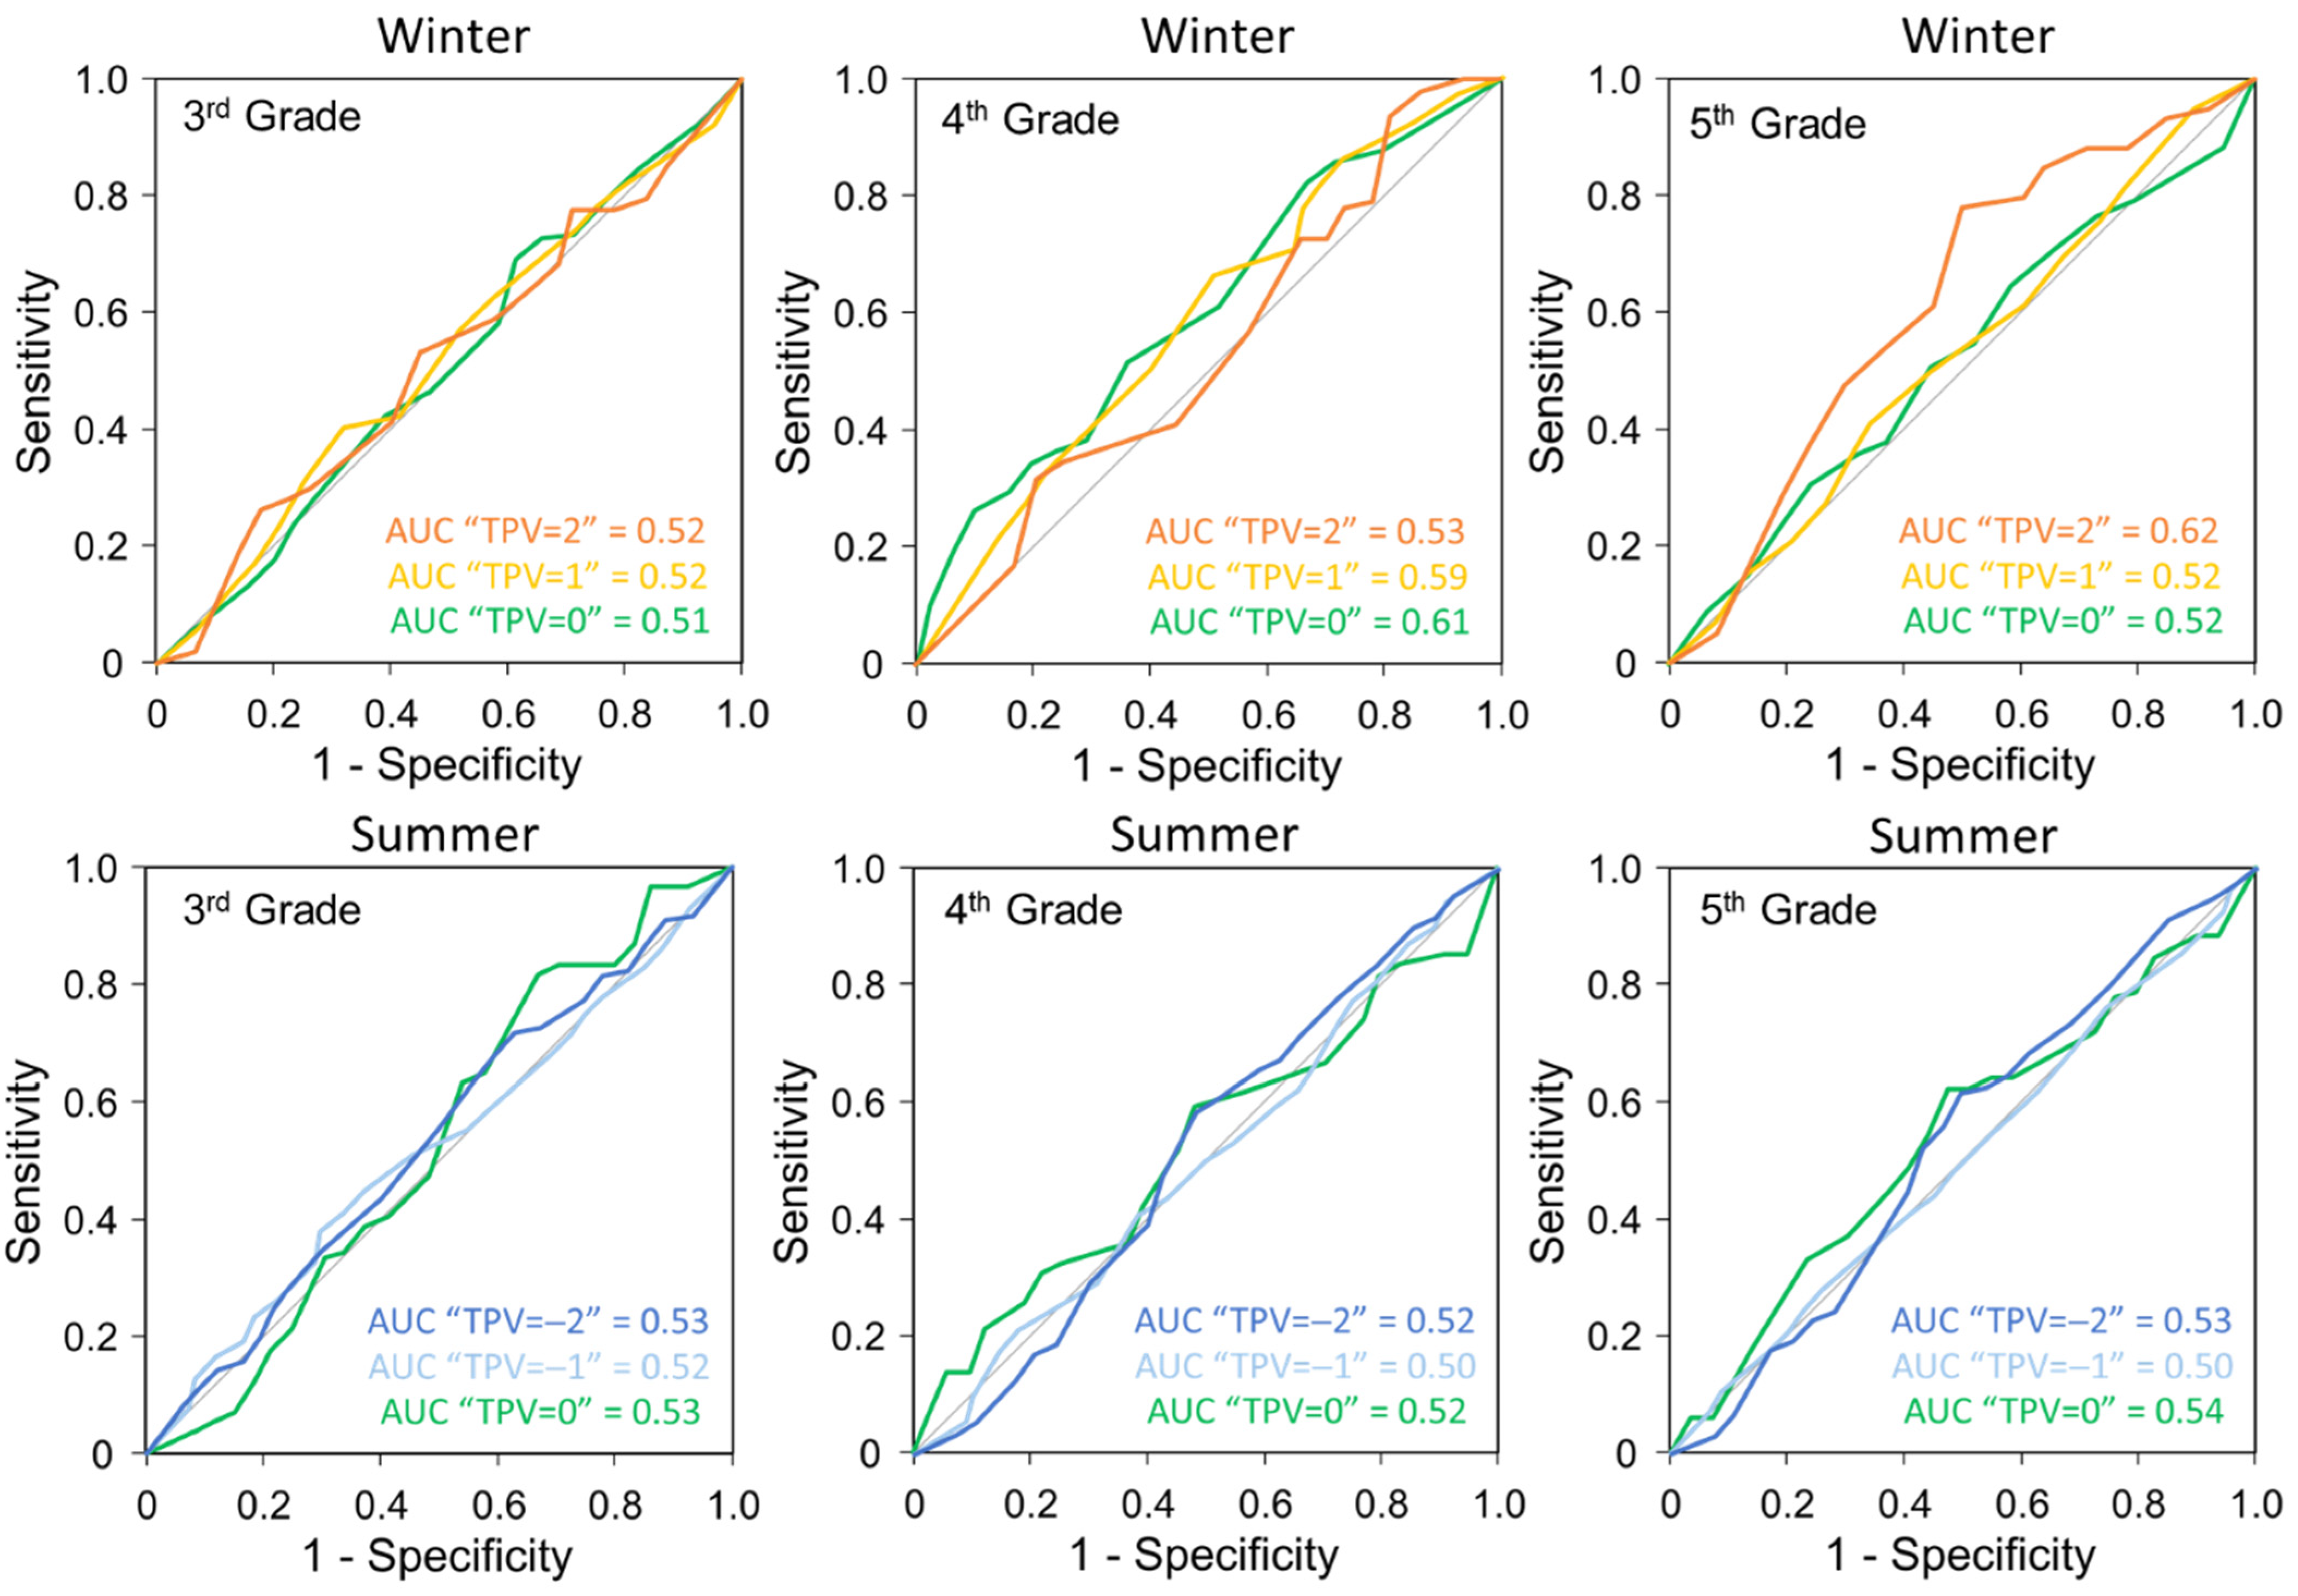
  • The fraction of each TSV and TPV level for the binned indoor air temperature range did not indicate a monotonic relationship between the TSV/TPV and air temperature. The results of the ROC analysis also showed relatively low AUC values, suggesting that some students could not differentiate between the degree of hot and cold under different temperature conditions, especially during the summer season. Nevertheless, the regression line plotted between air temperature and mean values of TSV for each class suggests a clear positive correlation, with the gradients varying from 0.030/°C to 0.114/°C attributed to different students’ school grades.
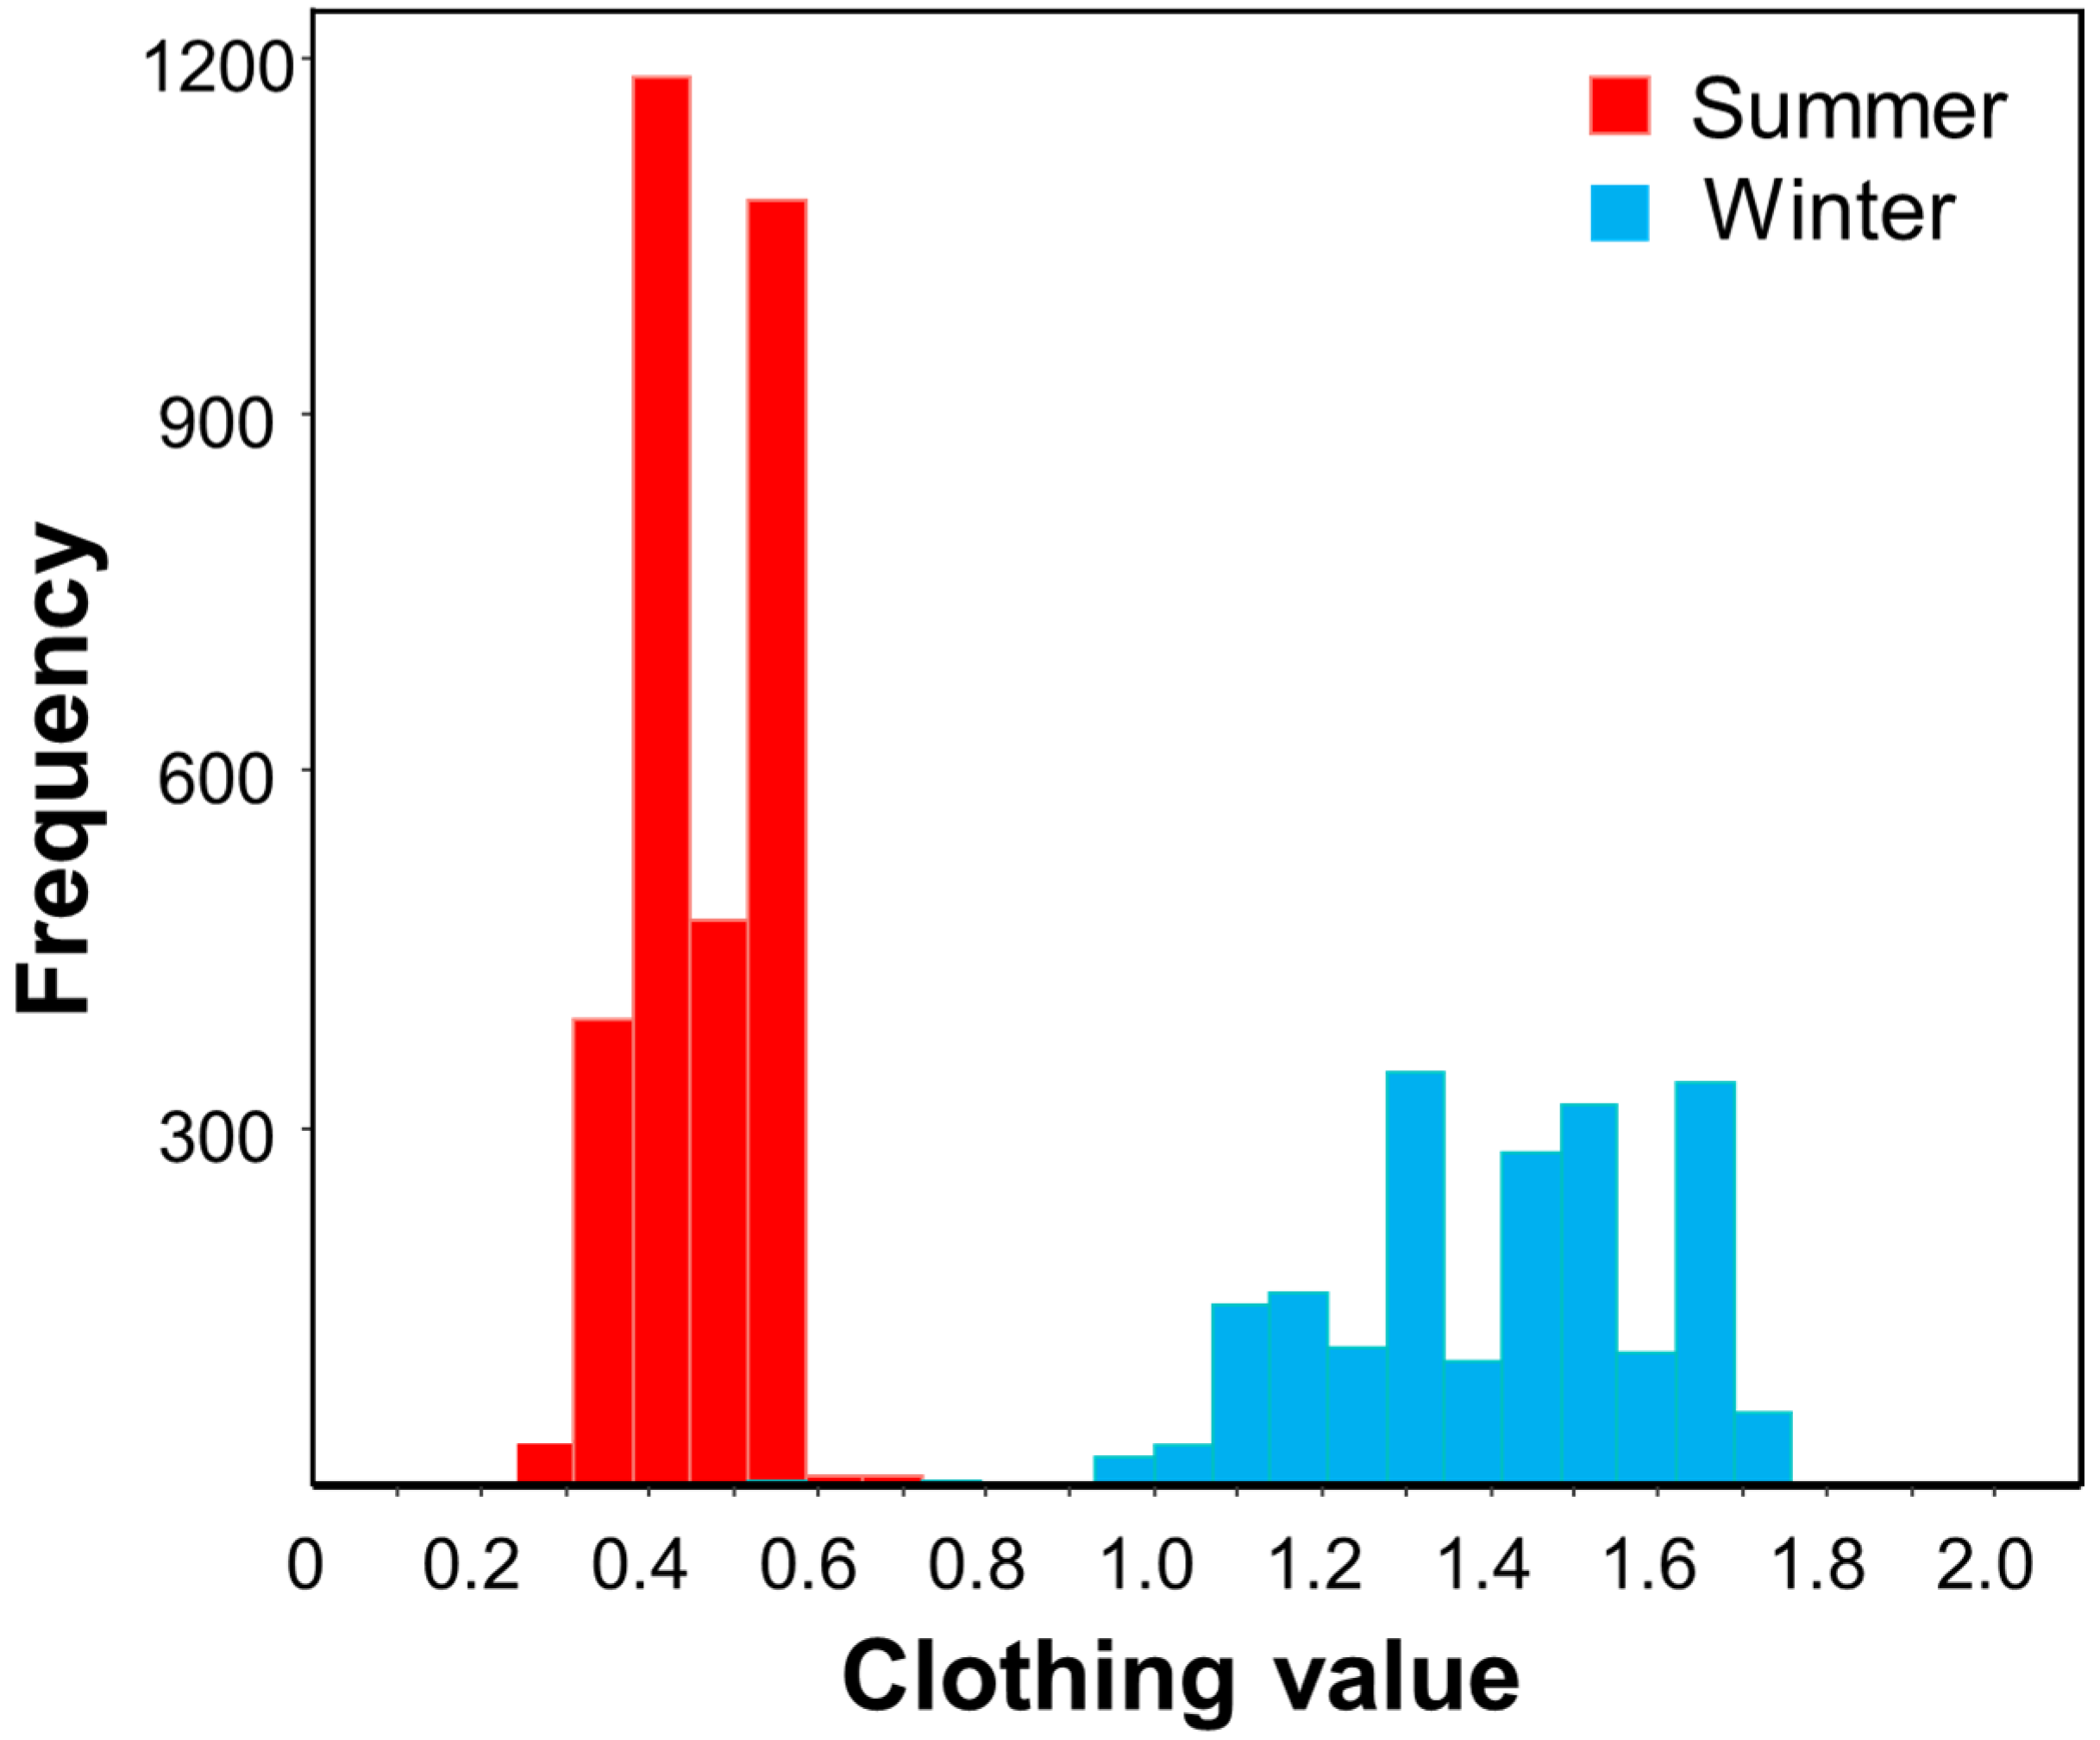
  • In terms of thermal adaptive behaviors, closing the windows and wearing extra, thicker garments with a clo value ranging from 1.02 to 1.77 were popular methods for the students to mitigate the cold indoor air temperature in the classrooms. In contrast, 40% of students preferred to increase the speed of fans to achieve thermal comfort during the summer season.
These findings clearly suggest that children’s reports of thermal sensations and thermal satisfaction do not correspond to the actual physical environment. Moreover, it should be emphasized that many of the children reported that they were satisfied with the thermal environment, even in a severely high-temperature environment. This fact draws attention to the adequacy of applying widely used methods of TSV-based identification of thermal comfort in classrooms for children aged 6–13 years. Nevertheless, we must point out the limitations of this study that exclude the socio-economic and habitual factors as the background condition that might affect the children’s thermal perception and satisfaction in this study. In the future, the present study is expected to fundamentally support the National Education Policy (NEP) 2020 of the Indian government in terms of establishing continual learning and quality education. Furthermore, future studies to identify the effectiveness of thermal adaptation behaviors as affordable measures and how the physiological heat-related health risks impact the quality of learning or education outcomes of students are needed.

Author Contributions

Conceptualization, B.L. and A.H.; methodology, B.L. and S.M.; investigation, B.L.; data curation, B.L.; formal analysis, B.L. and S.M.; writing—original draft preparation, B.L.; visualization, S.M.; writing—review and editing, S.M. and A.H.; supervision, A.H.; funding acquisition, A.H. All authors have read and agreed to the published version of the manuscript.

Funding

This work was supported by Sasakawa Scientific Research Grant from the Japan Science Society and the Ministry of Education, Culture, Sports, Science, and Technology (MEXT) KAKENHI Grant Number JP22H01652.

Institutional Review Board Statement

Ethical review and approval were waived for this study, due to the committee confirmed that: (1) the questionnaire is completely anonymous; (2) no interventions are included throughout the survey; (3) the questionnaire is left to the will of the respondents, and (4) all questions included in the survey do not include anything beyond what they experience in their social lives or their daily conversations.

Informed Consent Statement

Informed consent was obtained from all subjects involved in the study.

Data Availability Statement

Not applicable.

Conflicts of Interest

The authors declare no conflict of interest.

References

  1. Xu, Z.; Sheffield, P.E.; Su, H.; Wang, X.; Bi, Y.; Tong, S. The impact of heat waves on children’s health: A systematic review. Int. J. Biometeorol. 2014, 58, 239–247. [Google Scholar] [CrossRef] [PubMed]
  2. Qi, J.; Ding, L.; Lim, S. Toward cool cities and communities: A sensitivity analysis method to identify the key planning and design variables for urban heat mitigation techniques. Sustain. Cities Soc. 2021, 75, 103377. [Google Scholar] [CrossRef]
  3. Murtyas, S.; Kusumaningdyah, N.H.; Toosty, N.T.; Hagishima, A. Relation between occupants’ health problems, demographic and indoor environment subjective evaluations: A cross-sectional questionnaire survey study in Java Island, Indonesia. PLoS ONE 2021, 16, e0254460. [Google Scholar] [CrossRef] [PubMed]
  4. De Giuli, V.; Da Pos, O.; De Carli, M. Indoor environmental quality and pupil perception in Italian primary schools. Build. Environ. 2012, 56, 335–345. [Google Scholar] [CrossRef]
  5. Bernardi, N.; Kowaltowski, D.C.C.K. Environmental comfort in school buildings: A case study of awareness and participation of users. Environ. Behav. 2006, 38, 155–172. [Google Scholar] [CrossRef]
  6. Ter Mors, S.; Hensen, J.L.M.; Loomans, M.G.L.C.; Boerstra, A.C. Adaptive thermal comfort in primary school classrooms: Creating and validating PMV-based comfort charts. Build. Environ. 2011, 46, 2454–2461. [Google Scholar] [CrossRef] [Green Version]
  7. Wargocki, P.; Wyon, D.P. The effects of moderately raised classroom temperatures and classroom ventilation rate on the performance of schoolwork by children (RP-1257). HVAC R Res. 2007, 13, 193–220. [Google Scholar] [CrossRef]
  8. Zomorodian, Z.S.; Tahsildoost, M.; Hafezi, M. Thermal comfort in educational buildings: A review article. Renew. Sustain. Energy Rev. 2016, 59, 895–906. [Google Scholar] [CrossRef]
  9. Anderson, J.; Lightfoot, A. The School Education System in India; British Council: New Delhi, India, 2019. [Google Scholar]
  10. Van Oldenborgh, G.J.; Philip, S.; Kew, S.; Van Weele, M.; Uhe, P.; Otto, F.; Singh, R.; Pai, I.; Cullen, H.; Achutarao, K. Extreme heat in India and anthropogenic climate change. Nat. Hazards Earth Syst. Sci. 2018, 18, 365–381. [Google Scholar] [CrossRef] [Green Version]
  11. Azhar, G.S.; Mavalankar, D.; Nori-Sarma, A.; Rajiva, A.; Dutta, P.; Jaiswal, A.; Sheffield, P.; Knowlton, K.; Hess, J.J. Heat-related mortality in India: Excess all-cause mortality associated with the 2010 Ahmedabad heat wave. PLoS ONE 2014, 9, e109457. [Google Scholar] [CrossRef]
  12. Rodríguez, C.M.; Coronado, M.C.; Medina, J.M. Thermal comfort in educational buildings: The Classroom-Comfort-Data method applied to schools in Bogotá, Colombia. Build. Environ. 2021, 194, 107682. [Google Scholar] [CrossRef]
  13. Malik, P.; Bhardwaj, P.; Singh, O. Distribution of cold wave mortalities over India: 1978–2014. Int. J. Disaster Risk Reduct. 2020, 51, 101841. [Google Scholar] [CrossRef]
  14. Xu, Z.; Etzel, R.A.; Su, H.; Huang, C.; Guo, Y.; Tong, S. Impact of ambient temperature on children’s health: A systematic review. Environ. Res. 2012, 117, 120–131. [Google Scholar] [CrossRef] [PubMed] [Green Version]
  15. Ray, K.; Giri, R.K.; Ray, S.S.; Dimri, A.P.; Rajeevan, M. An assessment of long-term changes in mortalities due to extreme weather events in India: A study of 50 years’ data, 1970–2019. Weather Clim. Extrem. 2021, 32, 100315. [Google Scholar] [CrossRef]
  16. Humphrey, M.A. Study of the thermal comfort of primary school children in summer. Appl. Ergon. 1979, 10, 175–176. [Google Scholar] [CrossRef]
  17. Hwang, R.L.; Cheng, M.J.; Lin, T.P.; Ho, M.C. Thermal perceptions, general adaptation methods and occupant’s idea about the trade-off between thermal comfort and energy saving in hot-humid regions. Build. Environ. 2009, 44, 1128–1134. [Google Scholar] [CrossRef]
  18. Teli, D.; Jentsch, M.F.; James, P.A.B.; Bahaj, A.B.S. Field study on thermal comfort in a UK primary school. In Proceedings of the 7th Windsor Conference: The Changing Context of Comfort in an Unpredictable World, Windsor, UK, 11–14 April 2012. [Google Scholar]
  19. Liang, H.H.; Lin, T.P.; Hwang, R.L. Linking occupants’ thermal perception and building thermal performance in naturally ventilated school buildings. Appl. Energy 2012, 94, 355–363. [Google Scholar] [CrossRef]
  20. d’Ambrosio Alfano, F.R.; Ianniello, E.; Palella, B.I. PMV-PPD and acceptability in naturally ventilated schools. Build. Environ. 2013, 67, 129–137. [Google Scholar] [CrossRef]
  21. Teli, D.; Jentsch, M.F.; James, P.A.B. The role of a building’s thermal properties on pupils’ thermal comfort in junior school classrooms as determined in field studies. Build. Environ. 2014, 82, 640–654. [Google Scholar] [CrossRef] [Green Version]
  22. Yun, H.; Nam, I.; Kim, J.; Yang, J.; Lee, K.; Sohn, J. A field study of thermal comfort for kindergarten children in korea: An assessment of existing models and preferences of children. Build. Environ. 2014, 75, 182–189. [Google Scholar] [CrossRef]
  23. Wang, D.; Jiang, J.; Liu, Y.; Wang, Y.; Xu, Y.; Liu, J. Student responses to classroom thermal environments in rural primary and secondary schools in winter. Build. Environ. 2017, 115, 104–117. [Google Scholar] [CrossRef]
  24. Kim, J.; de Dear, R. Thermal comfort expectations and adaptive behavioural characteristics of primary and secondary school students. Build. Environ. 2018, 127, 13–22. [Google Scholar] [CrossRef]
  25. Jindal, A. Thermal comfort study in naturally ventilated school classrooms in composite climate of India. Build. Environ. 2018, 142, 34–46. [Google Scholar] [CrossRef]
  26. Nematchoua, M.K.; Ricciardi, P.; Buratti, C. Adaptive approach of thermal comfort and correlation between experimental data and mathematical model in some schools and traditional buildings of Madagascar under natural ventilation. Sustain. Cities Soc. 2018, 41, 666–678. [Google Scholar] [CrossRef]
  27. UNICEF Uttarakhand Profile. In Census Info India 2011; UNICEF: New York, NY, USA, 2011; pp. 1–2.
  28. Kottek, M.; Grieser, J.; Beck, C.; Rudolf, B.; Rubel, F. World Map of the Koppen-Geiger climate classification updated. Meteorol. Z. 2006, 15, 259–263. [Google Scholar] [CrossRef]
  29. Beck, H.E.; Zimmermann, N.E.; McVicar, T.R.; Vergopolan, N.; Berg, A.; Wood, E.F. Present and future köppen-geiger climate classification maps at 1-km resolution. Sci. Data 2018, 5, 180214. [Google Scholar] [CrossRef] [Green Version]
  30. Peel, M.C.; Finlayson, B.L.; McMahon, T.A. Updated world map of the Koppen-Geiger climate classification. Hydrol. Earth Syst. Sci. 2007, 11, 1633–1644. [Google Scholar] [CrossRef] [Green Version]
  31. Sharma, A.; Singh, O.P.; Saklani, M.M. Climate of Dehradun; Indian Meteorological Department, Government of India, Ministry of Earth Sciences Mausam Bhavan: New Delhi, India, 2012.
  32. Dimitrova, A.; Bora, J.K. Monsoon weather and early childhood health in India. PLoS ONE 2020, 15, e0231479. [Google Scholar] [CrossRef] [Green Version]
  33. Khan, S.; Kotharkar, R. Performance Evaluation of School Environs: Evolving an Appropriate Methodology Building. Procedia-Soc. Behav. Sci. 2012, 50, 479–491. [Google Scholar] [CrossRef] [Green Version]
  34. Goto, T.; Toftum, J.; De Dear, R. Thermal Sensation and Comfort With Transient. In Indoor Air 2002, Proceedings of the 9th International Conference on Indoor Air Quality and Climate, Monterey, CA, USA, 30 June–5 July 2002; Indoor Air 2002: Santa Cruz, CA, USA, 2002; pp. 1038–1043. [Google Scholar]
  35. Haddad, S.; King, S.; Osmond, P.; Heidari, S. Questionnaire design to determine children’s thermal sensation, preference and acceptability in the classroom. In Proceedings of the 28th Conference, Opportunities, Limits & Needs Towards an Environmentally Responsible Architecture, Lima, Peru, 7–9 November 2012. [Google Scholar]
  36. Martinez-Molina, A.; Boarin, P.; Tort-Ausina, I.; Vivancos, J.L. Post-occupancy evaluation of a historic primary school in Spain: Comparing PMV, TSV and PD for teachers’ and pupils’ thermal comfort. Build. Environ. 2017, 117, 248–259. [Google Scholar] [CrossRef]
  37. Korsavi, S.S.; Montazami, A. Children’s thermal comfort and adaptive behaviours; UK primary schools during non-heating and heating seasons. Energy Build. 2020, 214, 109857. [Google Scholar] [CrossRef]
  38. Turner, S.C.; Paliaga, G.; Lynch, B.M.; Arens, E.A.; Aynsley, R.M.; Brager, G.S.; Deringer, J.J.; Ferguson, J.M.; Filler, J.M.; Hogeling, J.J.; et al. ASHRAE Standard 55-2010: Thermal Environmental Conditions for Human Occupancy; ASHRAE: Atlanta, GA, USA, 2010; Volume 2010, p. 30. [Google Scholar]
  39. Rothfusz, L.P. The Heat Index Equation (or, More Than You Ever Wanted to Know about Heat Index); National Oceanic and Atmospheric Administration, National Weather Service, Office of Meteorology: Fort Worth, TX, USA, 1990; pp. 23–90. [Google Scholar]
  40. Brooke Anderson, G.; Bell, M.L.; Peng, R.D. Methods to calculate the heat index as an exposure metric in environmental health research. Environ. Health Perspect. 2013, 121, 1111–1119. [Google Scholar] [CrossRef] [PubMed]
  41. Murtyas, S.; Hagishima, A.; Kusumaningdyah, N.H. On-site measurement and evaluations of indoor thermal environment in low-cost dwellings of urban Kampung district. Build. Environ. 2020, 184, 107239. [Google Scholar] [CrossRef]
  42. Yang, S.; Berdine, G. The receiver operating characteristic (ROC) curve. Southwest Respir. Crit. Care Chron. 2017, 5, 34. [Google Scholar] [CrossRef]
  43. Kim, J.; Zhou, Y.; Schiavon, S.; Raftery, P.; Brager, G. Personal comfort models: Predicting individuals’ thermal preference using occupant heating and cooling behavior and machine learning. Build. Environ. 2018, 129, 96–106. [Google Scholar] [CrossRef] [Green Version]
  44. Ji, Y.; Wang, Z. Thermal adaptations and logistic regression analysis of thermal comfort in severe cold area based on two case studies. Energy Build. 2019, 205, 109560. [Google Scholar] [CrossRef]
  45. Lamberti, G.; Salvadori, G.; Leccese, F.; Fantozzi, F.; Bluyssen, P.M. Advancement on thermal comfort in educational buildings: Current issues and way forward. Sustainability 2021, 13, 10315. [Google Scholar] [CrossRef]
  46. Lin, Y.C.; Chen, C.P. Thermoregulation and thermal sensation in response to wearing tight-fitting respirators and exercising in hot-and-humid indoor environment. Build. Environ. 2019, 160, 106158. [Google Scholar] [CrossRef]
  47. Choi, J.H.; Yeom, D. Investigation of the relationships between thermal sensations of local body areas and the whole body in an indoor built environment. Energy Build. 2017, 149, 204–215. [Google Scholar] [CrossRef]
  48. Wang, L.; Kim, J.; Xiong, J.; Yin, H. Optimal clothing insulation in naturally ventilated buildings. Build. Environ. 2019, 154, 200–210. [Google Scholar] [CrossRef]
  49. Nakagawa, A.; Nakaya, T. A survey of clothing insulation for university students in Japan: Effect of clothing insulation distribution between the upper and lower body in the winter. J. Build. Eng. 2021, 44, 103287. [Google Scholar] [CrossRef]
Figure 1. Uttarakhand population profile in 2011 based on age group and living area.
Sustainability 14 07072 g001
Figure 2. Dehradun city location (Google Map) and its climate classification according to Köppen–Geiger [32].
Sustainability 14 07072 g002
Figure 3. (a) Annual trend of daily mean temperature and relative humidity and (b) daily maximum global horizontal irradiation (GHI) of Dehradun City in 2012 [31].
Sustainability 14 07072 g003
Figure 4. Indoor and outdoor conditions of the surveyed school buildings.
Sustainability 14 07072 g004
Figure 5. Students filling in the questionnaire sheets.
Sustainability 14 07072 g005
Figure 6. Probability density distributions of measured indoor air temperature and thermal acceptability estimated by ASHRAE 55 2010 during the winter and summer survey periods.
Sustainability 14 07072 g006
Figure 7. Probability density distribution of the heat index during the summer survey.
Sustainability 14 07072 g007
Figure 8. Fraction of TSVs and thermal preference votes (TPVs) against the increment indoor air temperature with a 1 °C interval in the winter and summer seasons.
Sustainability 14 07072 g008
Figure 9. Regression between indoor air temperature and mean values of TSVs and TPVs from 3rd to 5th graders.
Sustainability 14 07072 g009
Figure 10. ROC and AUC revealing the sensitivity of students’ thermal sensations for each scale against the indoor air temperature.
Sustainability 14 07072 g010
Figure 11. ROC and AUC reveal the sensitivity of students’ thermal preferences for each scale against the indoor air temperature.
Sustainability 14 07072 g011
Figure 12. Thermal satisfaction of each TSV scale for both summer and winter seasons.
Sustainability 14 07072 g012
Figure 13. Breakdown of the heat risk levels determined by the heat index fraction of each thermal satisfaction level in the summer season.
Sustainability 14 07072 g013
Figure 14. Histogram of clo values in the winter and summer seasons.
Sustainability 14 07072 g014
Figure 15. Adaptation preferences of the students to the indoor thermal conditions.
Sustainability 14 07072 g015
Table 1. Subjective thermal responses of students at classrooms reported by past studies.
ResearchersLocationTemperature Range SurveyedSurvey SamplesRemarks
Humphreys (1977) [16]United KingdomTair: 14–26 °CAge 7–9, 10,000 responses, 262 studentsRegression gradient against Tair for each gender and classroom ranged from 0.09 to 0.51 per °C, suggesting the slightly higher sensitivity of females. The diversity of thermal sensitivity among students is also illustrated by the distribution of regression gradients for individuals.
Hwang et al. (2009) [17]Taichung, TaiwanTop: 15–34 °CAge 11–17, 3754 responses, 1614 studentsSurvey in 14 naturally ventilated classrooms. The students’ thermal sensations based on the American Society of Heating, Refrigerating and Air-Conditioning Engineers (ASHRAE) 7-grade TSVs were formulated for three conditions, suggesting a wide range of neutral temperature bands (22.7–29.1 °C).
MTSV = 0.17 Top—3.94, R2 = 0.93 (15 < Top < 23 °C)
MTSV = 0.01 Top—0.30, R2 = 0.04 (15 < Top < 23 °C)
MTSV = 0.35 Top—10.27, R2 = 0.89 (29 < Top < 34 °C).
Mors et al. (2011) [6]Eindhoven, NetherlandTop: 19–30 °CAge 9–11, 1300 responses, 79 studentsSurvey in non-air-conditioned classrooms. TSVs collected in mid-season and summer indicated the underestimation of PMV method especially for summer. Moreover, the discrepancy between the current adaptive thermal comfort assessment methods with the observed TSVs was revealed.
Teli et al. (2012) [18]Southampton, United KingdomTop: 19–29 °CAge 7–11, 1314 responses, 230 studentsSurvey in eight naturally ventilated classrooms. The comfort temperatures derived from MTSV were about 4 °C lower than those based on standard PMV.
Liang et al. (2012) [19]Taichung, TaiwanTop: 24–29 °C Tmean: 16–28 °CAge 12–17, 3754 responses 1614 studentsSurvey in 48 naturally ventilated classrooms. The linear regression between TSV * and Top for 5 months from September to January was presented.
TSV * = 0.288 Top—8.393, R2 = 0.89 for Sep. (Top 29–33.7 °C)
TSV * = 0.168 Top—3.695, R2 = 0.94 for Jan. (Top 17.6–23 °C).
The gradients for November were exceptionally close to zero. The neutral temperature (Tneu) identified by TSVs for September was 29.2 °C, which is 2.3 °C higher than the ASHRAE 55, while Tneu for January was 22.4 °C, which was closer to the ASHRAE 55 (23 °C).
Alfano et al. (2013) [20]Campania, ItalyTop: 16–31 °CAge 11–18, 4000 students, 200 classroomsSurvey in naturally ventilated classrooms.
MTSV = 0.107 Top—2.13, R2 = 0.42
The percentages of dissatisfaction (PPDs) based on the questionaire are higher than the suggested level in ASHRAE 55.
Teli et al. (2014) [21]Southampton, United KingdomTop: 17–26 °CAge 7–11, 2990 responsesSurvey in two schools with different construction types. MTSVs–Top and MTPVs-Top relations showed positive and negative correlation with broad scatter. The preferred temperature determined by MTPVs was higher by 2 °C than Tneu determined by MTSVs, suggesting students’ preference toward warmth.
Yun et al. (2014) [22]Seoul, KoreaTair: 22–29 °CAge 4–6, 119 childrenSurvey in kindergartens. Children’s comfort temperature was lower by about 3 °C than that for adults. PMV estimations did not agree well with the children’s sensation votes.
Wang et al. (2017) [23]Three provinces of Northwest ChinaTop: 6–17 °C, 6–17 °C, 9–23 °C for three locationsAge 9–16, 1126 studentsSurvey in schools with and without heating systems. The linear regression analysis on MTSV-Top was carried out for three locations, suggesting smaller temperature sensitivity of actual votes compared to PMV.
Kim and de Dear (2018) [24]New South Wales, AustraliaTdiff: −8–8 °CAge 10–18, 2206 responsesNaturally ventilated and mixed-mode conditions.
TSV = 0.16 Tdiff + 0.24, R2 = 0.79 (primary school)
TSV = −0.15 Tdiff + 0.12, R2 = 0.74 (secondary school).
Jindal (2018) [25]Ambala, IndiaTop: 13.5–20 °C and 26–33.5 °CAge 10–18, 640 responses, 130 studentsSurvey in naturally ventilated classrooms.
TSV = 0.19 Top—5.54, R2 = 0.18 (monsoon)
TSV = 0.18 Top—3.52, R2 = 0.36 (winter).
Nematchoua et al. (2018) [26]Northern MadagascarTair: 20.5–32.4 °CAge 15–75, 1100 responsesSurvey in school and traditional buildings with naturally ventilated mode.
TSV = 0.28 Top—7.006, R2 = 0.94 (school buildings)
TSV = 0.22 Top—5.316, R2 = 0.87 (traditional buildings)
* Top: operative temperature; Tair: indoor air temperature; Tneu: thermally neutral temperature; Tmean: monthly mean outdoor air temperature; Tdiff: temperature offset from neutrality; TSV: thermal sensation vote; TPV: thermal preference vote; MTSV: mean of thermal sensation votes of children in the classroom; MTPV: mean of thermal preference votes of children in the classroom.
Table 2. Number of responses collected in the questionnaire survey.
SeasonAgeNumber of Responses
MaleFemaleTotal
Winter6123
7321345
8150137287
9310316626
10395358753
11153125278
12271744
13033
Summer6505
783129212
8335268603
9488481969
10557385942
11225142367
12353368
Total274125565297
Table 3. Scale expression for thermal sensation votes (TSV) and thermal preference votes (TPV) used in this survey.
TSV TPV
+3Very hot
+2HotMuch warmer
+1WarmBit warmer
0NeutralNo change
−1CoolBit cooler
−2ColdMuch cooler
−3Very cold
Table 4. Technical information of the instruments used in this study.
Parameter MeasuredName and SeriesRangeAccuracy
Indoor air temperatureT and D, TR72wf-S−25 to 70 °C±0.3 °C at 10 to 40 °C
Outdoor air temperatureT and D, TR-5i−40 to 80 °C ±0.5 °C
Indoor relative humidityT and D, TR72wf-S0 to 99%±2.5% RH at 15 to 35 °C
Indoor air velocityKanomax Climomaster, 6501 0.01 to 50 m/s±2% reading or ±0.015 m/s
Publisher’s Note: MDPI stays neutral with regard to jurisdictional claims in published maps and institutional affiliations.

