Article

Food Waste Diversion from Landfills: A Cost–Benefit Analysis of Existing Technological Solutions Based on Greenhouse Gas Emissions

1
Institute for Sustainable Industries & Liveable Cities, Victoria University, 70-104 Ballarat Road, Footscray, Melbourne, VIC 3011, Australia
2
Peerless Foods, 21 Evans Street, Braybrook, Melbourne, VIC 3019, Australia
3
College of Engineering and Science, Victoria University, 70-104 Ballarat Road, Footscray, Melbourne, VIC 3011, Australia
*
Author to whom correspondence should be addressed.
Sustainability 2022, 14(11), 6753; https://doi.org/10.3390/su14116753
Submission received: 23 March 2022 / Revised: 24 May 2022 / Accepted: 24 May 2022 / Published: 31 May 2022
(This article belongs to the Special Issue Sustainable Food System Transition)

Abstract

:
Landfill disposals of food result in fugitive emissions of methane—a powerful greenhouse gas (GHG). This desktop study focuses on the cost and GHG emissions associated with food waste diversion from landfills using aerobic digesters with liquid outputs (ADLO). Despite the emerging popularity of ADLO units for food waste disposal, their cost and the GHG emissions associated with their use have not been independently quantified and compared to those of other food waste management options. This study compared landfill disposals, the currently available composting services, electric food dehydrators, and in-sink waste disposal units (garbage grinders). For a food waste production rate of 30 kg d−1, the landfill base case showed the lowest cost at USD 23 week−1. The modeled ADLO cost ranged from USD 20–42 week−1, depending on performance. Dehydrator costs were high at USD 29 week−1, largely due to the high energy intensity of the process. The cost of the current centralized composting was USD 51 week−1. The ADLO option with good performance was estimated to produce 5% of the GHG emissions of a landfill. This study showed that well-performing ADLO technology can be economically competitive with landfills and centralized composting and can markedly reduce GHG emissions.

Graphical Abstract

1. Introduction

The disposal of food waste in landfills is known to lead to the production of large quantities of fugitive methane emissions due to the anaerobic digestion of the food waste by bacteria in the landfill site [1]. Methane is a gas that has a global warming potential that is 25 times greater than CO2 over 100 yr [2]. Since 2007, the global atmospheric methane burden has risen sharply, and the growth rate has further accelerated in 2014. If growth in the methane burden continues at the current rates in the coming decades, it will become impossible to meet the Paris Target [3]. More than half of the global methane emissions result from human activities. Of these anthropogenic sources of methane, 35% result from fossil fuels, 40% result from agriculture, and 20% result from landfills and wastewater [4]. The global methane emissions from waste management have been estimated to be about 60–69 Tg yr−1 for the 2008 to 2017 period, or about 12% of the total global anthropogenic methane emissions [5].
The diversion of food waste from landfills to purpose-built anaerobic digestion processes or to wastewater treatment plants (WWTP) via the sewerage system would seem to be an attractive prospect for landfill methane emission mitigation. The generated methane could be collected and used to generate electricity rather than be liberated to the atmosphere to contribute to climate change. The burning of generated methane converts the powerful greenhouse gas (GHG), methane, into the less powerful GHG, CO2, and generates heat that can be used to generate electricity that can potentially offset the burning of fossil fuels. The CO2 generated from the burning of the methane that is generated from food waste is not considered to result in a net production of GHG since atmospheric CO2 is consumed in the growing of the food. The diversion of food waste from landfills also stands to decrease the likelihood of leachate contamination of the land and water in the vicinity of the landfill.
The co-digestion of food waste with sewage sludge at WWTPs has been extensively studied and has been found to have benefits and challenges. The benefits include greater electricity generation from the additional methane production at the WWTPs and an improved degradation efficiency due to improved growth and microorganisms [6]. The challenges include adverse effects on WWTP equipment and higher solid waste production [7].
Australia’s National Food Waste Strategy [1] and the Victorian Government’s 2016 Metropolitan Waste and Resource Recovery Plan [8] encourages and promotes the diversion of food waste away from landfills and into soils as compost and for other beneficial uses, and gives effect to Australia’s obligations under the United Nations Framework Convention on Climate Change in helping reduce GHG emissions. Similar policies and current worldwide drivers for change regarding GHG emissions have resulted in the passing of laws in five US states (California, Connecticut, Massachusetts, Rhode Island, and Vermont) to keep food out of landfills. The US state of Vermont has banned food waste from landfills altogether [9]. Similarly, in Europe, the Waste Framework Directive and the Landfill Directive give recycling targets for municipal waste to reduce landfills to a maximum of 10% of the municipal waste generated by 2035 [10]. This will encourage the composting and anaerobic digestion of bio-waste.
Food waste producers such as restaurants are faced with the challenge of dealing with a changing regulatory environment which will render landfill disposals of food waste increasingly more difficult and will advocate for the use of a more expensive local centralized composting system. Food waste producers are also faced with the challenge of odor and vermin issues associated with the storage of the food waste awaiting pick up. Some food waste producers have already started to look for alternatives to landfills and centralized composting. Food waste producers in Degraves Street, Melbourne, for example, have established a local waste processing facility involving dehydrators and food digesters [11]. Other on-site systems have come onto the market to meet these challenges [12].
There are two kinds of in-vessel aerobic digestion units on the market for small food waste producers—aerobic digesters with solid outputs and aerobic digesters with liquid outputs [13]. Aerobic digesters with solid outputs lead to the production of a solid compost product and CO2. They can take 18 h to 7 days to completely digest the food and are larger and considerably more difficult to accommodate in the typical commercial kitchen than aerobic digesters with a liquid output. Aerobic digesters with liquid outputs (ADLO) are more accurately described as food waste liquefiers. They are compact and can reduce the volume of food waste by 90% in 24 h by grinding it down in the presence of oxygen, added microbes, enzymes, and water. ADLO technology is essentially an agitated enzymatic composting process with porous abrasive beads to accelerate the physical breakdown of food to small particulates and to provide a surface for biological colonization by beneficial organisms.
In considering the implementation of ADLO units, food waste producers are faced with contradictory information regarding the efficacy of the technology, the characteristics of the effluent, and the GHG emissions associated with the use of ADLO units. Although the power consumption, electricity cost, and GHG emissions can be estimated, the characteristics of the effluent, cost, and GHG emissions associated with the disposal of the effluent from the machines is not clearly known. Some manufacturers of ADLO machines, for example, state that the process is designed to completely decompose the food within 24 h. The Exbio website, for example [14], states that “the decomposition process does not produce any pollutants, and its by-products are water, CO2 and negligible amounts of methane” and that “the machine is capable of blocking bad odor”. Others state that the machine “digests food waste into a liquid” and that the liquid “can then be used to create renewable, sustainable energy” [15]. The digestate effluent from these machines has been found to contain potentially harmful bacteria and have a biological oxygen demand (BOD) comparable to raw sewage, and the only safe disposal option is discharge to the sewerage system [16]. Although the BOD can be utilized for energy generation by anaerobic digesters at the municipal wastewater treatment plant (WWTP), the treatment of the added BOD load adds costs and may be beyond the WWTP’s treatment capacity. As a result, some water authorities and municipalities are reluctant to accept the digestate into their sewerage system [12]. Those that do accept the digestate apply trade waste charges to cover the cost of treatment of the discharged BOD.
The objective of this desktop study is to provide an independent, end-user-focused comparison of the available food waste treatment options for small waste producers such as restaurants. It compares the cost, energy usage, and GHG emissions of landfill disposal with centralized composting, ADLO disposal, in-sink disposal, and dehydration. The effect of the quality of the ADLO effluent on these broad economic and environmental factors is also investigated and discussed. The context of this comparison is Melbourne, Australia, as this location has relevance to medium- to high-density urban areas around the world. Melbourne has a population density of approximately 500 residents per square kilometer, with a population of approximately five million people and thriving restaurant and hospitality precincts. It has an extensive road network and is serviced by utilities that provide electricity, gas, water, and sewerage infrastructure, allowing for the evaluation of several different modes of food waste management.

2. Materials and Methods

The quality of the effluent was estimated from the available scientific literature on ADLO machine performance [17] and on literature on the laboratory aerobic digestion of food waste [18,19]. Six different scenarios were envisaged to aid the comparisons. The costs associated with food waste management via pick up and disposal to landfills (Scenario 1) was compared with those associated with food disposal at a central composting facility (Scenarios 2 and 3) and with food disposal via the sewer using ADLO machines (Scenarios 4 and 5) and in-sink waste disposal devices (Scenario 6) for a food business producing 30 kg d−1 (60 L d−1) of food waste and operating for 6 days per week in Melbourne, Victoria.

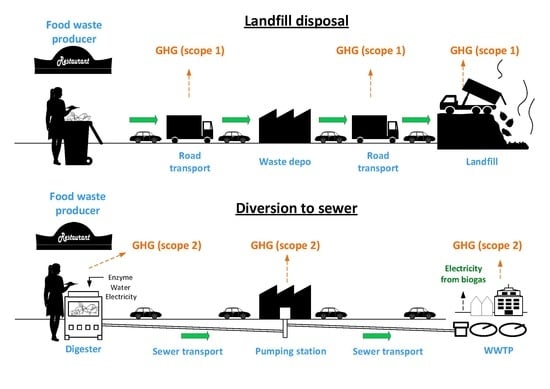
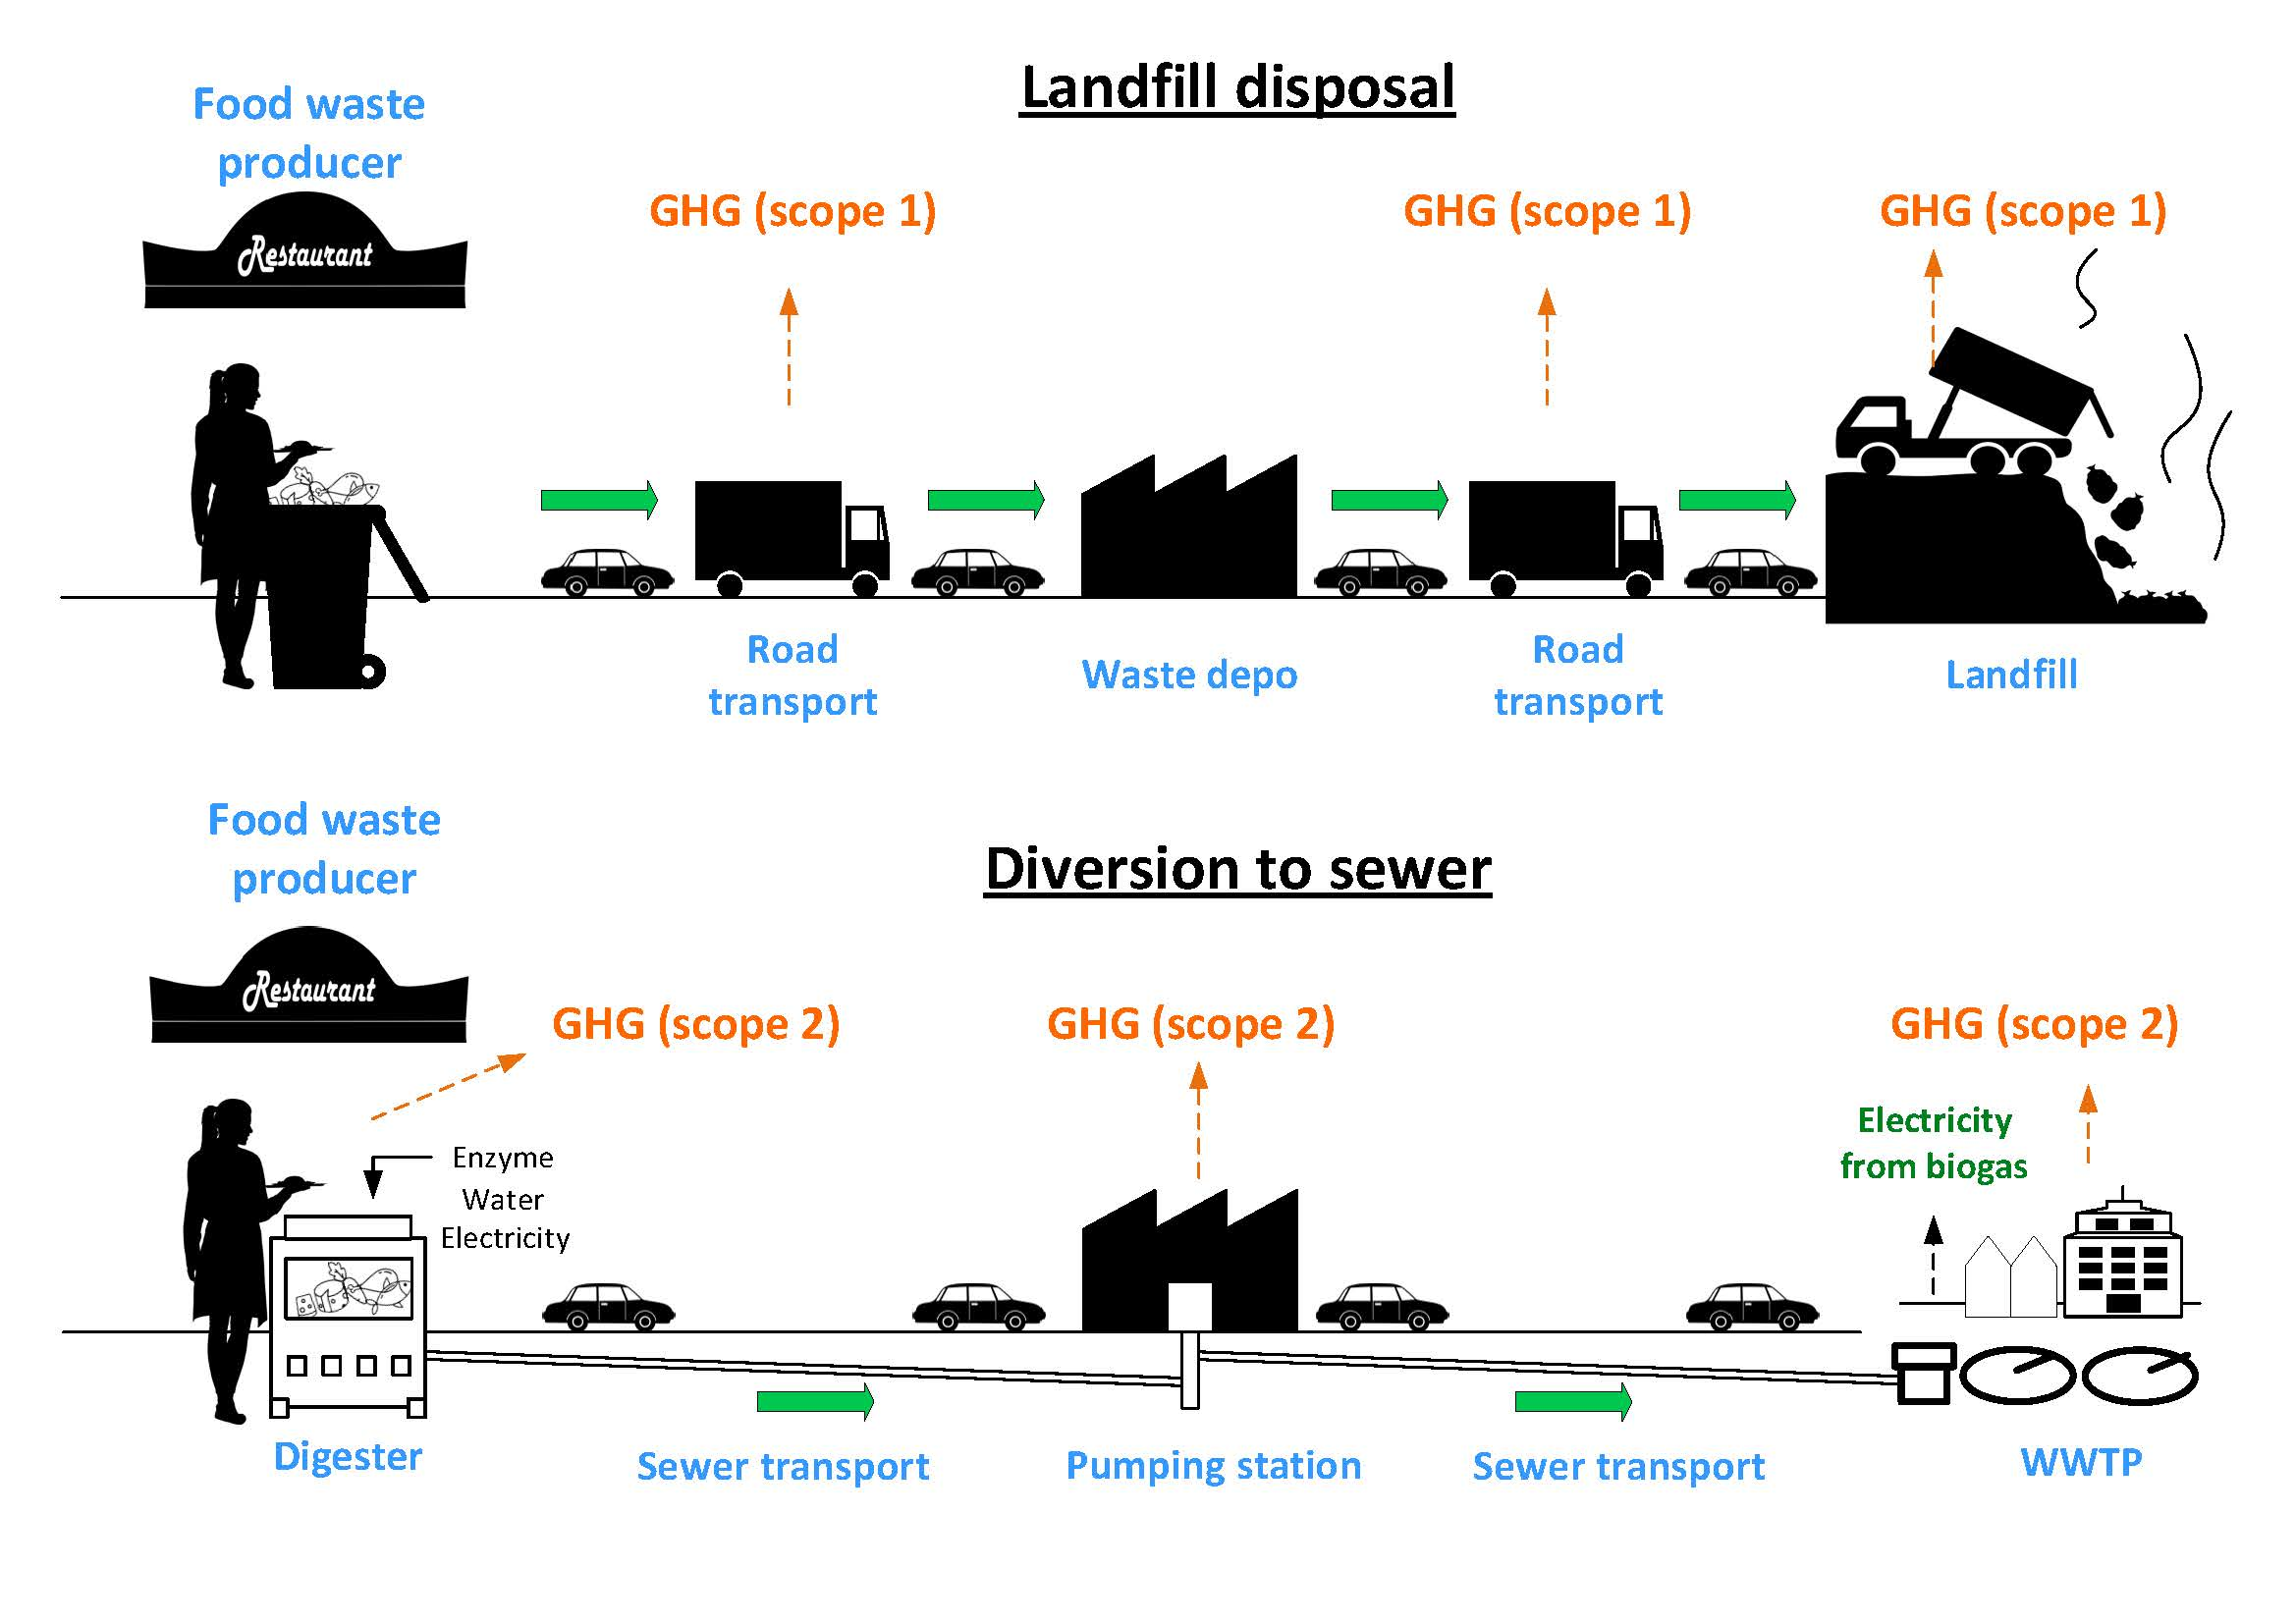
2.1. Scenario 1: Waste Pick Up and Landfill Disposal

This is the reference current status case. The waste producer pays for a weekly truck pick up of two 240 L bins of the food waste that is produced during the 6-day working week and is sent to landfill disposals. The waste is stored in bins, without refrigeration, until pick-up day (once per week). As this is a general waste service, room is allowed in the bins for non-food waste. The food waste occupies 360 L of the total volume of 480 L.

2.2. Scenario 2: Waste Pick Up and Centralized Composting

The waste producer pays for a weekly truck pick up of one 240 L bin and one 120 L bin of food waste that is produced during the 6-day working week and is sent to a central composting facility. The waste is stored in bins, without refrigeration, until pick-up day (once per week). As this is a food-only waste service, the total available volume is occupied by food.

2.3. Scenario 3: Dehydrator and Centralized Composting

The waste producer dehydrates the food waste to 10% of its original volume on site and pays for the dehydrated waste to be picked up in two 240 L bins. The waste is stored until pick-up day, without refrigeration (once every 13 weeks), and is sent to a central composting facility. As this is a food-only waste service, the total available volume is occupied by food.

2.4. Scenario 4: On-Site ADLO, Poor BOD Reduction Performance

The waste producer processes the food waste on site using an ADLO machine and pays trade waste charges for the disposal of the digestate into the sewerage system, but the ADLO machine functions sub-optimally, i.e., as indicated by literature laboratory food composting tests conducted under similar conditions [19]. The digestate is deemed to have 56% of the total food waste BOD and total suspended solids (98 g of BOD and 154 g of SS per kg food waste, see Appendix A Table A2).

2.5. Scenario 5: On-Site ADLO, BOD Reduction as Per Literature Case Study

The waste producer processes the food waste on site using an ADLO machine and pays trade waste charges for the disposal of the digestate into the sewerage system, but the ADLO machine (a popular machine on the market—ORCA Green Food Digester) performs as well as outlined in the Fey et al. case study [17]. This is the best available estimate of the ADLO machine performance as a thorough search of the literature for data on the performance for other machines could not be found. The digestate is deemed to produce 8.3 g of BOD and 93 g of SS per kg of food waste, see Appendix A Table A3.

2.6. Scenario 6: In-Sink Waste Disposal, No BOD Reduction

The waste producer processes the food waste on site using an in-sink food waste disposal unit which simply grinds the food and flushes it down the drain, and pays trade waste charges for disposal into the sewerage system. In this scenario, the BOD is that of the starting food waste (175 g BOD kg−1 food waste) and the total suspended solids (TSS) is 100% of the dry weight of the food waste (250 g SS kg−1 food waste), see Appendix A Table A4.

2.7. Assumptions and Calculation Parameter Setting

If not already in USD, literature costs were converted to USD from the published currency and date using an online converter [20]. Inflation from the year of publication to mid-September 2021 was accounted for by using an online calculator [21]. The cost of building and managing the landfill, which is often worn by council and passed on to the waste producer via rates and fees, was not included in the cost-to-consumer calculation. The assumptions and model settings used are summarized in Appendix A Table A1, Table A2, Table A3, Table A4 and Table A5.
The effluent quality settings for Scenario 4 (ADLO, poor performance), Scenario 5 (ADLO, ORCA case study performance) and Scenario 6 (in-sink disposal) are shown in Appendix A Table A2, Table A3 and Table A4, respectively. The parameter settings, assumptions, and data inputs in the modeling of the GHG emissions are shown in Appendix A Table A5.
The costs of disposal to sewers for Scenarios 4–6 were calculated from a local water authority’s trade waste charge [22] for specific trade waste parameters (usage, BOD, N, SS, and TDS), the per kg of the food waste estimated concentration of each parameter in the output stream, and the weight of the food waste digested. It is important to note, however, that the trade waste charges imposed by different water authorities can vary. The final cost to the consumer can, therefore, also vary depending on their particular location and their responsible water authority’s pricing. However, the prices used in this model serve as a convenient means to rank the options in terms of cost, which serves as an indicator to how much it could cost the consumer to operate.
The CO2 equivalents (CO2e) generated from each scenario were calculated from the expected methane emission (Scenario 1) or from the centralized composting electricity consumption (Scenarios 2 and 3) or from the electrical energy required for the dehydration, ADLO, or in-sink disposal process (Scenarios 3–6), including the electrical energy input for further processing by the WWTP (Scenarios 4–6). The energy generated from burning the methane generated during anaerobic digestion of the food waste at the WWTP was also calculated to yield a net energy requirement and a net CO2e generation for each scenario. Sample calculations of the cost and CO2e are shown in Appendix B.
The major input and output types considered for food waste diversion Scenarios 4 and 5 are compared to those of landfill disposal in Figure 1. The input and output types for Scenario 2 (composting) are the same as for Scenario 1 (landfill), but with no methane emitted at the composting location. The input and output types for Scenario 3 (dehydration and composting) are the same as those of Scenario 2 (composting), but with added electricity usage. The input and output types for Scenario 6 (in-sink disposal) are the same as those for Scenarios 4 and 5 (food waste diversion with ADLO), but with no enzyme and grinding beads.

3. Results

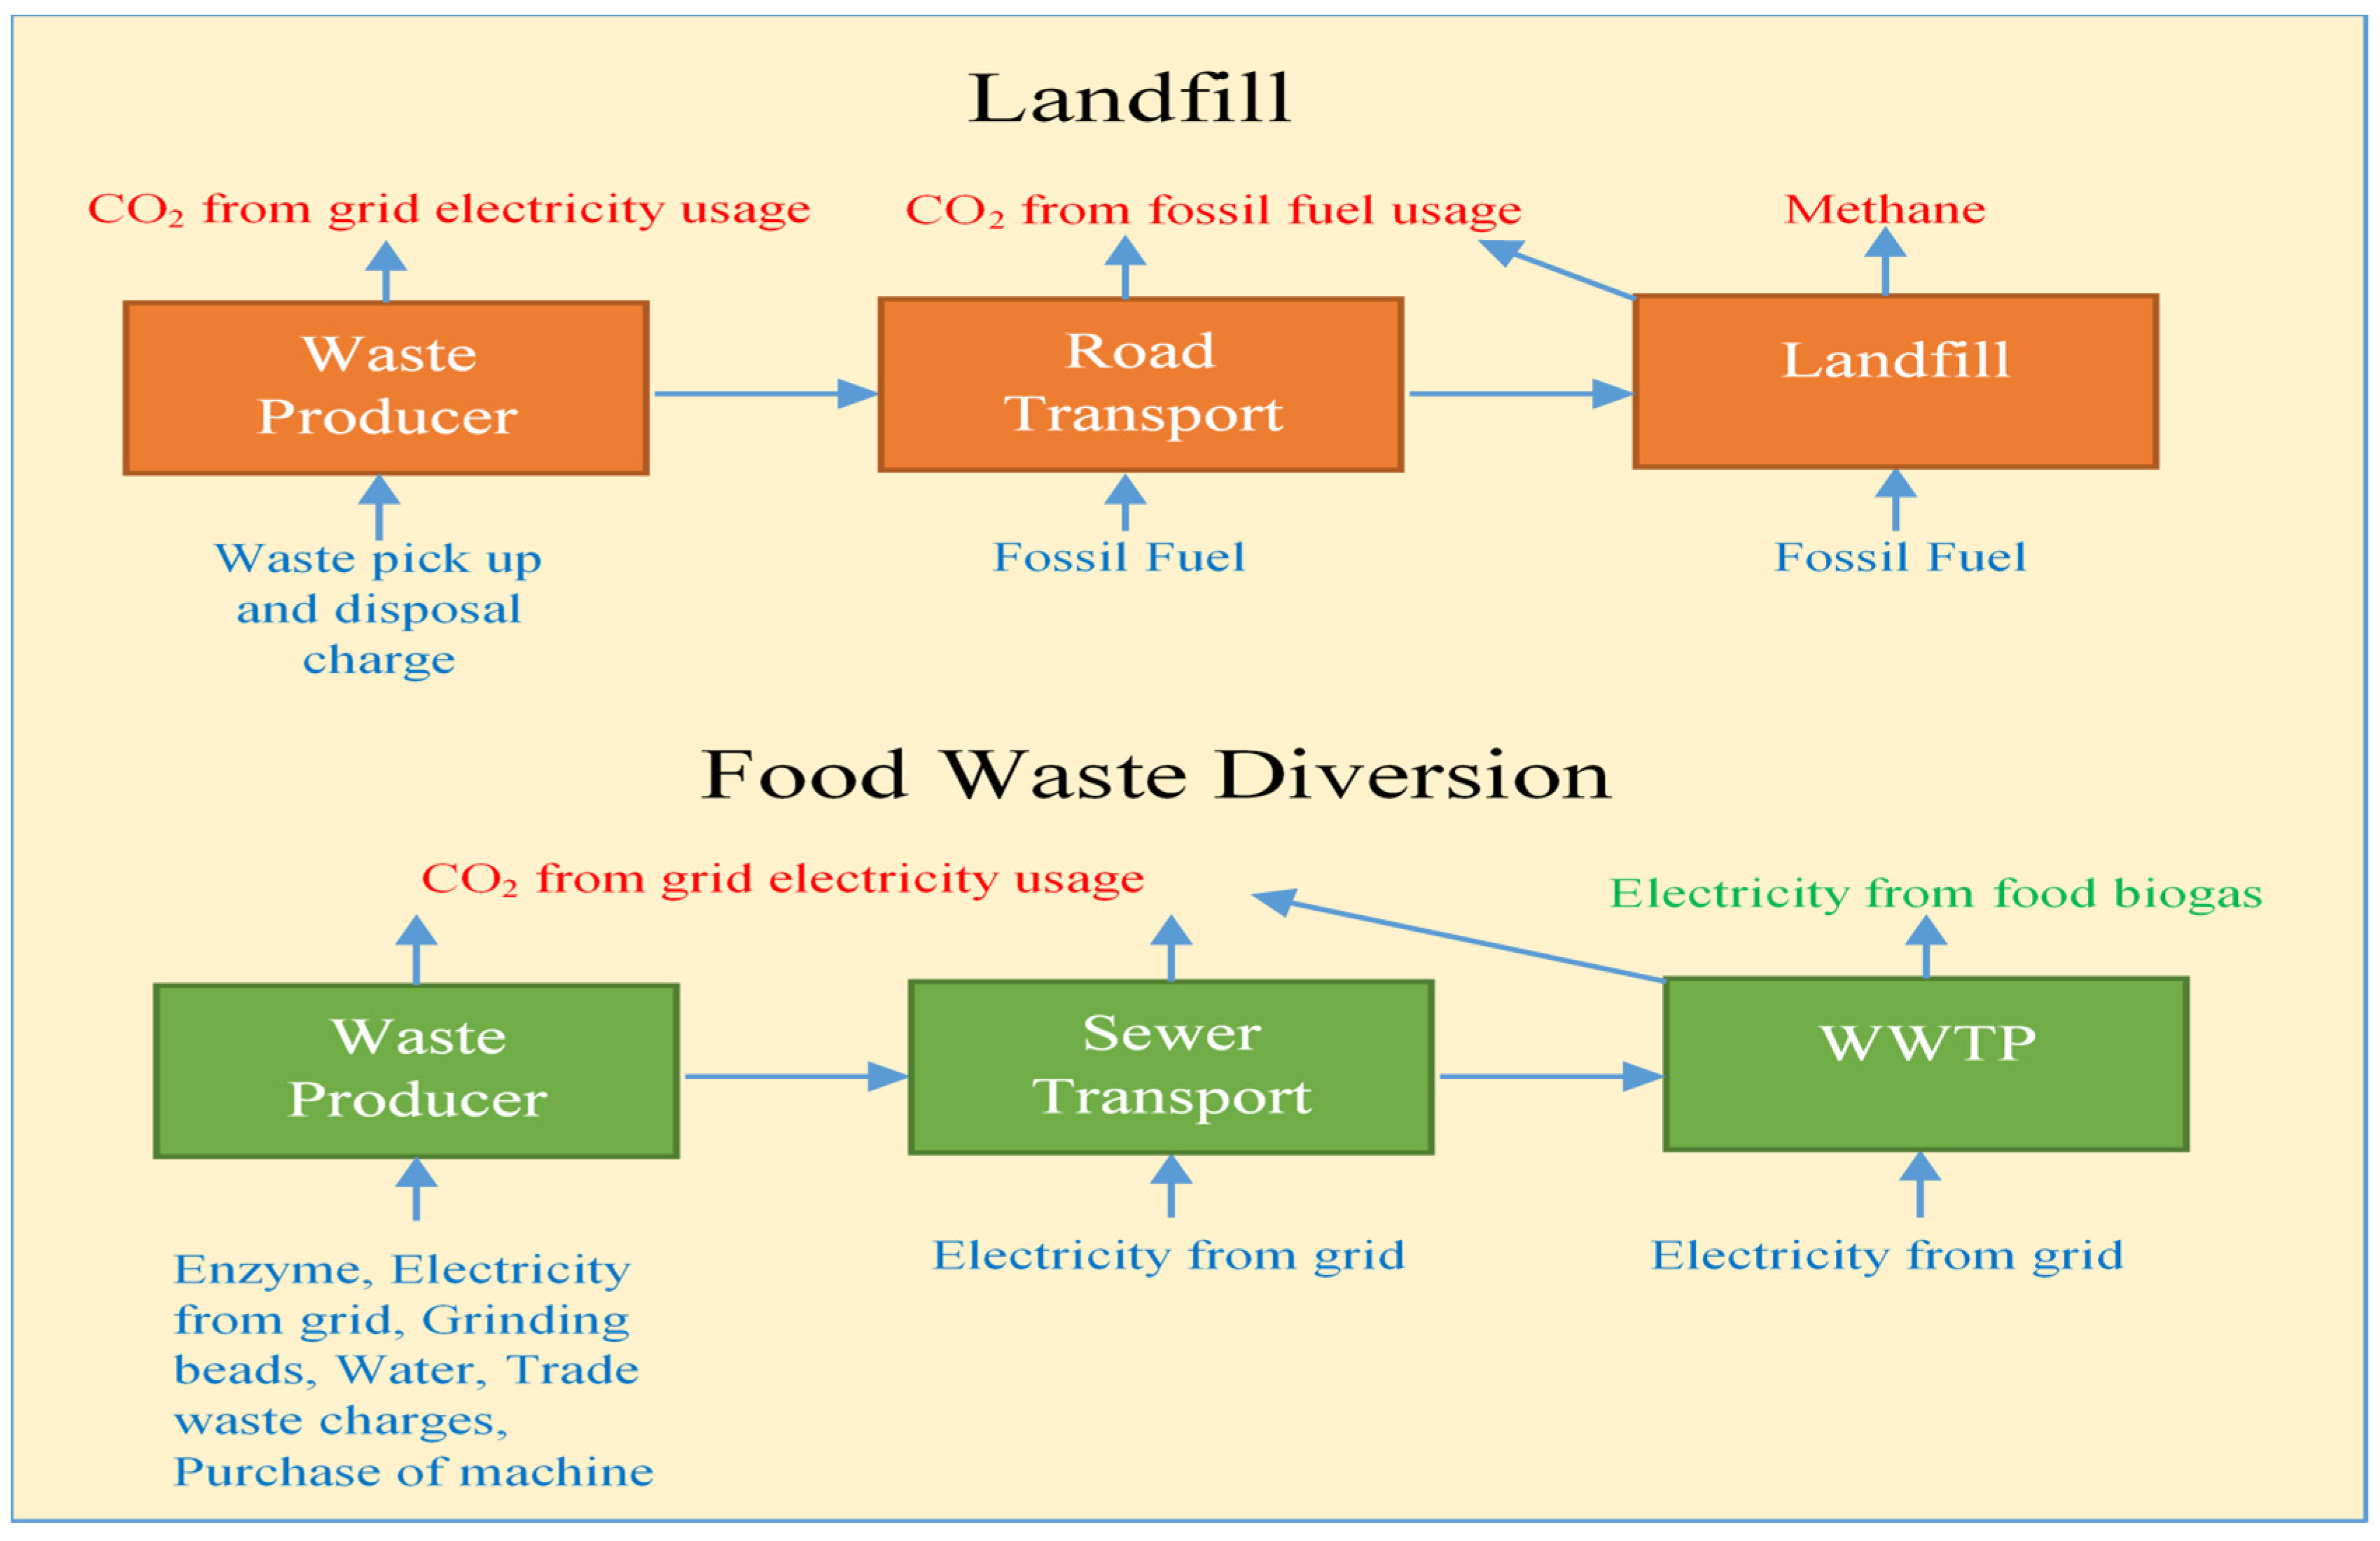
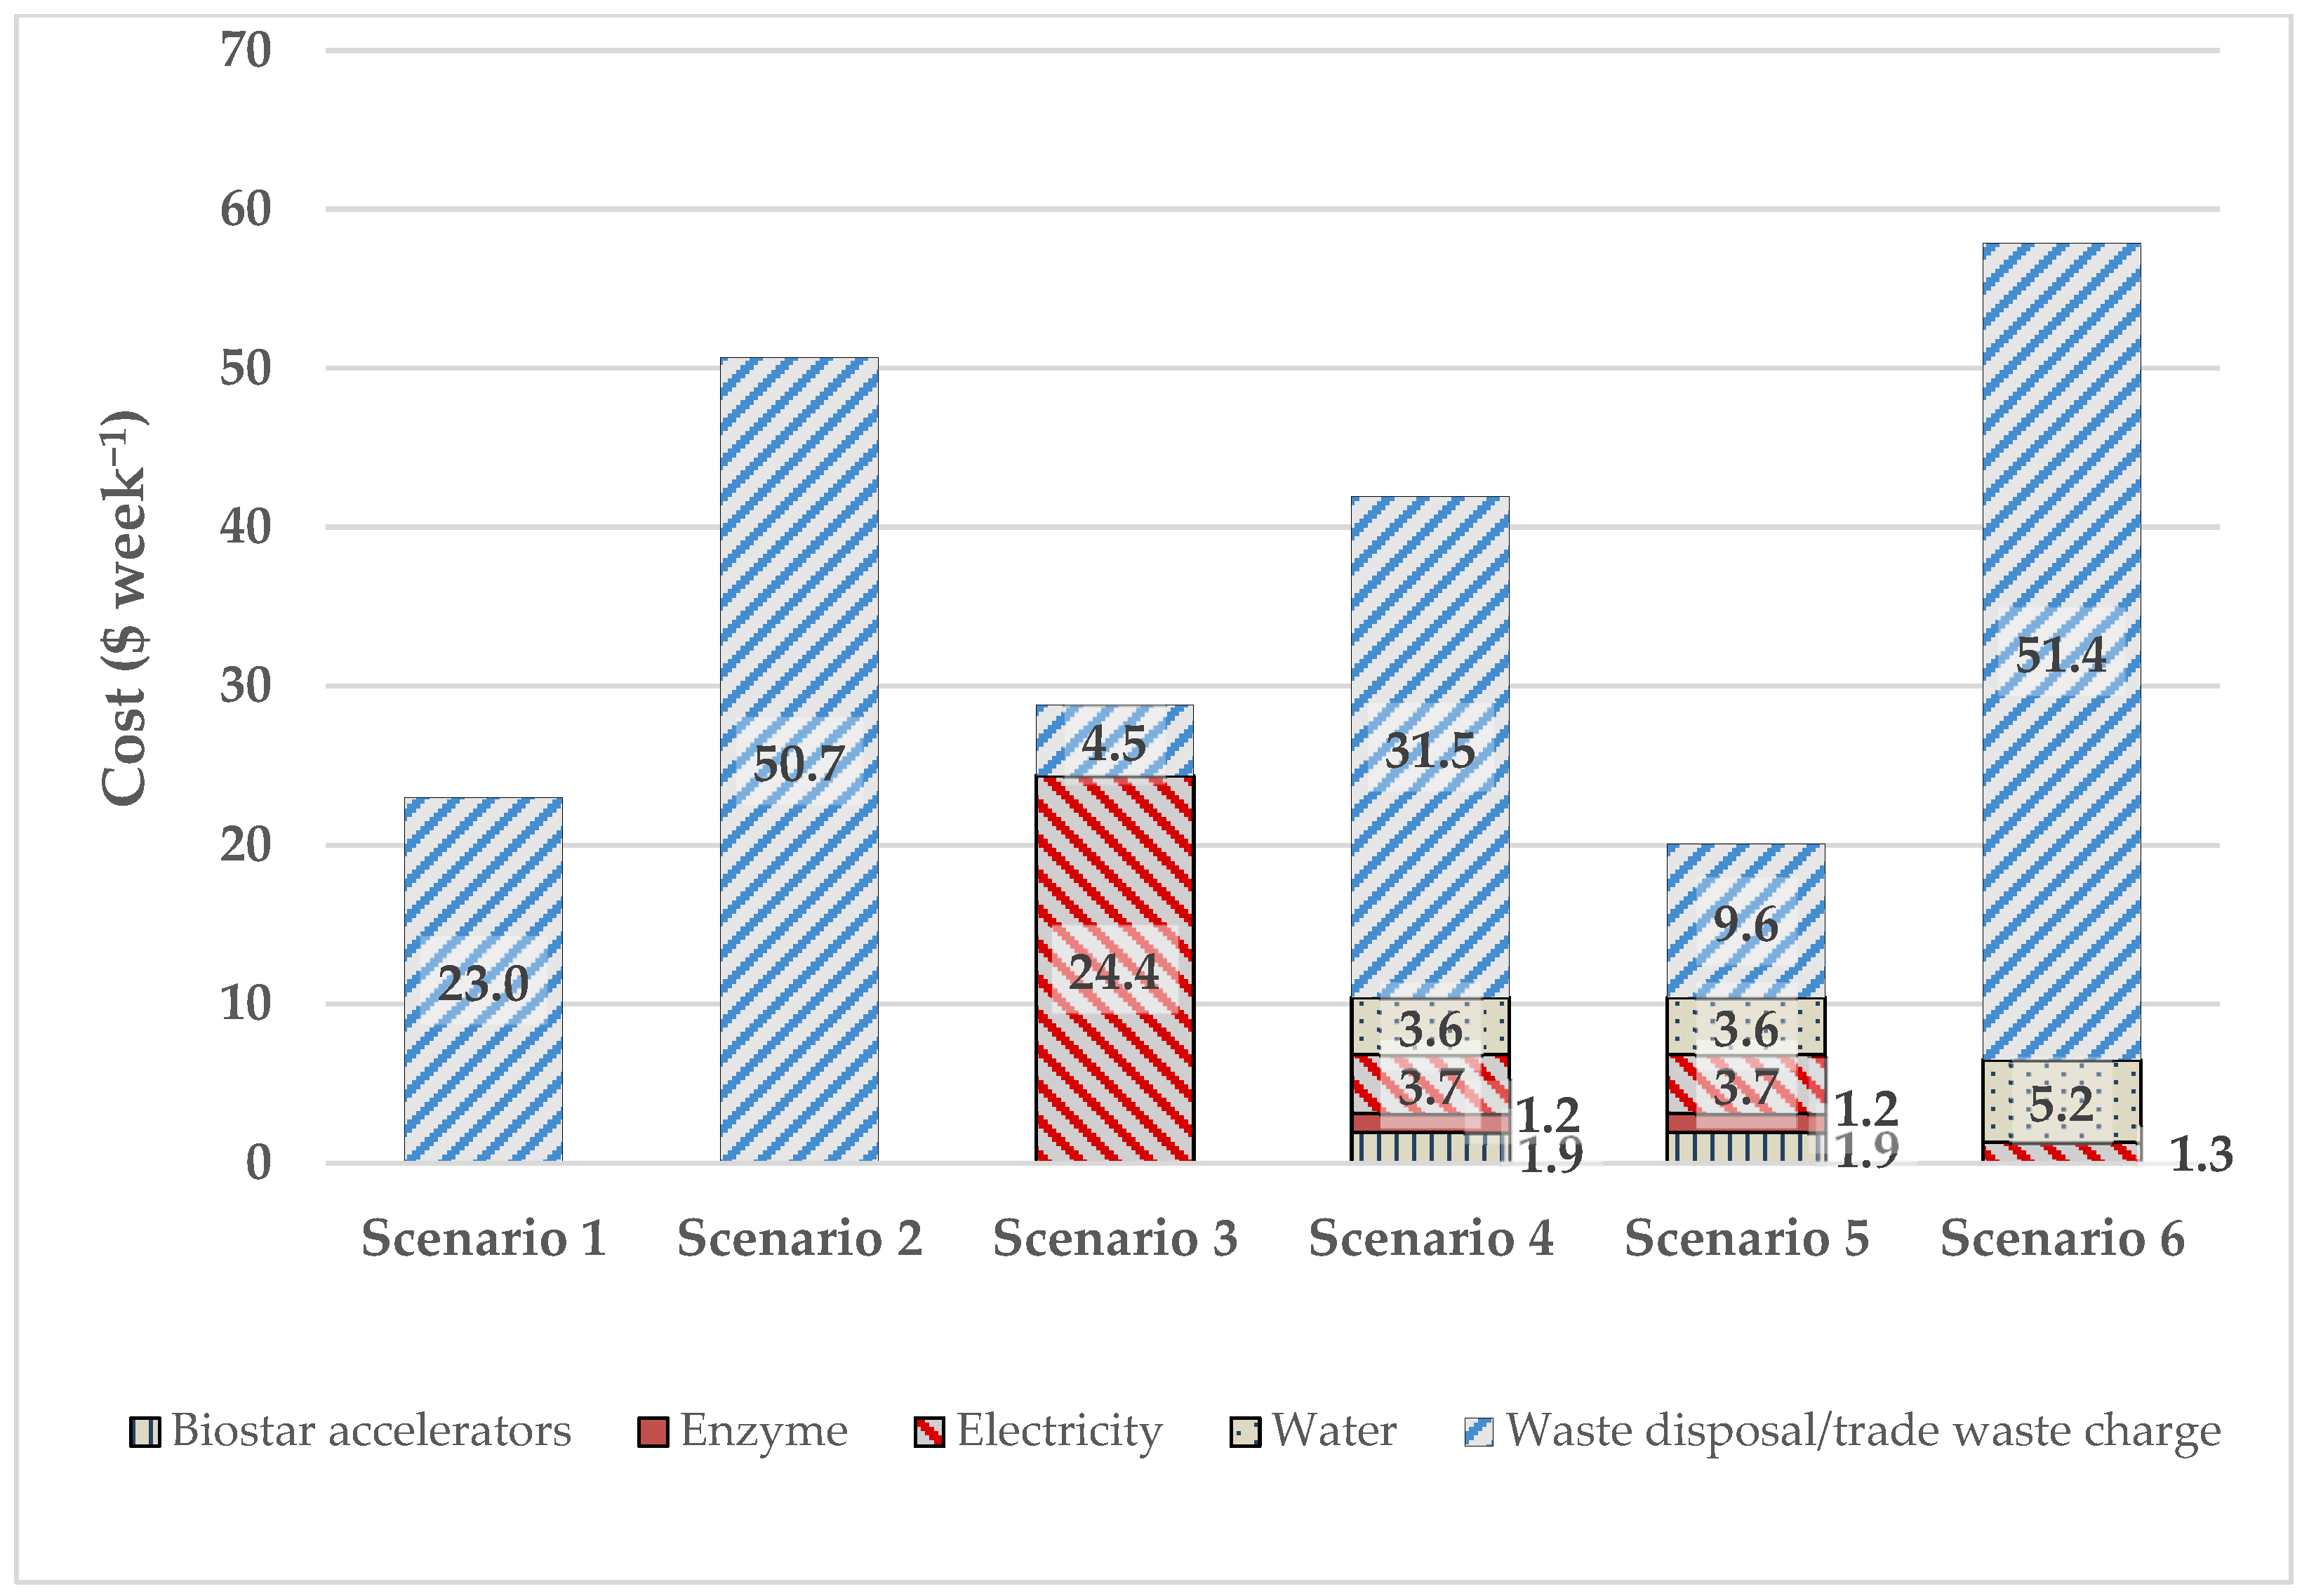
3.1. Techno-Economic Comparison of the Six Scenarios

The results of the economic assessment of the six options are shown in Figure 2.
Overall, there seems to be little or no current economic incentive to change from the landfill disposal of food waste. The base case of landfills (Scenario 1) leads to a cost of USD 23 per week, while Scenario 5 (reference performance with the ORCA machine performance option) was slightly more favorable than landfills at USD 20 per week. This cost reduction, however, may not be significant when the likely uncertainty/error involved in the estimates is considered.
It is envisaged that the current regulatory environment is likely to drive the cost of the landfill option up and possibly lead to a total ban on landfills of food waste, as has occurred in some US states [9,17]. In such a situation, the base case would be expected to become centralized composting (Scenario 2). Composting is higher in the waste hierarchy than energy recovery and landfills [23] and would be expected to be favored in a future regulatory environment. In such a situation, the composting of dehydrated food waste (Scenario 3) and ADLO with ORCA performance (Scenario 5) would then become the most attractive alternative options.
It is noteworthy, however, that the cost to the food waste producer can vary depending on their particular location and on the region’s responsible water authority’s pricing policy. The cost to the food waste producer can also change with time as water authorities adapt to a changing government policy regulatory environment. Having to treat large quantities of food waste at the WWTP would be expected to incur added costs that the water authority may seek to recover from waste producers. This may lead to higher trade waste charges which would be expected to uniformly increase the cost to the food waste producers of Scenarios 4, 5, and 6.
A selection of a local water authority’s trade waste acceptance limits [24] for parameters relevant to food waste are compared to the quality of the Scenarios 4 and 5 effluents in Table 1.
It can be seen that the digestate from these ADLO scenarios does not conform to the concentration acceptance criteria and the viability of this scenario would require a detailed analysis of the digestate quality and a special agreement with the water authority for discharge of the digestate into the sewerage system. This does not seem to be an insurmountable obstacle in the local Melbourne context of this study, however, as the liquid output aerobic digesters have been used in a local inner-city restaurant and café precinct [25], a high-end restaurant [26], a supermarket chain [27], and major sporting facilities [28]. There are also claims that “The ORCA is rolling out across Australia in pubs, shopping centres, food courts and hotels.” [29].
Dehydration is an energy-intensive process and the electric energy cost is the major contributor to the overall cost. If, however, solar electricity is generated on site via the use of rooftop solar panels, this would be expected to lead to much lower running costs. The use of solar power was not modeled here as it would require many uncertain assumptions regarding government subsidies, capital costs, the available rooftop space, and competing feed-in tariffs, all of which are currently subject to considerable change, to render the estimates useful for small food waste producers.
Scenario 6 involves the use of in-sink grinders which allows the flushing of ground-up food into the sewerage system without further treatment. The trade waste charges are more than for the ADLO scenarios (4 and 5), primarily due to the trade waste charge on the food solids going into the sewerage system without liquefaction. The water used (13 L kg−1 of food waste) is also estimated to be considerably more than the ADLO scenario (9.3 L kg−1 of food waste [30]). Acceptance of the effluent into the sewerage system by the responsible water authority is likely to be more difficult than for the ADLO scenarios due to the additional risks of sediment build up and fat and grease fouling that may lead to blockages in the sewer system or at the WWTP [31].
An additional consideration is the cost of the equipment to the waste producers for the various scenarios. The approximate equipment costs and the simple payback period for the treatment of 30 kg of food waste per day with landfills (Scenario 1) and centralized composting (Scenario 2) as the base case are shown in Table 2.
With an estimated saving of only approximately USD 3 week−1 when compared to landfills as the base case, there is no economic incentive for waste producers to adopt the ADLO Scenario 5 since the payback period of 48 yr is much longer than the expected lifetime of the machine. There does, however, appear to be an economic incentive for adoption of the ADLO Scenario 5 when compared to centralized composting (Scenario 2) as the base case. A simple payback period of 4 yr is within the expected 10 yr lifetime of the machine.
The use of solar energy would be expected to considerably reduce the payback period for the dehydration case (Scenario 3), but the equipment cost of the solar installation needs to be considered for the context (e.g., within the existing system capacity, or as part of a purpose-installed new system).

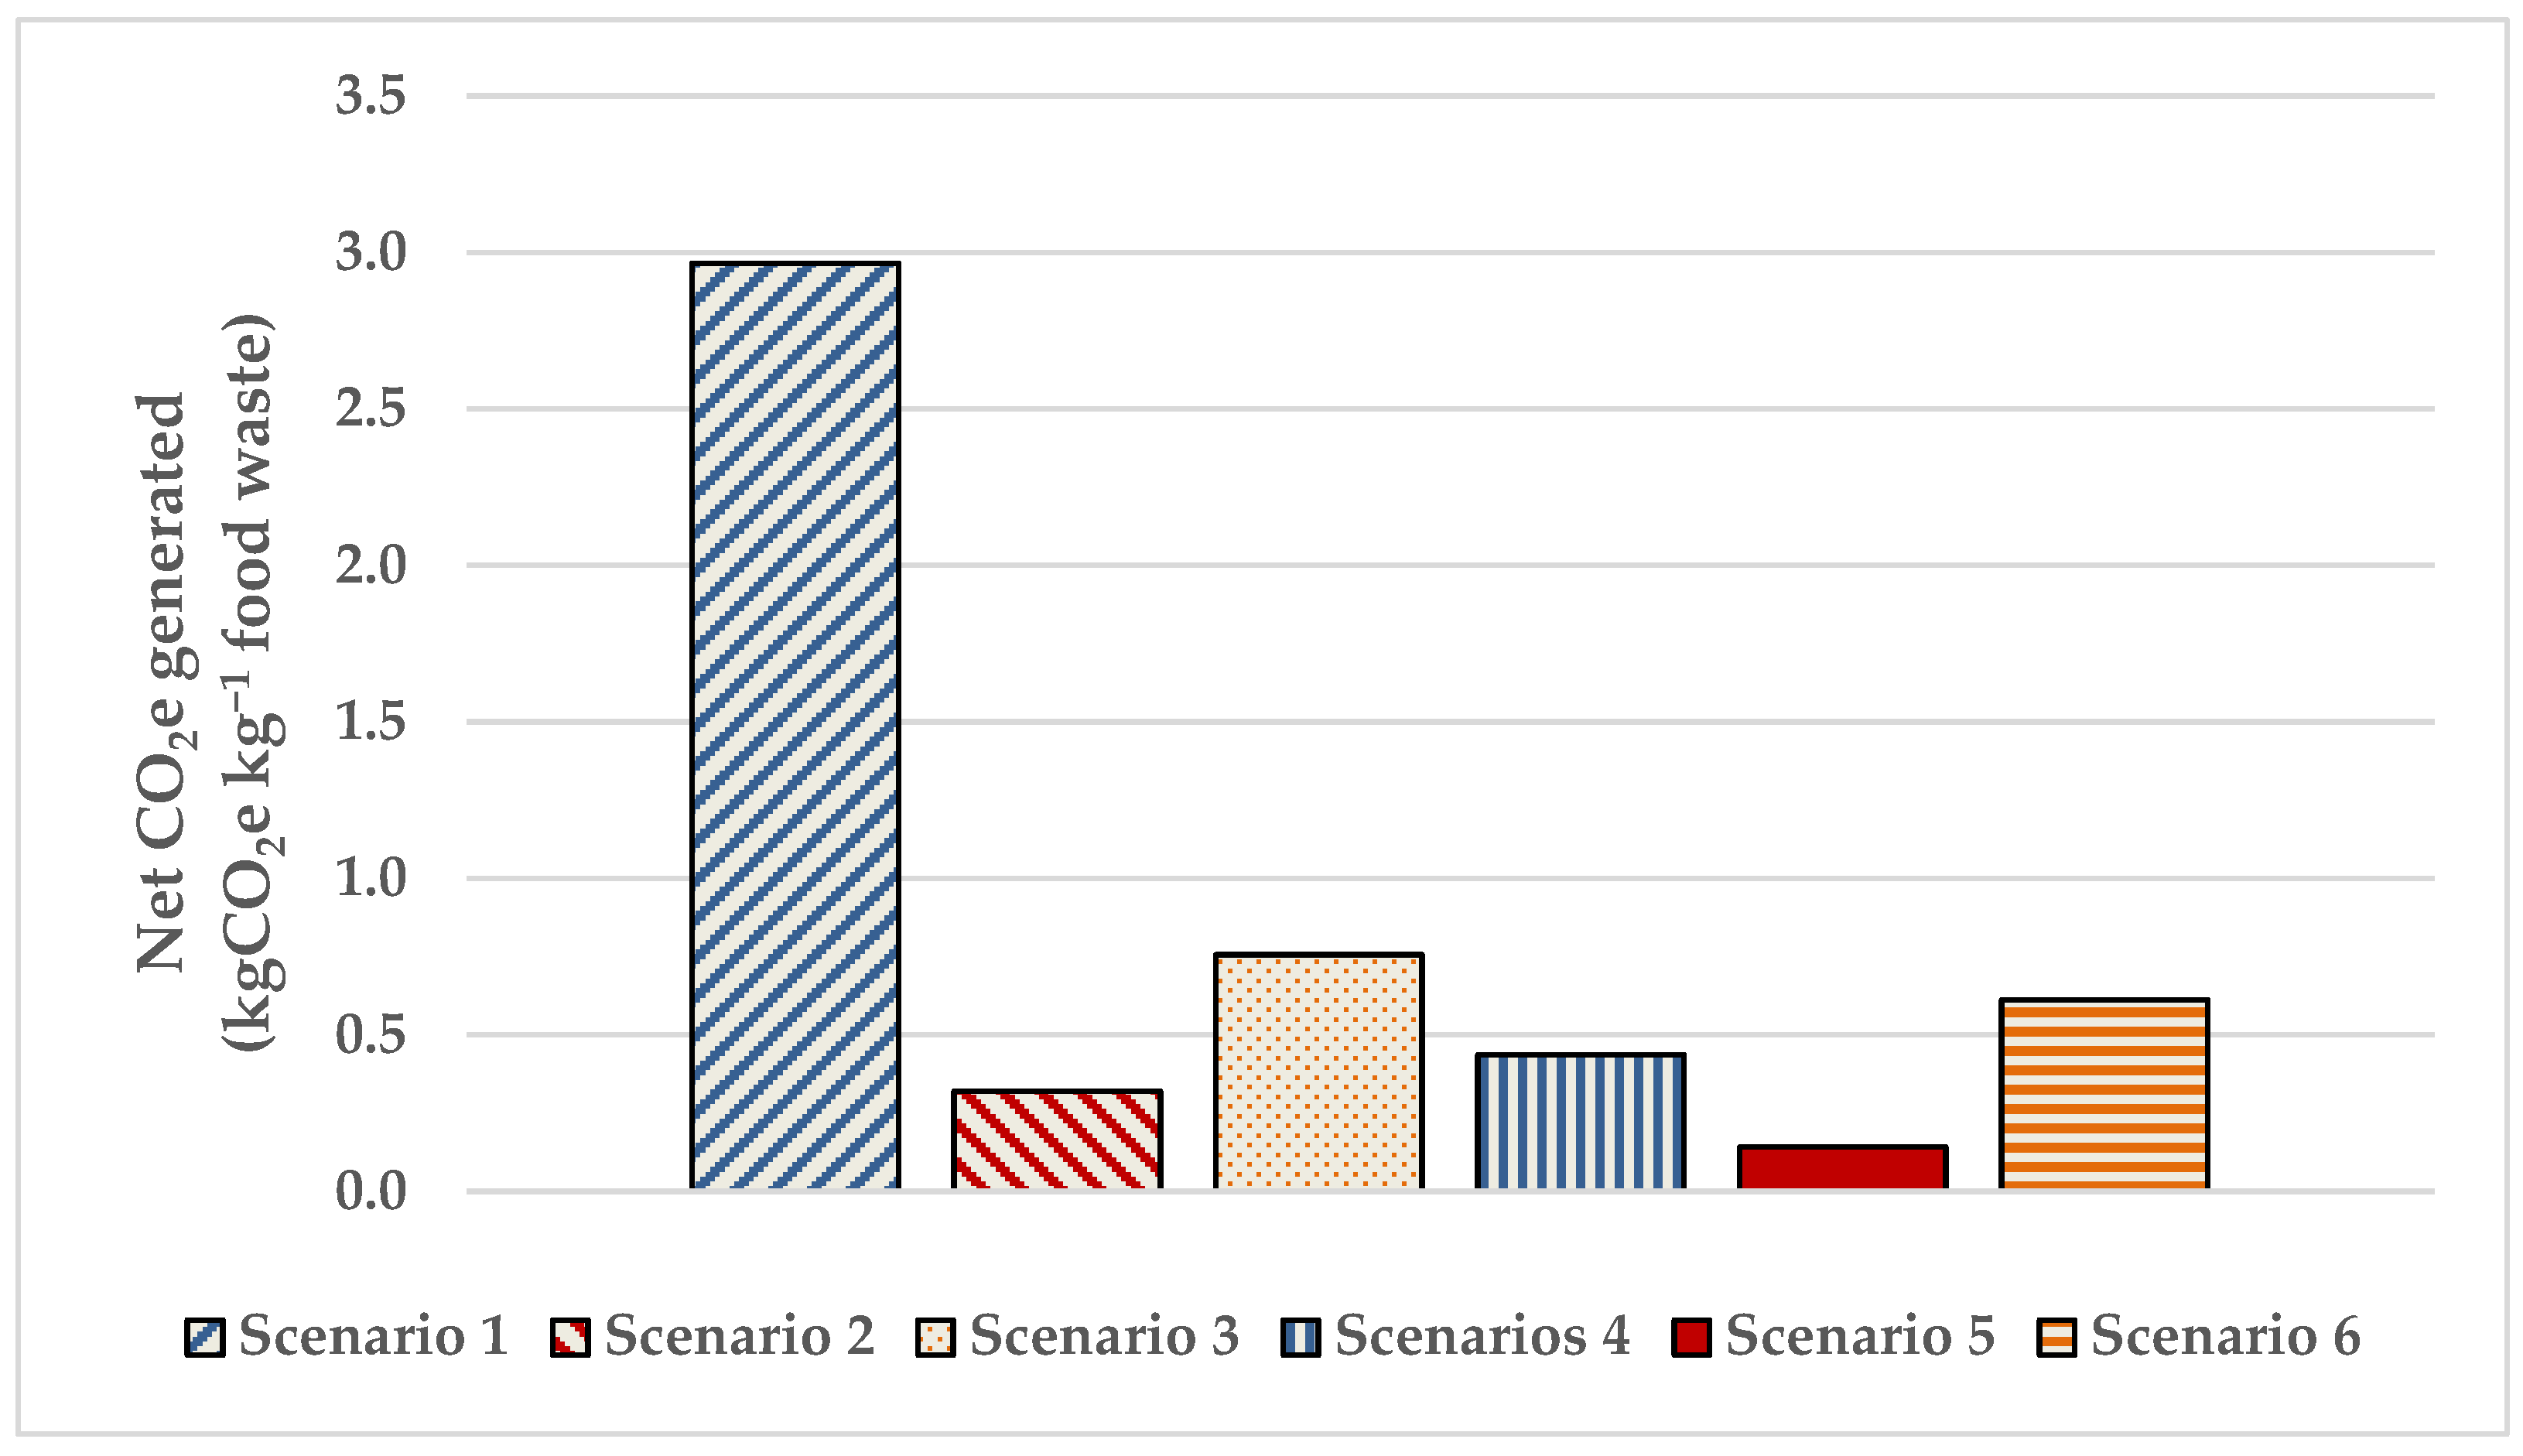
3.2. Environmental Benefit Assessment

The diversion of food waste away from landfills also diverts methane production from landfills where its generation under uncontrolled conditions leads to fugitive GHG emissions. This diversion of food to WWTPs allows for controlled methane production at the WWTP’s anaerobic digesters, allowing on-site electricity generation to run the WWTP processes.
The calculated net CO2 equivalents generated for each scenario are shown in Figure 3.
The inputs (energy and water) and outputs (energy, water, and GHG emissions) associated with landfill disposal with fugitive methane emissions (i.e., without electricity generation at landfills) that were used to calculate the net CO2e in Figure 3 are given in Appendix A Table A6. The estimates of the energy output from the food at the WWTP were calculated on the basis of the COD content (1.3 kWh kg−1 COD removed [32]).
Although landfill disposals (Scenario 1) use less energy than all the other scenarios on a per kg food basis, it generates the most GHG emissions. The major GHG emission from landfills comes from the fugitive methane generated and emitted to the atmosphere at the landfill site (3.0 kg CO2e kg−1 of food waste, [33]). The GHG emissions from transport to the landfill were minor in comparison to this (0.006 CO2e kg−1 of food waste).
The on-site energy input for food waste composting at a centralized facility (Scenario 2, 0.3 kWh kg−1, [34]) was lower than that for the dehydration of waste (Scenario 3, 0.7 kWh kg−1, [12]), giving rise to higher GHG emissions. The ADLO scenarios, 4 and 5, and the in-sink disposal (Scenario 6) had a lower on-site energy input (0.11 kWh kg−1 food waste for Scenarios 4 and 5 and 0.04 kWh kg−1 food waste for Scenario 6) than centralized composting (0.3 kWh kg−1 food waste) but had varying energy requirements to treat the waste at the WWTP due to the varying COD of the ADLO effluent.
The ADLO energy requirement also included the energy required to pump the wastewater to the WWTP. The energy usage by the WWTP to treat the food waste was estimated using the average usage of 245 WWTPs in Australia (2.8 kWh kg−1 COD removed) [35] and the estimated digestate COD (See Appendix A, Table A2, Table A3 and Table A4). It is important to note, however, that the energy use of the WWTP is subject to variability depending on the type and size of the plant, and has been estimated to range from 1.1 to 3.6 kWh kg−1 COD removed [35]. Additionally, the WWTP is here assumed to be running on electrical energy from the grid but many modern WWTPs generate a considerable proportion of their electricity from biogas and not from fossil-fuel-derived energy from the grid. They are also increasingly investing into utilizing solar power to offset their grid electricity demand, with a target to become carbon neutral by 2030 [36,37].
The GHG emissions of the ADLO Scenario 5 were estimated to be approximately 5% of the landfill GHG emissions. Considering the large number of assumptions involved in GHG modeling, this is in general agreement with another study which compared the GHG emissions of liquefaction and sewer discharge to those of landfill disposal [38]. This life cycle assessment modeling estimated that liquefaction would yield approximately 10% of the landfill CO2 equivalent emissions.
The GHG emissions of the in-ink grinding scenario (Scenario 6) are in general agreement with some of the results of a recent life cycle assessment of food waste management systems for two real-life locations [39]. Edwards et al. estimated a global warming potential of 4.3 × 10⁶ kg CO2e from 8559 Mg of food for one of the test cases, equating to 0.51 kg CO2e/kg food waste. The food waste scenario involved in-sink maceration and co-digestion at the WWTP. This agrees with the result in Figure 3 for the in-sink grinding scenario (Scenario 6). The other test case estimate for the same scenario was 2.5 × 10⁶ kg CO2e from 17,920 MG of food waste, equating to 0.13 kg CO2/kg food waste. The difference between the two test case studies was attributed to differences in the WWTP anaerobic digester performance due a difference in the relative quantities of food waste and sewage sludge at the two locations. The global warming potential of centralized composting was found to be 19% and 54% more than for the in-sink maceration scenario for the two test case studies, respectively. This is in contrast to the results in Figure 3, where centralized composting (Scenario 2) was 50% less than the in-sink grinding scenario (Scenario 6). A comparison of the landfill option in the Edwards et al. study with the current results presented in Figure 3 is not possible due to the use of landfill gas capture and subsequent electricity generation in this literature study.
Scenario 5 stands out as the option that has the lowest GHG emissions, primarily due to the low energy requirement for the treatment of the relatively low COD digestate. Scenario 5 also has the lowest weekly running cost (see Figure 2). It is important to note, however, that this estimate was based on digestate effluent quality data from one case study [17]. This was the only available data on the ADLO unit effluent quality. No peer-reviewed scientific studies on the effluent quality or on the likely variability in effluent quality depending on factors such as the type and quantity of food, the temperature profile, and the digester microbial community have been found.
These estimates do not include the CO2 equivalents originating from the methane generated in the sewerage pipes. These emissions are dependent on the design of the sewerage system and can be estimated using literature data [40] to be very low on a per capita basis (~0.001 to 0.01 kg d−1 capita−1 CO2e) but not negligible for large population centers for normal sewage. How much these emissions would increase with large diversions of food waste to the sewerage system is not known and needs further research.
The centralized composting of dehydrated food waste (Scenario 3) was found to have higher energy requirements than the ADLO scenarios as dehydration is a more energy-intensive process. The net GHG emissions were higher than those of the ADLO options. Dehydration may, however, be favored over the ADLO option in locations where solar power is readily available and/or where the sewerage system is deemed to not be able to accommodate the BOD and solids load of the ADLO option. It would also be favored in situations where the waste collection cost is high and where there is a consistent quantity of food waste such that the internal dehydrator temperature can be maintained with regular operation, such as hotels and hospitals. Due to the largest single cost component being electricity, the dehydration option appears to present the highest potential for cost reduction in situations where cheaper and low carbon intensity electricity can be sourced, for example from solar.

4. Conclusions

Economic modeling of the likely costs to a small food-waste-producing business revealed that there is little or no economic incentive in the current regulatory and cost environment for small food waste producers such as cafés and small restaurants to change from the current food waste disposal practice involving landfills. In a more stringent future regulatory environment in which composting is encouraged by higher landfill tipping fees and/or the banning of food waste disposal in landfills, however, the ADLO scenario would become economically favored over centralized composting. The dehydrator scenario was the second most attractive option in terms of cost but had a higher weekly running cost than the landfill and the ADLO scenario with ORCA machine performance due to a higher energy intensity.
Centralized composting was found to lead to 10% of the CO2e generated from landfills. The ADLO scenario with ORCA machine performance was found to generate 5% of the landfill CO2e. The energy-intensive dehydration scenario CO2e emissions (Scenario 3) were estimated to be approximately the same as those of the in-sink disposal (Scenario 6) and 5-fold more than the ADLO pre-treatment (Scenario 5). The use of solar power would be expected to make the dehydration scenario much more attractive from both cost and GHG emissions perspectives.
The modeled data identified a major cost disincentive for food producers to decrease the GHG emissions of their food waste management practices by adopting centralized composting as a food waste management option. Given the choice in a regulatory environment in which landfills are banned, many would be expected to look for a less costly option than centralized composting, such as ADLO (Scenario 5), which has a weekly cost and GHG emissions that are approximately 40% of centralized composting and 5% of landfill disposal.

Author Contributions

Conceptualization, E.R. and M.C.D.; methodology, P.S.; formal analysis, P.S.; investigation, P.S.; writing—original draft preparation, P.S.; writing—review and editing, P.S., M.C.D. and D.N.; supervision, M.C.D. and D.N.; project administration, E.R. and M.C.D.; funding acquisition, E.R. and M.C.D. All authors have read and agreed to the published version of the manuscript.

Funding

This research was funded by the Innovation Connections Grant from the Australian Government Department of Industry, Innovation (Grant no. ICG001196), with co-funding from Brooklite Pty Ltd.

Institutional Review Board Statement

Not applicable for studies not involving humans or animals.

Informed Consent Statement

Not applicable for studies not involving humans.

Data Availability Statement

Data is contained within the article and accompanying appendix.

Conflicts of Interest

The authors declare no personal circumstances or interest that may be perceived as inappropriately influencing the representation or interpretation of the reported research results. The funders had no role in the design of the study; in the collection, analyses, or interpretation of data; or in the writing of the manuscript. The co-funder, Brooklite Pty Ltd., was consulted before publishing the results.

Appendix A

Table A1. Parameter settings, assumptions, data inputs and costs (in USD inflated to 2021).
ParameterSetting/ValueReference Comments
BioStar accelerator medium
(USD week−1)
1.9[17]Calculated from accelerator chip use (per kg of food waste) for ORCA machine in US case study.
Enzyme formulation
(USD week−1)
1.2.[17]Calculated from enzyme use (per kg of food waste) for ORCA machine in US case study.
Electricity cost
(USD kWh−1)
0.19[41]Using average annual electricity bills of AUD 6000 for SMEs using 20,000 kWh (single rate) per annum in Victoria. Offers as of April 2018, GST inclusive.
EX-30 machine electricity usage
(kWh day−1)
3.2[30]
EX-30 machine water usage
(L day−1)
278[30]
EX-30 water usage
(kL day−1)
0.278[30]
EX-30 water usage
(kL week−1)
1.67[30]calculated assuming 6-day working week.
EX-30 weekly energy usage
(kWh week−1)
19.2[30]calculated assuming 6-day working week.
EX-30 water usage
(kL week−1)
1.67[30]calculated assuming 6-day working week.
Water usage charge
(USD kL−1)
2.16[22]
Sewerage disposal charge
(USD kL−1)
1.37[22]
Trade waste usage volume charge
(USD kL−1)
0.65[22]
Trade waste usage BOD charge
(USD kg−1 BOD)
0.80[22]
Trade waste usage Total Kjendhal N charge
(USD kg−1 N)
1.53[22]
Trade waste usage SS charge
(USD kg−1 SS)
0.43[22]
Trade waste usage Inorganic TDS charge
(USD kg−1 TDS)
0.02[22]
Weight of food generated
(kg week−1)
180 Assuming Ex-30 machine is operated at full capacity of 30 kg d−1 for 6 days a week.
Density of food
(g L−1)
500[8]
General food waste disposal costs
(USD week−1)
11.5[42]For a 240 L bin.
Organics food waste disposal cost
(USD week−1)
29.8[43]For a 240 L bin.
Volume of waste generated
(L week−1)
360 Assuming food waste density of 500 g L−1.
Moisture content of food waste
(%)
75%[44]
In-sink disposal water usage
(kL week−1)
2.4[31,45]Using 4 L capita−1 day−1, assuming 3 meals capita−1 d−1, and 100 g food waste per meal and 1800 meals week−1.
Insinkerator energy usage
(Watts)
370.0[46]
Insinkerator energy usage
(KWh kg−1 food waste)
0.037 Assuming 3 h d−1 operation, 6 day week, 180 kg week−1 food waste.
Centralized composting electricity consumption
(kWh tonne−1 food waste)
300[34]
Dehydrator energy requirement
(kWh kg−1 food waste)
0.7[12]
COD of food waste
(g COD kg−1 food waste)
350[18]
Table A2. Scenario 4, on-site ADLO, poor BOD reduction performance, COD, BOD, TN, SS, and TDS estimates.
ParameterSetting/ValueReferenceComments
COD
(g COD Kg−1 wet food waste)
196[19]Wet weight reduction of 44% in 1 day.
Assumption that %COD reduction is the same as the %weight reduction.
BOD
(g BOD kg−1 wet food waste)
98 Using BOD:COD ratio of two in undigested food in Kim et al. 2015.
N
(g N kg−1 wet food waste)
4.1[47]Assuming a COD:TotalN ratio of 48 for undigested food.
SS
(g SS kg−1 food waste)
154[18]Assuming ~56% solubilization and a food waste, moisture content of 75%.
Inorganic TDS
(g TDS kg−1 food waste)
3.76[17]Calculated from salinity of ORCA machine digestate, added water volume, and food load.
Table A3. Scenario 5, on-site ADLO, BOD reduction as per Fey et al. literature case study [17] 1, COD, BOD, TN, SS, and TDS estimates.
ParameterSetting/ValueReferenceComments
BOD
(g BOD kg−1 wet food waste)
8.3[17]Calculated from ORCA digestate BOD, added water volume and food load.
N
(g N kg−1 wet food waste)
0.33 Assuming similar N reduction and BOD reduction to BOD reduction.
SS
(g SS kg−1 food waste)
93.2[17]Calculated from ORCA digestate TSS, added water volume and food load.
Inorganic TDS
(g TDS kg−1 food waste)
3.76[17]Calculated from salinity of ORCA machine digestate, added water volume, and food load.
Table A4. Scenario 6, in-sink waste disposal, COD, BOD, TN, SS, TDS, and water usage estimates.
ParameterSetting/ValueReferenceComments
COD of food waste
(g COD kg−1 wet food waste)
350[18]
BOD
(g BOD kg−1 wet food waste)
175 Using BOD:COD ratio of two in undigested food in Kim et al. 2015.
N
(g N kg−1 wet food waste)
7[47]Assuming a COD:Total N ratio of 48 for undigested food.
SS
(g SS kg−1 food waste)
250 Assuming grinding reduces total solids to suspended solids.
Estimated inorganic TDS, Scenarios 3 and 4
(g TDS kg−1 food waste)
3.76[17]Calculated from salinity of ORCA machine digestate, added water volume, and food load.
Water usage (L capita−1 day−1)4[31]
Customer food waste production (kg meal−1 day−1)0.1[47]
Table A5. Parameter settings, assumptions, and data inputs in modeling of GHG emissions.
ParameterSetting/ValueReference/Comments
Density of food waste (kg L−1)0.5[48]
Truck fuel consumption (L km−1)0.345[49]
Energy content of truck diesel fuel (MJ L−1)38.6[50]
Truck CO2 emissions (kgCO2e (km−1 tonnes−1 of food)0.2[33]
Distance to transfer station (km)15Estimate
Distance between transfer station and landfill (km)15Estimate
Moisture content of food (%)75%[51]
Garbage truck maximum weight load (Tonnes)24[52]
CO2 equivalents from methane release (kgCO2e tonne−1 of food)2965[33]
Anaerobic digester recoverable energy (kWh tonne−1 of waste)400[52]
WWTP energy benchmark (kWh kg−1 COD removed)2.8[35]
COD of food waste (g COD Kg−1 of food waste)350[18]
Indirect CO2 equivalents from use of electricity in Victoria, Australia (kg CO2e kWh−1)1.08[53]
Table A6. Energy, water, and CO2 equivalents estimates for landfills (Scenario 1) or centralized composting (Scenario 2), centralized composting of dehydrated food waste (Scenario 3) and food waste or diversion to WWTP as a result of using ADLO (Scenarios 4 and 5) or in-sink disposal (Scenario 6).
Scenario
123456
InOutInOutInOutInOutInOutInOut
On site and/or Road Energy Use and output
(kWh kg−1 food waste)
0.0046 (a)00.300.7000.1100.1100.040
Sewer+WWTP Energy use
and output
(kWh kg−1 food waste)
------0.55 (d)0.25 (c)0.05 (d)0.02 (c)0.98 (d)0.45 (c)
Water
(L kg−1 food waste)
------9.39.39.39.313.313.3
CO2 equivalents generated (b) (kgCO2e kg−1 food waste)-3.0-0.32-0.76-0.70-0.17 1.1
(a) Due to trucking of waste to landfill. (b) CO2 liberated from composting or from burning of methane is biogenic (non-fossil) so was not included. Values shown are from methane emissions (Scenario 1) or from electricity used during processes (Scenarios 2 to 6). (c) Electrical energy generated from food waste = 1.3 kWh kg−1 COD [32]. (d) WWTP energy usage = 2.8 kWh kg−1 COD, [35].

Appendix B. Sample Calculations

Appendix B.1. Cost Calculations

Appendix B.1.1. Scenario 1: Landfill Base Case)

Appendix B.1.1.1. Required Bin Volume (L week−1)

Required   bin   volume   ( L   week 1 ) = Food   Waste   Weight   ( kg   week 1 ) Density   of   food   waste   ( kg   L 1 ) =   180 / 0.5 =   360

Appendix B.1.1.2. Disposal Cost (USD week−1)

Disposal   Cost   ( USD   week 1 ) =   240 L   Bin   Cost   ( USD   week 1 )   ×   2 =   11.5   ×   2 =   23

Appendix B.1.2. Scenario 5: ADLO with Performance and per US Case Study

Total Cost (USD week−1)

Total   cost   ( USD   week 1 ) =   BioStar   accelerator   cost + Enzyme   cost + Water   cost + Electricity   cost   + Trade   waste   charges = 1.93 + 1.16 + 3.71 + 3.61 + 9.63 = 20.04
(1)
BioStar accelerator Cost (USD week−1)
BioStar   accelerator   cost   ( USD   week 1   ) = Case   study   BioStar   cost   ( USD   week 1 )   ×   ExBio   machine   capacity   ( kg   d 1 ) Case   Study   machine   capacity   ( kg   d 1 ) = 17.54   ×   180 / 1633 = 1.93
(2)
Enzyme Cost (USD week−1)
Enzyme   cost   ( USD   week 1   ) = Case   study   Enzyme   Cost   ( USD   week 1 )   ×   ExBio   machine   capacity   ( kg   d 1 ) Case   Study   machine   capacity   ( kg   d 1 ) = 10.52   ×   180 / 1633 = 1.16
(3)
Electricity Cost (USD week−1)
Electricity   cost   ( USD   week 1   ) = ExBio - 30   machine   electricity   usage   ( kWh   d 1 )   ×   6   ( d   week 1 )   ×   electricity   usage   charge   ( USD   kWh 1 ) = 3.2   ×   6   ×   0.1933 = 3.71
(4)
Water Cost (USD week−1)
Water   cost   ( USD   week 1   ) = ExBio - 30   machine   water   usage   ( kL   d 1 )   ×   6   ( d   week 1 )   ×   water   usage   charge   ( USD   kL 1 ) = 0.278   ×   6   ×   2.16 = 3.61
(5)
Trade Waste Costs
Trade   waste   cost = Volume   cost + BOD   cost + N   cost + SS   cost + Inorganic   TDS   cost = 1.09 + 1.20 + 0.10 + 7.2 + 0.01 = 9.6
  • Trade Waste Volume Cost (USD week−1)
    Volume   cost   ( USD   week 1   ) = ExBio - 30   machine   water   usage   ( kL   d 1 )   ×   6   ( d   week 1 ) ×   Trade   waste   volume   chagre   ( USD   kL 1 ) = 0.278   ×   6   ×   0.653 = 1.09
  • Trade Waste BOD Cost (USD week−1)
    BOD   cost   ( USD   week 1   ) = Food   waste   weight   ( kg   week 1 )   ×   Case   study   BOD   ( kg   BOD   kg   food   waste 1 ) ×   Trade   wate   BOD   charge   ( USD   kg   BOD 1 ) = 180   ×   0.00835   ×   0.80 = 1.20
  • Trade Waste N Cost (USD week−1)
    N   cost   ( USD   week 1   ) = Food   waste   weight   ( kg   week 1 )   ×   Case   study   BOD   ( kg   BOD   kg   food   waste 1 ) ×   literature   Food   Waste   COD : BOD   ratio ×   literature   Food   Waste   COD : N   ratio ×   Trade   wate   N   charge   ( USD   kgN 1 ) = 180   ×   ( 0.00835   ×   2 / 48 )   ×   1.53 = 0.10
  • Trade waste SS Cost (USD week−1)
    SS   cost   ( USD   week 1   ) = Food   waste   weight   ( kg   week 1 )   ×   Case   study   SS   ( kg   SS   kg   food   waste 1 ) ×   Trade   wate   SS   charge   ( USD   kg   SS 1 ) = 180   ×   0.0932   ×   0.43 = 7.2
  • Trade waste TDS cost (USD week−1)
    TDS   cost   ( USD   week 1   ) = Food   waste   weight   ( kg   week 1 )   ×   Case   study   TDS   ( kg   TDS   kg   food   waste 1 ) ×   Trade   wate   TDS   charge   ( USD   kg   TDS 1 ) = 180   ×   0.00376   ×   0.02 = 0.013

Appendix B.2. Energy, Water and CO2 Equivalents Estimates

Appendix B.2.1. Scenario 1: Landfill Base Case

Appendix B.2.1.1. Energy Required (kWh kg−1 Food Waste)

= [Energy for Transport of waste to transfer station] + [Energy for Transport from transfer station to landfill]
Energy   required   ( kWh   kg 1   food   waste ) = [ Truck   energy   consumption   ( kWh   km 1 ) × Distance   to   transfer   station   ( km ) Garbage   truck   capacity   ( kg ) ]   + [ Truck   energy   consumption   ( kWh   km 1 ) × Distance   fom   transfer   station   to   landfill   ( km ) Garbage   truck   capacity   ( kg ) ] = [ 3.699   ×   15 / 24,000 ] + [ 3.699   ×   15 / 24,000 ] = 0.0046

Appendix B.2.1.2. CO2e Generated (kg CO2e kg−1 Food Waste)

CO 2 e   generated   ( kg   CO 2 e   kg 1   food   waste ) = Truck   CO 2 e   ( kg CO 2 e   ( km 1   tonnes 1   of   food   waste ) ×   Distance   travelled   ( km ) = ( 0.2 / 1000 )   ×   30 = 0.006

Appendix B.2.2. Scenario 5: ADLO with Performance and per US Case Study

Net CO2e

Net   CO 2 e = Total   CO 2 e   generated   CO 2 e   saving   due   to   electricity   generation   from food   waste   methane   at   WWTP   ( kg   CO 2 e   kg 1   food   waste ) = 0.17     0.02 = 0.15
(1)
Total CO2e generated (kgCO2e kg−1)
Total   CO 2 e   generated = CO 2 e   generated   from   COD   at   WWTP +   CO 2 e   generated   from   electricity   used   by   ADLO   machine +   CO 2 e   generated   from   electricity   used   to   pump   the   digestate   to   the   WWTP = 0.05 + 0.12 + 6.9   ×   10 4 = 0.17
  • CO2e generated from COD at WWTP (kgCO2e kg−1 food waste)
    = Energy required for treatment at WWTP on COD basis (kWh kg−1 food waste) × indirect (scope 2) CO2e from use of electricity (kg CO2e kWh−1)
    CO 2 e   generated   from   COD   at   WWTP   ( kg CO 2 e   kg 1   food   waste ) = WWTP   Energy   benchmark   ( kWh   kg 1   COD   removed ) ×   COD   of   ORCA   digestate   ( kgCOD   kg 1   food   waste ) ×   indirect   ( scope   2 )   CO 2 e   from   use   of   electricity   ( kg   CO 2 e   kWh 1 ) = 2.8   ×   0.0166   ×   1.08 = 0.0502
  • CO2e generated from electricity used by ADLO machine (kg CO2e kg−1 food waste)
    CO 2 e   generated   from   electricity   used   by   ADLO   machine   ( kg   CO 2 e   kg 1   food   waste ) = ADLO   machine   energy   use   ( kWh   kg 1   food   waste ) ×   indirect   ( scope   2 )   CO 2 e   from   use   of   electricity   ( kg   CO 2 e   kWh 1 ) = 0.11   ×   1.08 = 0.12
  • CO2e generated from electricity used to pump the digestate to the WWTP (kWh L−1)
    CO 2 e   generated   from   electricity   used   to   pump   digestate   to   the   WWTP   ( kWh   L 1 ) = Sewage   pumping   station   energy   usage   ( kWh   L 1 ) ×   Volume   of   water   used   by   ADLO   machine   ( L   kg 1   food   waste ) = 7.5   ×   10 5   ×   9.3 = 6.9   ×   10 4
(2)
CO2e Saving due to Electricity Generation from Food Waste Methane at WWTP (kg CO2e kg−1 Food Waste)
CO 2 e   saving   due   to   electricity   generation   from   food   waste   methane   at   WWTP   ( kg   CO 2 e   kg 1   food   waste ) = Electrical   energy   generated   from   methane   ( kWh   kg 1   COD   removed ) ×   COD   of   ORCA   digestate   ( kgCOD   kg 1 food   waste ) ×   indirect   ( scope   2 )   CO 2 e   from   use   of   electricity   ( kg   CO 2 e   kW ) = 1.29   ×   0.0166   ×   1.08 = 0.02

Appendix B.2.3. Scenario 6

Water Usage (L kg−1 Food Waste)

Water   usage   ( L   kg 1   food   waste ) = Water   usage   per   meal   ( L   meal 1 ) ×   Restaurant   meal   frequency   ( meals   d 1 ) Food   waste   production   rate   ( kg   food   waste   d 1 ) = ( ( 4 / 3 )   ×   ( 30 / 0.1 ) ) / 30 = 13.3
(1)
Water usage per meal (L meal−1)
Water   usage   per   meal   ( L   meal 1 ) = in   sin k   disposal   water   usage   ( L   capita 1   d 1 ) capita   meals   frequency   ( meals   capita 1   d 1 ) = 4 / 3
(2)
Restaurant meal frequency (meals d−1)
Restaurant   meal   frequency   ( meals   d 1 ) = Restaurant   food   waste   production   rate   ( kg   food   waste   d 1 ) Customer   food   waste   production   ( kg   food   waste   meal 1   d 1 ) = 30 / 0.1 = 300

References

  1. Australian Government Department of the Environment and Energy. National Food Waste Strategy: Halving Australia’s Food Waste by 2030. 2017. Available online: https://www.awe.gov.au/sites/default/files/documents/national-food-waste-strategy.pdf (accessed on 16 March 2022).
  2. European Government. European Union Regulation No 517/2014 of the European Parliament and of the Council of 16 April 2014 on Fluorinated Greenhouse Gases Annex IV. 2014. Available online: https://www.eea.europa.eu/policy-documents/regulation-eu-no-517-2014 (accessed on 16 March 2022).
  3. Nisbet, E.G.; Fisher, R.E.; Lowry, D.; France, J.L.; Allen, G.; Bakkaloglu, S.; Broderick, T.J.; Cain, M.; Coleman, M.; Fernandez, J.; et al. Methane Mitigation: Methods to Reduce Emissions, on the Path to the Paris Agreement. Rev. Geophys. 2020, 58, e2019RG000675. [Google Scholar] [CrossRef]
  4. Saunois, M.; Stavert, A.R.; Poulter, B.; Bousquet, P.; Canadell, J.G.; Jackson, R.B.; Raymond, P.A.; Dlugokencky, E.J.; Houweling, S.; Patra, P.K.; et al. The Global Methane Budget 2000–2017. Earth Syst. Sci. Data 2020, 12, 1561–1623. [Google Scholar] [CrossRef]
  5. United Nations Environment Programme and Climate and Clean Air Coalition. Global Methane Assessment: Benefits and Costs of Mitigating Methane Emissions; United Nations Environment Programme: Nairobi, Kenya, 2021; ISBN 978–92–807–3854–4. [Google Scholar]
  6. Iqbal, A.; Ekama, G.A.; Zan, F.; Liu, X.; Chui, H.-K.; Chen, G.-H. Potential for co-disposal and treatment of food waste with sewage: A plant-wide steady-state model evaluation. Water Res. 2020, 184, 116175. [Google Scholar] [CrossRef]
  7. Iacovidou, E.; Ohandja, D.-G.; Voulvoulis, N. Food waste co-digestion with sewage sludge e Realising its potential in the UK. J. Environ. Manag. 2012, 112, 267–274. [Google Scholar] [CrossRef] [PubMed]
  8. Victorian Government. Metropolitan Waste and Resource Recovery Plan 2016. 2016. Available online: https://www.mwrrg.vic.gov.au/assets/resource-files/Web-Metro-Implementation-Plan.pdf (accessed on 16 March 2022).
  9. Schultz, J. Fighting Food Waste. National Congress of State Legislature. 2017. Available online: https://www.ncsl.org/research/agriculture-and-rural-development/fighting-food-waste.aspx (accessed on 16 March 2022).
  10. European Environment Agency. Bio-Waste in Europe—Turning Challenges into Opportunities. EEA Report No 04/2020. 2020. Available online: https://www.eea.europa.eu/publications/bio-waste-in-europe (accessed on 16 March 2022).
  11. Mitchelmore, P. Degrave Street Recycling Facility MF-R1 Final Report. Melbourne Metropolitan Government. 2015. Available online: https://www.mwrrg.vic.gov.au/assets/resource-files/Degraves-Street-Recycling-MF-R1-Final-Report-Melbourne.pdf (accessed on 16 March 2022).
  12. Griffiths-Onnen, I.; Patten, Z.; Wong, J. On-Site Systems for Processing Food Waste: A Report to the Massachusetts Department of Environmental Protection. 2013. Available online: https://www.mass.gov/doc/report-on-site-systems-for-processing-food-waste-april-2013/download (accessed on 16 March 2022).
  13. American Institute of Architects (AIA). Zero Waste Design Guidelines: Design Strategies and Case Studies for a Zero Waste City. 2017. Available online: https://www.zerowastedesign.org/wp-content/uploads/2017/10/ZeroWasteDesignGuidelines2017_Web.pdf (accessed on 16 March 2022).
  14. EXBIO Waste Management Solutions UK. Available online: http://exbiouk.com/ (accessed on 16 March 2022).
  15. Innovative Clean Waste Technology—ORCA. 2020. Available online: https://www.feedtheorca.com/ (accessed on 16 March 2022).
  16. DeHaghin, M. Food Waste Liquefier Orca Green. Master’s Thesis, California State University, Northridge, CA, USA, 2013. Available online: https://scholarworks.csun.edu/bitstream/handle/10211.2/5166/DeHaghin-Maryam-thesis-2014.pdf?sequence=1 (accessed on 16 March 2022).
  17. Fey, C.; Chadderton, C.; Rodriguez, G.; Gilbert, D.; Urban, A.; Foran, C.M. Organic Waste Diversion Guidance for U.S. Army Installations. Final Technical Report. 2016. Available online: https://usace.contentdm.oclc.org/digital/api/collection/p266001coll1/id/3955/download (accessed on 16 March 2022).
  18. Graunke, R.E.; Wilkie, A.C. Examining the mechanisms of short-term solubilization of ground food waste for high-rate anaerobic digestion. Biodeterior. Biodegrad. 2014, 86, 327–333. [Google Scholar] [CrossRef]
  19. Kwon, S.H.; Lee, D.H. Evaluation of Korean food waste composting with fed-batch operations I: Using water extractable total organic carbon contents (TOCw). Process Biochem. 2004, 39, 1183–1194. [Google Scholar] [CrossRef]
  20. Xe Currency Converter. Available online: https://www.xe.com/currencytables/ (accessed on 16 March 2022).
  21. Coinnews Media Group Inflation Calculator. Available online: https://www.usinflationcalculator.com/ (accessed on 22 March 2022).
  22. City West Water. Trade Waste Charges Explained. Available online: https://www.citywestwater.com.au/business/trade_waste/trade_waste_charges_explained (accessed on 16 March 2022).
  23. Australian Government—Department of Agriculture Water and the Environment. National Waste Policy—Less Waste, More Resources. 2018. Available online: https://www.awe.gov.au/environment/protection/waste/how-we-manage-waste/national-waste-policy (accessed on 12 March 2022).
  24. City West Water. Trade Waste Acceptance Criteria. Available online: https://www.westernwater.com.au/assets/volumes/general-downloads/trade-wate-acceptance-criteria.pdf (accessed on 16 March 2022).
  25. The Mechanical Stomach: Iugis. Waste Management Review. 18 December 2019. Available online: https://wastemanagementreview.com.au/the-mechanical-stomach-iugis/ (accessed on 16 March 2022).
  26. Stokehouse Restaurant. Available online: https://stokehouse.com.au/melbourne/sustainability/ (accessed on 16 March 2022).
  27. Coles Group. Coles Sustainability Report 2019. 2019. Available online: https://www.colesgroup.com.au/FormBuilder/_Resource/_module/ir5sKeTxxEOndzdh00hWJw/file/Coles_Sustainability_Report_2019.pdf (accessed on 16 March 2022).
  28. Sustainability Allies: Veolia. Waste Management Review. 16 July 2019. Available online: https://wastemanagementreview.com.au/sustainability-allies/ (accessed on 16 March 2022).
  29. Turning Waste into Water in the City of Melbourne. Waste Management Review. 2018. Available online: https://wastemanagementreview.com.au/turning-waste-water-city-melbourne/ (accessed on 16 March 2022).
  30. ExBio Ex-Series Catalogue. Available online: http://exbiouk.com/catalogue/ (accessed on 16 March 2022).
  31. Stantec Consulting. Impact of Food Waste Disposal on WWTP. Final Report to the Town of Canmore. 2017. Available online: https://canmore.ca/documents/2270-2017-impact-of-food-waste-disposal-on-wwtp (accessed on 17 March 2022).
  32. Khanal, S.K. Anaerobic Biotechnology for Bioenergy Production: Principles and Applications; John Wiley & Sons Inc.: Hoboken, NJ, USA, 2008; ISBN 978-0-813-82346-1. [Google Scholar]
  33. Moult, J.A.; Allan, S.R.; Hewitt, C.N.; Berners-Lee, M. Greenhouse gas emissions of food waste disposal options for UK retailers. Food Policy 2018, 77, 50–58. [Google Scholar] [CrossRef] [Green Version]
  34. Zhang, H.J.; Matsuto, T. Comparison of mass balance, energy consumption and cost of composting facilities for different types of organic waste. Waste Manag. 2011, 31, 416–422. [Google Scholar] [CrossRef] [PubMed]
  35. De Haas, D.; Appleby, G.; Charakos, G.; Dinesh, N.B. Benchmarking Energy Use for Wastewater Treatment Plants: A summary of the 2015–16 benchmarking study. Online J. Aust. Water Assoc. 2018, 3, 1–26. [Google Scholar] [CrossRef]
  36. Melbourne Water. Western Treatment Plant Sewage Treatment Process. 2021. Available online: https://fdocuments.net/document/benchmarking-energy-use-for-wastewater-treatment-the-wastewater-data-ow-and-concentration.html?page=1 (accessed on 17 March 2022).
  37. Melbourne Water. Our Path to Net Zero. 2021. Available online: https://www.melbournewater.com.au/water-data-and-education/environmental-issues/our-path-net-zero (accessed on 17 March 2022).
  38. Kim, Y.; Bothi, K.; Cha, D.; Chajes, M.; Aukam, R. Life Cycle Assessment of BioHiTech Digester for Food Waste Management, Department of Civil and Environmental Engineering University of Delaware Newark, Delaware 19716. Available online: https://renovareenv.com/wp-content/uploads/2020/11/LCA.pdf (accessed on 1 August 2018).
  39. Edwards, J.; Othman, M.; Crossin, E.; Burn, S. Life cycle assessment to compare the environmental impact of seven contemporary food waste management systems. Bioresour. Technol. 2018, 248, 156–173. [Google Scholar] [CrossRef] [PubMed]
  40. Jin, P.; Gu, Y.; Shi, X.; Yang, W. Non-negligible greenhouse gases from urban sewer system. Biotechnol. Biofuels 2019, 12, 100. [Google Scholar] [CrossRef] [PubMed] [Green Version]
  41. Analysis of Small Business Retail Energy Bills in Australia, Final Report. Alviss Consulting. June 2018. Available online: https://energyconsumersaustralia.com.au/wp-content/uploads/SME-Retail-Tariff-Tracker-Final-Report-June-2018.pdf (accessed on 17 March 2022).
  42. Waster Pty Ltd. 240 Litre General Waste Bin Service. Available online: https://waster.com.au/product/240-litre-general-waste-bin-service/ (accessed on 17 March 2022).
  43. Waster Pty Ltd. 120 Litre Organic Bin Service. Available online: https://waster.com.au/product/120-litre-organics-bin-service (accessed on 17 March 2022).
  44. Kumar, M.; Ou, Y.-L.; Lin, J.-G. Co-composting of green waste and food waste at low C/N ratio. Waste Manag. 2010, 30, 602–609. [Google Scholar] [CrossRef] [PubMed]
  45. McAdams, B.; von Massow, M.; Gallant, M.; Hayhoe, M.A. A cross industry evaluation of food waste in restaurants. J. Foodserv. Bus. Res. 2019, 22, 449–466. [Google Scholar] [CrossRef]
  46. Insinkerator Worldwide. Evolution 200 Disposer. Available online: https://www.insinkerator-worldwide.com/product/evolution-200-disposer (accessed on 17 March 2022).
  47. Kim, M.; Chowdhury, M.M.I.; Nakhla, G.; Keleman, M. Characterization of typical household food wastes from disposers: Fractionation of constituents and implications for resource recovery at wastewater treatment. Bioresour. Technol. 2015, 183, 61–69. [Google Scholar] [CrossRef] [PubMed]
  48. Waste Recycling Action Program (WRAP). Summary Report—Material Bulk Densities, Report Prepared by Resource Futures. 2009. Available online: http://docplayer.net/20954269-Material-bulk-densities.html (accessed on 17 March 2022).
  49. Transport and Environment. Truck-CO2-Emissions-2030. 2015. Available online: https://www.transportenvironment.org/discover/too-big-ignore-truck-co2-emissions-2030/ (accessed on 17 March 2022).
  50. Beer, T.; Grant, T.; Morgan, G.; Lapszewicz, J.; Anyon, P.; Edwards, J.; Nelson, P.; Watson, H.; Williams, D. Comparison of Transport Fuels, Final Report (EV45A/2/F3C) to the Australian Greenhouse Office on the Stage 2 study of Life-cycle Emissions Analysis of Alternative Fuels for Heavy Vehicles, Australia. 2001. Available online: http://www.fischer-tropsch.org/DOE/DOE_reports/ev45a_2_f3c/ev45a_2_f3c_toc.pdf (accessed on 17 March 2022).
  51. Banks, C.J.; Heaven, S.; Zhang, Y.; Baier, U. Food Waste Digestion: Anaerobic Digestion of Food Waste for a Circular Economy; Murphy, J.D., Ed.; IEA Bioenergy: Paris, France, 2018; ISBN 978-1-910154-57-1. [Google Scholar]
  52. City of Melbourne. Guidelines for Preparing a Waste Management Plan 2017. Available online: https://www.melbourne.vic.gov.au/sitecollectiondocuments/waste-management-plan-guidelines.pdf (accessed on 17 March 2022).
  53. Banks, C.; Chesshire, M.; Heaven, S.; Arnold, R.; Lewis, L. Biocycle anaerobic digester: Performance and benefits. In Proceedings of the Institution of Civil Engineers; Issue WR3; ICE Publishing: London, UK, 2011; pp. 141–150. [Google Scholar] [CrossRef]
Figure 1. Comparison of major considered input and output types for food waste diversion scenarios (4 and 5) and landfill disposal.
Sustainability 14 06753 g001
Figure 2. Waste management cost to the waste producer (USD week−1) for the different scenarios. Scenario 1: landfill, Scenario 2: centralized composting, Scenario 3: centralized composting of dehydrated food waste, Scenario 4: ADLO with poor performance, Scenario 5: ADLO with ORCA case study performance, Scenario 6: in-sink grinder disposal.
Sustainability 14 06753 g002
Figure 3. Net CO2 equivalents emissions per kg of food waste for landfills (Scenario 1) or centralized composting (Scenario 2), centralized composting of dehydrated food waste (Scenario 3) and food waste or diversion to WWTP as a result of using ADLO (Scenarios 4 and 5) or in-sink disposal (Scenario 6).
Sustainability 14 06753 g003
Table 1. Trade waste acceptance limits and expected effluent quality for Scenarios 4 and 5.
ParameterAcceptance Criteria LimitScenario 4Scenario 5
(Orca Digestate [17])
pH6–105.1 (a)4.2
SS (mg L−1)10,00097,00067,000
Nitrogen (mg L−1 TNK)5003333286 (b)
BOD (mg L−1)400070,0006000
(a) Assumed to be close to original pH of food waste as this scenario represents poor digester performance. (b) Assuming COD:BOD ratio of two and COD:N ratio of 42.
Table 2. Costs estimates and simple payback period, 30 kg d−1 food waste.
ScenarioApproximate Equipment Cost
(USD)
Simple Payback Period (yr)
Base Case: Landfill
(Scenario 1)
Base Case: Centralized Composting
(Scenario 2)
3: (dehyd.+compost)20,000np *18
4: (ADLO worst case)7500npnp
5: (ADLO best case)7500484
6: (in-sink disposal)1200npnp
* np: no payback period, scenario more costly than base case.
Publisher’s Note: MDPI stays neutral with regard to jurisdictional claims in published maps and institutional affiliations.

