Article

Flood Risk Analysis by Building Use in Urban Planning for Disaster Risk Reduction and Climate Change Adaptation

1
Korea Adaptation Center for Climate Change, Korea Environment Institute, Sejong 30121, Korea
2
Department of Big Data, Chungbuk National University, Cheongju 28644, Korea
3
School of Civil Engineering, Chungbuk National University, Cheongju 28644, Korea
*
Author to whom correspondence should be addressed.
Sustainability 2021, 13(23), 13006; https://doi.org/10.3390/su132313006
Submission received: 18 October 2021 / Revised: 18 November 2021 / Accepted: 18 November 2021 / Published: 24 November 2021
(This article belongs to the Topic Urban Mitigation and Adaptation to Climate Change)

Abstract

:
In this study, focusing on buildings as the smallest unit of urban space, the distribution characteristics of risk factors were examined by building use as an adaptable measure for urban flooding disasters. Flood risk is calculated as a function of hazard, exposure, and vulnerability. The flood risk for a building was classified into five classes, and the distribution characteristics of buildings were examined according to England’s flood risk vulnerability classification system, known as Planning Policy Statement 25 (PPS25). After analyzing the risk of flooding in Ulsan Metropolitan City, one of Korea’s representative urban areas, it was found that while Dong-gu District can be considered relatively safe, districts of Jung-gu and Nam-gu, as well as Ulju-gun, have highly vulnerable buildings with red and orange ratings, which include motor vehicles-related facilities, education and welfare facilities, and residential facilities. There has been evidence to prove that urban flood disaster affects topography and the environment, in addition to having a significant effect on adaptability depending on the facility groups that resulted from urbanization. This study is expected to serve as a scientific database for disaster risk reduction and climate change adaptation to floods during land-use planning, which would eventually allow for systematic management of high-risk buildings through verification of location suitability of buildings by facility group.

1. Introduction

Climatological, meteorological, and hydrological hazards have been increasing in magnitude and frequency due to climate change (i.e., temperature, precipitation, and humidity) [1]. The frequency of climate-induced disasters (CIDs) has tripled in the last three decades, driving the World Economic Forum to identify them as the most likely and most impactful risks worldwide [2]. Recently, global research shows that flood hazard has become the most common disaster that may bring more harmful effects than other disasters such as earthquakes and typhoons [3]. In the United States, flooding had devastating impacts on communities in terms of social and economic aspects over the last couple of decades [4]. Flooding has the greatest proportion of the presidential disaster declarations [5]. One-third of the economic losses due to natural hazards in Europe are related to flooding, one of the most frequent hazards with windstorms [6].
“Understanding disaster risk” is the first priority for the action of the Sendai Framework for Disaster Risk Reduction 2015–2030 [7], endorsed by the Member States of the United Nations in 2015, with the aim of “preventing new and reduce existing disaster risk”. Disaster risk reduction and management need to be based on understanding disaster risk in all its dimensions of hazard characteristics, exposure, vulnerability, the capacity of people and assets, and the environment [8]. As the world further acknowledges the importance of adaptive capacity, the Paris Agreement and Sendai Framework have been adopted, and the significance of disaster risk reduction strategies is becoming increasingly important [7]. With more than 70% of the world population expected to be living in cities by 2050, ensuring the resilience of urban infrastructure systems under climate-induced disasters is crucial [2].
Land development usually results in increased impervious surfaces, known as the main cause of increased urban surface runoff [9], discharge of higher peak [10], faster runoff reaction [11], and alteration of the hydrological regimes and the water balance in general [12]. Particularly, Hu et al. [13] revealed that change in surface runoff is most strongly related to changes on impervious surfaces when compared with the changes in runoff related to other types of land use [14]. The change in runoff coefficients after urban development due to the increase in impervious areas is shown in Figure 1. The pre-development line expresses the change in the runoff coefficient before urban development, and the post-development line expresses the change in the runoff coefficient after urban development. Prior to development, the change rate of runoff coefficient increased slightly. The runoff rate declined as the rainfall increased, but the change rate of the runoff coefficient was larger due to the increase in impervious areas due to development. In short, in impermeable areas of the development area, the runoff coefficient increases during short-term heavy rains, which puts a heavy burden on the stormwater drainage pipes [15].
With the population becoming concentrated in urban spaces due to urbanization, land and buildings have been intensively used. As a result, in urban development, designers and planners have focused on convenience and efficiency, leading to a natural increase in impervious surfaces. Consequently, the damage from urban flooding is becoming increasingly complex and diversified. Moreover, traditional disaster prevention measures have limitations. Therefore, the need for planning measures that can be adapted to the urban has been emphasized.
Adaptation and mitigation have generally been treated as two separate issues, both in public politics and in practice; mitigation is considered the attenuation of the cause, and studies of adaption deal with the consequences of climate change [17]. Based on the 2015 Paris Agreement, the international community is demanding preventive policies to adapt to climate change and minimize losses and damages, so we are aligning our direction with climate change. Accordingly, disaster risk reduction (DRR) and climate change adaptation (CCA) strategies through flood risk assessment are required to protect land and buildings.
The purpose of improving the adaptability of cities is to restore and maintain the functions of the natural circulation system disturbed by urbanization. Since cities are growing rapidly, disasters occur frequently and can easily become social problems when combined with complex social structures. The primary purpose of this study is to support decision making for urban planning and climate change adaptation measures by classifying flood risk according to the use of buildings and determining the priority of risky buildings. In other words, it strives to accurately identify urban areas with high flood risk and classify high and low-vulnerability facilities in these areas so that flood risk could be minimized through systematic management and adaptation, along with formulating effective measures.

2. Materials and Methods

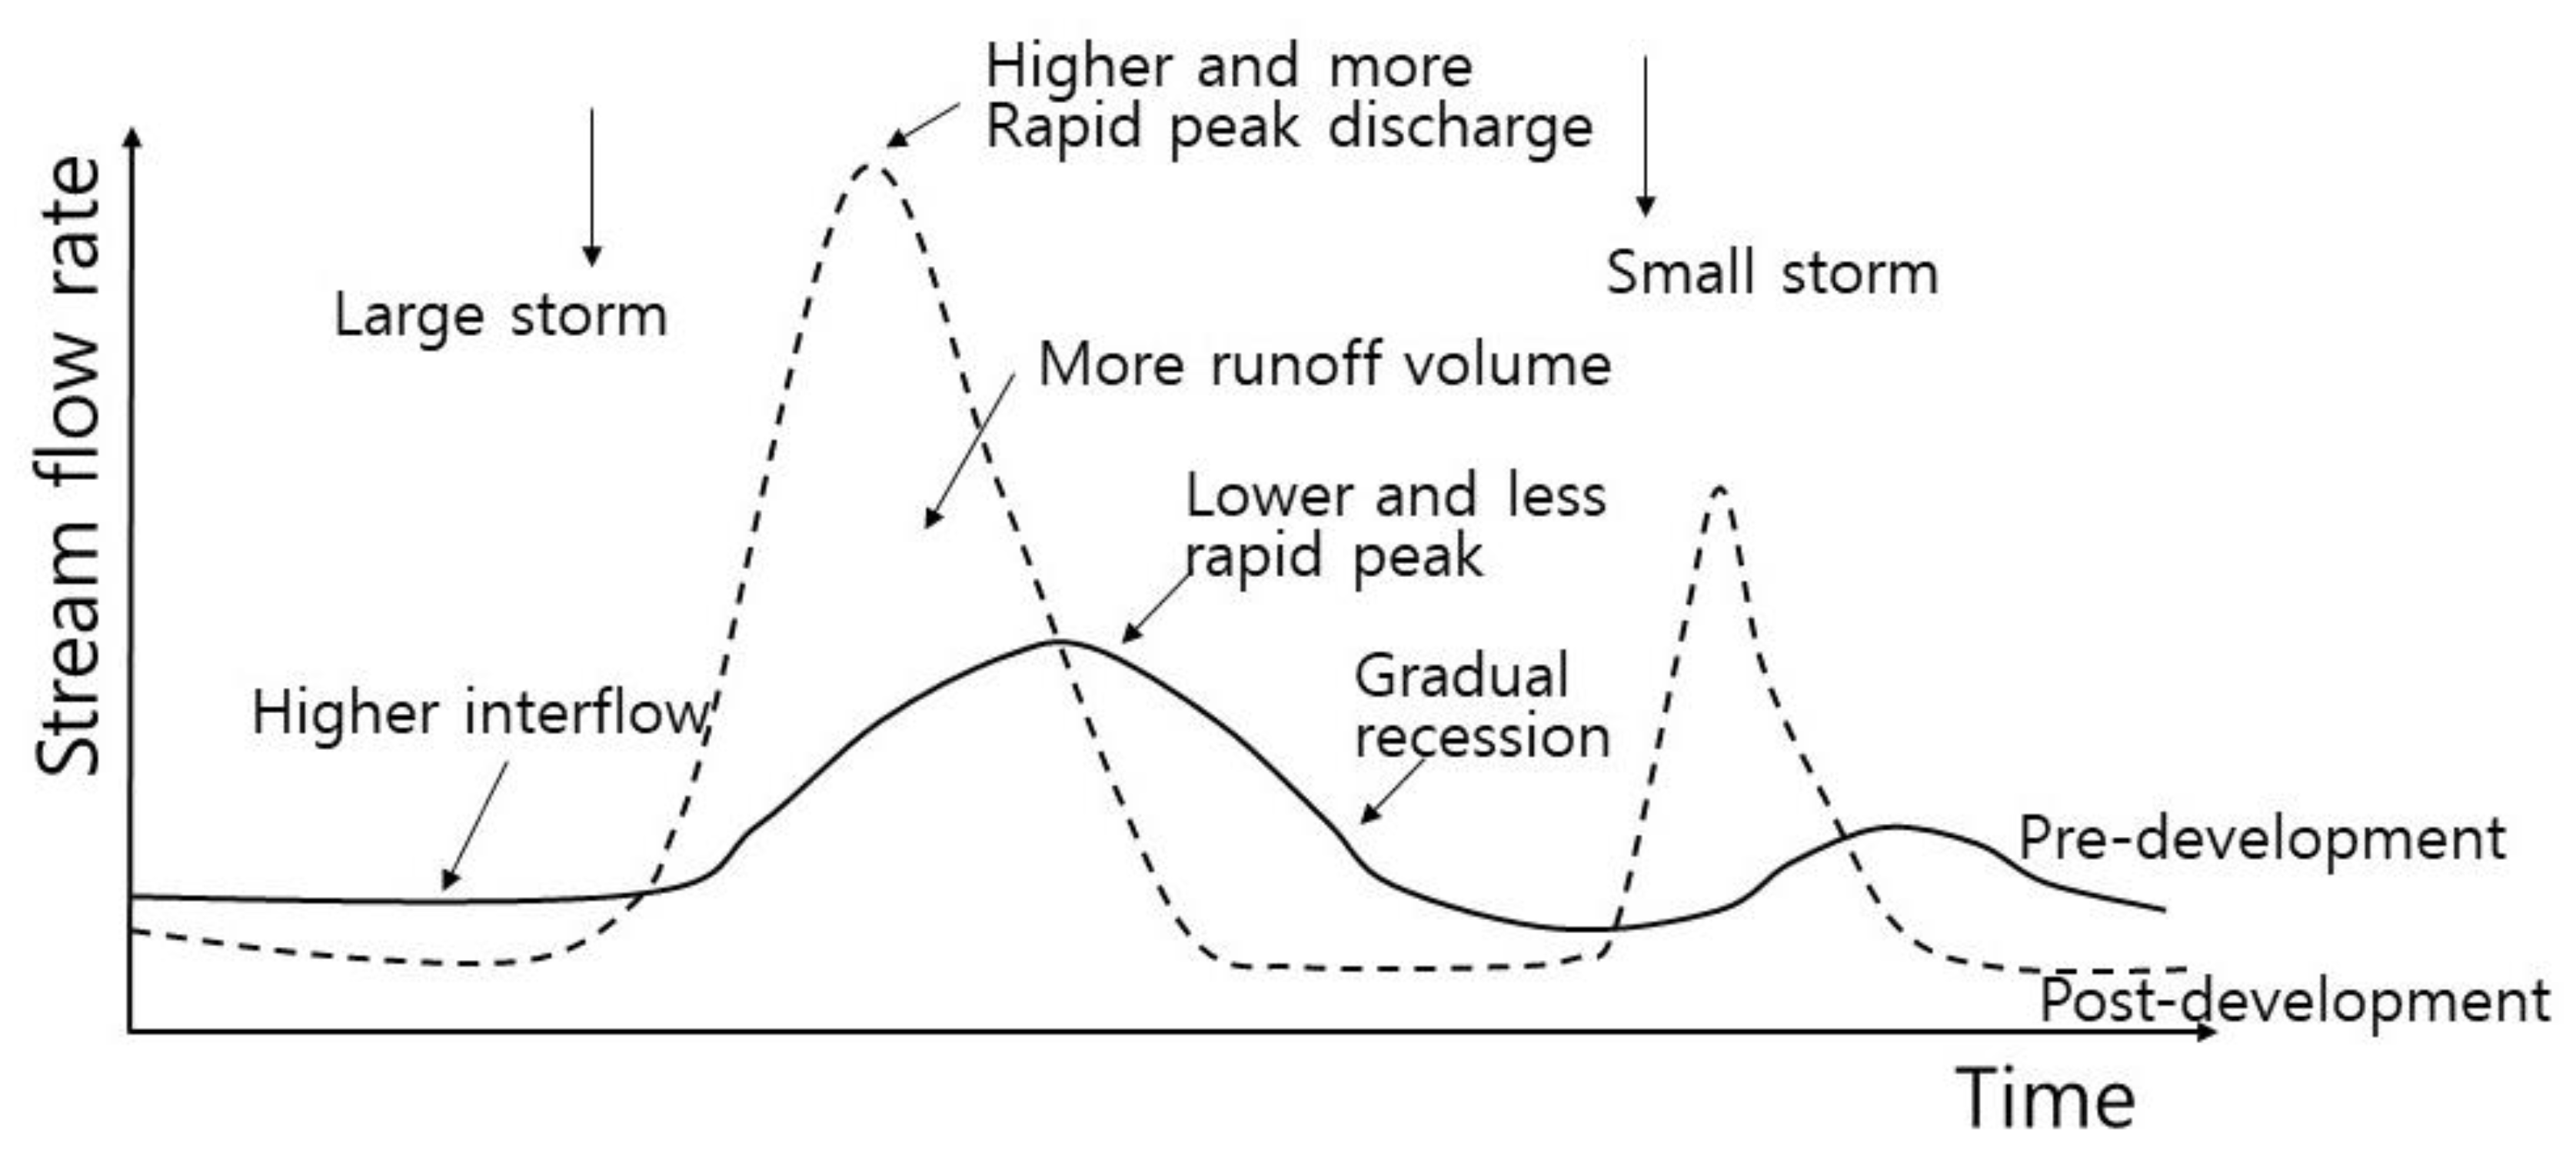
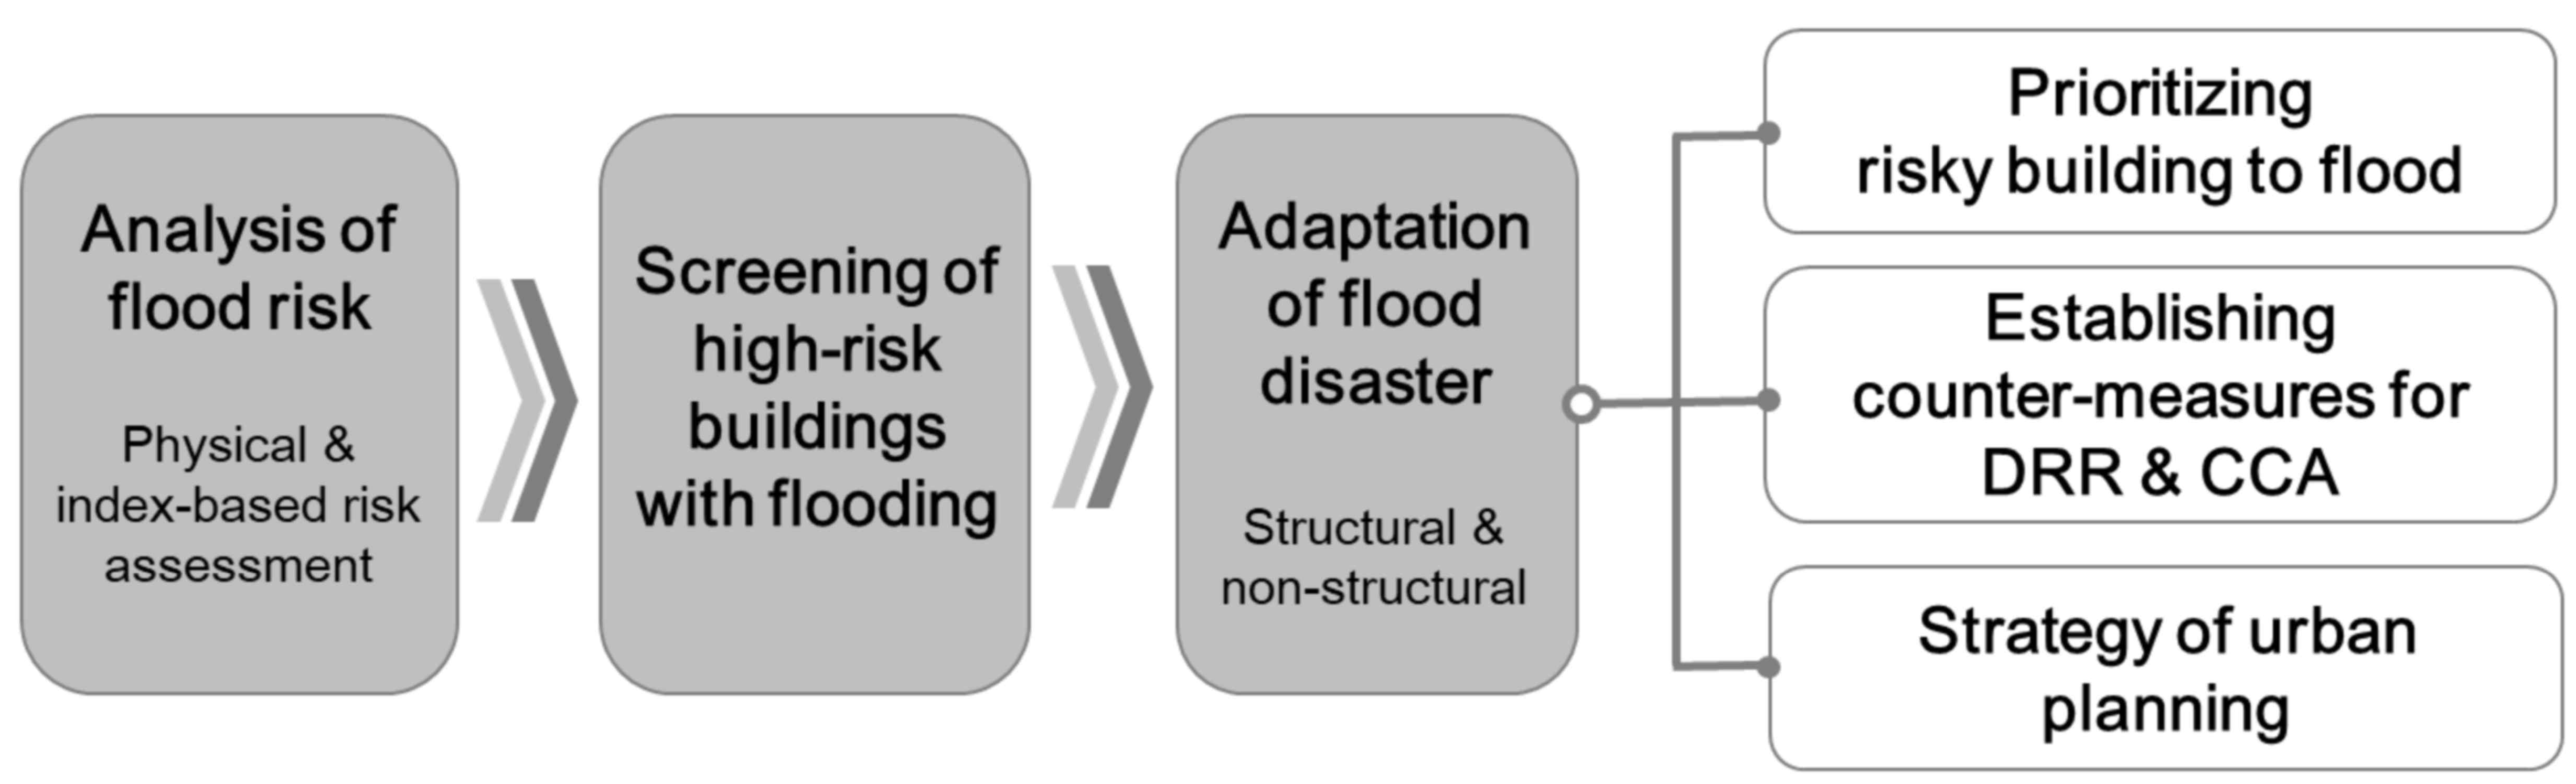
2.1. Adaptation to Cope with Urban Flood Disaster
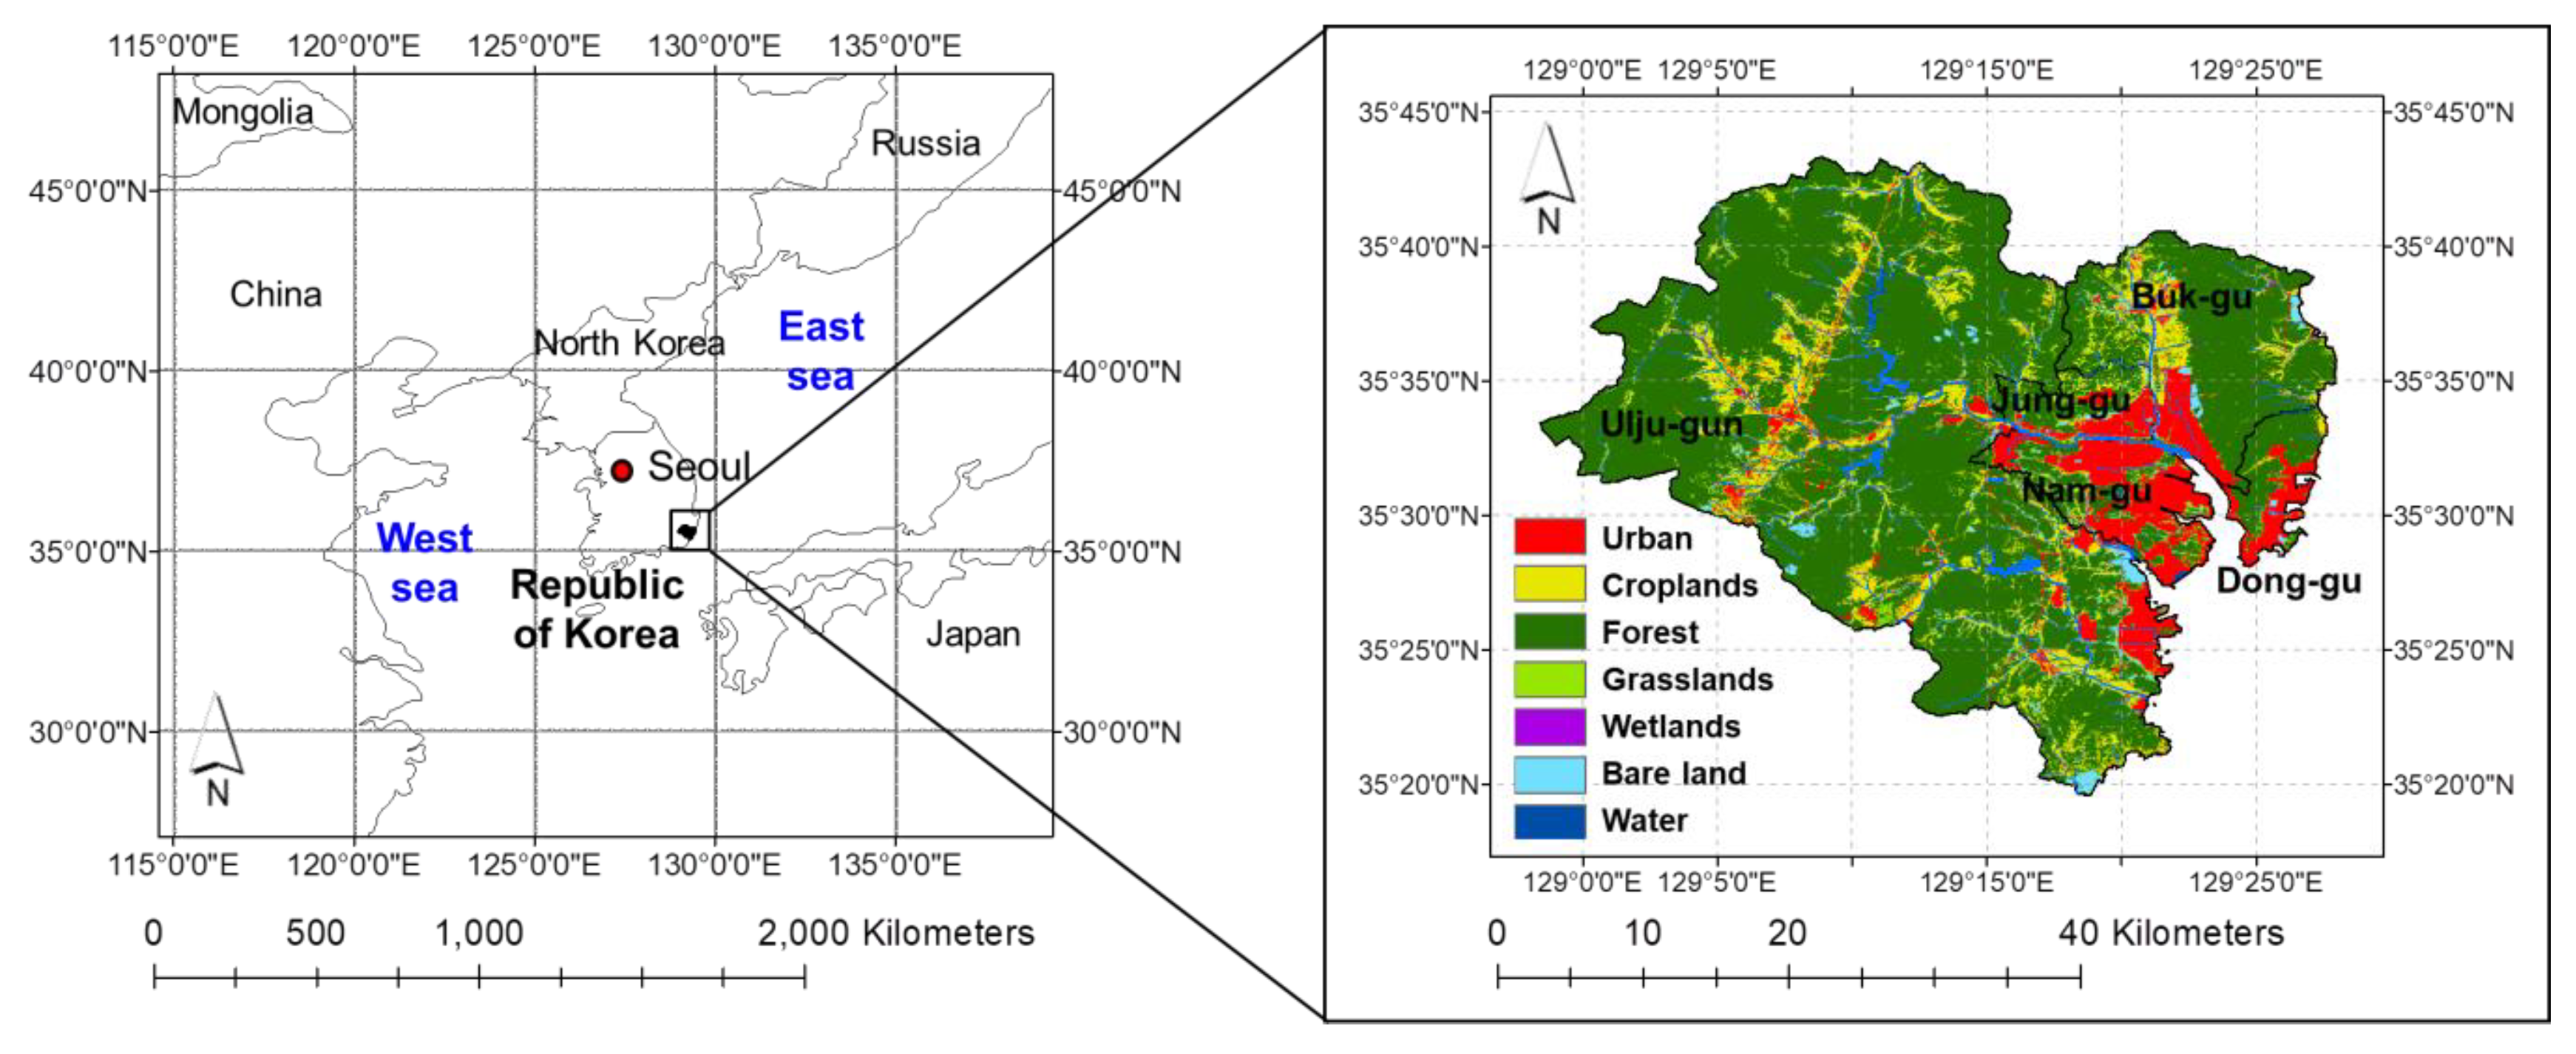
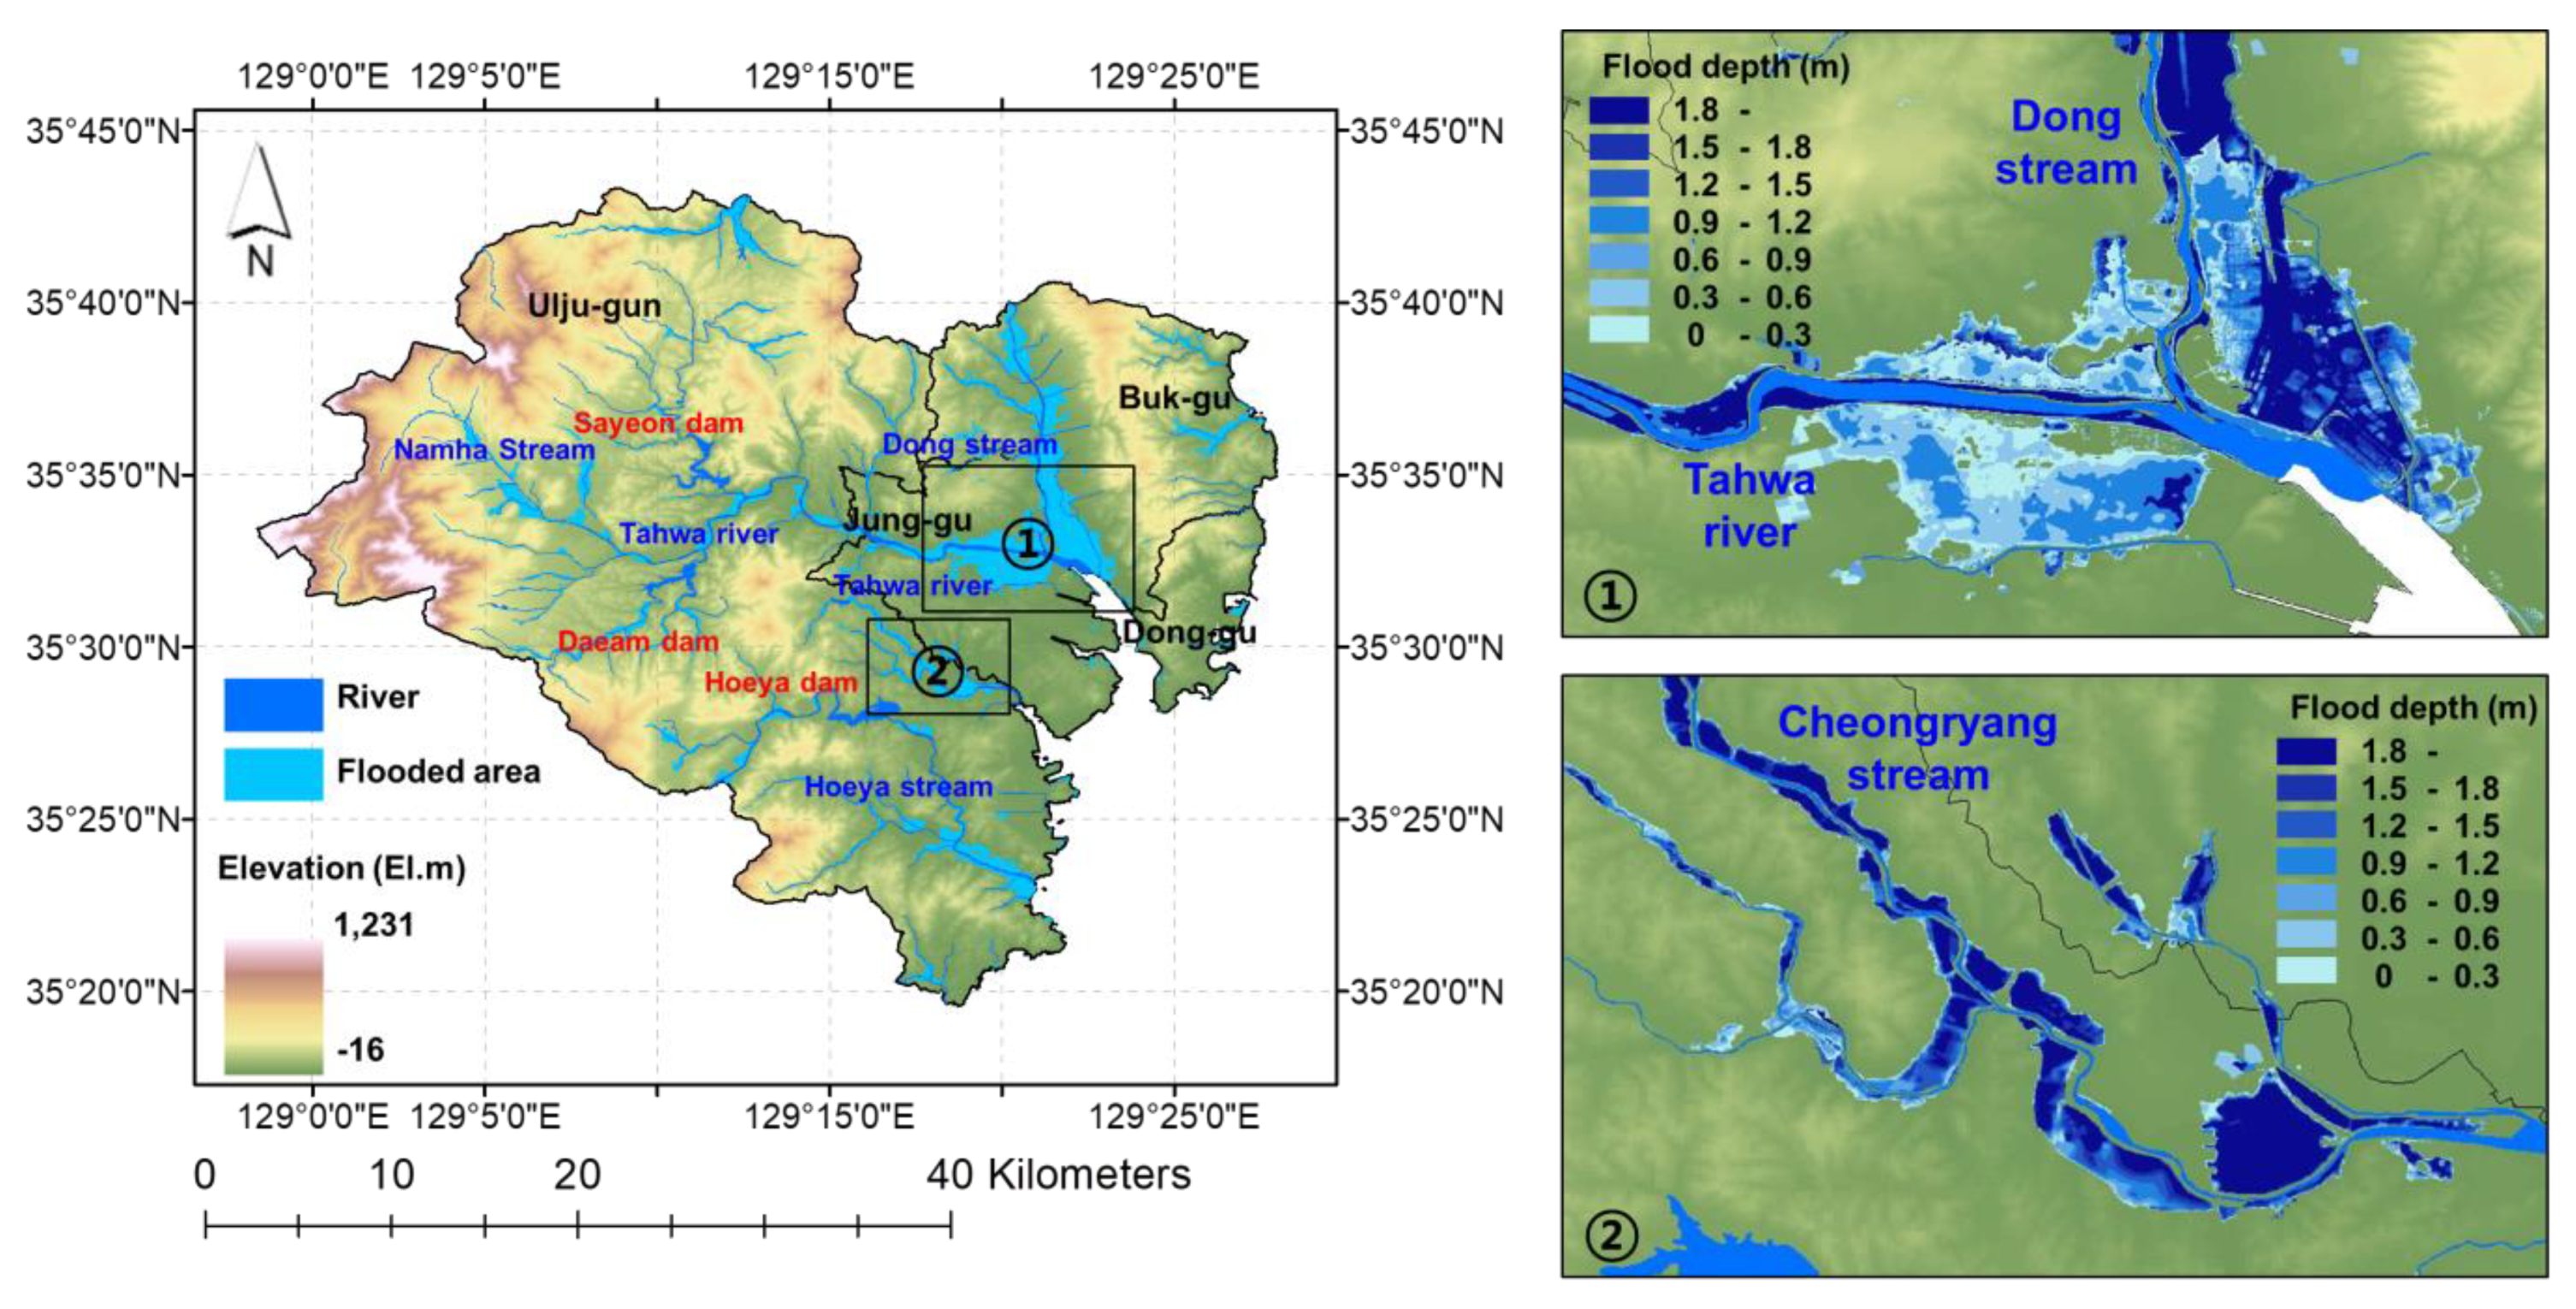
The response to climate change refers to the implementation of preventive measures to stop or minimize climate change and reduce disaster risk from its negative effects. To combat climate change, the international community has proposed two response strategies in the “United Nations Framework Convention on Climate Change”: mitigation and adaptation. While the former aims to mitigate the progress of climate change by limiting greenhouse gas emissions and increasing sinks, the latter seeks to alleviate the adverse effects of climate change and enhance resilience. Mitigation is an approach focused on measures to control and block the causes of climate change in advance, such as curtailing carbon emissions or securing carbon absorption capabilities that existing low-carbon cities are aiming for. In contrast, adaptation is a more comprehensive approach in that it focuses on measures to cope with abnormal weather conditions caused by greenhouse gases and the resulting natural disasters, taking into account mitigation as well as adaptation aspects, such as ways to respond to heavy rains, heat waves, and droughts caused by climate change [18].
Cities with high adaptability can be considered less risky to disasters caused by climate change and have relatively safe systems. Improving such adaptability requires identifying potential risk factors, understanding a society’s ability to respond to those risks, and setting policy directions based on that information. In order to improve adaptability to climate change and build a disaster-safe city, urban planning strategies should be systematically established, as shown in Figure 2. Urban planning for climate change adaptation and disaster risk reduction minimizes flood risk by preparing urban planning measures, along with structural measures for disaster-prone areas, which are identified by risk analysis.
Urban planning for climate change adaptation offers ways to establish a city that is safe from disasters, through the application of urban planning techniques such as land use, infrastructure, and buildings. Land use measures refer to measures for the spatial arrangement, the layout of uses, and the creation of buffer zones in consideration of the characteristics and risks associated with disasters. Infrastructure measures aim at reducing disaster effects by reviewing location and disaster prevention performance (penetration, undercurrent, etc.) necessary for installing existing infrastructure. Building measures aim to strengthen the disaster prevention function of buildings by utilizing construction sites, structures, and facilities.
The urban planning for climate change adaptation as a long-term measure involves making efforts to change natural and human systems to suit the changing environment. In other words, its goal is to reduce or minimize adverse impacts by predicting damage and risks from climate change and to actively increase adaptability to urban components such as space, land, and facilities to a higher level. Since climate change occurs over a long time and is accompanied by uncertainty, efforts to mitigate climate change through greenhouse gas reduction are not enough. Without a proper adaptation plan and action, it is practically impossible to avoid the adverse effects of climate change that are already occurring and affecting the world. Therefore, appropriate adaptation and planning are crucial to reduce risk and increase resilience by predicting changes that will occur in the future based on the current situation. In light of this, the adaptation elements of climate change, along with mitigation elements, are essential for climate change response. This study identified high-risk buildings, determined by building use whether buildings with high vulnerability were clustered, and analyzed buildings that require facility reinforcement, urban planning strategies, and adaptation systems.

2.2. Study Area

Typhoon Chaba caused the deaths of 3 people and approximately 61 million USD of property damage in October 2016 in Ulsan Metropolitan City, Republic of Korea [19]. Recently, Ulsan Metropolitan City has experienced widespread flood damage in areas such as farming, urban, national streams, local streams, and coastal areas, and has hydrological and geographical conditions that are vulnerable to flood disaster [15]. Therefore, as shown in Figure 3, Ulsan Metropolitan City was decided as the target location of this paper. Ulsan Metropolitan City is divided into five administrative districts namely, Buk-gu, Nam-gu, Jung-gu, Dong-gu, and Ulju-gun [20]. It experiences a considerable amount of rain and has climatic conditions vulnerable to floods.

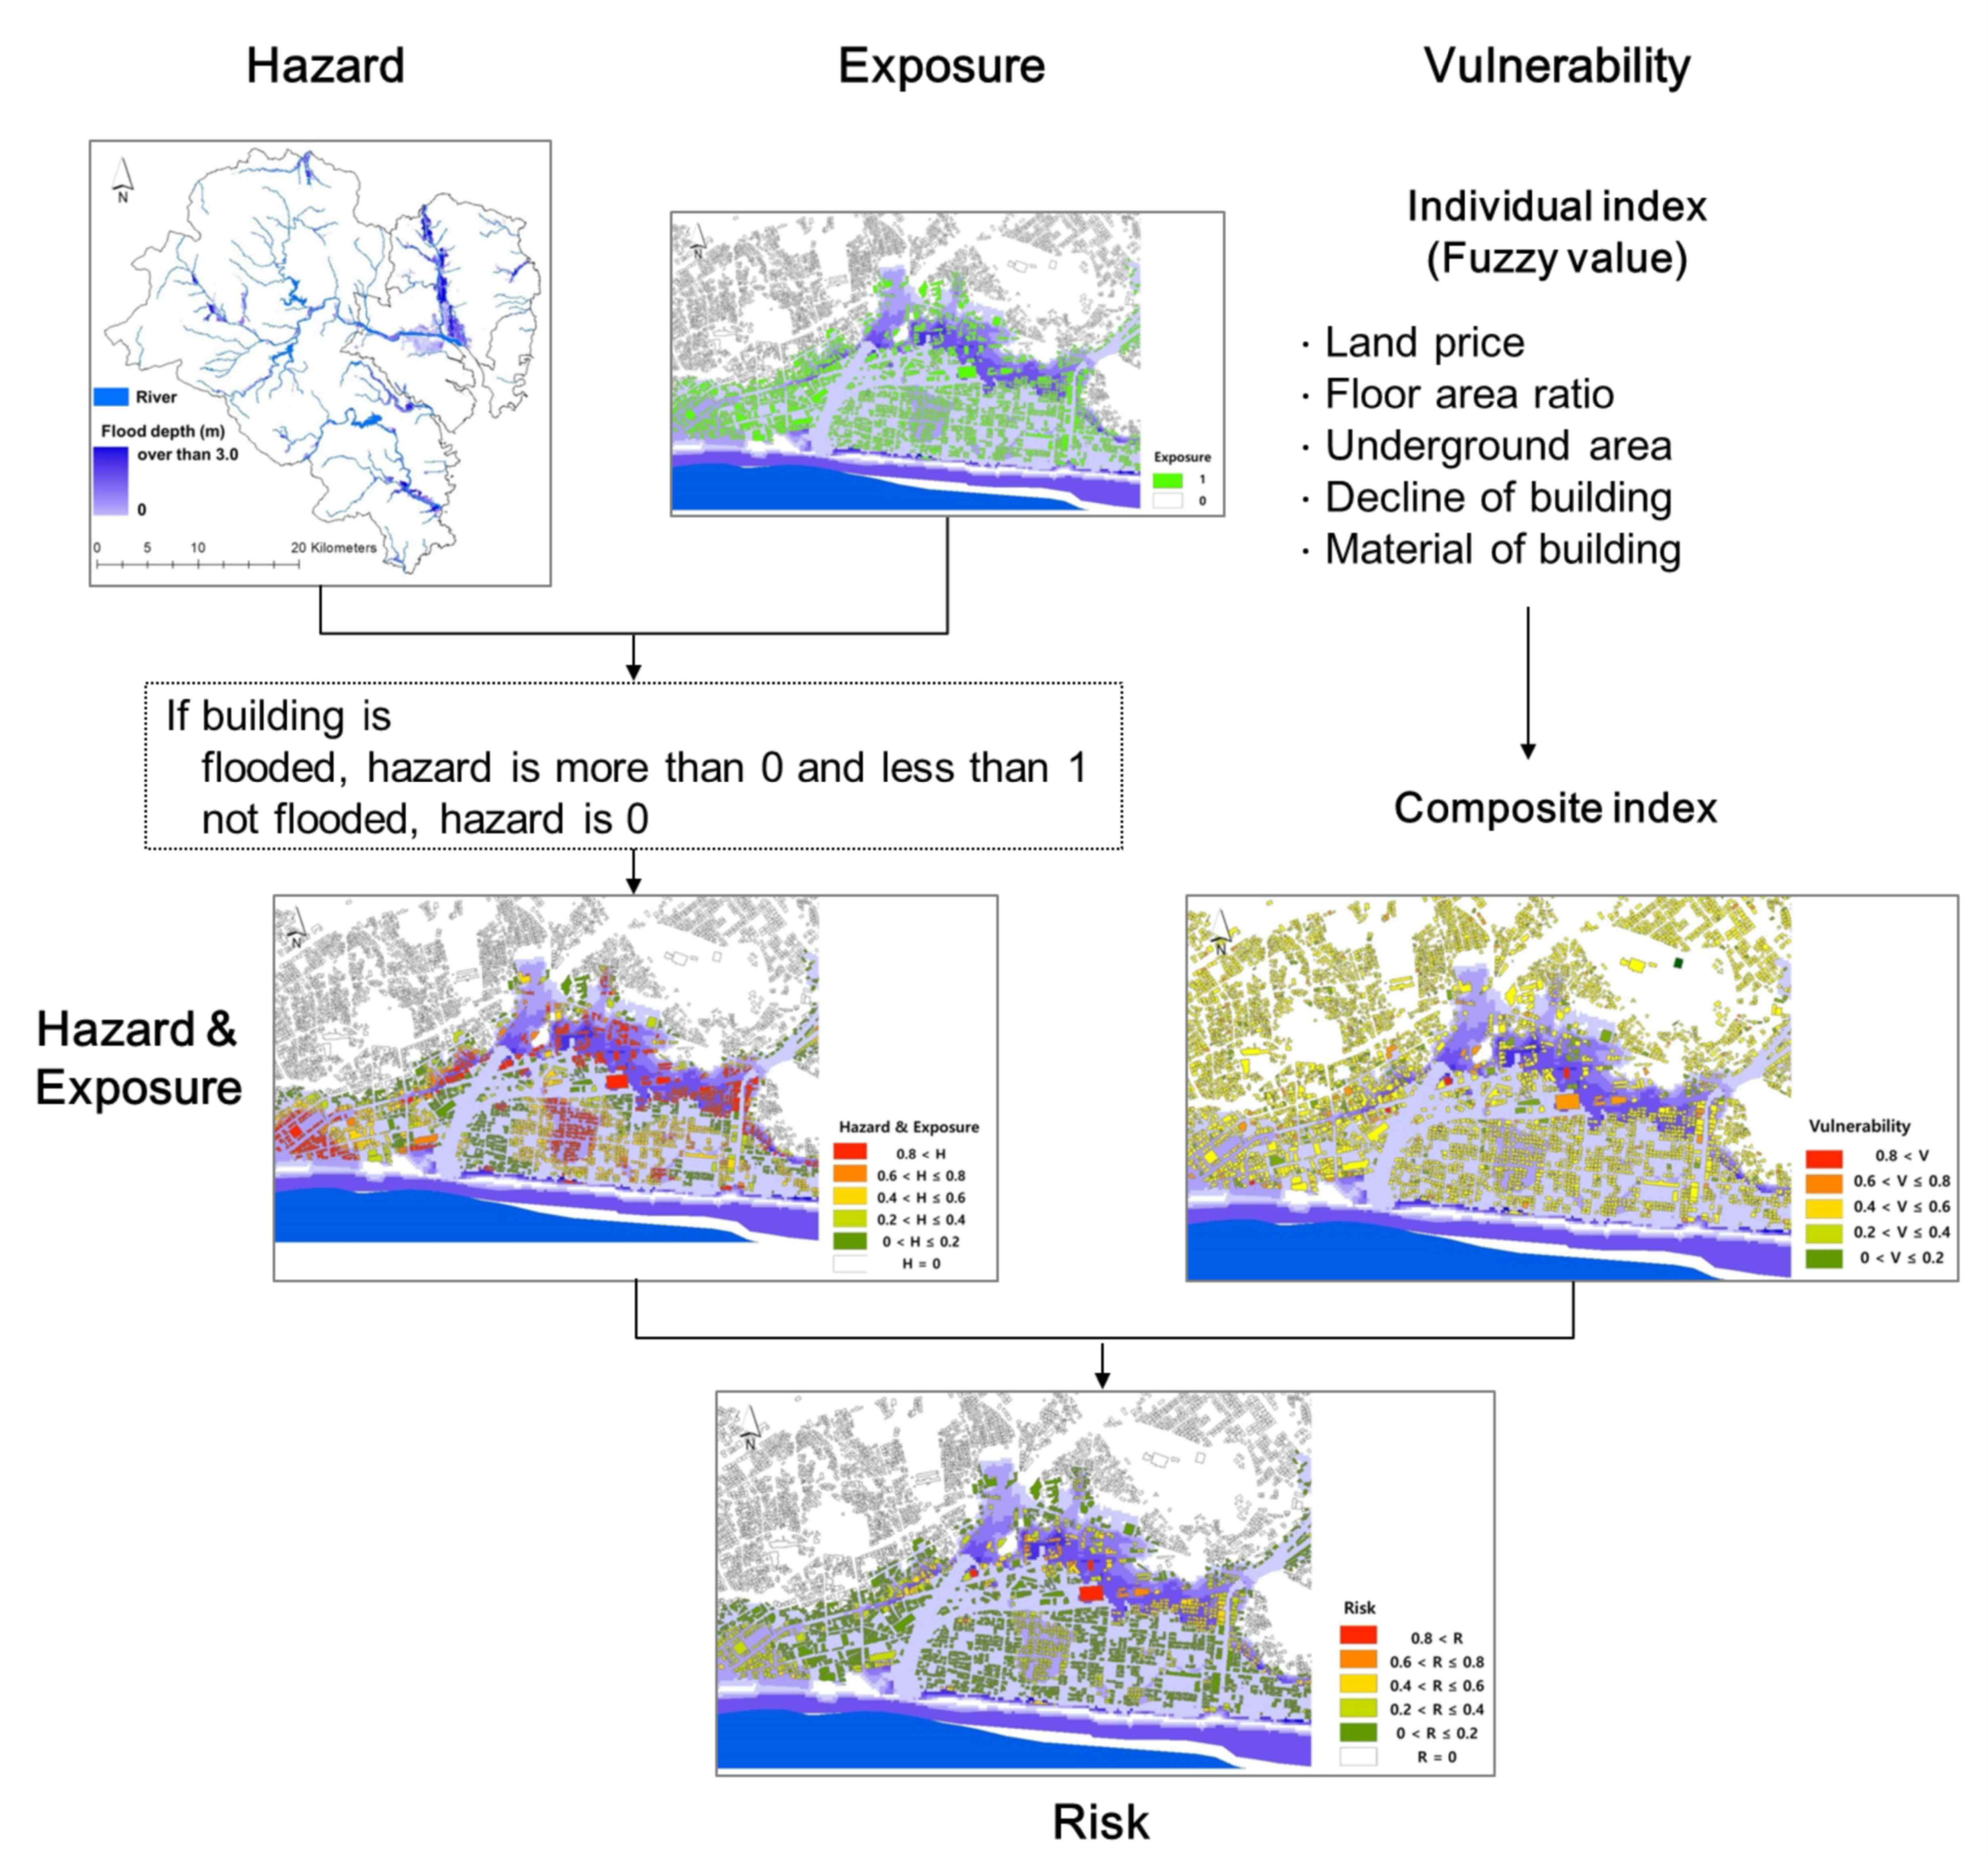
2.3. Methods of Assessing Flood Risk

Researchers from various scientific backgrounds have different understandings of the definition of risk [21,22]. Definitions and methodologies for risk are not general and vary depending on the researcher and the research purpose [23,24]. Methods of calculating risk and spatial resolution are determined according to the subject who establishes countermeasures for disaster risk reduction and climate change adaptation and the spatial scope of risk assessment. Since the central government provides financial support to local governments, risk assessment at the resolution of administrative districts is required for the entire country. Index-based risk assessment using proxy variables of administrative districts is useful for the central government since there are time and economic limitations in performing high-resolution risk assessment for the entire country [25,26,27,28]. In contrast, since local governments plan and implement structural and non-structural measures, high-resolution risk assessment methods for administrative districts are suitable [29,30,31,32]. In particular, it is necessary to utilize the results of physical flood simulation that reflects rainfall in addition to high-resolution regional characteristics. The concept of climate change risk was formulated through the IPCC Climate Change Assessment Report [33]. The risk is defined as a function of hazard, exposure, and vulnerability in the report. This study applied the IPCC risk concept, and the study area has a local government, so high-resolution risk assessment results were required. A combination of methods on physical risk and index-based risk assessment was developed for high-resolution flood risk assessment of a building, as shown in Figure 4. Hazard was calculated by using the flood map developed through numerical analysis, and exposure was calculated by estimating whether flooding would occur by overlapping the building location and the flood map. Vulnerability was calculated by converting five individual indexes of buildings related to flooding into a composite index. Since the correlation between building use and flooding was not physically identified, a qualitative method was applied to estimate vulnerability. The significance of the method lies in enabling high-resolution flood risk assessment for local governments by combining physical and index-based risk assessment techniques proposed in previous studies.
The flood risk calculation method is expressed as Equations (1) and (2), with reference to the risk estimation guideline suggested by Risk Supplement to the Vulnerability Sourcebook of GIZ; EURAC research. The risk is the damage ratio of buildings due to flooding and is calculated through the flood depth–damage ratio curve developed based on empirical data on flood damage, as shown in Figure 5. The flood damage ratio can be expressed as follows: It has a value of 0–1, as in Equation (3), as a function of the flood depth in the area where the building is located. If the damage ratio is 0, the flood depth is 0, and if the damage ratio is 1, it means that the flooding depth is 3 m or more, and damage to the entire building has occurred. Exposure is determined by the presence or absence of flooding in the area where the building is located. If the building is flooded, the exposure is 1; otherwise, the exposure is 0, as shown in Equation (4). The vulnerability is a fuzzy value calculated using five building-related indicators, as shown in Equation (5), and has a value of 0–1 using the results.
R i ,   0   t o   1 = R i R min   o f   i R max   o f   i R min   o f   i
R i = H + E + V
H i ,   0   t o   1 = 0.0238 x 3 + 0.048 x 2 + 0.3988 x + 0.0173 ,           i f   x = 0 ,   H = 0
E i ,   0   o r   1 = 0   or   1 ,   if   a   building   is   flooded ,   E = 1 ,   not   flooded ,   E = 0
V i ,   0   t o   1 = Fuzzy   value   using   building   characteristics related   indicators
where R i is the risk of building i, R i is the risk of building i before normalized using min-max methods, R max   o f   i is the highest value for R i , R min   o f   i is the lowest value for R i , H i ,   E i ,   V i are the hazard, exposure, and vulnerability of building i, respectively. x is flood depth.
The urban flood risk classification by facility and use group, introduced in England’s Guidance about Planning Policy Statement 25 (PPS25), is used as a standard to examine buildings in Korea. The flood risk was analyzed to find which facility groups are included in the high-risk category, according to the resultant analysis of flood risk by each building use and suggest ways to reduce the level of flood disaster to buildings.

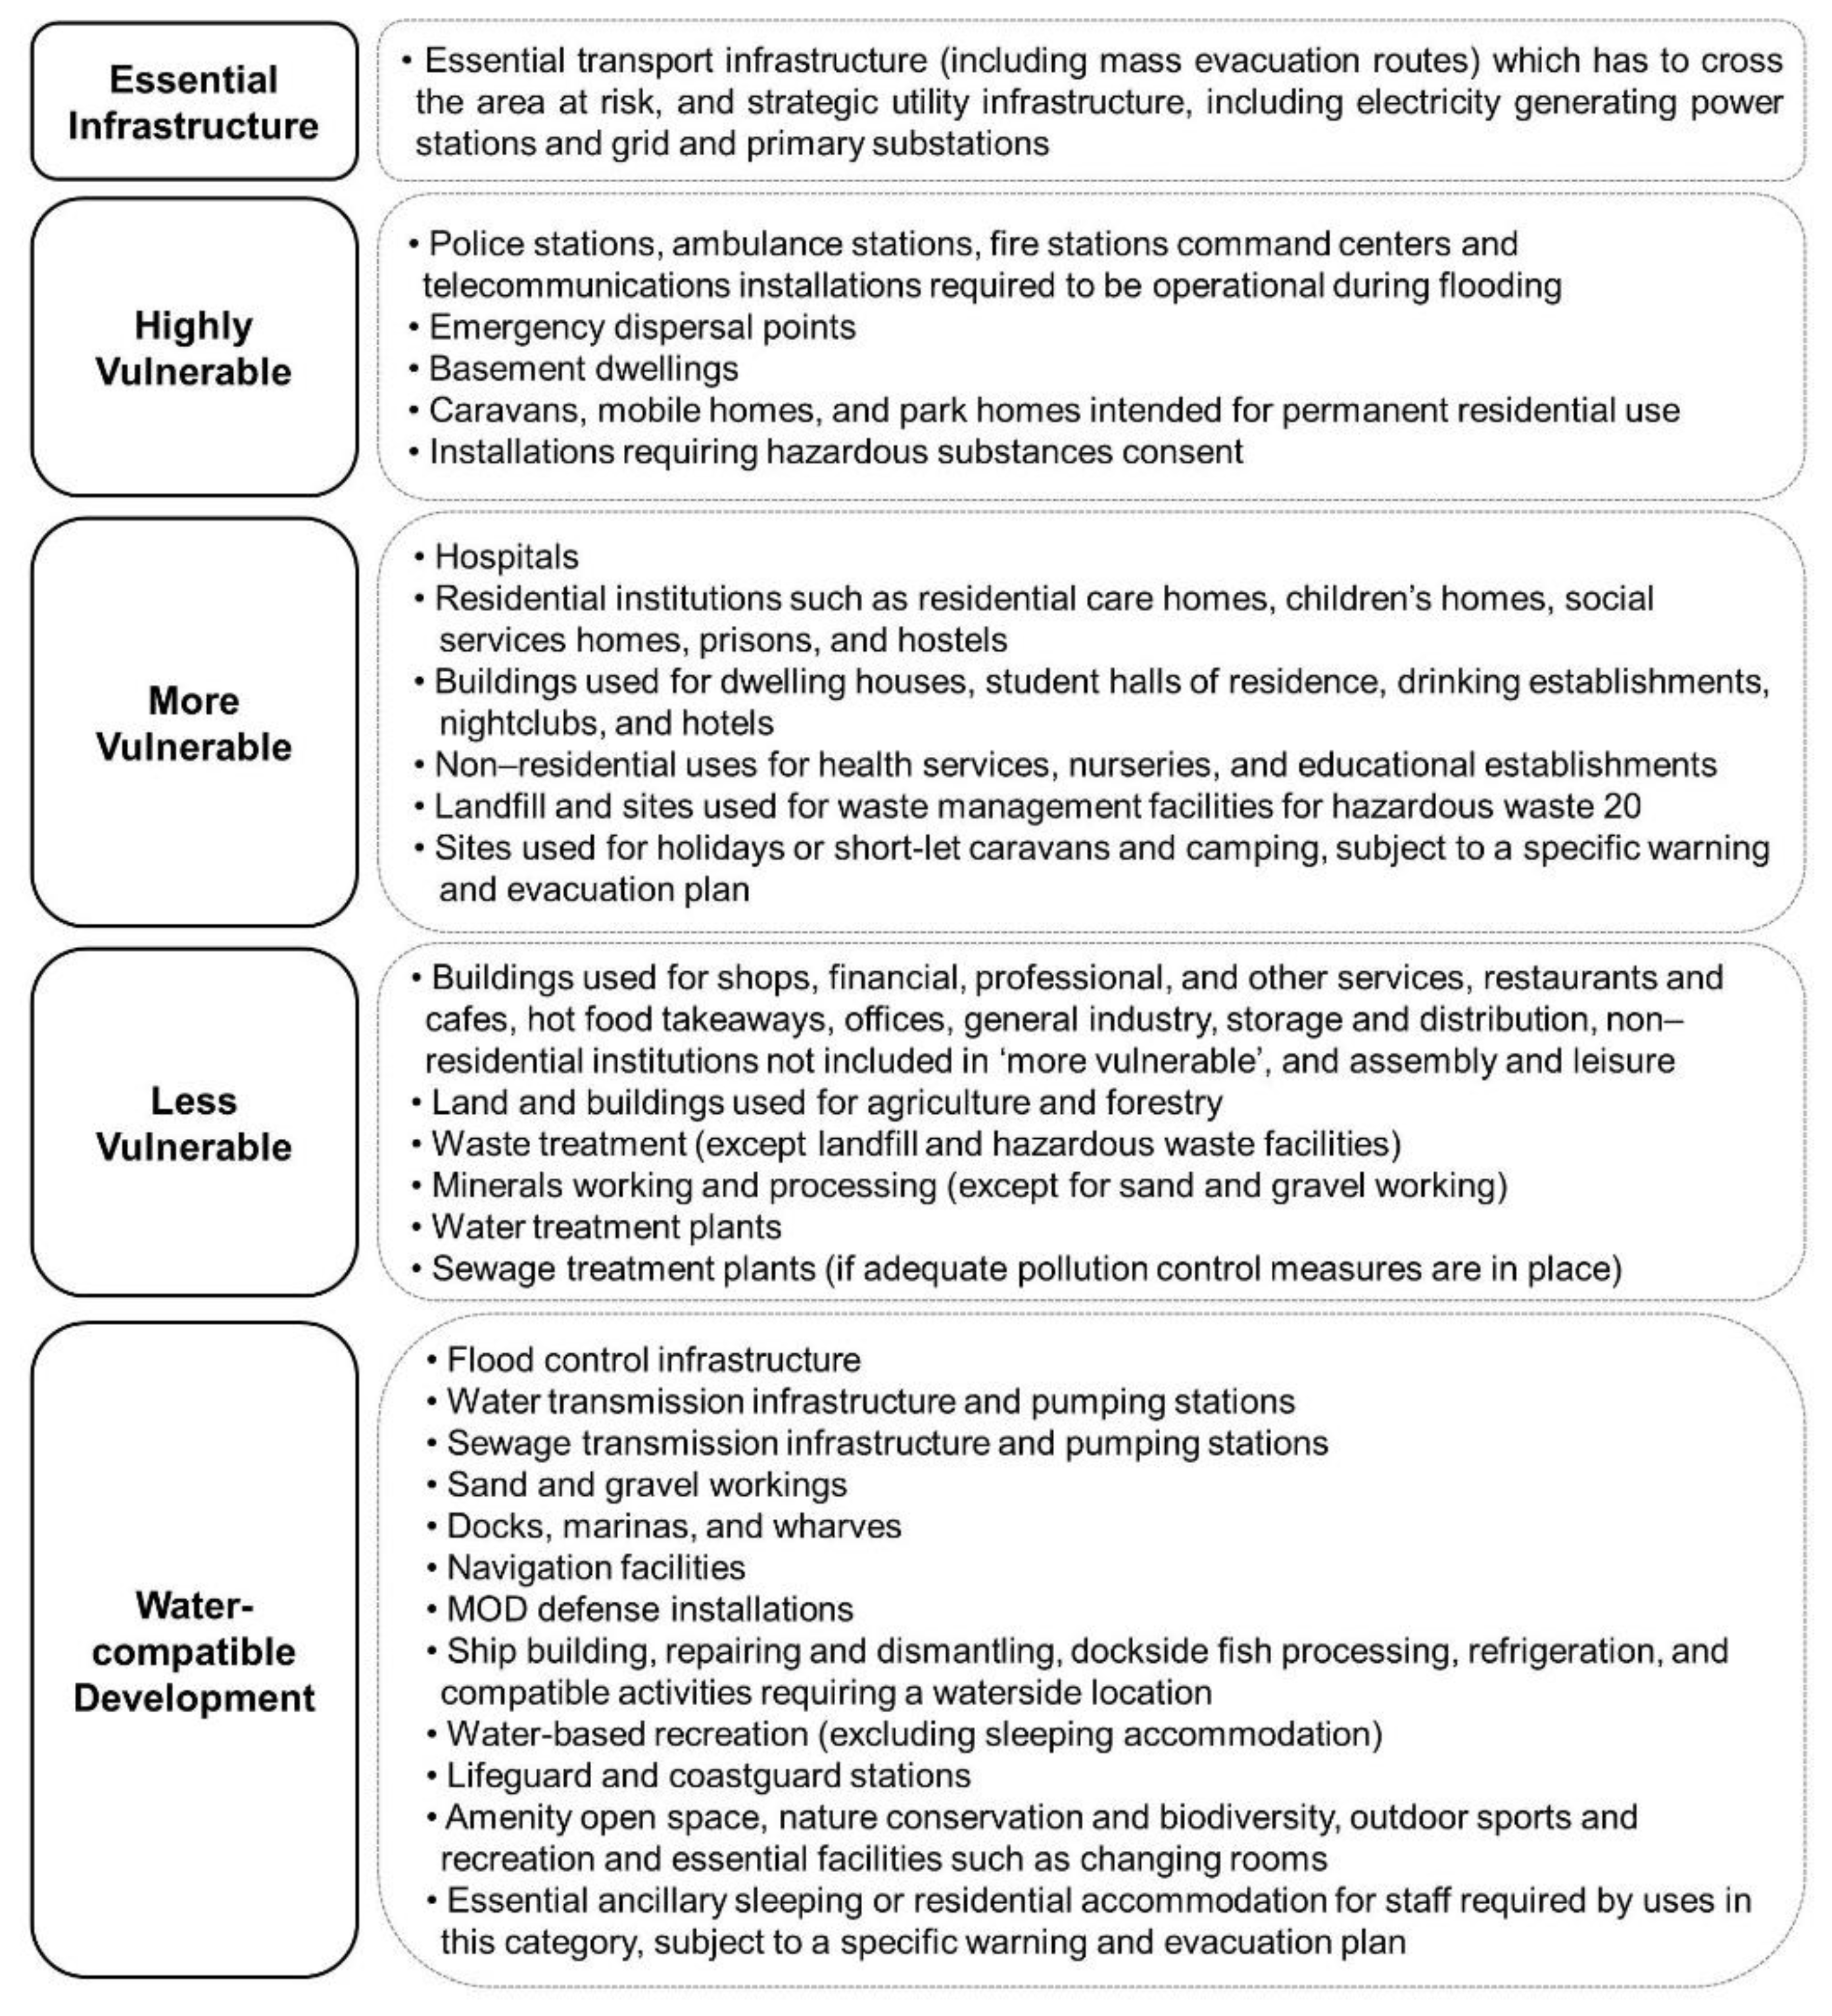
2.4. Characteristics of Building by Use

A building is a structural foundation for people in modern society. Members of society choose buildings that are suitable and affordable to ensure the stability of life. However, establishing a new building cannot be the only alternative for enhancing their lives. As improvements made to buildings already constructed or the strengthening of functions of new buildings are linked to increased adaptability, re-establishment of abandoned buildings by demolishing them must also be treated under the concept of building adaptability. Moreover, since the spatial expansion of buildings occurs vertically, buildings should be approached differently from cities in terms of adaptability.
In England, it is deemed that vulnerability to flood risk varies depending on the use and facility in the course of performing the flood risk assessment. The Planning Policy Guidance (PPS25; Planning Policy Statement 25: Development and Flood Risk) established a flood risk vulnerability classification system by use and facility and made decisions on whether the location was feasible (development permitted or development prohibited) or required exceptional verifications by reviewing the compatibility between use and facility and flood area during sequential verification [24].
The actual damage, as well as the potential impacts and hazards resulting from flooding, may vary by the building use and facility groups. In urban planning and land use policy in England, vulnerability is classified by uses and facilities groups, as demonstrated in Figure 6, and the sequential test is operated according to urban flood risk for flood disaster risk reduction in advance by regulating the location of development and land use. The classification revealed that “essential infrastructure” includes essential transport infrastructure, strategic utility infrastructure, and electricity-generating power stations, while the “highly vulnerable” category enumerates facilities that must be operated in the event of a flooding, such as police stations, rescue teams, fire stations, command centers, and communication facilities. As such, this classification system strives to ensure effective disaster management.
Republic of Korea classified buildings by use (Figure 7) in the Enforcement Decree of the Building Act to define matters required in applying elements for the design and construction of buildings [35]. Therefore, based on the vulnerability classification by uses and facility groups offered by the Planning Policy Statement 25, the groups of facilities classified in Korea by their uses were matched to the same categories in Planning Policy Statement 25, and the distribution of building uses was analyzed with respect to the urban flood risk rating.

3. Results and Discussion

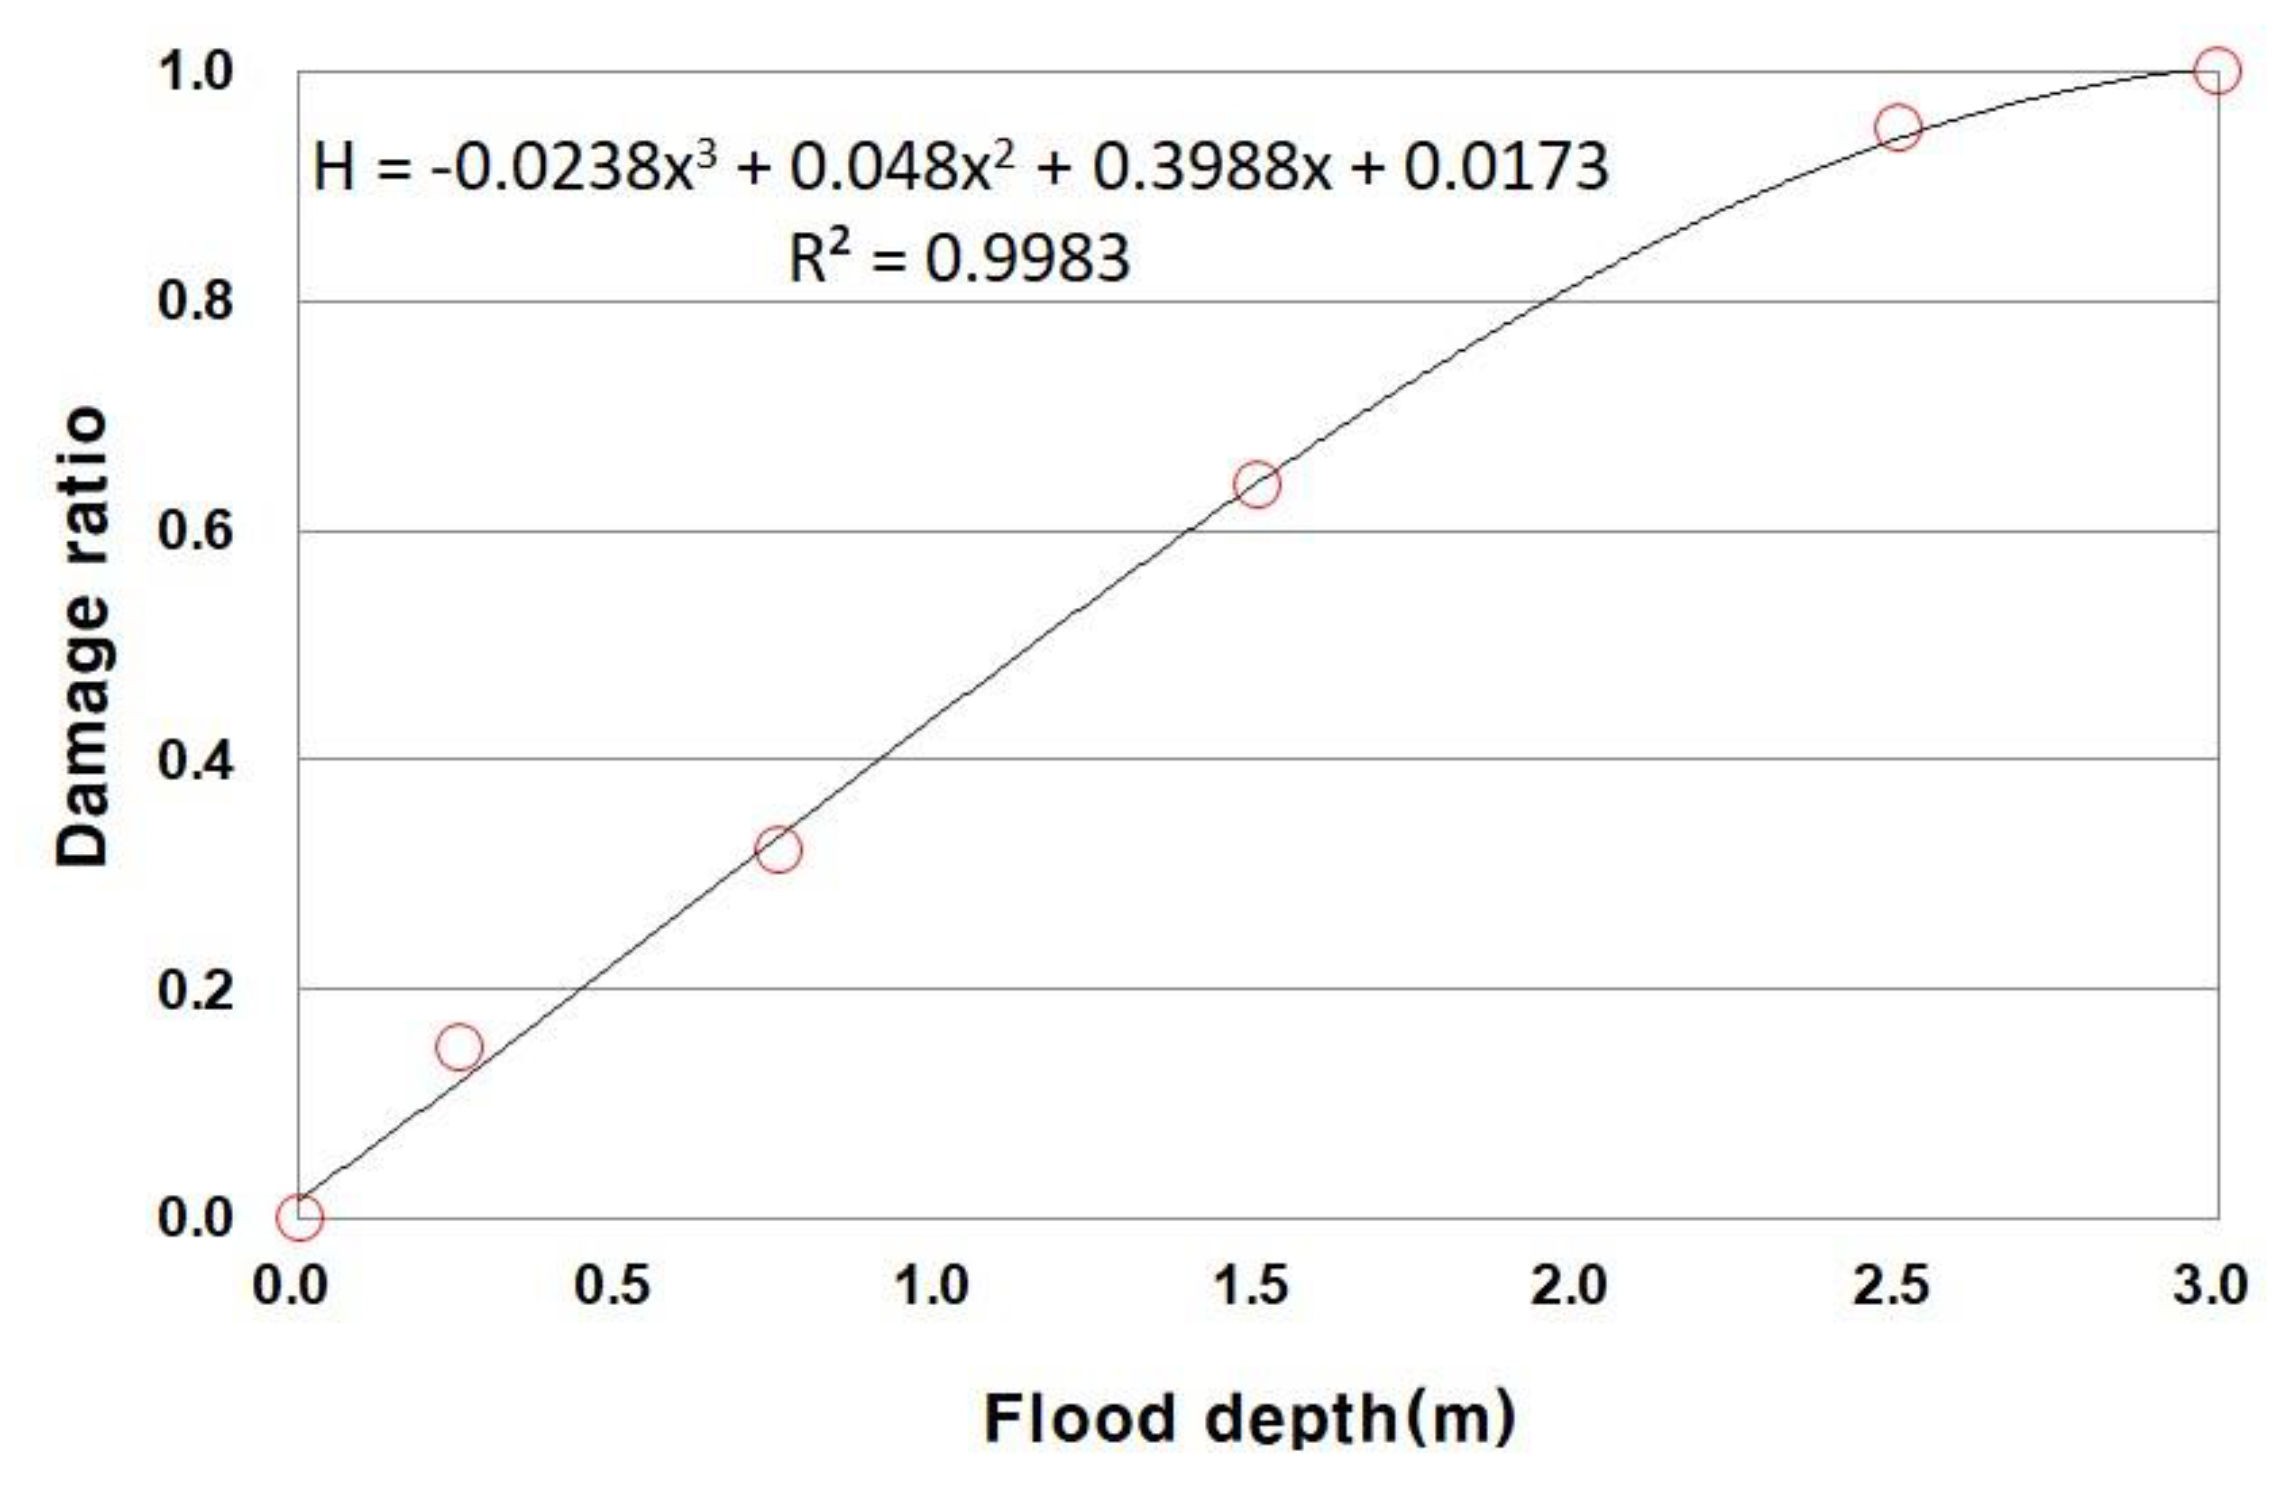
3.1. Vulnerability Analysis for Building

Vulnerability is defined as a function of the nature, scale, and ratio of climate change, as well as the sensitivity and adaptability to which a system is exposed, referring to the extent to which such a system is susceptible or unable to respond to the adverse effects (climate variability, extreme weather, etc.) of climate change [36]. The IPCC considers vulnerability as a function of sensitivity, and adaptability to climate change and identifies a system as highly vulnerable if a system shows low adaptability under a strong impact of climate change.
The impact of disaster risk is local, discontinuous, and uncertain. The way to mitigate flood risk is to reduce the vulnerabilities in a system. Vulnerability to natural disasters can be reduced through changes in social infrastructure and systems [37]. In other words, the vulnerability in the field of climate change implies that the external stress of climate change is caused by certain components of human systems—namely, urbanization. Further, given that such external stresses can be large or small depending on human efforts, vulnerability can be reduced by the external stress strengthening the ability of the internal parts of the system to respond to a disaster.
Five building-related indicators were selected to assess vulnerability to urban flood hazards. To yield indices, the fuzzy analysis method was utilized. The fuzzy inference process analyzed vulnerability by replacing indices with the appropriate fuzzy value via fuzzification and converting them to a defuzzification value. For analyzing the characteristics of buildings, they were treated as the most basic unit of urban space. To evaluate the vulnerability of each building in Ulsan Metropolitan City, the information on the official land price announced by the Korea Real Estate Board was obtained, and the data on underground area, floor area ratio, building materials, and building decline were collected using the building registry established by Ulsan Metropolitan city, as shown in Table 1. The results of fuzzy inference analysis conducted across five districts in Ulsan Metropolitan City led to an examination of vulnerabilities from urban flooding for each building category. As each building category has different economic and social vulnerabilities, the degree of damage was found to vary even under the same risk factor. At this point, each indicator had its own characteristics and thus was standardized. Vulnerability was ranked in five levels by applying the standardized values of up to 1.0 and at least 0.1 to all buildings, as shown in Table 2.

3.2. Hazard and Exposure Analysis for Urban Flood

Hazard refers to the nature and extent of climate stress on the system, including long-term changes in climate conditions and changes in climate variability, and can be combined with the particular vulnerability of factors exposed to certain risks [36]. The analysis applying FLUMEN and HEC-Ras are normal flood depth analysis models that carry out a simulation by constructing the centerline of the river, the river bank line, the river crossing data, using the flood level and the flood amount as the boundary conditions. In this analysis, a flood depth map was prepared by applying the numerical analysis model based on environmental factors such as topographical and rainfall data developed by the Ministry of Interior and Safety [37]. As a result of the hazards analysis (Figure 8), the meeting points of Jung-gu, Nam-gu, and Buk-gu, as well as the low-lying districts centered on the Taehwa River, were found to be particularly flood prone.

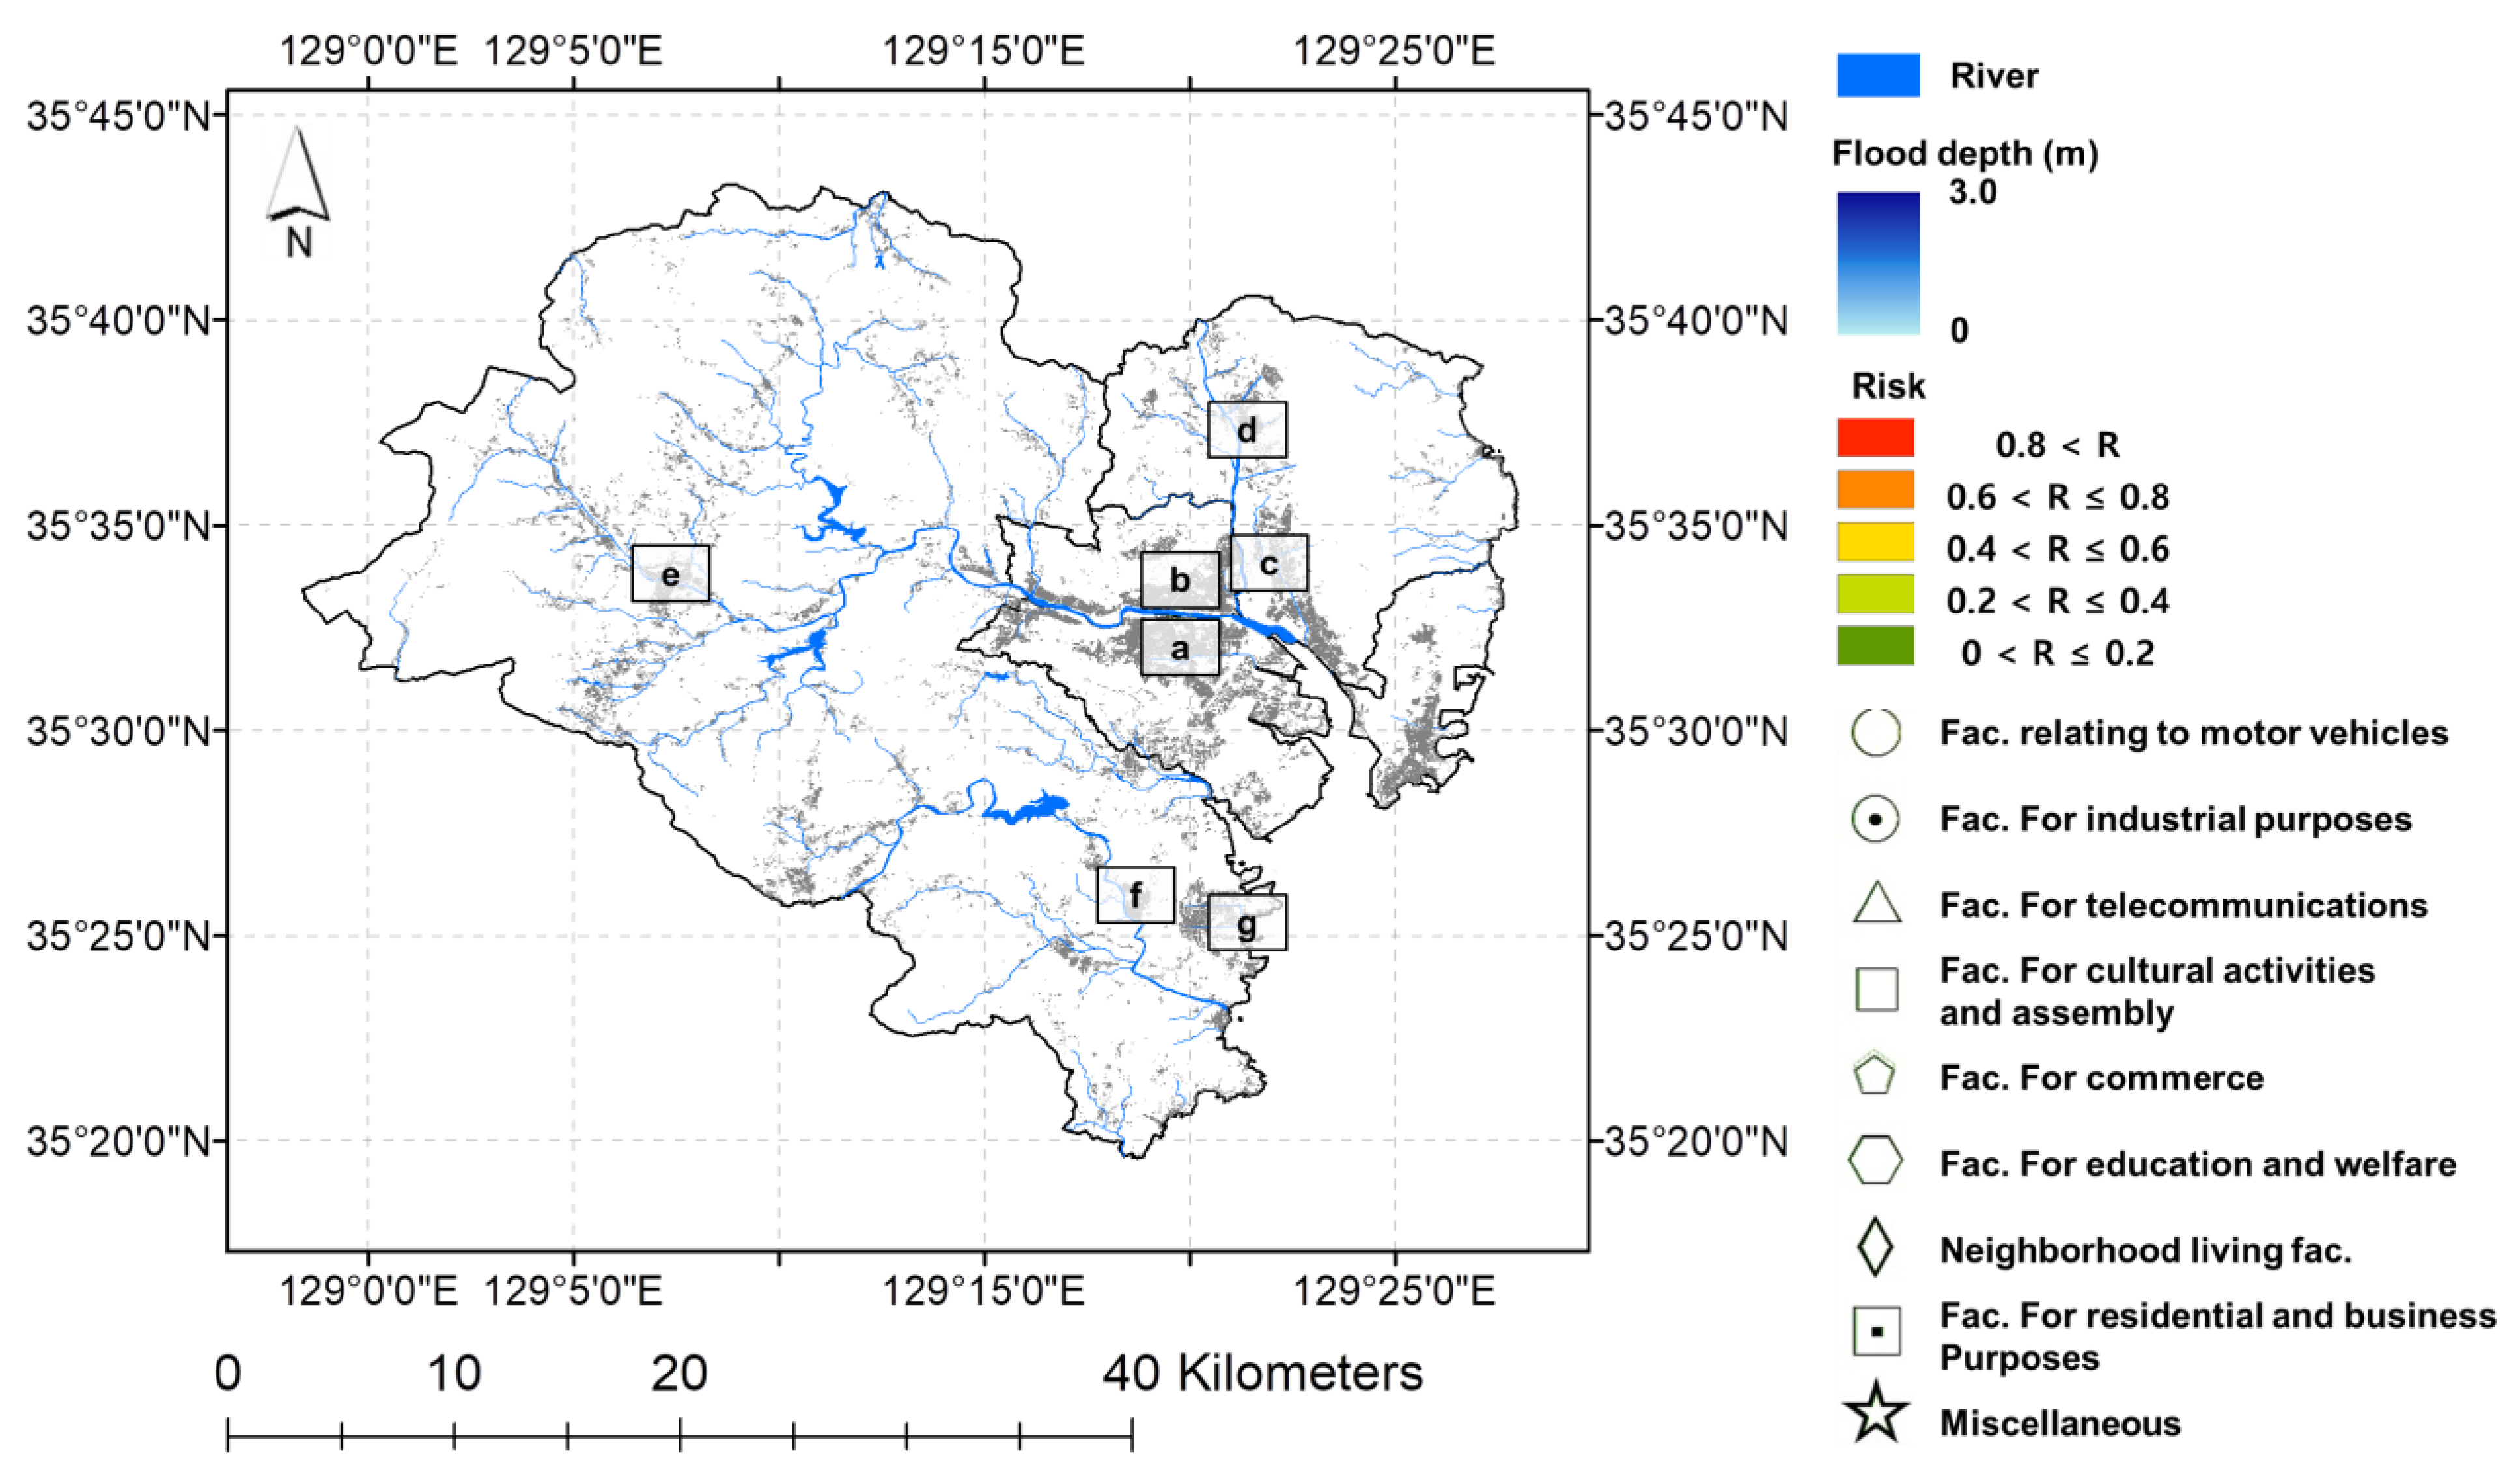
3.3. Building Risk Analysis

The likelihood that the loss may be greater than ordinarily expected is referred to as a risk. Risk is a probability concept, but it can also cover the gap between the currently expected amount of loss and future probability [38].
The urban flood risk analysis is based on the following equation: Risk = Hazard (Exposure) + Vulnerability [39]. The analysis results are shown in Table 3. The risk analysis also classified the buildings according to their vulnerability level using different color codes (very high risk—red, high risk—orange, medium risk—yellow, low risk—yellowish green, and very low risk—green). According to the analysis of urban flood risk, there was a high risk of flooding in areas where urban development has been carried out, which are low-lying areas centered on the Taehwa River. With regard to the buildings with red and orange ratings, indicating high flood risk, the distribution rate varied by district, with Nam-gu having the highest number of buildings (6545; 26.9%), followed by Buk-gu (2576; 21.6%), Jung-gu (4856; 20.2%), Ulju-gun (3205; 8.5%), and Dong-gu (0; 0%).

3.4. Distribution Characteristics by Building Use

While it is important to analyze the risk of urban floods in buildings, it is also extremely important to analyze which groups of facilities are classified as dangerous buildings and whether facilities with similar use are concentrated in high-risk flood areas. Hence, based on the flood risk analysis derived from the study of hazard, exposure, and vulnerability, the distribution characteristics of the facility groups by building use were organized, as shown in Table 4 and Figure 9.
The vulnerability classification by building use in England’s land and urban planning system was compared and matched to the Korean classification by building use, resulting in the following classification in Korean context: “essential infrastructure” category includes facilities for telecommunications; “highly vulnerable” category includes education and welfare facilities; “more vulnerable” category includes commercial facilities; “less vulnerable” category includes facilities relating to motor vehicles, industrial purposes, cultural assembly, and neighborhood living facilities.
The distribution analysis of facilities groups by each building use (Figure 10) revealed that residential facilities were constructed with the largest numbers, amounting to 66,133 buildings. Next in rank were 21,203 neighborhood living facilities, followed by 12,262 industrial facilities, 2189 education and welfare facilities, 972 facilities for commerce, 959 cultural groups, 675 motor vehicles-related facilities, and lastly, 54 telecommunications facilities.
Since telecommunication facilities are essential infrastructures that are closely related to the lifelines of urban residents, it is clear that the impact of flooding would be tremendous, leading to difficulties in daily lives and paralysis of a city’s functions. Telecommunication facilities are of great importance when there is flooding because they communicate changing circumstances and also serve as a central operations center in terms of rapid disaster management and response, such as firefighting, first aid, and emergency measures. In addition, various infrastructures such as water and sewage, electricity, gas, and heat supply facilities are located underground, which means potential power outages, electric shock, explosions, and fires pose the risk of secondary damages, exacerbating overall harm. As such, it is imperative to secure the stability of telecommunication facilities. In examining the urban flood risk in telecommunication facilities and building distribution in each district, it was found that the distribution ratios of the buildings with a high-risk rating of red and orange across evaluated districts were 0.02% in Jung-gu, 0.01% in Ulju-gun; the rest of the districts did not reflect a high-risk rating. The ratio to green rating was relatively high, which is considered to be a positive sign in terms of stability.
Medical facilities that belong to the education and welfare facility group are related to emergency rescue, and police and fire stations are classified as important facilities, as their operation during flooding is critical. The group of facilities for residential and business purposes, which include detached houses, apartment buildings, and multifamily houses, is where city residents live at all times and underground spaces exist for most structures this makes them fall under the highly vulnerable category, along with education and welfare facilities.
Following the urban flood risk assessment for these groups, the distribution status of buildings in each district was examined. For education and welfare facilities, around 0.26% of Nam-gu District, 0.22% of Jung-gu District, 0.13% of Ulju gun, and 0.12% of Buk-gu District were found to be high-risk buildings, graded with red and orange ratings. There are also a number of buildings with a green rating. Distribution ratios for red and orange-rated buildings within the group of facilities for residential and business purposes were 14.67% in Nam-gu, 13.67% in Jung-gu, 10.59% in Buk-gu, and 4.04% in Ulju-gun, with none in Dong-gu District. Yellow-rated buildings were found in a small number of districts, while relatively more green-rated buildings existed.
The group of facilities for commerce includes sales facilities, sports facilities, and lodging facilities, which correspond to the relatively “more vulnerable” category. For commerce-related facilities, the distribution status of buildings in each district was investigated after the urban flood risk analysis was conducted, revealing that they were distributed across the districts at the ratios of 0.75% in Nam-gu, 0.35% in Jung-gu, 0.12% in Buk-gu, 0.11% in Ulju-gun, and none in Dong-gu.
Facilities related to motor vehicles, industrial purposes, cultural activities and assembly, and neighborhood living facilities all fall under the less vulnerable category, as they are considered to have low asset value for not being subject to citizens’ permanent residency. According to the analysis of the risk of urban flooding, the distribution status of buildings in each region demonstrated a low distribution ratio of high-risk for red and orange-rated buildings and a significantly high ratio of green-rated buildings in the neighborhood living facilities group. Other groups of facilities showed an even distribution ratio by rating.
Furthermore, the urban flood risk analysis confirmed that topographical aspects, environmental factors, and the progress of urbanization could exert significant influences. Therefore, in order to minimize and reduce flood disasters to high-risk buildings, the location of buildings should be considered in advance in terms of the vulnerability by the buildings’ use, importance, and usability; following the construction of buildings, management and disaster preparedness must be designed according to risk level.

4. Conclusions

A recent increase in the frequency of natural disasters has been attributed to environmental factors such as climate change and urbanization. Korean climate change and urbanization rates are significantly higher than the global average, raising concerns that the country will become extremely vulnerable to disasters. As climate change and rapid urbanization are increasing the risk of disasters, developed countries and international organizations have introduced the concept of adaptation into the disaster prevention sector. Moreover, the importance of response measures associated with urban planning for climate change adaptation using various urban planning, land use, and buildings, is gaining recognition, in addition to the traditional disaster prevention measures.
In this study, the scope of the research was limited to the flood hazard in urban areas, as it has been the most destructive damage of natural disasters, and the flood risk was assessed for buildings, which can be considered the smallest unit of urban space. Specifically, the characteristics of risk distribution were analyzed by the uses of buildings in order to come up with feasible countermeasures from an urban planning perspective by increasing the adaptability of buildings by spatial units. According to the risk analysis of urban floods, it was found that low-lying areas around the Taehwa River, where urban development has progressed at a rapid pace, were facing a high risk of flooding, and that a substantial number of highly vulnerable facilities were distributed in the districts of Jung-gu and Nam-gu, and Ulju-gun. No such group of facilities was found in the Dong-gu District, which suggests that it has established a land-use plan that is safe from flood disasters. Based on the overall findings of the urban flood risk assessment by facility group and the distribution characteristic analysis by building use, several meaningful implications can be derived.
First, measures were proposed to reduce flood disasters in urban areas and adapt to heavy rains. This is significant in that it has allowed for efficient and systematic building-based management of urban space and land use as part of urban planning measures that could supplement the limitations of existing traditional measures. Second, the development of a new methodology based on spatial information obtained through statistical synthesis and spatial localization was suggested. By evaluating the locational distribution characteristics by building use, flood damage can be minimized through the improvement of the city’s ability to adapt to flood hazards by selecting high-risk buildings that demand primary management and response and determining the level of concentration of a particular facility group in flood-prone zones. Third, the study emphasized that the urban flood risk by facility group can be analyzed by district, and that disaster prevention measures should be established in a large framework by first considering the administrative districts with a relatively high distribution ratio of red-rated facilities. Legislative and policy enforcement in the initial step of urban planning may give rise to or facilitate the implementation of scientific results. It is anticipated that if proper land use planning is established in consideration of the findings of this study, such planning will serve as a short-term measure to minimize flood disaster risk but will also function as an effective long-term measure for urban planning and other spaces.

Author Contributions

Conceptualization, K.P.; data curation, I.Y.; project administration, E.H.L.; software, I.Y.; validation, K.P.; writing—original draft preparation, K.P.; writing—review and editing, E.H.L. All authors have read and agreed to the published version of the manuscript.

Funding

This research was funded by the National Research Foundation (NRF) of Korea (NRF-2019R1I1A3A01059929).

Institutional Review Board Statement

Not applicable.

Informed Consent Statement

Not applicable.

Conflicts of Interest

The authors declare no conflict of interest.

References

  1. Thomas, V.; Albert, J.R.G.; Hepburn, C. Contributors to the frequency of intense climate disasters in Asia-Pacific countries. Clim. Chang. 2014, 126, 381–398. [Google Scholar] [CrossRef] [Green Version]
  2. Haggag, M.; Yorsi, A.; El-Dakhakhni, W.; Hassini, E. Infrastructure performance prediction under Climate-Induced Disasters using data analytics. Int. J. Disaster Risk Reduct. 2021, 56, 102121. [Google Scholar] [CrossRef]
  3. Cai, T.; Li, X.; Ding, X.; Wang, J.; Zhan, J. Flood risk assessment based on hydrodynamic model and fuzzy comprehensive evaluation with GIS technique. Int. J. Disaster Risk Reduct. 2019, 35, 101077. [Google Scholar] [CrossRef]
  4. Highfield, W.E.; Brody, S.D. Evaluating the effectiveness of local mitigation activities in reducing flood losses. Nat. Hazards Rev. 2012, 14, 229–236. [Google Scholar] [CrossRef]
  5. Yildirim, E.; Demir, I. An integrated flood risk assessment and mitigation framework: A case study for middle Cedar River Basin, Iowa, US. Int. J. Disaster Risk Reduct. 2021, 56, 102113. [Google Scholar] [CrossRef]
  6. EEA. Flood Risks and Environmental Vulnerability; EEA Report No 1/2016; European Environment Agency: Copenhagen, Denmark, 2016. [Google Scholar]
  7. United Nations Office for Disaster Risk Reduction. Sendai Framework for Disaster Risk Reduction 2015–2030; UNDRR: Geneva, Switzerland, 2015. [Google Scholar]
  8. Galasso, C.; Pregnolato, M.; Parisi, F. A model taxonomy for flood fragility and vulnerability assessment of buildings. Int. J. Disaster Risk Reduct. 2021, 53, 101985. [Google Scholar] [CrossRef]
  9. Madsen, H.; Rasmussen, P.F.; Rosbjerg, D. Comparison of annual maximum series and partial duration series methods for modeling extreme hydrologic events, 1, At-site modeling. Water Resour. Res. 1997, 33, 747–757. [Google Scholar] [CrossRef]
  10. Ferreira, A.; de Haan, L. On the block maxima method in extreme value theory: PWM estimator. Ann. Statist. 2015, 43, 276–298. [Google Scholar] [CrossRef] [Green Version]
  11. Coles, S. An Introduction to Statistical Modelling of Extreme Values; Springer: London, UK, 2001. [Google Scholar]
  12. Süveges, M.; Davison, A.C. Model misspecification in peaks over threshold analysis. Ann. Appl. Stat. 2010, 4, 203–221. [Google Scholar] [CrossRef] [Green Version]
  13. Svensson, C.; Jones, D. Review of rainfall frequency estimation methods. J. Flood Risk Manag. 2010, 3, 296–313. [Google Scholar] [CrossRef] [Green Version]
  14. Collet, L.; Beevers, L.; Prudhomme, C. Assessing the impact of climate change and extreme value uncertainty to extreme flows across Great Britain. Water 2017, 9, 103. [Google Scholar] [CrossRef] [Green Version]
  15. Park, K.; Yu, I. Evaluating the vulnerability of buildings to urban flooding using the fuzzy inferences method. Desalin. Water Treat. 2020, 183, 88–103. [Google Scholar] [CrossRef]
  16. Schueler, T.R. Controlling Urban Runoff: A Practical Manual for Planning and Designing Urban BMPs; Metropolitan Washington Council of Governments: Washington, DC, USA, 1987. [Google Scholar]
  17. Popa, M.C.; Peptenatu, D.; Drăghici, C.C.; Diaconu, D.C. Flood hazard mapping using the flood and flash-flood potential index in the Buzău river catchment, Romania. Water 2019, 11, 2116. [Google Scholar] [CrossRef] [Green Version]
  18. Rahmstorf, S.; Schellnhuber, H.J. Alles nur Klimawandel; Verlag C. H. Beck: Munich, Germany, 2006. [Google Scholar]
  19. Ministry of the Interior and Safety. 2018 Statistical Yearbook of Natural Disaster; Ministry of the Interior and Safety: Seoul, Korea, 2019.
  20. Ulsan Metropolitan City. 2030 Urban Masterplan for Ulsan; Ulsan Metropolitan City: Ulsan, Korea, 2016.
  21. Fuchs, S. Susceptibility versus resilience to mountain hazards in Austria—Paradigms of vulnerability revisited. Nat. Hazards Earth Syst. Sci. 2009, 9, 337–352. [Google Scholar] [CrossRef]
  22. Hufschmidt, G. A comparative analysis of several vulnerability concepts. Nat. Hazards 2011, 58, 621–643. [Google Scholar] [CrossRef]
  23. Fuchs, S.; Heiss, K.; Hübl, J. Towards an empirical vulnerability function for use in debris flow risk assessment. Nat. Hazards Earth Syst. Sci. 2007, 7, 495–506. [Google Scholar] [CrossRef] [Green Version]
  24. Papathoma-Köhle, M.; Kappes, M.; Keiler, M.; Glade, T. Physical vulnerability assessment for alpine hazards: State of the art and future needs. Nat. Hazards 2011, 58, 645–680. [Google Scholar] [CrossRef]
  25. Dabanli, I. Drought Risk Assessment by Using Drought Hazard and Vulnerability Indexes. Nat. Hazards Earth Syst. Sci. Discuss. 2018. [Google Scholar] [CrossRef]
  26. Sun, L.; Tian, Z.; Zou, H.; Shao, L.; Sun, L.; Dong, G.; Fan, D.; Huang, X.; Frost, L.; James, L.-F. An Index-Based Assessment of Perceived Climate Risk and Vulnerability for the Urban Cluster in the Yangtze River Delta Region of China. Sustainability 2019, 11, 2099. [Google Scholar] [CrossRef] [Green Version]
  27. Mac Gregor-Gaona, F.M.; Anglés-Hernández, M.; Guibrunet, L.; Zambrano-González, L. Assessing climate change risk: An index proposal for Mexico City. Int. J. Disaster Risk Reduct. 2021, 65, 102549. [Google Scholar] [CrossRef]
  28. Chen, J.; Ji, J.; Wang, H.; Deng, M.; Yu, C. Risk Assessment of Urban Rainstorm Disaster Based on Multi-Layer Weighted Principal Component Analysis: A Case Study of Nanjing, China. Int. J. Environ. Res. Public Health 2020, 17, 5523. [Google Scholar] [CrossRef] [PubMed]
  29. Yu, I. Development of an Index-Based Risk Assessment Model: Focused on Flood, Wind, and Snow Disaster. Ph.D. Dissertation, Kongju National University, Cheonan City, Korea, 25 August 2017. [Google Scholar]
  30. Uhe, P.F.; Mitchell, D.M.; Bates, P.D.; Sampson, C.C.; Smith, A.M.; Islam, A.S. Enhanced flood risk with 1.5 °C global warming in the Ganges–Brahmaputra–Meghna basin. Environ. Res. Lett. 2019, 14, 074031. [Google Scholar] [CrossRef]
  31. Mazzorana, B.; Simoni, S.; Scherer, C.; Gems, B.; Fuchs, S.; Keiler, M. A physical approach on flood risk vulnerability of buildings. Hydrol. Earth Syst. Sci. 2014, 18, 3817–3836. [Google Scholar] [CrossRef] [Green Version]
  32. Kappes, M.; Keiler, M.; von Elverfeldt, K.; Glade, T. Challenges of analyzing multi-hazard risk: A review. Nat. Hazards 2012, 64, 1925–1958. [Google Scholar] [CrossRef] [Green Version]
  33. Intergovernmental Panel on Cimate Change (IPCC). Climate Change 2014: Impacts, Adaptation, and Vulnerability. Part A: Global and Sectoral Aspects; Contribution of Working Group II to the Fifth Assessment Report of the Intergovernmental Panel on Climate Change; Cambridge University Press: Cambridge, UK; New York, NY, USA, 2014. [Google Scholar]
  34. U.K. Communities, Local Government. Planning Policy Statement 25: Development and Flood Risk; U.K. Communities: London, UK, 2006.
  35. Park, K.; Won, J. Analysis on distribution characteristics of building use with risk zone classification based on urban flood risk assessment. Int. J. Disaster Risk Reduct. 2019, 38, e101192. [Google Scholar] [CrossRef]
  36. Côté, M. Mainstreaming Climate Change in National Development Processes and UN Country Programming; United Nations Development Programme: New York, NY, USA, 2012; pp. 1–33. [Google Scholar]
  37. Park, K.; Lee, M.H. The development and application of the urban flood risk assessment model for reflecting upon urban planning elements. Water 2019, 11, 920. [Google Scholar] [CrossRef] [Green Version]
  38. Mehr, R.I.; Hedges, B.A. Risk Management: Concepts and Applications; Richard Irwin Inc.: Homewood, IL, USA, 1974. [Google Scholar]
  39. GIZ; Eurac. Risk Supplement to the Vulnerability Sourcebook; GIZ: Bonn, Germany, 2017. [Google Scholar]
Figure 1. Change in runoff coefficients due to urban development [16].
Sustainability 13 13006 g001
Figure 2. Flood risk analysis for disaster risk reduction (DRR) and climate change adaptation (CCA).
Sustainability 13 13006 g002
Figure 3. Land cover map of Ulsan Metropolitan City in the Republic of Korea.
Sustainability 13 13006 g003
Figure 4. Procedure of calculating flood risk by combing methods of physical and index-based risk assessment.
Sustainability 13 13006 g004
Figure 5. Flood depth–damage ratio curve of building for hazard calculations.
Sustainability 13 13006 g005
Figure 6. Classification of flood risk vulnerability [34].
Sustainability 13 13006 g006
Figure 7. Group classification of facilities according to Republic of Korea’s Building Act.
Sustainability 13 13006 g007
Figure 8. Hazard analysis for urban flood.
Sustainability 13 13006 g008
Figure 9. Key distribution map of administrative districts by building use on flood risk.
Sustainability 13 13006 g009
Figure 10. Distribution by each building use on flood risk (Micro view). (ae) The Facility for cultural activities and assembly, commerce, residential and business purposes, and neighborhood living facility located near the Tahwa river and Dongstream is exposed to flooding of yellow grade or higher. In particular, (c) area, facility for industrial purposes is exposed to red-grade flooding, and a lot of damage is expected, and (d,e) area, red-grade facilities are located at high density. Conversely, (f,g) area, there is little risk because flooding is not expected in the facility-dense areas.
Sustainability 13 13006 g010
Table 1. Fuzzy analysis for vulnerability.
DistrictsLand Price
(KRW/m2)
Floor Area Ratio (%)Underground Area (m2)Building DeclineBuilding MaterialsFuzzy Score
Jung-guMaximum6,463,18069626,41614940.92
Minimum959,470014210.10
Mean11671242633030.49
Nam-guMaximum12,200,00021941,512,91113640.94
Minimum115302210.10
Mean1,101,6541404432620.49
Dong-guMaximum3,133,527254813,73610840.92
Minimum155019210.15
Mean930,4101353842520.92
Buk-guMaximum4,151,37855156,50615340.78
Minimum10403210.10
Mean614,318819072420.49
Ulju-gunMaximum3,339,00082737,66022940.50
Minimum18804110.10
Mean308,655578132720.50
Table 2. Classification of administrative districts by buildings on flood vulnerability [15].
DistrictsTotal # of BuildingsGreenYellowish GreenYellowOrangeRed
# of Buildings%# of Buildings%# of Buildings%# of Buildings%# of Buildings%
Ulsan Metropolitan CityJung-gu24,05912975.48353.520,84286.62341.08513.5
Nam-gu24,302256710.68213.419,22179.15782.411154.6
Dong-gu10,3438087.82162.1907387.7890.91571.5
Buk-gu11,9095434.62091.811,09893.2260.2330.3
Ulju-gun37,6435701.5110.037,06298.5----
Table 3. Classification of administrative districts by each building on flood risk.
DistrictsTotal # of BuildingsGreenYellowish GreenYellowOrangeRed
# of Buildings%# of Buildings%# of Buildings%# of Buildings%# of Buildings%
Ulsan Metropolitan CityJung-gu24,05917,13171.21920.818807.8443318.44231.8
Nam-gu24,30215,41963.44141.719247.9638826.31570.6
Dong-gu10,34310,18798.51161.1400.4----
Buk-gu11,909893675.0110.13863.2156413.110128.5
Ulju-gun37,64333,51589.000.09232.523876.38182.2
Table 4. Distribution of administrative districts by building use according to flood risk.
Group of Fac.RiskJung-guNam-guDong-guBuk-guUlju-gunUlsan Metropolitan City
# of Fac.%# of Fac.%# of Fac.%# of Fac.%# of Fac.%# of Fac.
Fac. relating to motor vehiclesGreen265.912328.04510.27316.617339.3440
Yellowish green00.0266.7133.300.000.03
Yellow1018.93158.500.0917.035.753
Orange1614.26053.100.02723.9108.8113
Red57.61015.200.04365.2812.166
Fac. for industrial purposesGreen2312.2330630.93243.0124011.6560352.310,704
Yellowish green00.01100.000.000.000.01
Yellow3311.06421.3217.06822.611538.2301
Orange617.913417.400.028036.329738.5772
Red61.2255.200.028759.316634.3484
Fac. for telecommunicationsGreen511.148.948.924.43066.745
Yellowish green00.000.000.000.000.00
Yellow150.000.000.000.0150.02
Orange457.100.000.000.0342.97
Red00.000.000.000.000.00
Fac. for cultural activities and assemblyGreen13218.310013.910614.77310.131143.1722
Yellowish green628.61047.6523.800.000.021
Yellow1129.71951.400.025.4513.537
Orange4830.09559.400.021.3159.4160
Red315.81157.900.0210.5315.819
Fac. for commerceGreen407.519636.610219.1295.416831.4535
Yellowish green28.31458.3729.214.200.024
Yellow3537.23840.400.011.12021.394
Orange7226.515757.700.093.33412.5272
Red1123.42553.200.0510.6612.847
Fac. for education and welfareGreen27314.738520.834018.327714.957831.21853
Yellowish green1527.82750.01018.523.700.054
Yellow1918.65251.076.987.81615.7102
Orange4732.26242.500.0117.52617.8146
Red514.712.900.0411.82470.634
Neighborhood living fac.Green209614.7299021.0215615.213039.2567039.914,215
Yellowish green6918.124363.66316.571.800.0382
Yellow48930.877348.630.2945.923114.51590
Orange116026.5233353.400.03057.057513.14373
Red12819.96910.700.025239.219430.2643
Fac. for residential and business purposesGreen14,24626.7829215.5710113.3568410.718,02833.853,351
Yellowish green10040.311747.23012.110.400.0248
Yellow128144.294632.690.31946.746816.12898
Orange302535.0354741.100.087010.1119313.88635
Red26526.5161.600.039139.132932.91001
MiscellaneousGreen822.5230.790.32557.7295488.93323
Yellowish green00.000.000.000.000.00
Yellow11.311.300.01013.26484.276
Orange00.000.000.06020.423479.6294
Red00.000.000.02824.18875.9116
Publisher’s Note: MDPI stays neutral with regard to jurisdictional claims in published maps and institutional affiliations.

