Article

Sustainability and Waste Imports in China: Pollution Haven or Resources Hunting

1
School of International Economics and Trade, Dongbei University of Finance and Economics, Dalian 116025, China
2
Department of Economics, The University of the West Indies Cave Hill Campus, Bridgetown 11000, Barbados
3
School of Business and Law, Edith Cowan University, Joondalup, WA 6027, Australia
*
Author to whom correspondence should be addressed.
Sustainability 2021, 13(2), 932; https://doi.org/10.3390/su13020932
Submission received: 14 December 2020 / Revised: 12 January 2021 / Accepted: 15 January 2021 / Published: 18 January 2021

Abstract

:
Motivations behind a country’s importation of waste are categorized into the pollution haven hypothesis (PHH) and the resource hunting hypothesis (RHH). The importation of wastes can lead to environmental sustainability concerns, requiring governments to intervene when the market fails to reduce the negative externalities by strengthening and implementing environmental regulations. Motivated by China’s position within a rapidly growing but environmentally damaging sector of trade, this paper has three goals: (1) to classify the primary hypothesis that governs China’s flow of traded wastes; (2) to verify the heterogeneous impact of the pollution paradise motivation and resource demand motivation of waste imports from developed and developing countries, and across industries; (3) to assess the impact of domestic environmental regulations on the motives behind China’s waste imports. Using 28 imported waste-varieties from 20 of China’s major trade partners across 24 years, findings indicate that the flow of Chinese waste imports is relatively unresponsive under the pollution haven effect. However, the resource hunting effect from developing countries is significantly greater than what originates from developed countries, despite the laws of 2011 and 2017 established to restrict resource hunting activities. These results have important implications for improving the efficiency of China’s waste sorting and recycling systems.

1. Introduction

Among researchers and policymakers, expanding global trade and investment has become the fuel that drives concerns of environmental sustainability caused by the flow of production factors across borders. According to Kellenberg [1], wastes trade in 2012 was approximately 500% greater in size compared with two decades earlier and is becoming a crucial component of global factor flows [2]. Dominated by concerns of environmental pollution [3] and illegal dumping [4] through traded wastes, the literature remains concentrated on developed countries such as the United States and those in the European Union, while waste trade in developing countries has received limited attention [5]. This is despite developing countries being the lead importers of wastes due to relaxed environmental regulations, low labor costs, and strong demand for resources [2,6].
According to Kellenberg [7], waste has a dual characteristic. Waste is pollution that needs to be disposed of by developed countries with strict environmental regulations, while perhaps being misplaced resources for developing countries’ recycling industry. As a result, we can categorize the drive for trading wastes under two hypotheses. First, there is the pollution haven hypothesis (PHH), which has been widely used to study environmental issues in international trade and investment literature. PHH holds that each country’s environment can be regarded as a factor of production, and the differences in environmental regulations will change the flow of international factors of production [8]. Therefore, PHH advocates that developed countries with strict environmental regulations will export large quantities of wastes that cannot be disposed of domestically and developing countries will become their waste refuge.
Second, as a misplaced resource, developing countries have the motivation to find wastes as an intermediate input for manufacturing development [7], defined as the resource hunting hypothesis (RHH). The assumption is that developing countries import large quantities of wastes in efforts to find the cheapest intermediate inputs, which are used as recycled raw materials within the manufacturing process [1]. It should be noted that despite the well-established economic rationale and theoretical explanations of PHH and RHH, no consistent evidence has been identified to support this empirical analysis.
Since 1995, China has become a dominant player in the global wastes market [9,10,11], capturing 45% of the world’s wastes volume imported and 72% of all imported waste plastics. According to PHH and RHH, wastes imported by China may be directly incinerated and landfilled [12], or they may be recycled as raw materials for manufacturing development. Regardless of the motives, Chinese waste imports, i.e., foreign garbage in China, can cause negative externalities to the ecological environment, the health of citizens, and the domestic recycling systems. Affected by the upgrading of industrial structure and the destocking of industrial output before 2010, China began to strengthen its environmental regulation over imported waste. Two significant laws regarding the environment promulgated in 2011 and 2017 and struck China’s flow of waste imports. However, insufficient evidence exists regarding these laws and their impacts on China’s waste imports motives across different categories of wastes. Further research on these issues is expected to heighten China’s and other developing countries’ awareness of the management of traded wastes.
Motivated by China’s dominating import position and environmental concerns, this research contributes to the trade and environmental literature of developing countries by empirically analyzing a neglected but highly pollutive component of international trade. First, this article provides evidence of imports by China to assess whether waste trade in developing countries fits PHH or RHH. Second, this research verifies the heterogeneous impact of the pollution paradise and resource demand motivations in Chinese waste imports between developed and developing countries, as well as between the metals, woods, plastics, and textiles industries. Third, given China’s increasingly stringent environmental regulatory policies in recent years, the research also analyzes whether environmental regulations have impacted the pollution paradise and resource demand motives behind Chinese imported wastes.
The rest of this article proceeds as follows: Section 2 continues with a brief review of the relevant literature, summarizing theoretical frameworks and empirical studies. Section 3 provides an overview that briefly describes the state of China’s waste imports. The following section introduces the choice of model and data, followed by some empirical results and a discussion of these findings. Finally, concluding remarks coupled with implications for further consideration are stated.

2. Literature Review

Given the significant growth in the volume of wastes trade, scholarly attention has been directed to the negative externality to people’s health and the environmental sustainability of developing countries [13]. To measure waste trade, Kellenberg [7] reviewed the determinants of waste trade by focusing on wastes and scrap categories within the six-digit level of the harmonized system (HS). The author found that the top 10 waste-exporting countries are developed countries, while China stands as the biggest importer globally. Subsequently, researchers were able to use quantitative methods to study the scale, flow, structure, and motivations of global waste trade [1]. Studies have also focused on waste exports from developed countries such as the European Union [14] and Japan [15] and the waste import position of developing countries like China [16] and India [17]. The position and impact of various waste categories on the environment are also studied; examples are scrapped woods [16], scrapped metals [10], scrapped plastics [18], and electronic waste (e-waste) [19].
On the one hand, traditional studies believe that waste trade is a form of international pollution transfer and attribute this phenomenon to wastes traded from developed countries to developing countries [7] under PHH. PHH was first proposed by Pethig [20] and used to explain how the flow of international production factors is affected by differences in environmental regulations among countries [8]. PHH believes that strict environmental regulation is a cost to the host country, which reduces the company’s international competitiveness and negatively affects FDI destination choice and trade comparative advantage. This theory has become the theoretical foundation for countries with higher environmental regulations to impose tariffs on countries with lower regulations. PHH is widely referenced in empirical studies on environmental regulations, international trade flows, and FDI location selection [21,22,23].
The rapid expansion of the global waste trade has become the backdrop for studies shifting focus on wastes trade that complies with PHH. Baggs [13] used GDP per capita as a proxy variable for environmental regulation. Based on self-reported waste trade data, this study found that an increase in GDP per capita significantly reduced the country’s waste imports, suggesting that motives for wastes trade are captured by PHH. Kellenberg [7], using a cross-country panel dataset, found that countries with slack environmental regulations tend to import more wastes. Differences in environmental regulations among countries have played an important role in the flow of wastes trade. Okubo et al. [15] revealed that Japan mainly exports waste to Asian countries with low GDP per capita, broad market, and less restrictive environmental regulations. However, Higashida and Managi [24], who used wage per capita and GDP per capita as proxy variables for environmental regulation, found no evidence to support PHH. The empirical assessment of Nuñez-Rocha [14] on waste trade among European Union member states found no evidence of pollution resulting from waste imports in the less developed European Union countries.
On the other hand, an analysis of the entire life cycle of waste finds that waste productions may be incinerated, landfilled, directly discarded, or recycled into raw materials for manufacturing in the importing country [7]. Importers are highly motivated to find low-cost wastes for developing countries challenged by scarce resources and strong demand for raw materials used within manufacturing. Despite the attention paid to the possibility of resource demand motivations behind waste imports [25], there was not sufficient evidence to support this hypothesis. It was not until the seminal work of Higashida and Managi [24] that proof of RHH could be established. The authors found that countries with higher wages per capita and GDP per capita imported more recyclable wastes, whereas developing countries imported wastes from the more developed countries with expanded industries and strong economic growth. Sawhney et al. [17] found that India’s abundant labor force and domestic demand for metal are the key factors driving the country’s wastes metals import. In general, neither the waste trade is motivated by PHH nor has RHH been unanimously supported by empirical evidence.
According to the pollution externalities theory, in an open economy, trading wastes creates negative effects on society that can be resolved through environmental regulations [26,27]; the Basel Agreement is one example. Various literature evaluated the effectiveness of multilateral environmental agreements and found that the Basel Convention does not significantly impact the flow of wastes trades [28,29,30]. As a result, later studies focused on unilateral regulations. More specifically, studies that account for China’s increasing policies found that the waste import controls after 2010 have significantly reduced the country’s scrapped metals imports [10], waste wood imports [16], and plastics waste imports [18]).
PHH and RHH identify waste trade with dual characteristics, i.e., pollution and resources. Under PHH, countries with strong restrictive environmental regulations tend to dump wastes into countries with lax environmental regulations, which receive and disposes of (incinerate or landfill) wastes for profit. RHH assumes countries with strong demand for raw materials will look for cheap raw materials around the world by importing wastes for reuse within manufacturing. Whether motivated by pollution discharge or resource demand, the importation of significant volumes of wastes would result in negative externalities to the environment and the health of citizens. According to the pollution externalities theory, governments should intervene when the market fails to reduce negative externalities by strengthening and implementing environmental regulations and policies.
This paper utilizes a panel dataset of 28 imported waste varieties from 20 countries into China during the years 1995 to 2018. By using the fixed effects (FE) and least-squares dummy variables (LSDV) approaches, we assess whether China’s pattern of imported waste effect is based on PHH or RHH motives while analyzing the heterogeneous effects between countries and among waste categories. The discussion will target China’s environmental regulations and their restrictiveness on waste imports in recent years.

3. Overview of China’s Waste Import

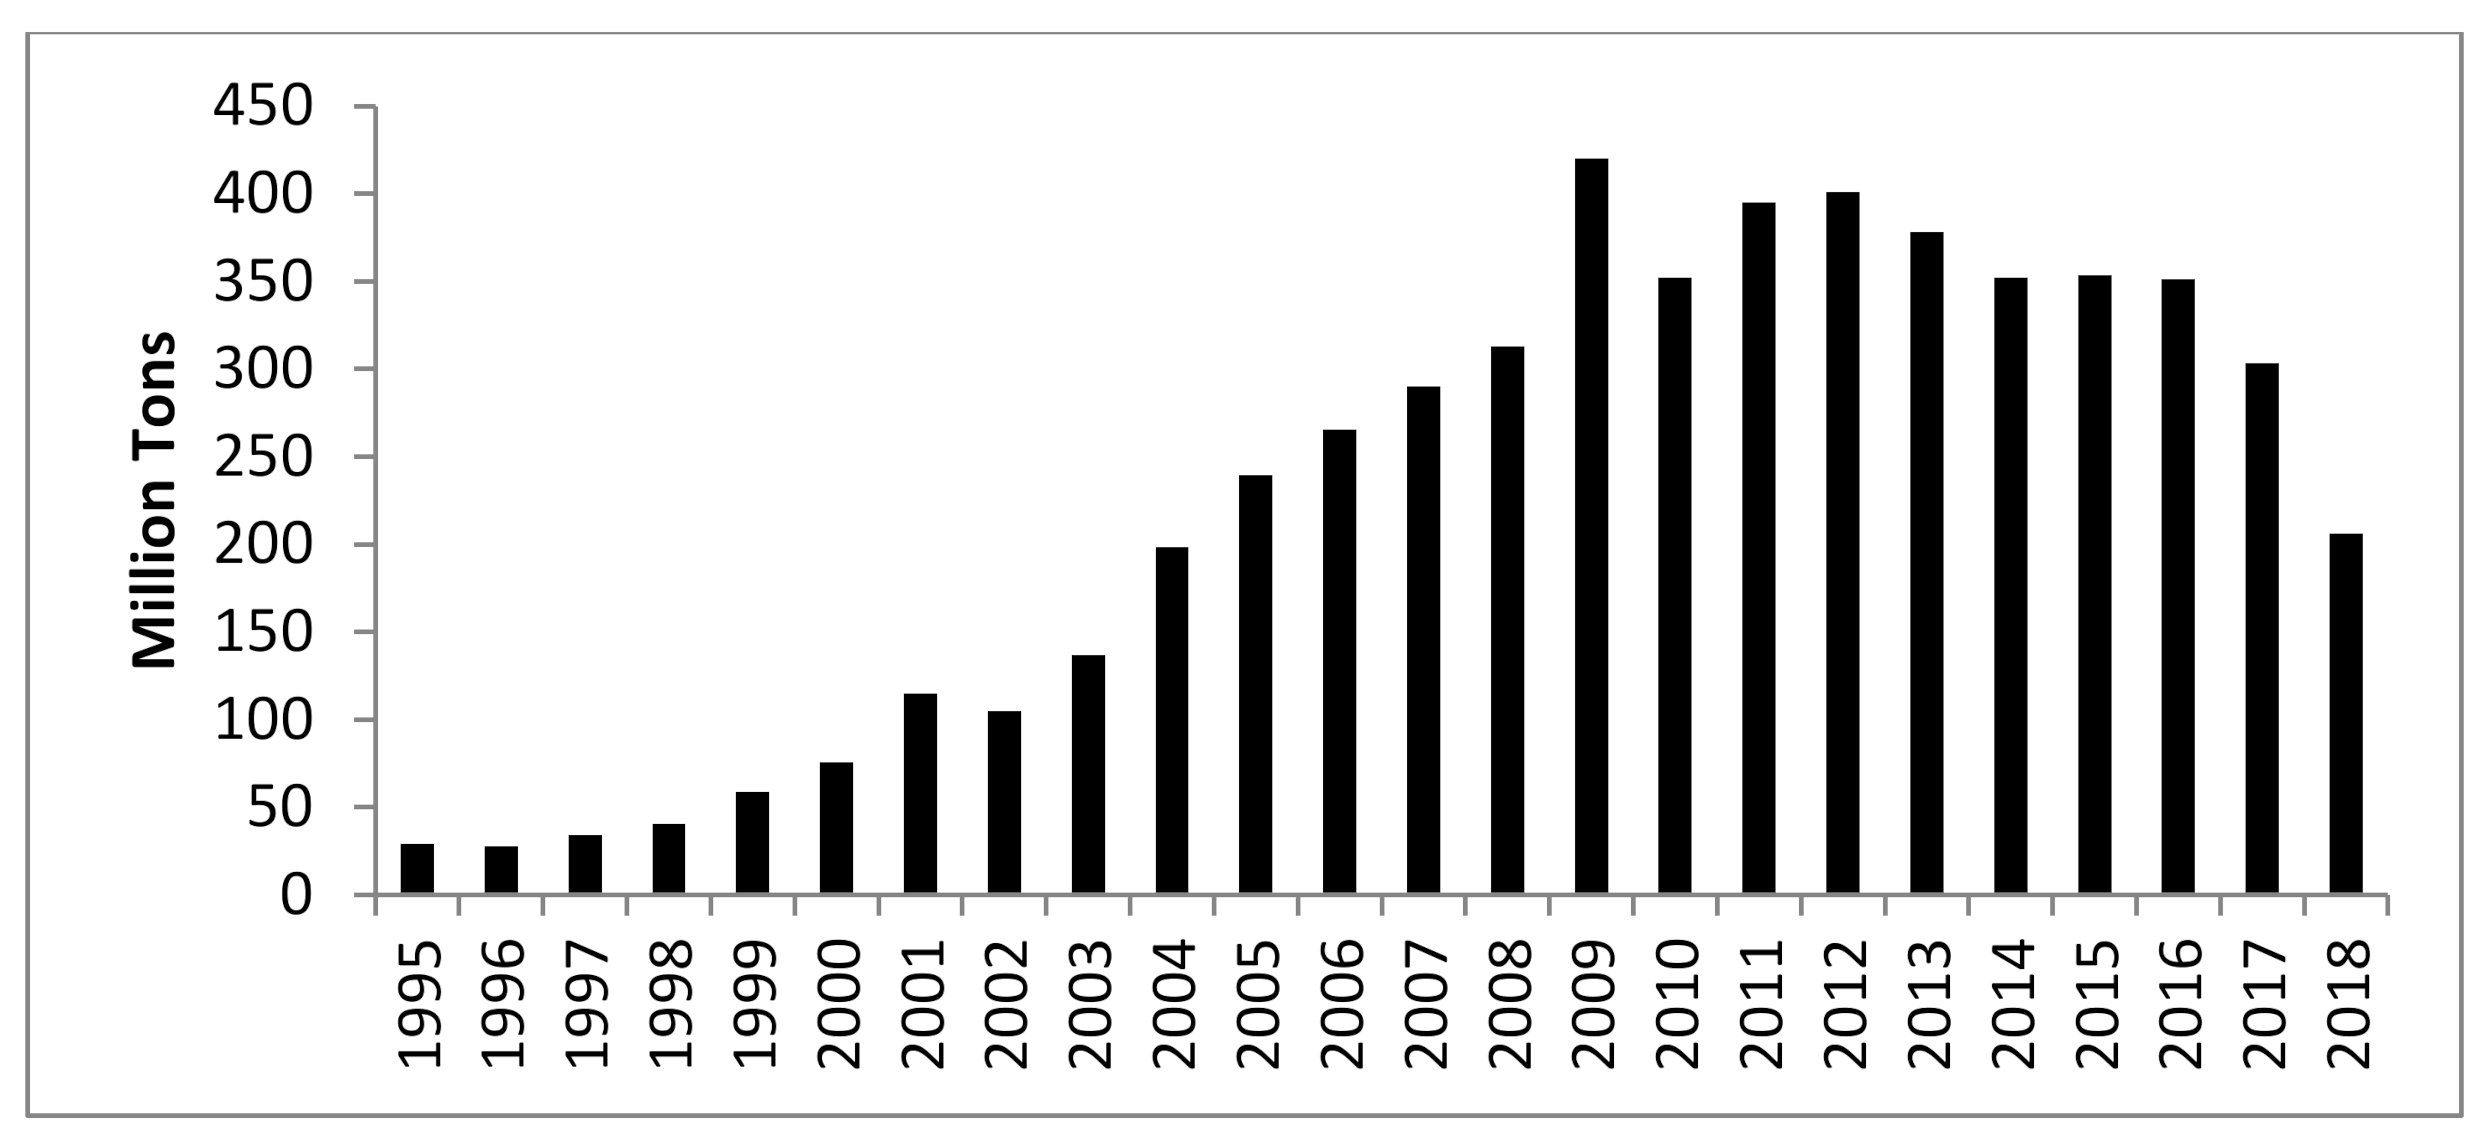
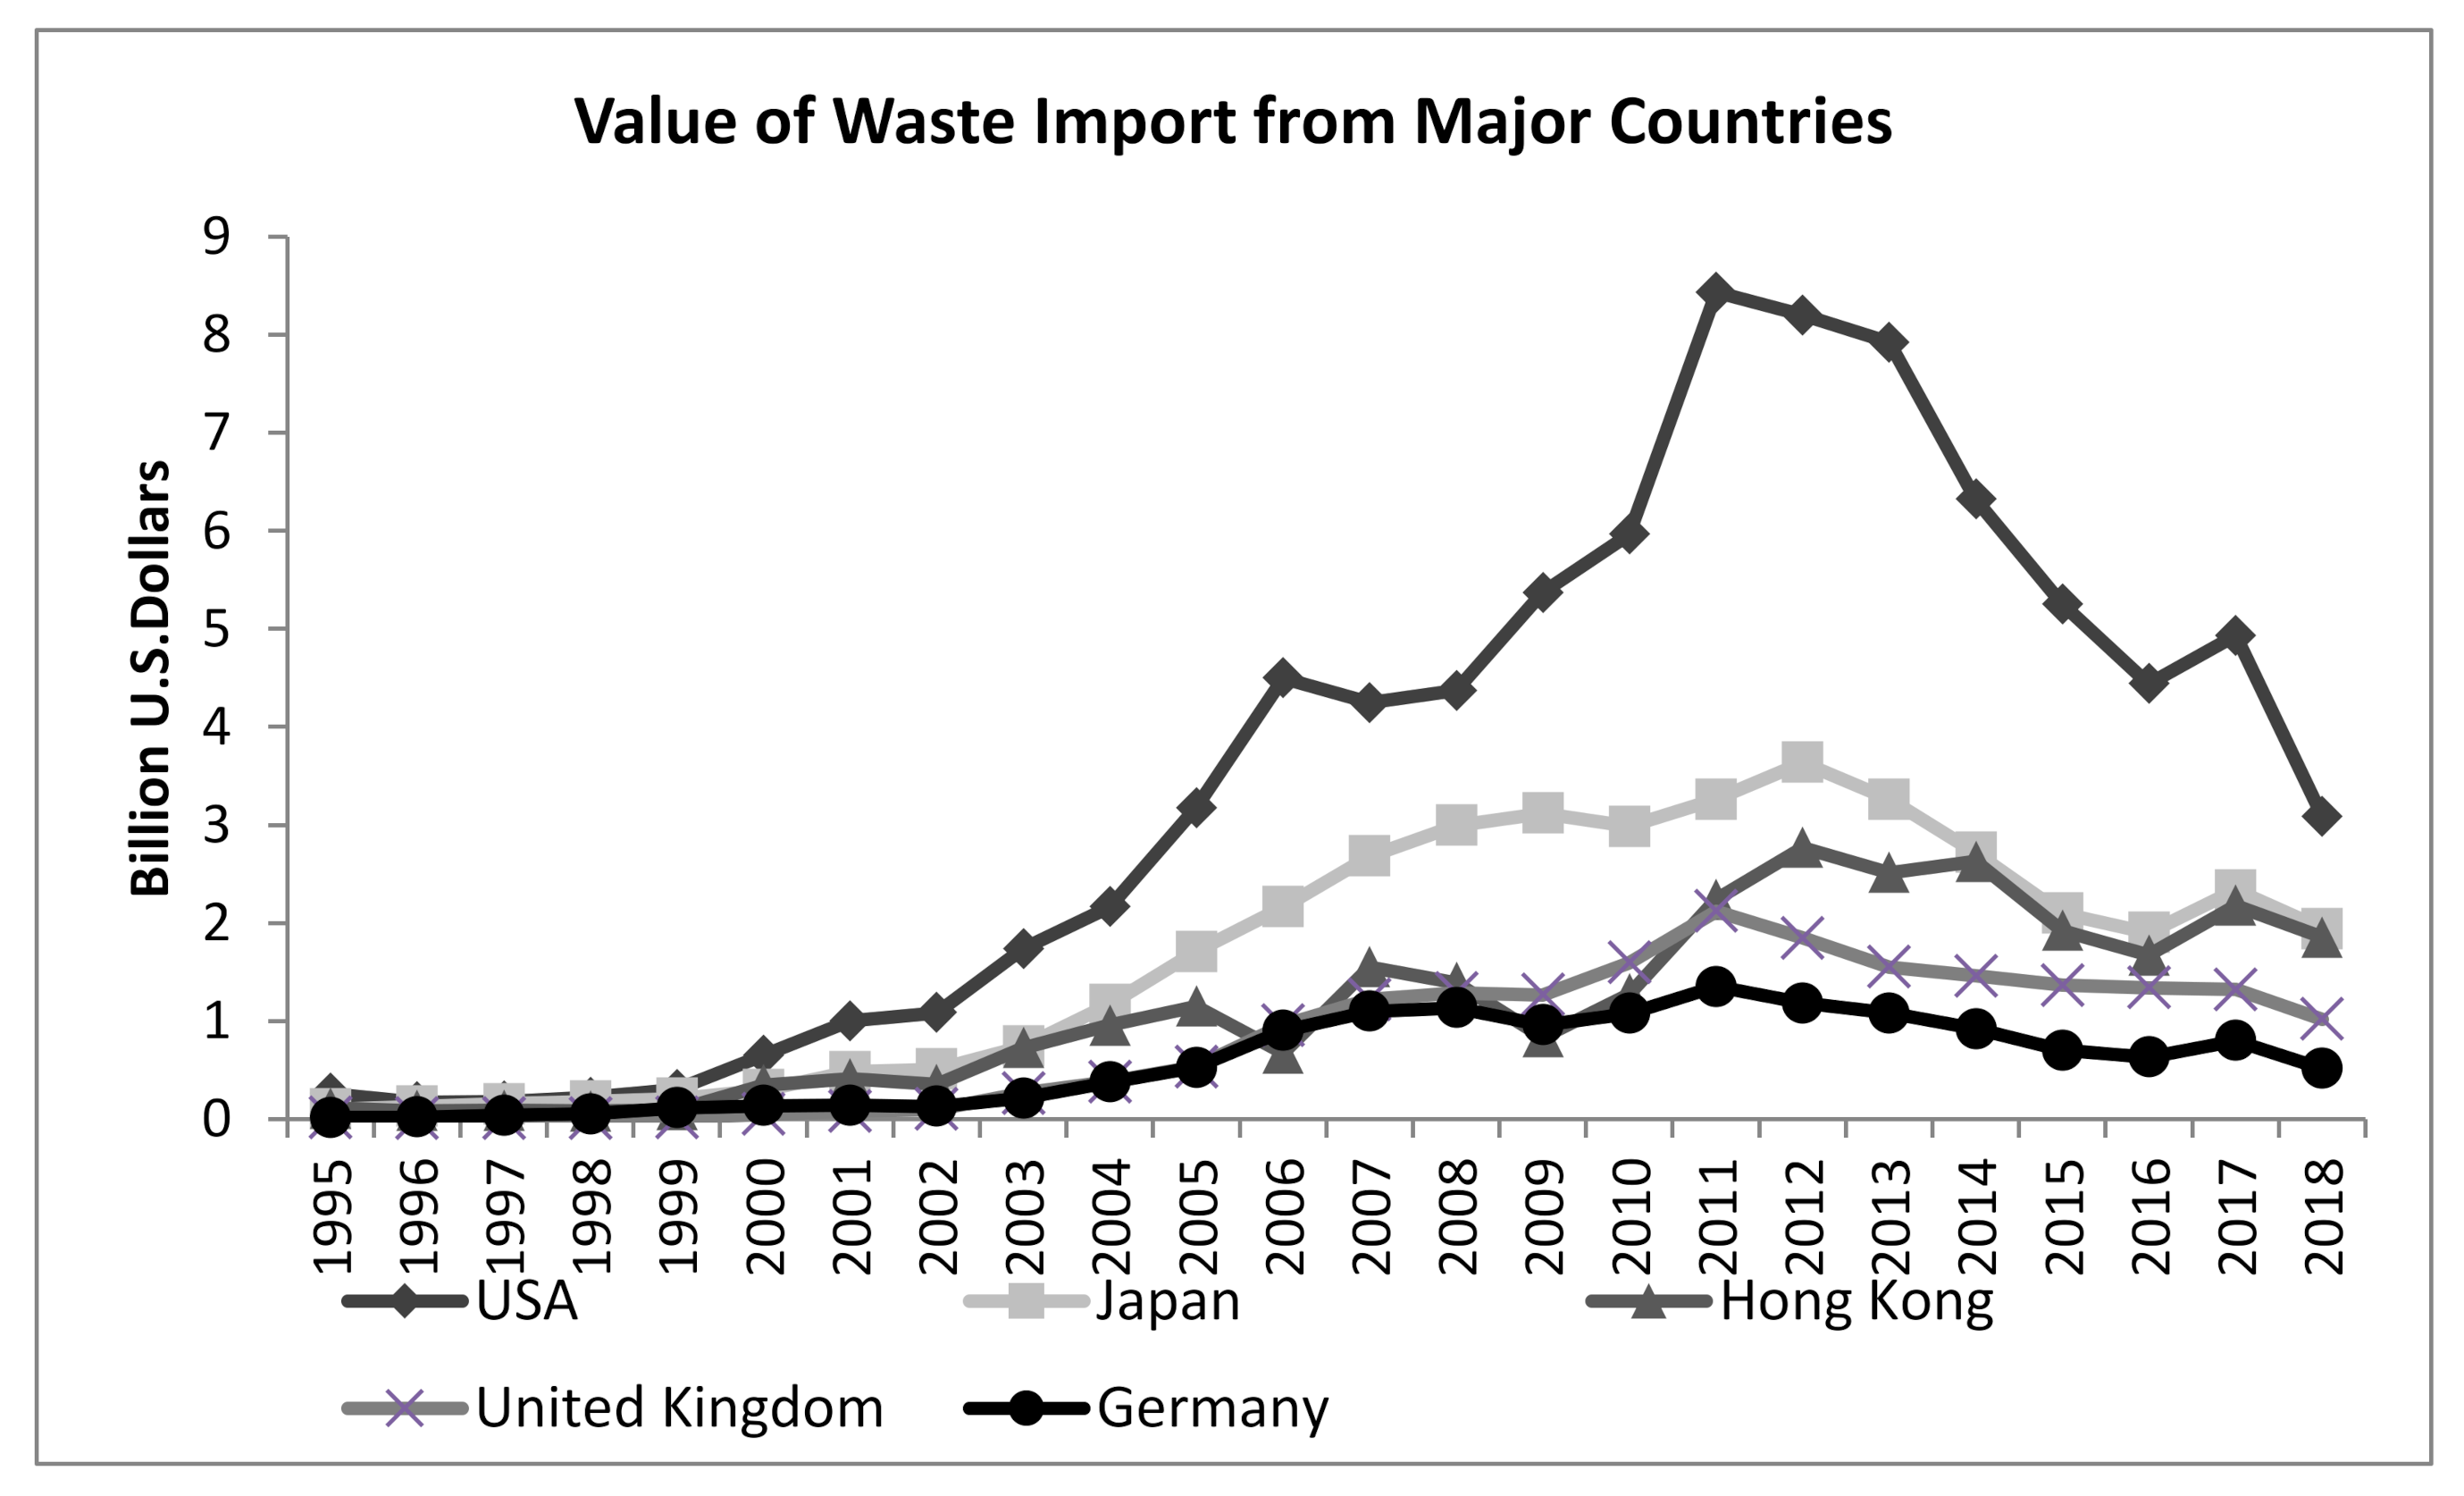
3.1. China’s Waste Import

China’s waste imports can be traced back to its reform and “opening-up.” After the country joined the WTO at the end of 2001, the value of the waste imports increased remarkably; peaking around $27.1 billion USD in 2011. However, following the enactment of the 2011 law “Measures on the Administration of Import of Solid Waste,” the value of imports for the six consecutive years to follow quickly declined but later rebounded. In 2017, the “Implemented Plan on Banning Entry of Foreign Garbage and Reforming the Administrative System of Solid Waste Importation” caused the import value to drop to $13.4 billion USD a year later (Figure 1).
Figure 2 indicates the quantity of China’s waste imports between 1995 and 2018. Following a similar flow to the value of waste imports, the total quantity displayed downward trends after the restrictive environmental laws took effect in 2011 and 2017.
According to Kellenberg [7], 62 varieties of products at the HS6 level could be treated as traded wastes. For China, 28 of them are the highest value of imports in various waste products with a share of 99.4% in 2018. Using a similar methodology of separation to Sun [16] and Okubo et al. [15], we split the import of the wastes for these 28 varieties into four categories of wastes—metal, paper, plastic, and textile. The categories of waste are presented in Table 1.
In 2018, metal was the highest value of wastes imported, taking around 78.4% of total waste imports. Paper accounted for a share of 20.2% of the value of total waste imports; in the same year, 0.5% of wastes imports were plastic and 0.3% were from the textile category. A combined value of the remaining 34 varieties of waste products accounted for 0.6%.
Figure 3 indicates China’s import values and quantities for these four categories, in which patterns of metal waste and paper waste show similarity to the total waste imports, which were impacted by the laws imposed in 2011 and 2017. For plastic waste and textile waste, the import values increased after 2011 but declined dramatically following the law banning entry of foreign garbage. Import values are just $67.8 million USD and $41.8 million USD in 2018, 3.9% and 18.9%, respectively, when compared with their highest import values in 2013 and 2014.
In 2018, the top five countries and regions exporting wastes to China were the United States, Japan, Hong Kong, United Kingdom, and Germany. China imported 62.6% of all waste products from these five countries. All major orientations of wastes imported by China are from developed economies. Figure 4 indicates China’s import value of waste products from these top five countries. Indications are that all major locations were also impacted by the more restricted environmental regulations enacted in 2011 and 2017. Notably, there are clear declining trends after the promulgation of these laws.

3.2. China’s Laws on Waste Imports

Attributed to a lack of restrictive regulations and inefficiencies in the implementation of laws, China’s waste imports increased with relatively high acceleration before 2007. Yoshida et al. [9], Velis [11] and [12] found that China was the major waste importer due to relatively less restrict regulations, especially in the high growth of waste imports from developed countries (according to Kellenberg [7], 1% increase on environment regulation gap between trade partners will increase waste trade 0.32%). Impacted by the global financial crisis, the growth rate subsequently slowed from 2007 to 2009 but recovered in 2010.
In August 2011, “Measures on the Administration of Import of Solid Waste” was endorsed. According to this law, any firms without the licenses issued by the Ministry of Environmental Protection of China (MEP) are prohibited from trading waste. China’s Customs Department has been empowered to tracking all containers that include waste products. The law, which established the quota for waste imports, has banned a variety of wastes eligible for import. For different categories, the values of metal waste and paper waste declined. However, the value for plastic waste and textile waste showed no signs of decline, despite accounting for a relatively small fraction of total waste imports. Due to the rapid development of e-business in China, there has been a fast-growing demand for paper used packaging of goods. As a likely result, we are unable to identify any contraction in the quantity of paper waste after 2011.
In 2017, President Xi Jinping proposed that “lucid waters and lush mountains are invaluable assets”. In the report delivered at the 19th National Congress of the Communist Party of China 2017, President Xi said, “Building an ecological civilization is vital to sustain the Chinese nation’s development. We must realize that lucid waters and lush mountains are invaluable assets and act on this understanding, implement our fundamental national policy of conserving resources and protecting the environment, and cherish the environment as we cherish our own lives. We will adopt a holistic approach to conserving our mountains, rivers, forests, farmlands, lakes, and grasslands, implement the strictest possible systems for environmental protection, and develop eco-friendly growth models and ways of life.” This led to significant improvements in the efficiency of implementing environmental regulations, and within the same year the “Implementation Plan on Banning Entry of Foreign Garbage and Reforming the Administrative System of Solid Waste Importation” was promulgated. According to this law, an additional 24 varieties of waste products imports are banned. Four of them are waste metals, eleven varieties are waste textiles, eight varieties are waste plastics, and one is waste paper. After 2017, both value and quantities for all categories of waste imports declined, especially for plastic waste and textile waste. Compared to 2017, the value of plastic waste dropped by 90.8% in 2018, while the value of textile waste dropped by 67%. In addition, waste import values declined from both developed and developing economies, which led to an overall 23.9% decline in 2018 when compared with 2017.

4. Methodology and Data

4.1. Econometric Specification

Earlier research offers various explanations regarding the motivations for the trading of waste, particularly for countries with restricted environmental regulations that export wastes to countries without. According to Kellenberg [7], these motivations can be broadly divided into two hypotheses. The first relates to exporters simply searching for destinations to dispose of waste products. Due to the differences in the implementation efficiency of environmental regulations across countries, the flow of waste products is likely to originate from a developed economy with strict regulations to a developing economy bearing lesser restrictions. This could be referred to as PHH.
The second hypothesis relates to importers in search of waste products as intermediate inputs, generating demand for waste-products-searching within the recycling market. Here, developing economies’ demand is relatively higher for two reasons. One is the relatively less restrictive regulation within developing countries, which leads to a lower operating cost for wastes import firms (see, for instance, Yoshida et al. [9], Velis [11], and [10]). The other is attributed to the developing countries’ faster-growing manufacturing industries that led to higher demand for wastes used as an intermediate input (see Higashida and Managi [24] and Sawhney et al. [17]). This aligns with Higashida and Managi’s [24] findings that waste imports benefit the developing economies’ manufacturing industries, while Gregson and Crang [2] broadly promoted that the trading of waste products is an important part of the global economy. Such motivations could be referred to as RHH.
All forms of motivation can result in future environmental costs to be borne by society. Thus, according to Antweiler et al. [21] and Henderson and Managi [31], this will lead destinations’ governments to increase their environmental laws restricting the importation of waste products. As such, the primary objective of this research is to investigate whether China’s waste imports are motivated by PHH or RHH. Following Kellenberg [7], Gregson and Crang [2], and Petridis et al. [19], we specified the model as follows:
l n X c j k t = α + β 1 P H H c j t + β 2 R H H c t + γ C + I j + I k + I t + ε c j k t
where X c j k t represents China’s waste imports from country j, for waste product k at time t. I j is the fixed effect for orientation j, which will absorb the country’s specific effects; I k is the fixed effect for industry k, which will absorb the industry-specific effects; I t is the time fixed effect, which will absorb the effects varying across time; and ε c j k t is the error term. P H H c j t represents the array of variables for PHH. Kheder and Zugravn [32], Ma et al. [33], and Wen and Dai [33] used the difference of GDP per unit amount of carbon dioxide emission between orientation and destination to denote the difference in the effectiveness of environmental regulation implementation. Ma et al. [33] and Wen and Dai [33]) argued that using GDP/CO2 emissions is a better measure of the effects of environmental regulation compared with directly using the degree of environmental governance. Directly, the second method cannot comprehensively reflect the factors of the government’s implementation of a series of laws, which is one of the reasons China’s waste imports increased rapidly before 2011 despite environmental regulations already existing. This reveals that a country with restricted environmental regulations exports waste products to a country with lesser restricted environmental regulations, which can be treated as a proxy for PHH. On the other hand, Baggs [13], Lepawsky and McNabb [34], Kusch and Hills [35], Kumar et al. [36], and Balsalobre-Lorente et al. [37] adopted the difference of GDP per capital between orientation and destination as an alternate proxy. In this paper, we adopted both proxies for PHH. R H H c t denotes the variable for RHH. As pointed out by Higashida and Managi [24] and Gregson and Crang [2], waste products are important intermediate inputs in the recycling market. Thus, there is an expected increase in demand for waste products resulting from increased demand for final goods. The two variables used to estimate this effect are China’s import value of intermediate material excluding all waste products and China’s export value of products that use waste-related raw material, where product selection follows Dussaux [38].
The vector of control variables, denoted by C, follows studies by Kellenberg [7] and Petridis et al. [19], which include contiguity (dummy variable equals 1 if China and orientation share a border), common language (dummy variable equals 1 if China and orientation use same official language), China’s GDP, orientations’ GDP, and free trade agreements (dummy variable equals 1 if China and orientation have a free trade agreement). Additionally, the use of several patents weighted by population is included to control for technological development, while waste products tariffs were added following Dussaux [38].
Given China’s relatively large trade surplus on goods, Kellenberg [6] and Sun [16] argued that there are substantial profits generated from importing waste products in the existence of “reverse-haulage” logistics. That is, there exists a large number of empty containers on the “back-run” routes to China where importers will utilize the extra capacities of shipping by importing waste products. Thus, we include China’s trade surplus with the orientation as consideration for these “back-run” effects. We complete the model with fixed effects and a disturbance term.
Antweiler et al. [21] and Henderson and Millimet [31] revealed that environmental regulations impact the value of trade. Since 2011, China has improved the implementation efficiency of its environmental regulation, and it is believed that the endorsement of the 2017 law leads to huge impacts on China’s plastic and copper waste imports (Hu et al. [18]; Wang et al. [10]). To investigate the impact of China’s environment laws promulgated in 2011 and 2017, the empirical model is then specified as follows:
l n X c j k t = α + β 1 P H H c j t + β 2 R H H c j t + β 3 P H H c j t L a w c t + β 2 R H H c t L a w c t + γ C + I j + I k + I t + ε c j k t
where the L a w c t represents a dichotomous variable that denotes the endorsement of China’s environmental laws in 2011 and 2017. P H H c j t L a w c t captures the regulatory impact under PHH, whereas R H H c t L a w c t is used to capture the regulatory impact on resource hunting. The omission of the L a w c t variable (independent) was due to its perfect collinear relationship with the time fixed effect I t .
Because reasons for China’s waste imports from different countries may vary, we followed earlier research by Baggs [13], Gregson and Crang [2], and Sun [16] to classify the source countries into developing economies and developed economies for regression Equations (1) and (2). We also examined the determinants of waste imports by categories because, in addition to the effects of environmental regulations, different categories of waste matter in the import industry.

4.2. Data and Descriptions of Variables

This study utilized 28 varieties of waste products with the highest import value at the HS6 level according to Kellenberg [7]. This accounted for a share of 99.4% of China’s total waste imports in 2018. Product wastes were separated into four categories—metal, paper, plastic, and textile—and presented in Table 1. We constructed the panel dataset to include 20 countries and regions (Australia, Belgium, Canada, Chile, Colombia, France, Germany, Hong Kong, Italy, Japan, Korea, Malaysia, Mexico, the Netherlands, Philippines, Singapore, Spain, Thailand, the United Kingdom, and the USA) that China imported more than 91% of its waste from in 2018 and averaged 90% between 1995 and 2018. Table 2 presents the data source and descriptions of variables.
The observed variation levels of the variable data identified in Table 2 are summarized as statistical measurements and displayed in Table 3.

5. Results

Table 4 presents the baseline results of Equation (1). The P-value for the Hausman test is 0.589, which fails to reject the null hypothesis that the differences in coefficients are non-systematic. Therefore, we adopted the random effects panel analysis, which is consistent with Petridis et al. [19]. Columns (1) to (4) analyze PHH and RHH for China’s waste import without Hong Kong (between 1995 and 2018, 96.2% of Hong Kong’s waste exports to the mainland were re-exports from other locations.). There is a relatively weak but positive sign for PHH coefficients. However, RHH coefficients are consistent and positively significant, suggesting that the most important motivation for China’s waste imports relates to “searching for resources”. There is also some, but weak, motivation based on the pollution haven premise.
Following Bun and Klviet [39] and Meschi and Vivarelli [40], columns (5) to (8) report the estimates with the LSDV method to check the robustness of the results. The results depict consistency with earlier findings. The results are consistent with Table 4. Columns of RE refer to the results of the random-effect analysis, whereas the LSDV columns refer to results of the least square dummy variables analysis.
Hong Kong’s activity was reintroduced into the model (see Table A1), the results for PHH remains consistent. The coefficient of L n R H _ e x p o r t c k t as a proxy of RHH is also consistent; however, it is negative due to the distortion caused by Hong Kong’s wastes re-export. Acting as a hub for waste import, the value of re-export is unable to comprehensively reflect the factors of Hong Kong’s environmental regulations. Hence, Hong Kong’s re-export value is excluded from the analysis below. We also used the logarithmic transformation of China’s waste import quantities as the dependent variable for robust verification.
Table 5 presents the baseline results of Equation (2), where columns (1) to (4) presents China’s endorsement of environment law’s impact on PHH and RHH. For PHH, the influence of the regulations is mixed. Results are not robust based on the choice of different proxy variables, which is likely caused for two reasons. First, the pollution haven effect is not the major reason for China’s waste imports (significant at a 10% level for L n G D P C O 2 _ g a p c j t , which is consistent with the results in Table 4). Second, the impact of the regulations varies across countries and categories of waste products.
Under RHH, the coefficients are reflective of those in Table 4, with relatively consistent regulation impacts. Most coefficients representing interaction terms between the resource hunting proxy variables and dummy variables on laws are significantly negative, especially following the endorsement of the 2017 law. We, therefore, posit that China’s environment laws are focused on restricting importers from searching for waste products as intermediate inputs. Columns (5) to (8) stand as robustness verification with LSDV estimation. The results are consistent with columns (1) to (4). Similar to equation (1), when the logarithmic transformation of China’s waste import quantities is used as the dependent variable, the results remain consistent. The results of the RE and LSDV estimates in Table 5 match those expressed in Table 4.
From the results presented, it can be derived that the primary motivation for China’s waste imports is related to a search for resources, with impact possibilities due to the re-export agenda. Therefore, China’s environment laws seek to restrict importers from searching for intermediate inputs, which explains the varied impact of policy across different sectors.

6. Further Discussions

Table 6 presents the estimation results based on categorized origins of waste imports, i.e., developed or developing, with columns (1) to (4) presenting the results for developed countries. Under PHH, the variable L n G D P C A P _ g a p c j t is positive and significant, while the alternate proxy produces an insignificant impact. It provides evidence, though weak, that China’s waste imports are driven by the pollution haven theory, which is consistent with the results from Table 4 and Table 5. This suggests unclear impacts from China’s environmental laws under the pollution haven narrative, which is also consistent with the results presented in Table 5. Under RHH, the coefficients are positive and significant, suggesting that China’s importers are searching for intermediate inputs byway of waste products imported from developed countries. The endorsement of the 2011 environmental law did little to discourage resource hunting from developed economies. However, the 2017 law reduced the motivation to engage in such activities.
For developing economies, the results are listed in columns (5) to (8). The proxy variables for PHH is indicated as negative, which suggests that motivation under PHH provides no statistical support regarding China’s waste imports from developing countries. Thus, 2011 and 2017 environmental laws are ineffective. Under RHH, the findings are positive and significant. Compared with the results of columns (1) to (4), China’s resource hunting effect from developing countries is significantly larger than what has originated from developed countries. Both laws have restricted China’s waste product searching from developing countries. Additionally, we conducted a robustness check by replacing the dependent variable with the logarithmic transformation of China’s waste import quantities. The results remained consistent.
Appendix ATable A2 and Table A3 present findings for different categories of waste from developed economies and developing economies. Appendix A Table A2 shows the pollution haven effects of plastic waste and textile waste categories. There is no clear evidence that China’s environmental laws imposed any significant effect under the PHH of these two categories because of the relatively small import value compared with total waste imports. For RHH, the coefficients on metal waste are significantly positive. Chinese importers’ demand-search for waste metals from developed countries because manufacturing inputs were unabated by the 2011 law. However, the 2017 law discourages such import practices. The results are consistent with the results in columns (1–4) from Table 6.
Appendix ATable A3 presents the results for different categories from developing countries. Under PHH, all proxy variables for all categories are either negative or insignificant, suggesting that there is no evidence that China’s waste imports from developing countries resulted from motives under PHH. Consequently, China’s environment regulation has no significant impact on the pollution haven effect for all categories. However, there is relatively strong evidence that China imports all categories of waste from developing countries due to “resource hunting” motives, with coefficients significantly larger when compared with Table 6. The law implemented in 2011 fail to impact resource hunting motivations for metal waste imports. However, the law of 2017 significantly reduced these motives for metal waste imports from developing countries. This is similar to the effects on imports from developed economies for the same categories. For paper waste, plastic waste, and textile waste categories, both laws reduced China’s importers’ motivation for searching for waste imports as intermediate inputs. Generally, the results are consistent with columns (5–8) in Table 6. We also replaced the independent variable with quantity as a robustness check. The results are presented in Table A4, Table A5, and Table A6. The findings are mainly consistent with those presented in previous tables. Table A7 presents the results for different periods crossing 23 years. Both PHH and RHH motivations diminished between 2015 and 2018. It is consistent with the results in Table 5. The endorsement of the 2017 law deterred motivations of waste import.
Overall, there is no strong evidence that China imports waste in accordance with PHH. The major reason for the waste imports follows RHH. There are pollution haven effects on China’s plastic waste and textile waste imports from developed countries. However, due to the relatively small value for these two categories, the average effect is relatively weak. On the other hand, Chinese importers are strongly motivated to import waste products to be used as intermediate manufacturing inputs. China imports metal waste from all countries and paper waste, plastic waste, and textile waste from developing countries for reasons categorized under RHH. The environmental law of 2011 focused on the resource hunting effect on paper waste, plastic waste, and textile waste categories, while the 2017 version of the law restricts resource hunting activities on all categories of waste.

7. Conclusions and Policy Implication

Previous research has sought to explain the motivations of a country, especially China as the world’s largest waste import country, for importing waste products by using two hypotheses—PHH and RHH. Under these two umbrella assumptions, this paper utilizes a panel dataset of four categories and 28 varieties of traded waste products from 1995 to 2018 to analyze which of the two hypotheses is the major driving force for China’s waste imports. The findings reveal that, firstly, China’s waste imports are primarily a cause of “resource hunting” motives. Though “pollution haven” motives exist for the importation of plastic waste and textile waste from developed countries, such effects are marginal due to the small trade value in these two categories. Metal waste imports from developed countries and all categories of waste imports from developing countries are stimulated by the demand in China for seeking resources as cheap intermediate manufacture inputs [41,42]. Different from Kellenberg’s (2012) view that developing countries import waste due to lax environmental regulations, this paper finds that the resource-seeking motivation of China’s waste import supports Higashida and Managi [24]. Secondly, this study found that the motivation for polluting the paradise and the motivation for resource demand have heterogeneous effects on China’s waste imports between developed and developing countries, and between the metal, wood, plastic, and textile industries. China’s scrap metal imports are for resources, and imports of plastic waste mainly come from developed countries, which is consistent with Sawhney et al. [17] and Hu et al. [18]. Thirdly, the environment laws endorsed in 2011 and 2017 have significantly restricted resource hunting activities, which is consistent with Sun [16]. More specifically, the environmental law of 2011, which affects paper waste, plastic waste, and textile waste, reduced waste imports from developing countries significantly, whereas the law from 2017 restricts resource hunting motives for every sampled category from all orientations.
Although the Chinese government has gradually strengthened the control of waste imports, a large amount of demand for the import of classified waste products continues. China’s future environmental policy should have a strategic structure, disposing of different types of waste separately to ensure that various resources are fully collected and avoid becoming a pollution paradise, i.e., a place for importation of plastic waste and textile waste from developed economies.
Meanwhile, relatively large amounts of domestic waste products in China are still unclassified and yet to be processed. At present, in China’s larger cities, such as Beijing and Shanghai, waste separation and recycling measures have been adopted. However, these measures have not yet spread throughout the country. China’s waste sorting and recycling systems need to be more efficient and replace imports by looking for resources from the local waste market. The findings of this study have important implications for China on how to regulate waste imports and for other developing countries’ sustainable economic development.

Author Contributions

Conceptualization, Y.M. and B.L.; methodology, Y.M. and Z.Z.; software, B.L.; validation, Y.M. and A.A.; formal analysis, Z.Z.; data curation, B.L.; writing—original draft preparation, Y.M. and B.L.; writing—review and editing, A.A. and Z.Z.; project administration, Y.M.; funding acquisition, Y.M. All authors have read and agreed to the published version of the manuscript.

Funding

This research was funded by the Ministry of Education of China Youth Fund Program, 17YJC790110 and the Department of Education of Liaoning Province’s Youth Fund Program, LN2017QN017.

Institutional Review Board Statement

Not applicable.

Conflicts of Interest

The authors declare no conflict of interest.

Appendix A

Table A1. Baseline results of Equation (1) within Hong Kong.
RERERERELSDVLSDVLSDVLSDV
(1)(2)(3)(4)(5)(6)(7)(8)
L n G D P C O 2 _ g a p c j t 0.45 ** 0.45 ** 0.45 ** 0.45 **
(2.07) (2.07) (2.10) (2.10)
L n G D P C A P _ g a p c j t −0.43 −0.43 −0.43 −0.43
(−0.49) (−0.49) (−0.54) (−0.54)
L n R H _ i m p o r t c t −28.04 ***−28.15 *** 1.31 ***1.00 *
(−5.37)(−5.39) (14.83)(1.92)
L n R H _ e x p o r t c k t 29.62 ***29.74 *** 1.40 ***1.04 *
(5.37)(5.39) (16.20)(1.89)
ControlYesYesYesYesYesYesYesYes
Observations12,81312,81312,81312,81312,16912,16912,16912,169
R20.140.140.140.140.200.200.200.20
All models include the country (FE), industry (FE), and time (FE), with robust standard errors corrected. T statistics are in parentheses. ***, **, and * denote significance at 1%, 5%, and 10%, respectively.
Table A2. Results for four categories of waste imports from developed countries.
Metal WastePaper WastePlastic WasteTextile Waste
(1)(2)(3)(4)(1)(2)(3)(4)(1)(2)(3)(4)(1)(2)(3)(4)
L n G D P C O 2 _ g a p c j t 0.58 0.58 −0.14 −0.14 −1.30 * −1.30 * −0.31 −0.31
(1.46) (1.46) (−0.19) (−0.19) (−1.73) (−1.73) (−0.51) (−0.51)
L n G D P C O 2 _ g a p c j t L a w 2011 −0.33 −0.33 0.08 0.08 0.09 0.09 −0.30 −0.30
(−1.22) (−1.22) (0.15) (0.15) (0.18) (0.18) (−0.74) (−0.74)
L n G D P C O 2 _ g a p c j t L a w 2017 1.45 *** 1.45 *** 0.38 0.38 −0.25 −0.25 1.45 ** 1.45 **
(3.44) (3.44) (0.48) (0.48) (−0.32) (−0.32) (2.24) (2.24)
L n G D P C A P _ g a p c j t 2.74 2.74 2.17 2.17 7.23 ** 7.23 ** 6.10 ** 6.10 **
(1.62) (1.62) (0.68) (0.68) (2.25) (2.25) (2.34) (2.34)
L n G D P C A P _ g a p c j t L a w 2011 0.76 *** 0.76 *** 0.54 0.54 0.94 ** 0.94 ** 0.92 *** 0.92 ***
(3.40) (3.40) (1.29) (1.29) (2.27) (2.27) (2.67) (2.67)
L n G D P C A P _ g a p c j t L a w 2017 −0.89 ** −0.89 ** −0.74 −0.74 −1.29 * −1.29 * −1.01 −1.01
(−2.23) (−2.23) (−0.98) (−0.98) (−1.72) (−1.72) (−1.64) (−1.64)
L n R H _ i m p o r t c t 19.88 **22.89 *** 16.2319.89 21.9039.38 ** 3.2515.10
(2.56)(2.66) (1.11)(1.22) (1.51)(2.44) (0.27)(1.14)
L n R H _ i m p o r t c t L a w 2011 0.18 **0.21* 0.110.18 0.060.43 ** 0.010.23
(2.43)(1.84) (0.80)(0.87) (0.44)(2.02) (0.06)(1.35)
L n R H _ i m p o r t c t L a w 2017 −0.17 ***−0.04 −0.10−0.05 −0.10−0.08 −0.060.04
(−3.21)(−0.80) (−1.04)(−0.46) (−1.02)(−0.83) (−0.80)(0.53)
L n R H _ e x p o r t c k t 10.44 **11.94 *** 24.2129.70 9.7117.18 ** 1.144.84
(2.57)(2.65) (1.10)(1.22) (1.52)(2.43) (0.29)(1.11)
L n R H _ e x p o r t c k t L a w 2011 −0.01−0.01 −0.35−0.37 −0.28 ***−0.14 −0.030.11
(−0.35)(−0.25) (−1.21)(−1.30) (−2.73)(−1.16) (−0.52)(1.13)
L n R H _ e x p o r t c k t L a w 2017 −0.09 ***0.06* −0.020.06 −0.030.05 −0.050.13 ***
(−2.92)(1.70) (−0.41)(0.98) (−0.49)(0.65) (−1.17)(2.62)
ControlYesYesYesYesYesYesYesYesYesYesYesYesYesYesYesYes
Obs4157415741574157118511851185118511851185118511851791179117911791
R20.140.140.140.140.160.160.160.160.140.140.140.140.150.150.150.15
All models include the country (FE), industry (FE), and time (FE). Robust standard errors corrected. T statistics are in parentheses. ***, **, and * denote significance at 1%, 5%, and 10%, respectively.
Table A3. Results for four categories of waste imports from developing countries.
Waste MetalWaste PaperWaste PlasticWaste Textile
(1)(2)(3)(4)(1)(2)(3)(4)(1)(2)(3)(4)(1)(2)(3)(4)
L n G D P C O 2 _ g a p c j t −2.50 ** −2.50 ** −3.29 * −3.29 * −3.91 ** −3.91 ** −0.14 −0.14
(−2.44) (−2.44) (−1.72) (−1.72) (−1.97) (−1.97) (−0.09) (−0.09)
L n G D P C O 2 _ g a p c j t L a w 2011 −0.60 −0.60 0.64 0.64 −1.06 −1.06 −0.18 −0.18
(−1.25) (−1.25) (0.72) (0.72) (−1.16) (−1.16) (−0.25) (−0.25)
L n G D P C O 2 _ g a p c j t L a w 2017 0.84 0.84 2.55 2.55 0.47 0.47 4.18 4.18
(0.50) (0.50) (0.82) (0.82) (0.15) (0.15) (1.63) (1.63)
L n G D P C A P _ g a p c j t −6.37 ** −6.37 ** −2.81 −2.81 −8.13 −8.13 −4.96 −4.96
(−2.25) (−2.25) (−0.52) (−0.52) (−1.48) (−1.48) (−1.14) (−1.14)
L n G D P C A P _ g a p c j t L a w 2011 −0.10 −0.10 −0.76 −0.76 0.61 0.61 −0.43 −0.43
(−0.26) (−0.26) (−1.07) (−1.07) (0.83) (0.83) (−0.74) (−0.74)
L n G D P C A P _ g a p c j t L a w 2017 −0.12 −0.12 −0.85 −0.85 0.46 0.46 0.17 0.17
(−0.19) (−0.19) (−0.70) (−0.70) (0.37) (0.37) (0.17) (0.17)
L n R H _ i m p o r t c t 79.61 ***87.75 *** 53.48 ***50.70 *** 68.26 ***67.87 *** 75.27 ***74.05 ***
(6.66)(7.47) (4.49)(4.25) (5.57)(5.53) (7.76)(7.62)
L n R H _ i m p o r t c t L a w 2011 0.63 ***0.81 *** −0.44 **−0.39 ** 0.06−0.01 −0.22−0.20
(5.17)(6.93) (−2.22)(−2.09) (0.31)(−0.07) (−1.33)(−1.31)
L n R H _ i m p o r t c t L a w 2017 −0.47 ***−0.44 *** −0.62 ***−0.46 *** −0.48 **−0.45 *** −0.78 ***−0.54 ***
(−3.90)(−6.35) (−3.13)(−4.95) (−2.35)(−4.63) (−4.80)(−7.14)
L n R H _ e x p o r t c k t 41.74 ***45.91 *** 173.16 ***180.31 *** 36.84 ***29.04 *** 45.14 ***44.77 ***
(6.66)(7.47) (5.18)(5.48) (3.17)(2.59) (7.42)(7.51)
L n R H _ e x p o r t c k t L a w 2011 −0.14 ***−0.04 −2.29 ***−2.17 *** −0.62 ***−0.39 * −0.07−0.03
(−2.74)(−0.90) (−5.33)(−5.12) (−2.73)(−1.83) (−0.84)(−0.38)
L n R H _ e x p o r t c k t L a w 2017 −0.15−0.08 *** −0.25−0.06 −0.23−0.06 −0.33 **−0.07 *
(−1.47)(−2.90) (−1.27)(−1.40) (−1.11)(−0.67) (−2.07)(−1.79)
ControlYesYesYesYesYesYesYesYesYesYesYesYesYesYesYesYes
Obs1817181718171817519519519519519519519519777777777777
R20.160.160.160.160.210.200.210.200.190.190.190.190.180.180.180.18
All models include the country (FE), industry (FE), and time (FE), with robust standard errors corrected. T statistics are in parentheses. ***, **, and * denote significance at 1%, 5%, and 10%, respectively.
Table A4. Baseline results of Equation (1) with quantity as the dependent variable.
L n Q u a n t i t y c j k t RELSDV
(1)(2)(3)(4)(1)(2)(3)(4)
LnGDPCO 2 _ gap cjt −0.05 −0.05 −0.05 −0.05
(−0.22) (−0.22) (−0.23) (−0.23)
LnGDPCAP _ gap cjt −0.01 −0.01 −0.01 −0.01
(−0.01) (−0.01) (−0.01) (−0.01)
LnRH _ import ct 7.29 ***7.30 *** 0.83 ***0.82
(5.19)(5.04) (8.73)(1.35)
LnRH _ export ckt 11.39 ***11.40 *** 1.06 ***1.06 *
(4.69)(4.66) (11.08)(1.65)
ControlYesYesYesYesYesYesYesYes
Obs12,16912,16912,16912,16912,16912,16912,16912,169
R20.070.070.070.070.140.140.140.14
All models include the country (FE), industry (FE), and time (FE). T statistics are in parentheses. *** and * denote significance at 1% and 10%, respectively.
Table A5. Baseline results of Equation (2) with quantity as the dependent variable.
L n Q u a n t i t y c j k t RELSDV
(1)(2)(3)(4)(1)(2)(3)(4)
LnGDPCO 2 _ gap cjt 0.14 0.14 0.14 0.14
(0.55) (0.55) (0.58) (0.58)
LnGDPCO 2 _ gap cjt Law 2011 −0.76 *** −0.76 *** −0.76 *** −0.76 ***
(−4.42) (−4.42) (−4.26) (−4.26)
LnGDPCO 2 _ gap cjt Law 2017 0.76 *** 0.76 *** 0.76 ** 0.76 **
(2.65) (2.65) (2.45) (2.45)
LnGDPCAP _ gap cjt 0.05 0.05 0.05 0.05
(0.05) (0.05) (0.05) (0.05)
LnGDPCAP _ gap cjt Law 2011 0.19 * 0.19 * 0.19 * 0.19 *
(1.71) (1.71) (1.81) (1.81)
LnGDPCAP _ gap cjt Law 2017 0.04 0.04 0.04 0.04
(0.24) (0.24) (0.27) (0.27)
LnRH _ import ct 19.75 ***19.63 *** 0.90 ***0.89 *
(7.14)(7.09) (9.93)(1.86)
LnRH _ import ct Law 2011 0.12 ***0.06 0.03 *−0.03 **
(2.61)(1.43) (1.85)(−2.03)
LnRH _ import ct Law 2017 −0.13 ***−0.10 *** −0.03 *0.01
(−5.22)(−4.21) (−1.75)(0.42)
LnRH _ export ckt 11.49 ***11.69 *** 0.86 ***0.83 *
(4.70)(4.74) (9.38)(1.79)
LnRH _ export ckt Law 2011 −0.05 ***−0.10 *** 0.07 ***0.01
(−3.04)(−5.79) (4.44)(0.70)
LnRH _ export ckt Law 2017 −0.05 ***−0.01 −0.04 *0.00
(−2.71)(−0.89) (−1.90)(0.27)
ControlYesYesYesYesYesYesYesYes
Obs12,16912,16912,16912,16912,16912,16912,16912,169
R20.070.070.070.070.140.140.140.14
All models include the country (FE), industry (FE), and time (FE). T statistics are in parentheses. ***, **, and * denote significance at 1%, 5%, and 10%, respectively.
Table A6. Results for developed and developing countries with quantity as the dependent variable.
L n Q u a n t i t y c j k t Developed CountriesDeveloping Countries
(1)(2)(3)(4)(1)(2)(3)(4)
LnGDPCO 2 _ gap cjt −0.04 −0.04 −1.94 *** −1.94 ***
(−0.13) (−0.13) (−2.74) (−2.74)
LnGDPCO 2 _ gap cjt Law 2011 −0.91 *** −0.91 *** 0.59 * 0.59 *
(−4.17) (−4.17) (1.79) (1.79)
LnGDPCO 2 _ gap cjt Law 2017 1.13 *** 1.13 *** −2.61 ** −2.61 **
(3.31) (3.31) (−2.25) (−2.25)
LnGDPCAP _ gap cjt 5.20 *** 5.20 *** −8.85 *** −8.85 ***
(3.79) (3.79) (−4.51) (−4.51)
LnGDPCAP _ gap cjt Law 2011 0.46 ** 0.46 ** 0.65 ** 0.65 **
(2.57) (2.57) (2.50) (2.50)
LnGDPCAP _ gap cjt Law 2017 −0.02 −0.02 0.67 0.67
(−0.07) (−0.07) (1.47) (1.47)
LnRH _ import ct 12.70 ***12.79 *** 71.72 ***81.52 ***
(3.61)(3.63) (8.65)(10.05)
LnRH _ import ct Law 2011 0.17 ***0.10 * 0.55 ***0.77 ***
(2.92)(1.68) (6.45)(9.53)
LnRH _ import ct Law 2017 −0.11 ***−0.05 −0.23 ***−0.39 ***
(−3.28)(−1.35) (−2.76)(−8.23)
LnRH _ export ckt 6.24 ***6.31 *** 35.82 ***40.71 ***
(3.58)(3.61) (8.64)(10.04)
LnRH _ export ckt Law 2011 0.03−0.04 −0.21 ***−0.10 ***
(0.51)(−0.65) (−5.96)(−2.96)
LnRH _ export ckt Law 2017 −0.06 **0.01 0.07−0.06 ***
(−2.04)(0.25) (0.98)(−3.20)
ControlYesYesYesYesYesYesYesYes
Obs83188318831883183632363236323632
R20.060.060.060.060.120.130.120.13
All models include the country (FE), industry (FE), and time (FE). T statistics are in parentheses. ***, **, and * denote significance at 1%, 5%, and 10%, respectively.
Table A7. Time−phased results.
1995–20002001–20052006–20102011–20152015–2018
RERERERERE
L n G D P C A P _ g a p c j t −0.40 ***0.32 **0.45 ***0.56 ***−19.35 ***
(−3.94)(2.45)(3.07)(4.30)(−3.48)
L n R H _ i m p o r t c t 4.45 ***7.18 ***2.11 ***8.16 ***−18.38
(6.64)(4.94)(3.06)(3.26)(−0.95)
ControlYesYesYesYesYes
Obs29862616262725081432
R20.040.060.010.020.06
T statistics are in parentheses. *** and ** denote significance at 1% and 5%, respectively.

References

  1. Kellenberg, D. The economics of the international trade of waste. Annu. Rev. Resour. Econ. 2015, 7, 109–125. [Google Scholar] [CrossRef] [Green Version]
  2. Gregson, N.; Crang, M. From waste to resource: The trade in wastes and global recycling economies. Annu. Rev. Environ. Resour. 2015, 40, 151–176. [Google Scholar] [CrossRef] [Green Version]
  3. Almer, C.; Goeschl, T. The Sopranos redux: The empirical economics of waste crime. SSRN 2010, 1908–1921. [Google Scholar] [CrossRef] [Green Version]
  4. D’Amato, A.; Mazzanti, M.; Nicolli, F. Waste and organized crime in regional environments: How waste tariffs and the mafia affect waste management and disposal. Resour. Energy Econ. 2015, 41, 185–201. [Google Scholar] [CrossRef]
  5. Gray, W.B.; Shimshack, J.P. The effectiveness of environmental monitoring and enforcement: A review of the empirical evidence. Rev. Environ. Econ. Policy 2011, 5, 3–24. [Google Scholar] [CrossRef]
  6. Kellenberg, D. Consumer waste, backhauling, and pollution havens. J. Appl. Econ. 2010, 13, 283–304. [Google Scholar] [CrossRef]
  7. Kellenberg, D. Trading wastes. J. Environ. Econ. Manag. 2012, 64, 68–87. [Google Scholar] [CrossRef]
  8. Walter, I.; Ugelow, J.L. Environmental policies in developing countries. AMBIO 1979, 8, 102–109. [Google Scholar]
  9. Yoshida, J.; Kim, H.; Nagaki, A. Green and sustainable chemical synthesis using flow microreactors. ChemSusChem 2011, 4, 331–340. [Google Scholar] [CrossRef]
  10. Wang, C.; Zhao, L.; Lim, M.K.; Chen, W.; Sutherland, J.W. Structure of the global plastic waste trade network and the impact of China’s Import Ban. Resour. Conserv. Recycl. 2020, 153, 104591. [Google Scholar] [CrossRef]
  11. Velis, C.A. Global Recycling Markets-Plastic Waste: A Story for One Player–China; International Solid Waste Association—Global Waste Management Task Force (ISWA): Vienna, Austria, 2014. [Google Scholar]
  12. Michida, E. International Trade of Recyclables in Asia: Is Cross-border Recycling Sustainable? In Economic Integration and Recycling in Asia; Institute of Developing Economics: Chiba, Japan, 2011; pp. 9–27. [Google Scholar]
  13. Baggs, J. International trade in hazardous waste. Rev. Int. Econ. 2009, 17, 1–16. [Google Scholar] [CrossRef]
  14. Nunez-Rocha, T. Waste Haven Effect: Unwrapping the Impact of Environmental Regulation; Centre d’Economie de la Sorbonne: Paris, France, 2016. [Google Scholar]
  15. Okubo, T.; Watabe, Y.; Furuyama, K. Export of Recyclable Materials: Evidence from Japan. Asian Econ. Pap. 2016, 15, 134–148. [Google Scholar] [CrossRef]
  16. Sun, M. The effect of border controls on waste imports: Evidence from China’s Green Fence campaign. China Econ. Rev. 2019, 54, 457–472. [Google Scholar] [CrossRef]
  17. Sawhney, A.; Majumder, P. Is India becoming a waste haven of metal scrap? Munich Pers. Repec Arch. 2015, 67186. Available online: https://mpra.ub.uni-muenchen.de/id/eprint/67186 (accessed on 14 January 2021).
  18. Hu, X.; Wang, C.; Lim, M.K.; Chen, W. Characteristics of the global copper raw materials and scrap trade systems and the policy impacts of China’s import ban. Ecol. Econ. 2020, 172, 106626. [Google Scholar] [CrossRef]
  19. Petridis, N.E.; Petridis, K.; Stiakakis, E. Global e-waste trade network analysis. Resour. Conserv. Recycl. 2020, 158, 104742. [Google Scholar] [CrossRef]
  20. Pethig, R. Pollution, Welfare, and Environmental Policy in the Theory of Comparative Advantage. J. Environ. Econ. Manag. 1976, 2, 160–169. [Google Scholar] [CrossRef]
  21. Antweiler, W.; Copeland, B.R.; Taylor, M.S. Is free trade good for the environment? Am. Econ. Rev. 2001, 91, 877–908. [Google Scholar] [CrossRef] [Green Version]
  22. Cole, M.A.; Elliott, R.J.R.; Fredriksson, P.G. Endogenous pollution havens: Does FDI influence environmental regulations? Scand. J. Econ. 2006, 108, 157–178. [Google Scholar] [CrossRef]
  23. Becker, R.; Henderson, V. Effects of Air Quality Regulations on Polluting Industries. J. Political Econ. 2000, 108, 379–421. [Google Scholar] [CrossRef]
  24. Higashida, K.; Managi, S. Determinants of trade in recyclable wastes: Evidence from commodity-based trade of waste and scrap. Environ. Dev. Econ. 2014, 19, 250–270. [Google Scholar] [CrossRef]
  25. Yang, K.; Yoshida, H. Effect of mist injection position on particle separation performance of cyclone scrubber. Sep. Purif. Technol. 2004, 37, 221–230. [Google Scholar] [CrossRef]
  26. Baumol, W.J.; Bradford, D.F. Detrimental externalities and non-convexity of the production set. Economica 1972, 39, 160–176. [Google Scholar] [CrossRef]
  27. Copeland, B.R.; Taylor, M.S. Trade, spatial separation, and the environment. J. Int. Econ. 1999, 47, 137–168. [Google Scholar] [CrossRef] [Green Version]
  28. Barrett, S. The strategy of trade sanctions in international environmental agreements. Resour. Energy Econ. 1997, 19, 345–361. [Google Scholar] [CrossRef]
  29. Carraro, C.; Siniscalco, D. Strategies for the international protection of the environment. J. Public Econ. 1993, 52, 309–328. [Google Scholar] [CrossRef]
  30. Kellenberg, D.; Levinson, A. Waste of effort? international environmental agreements. J. Assoc. Environ. Resour. Econ. 2014, 1, 135–169. [Google Scholar] [CrossRef]
  31. Henderson, D.J.; Millimet, D.L. Pollution abatement costs and foreign direct investment inflows to US states: A nonparametric reassessment. Rev. Econ. Stat. 2007, 89, 178–183. [Google Scholar] [CrossRef]
  32. Kheder, S.B.; Zugravu, N. The Pollution Haven Hypothesis: A Geographic Economy Model in a Comparative Study; Climate Change Modelling and Policy Working Papers 44223; Fondazione Eni Enrico Mattei (FEEM): Milan, Italy, 2008. [Google Scholar]
  33. Ma, Z.; Chen, Y.; Melville, D.; Fan, J.; Liu, J.; Dong, J.; Tan, K.; Cheng, X.; Fuller, R.; Xiao, X.; et al. Changes in area and number of nature reserves in China. Conserv. Biol. 2019, 33, 1066–1075. [Google Scholar] [CrossRef]
  34. Wen, H.; Dai, J. Trade openness, environmental regulation, and human capital in China: Based on ARDL cointegration and Granger causality analysis. Environ. Sci. Pollut. Res. 2020, 27, 1789–1799. [Google Scholar] [CrossRef]
  35. Lepawsky, J.; McNabb, C. Mapping international flows of electronic waste. Can. Geogr. Le Géographe Can. 2010, 54, 177–195. [Google Scholar] [CrossRef]
  36. Kusch, S.; Hills, C.D. The link between e-waste and GDP—New insights from data from the pan-European region. Resources 2017, 6, 15. [Google Scholar] [CrossRef]
  37. Kumar, A.; Holuszko, M.; Espinosa, D.C.R. E-waste: An overview on generation, collection, legislation and recycling practices. Resour. Conserv. Recycl. 2017, 122, 32–42. [Google Scholar] [CrossRef]
  38. Balsalobre-Lorente, D.; Gokmenoglu, K.K.; Taspinar, N.; Cantos-Cantos, J.M. An approach to the pollution haven and pollution halo hypotheses in MINT countries. Environ. Sci. Pollut. Res. 2019, 26, 23010–23026. [Google Scholar] [CrossRef] [PubMed]
  39. Dussaux, D. The Effects of Environmental Regulations on Waste Trade, Clean Innovation, and Competitiveness in a Globalized World; Ecole Nationale Supérieure des Mines de Paris: Paris, France, 2015. [Google Scholar]
  40. Chaturvedi, A.; McMurray, N. China’s Emergence as a Global Recycling Hub—What Does it Mean for Circular Economy Approaches Elsewhere? IDS Evidence Report 146; IDS: Brighton, UK, 2015. [Google Scholar]
  41. Rodić, L.; Wilson, D.C. Resolving governance issues to achieve priority sustainable development goals related to solid waste management in developing countries. Sustainability 2017, 9, 404. [Google Scholar] [CrossRef] [Green Version]
  42. Tozanlı, Ö.; Kongar, E.; Gupta, S.M. Evaluation of Waste Electronic Product Trade-in Strategies in Predictive Twin Disassembly Systems in the Era of Blockchain. Sustainability 2020, 12, 5416. [Google Scholar] [CrossRef]
Figure 1. The total value of waste imports for 1995–2018. (Source: CEPII-BACI database).
Sustainability 13 00932 g001
Figure 2. The total quantity of waste imports for 1995–2018. (Source: CEPII-BACI database).
Sustainability 13 00932 g002
Figure 3. China’s import value and quantities for four categories of waste. (Source: CEPII-BACI database).
Sustainability 13 00932 g003
Figure 4. Value of waste imports from major countries for 1995–2018. (Source: China’s Customs Statistics).
Sustainability 13 00932 g004
Table 1. Categories of China’s waste import.
CategoriesHS6 CodeHS6 Description
waste metal720410Waste and scrap of cast iron
720421Waste and scrap of stainless steel
720429Waste and scrap of alloy steel other than stainless steel
720430Waste and scrap of tinned iron/steel
720441Ferrous turnings, shavings, chips, milling waste, sawdust, filings
720449Ferrous waste and scrap (excl. of 7204.10–7204.41)
740400Copper waste and scrap
750300Nickel waste and scrap
760200Aluminum waste and scrap
780200Lead waste and scrap
790200Zinc waste and scrap
800200Tin waste and scrap
810420Magnesium waste and scrap
810600Bismuth and arts. thereof, incl. waste and scrap
waste paper470710Recovered (waste and scrap) unbleached kraft paper/paperboard
470720Recovered (waste and scrap) paper/paperboard mainly of bleached chem.
470730Recovered (waste and scrap) paper/paperboard made mainly of mech. Pulp
470790Recovered (waste and scrap) paper/paperboard (excl. of 4707.10–4707.30)
waste plastic391510Waste, parings and scrap, of polymers of ethylene
391520Waste, parings and scrap, of polymers of styrene
391530Waste, parings and scrap, of polymers of vinyl chloride
391590Waste, parings and scrap, of plastics n.e.s. in 39.15
waste textile500390Silk waste (incl. cocoons unsuit. for reeling, yarn waste, and garnetted stock)
510320Waste of wool/of fine animal hair, incl. yarn waste
520210Yarn waste (incl. thread waste), of cotton
520299Cotton waste other than yarn waste
550510Waste (incl. noils, yarn waste, and garnetted stock) of synth. fibers
550520Waste (incl. noils, yarn waste, and garnetted stock) of art. Fibers
Source: Kellenberg [7], Sun [16], and Okubo et al. [15].
Table 2. Data source and descriptions of variables.
Variable NameDescriptionsData Source
Explained variable ( l n X c j k t )
L n V a l u e c j k t Log of China’s import value for product k from country j at time t.CEPII-BACI Database
L n Q u a n t i t y c j k t Log of China’s import quantity for product k from country j at time t.CEPII-BACI Database
Pollution haven hypothesis variable ( P H H c t )
L n G D P C O 2 _ g a p c j t Following Ben and Zugravn (2008); Wen and Dai (2019) and Ma et al. (2019), a ratio of log GDP/CO2 emission between orientation and China at time t was used as a proxy for PHH. A higher value presents the orientation’s effectiveness of environmental regulation being better than China’s, thus more likely to export waste products to China for searching relative cheaper environment costs.World Bank WDI Carbon Dioxide Information Analysis Center (CDIAC)
L n G D P C A P _ g a p c j t Following Baggs (2009), Lepawsky and McNabb (2010), Kusch and Hills (2017), Kumar et al. (2017), and Balsalobre-Lorente et al. (2019), the ratio of log GDP per Capita between orientation and China at time t was used as a proxy for PHH. A higher value presents the orientation’s GDP per Capita to China’s, suggest a positive relationship to more restricted environment regulations.World Bank WDI
Resource hunting hypothesis variable ( R H H c t )
L n R H _ i m p o r t c t Uses the log of China’s import value of intermediate material with Broad Economic Categories code as 21, 22, 111, 121, excluding all waste import, at time t as a proxy for RHH. The higher the value indicates a higher demand for intermediate input resources.CEPII-BACI Database
L n R H _ e x p o r t c k t We used the log of China’s export value with HS2 code as 39, 47–49, 50–55, and 72–83 at time t as a proxy for RHH. According to Dussaux (2015), these sectors use the intermediate input related to waste imports. Different sectors’ exporting values associated with different categories of waste were adopted.CEPII-BACI Database
Control variables’ vector ( C )
L n G D P _ j t Log of orientation j’s GDP at time t.World Bank WDI
L n G D P _ c t Log of China’s GDP at time t.World Bank WDI
T r a d e _ S u r c j t Following Kellenberg (2010) and Sun (2019), we used China’s trade surplus relative to country j at time t for the “reverse-haulage” logistics effect.CEPII-BACI Database
L n P A T C A P j t Log of patents per million capita in country j at time t as a proxy of technology level.WIPO IP Database
L n T a r i f f c j k t Effective tariff China collected for products k from country j at time t.WITS Database
T r a d e _ a g r e e c j t Dummy variable equals 1 if China has a free trade agreement with country j.WTO Database
C o n t i g c j Dummy variable equals 1 if China has a common border with country j.CEPII-Gravity Database
C o m l a n g c j Dummy variable equals 1 if China has the same official language as country j.CEPII-Gravity Database
Environmental laws variable ( L a w c t )
L a w 2011 Dummy variable equals 1 after 2011 presents the endorsement of “Measures on the Administration of Import of Solid Waste.”
L a w 2017 Dummy variable equals 1 after 2017 presents the endorsement of “Measures on the Administration of Import of Solid Waste.”
Table 3. Summary statistics of variables.
NameObsMeanSDMinMax
L n V a l u e c j k t 13,4406.622.920.0011.81
L n Q u a n t i t y c j k t 13,4406.903.16−6.9112.26
L n G D P C O 2 _ g a p c j t 13,4401.180.390.352.58
L n G D P C A P _ g a p c j t 13,4401.590.78−0.613.02
L n R H _ i m p o r t c t 13,44019.180.9417.8020.33
L n R H _ e x p o r t c k t 13,44018.530.9417.1019.68
L n G D P _ j t 13,44027.791.0525.8730.63
L n G D P _ c t 13,44029.720.6328.6830.67
T r a d e _ S u r c j t 13,3840.090.64−2.080.98
L n P A T C A P j t 13,4405.801.610.849.35
L n T a r i f f c j k t 12,869−1.001.89−2.303.56
T r a d e _ a g r e e c j t 13,4400.160.370.001.00
C o n t i g c j 13,4400.050.220.001.00
C o m l a n g c j 13,4400.150.360.001.00
L a w 2011 13,4400.330.470.001.00
L a w 2017 13,4400.080.280.001.00
SD = standard deviation.
Table 4. Baseline results of Equation (1).
RERERERELSDVLSDVLSDVLSDV
(1)(2)(3)(4)(5)(6)(7)(8)
L n G D P C O 2 _ g a p c j t 0.47 ** 0.47 ** 0.47 ** 0.47 **
(2.10) (2.10) (2.11) (2.11)
L n G D P C A P _ g a p c j t −0.83 −0.83 −0.83 −0.83
(−0.93) (−0.93) (−1.02) (−1.02)
L n R H _ i m p o r t c t 7.85 ***7.39 *** 1.31 ***0.73
(6.25)(5.70) (14.49)(1.34)
L n R H _ e x p o r t c k t 16.43 ***16.09 *** 1.38 ***0.75
(7.56)(7.34) (15.86)(1.31)
ControlYesYesYesYesYesYesYesYes
Observations12,16912,16912,16912,16912,16912,16912,16912,169
R20.150.150.150.150.200.200.200.20
All models include the country (FE), industry (FE), and time (FE), with robust standard errors corrected. T statistics are in parentheses. *** and ** denote significance at 1% and 5%, respectively.
Table 5. Baseline results of Equation (2).
RERERERELSDVLSDVLSDVLSDV
(1)(2)(3)(4)(5)(6)(7)(8)
L n G D P C O 2 _ g a p c j t 0.41 * 0.41 * 0.41 * 0.41 *
(1.77) (1.77) (1.78) (1.78)
L n G D P C O 2 _ g a p c j t L a w 2011 −0.19 −0.19 −0.19 −0.19
(−1.21) (−1.21) (−1.19) (−1.19)
L n G D P C O 2 _ g a p c j t L a w 2017 0.77 *** 0.77 *** 0.77 *** 0.77 ***
(3.04) (3.04) (2.84) (2.84)
L n G D P C A P _ g a p c j t −0.62 −0.62 −0.62 −0.62
(−0.69) (−0.69) (−0.76) (−0.76)
L n G D P C A P _ g a p c j t L a w 2011 0.55 *** 0.55 *** 0.55 *** 0.55 ***
(5.43) (5.43) (5.44) (5.44)
L n G D P C A P _ g a p c j t L a w 2017 −0.34 ** −0.34 ** −0.34 ** −0.34 **
(−2.00) (−2.00) (−1.98) (−1.98)
L n R H _ i m p o r t c t 21.79 ***21.60 *** 1.40 ***1.01 **
(8.79)(8.71) (15.85)(2.36)
L n R H _ i m p o r t c t L a w 2011 −0.02−0.06 0.00−0.05 ***
(−0.41)(−1.38) (0.11)(−3.81)
L n R H _ i m p o r t c t L a w 2017 −0.18 ***−0.12 *** −0.04 **0.01
(−7.68)(−5.77) (−2.40)(0.51)
L n R H _ e x p o r t c k t 16.73 ***16.48 *** 1.30 ***0.89 **
(7.64)(7.47) (14.53)(2.16)
L n R H _ e x p o r t c k t L a w 2011 −0.11 ***−0.15 *** 0.03 **−0.03
(−7.18)(−9.67) (1.97)(−1.56)
L n R H _ e x p o r t c k t L a w 2017 −0.08 ***−0.02 −0.05 ***0.01
(−4.47)(−1.36) (−2.64)(0.36)
ControlYesYesYesYesYesYesYesYes
Observations12,16912,16912,16912,16912,16912,16912,16912,169
R20.150.150.150.150.200.200.200.20
All models include the country (FE), industry (FE), and time (FE), with robust standard errors corrected. T statistics are in parentheses. ***, **, and * denote significance at 1%, 5%, and 10%, respectively.
Table 6. Results for developed and developing countries.
Developed CountriesDeveloping Countries
(1)(2)(3)(4)(5)(6)(7)(8)
L n G D P C O 2 _ g a p c j t 0.01 0.01 −2.29 *** −2.29 ***
(0.04) (0.04) (−3.16) (−3.16)
L n G D P C O 2 _ g a p c j t L a w 2011 −0.21 −0.21 −0.41 −0.41
(−1.10) (−1.10) (−1.21) (−1.21)
L n G D P C O 2 _ g a p c j t L a w 2017 1.06 *** 1.06 *** 1.78 1.78
(3.54) (3.54) (1.50) (1.50)
L n G D P C A P _ g a p c j t 4.01 *** 4.01 *** −5.82 *** −5.82 ***
(3.34) (3.34) (−2.89) (−2.89)
L n G D P C A P _ g a p c j t L a w 2011 0.78 *** 0.78 *** −0.15 −0.15
(4.98) (4.98) (−0.57) (−0.57)
L n G D P C A P _ g a p c j t L a w 2017 −0.95 *** −0.95 *** −0.08 −0.08
(−3.36) (−3.36) (−0.18) (−0.18)
L n R H _ i m p o r t c t 15.68 ***15.08 *** 99.26 ***105.68 ***
(5.10)(4.90) (11.73)(12.72)
L n R H _ i m p o r t c t L a w 2011 0.11 **0.06 0.81 ***0.96 ***
(2.18)(1.20) (9.33)(11.69)
L n R H _ i m p o r t c t L a w 2017 −0.12 ***−0.01 −0.63 ***−0.55 ***
(−4.34)(−0.24) (−7.46)(−11.19)
L n R H _ e x p o r t c k t 7.75 ***7.46 *** 49.72 ***52.81 ***
(5.08)(4.89) (11.74)(12.72)
L n R H _ e x p o r t c k t L a w 2011 −0.06−0.10 * −0.24 ***−0.15 ***
(−1.06)(−1.85) (−6.69)(−4.70)
L n R H _ e x p o r t c k t L a w 2017 −0.06 **0.06 ** −0.23 ***−0.12 ***
(−2.56)(2.24) (−3.39)(−6.06)
ControlYesYesYesYesYesYesYesYes
Observations83188318831883183632363236323632
R20.140.140.140.140.160.160.160.16
All models include the country (FE), industry (FE), and time (FE), with robust standard errors corrected. T statistics are in parentheses. ***, **, and * denote significance at 1%, 5%, and 10%, respectively.
Publisher’s Note: MDPI stays neutral with regard to jurisdictional claims in published maps and institutional affiliations.

