
Impact of Green Stormwater Infrastructure Age and Type on Water Quality

Abstract
:1. Introduction
2. Materials and Methods
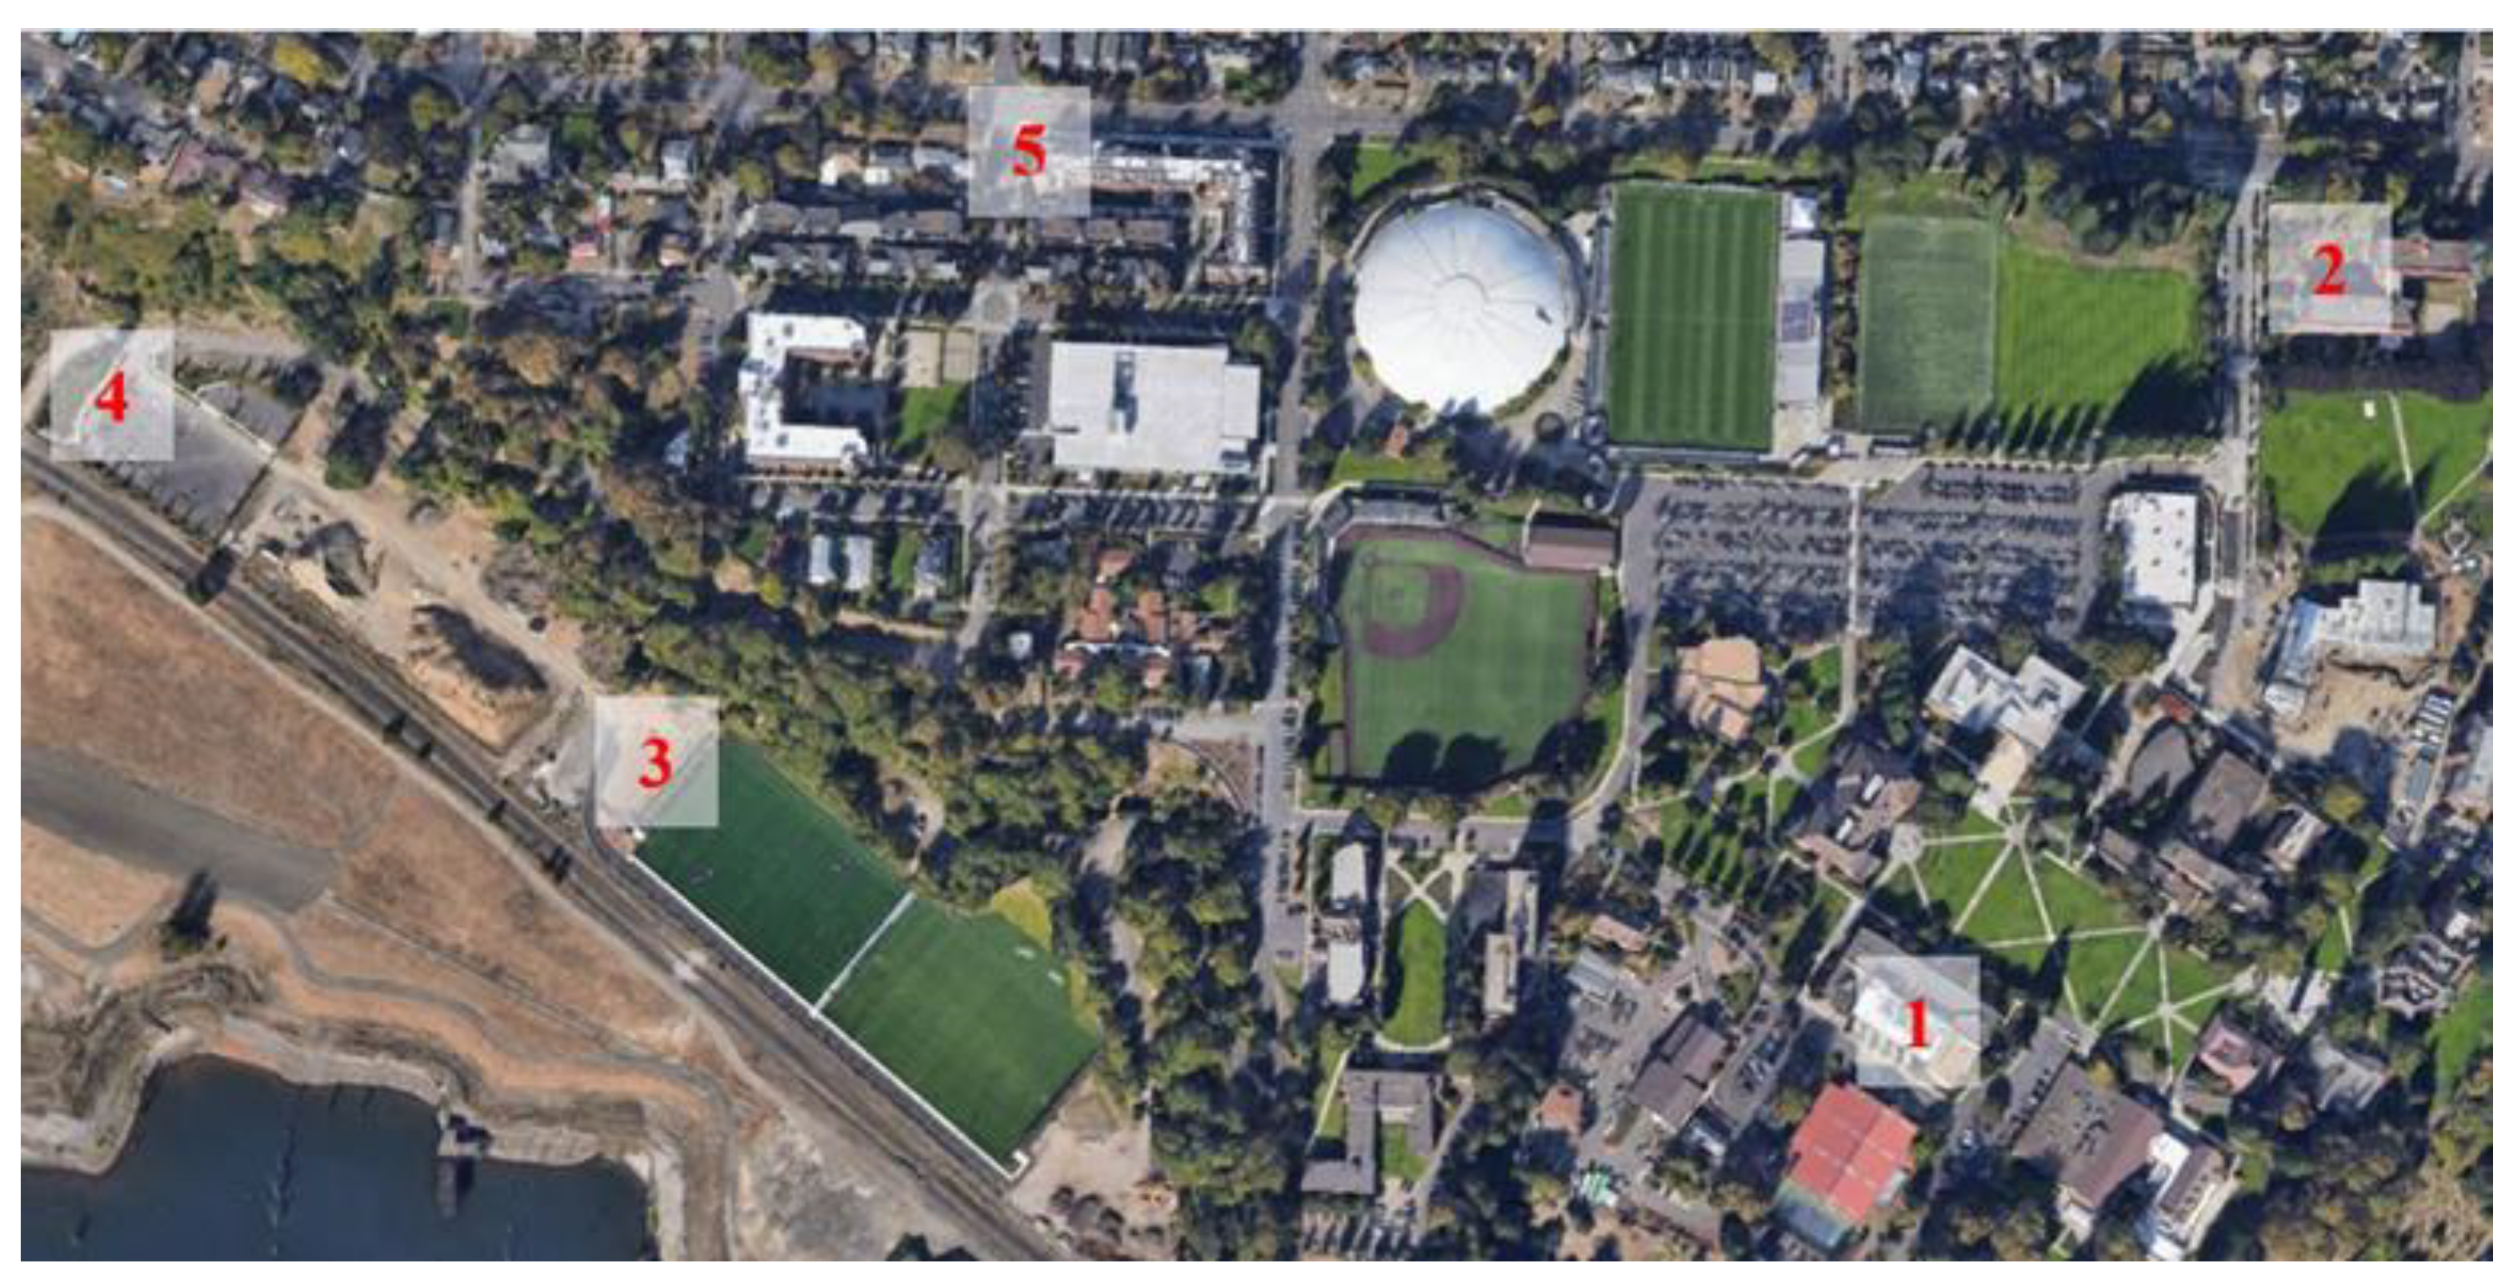
2.1. Sampling Sites
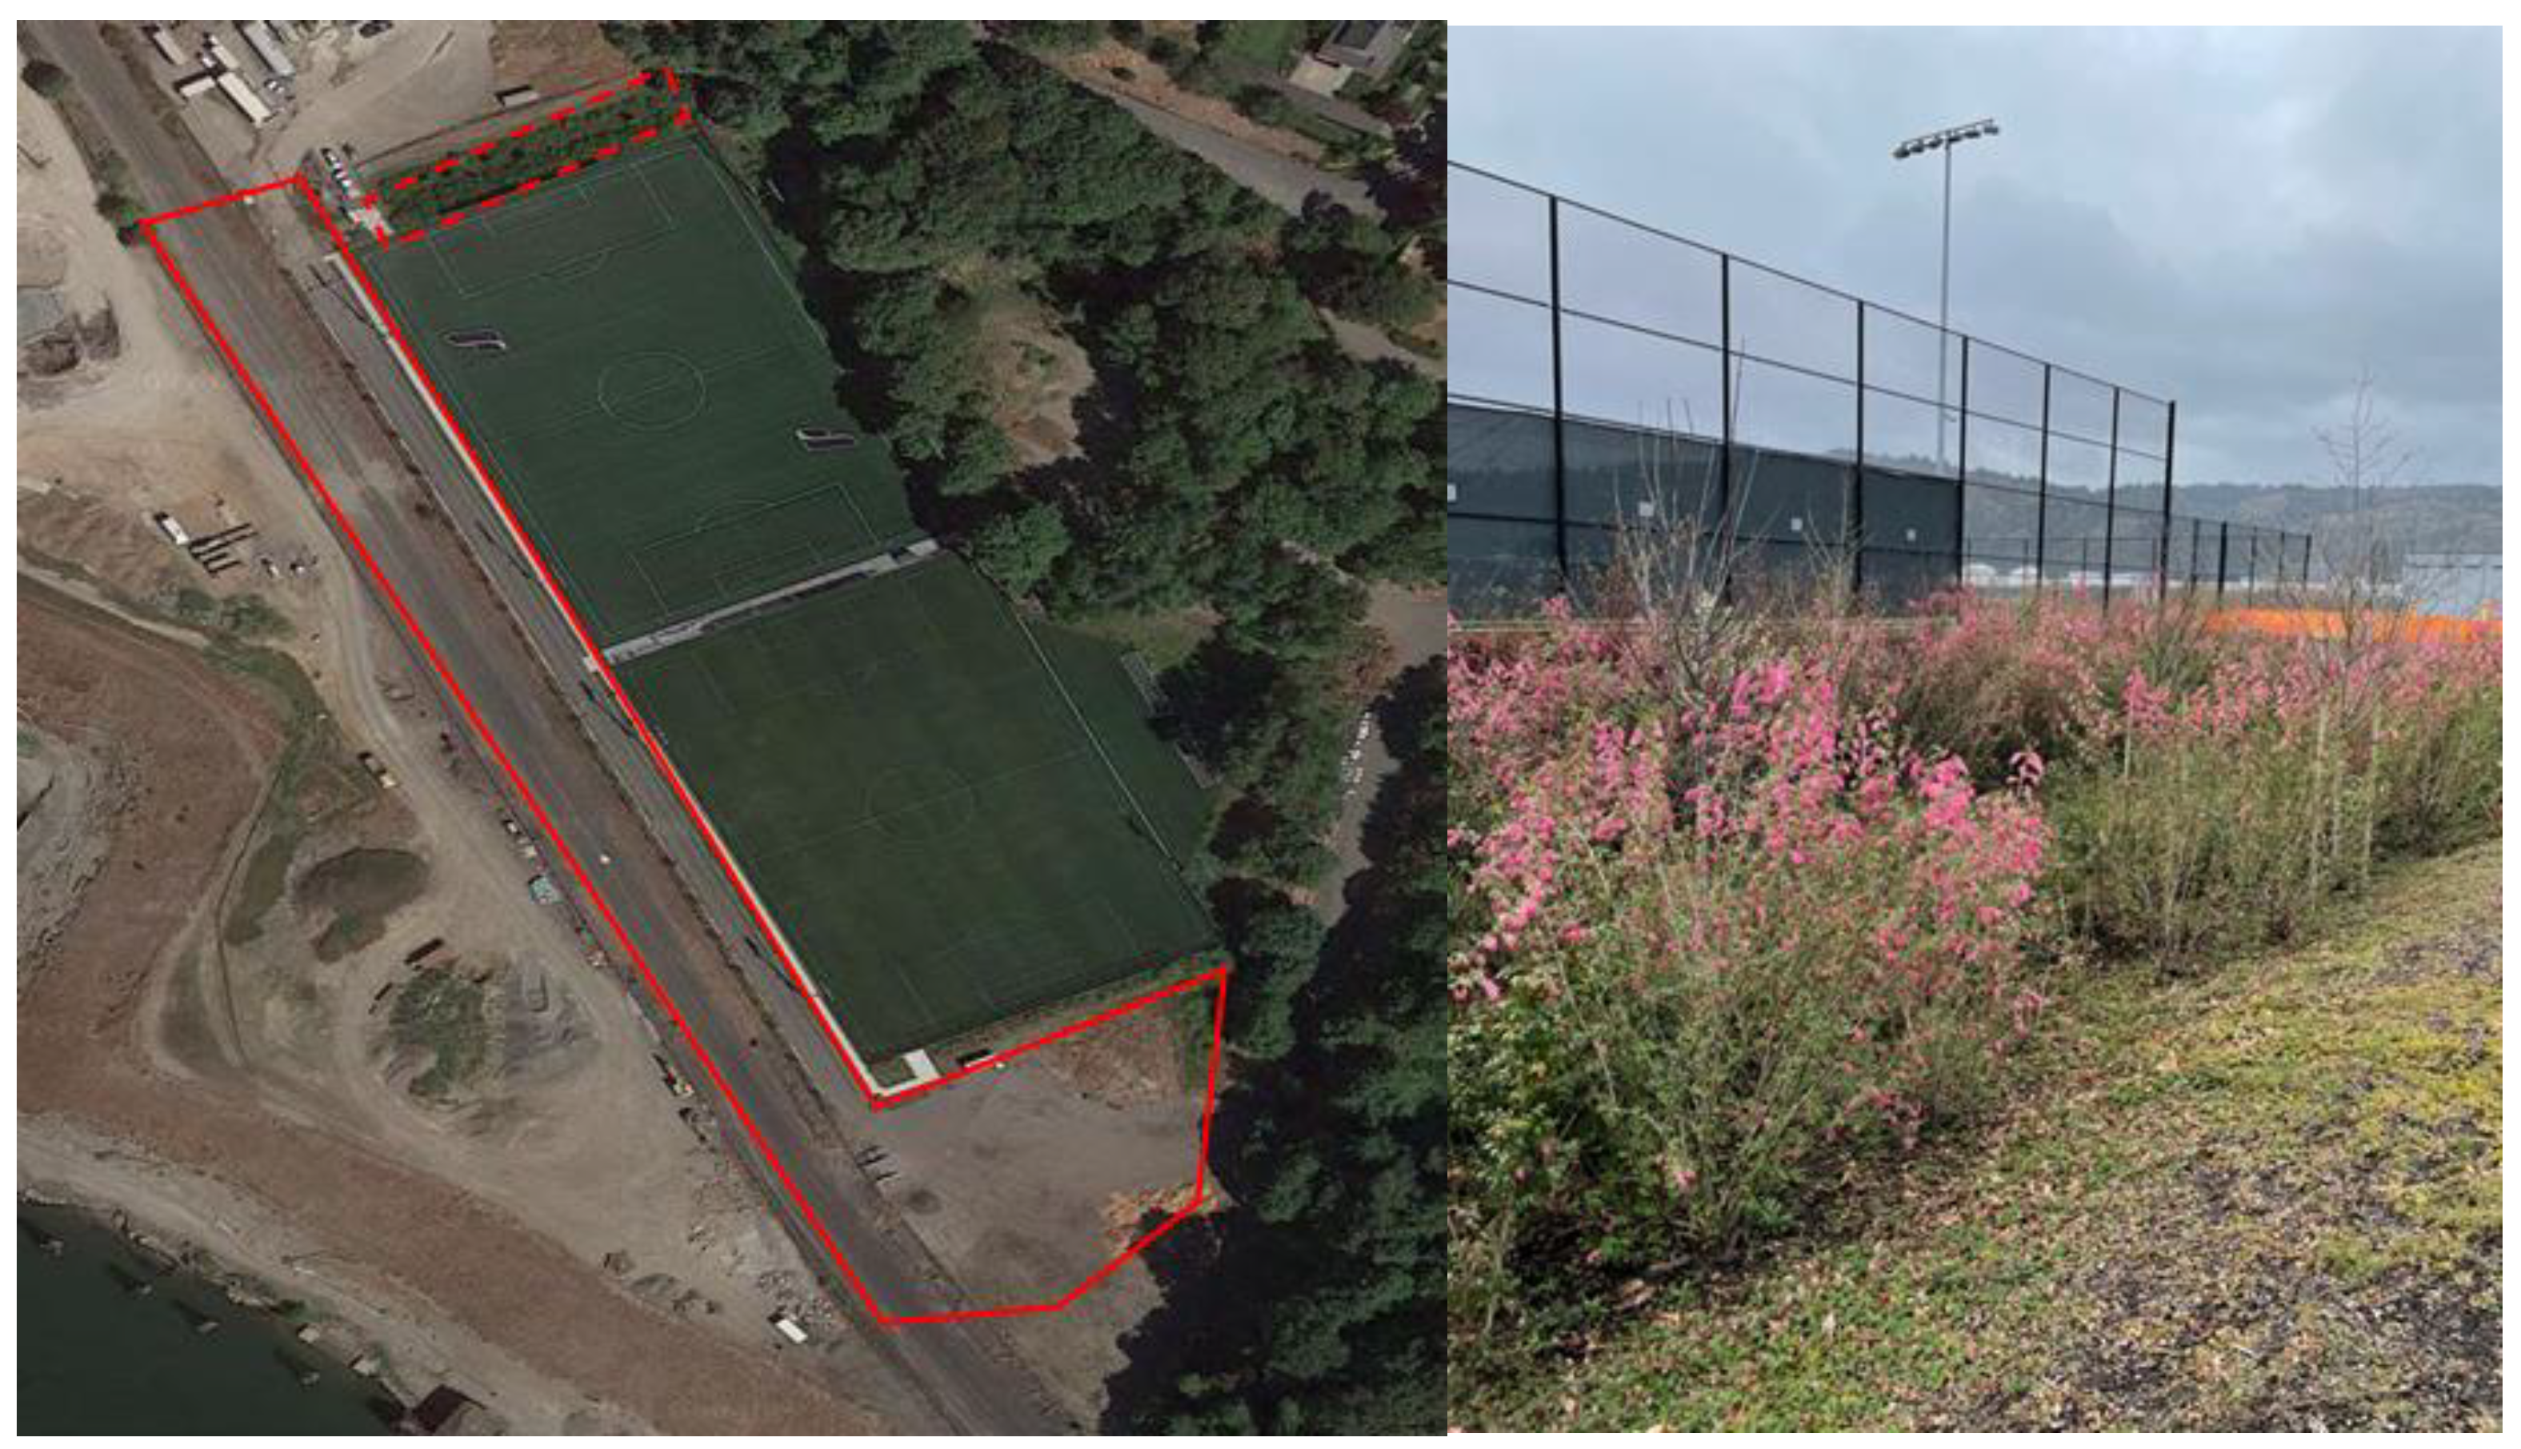
2.1.1. Bioswale
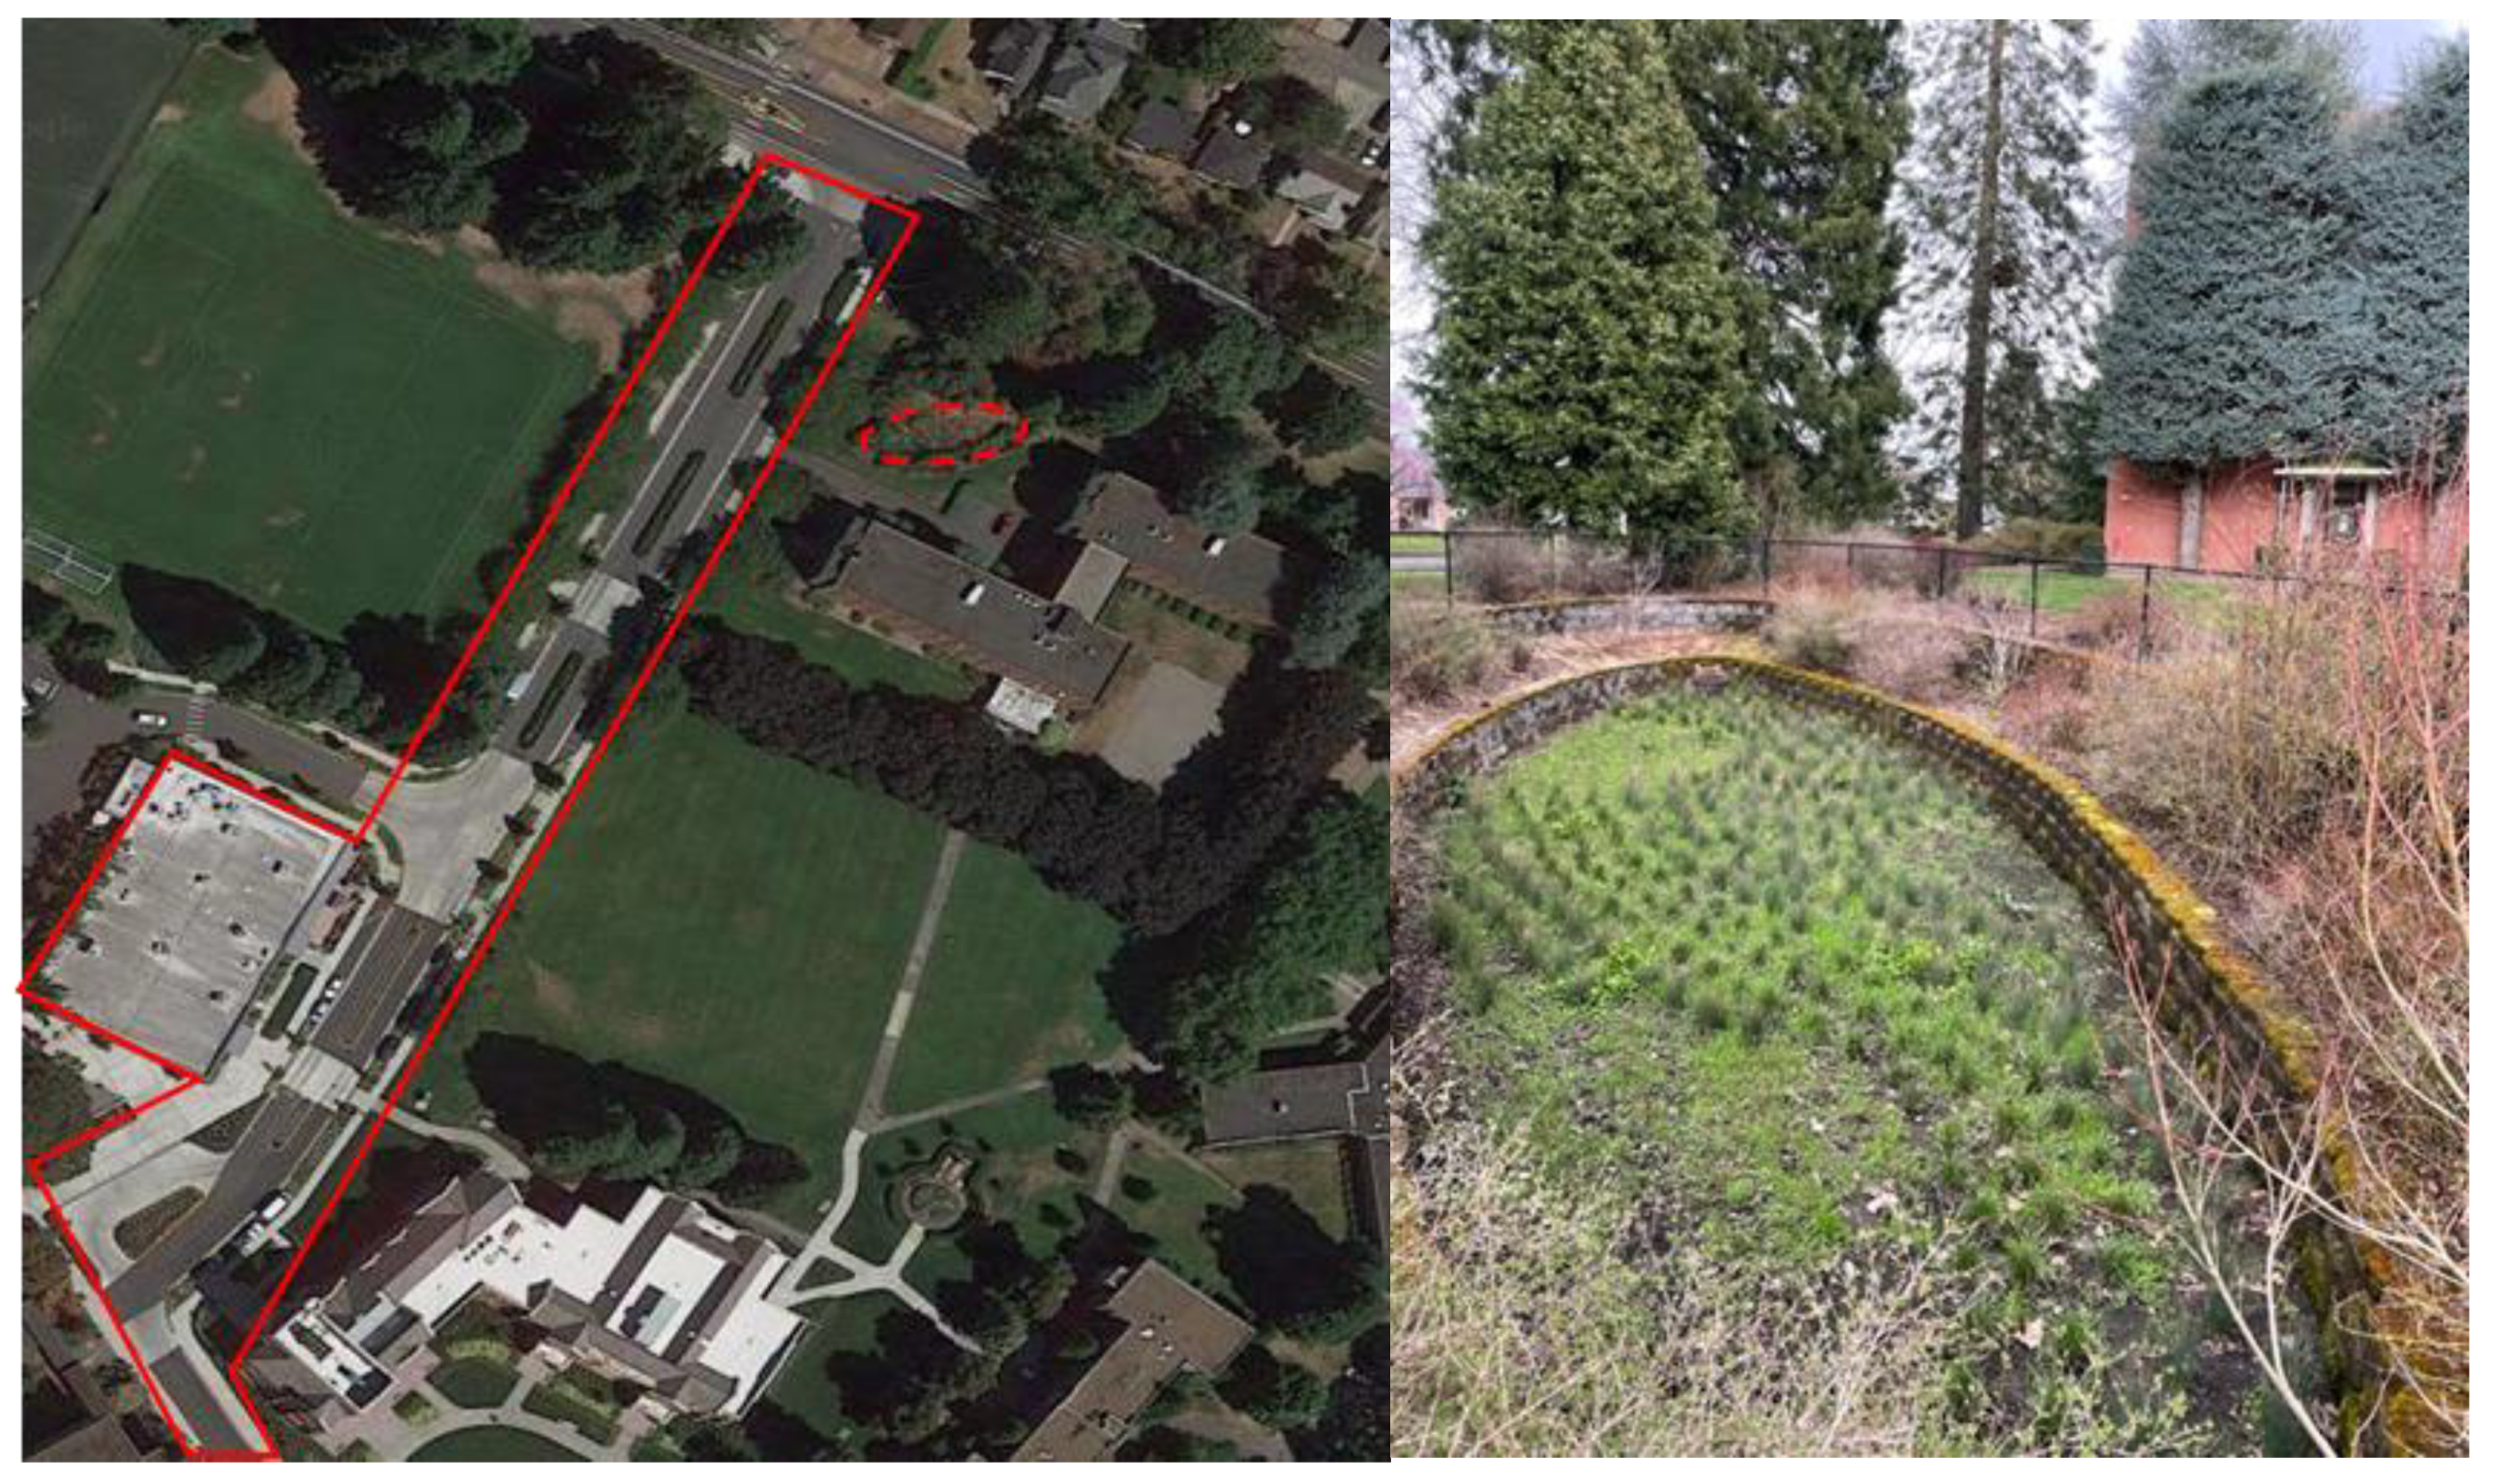
2.1.2. Infiltration Basin
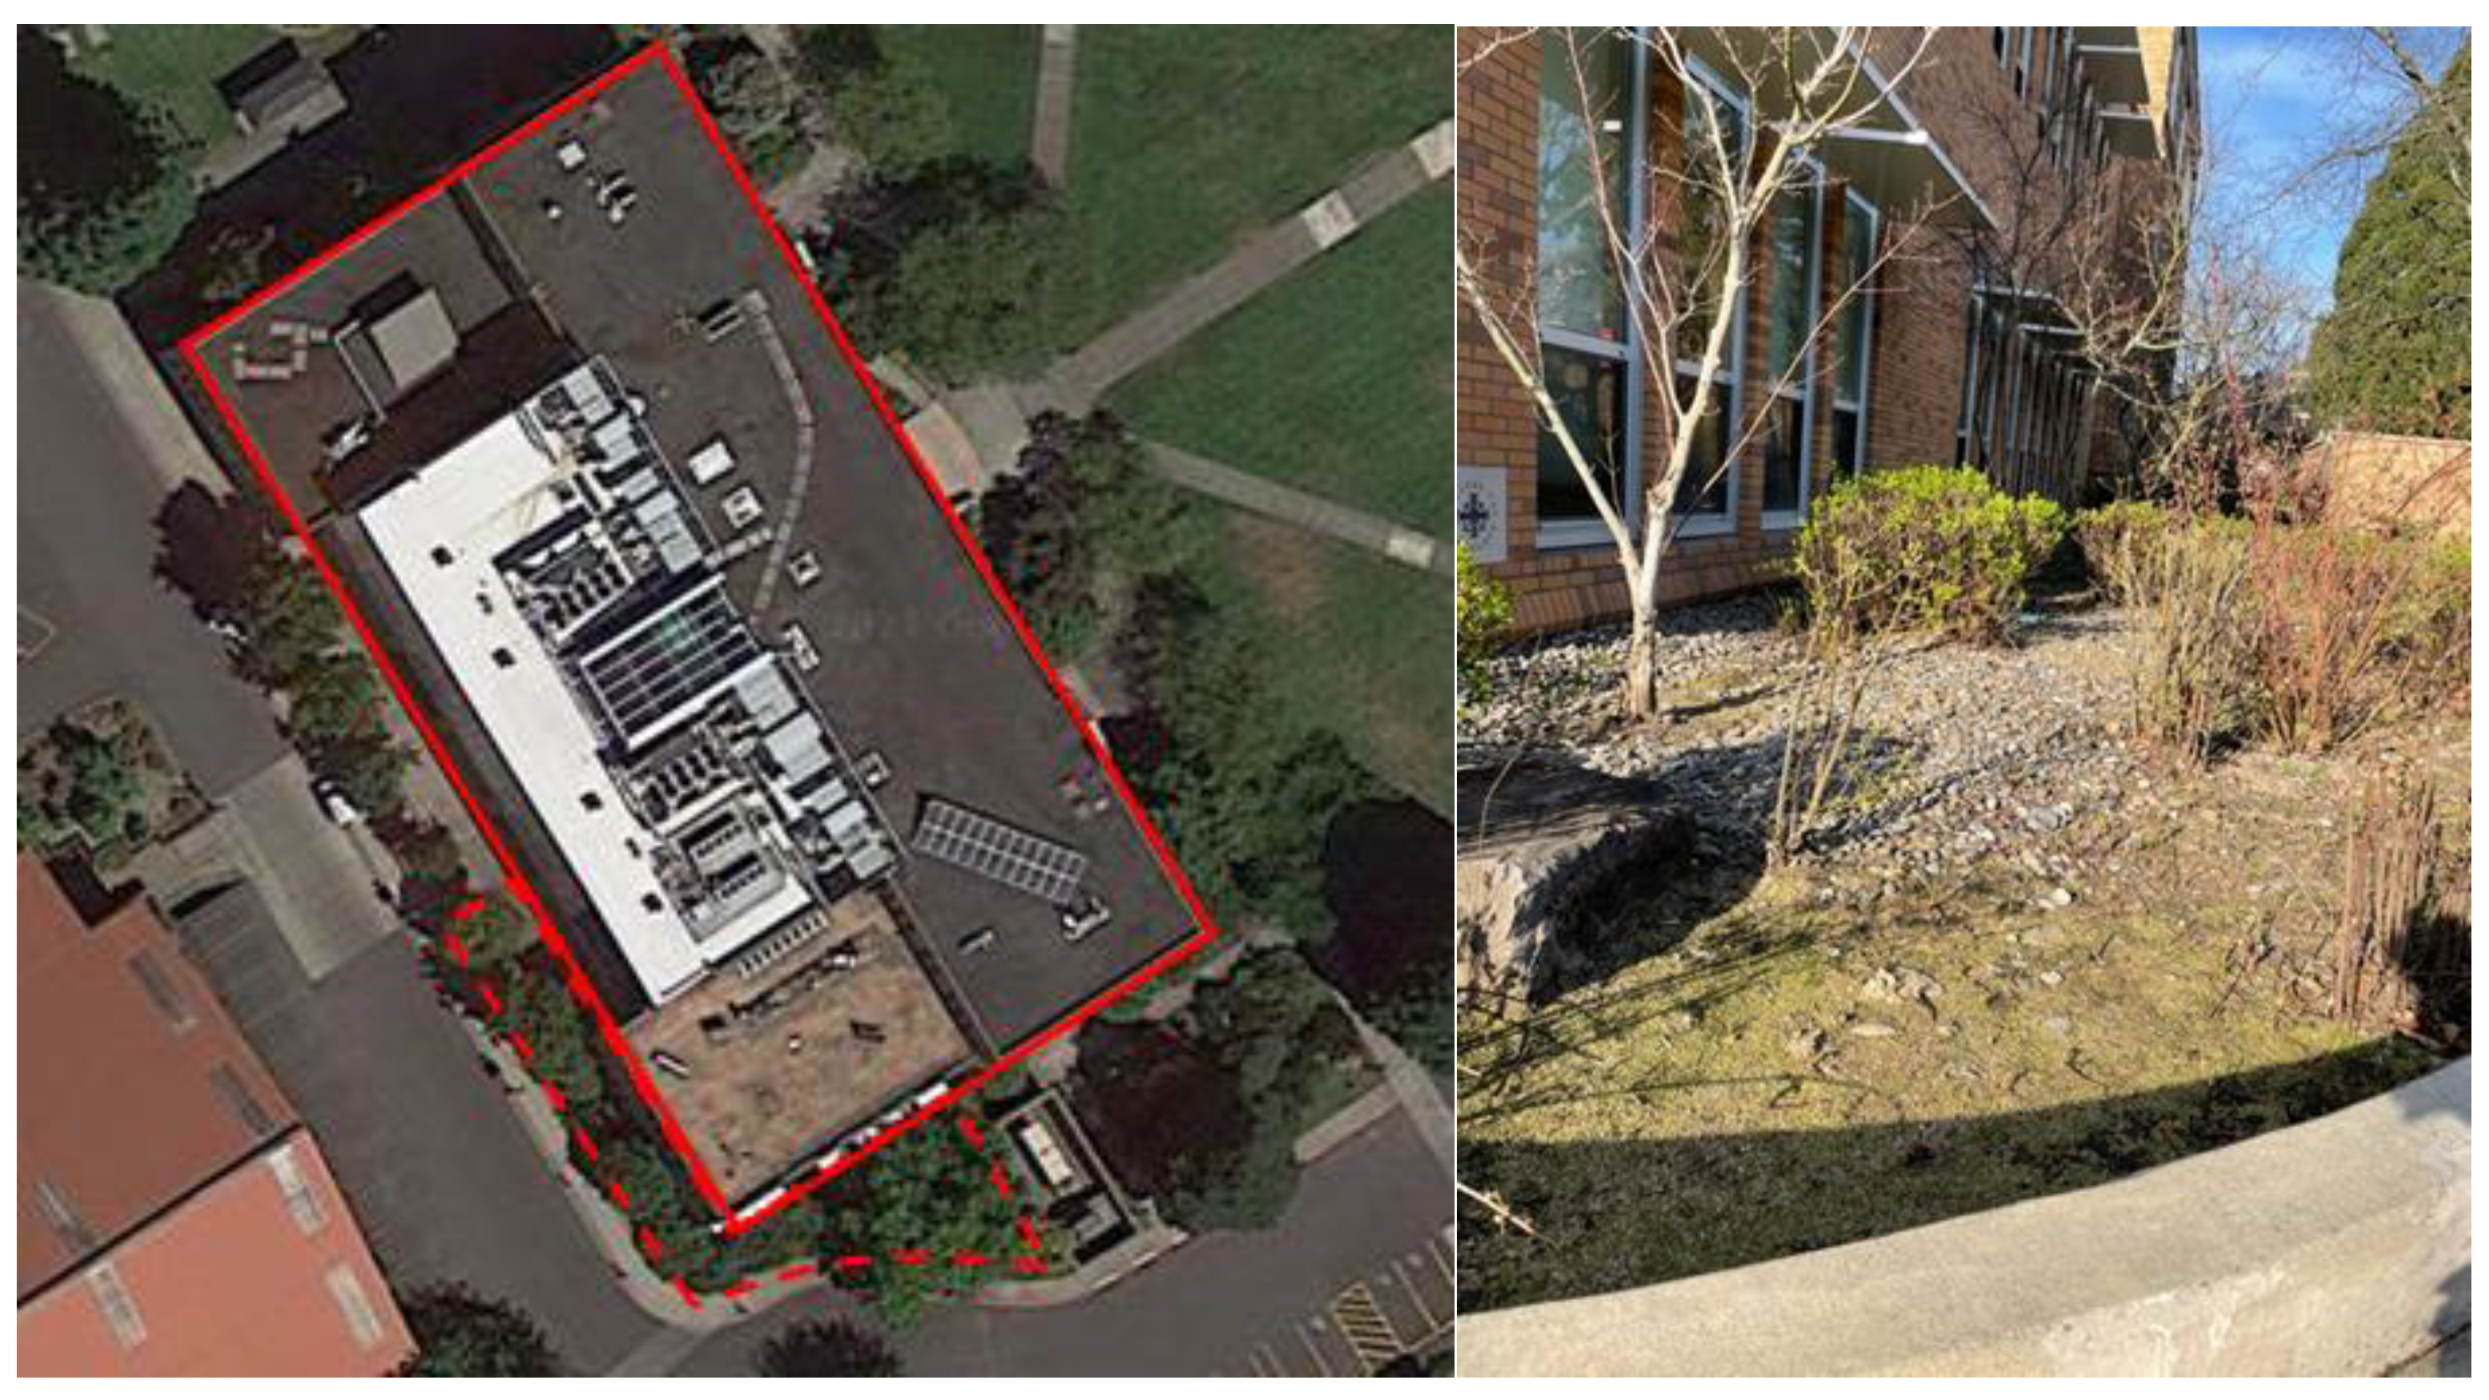
2.1.3. Bioretention Planter
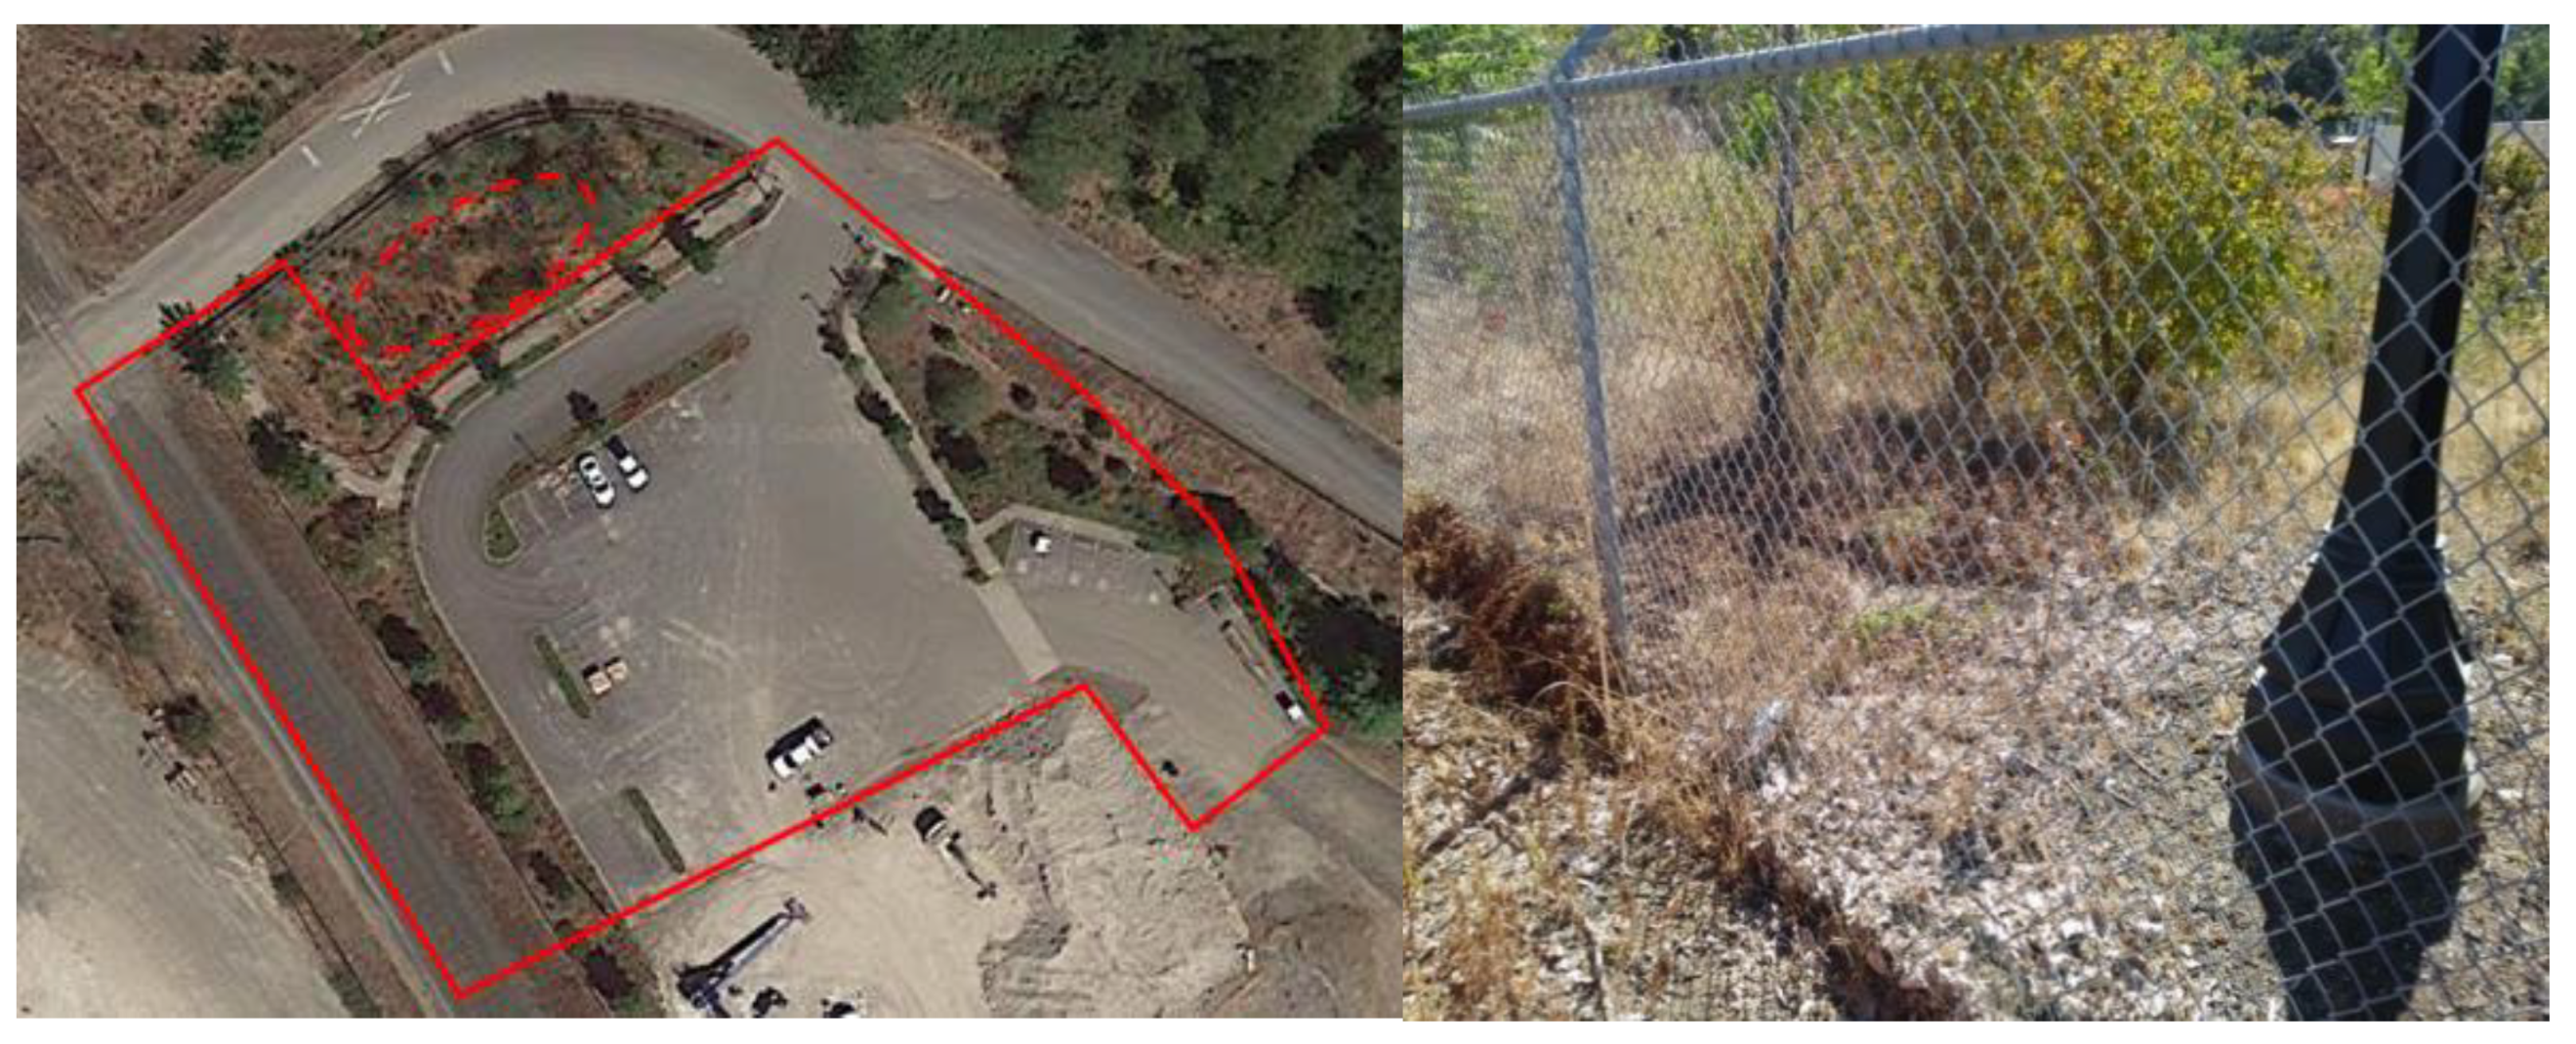
2.1.4. Bioretention Basin
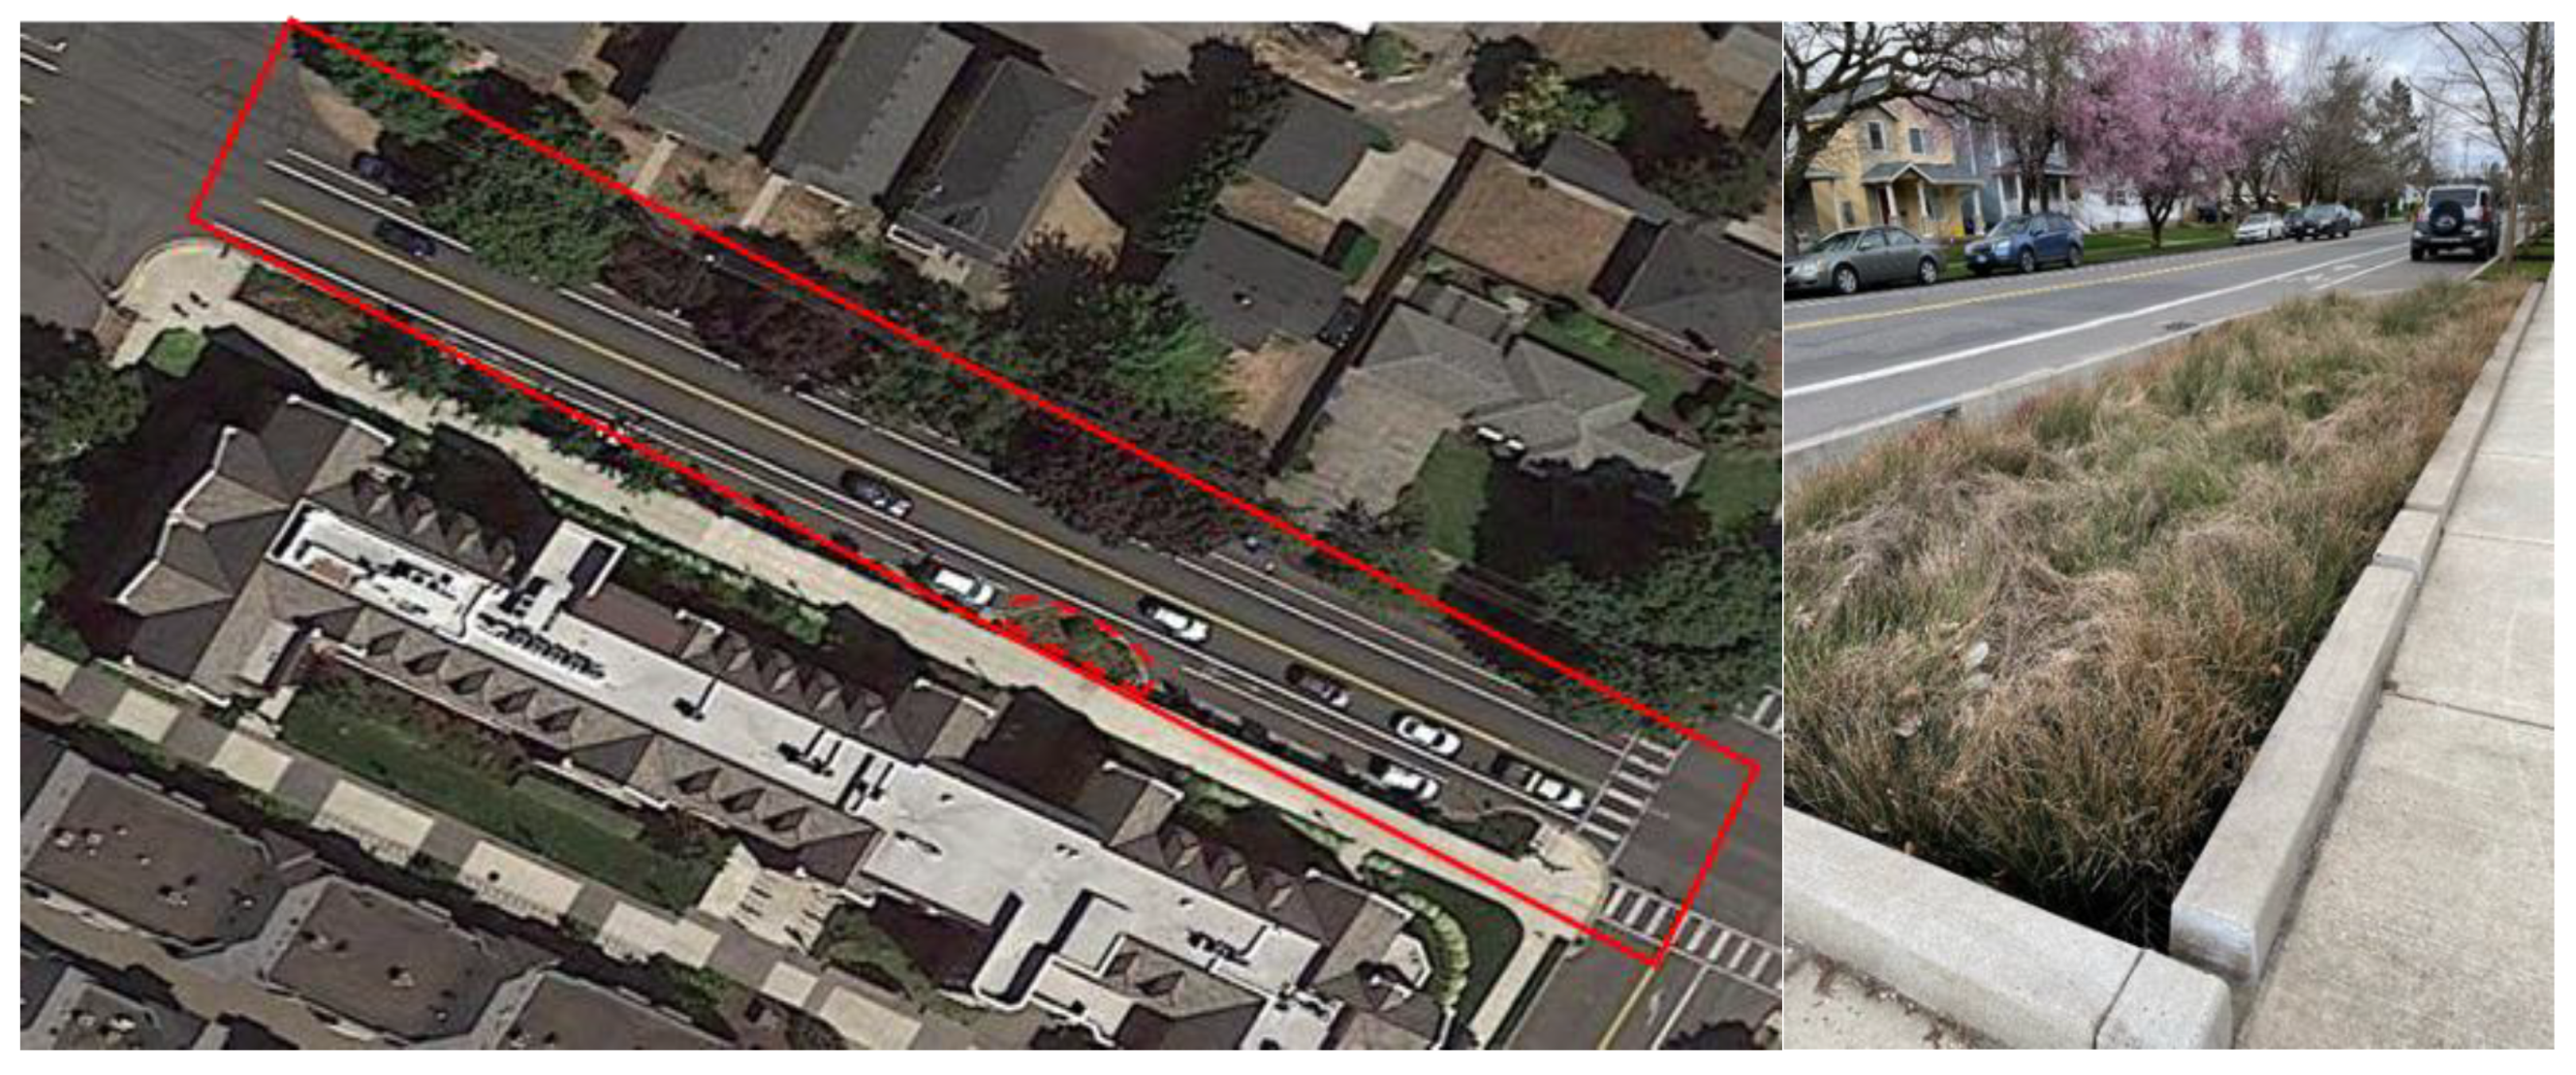
2.1.5. Bioretention Curb Extension
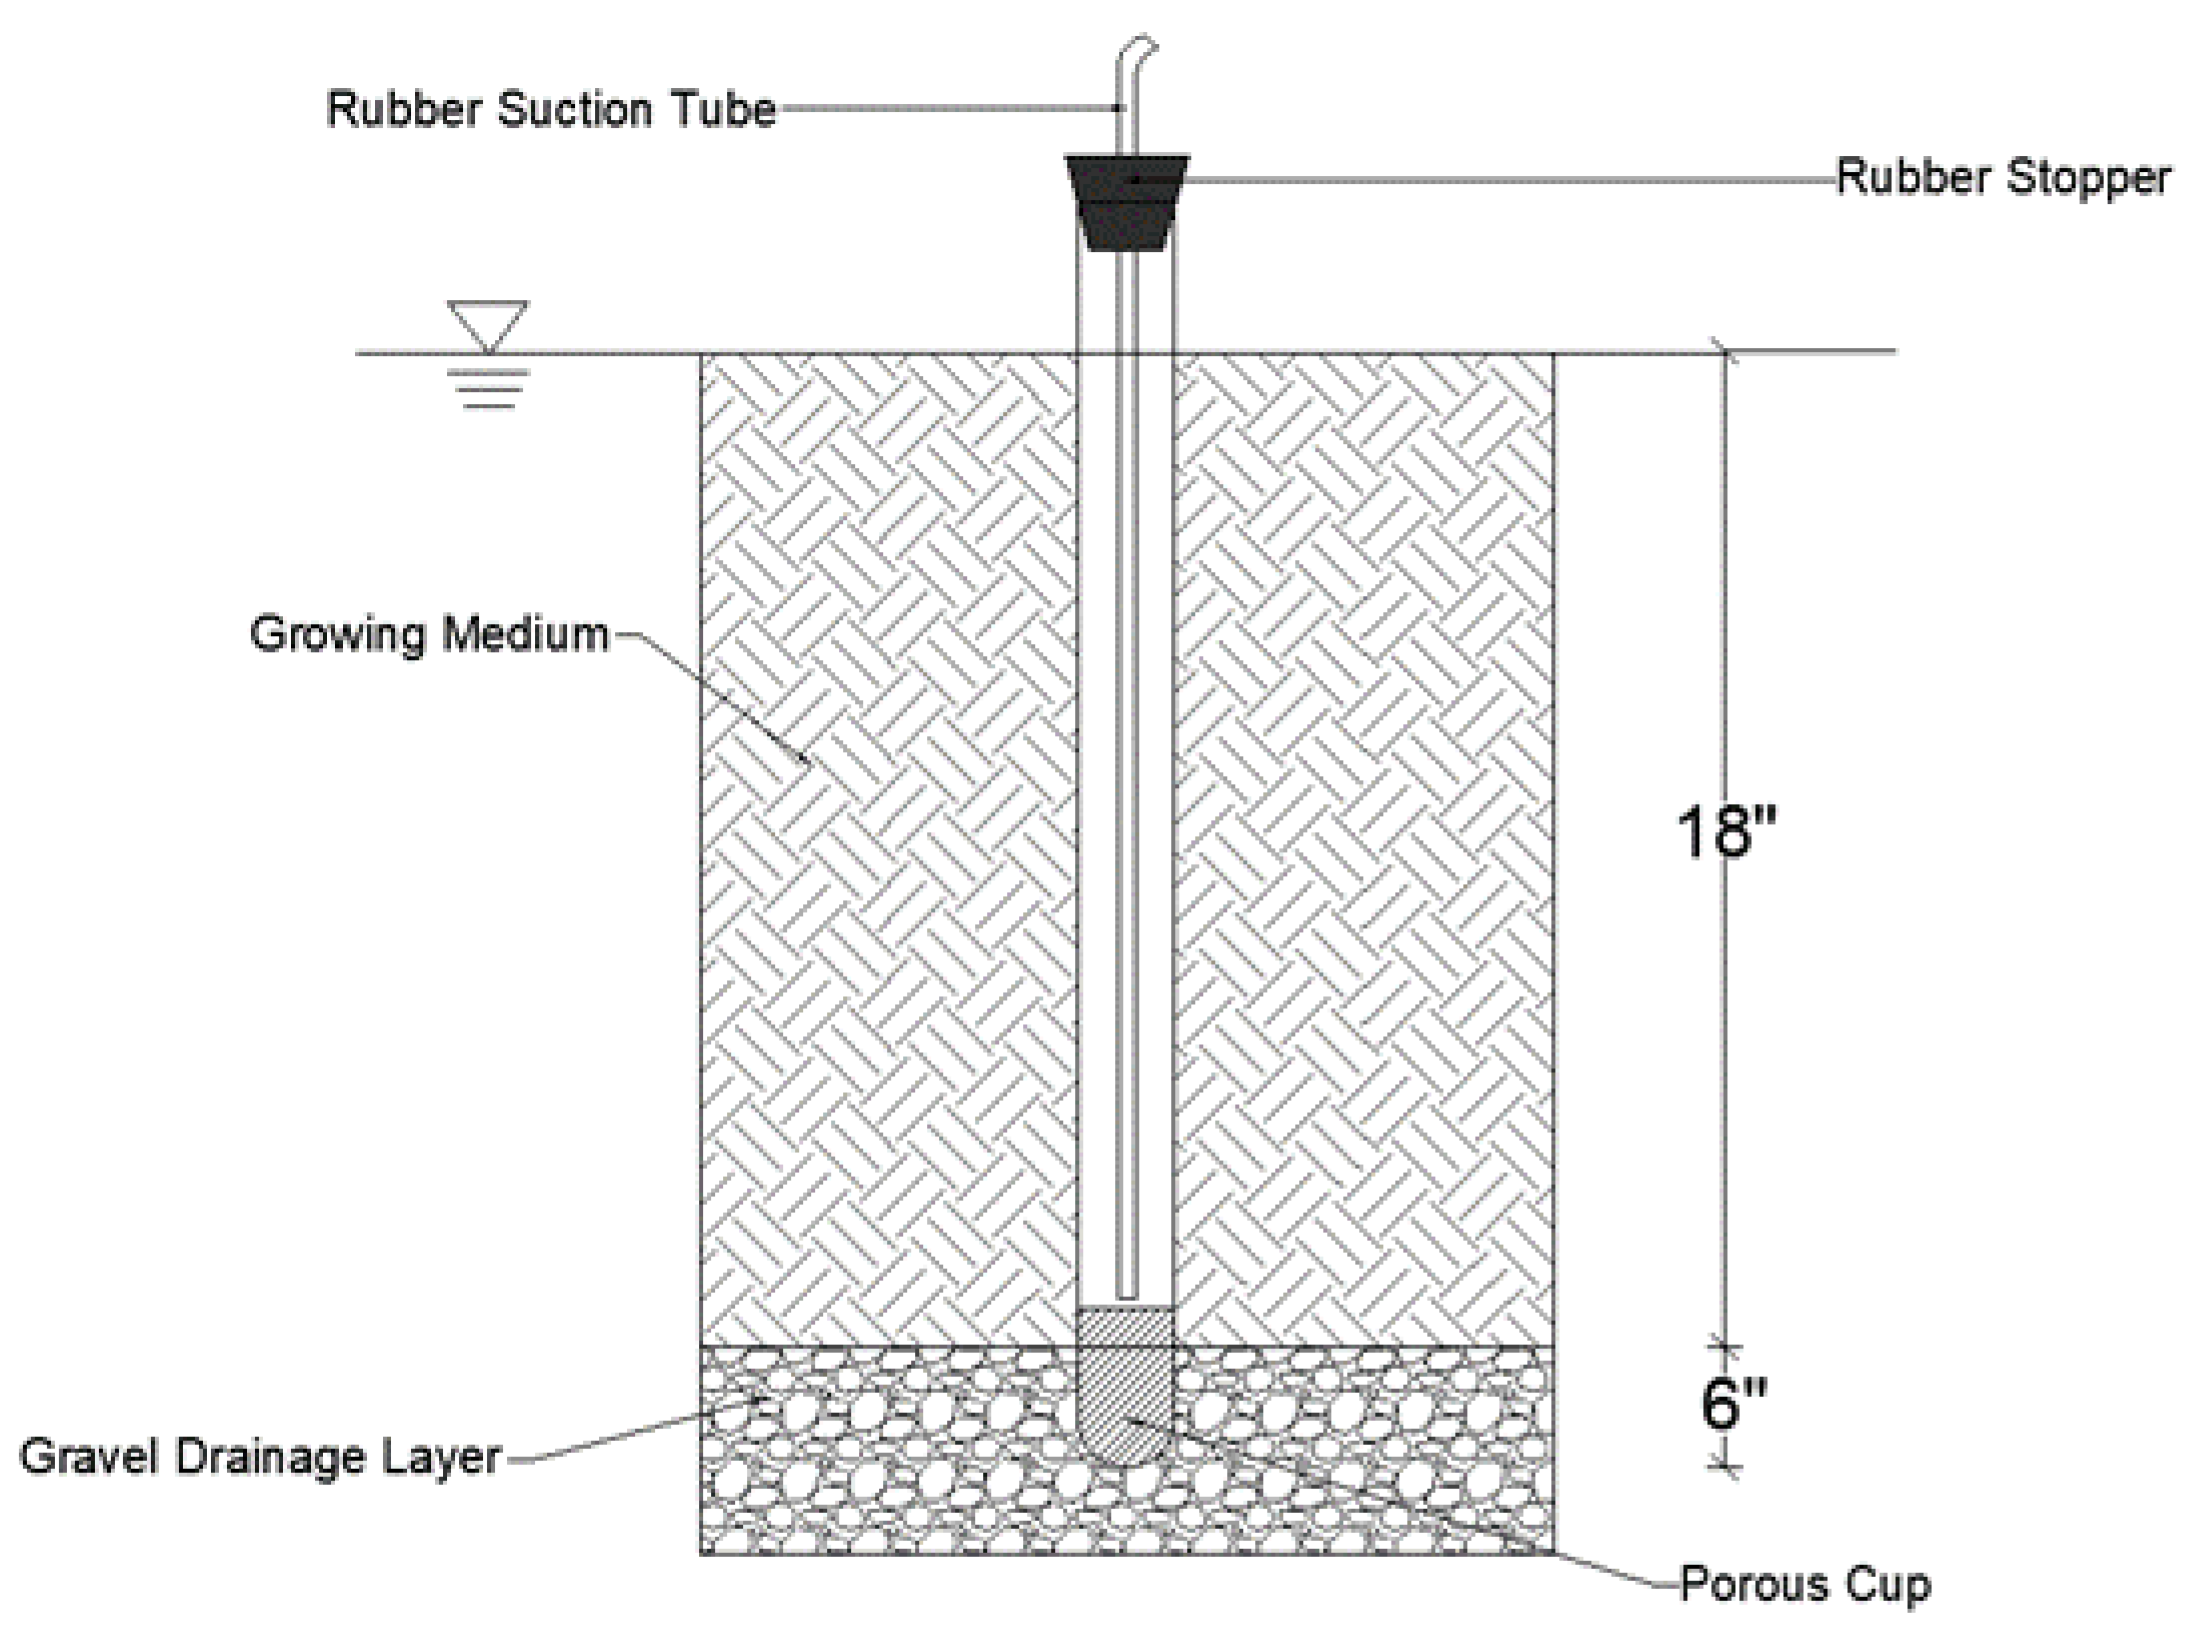
2.2. Data Collection and Analysis
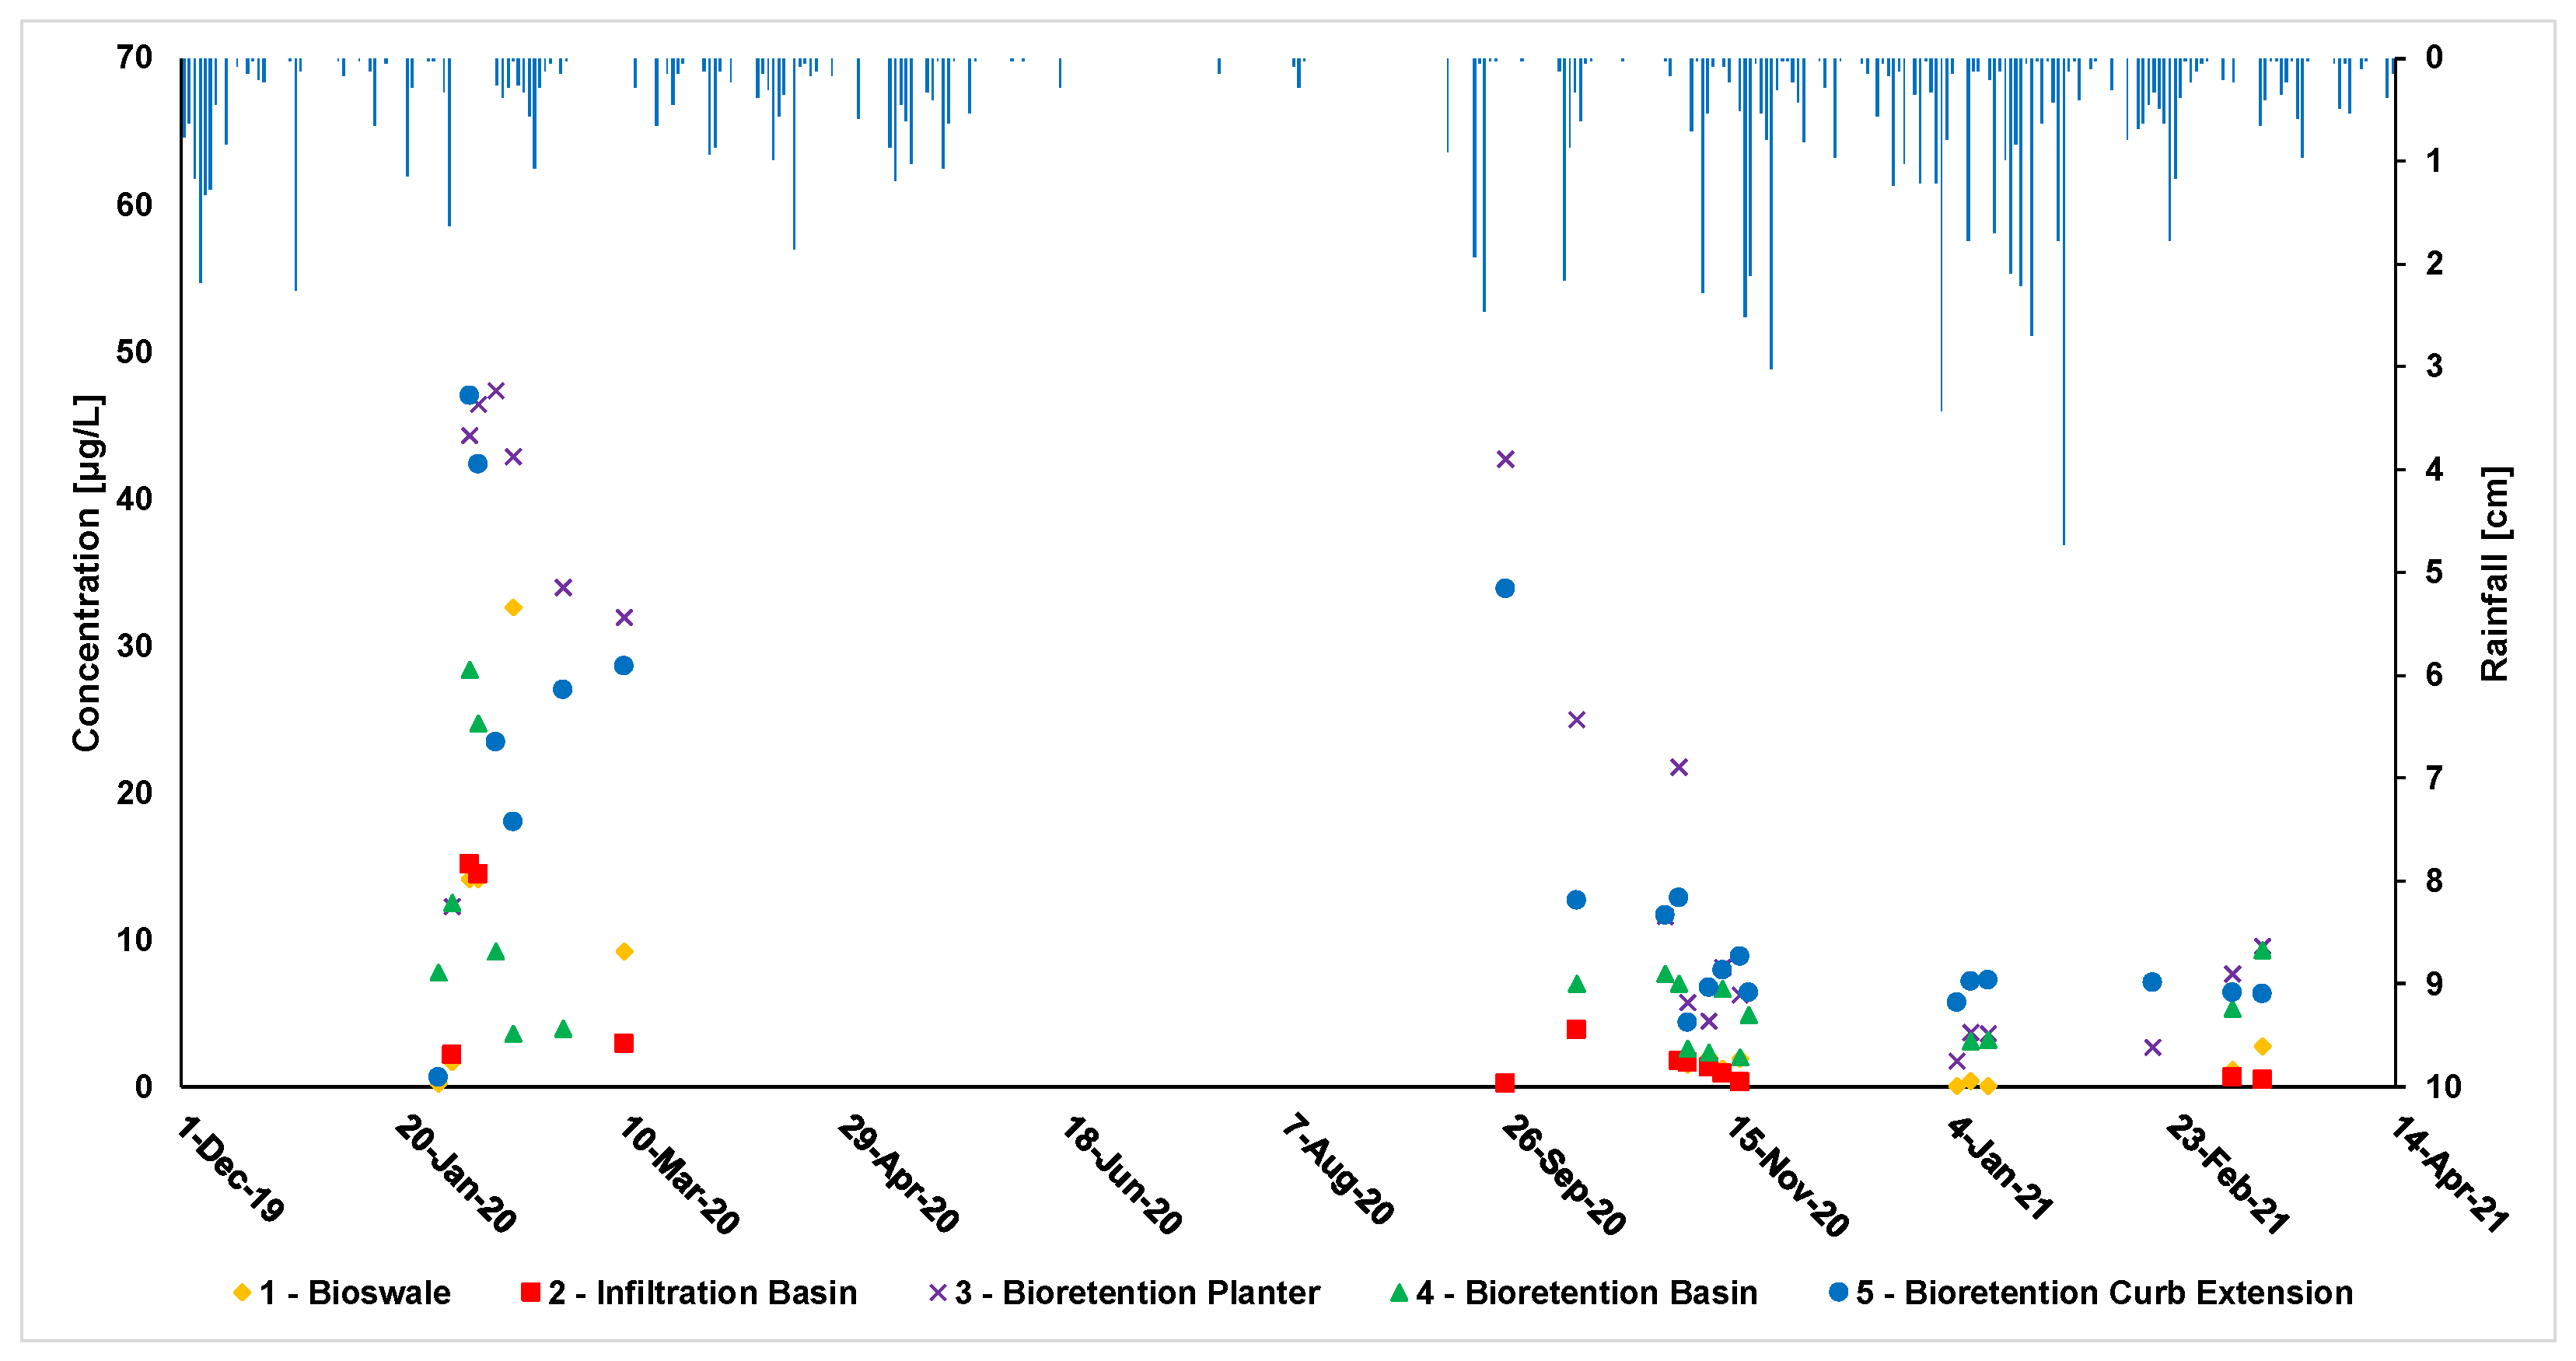
3. Results and Discussion
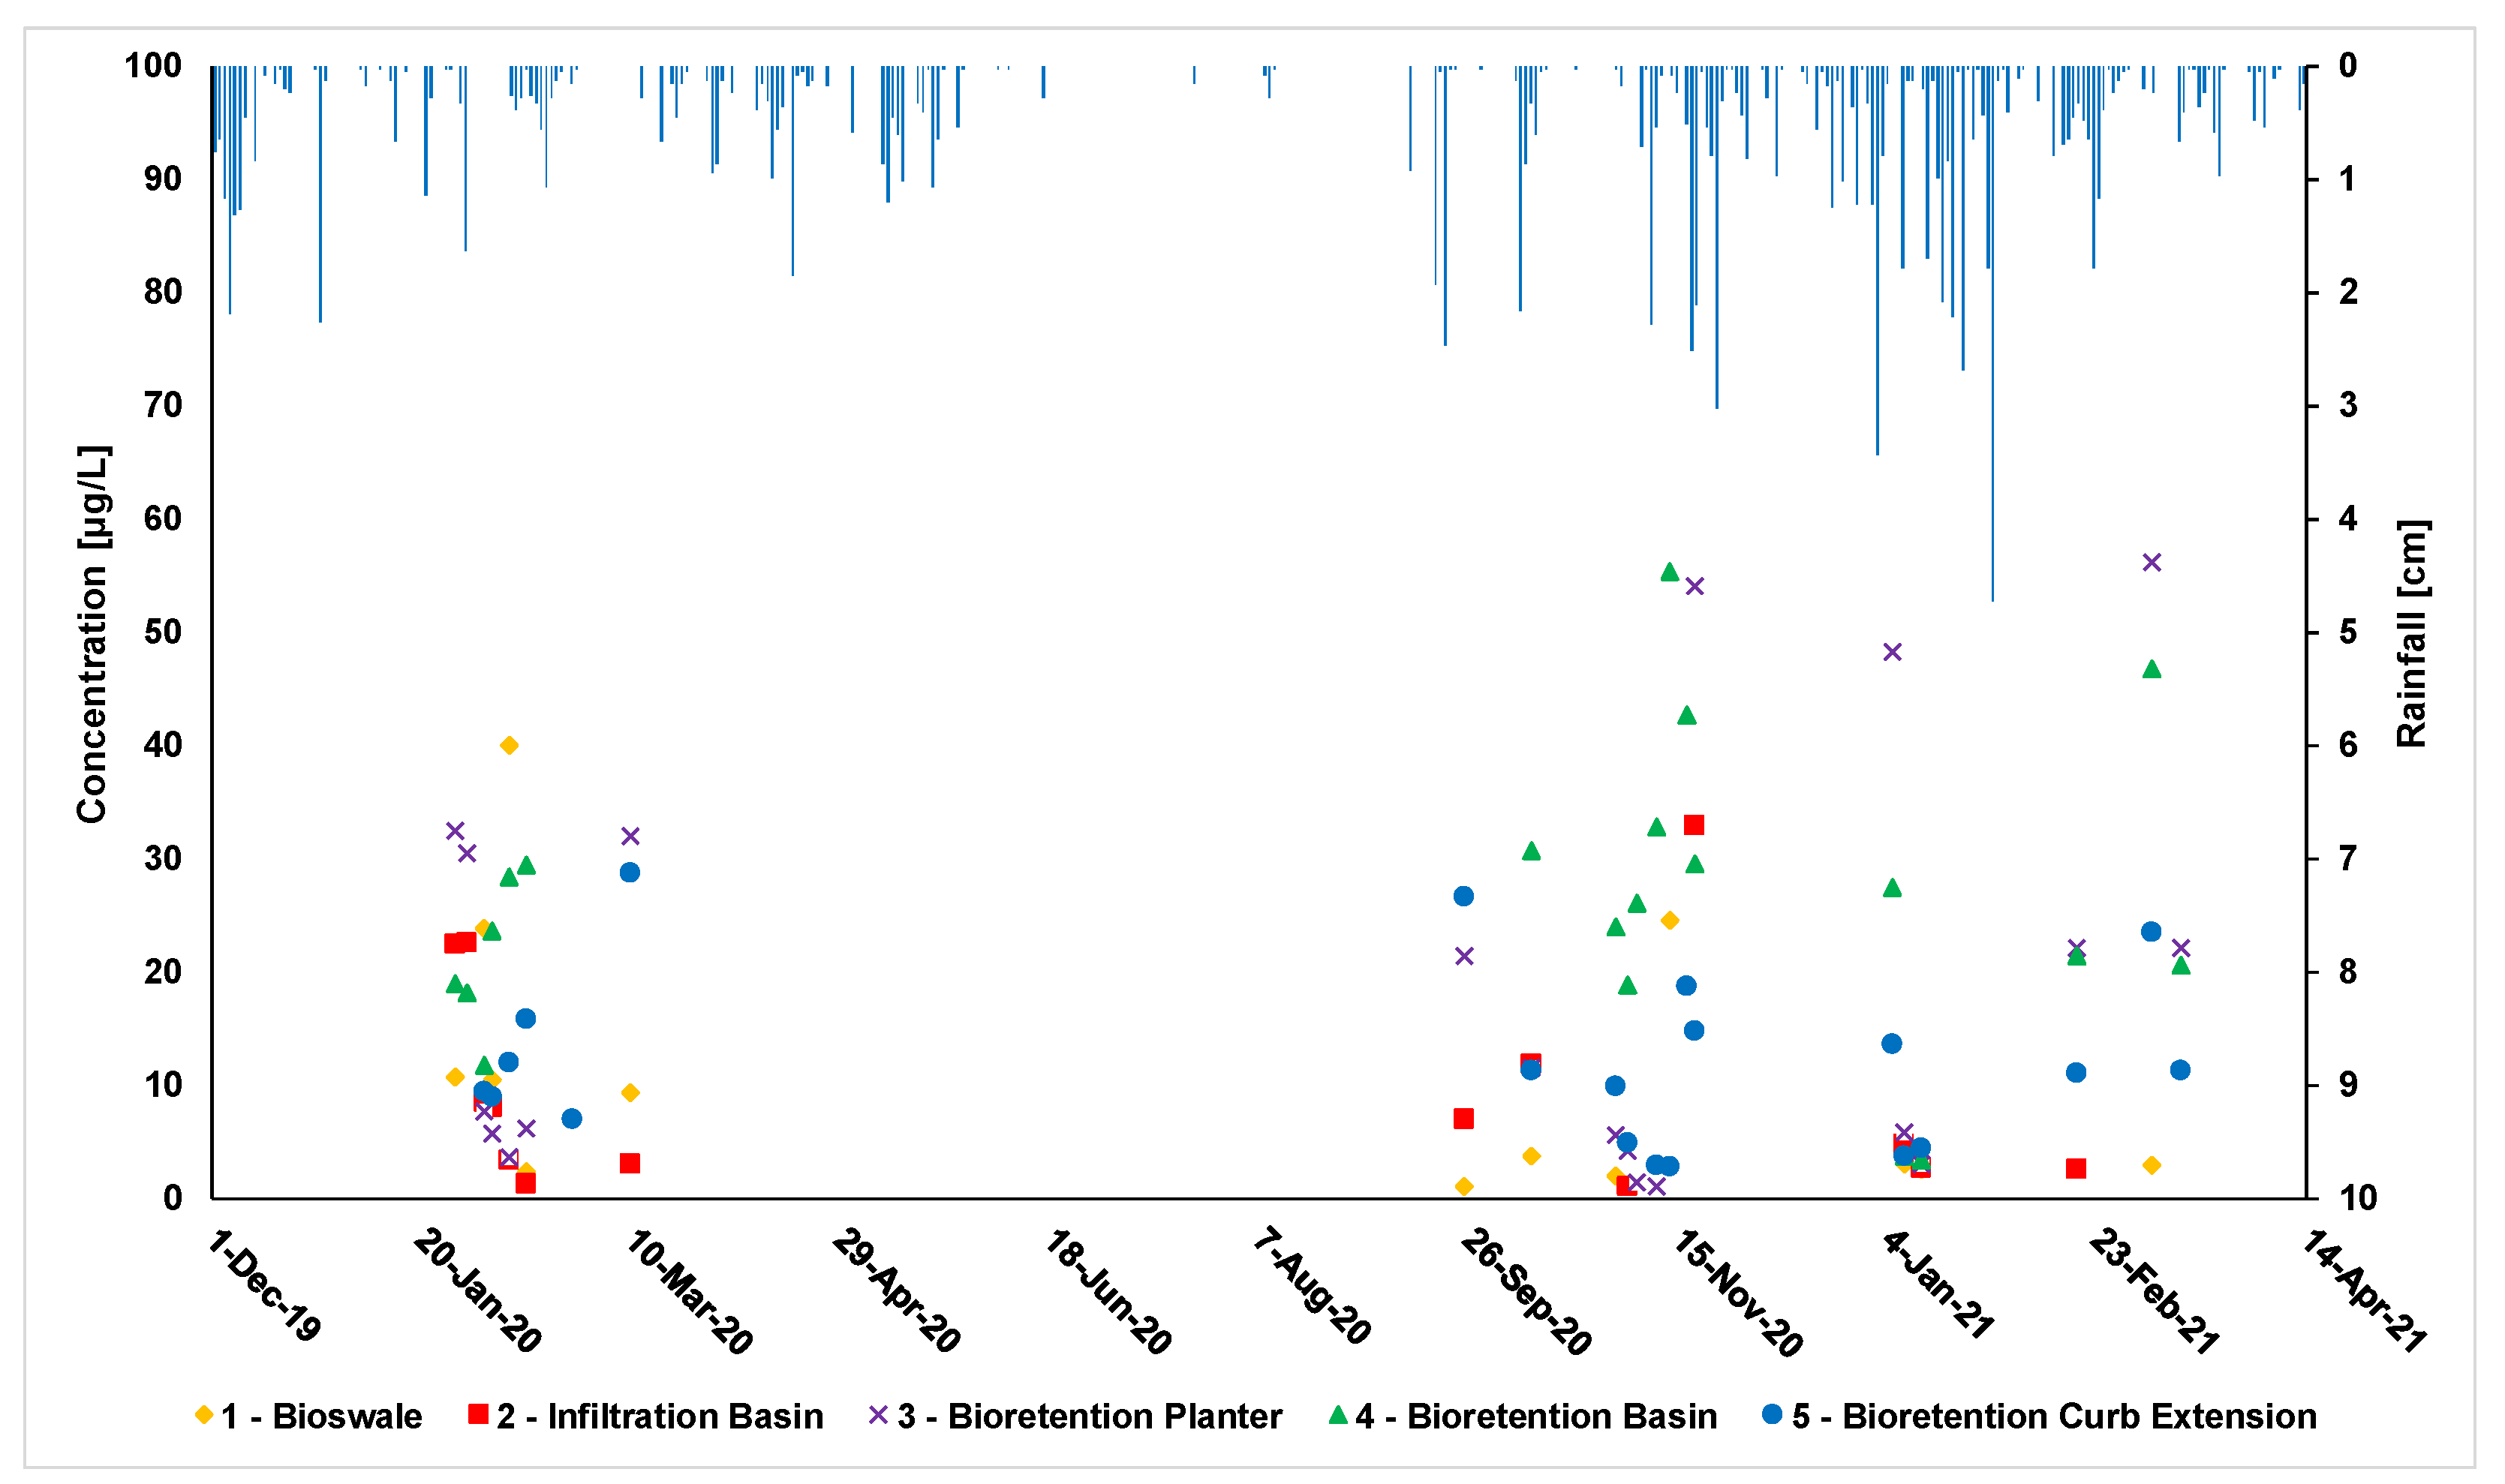
3.1. Copper
3.2. Zinc
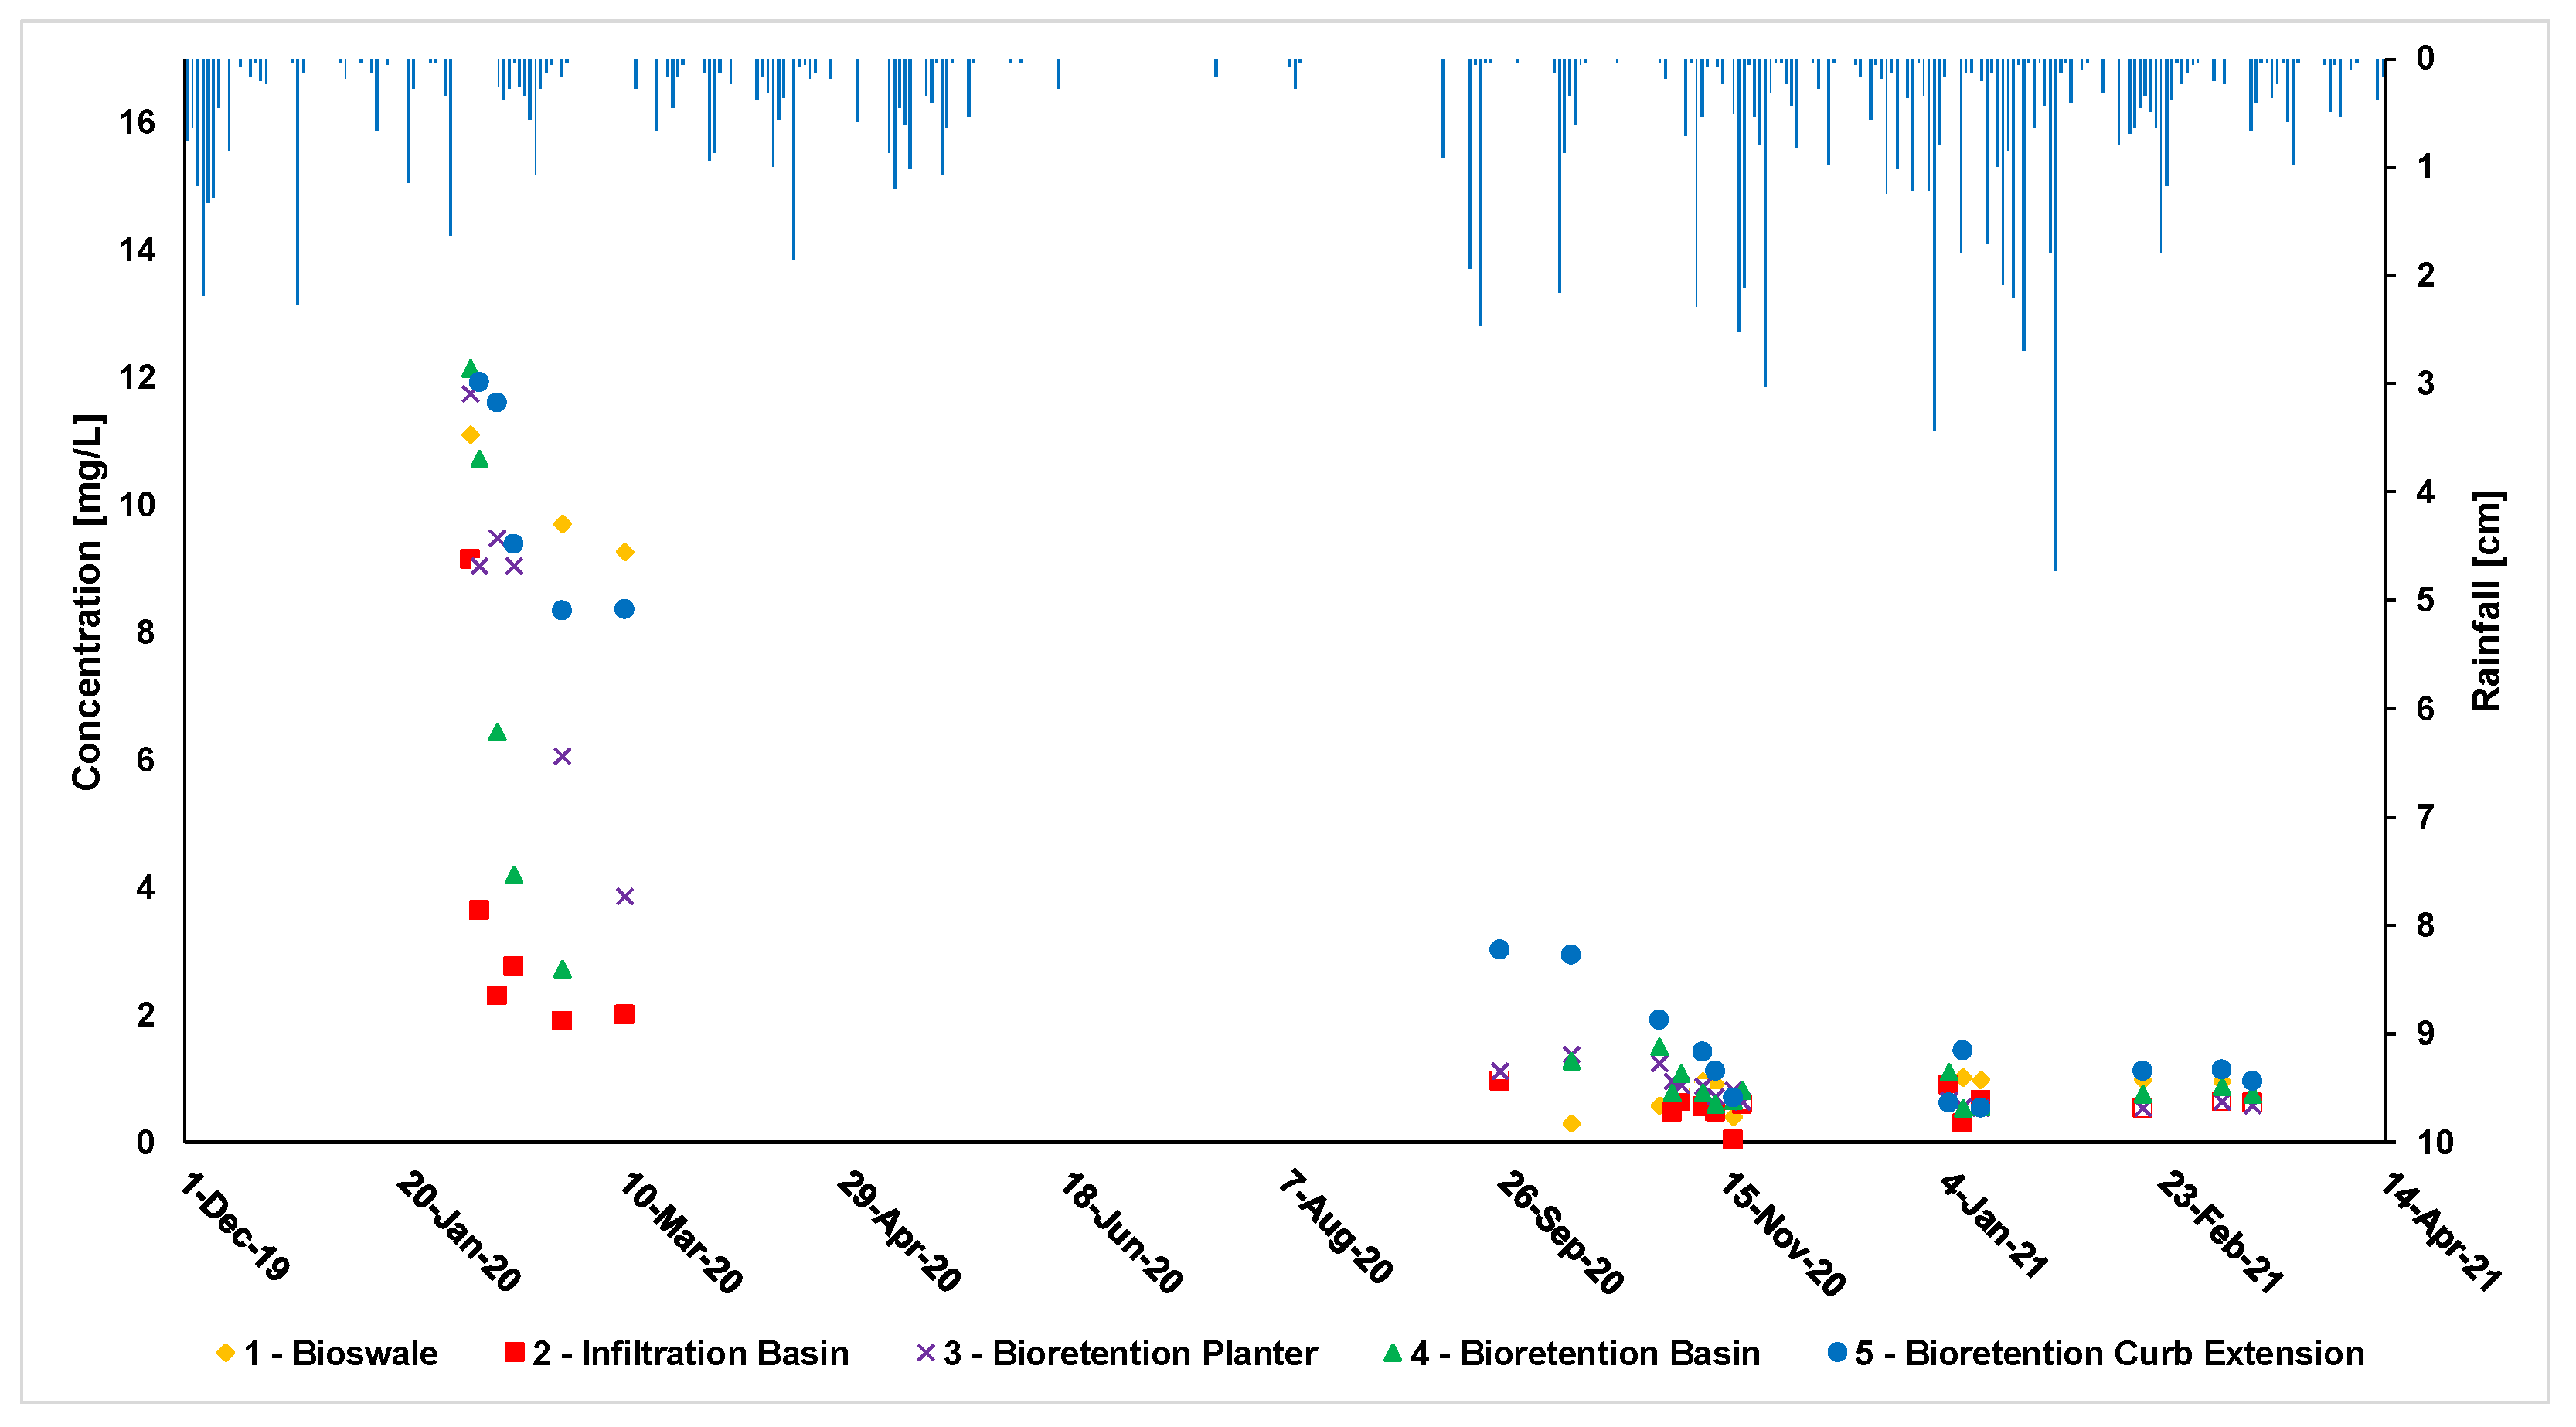
3.3. Phosphate
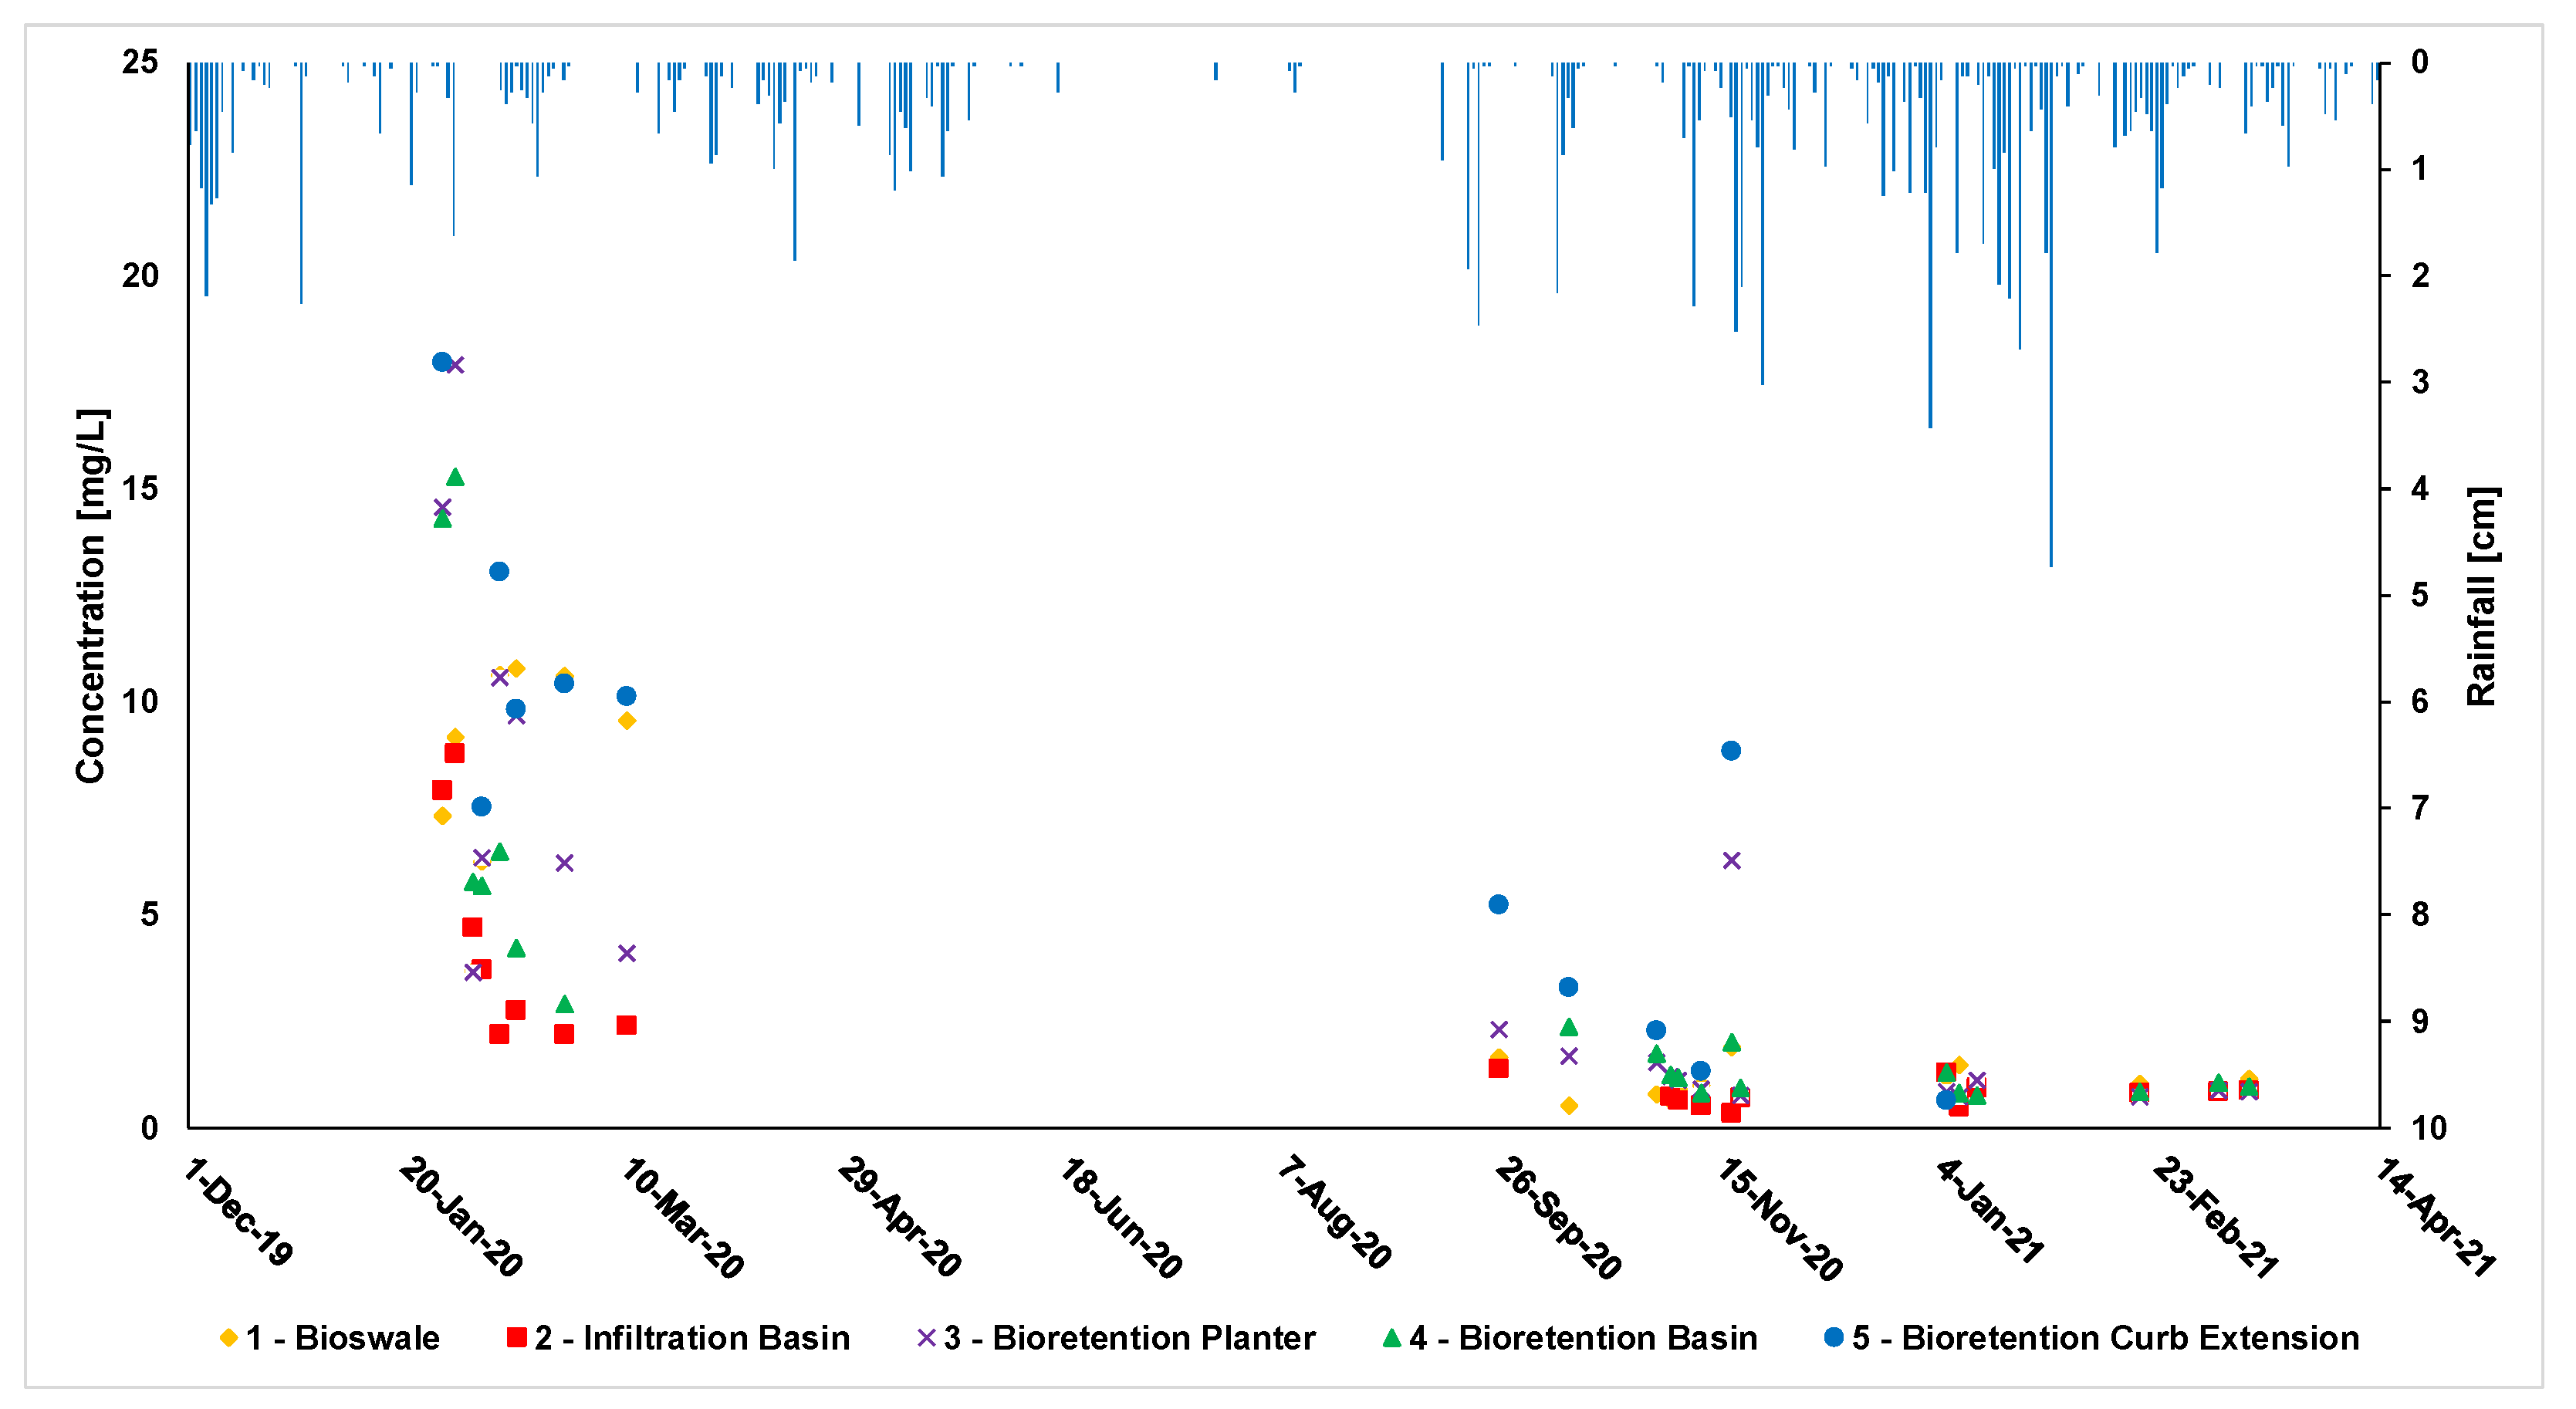
3.4. Total Phosphorus
4. Conclusions
Author Contributions
Funding
Data Availability Statement
Acknowledgments
Conflicts of Interest
References
- Dietz, M.E.; Clausen, J.C. Stormwater runoff and export changes with development in a traditional and low impace subdivision. J. Environ. Manag. 2008, 87, 560–566. [Google Scholar] [CrossRef]
- Allmendinger, N.E.; Pizzuto, J.E.; Moglen, G.E.; Lewicki, M. A sediment budget for an urbanizing watershed, 1951–1996, Montgomery County, Maryland, USA. J. AWWA 2007, 43, 1483–1498. [Google Scholar]
- Wang, J.; Zhao, Y.; Yang, L.; Tu, N.; Xi, G.; Fang, X. Removal of heavy metals from urban stormwater runoff using bioretention media mix. Water 2017, 9, 854. [Google Scholar] [CrossRef] [Green Version]
- EPA (Environmental Protection Agency). Harmful Algal Blooms. 2019. Available online: https://www.epa.gov/nutrientpollution/harmful-algal-blooms (accessed on 15 March 2020).
- City of Portland. Stormwater Management Manual; City of Portland: Portland, OR, USA, 2016.
- Freeborn, J.R.; Sample, D.J.; Fox, L.J. Residential stormwater: Methods for decreasing runoff and increasing stormwater infiltration. J. Green Build. 2012, 7, 15–30. [Google Scholar] [CrossRef]
- Palmer, E.T.; Poor, C.J.; Hinman, C.; Stark, J.D. Nitrate and phosphate removal through enhanced bioretention media: Mesocosm study. Water Environ. Res. 2013, 85, 823–832. [Google Scholar] [CrossRef]
- Valtanen, M.; Sillanpaa, N.; Setala, H. A large-scale lysimeter study of stormwater biofiltration under cold climatic conditions. Ecol. Eng. 2017, 100, 89–98. [Google Scholar] [CrossRef]
- Davis, A.P.; Hunt, W.; Traver, R.G.; Clar, M. Bioretention technology: Overview of current practice and future needs. J. Environ. Eng. 2009, 135, 109–117. [Google Scholar] [CrossRef]
- Jay, J.G.; Brown, S.L.; Kurtz, K.; Grothkopp, F. Predictors of phosphorus leaching from bioretention soil media. J. Environ. Qual. 2017, 46, 1098–1105. [Google Scholar] [CrossRef]
- Chapman, C.; Horner, R.R. Performance assessment of street-drainage bioretention system. Water Environ. Res. 2010, 82, 109–119. [Google Scholar] [CrossRef] [PubMed]
- Glass, C.; Bissouma, S. Evaluation of a parking lot bioretention cell for removal of stormwater pollutants. WIT Trans. Ecol. Environ. 2005, 81, 699–708. [Google Scholar]
- Hsieh, C.; Davis, A.P. Evaluation and optimization of bioretention media for treatment of urban storm water runoff. J. Environ. Eng. 2005, 131, 1521–1531. [Google Scholar] [CrossRef] [Green Version]
- Austin, G. Design and performance of bioretention beds for removal of stormwater contaminants. J. Green Build. 2012, 7, 17–27. [Google Scholar] [CrossRef]
- Davis, A.; Shoukouhian, M.; Sharma, H.; Minami, C.; Winogradoff, D. Water quality improvement through bioretention: Lead, copper, and zinc removal. Water Environ. Res. 2003, 75, 73–82. [Google Scholar] [CrossRef]
- Li, H.; Davis, A.P. Water quality improvement through reduction of pollutant loads using bioretention. J. Environ. Eng. 2009, 135, 567–576. [Google Scholar] [CrossRef]
- Trowsdale, S.; Simcock, R. Urban stormwater treatment using bioretention. J. Hydrol. 2011, 397, 167–174. [Google Scholar] [CrossRef]
- Poor, C.; Balmes, C.; Freudenthaler, M.; Martinez, A. Role of mycelium in bioretention systems: Evaluation of nutrient and metal retention in mycorrhizae-inoculated mesocosms. J. Environ. Eng. 2018, 144, 04018034. [Google Scholar] [CrossRef]
- Clary, J.; Jones, J.; Leisenring, M.; Hobson, P.; Strecker, E. International Stormwater BMP Database: 2016 Summary Statistics; Final Report; Water Environment Reuse Foundation: Portland, OR, USA, 2017. [Google Scholar]
- Mullane, J.M.; Flury, M.; Iqbal, H.; Freeze, P.M.; Hinman, C.; Cogger, C.G.; Shi, Z. Intermittent rainstorms cause pulses of nitrogen, phosphorus, and copper in leachate from compost in bioretention systems. Sci. Total Environ. 2015, 537, 294–303. [Google Scholar] [CrossRef] [Green Version]
- Hurley, S.; Shrestha, P.; Cording, A. Nutrient leaching from compost: Implications for bioretention and other green stormwater infrastructure. J. Sustain. Water Built Environ. 2017, 3, 04017006. [Google Scholar] [CrossRef]
- Paus, K.H.; Morgan, J.; Gulliver, J.S.; Hozalski, R.M. Effects of bioretention media compost volume fraction on toxic metals removal, hydraulic conductivity, and phosphorus release. J. Environ. Eng. 2014, 140, 04014033. [Google Scholar] [CrossRef]
- Birch, G.F.; Fezeli, M.S.; Matthai, C. Efficiency of an infiltration basin in removing contaminants from urban stormwater. Environ. Monit. Assess. 2005, 101, 23–38. [Google Scholar] [PubMed]
- Winston, R.J.; Luell, S.K.; Hunt, W.F. Retrofitting with bioretention and a bioswale to treat bridge deck stormwater runoff. In Proceedings of the Green Streets and Highways Conference, Denver, CO, USA, 14–17 November 2010; Weinstein, N., Ed.; American Society of Civil Engineers: Reston, VA, USA, 2010; pp. 147–162. [Google Scholar]
- Kohlsmith, E.; Morse, J.; Poor, C.; Law, J. Stormwater treatment effectiveness of established lined bioretention facilities in Portland, Oregon. J. Sustain. Water Built Environ. 2021, 7, 05021002. [Google Scholar] [CrossRef]
- Kandel, S.; Vogel, J.; Penn, C.; Brown, G. Phosphorus retention by fly ash amended filter media in aged bioretention cells. Water 2017, 9, 746. [Google Scholar] [CrossRef] [Green Version]
- Johnson, J.P.; Hunt, W.F. A retrospective comparison of water quality treatment in a bioretention cell 16 years following initial analysis. Sustainability 2019, 11, 1945. [Google Scholar] [CrossRef] [Green Version]
- Houdeshel, C.D.; Hultine, K.R.; Collins Johnson, N.; Pomeroy, C.A. Evaluation of three vegetation treatments in bioretention gardens in a semid-arid climate. Landsc. Urban Plan. 2015, 135, 62–72. [Google Scholar] [CrossRef]
- Costello, D.M.; Hartung, E.W.; Stoll, J.T.; Jefferson, A. Bioretention cell age and construction style influence stormwater pollutant dynamics. Sci. Total Environ. 2020, 712, 135597. [Google Scholar] [CrossRef] [PubMed]
- Rice, E.W.; Baird, R.B.; Eaton, A.D.; Clesceri, L.S. Standard Methods for the Examination of Water and Wastewater, 22nd ed.; American Public Health Association: Washington, DC, USA, 2012. [Google Scholar]
- Helsel, D.R.; Hirsch, R.M. Techniques of Water-Resources Investigations of the United States Geological Survey: Statistical Methods in Water Resources; United States Geological Survey: Reston, VA, USA, 2002. [Google Scholar]
- Clary, J.; Jones, J.; Leisenring, M.; Hobson, P.; Strecker, E. International Stormwater BMP Database: 2020 Summary Statistics; Water Research Foundation: Alexandria, VA, USA, 2020. [Google Scholar]
- Hobbie, S.E.; Finlay, J.C.; Janke, B.D.; Nidzgorski, D.A.; Millet, D.B.; Baker, L.A. Contrasting nitrogen and phosphorus budgets in urban watersheds and implications for managing urban water pollution. Proc. Natl. Acad. Sci. USA 2017, 114, 4177–4182. [Google Scholar] [CrossRef] [PubMed] [Green Version]
- Poor, C.J.; Conkle, K.; MacDonald, A.; Duncan, K. Water treatment residuals in bioretention planters to reduce phosphorus levels in stormwater. Environ. Eng. Sci. 2019, 36, 265–272. [Google Scholar] [CrossRef]
- Hererra Environmental Consultants. 185th Avenue NE Bioretention Stormwater Treatment System Performance Monitoring; Hererra Environmental Consultants: Seattle, WA, USA, 2014. [Google Scholar]
- Okita, J.; Poor, C.; Kleiss, J.M.; Eckmann, T. Effect of green roof age on runoff water quality in Portland, Oregon. J. Green Build. 2018, 13, 42–54. [Google Scholar] [CrossRef]
- NHDES (New Hampshire Department of Environmental Services). New Hampshire Stormwater Manual, Volume 2: Post-Construction Best Management Practices Selection and Design; NHDES: Concord, NH, USA, 2008.
- MDE (Maryland Department of the Environment). Maryland Stormwater Design Manual, Appendix A; MDE: Baltimore, MD, USA, 2009.
- NCDEQ (North Carolina Department of Environmental Quality). Stormwater Design Manual Part C: Minimum Design Criteria and Recommendations for Stormwater Control; NCDEQ: Raleigh, NC, USA, 2017.
- Erickson, A.; Gulliver, J.S.; Weiss, P.T. Enhanced sand for storm water phosphorus removal. J. Environ. Eng. 2007, 133, 485–497. [Google Scholar] [CrossRef] [Green Version]


| GSI Type | Date Established | Age | Surface Area (m2) | Catchment Area (m2) | Catchment: Surface Area Ratio |
|---|---|---|---|---|---|
| 2009 | 11 | 96.2 | 776 | 8.1 |
| 2011 | 9 | 172 | 8052 | 46.8 |
| 2018 | 2 | 600 | 11,533 | 19.2 |
| 2015 | 5 | 350 | 6516 | 18.6 |
| 2014 | 6 | 45 | 1164 | 25.8 |
| GSI Type | Cu (μg/L) | Zn (μg/L) | PO43− (mg/L) | TP (mg/L) |
|---|---|---|---|---|
| 5.5 | 10.5 | 2.4 | 3.9 |
| 2.6 | 9.4 | 1.5 | 2.2 |
| 19.7 | 18.7 | 2.9 | 4.3 |
| 8.0 | 25.6 | 2.5 | 3.5 |
| 15.1 | 12.0 | 3.9 | 5.8 |
| NSQD | 10.6 | 28.8 | 0.06 | 0.22 |
| Significant Difference? | Cu | Zn | PO43− | TP |
|---|---|---|---|---|
| 1 vs. 2 | No | No | No | Yes (p < 0.05) |
| 1 vs. 3 | Yes (p < 0.01) | Yes (p < 0.05) | No | No |
| 1 vs. 4 | No | Yes (p < 0.01) | No | No |
| 1 vs. 5 | Yes (p < 0.01) | No | No | No |
| 2 vs. 3 | Yes (p < 0.01) | Yes (p < 0.05) | No | Yes (p < 0.05) |
| 2 vs. 4 | Yes (p < 0.01) | Yes (p < 0.01) | No | No |
| 2 vs. 5 | Yes (p < 0.01) | No | Yes (p < 0.05) | Yes (p < 0.01) |
| 3 vs. 4 | Yes (p < 0.01) | No | No | No |
| 3 vs. 5 | No | No | No | No |
| 4 vs. 5 | Yes (p < 0.05) | Yes (p < 0.01) | No | Yes (p < 0.05) |
Publisher’s Note: MDPI stays neutral with regard to jurisdictional claims in published maps and institutional affiliations. |
© 2021 by the authors. Licensee MDPI, Basel, Switzerland. This article is an open access article distributed under the terms and conditions of the Creative Commons Attribution (CC BY) license (https://creativecommons.org/licenses/by/4.0/).
Share and Cite
Poor, C.; Membrere, T.; Miyasato, J. Impact of Green Stormwater Infrastructure Age and Type on Water Quality. Sustainability 2021, 13, 10484. https://doi.org/10.3390/su131810484
Poor C, Membrere T, Miyasato J. Impact of Green Stormwater Infrastructure Age and Type on Water Quality. Sustainability. 2021; 13(18):10484. https://doi.org/10.3390/su131810484
Chicago/Turabian StylePoor, Cara, Troy Membrere, and Jared Miyasato. 2021. "Impact of Green Stormwater Infrastructure Age and Type on Water Quality" Sustainability 13, no. 18: 10484. https://doi.org/10.3390/su131810484