
Cognitive Profiles in the WISC-V of Children with ADHD and Specific Learning Disorders


Abstract
:1. Introduction
1.1. Cognitive Profiles of Children with ADHD
1.2. Cognitive Profiles of Children with Specific Learning Disorders
1.3. Measuring Cognitive Profiles in Children with Specific Disabilities Using IQ Tests
1.4. Aims
2. Methods
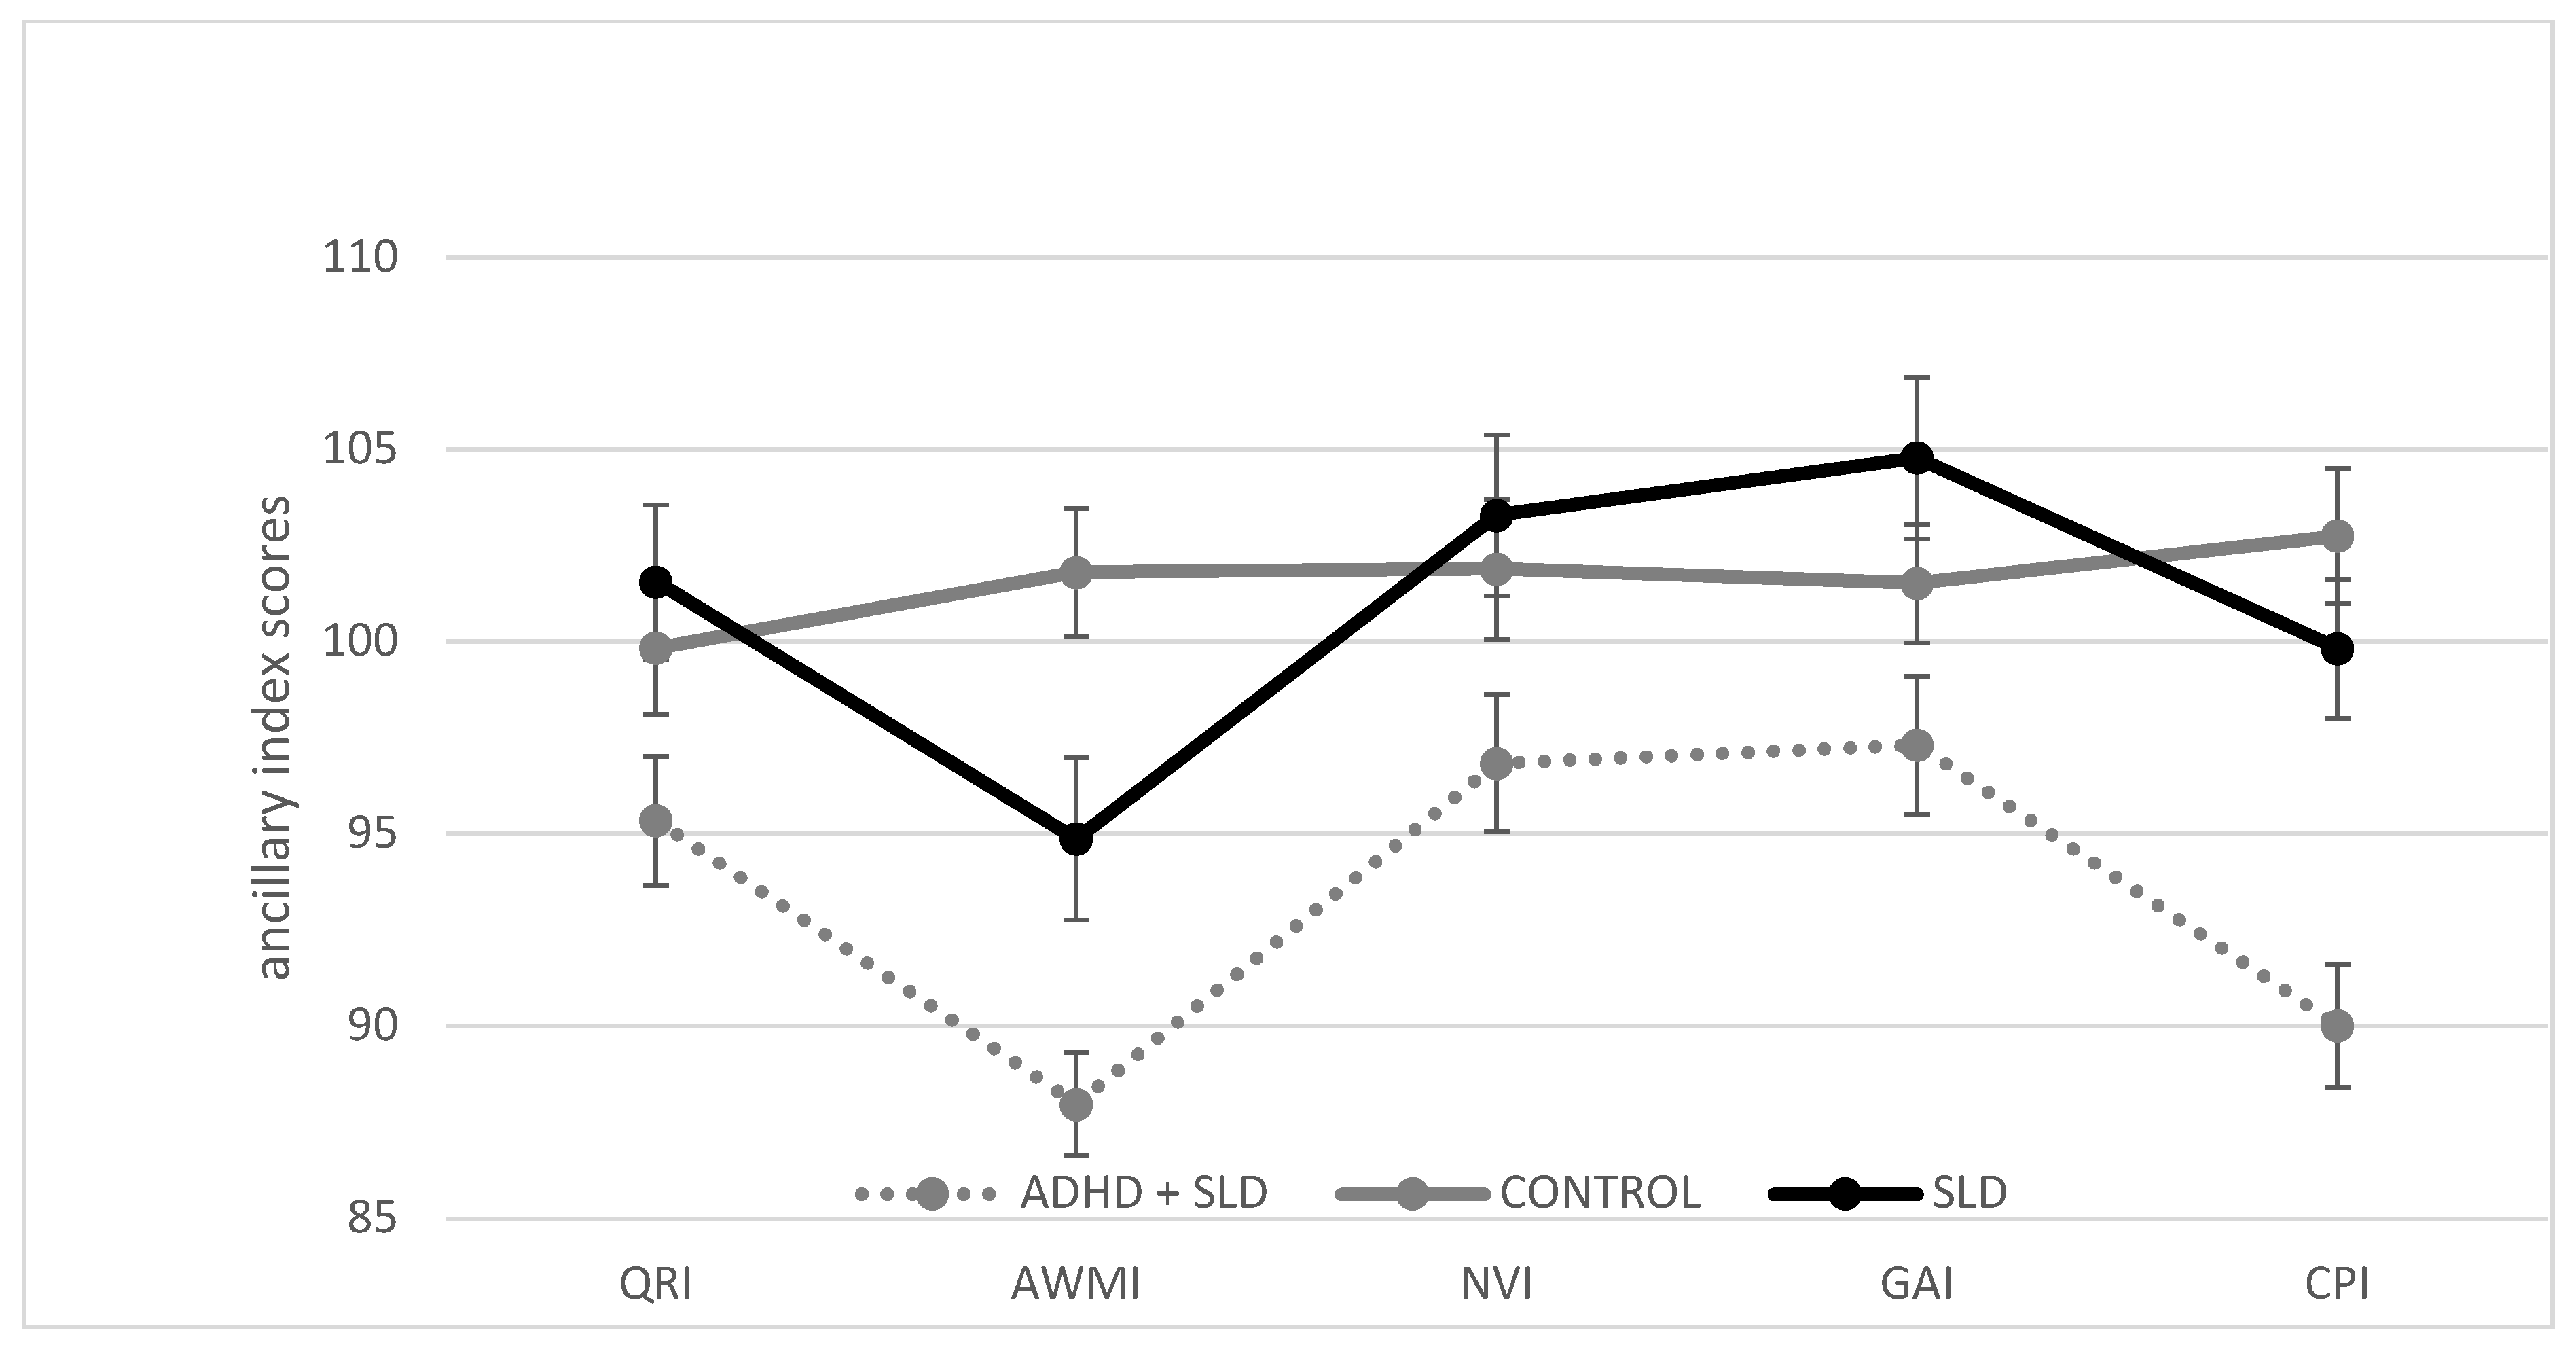
3. Results
3.1. Statistical Analyses
3.2. Descriptive Statistics and Group Comparison
4. Discussion
4.1. Comparison of ADHD + SLD and CONTROL
4.2. Comparison of ADHD + SLD and SLD
4.3. Exploratory Comparison of ADHD + SLD and ADHD
4.4. Exploratory Comparison of Children with and witout Arithmetic Problems in the ADHD + SLD Group
4.5. Limitations and Directions for Future Research
4.6. Implications for Practice
Author Contributions
Funding
Institutional Review Board Statement
Informed Consent Statement
Data Availability Statement
Acknowledgments
Conflicts of Interest
Appendix A

| WISC-V Index | ADHD + SLD n = 62 | SLD n = 34 | CONTROL n = 62 | ADHD n = 13 | Kruskal-Wallis | ||||||
|---|---|---|---|---|---|---|---|---|---|---|---|
| M | SD | M | SD | M | SD | M | SD | X2(df) | p a | ||
| VCI | 97.47 | 14.37 | 105.41 | 11.29 | 100.76 | 11.53 | 105.80 | 9.62 | 8.99 | (3) | 0.029 |
| VSI | 99.18 | 13.63 | 102.32 | 13.92 | 101.00 | 14.44 | 106.00 | 12.89 | 2.64 | (3) | 0.450 |
| FRI | 97.90 | 13.98 | 103.03 | 13.08 | 101.74 | 13.34 | 106.77 | 12.93 | 6.09 | (3) | 0.107 |
| WMI | 93.48 | 13.28 | 101.65 | 11.55 | 102.27 | 14.16 | 100.77 | 12.14 | 14.49 | (3) | 0.002 |
| PSI | 90.48 | 12.30 | 97.76 | 10.85 | 102.19 | 13.83 | 94.69 | 12.64 | 25.44 | (3) | <0.001 |
| FSIQ | 93.87 | 12.98 | 102.59 | 12.57 | 101.63 | 12.30 | 101.38 | 9.98 | 12.88 | (3) | 0.005 |
| QRI | 95.35 | 13.25 | 101.56 | 11.66 | 99.84 | 13.56 | 109.69 | 10.29 | 14.64 | (3) | 0.002 |
| AWMI | 87.98 | 10.52 | 94.88 | 12.31 | 101.81 | 13.17 | 95.85 | 8.92 | 32.87 | (3) | <0.001 |
| NVI | 96.85 | 14.03 | 103.29 | 12.22 | 101.89 | 14.35 | 104.85 | 11.05 | 5.38 | (3) | 0.146 |
| GAI | 97.32 | 14.07 | 104.79 | 12.28 | 101.52 | 12.11 | 105.85 | 11.87 | 7.03 | (3) | 0.071 |
| CPI | 90.02 | 12.64 | 99.82 | 10.54 | 102.76 | 13.82 | 97.00 | 11.23 | 28.95 | (3) | <0.001 |
| WISC-V Index | ADHD + SLD versus CONTROL | ADHD + SLD versus SLD | ADHD + SLD versus ADHD | SLD versus CONTROL | SLD versus ADHD | ADHD versus CONTROL | ||||||||||||||||||
|---|---|---|---|---|---|---|---|---|---|---|---|---|---|---|---|---|---|---|---|---|---|---|---|---|
| U a | Z b | p c | r d | U | Z | p | r | U | Z | p | r | U | Z | p | r | U | Z | p | r | U | Z | p | r | |
| VCI | 3575.50 | −1.501 | 0.133 | −0.135 | 2712.00 | −2.455 | 0.014 | −0.249 | 22150.00 | −1.979 | 0.048 | −0.228 | 2821.00 | −1.703 | 0.089 | −0.173 | 314.00 | −0.105 | 0.917 | −0.015 | 2268.50 | −1.230 | 0.219 | −0.142 |
| WMI | 3196.50 | −3.399 | 0.001 | −0.305 | 2673.00 | −2.751 | 0.006 | −0.279 | 2214.50 | −1.987 | 0.047 | −0.229 | 1655.50 | −0.448 | 0.654 | −0.045 | 851.00 | −0.152 | 0.880 | −0.022 | 475.00 | −0.267 | 0.790 | −0.031 |
| PSI | 2914.00 | −4.813 | <0.001 | −0.432 | 2664.00 | −2.818 | 0.005 | −0.286 | 2291.00 | −0.913 | 0.361 | −0.105 | 1455.50 | −1.956 | 0.050 | −0.198 | 276.50 | −0.979 | 0.328 | −0.014 | 361.00 | −1.869 | 0.062 | −0.218 |
| FSIQ | 3242.00 | −3.165 | 0.002 | −0.284 | 2683.50 | −2.665 | 0.008 | −0.271 | 2220.50 | −1.898 | 0.058 | −0.219 | 3001.50 | −0.274 | 0.784 | −0.027 | 303.50 | −0.348 | 0.728 | −0.050 | 493.00 | −0.014 | 0.989 | −0.001 |
| QRI | 3471.00 | −2.022 | 0.043 | −0.182 | 2737.50 | −2.264 | 0.024 | −0.229 | 2110.50 | −3.446 | 0.001 | −0.397 | 2987.00 | −0.384 | 0.701 | −0.038 | 769.00 | −2.064 | 0.039 | −0.298 | 2193.00 | −2.288 | 0.022 | −0.264 |
| AWMI | 27771.0 | −5.543 | <0.001 | −0.498 | 2659.50 | −2.852 | 0.004 | −0.289 | 2186.00 | −2.388 | 0.017 | −0.275 | 1419.50 | −2.226 | 0.026 | −0.226 | 318.00 | −0.012 | 0.991 | −0.001 | 398.00 | −1.474 | 0.141 | −0.170 |
| CPI | 2893.00 | −4.912 | <0.001 | −0.441 | 2525.50 | −3.694 | <0.001 | −0.375 | 2229.00 | −1.781 | 0.075 | −0.206 | 1472.00 | −1.358 | 0.174 | −0.138 | 268.50 | −1.037 | 0.300 | −0.149 | 374.50 | −1.675 | 0.094 | −0.193 |
Appendix B


Appendix C
| WISC-V Index | ADHD + SLD versus CONTROL | ADHD + SLD versus SLD | SLD versus CONTROL | ||||||
|---|---|---|---|---|---|---|---|---|---|
| t(122) | p | d | t(95) | p | d | t(95) | p | d | |
| VCI | 1.406 | 0.161 | 0.24 | −2.308 | 0.023 | 0.52 | −1.368 | 0.175 | 0.24 |
| WMI | 3.564 | 0.001 | 0.67 | −3.038 | 0.003 | 0.75 | 0.241 | 0.810 | 0.00 |
| PSI | 4.982 | <0.001 | 0.96 | −2.635 | 0.010 | 0.61 | 1.840 | 0.069 | 0.41 |
| FSIQ | 3.416 | 0.001 | 0.72 | −3.013 | 0.003 | 0.69 | −0.173 | 0.863 | 0.00 |
| AWMI | 6.458 | <0.001 | 1.08 | −2.788 | 0.006 | 0.61 | 2.662 | 0.009 | 0.55 |
| NVI | 1.975 | 0.051 | 0.36 | −2.064 | 0.042 | 0.46 | −0.295 | 0.768 | 0.07 |
| GAI | 1.779 | 0.078 | 0.38 | −2.254 | 0.027 | 0.52 | −0.895 | 0.373 | 0.16 |
| CPI | 5.359 | <0.001 | 0.89 | −3.848 | <0.001 | 0.87 | 1.077 | 0.284 | 0.23 |
Appendix D
| Subtest | ADHD + SLD n = 62 | SLD n = 34 | CONTROL n = 62 | ADHD n = 13 | Kruskal-Wallis | ||||||
|---|---|---|---|---|---|---|---|---|---|---|---|
| M | SD | M | SD | M | SD | M | SD | X2(df) | p a | ||
| DS | 7.66 | 2.03 | 9.20 | 2.24 | 10.34 | 2.59 | 9.00 | 2.48 | 33.30 | (3) | <0.001 |
| PS | 10.05 | 3.03 | 11.34 | 2.75 | 10.44 | 3.21 | 11.23 | 2.55 | 4.12 | (3) | 0.249 |
| LN | 7.95 | 4.03 | 8.86 | 2.61 | 10.34 | 2.69 | 9.46 | 1.61 | 25.63 | (3) | <0.001 |
References
- Huss, M.; Hölling, H.; Kurth, B.-M.; Schlack, R. How often are German children and adolescents diagnosed with ADHD? Prevalence based on the judgment of health care professionals: Results of the German health and examination survey (KiGGS). Eur. Child Adolesc. Psychiatry 2008, 17 (Suppl. 1), 52–58. [Google Scholar] [CrossRef]
- Polanczyk, G.; De Lima, M.S.; Horta, B.L.; Biederman, J.; Rohde, L.A. The worldwide prevalence of ADHD: A systematic review and metaregression analysis. Am. J. Psychiatry 2007, 164, 942–948. [Google Scholar] [CrossRef] [PubMed]
- Landerl, K.; Moll, K. Comorbidity of learning disorders: Prevalence and familial transmission. J. Child Psychol. Psychiatry. 2010, 51, 287–294. [Google Scholar] [CrossRef] [PubMed]
- Moll, K.; Kunze, S.; Neuhoff, N.; Bruder, J.; Schulte-Körne, G. Specific learning disorder: Prevalence and gender differences. PLoS ONE 2014, 9, e103537. [Google Scholar] [CrossRef] [PubMed] [Green Version]
- Fortes, I.S.; Paula, C.S.; Oliveira, M.C.; Bordin, I.A.; de Jesus Mari, J.; Rohde, L.A. A cross-sectional study to assess the prevalence of DSM-5 specific learning disorders in representative school samples from the second to sixth grade in Brazil. Eur. Child Adolesc. Psychiatry 2016, 25, 195–207. [Google Scholar] [CrossRef] [PubMed]
- Sexton, C.C.; Gelhorn, H.L.; Bell, J.A.; Classi, P.M. The Co-occurrence of Reading Disorder and ADHD: Epidemiology, Treatment, Psychosocial Impact, and Economic Burden. J. Learn. Disabil. 2012, 45, 538–564. [Google Scholar] [CrossRef]
- Mayes, S.D.; Calhoun, S.L.; Crowell, E.W. Learning Disabilities and ADHD: Overlapping Spectrum Disorders. J. Learn. Disabil. 2000, 33, 417–424. [Google Scholar] [CrossRef]
- Mattison, R.E.; Mayes, S.D. Relationships Between Learning Disability, Executive Function, and Psychopathology in Children with ADHD. J. Atten. Disord. 2012, 16, 138–146. [Google Scholar] [CrossRef]
- Yoshimasu, K.; Barbaresi, W.J.; Colligan, R.C.; Killian, J.M.; Voigt, R.G.; Weaver, A.L.; Katusic, S.K. Gender, ADHD, and Reading Disability in a Population-Based Birth Cohort. Pediatrics 2010, 126, e788–e795. [Google Scholar] [CrossRef] [Green Version]
- Schuchardt, K.; Fischbach, A.; Balke-Melcher, C.; Mähler, C. Die Komorbidität von Lernschwierigkeiten mit ADHS-Symptomen im Grundschulalter. Z. Kinder. Jugendpsychiatr. Psychother. 2015, 43, 185–193. [Google Scholar] [CrossRef]
- Visser, L.; Kalmar, J.; Linkersdörfer, J.; Görgen, R.; Rothe, J.; Hasselhorn, M.; Schulte-Körne, G. Comorbidities Between Specific Learning Disorders and Psychopathology in Elementary School Children in Germany. Front. Psychiatry 2020, 11, 1–12. [Google Scholar] [CrossRef]
- American Psychiatric Association. Diagnostic and Statistical Manual of Mental Disorders, 5th ed.; American Psychiatric Association: Washington, DC, USA, 2013. [Google Scholar]
- World Health Organization. Internationale Statistische Klassifikation der Krankheiten und Verwandter Gesundheitsprobleme, 10. Revision, German Modification, Version 2014; WHO: Geneva, Switzerland, 2014. [Google Scholar]
- Willcutt, E.G.; Doyle, A.E.; Nigg, J.T.; Faraone, S.V.; Pennington, B.F. Validity of the executive function theory of attention-deficit/hyperactivity disorder: A meta-analytic review. Biol. Psychiatry 2005, 57, 1336–1346. [Google Scholar] [CrossRef] [PubMed]
- Kasper, L.J.; Alderson, R.M.; Hudec, K.L. Moderators of working memory deficits in children with attention-deficit/hyperactivity disorder (ADHD): A meta-analytic review. Clin. Psychol. Rev. 2012, 32, 605–617. [Google Scholar] [CrossRef]
- Martinussen, R.; Hayden, J.; Hogg-Johnson, S.; Tannock, R. A meta-analysis of working memory impairments in children with attention-deficit/hyperactivity disorder. J. Am. Acad. Child Adolesc. Psychiatry 2005, 44, 377–384. [Google Scholar] [CrossRef]
- Shanahan, M.A.; Pennington, B.F.; Yerys, B.E.; Scott, A.; Boada, R.; Willcutt, E.G.; Olson, R.K.; DeFries, J.C. Processing speed deficits in attention deficit/hyperactivity disorder and reading disability. J. Abnorm. Child Psychol. 2006, 34, 585–602. [Google Scholar] [CrossRef] [PubMed]
- Pievsky, M.A.; McGrath, R.E. The Neurocognitive Profile of Attention-Deficit/Hyperactivity Disorder: A Review of Meta-Analyses. Arch. Clin. Neuropsychol. 2018, 33, 143–157. [Google Scholar] [CrossRef] [Green Version]
- Barkley, R.A. Behavioral inhibition, sustained attention, and executive functions: Constructing a unifying theory of ADHD. Psychol. Bull. 1997, 121, 65–94. [Google Scholar] [CrossRef] [Green Version]
- Hasselhorn, M.; Schuchardt, K.; Mähler, C. Arbeitsgedächtnis bei Kindern mit diagnostizierter Lese-Und/oder Rechtschreibstörung Zum Einfluss von Wortlänge und Lexikalität auf die Gedächtnisspanne. Z. Entwicklungspsychol. Padagog. Psychol. 2010, 42, 211–216. [Google Scholar] [CrossRef]
- Toffalini, E.; Giofrè, D.; Cornoldi, C. Strengths and Weaknesses in the Intellectual Profile of Different Subtypes of Specific Learning Disorder: A Study on 1049 Diagnosed Children. Clin. Psychol. Sci. 2017, 5, 402–409. [Google Scholar] [CrossRef]
- Landerl, K.; Fussenegger, B.; Moll, K.; Willburger, E. Dyslexia and dyscalculia: Two learning disorders with different cognitive profiles. J. Exp. Child Psychol. 2009, 103, 309–324. [Google Scholar] [CrossRef] [PubMed]
- Willcutt, E.G.; Petrill, S.A.; Wu, S.; Boada, R.; DeFries, J.C.; Olson, R.K.; Pennington, B.F. Comorbidity between reading disability and math disability: Concurrent psychopathology, functional impairment, and neuropsychological functioning. J. Learn. Disabil. 2013, 46, 500–516. [Google Scholar] [CrossRef] [PubMed] [Green Version]
- Wechsler, D. Wechsler Intelligence Scale for Children—Fifth Edition (WISC-V); Pearson: San Antonio, TX, USA, 2014. [Google Scholar]
- Wechsler, D. Wechsler Intelligence Scale for Children—Fourth Edition (WISC-IV); Pearson: San Antonio, TX, USA, 2003. [Google Scholar]
- Giofrè, D.; Cornoldi, C. The structure of intelligence in children with specific learning disabilities is different as compared to typically development children. Intelligence 2015, 52, 36–43. [Google Scholar] [CrossRef]
- World Health Organization. International Classification of Diseases for Mortality and Morbidity Statistics (ICD-11), 11th Revision; WHO: Geneva, Switzerland, 2018. [Google Scholar]
- Poletti, M. WISC-IV Intellectual Profiles in Italian Children With Specific Learning Disorder and Related Impairments in Reading, Written Expression, and Mathematics. J. Learn. Disabil. 2016, 49, 320–335. [Google Scholar] [CrossRef]
- Mayes, S.D.; Calhoun, S.L. WISC-IV and WISC-III profiles in children with ADHD. J. Atten. Disord. 2006, 9, 486–493. [Google Scholar] [CrossRef] [PubMed]
- Pauls, F.; Daseking, M.; Jacobs, C.; Werpup, L.; Petermann, F. Intelligenzdiagnostik bei Kindern und Jugendlichen mit ADHS. Kindh. Entwickl. 2018, 27, 165–174. [Google Scholar] [CrossRef]
- Yang, P.; Cheng, C.P.; Chang, C.L.; Liu, T.L.; Hsu, H.Y.; Yen, C.F. Wechsler Intelligence Scale for Children 4th edition—Chinese version index scores in Taiwanese children with attention-deficit/hyperactivity disorder. Psychiatry Clin. Neurosci. 2013, 67, 83–91. [Google Scholar] [CrossRef] [PubMed]
- Devena, S.E.; Watkins, M.W. Diagnostic Utility of WISC-IV General Abilities Index and Cognitive Proficiency Index Difference Scores Among Children with ADHD. J. Appl. Sch. Psychol. 2012, 28, 133–154. [Google Scholar] [CrossRef] [Green Version]
- Mealer, C.; Morgan, S.; Luscomb, R. Cognitive functioning of ADHD and non-ADHD boays on the WISC-II and WRAML: An analysis within a memory model. J. Atten. Disord. 1996, 1, 133–145. [Google Scholar] [CrossRef]
- Assesmany, A.; McIntosh, D.E.; Phelps, L.; Rizza, M.G. Discriminant validity of the WISC-III with children classified with ADHD. J. Psychoeduc. Assess. 2001, 19, 137–147. [Google Scholar] [CrossRef]
- Tischler, T.; Daseking, M.; Petermann, F. Kognitive fähigkeiten und lesekompetenz: Zur bedeutung der intelligenz für die güte der lesefertigkeit. Kindh. Entwickl. 2017, 26, 48–57. [Google Scholar] [CrossRef]
- De Clercq-Quaegebeur, M.; Casalis, S.; Lemaitre, M.P.; Bourgois, B.; Getto, M.; Vallée, L. Neuropsychological Profile on the WISC-IV of French Children with Dyslexia. J. Learn. Disabil. 2010, 43, 563–574. [Google Scholar] [CrossRef] [PubMed] [Green Version]
- Parke, E.M.; Thaler, N.S.; Etcoff, L.M.; Allen, D.N. Intellectual Profiles in Children with ADHD and Comorbid Learning and Motor Disorders. J. Atten. Disord. 2020, 24, 1227–1236. [Google Scholar] [CrossRef] [PubMed]
- Frazier, T.W.; Demarree, H.A.; Youngstrom, E.A. Meta-analysis of intellectual and neuropsychological test performance in attention-deficit/hyperactivity disorder. Neuropsychology 2004, 18, 543–555. [Google Scholar] [CrossRef] [PubMed] [Green Version]
- Jepsen, J.R.M.; Mortensen, E.L. Do Attention Deficits Influence IQ Assessment in Children and Adolescents with ADHD? J. Atten. Disord. 2009, 12, 551–562. [Google Scholar] [CrossRef]
- Taddei, S.; Contena, B.; Caria, M.; Venturini, E.; Venditti, F. Evaluation of children with Attention Deficit Hyperactivity Disorder and Specific Learning Disability on the WISC and cognitive assessment system (CAS). Procedia Soc. Behav. Sci. 2011, 29, 574–582. [Google Scholar] [CrossRef] [Green Version]
- Zimmermann, P.; Gondan, M.; Fimm, B. Testbatterie zur Aufmerksamkeitsprüfung für Kinder (KITAP); Psytest: Herzogenrath, Germany, 2002. [Google Scholar]
- Zimmermann, P.; Fimm, B. Testbatterie zur Aufmerksamkeitsprüfung (TAP). Version 2.2; Psytest: Herzogenrath, Germany, 2009. [Google Scholar]
- Döpfner, M.; Plück, J.; Kinnen, C. CBCL/6-18R, TRF/6-18R, YSR/11-18R. Deutsche Schulalter-Formen der Child Behavior Checklist von Thomas M. Achenbach; Hogrefe: Göttingen, Germany, 2014. [Google Scholar]
- Döpfner, M.; Görtz-Dorten, A. Diagnostik-System für Psychische Störungen nach ICD-10 und DSM-5 für Kinder und Jugendliche (DISYPS-III); Hogrefe: Göttingen, Germany, 2017. [Google Scholar]
- Wechsler, D. Wechsler Intelligence Scale for Children—Fifth Edition (WISC-V) (dt. Bearbeitung durch F. Petermann); Pearson Assessment: Frankfurt am Main, Germany, 2017. [Google Scholar]
- Lenhard, W.; Lenhard, A.; Schneider, W. Ein Leseverständnistest für Erst-Bis Siebtklässler—Version II (ELFE II); Hogrefe: Göttingen, Germany, 2017. [Google Scholar]
- Schneider, W.; Schlagmüller, M.; Ennemoser, M. Lesegeschwindigkeits-Und-Verständnistest für die Klassen 6-12 (LGVT 6-12); Hogrefe: Göttingen, Germany, 2007. [Google Scholar]
- May, P. Hamburger Schreib-Probe (HSP) 1-10; Verlag für pädagogische Medien: Hamburg, Germany, 2012. [Google Scholar]
- Müller, R. Diagnostischer Rechtschreibtest für 1. Klassen (DRT 1); Beltz Test GmbH: Göttingen, Germany, 2003. [Google Scholar]
- Birkel, P. Weingartener Grundwortschatz Rechtschreib-Test für Zweite und Dritte Klassen (WRT 2+); Hogrefe: Göttingen, Germany, 2007. [Google Scholar]
- Birkel, P. Weingartener Grundwortschatz Rechtschreib-Test für Dritte und Vierte Klassen (WRT 3+); Hogrefe: Göttingen, Germany, 2007. [Google Scholar]
- Birkel, P. Weingartener Grundwortschatz Rechtschreib-Test für Vierte und Fünfte Klassen (WRT 4+); Hogrefe: Göttingen, Germany, 2007. [Google Scholar]
- Haffner, J.; Baro, K.; Parzer, P.; Resch, F. Heidelberger Rechentest (HRT 1-4); Hogrefe: Göttingen, Germany, 2005. [Google Scholar]
- Krajewski, K.; Liehm, S.; Schneider, W. Deutscher Mathematiktest für Zweite Klassen (DEMAT 2+); Beltz Test GmbH: Göttingen, Germany, 2004. [Google Scholar]
- Roick, T.; Gölitz, D.; Hasselhorn, M. Deutscher Mathematiktest für Dritte Klassen (DEMAT 3+); Hogrefe: Göttingen, Germany, 2004. [Google Scholar]
- Gölitz, D.; Roick, T.; Hasselhorn, M. Deutscher Mathematiktest für Vierte Klassen (DEMAT 4); Hogrefe: Göttingen, Germany, 2016. [Google Scholar]
- Götz, L.; Lingel, K.; Schneider, W. Deutscher Mathematiktest für Fünfte Klassen (DEMAT 5+); Hogrefe: Göttingen, Germany, 2013. [Google Scholar]
- Götz, L.; Lingel, K.; Schneider, W. Deutscher Mathematiktest für Sechste Klassen (DEMAT 6+); Hogrefe: Göttingen, Germany, 2013. [Google Scholar]
- IBM Corp. IBM SPSS Statistics for Windows, Version 25.0; IBM Corp: Armonk, NY, USA, 2017. [Google Scholar]
- Cohen, J. Statistical Power Analysis for the Behavioral Sciences, 2nd ed.; Erlbaum: Hillsdale, NJ, USA, 1988. [Google Scholar]
- Poletti, M.; Carretta, E.; Bonvicini, L.; Giorgi-Rossi, P. Cognitive Clusters in Specific Learning Disorder. J. Learn. Disabil. 2018, 51, 32–42. [Google Scholar] [CrossRef]
- Schuchardt, K.; Brandenburg, J.; Fischbach, A.; Mähler, C. Kognitive Profile bei lese-rechtschreibschwachen Kindern mit und ohne Aufmerksamkeitsprobleme. Lern. Lernstörungen 2017, 6, 169–181. [Google Scholar] [CrossRef]
- Mähler, C.; Schuchardt, K. Working memory in children with specific learning disorders and/or attention deficits. Learn. Individ. Differ. 2016, 49, 341–347. [Google Scholar] [CrossRef]
- Purvis, K.L.; Tannock, R. Phonological processing, not inhibitory control, differentiates ADHD and reading disability. J. Am. Acad. Child Adolesc. Psychiatry 2000, 39, 485–494. [Google Scholar] [CrossRef]
- Seidman, L.J.; Biederman, J.; Monuteaux, M.C.; Doyle, A.E.; Faraone, S.V. Learning disabilities and executive dysfunction in boys with attention-deficit/hyperactivity disorder. Neuropsychology 2001, 15, 544–556. [Google Scholar] [CrossRef]
- Willcutt, E.G.; Pennington, B.F.; Boada, R.; Ogline, J.S.; Tunick, R.A.; Chhabildas, N.A.; Olson, R.K. A comparison of the cognitive deficits in reading disability and attention-deficit/hyperactivity disorder. J. Abnorm. Psychol. 2001, 110, 157–172. [Google Scholar] [CrossRef]
- Willcutt, E.G.; Pennington, B.F.; Olson, R.K.; Chhabildas, N.; Hulslander, J. Neuropsychological analyses of comorbidity between reading disability and attention deficit hyperactivity disorder: In search of the common deficit. Dev. Neuropsychol. 2005, 27, 35–78. [Google Scholar] [CrossRef] [PubMed]
- Proctor, B. Relationships between Cattell-Horn-Carroll (CHC) Cognitive Abilities and Math Achievement within a Sample of College Students with Learning Disabilities. J. Learn. Disabil. 2012, 45, 278–287. [Google Scholar] [CrossRef] [PubMed]
- Taub, G.E.; Floyd, R.G.; Keith, T.Z.; McGrew, K.S. Effects of General and Broad Cognitive Abilities on Mathematics Achievement. Sch. Psychol. Q. 2008, 23, 187–198. [Google Scholar] [CrossRef] [Green Version]


| ADHD + SLD Group (n = 62) | SLD Group (n = 35) | CONTROL (n = 62) | ADHD (n = 13) | Group Differences | |
|---|---|---|---|---|---|
| sex (n and % female) | 19 (30.6%) | 13 (37.1%) | 19 (30.6%) | 3 (23.1%) | 0.804 a |
| M age (SD) | 10.44 (2.44) | 10.21 (2.11) | 10.42 (2.39) | 10.53 (2.48) | 0.971 b |
| Type of school | 0.241 a | ||||
| Primary school | 38 (62.3%) | 22 (64.7%) | 37 (59.7%) | 7 (53.8%) | |
| Secondary school, graduation after 9th grade (German: Hauptschule) | 2 (3.3%) | 2 (5.9%) | 4 (6.5%) | − | |
| Grammar school, graduation after 12th or 13th grade, univerity entrance degree (German: Gymnasium) | 4 (6.6%) | 3 (8.8%) | 4 (6.6%) | 5 (38.5%) | |
| Comprehensive school, different kinds of degrees can be obtained after 9th or 12th/13th grade (German: Gesamtschule) | 14 (23%) | 6 (17.6%) | 15 (24.2%) | 1 (7.7%) | |
| Special school (German: Förderschule) | 3 (4.9%) | 1 (2.9%) | 2 (3.2%) | − | |
| Parental education | 0.451 a | ||||
| Lower education level | 10 (16.1%) | 3 (8.6%) | 8 (12.9%) | − | |
| Medium education level | 26 (41.9%) | 16 (45.7%) | 26 (41.9%) | 2 (15.4%) | |
| High education level | 10 (16.1%) | 7 (20%) | 11 (17.1%) | 4 (30.8%) | |
| Highest education level | 16 (25.8%) | 8 (22.9%) | 16 (25.8%) | 7 (53.8%) |
| Specific Reading Disorder (N) | Specific Spelling Disorder (N) | Specific Disorder of Arithmetical Skills (N) | Mixed Disorder of the Scholastic Skills (N) | |
|---|---|---|---|---|
| ADHD &SLD | 19 | 16 | 3 | 24 |
| SLD | 11 | 14 | 2 | 8 |
| WISC-V Index | ADHD + SLD n = 62 | SLD n = 35 | CONTROL n = 62 | MANOVA | Post Hoc (See also Appendix C) | ||||||
|---|---|---|---|---|---|---|---|---|---|---|---|
| M | SD | M | SD | M | SD | F(df1/df2) | p | η2 | |||
| VCI | 97.47 | 14.37 | 105.41 | 11.29 | 100.76 | 11.53 | 4.338 | (2/155) | 0.015 | 0.05 | ADHD + SLD < SLD |
| VSI | 99.18 | 13.63 | 102.32 | 13.92 | 101.00 | 14.44 | 0.602 | (2/155) | 0.549 | 0.01 | − |
| FRI | 97.90 | 13.98 | 103.03 | 13.08 | 101.74 | 13.34 | 2.016 | (2/155) | 0.137 | 0.03 | − |
| WMI | 93.48 | 13.28 | 101.65 | 11.55 | 102.27 | 14.16 | 7.845 | (2/155) | 0.001 | 0.09 | ADHD + SLD < CONTROL; ADHD + SLD < SLD |
| PSI | 90.48 | 12.30 | 97.76 | 10.85 | 102.19 | 13.83 | 13.464 | (2/155) | <0.001 | 0.15 | ADHD + SLD < CONTROL; ADHD + SLD < SLD |
| FSIQ | 93.87 | 12.98 | 102.59 | 12.57 | 101.63 | 12.30 | 7.805 | (2/155) | 0.001 | 0.09 | ADHD + SLD < CONTROL; ADHD + SLD < SLD |
| QRI | 95.35 | 13.25 | 101.56 | 11.66 | 99.84 | 13.56 | 3.053 | (2/155) | 0.050 | 0.04 | − |
| AWMI | 87.98 | 10.52 | 94.88 | 12.31 | 101.81 | 13.17 | 20.560 | (2/155) | <0.001 | 0.21 | ADHD + SLD < CONTROL; ADHD + SLD < SLD; SLD < CONTROL |
| NVI | 96.85 | 14.03 | 103.29 | 12.22 | 101.89 | 14.35 | 3.142 | (2/155) | 0.046 | 0.04 | ADHD + SLD < SLD |
| GAI | 97.32 | 14.07 | 104.79 | 12.28 | 101.52 | 12.11 | 3.925 | (2/155) | 0.022 | 0.05 | ADHD + SLD < SLD |
| CPI | 90.02 | 12.64 | 99.82 | 10.54 | 102.76 | 13.82 | 16.544 | (2/155) | <0.001 | 0.18 | ADHD + SLD < CONTROL; ADHD + SLD < SLD |
| WISC-V Index | ADHD + SLD with Problems in Arithmetic n = 27 | ADHD + SLD without Problems in Arithmetic n = 35 | ANOVA | |||||
|---|---|---|---|---|---|---|---|---|
| M | SD | M | SD | F(df1/df2) | p | η2 | ||
| VCI | 93.11 | 14.62 | 100.83 | 13.41 | 4.663 | (1/60) | 0.035 | 0.07 |
| VSI | 95.44 | 15.21 | 102.60 | 11.69 | 3.750 | (1/60) | 0.058 | 0.06 |
| FRI | 91.85 | 12.93 | 102.57 | 12.73 | 10.658 | (1/60) | 0.002 | 0.15 |
| WMI | 88.96 | 13.76 | 96.97 | 12.12 | 5.992 | (1/60) | 0.017 | 0.09 |
| PSI | 88.33 | 13.16 | 92.14 | 11.51 | 1.473 | (1/60) | 0.230 | 0.02 |
| FSIQ | 88.81 | 12.93 | 97.77 | 11.76 | 8.103 | (1/60) | 0.006 | 0.12 |
| QRI | 88.96 | 10.59 | 100.29 | 13.11 | 13.381 | (1/60) | 0.001 | 0.18 |
| AWMI | 84.04 | 10.77 | 91.03 | 09.37 | 7.448 | (1/60) | 0.008 | 0.11 |
| NVI | 91.04 | 14.75 | 101.34 | 11.79 | 9.351 | (1/60) | 0.003 | 0.14 |
| GAI | 91.96 | 14.60 | 101.46 | 12.31 | 7.707 | (1/60) | 0.007 | 0.11 |
| CPI | 86.15 | 12.93 | 93.00 | 11.73 | 4.758 | (1/60) | 0.033 | 0.07 |
Publisher’s Note: MDPI stays neutral with regard to jurisdictional claims in published maps and institutional affiliations. |
© 2021 by the authors. Licensee MDPI, Basel, Switzerland. This article is an open access article distributed under the terms and conditions of the Creative Commons Attribution (CC BY) license (https://creativecommons.org/licenses/by/4.0/).
Share and Cite
Becker, A.; Daseking, M.; Kerner auch Koerner, J. Cognitive Profiles in the WISC-V of Children with ADHD and Specific Learning Disorders. Sustainability 2021, 13, 9948. https://doi.org/10.3390/su13179948
Becker A, Daseking M, Kerner auch Koerner J. Cognitive Profiles in the WISC-V of Children with ADHD and Specific Learning Disorders. Sustainability. 2021; 13(17):9948. https://doi.org/10.3390/su13179948
Chicago/Turabian StyleBecker, Angelika, Monika Daseking, and Julia Kerner auch Koerner. 2021. "Cognitive Profiles in the WISC-V of Children with ADHD and Specific Learning Disorders" Sustainability 13, no. 17: 9948. https://doi.org/10.3390/su13179948