Article

Analysis of Smallholders’ Livelihood Vulnerability to Drought across Agroecology and Farm Typology in the Upper Awash Sub-Basin, Ethiopia

1
Center for Environment and Development Studies, Addis Ababa University, Addis Ababa P.O. Box 1176, Ethiopia
2
Department of Geography and Environmental Studies, Wolaita Sodo University, Sodo P.O. Box 138, Ethiopia
3
International Water Management Institute (IWMI), Addis Ababa P.O. Box 5689, Ethiopia
4
Hailemariam and Roman Foundation, Addis Ababa P.O. Box 27858 Code 1000, Ethiopia
*
Author to whom correspondence should be addressed.
Sustainability 2021, 13(17), 9764; https://doi.org/10.3390/su13179764
Submission received: 6 July 2021 / Revised: 16 August 2021 / Accepted: 18 August 2021 / Published: 31 August 2021

Abstract

:
Assessing the magnitude of smallholder farmers’ livelihood vulnerability to drought is an initial step in identifying the causal factors and proposing interventions that mitigate the impacts of drought. This study aimed to assess smallholders’ livelihood vulnerability to the drought in the upper Awash sub-basin, Ethiopia. Household (HH) and climate data were used for indicators related to sensitivity, exposure, and adaptive capacity that define vulnerability to drought. The vulnerability of farmers’ livelihood to drought was compared among the studies agroecological zone (AEZ) and farm typologies. The result illustrated a diverse magnitude of vulnerability index (VI) ranging from −1.956 to −4.253 for AEZ. The highest magnitude of VI was estimated for livelihood in the lowland AEZ, while the lowest magnitude of VI was estimated in midland AEZ. This could be accounted for by the fact that lowland farmers shown the highest exposure (0.432) and sensitivity (0.420) and the lowest adaptive capacity (0.288). A closer look at farmers’ livelihood typology, in each of the AEZ, showed substantial diversity of farmers’ livelihood vulnerability to drought, implying potential aggregations at AEZ. Accordingly, the vulnerability index for livestock and on-farm-income-based livelihood and marginal and off-farm-income-based livelihood typologies were higher than the intensive-irrigation-farming-based smallholders’ livelihood typology. Based on the result, we concluded that procedures for smallholders’ livelihood resilience-building efforts should better target AEZ to prioritize the focus region and farmers’ livelihood typology to tailor technologies to farms. Although the result emphasizes the importance of irrigation-based livelihood strategy, the overall enhancement of farmers adaptive capacity needs to focus on action areas such as reducing the sensitivity and exposure of the households, improving farmers usage of technologies, diversify farmers’ livelihood options, and, hence, long-term wealth accumulation to strengthen farmers’ adaptive capacity toward drought impacts.

1. Introduction

Climate change is an occurring phenomenon that is constantly affecting livelihoods, especially in developing countries where the livelihood of smallholder farmers depends on subsistence agriculture [1,2,3]. Smallholder farmers’ livelihood vulnerability to climate change (particularly drought) stems both from their geographic location in the tropical regions and the difference in socioeconomic and policy trends that limit their adaptive capacity to the changing climate [4]. Farmers who depend solely on the naturally available rainfall for crop and livestock production are among the most vulnerable to the impacts of climate change [5]. A household-level drought vulnerability analysis will help to understand livelihood challenges, as well as alternative mitigation and adaptation measures [6].
Mixed crop–livestock production systems, agropastoralism, and pastoralism are the main livelihood activities in many developing countries [7,8]. In this regard, Ghosh and Ghosal [9] and Jellason et al. [10] indicated that farmers relying on these livelihood activities are severely impacted by climate change. One of the factors affecting livelihoods is the increasing occurrence of frequent and severe drought [11,12]. Drought has become a frequent occurrence in Africa, especially in countries in the Horn of Africa (e.g., Ethiopia [13,14,15]).
In Ethiopia, drought has been understood as the most severe long-term climatic shock and cause of concern for farm households [16,17,18,19]. Here, climate variability and extreme weather are two of the most serious threats to agricultural productivity and smallholder livelihoods [20,21]. Sam et al. [22] indicated that drought, unlike other natural disasters, strengthens its grip over time, gradually destroying the affected area. Drought’s spatial distribution and its persistence for a long period are therefore significant threats to rural livelihoods, putting many smallholders in a poverty trap [23,24].
According to Abeje et al. [25], more than 10 major drought episodes have occurred in Ethiopia since the 1970s. Awash basin, where this study focuses, experienced more than nine drought events on average in the last three decades [26]. More specifically, the upper parts of the Awash Basin are known as smallholders with mixed crop–livestock, agropastoralism, and pastoralism livelihood systems, which are highly vulnerable to climate-related disasters such as drought [27]. This is mainly because of environmental sensitivity and exposure to climate shocks. The area is highly exposed due to aridity and natural resource degradation [28]. The historical period of study of land use transformation in the upper Awash sub-basin indicates a significant expansion of croplands and urban areas [29,30]. It is a highly populated part of the basin compared to the lower Awash. Two major cities in Ethiopia—Addis Ababa and Adama—are in the upper Awash sub-basin [31]. These stressors, in addition to other natural factors, made smallholders in this part of the country extremely vulnerable to drought.
Though livelihood is a highly complex and comprehensive concept [32], it is a means of living for individuals and households [33]. The most cited understanding of livelihood includes the skills, resources (including both social and material resources), and activities that generate the means of household survival [34].
The subsistence-mixed crop–livestock production, agropastoralism, and pastoralism ways of living that rely heavily on ecosystem services are more vulnerable to drought-related climatic shocks. In sustainable development, vulnerability assessment is important because it provides an accurate explanation of how vulnerable a system is to climate change impacts [35]. Vulnerability is a state of sensitivity to disaster as a result of exposure to stresses associated with environmental and societal change, as well as a lack of adaptive capacity. With regard to the Intergovernmental Panel on Climate Change (IPCC) [36], vulnerability to the changing climate is the extent to which the system is exposed to and incapable of dealing with the prominent impact of climate change, including climate instability and extremes. Within the framework of this study, vulnerability is conceptualized as the occurrence, magnitude, rate, and variability of climate change shock (particularly drought) to which the system is exposed, as well as the system’s sensitivity and adaptive capacity.
The IPCC definition was applied to identify the vulnerability of farming communities to drought at the household level. Accordingly, the vulnerability of households was derived as a function of the three elements—namely, adaptive capacity, sensitivity, and exposure [37]. Exposure can be referred to as climate change shock and describes the pressure drought shocks put on rural households [2,38], and this can be explained by the intensity, frequency, and duration of drought. Sensitivity is understood as the extent of environmental factors’ impact on households [39,40] and expressed by various sub-components, such as the prevalence of crop failure, environment-related diseases, and different crises. Adaptive capacity explains rural households’ ability to adapt to drought stress [41,42] and can be characterized by capital, livelihood diversification, wealth, and access to infrastructure.
Since the variation in vulnerability to drought cannot be detailed at the AEZ level, we used farm typology. Farm typology is a method for categorizing farmers into classes with similar characteristics [43]. Smallholder farmers’ responses to the climate-induced livelihood vulnerabilities are not uniform but rather diverse, as response strategies are embedded in the heterogeneous sociodemographic, economic, livelihood type, and adaptation mechanisms. To understand these variations, we conducted a cluster analysis to group farmers into farm typologies. Farm typologies are a valuable tool for unpacking and recognizing the large variety of smallholder farms so that adaptation strategies can be better targeted [44,45]. Musafiri et al. [46] recommended using farm typology to investigate the actual characteristics of individual smallholder farmers in determining the vulnerability to climate change impacts.
The timely information on the occurrence of drought and the analysis of the level of farmers’ vulnerability is an element of the drought response mechanism. Nasir et al. [47] indicated that drought is often returned once it ends and due to this nature, the government will again be misinformed about the time of the next severe drought episode occurrence. Hence, investigating the vulnerability of farmers’ livelihood to this nature of recurrent drought helps to devise the response mechanisms.
In this regard, various studies have been conducted in the upper Awash sub-basin and elsewhere; (i) some have focused on livelihood vulnerability to the entire climate change impacts [25,48,49,50,51,52]. These studies only used household survey data to understand the level of livelihood vulnerability [8,53,54,55]; (ii) some vulnerability studies (e.g., [56,57]) considered only basin-wide livelihood vulnerability analyses that overlooked the local and farmers specific contexts; (iii) some studies completed livelihood vulnerability analysis using few numbers of indicator variables (e.g., [58,59,60]). Though these studies have made significant contributions to our current level of knowledge and understanding of livelihood vulnerability to climate change, there are likely gaps that must be filled. Here, we argue that these gaps can be filled by analyzing smallholders’ livelihood vulnerability to climate-induced shocks, especially drought, by incorporating real-time climate data into the vulnerability assessment, relying on local contexts in the analysis to understand the problem at a household level (by clustering farms based on their livelihood and activity profile to overcome the vulnerability), and including as many indicators as possible to make the vulnerability analysis multidimensional and robust.
The core aim of the current study is to analyze the smallholders’ livelihood vulnerability to drought using AEZs and farm typologies as units of analysis. The study hypothesized that the vulnerability of farmers’ livelihood to the drought varies in agroecology and farm typology. However, the level of vulnerability at the agroecology scale is more general and necessitates inspecting it at the farm typology scale. The drought management mechanism should consider these variations, and entry points have to depend on the actual level of farmers’ vulnerability to drought.
To analyze smallholders’ livelihood vulnerability to drought at a household level in upper Awash, this study is designed in a way that can address the above-mentioned research gaps. According to Singh et al. [21], model-based vulnerability analysis can provide a long-term view of the physical aspects of macro-scale climate scenarios but fail to accurately interpret the human dimensions of microscale climate uncertainty and hazards [61]. Hence, this micro-scale (household-level) study of smallholder farmers’ vulnerability to drought considered the human and natural dimensions of indicators through the integration of climate and household (HH) survey data to characterize a household’s vulnerability to drought. The procedures developed and information generated would help experts and policymakers in their efforts of enhancing farmers’ resilience to drought impacts by identifying the highly vulnerable livelihood capabilities of farmers.

2. Materials and Methods

2.1. The Study Area—Location and Characterization
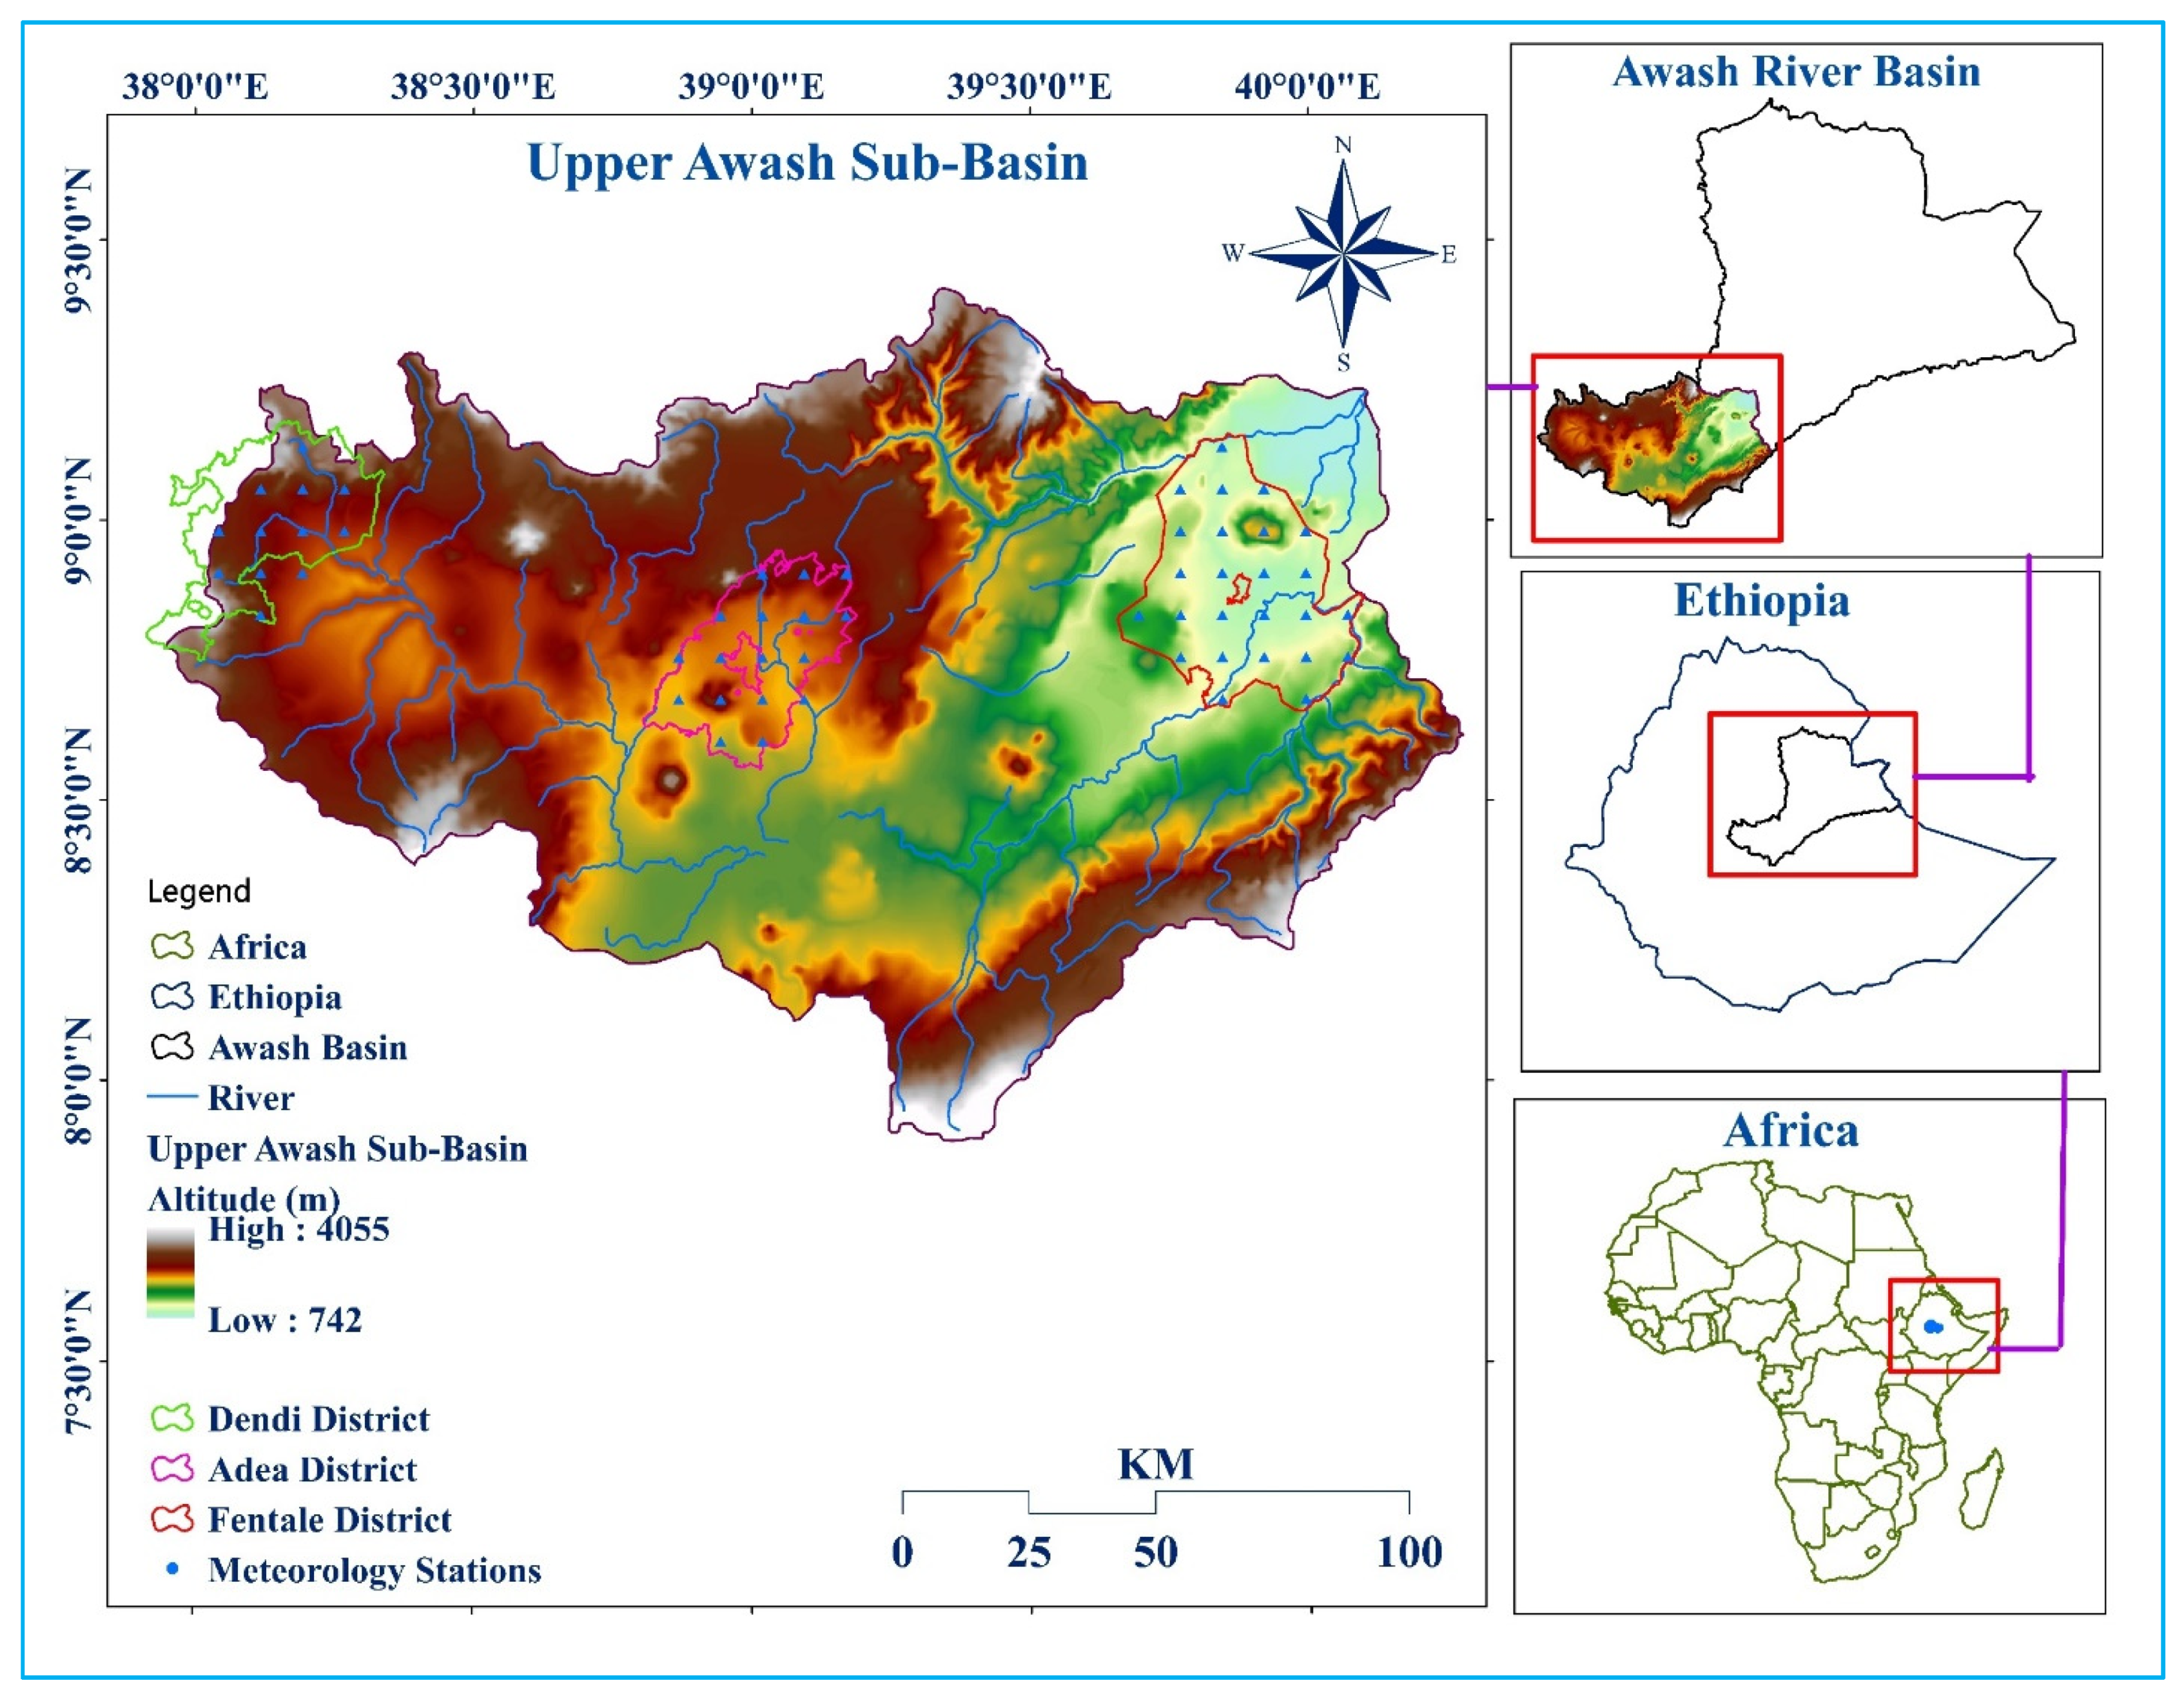
2.1.1. Location

Awash is one of the 12 River Basins of Ethiopia. The basin is divided into three parts—lower, middle, and upper, based on the characteristics of physical, climatological, agricultural, socioeconomic, and water resources [62]. This research has been carried out in the upper part of the basin (Figure 1). Addis Ababa, the capital of Ethiopia, is situated at the northern end of the basin. The sub-basin is limited to the 37°54′35″ E–40°16′53″ E longitude and 7°53′15″ N–9°25′15″ N latitude boundaries, and the area is 24,545 square kilometers.
The altitude varies from 4055 to 742 m above sea level (masl (Figure 1)), which suggests a greater altitude range within the sub-basin [63], influencing climatic variables and associated biophysical settings. The climatic condition of the upper Awash is classified as humid to afro-alpines, with a mean annual temperature varying from 15 to 20 degrees Celsius. Based on the elevation difference, the mean annual precipitation in the sub-basins ranges from 800 to 1400 mm [64]. The precipitation during the year occurs in different seasons. The major rainy season, which in Ethiopia is called Kiremt, typically occurs between June and September.

2.1.2. Livelihood Characterization

Farmers’ livelihoods in the highland and midland are dependent on crop–livestock mixed farming systems that seek naturally available rainfall for farming. As Tajebe et al. [65] stated major crops produced in highlands (e.g., Dendi District) include teff, wheat, barley, beans, peas, maize, potato, and enset. Dominant crops in the Adea District (midland) are teff, wheat, maize, and other cereals (Table 1). Livestock is integrated into crop production in midland and highland areas and serves as wealth accumulation and enables crop production. The two systems’ components, crop, and livestock complement each other through livestock supporting crop production and crop residues used to feed animals [66,67]. Lowlanders are known mainly for agropastoralism and pastoralism way of life in which limited crop production and livestock and their products are the main assets of the households. Camels, goats, and cattle are the dominant livestock assets in Fentale. Off-farm pursuits and livestock ventures may help farm households supplement their income depending on their farm structure and objectives. The contribution of these income-generating activities to farm income varies by season and farmer [44]. Whether in the case of a mixed system or agropastoral/pastoralist livelihood, the role of naturally available moisture has a great role. Moreover, the potential evapotranspiration rates are high as the area is known for a longer sunshine hour [68]. Those are the reasons for the severe to extreme drought episodes to occur in this part of the basin, particularly in recent years [26].
Although recurrent drought is a common phenomenon, its impact on the livelihood of smallholder farming households could not be the same. There are variations based on the farmers’ exposure to drought, the sensitivity of the environment they live in, and the adaptive capacity of the farmers to the shock of drought [60]. The characteristics of individual farmers to withstand the drought stress and absorb the shock are the other distinguishing factors. These could lead farmers to have a different level of vulnerability to the impact of the drought.
Even though most of the farmers in the study area practice mixed farming and pastoralism, they do not share the same characteristics. Some farmers have agricultural, agropastoral and pastoral livelihoods. Even within similar livelihood systems, they have different farm systems [69]. For example, some of them use irrigation to produce crops in the dry season. Others are predominantly herders who own cattle. Upper Awash is part of the basin with diverse livelihoods as a result of these characteristics. The most important activity for households in agricultural and agropastoral areas is rainfed crop farming. Rainfall is inadequate in these areas, including an uneven distribution and a short growing season. The pastoral group’s livelihood is based on livestock raising, which is heavily influenced by the harsh environment and climatic shocks in the area. Pastoralists rely on grazing and water, all of which are heavily reliant on naturally available rainfall.

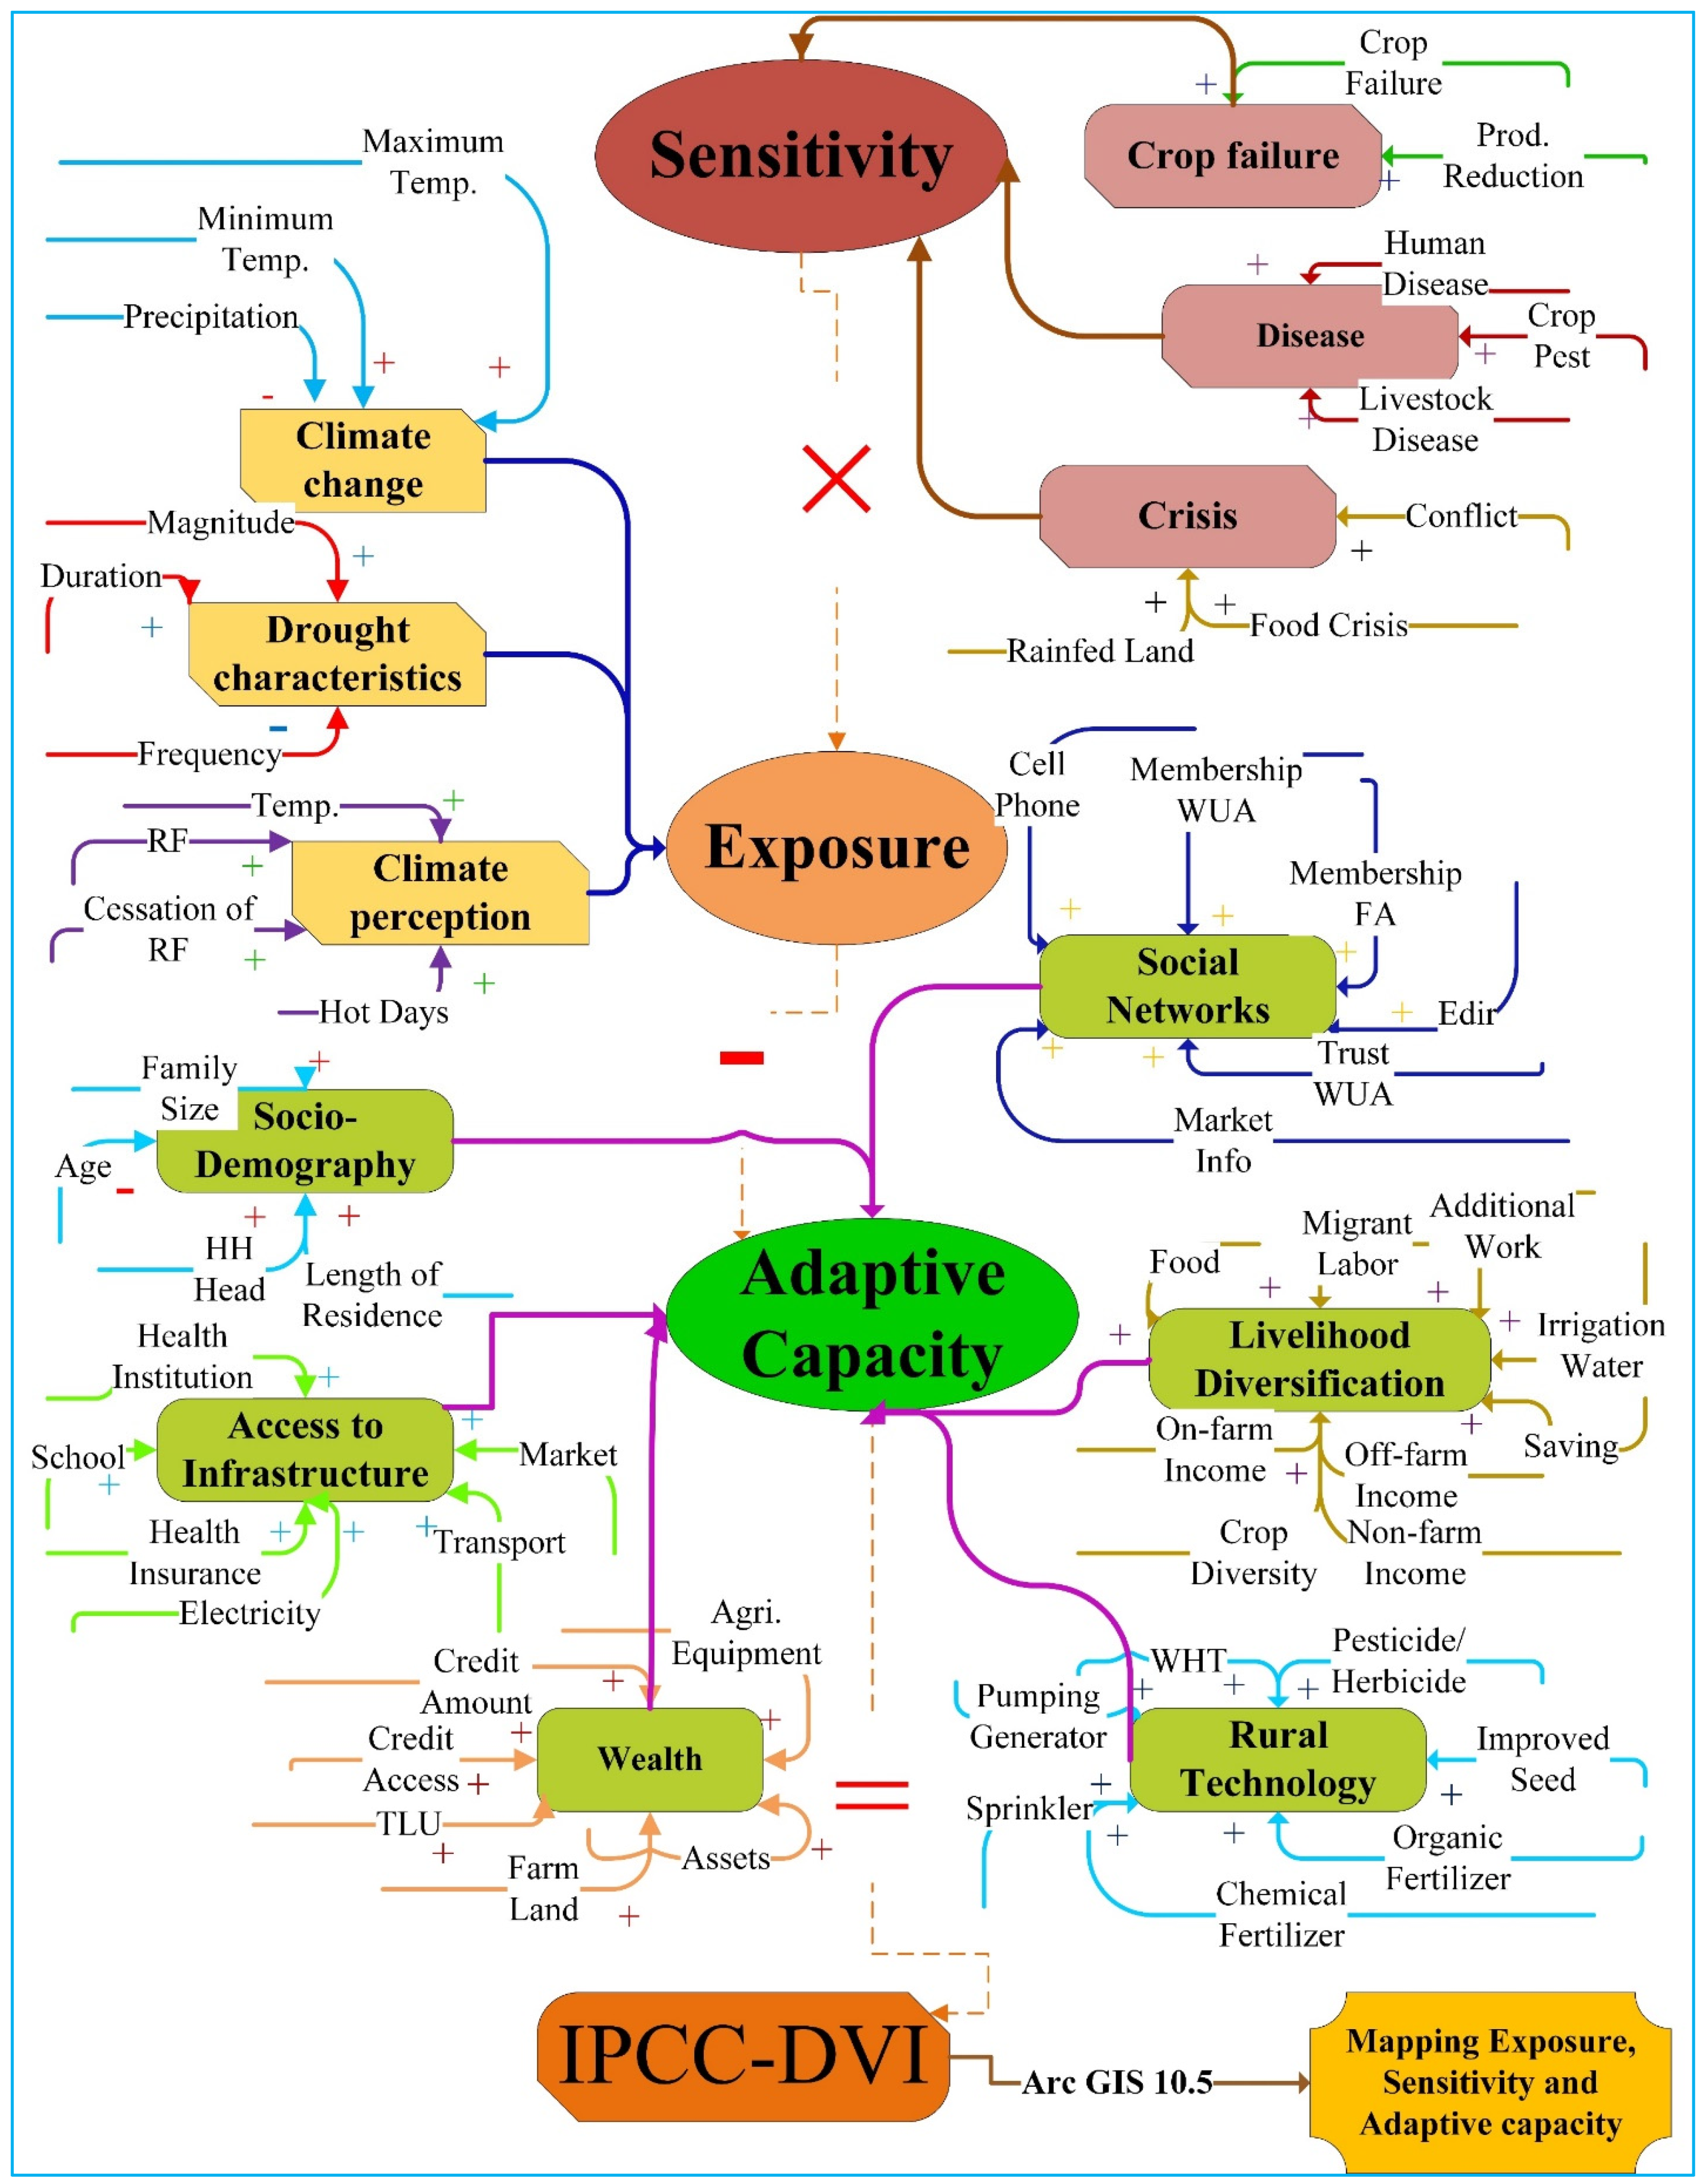
2.2. Indicators and Their Relationship with the Sub- and Major Components of the IPCC–Drought Vulnerability Index (IPCC–DVI)

Figure 2 depicts the workflow of the indicators for each sub-component of the IPCC–DVI and their interaction. In total, 10 indicators were recategorized into 3 sub-components, 8 indicators regrouped into 3 sub-components, 38 indicators reclassified into 6 sub-indicators made the exposure, sensitivity, and adaptive capacity major components of the IPCC–DVI. As illustrated in Figure 2 and Table 2, if the indicator contributes to the increment of the sub-component, the relation is represented as positive, and plus marks were put in the workflow line. If the indicator influenced the sub-component negatively, then the relationship is negative, and hence, minus sign was used to show this correlation [66].

2.3. Sampling and Data Sources

The HH survey data were collected from sample households in three districts covering the three AEZ in the upper Awash sub-basin. A three-stage sampling technique was used to select target respondents in the study area. In the study area, the moist highlands and midlands are AEZs that are vulnerable to annual and seasonal droughts [26]. This entails the inclusion of all the three AEZs in the vulnerability assessment using the climate and HH survey data. Firstly, Dendi for a highland, Adea, for midland, and Fenatle for a lowland were selected purposely to represent the three dominant AEZ, and secondly, the sample size was determined using Equation (1) as follows [70]:
n = 2 ( Z α + Z 1 β ) 2 σ 2 Δ 2
where
n = Required   sample   size   for   the   HH   survey ;
Z α =   Constant   ( 1.96 ) at 5% margin of error;
Z 1 β = Constant   ( 1.6449 ) at 5% margin of error;
σ = the standard deviation (estimated);
Δ =   estimated   effect   size .
Accordingly, the equation yields a sample size of 360 HHs. Adding a 10% (36 in number) non-response rate makes the total sample size 396. Thirdly, respondent household heads were randomly selected using a lottery method. Experienced survey enumerators who could speak the local language and with relevant backgrounds were recruited and trained to fill the survey questionnaire. The questionnaire was tested before implementation, and ambiguous questions were corrected. The HH survey was carried out from November 2018 to February 2019. Table 1 presents the districts’ characteristics and the distribution of sample respondents.
Data and sources: This study is based on two datasets—(1) the meteorological monthly total precipitation (mm), as well as monthly minimum and maximum temperature (°C) accessed from the National Meteorology Agency of Ethiopia, and (2) household survey data collected from sample smallholders in the three sample districts illustrated earlier. The meteorological data (precipitation and temperature) are 4 × 4 km gridded data and were used to characterize rainfall and temperature and calculate the exposure of smallholders to drought (intensity, frequency, and length) shock. This was integrated into the household survey data as a proxy to characterize households within the agroecological zone. The HH survey data were used to characterize smallholders in their adaptive capacity, sensitivity, and exposure that are elements in the computation of the livelihood vulnerability of smallholders to drought. Key informant interviews (KII) were conducted to triangulate information from the HH survey.
Thus, in this study, the combination of meteorological data and household survey data was used. We used the meteorological data to characterize the drought exposure profile of households in their respective AEZs. Similarly, we used the data from the household survey to characterize the exposure, sensitivity, and adaptive capacity of the households based on indicators. There were, however, some limitations associated with this approach. The data used for the climate analysis and drought magnitude, frequency, and intensity, for example, were in time series and did not represent the latest details, as the data from the questionnaire. There was a temporal variation between the two datasets (e.g., absence in the latest years of the meteorological data), and thus, the meteorological data were used as proxies to the data from the household survey.

2.4. Approach to the Measurement of Vulnerability to Drought

To derive indicators, the three vulnerability components (exposure, sensitivity, and adaptive capacity) need to be understood and distinguished. The indicators selected were designated to represent farmers’ adaptive capacity, sensitivity, and exposure to drought in the sub-basin. Each of the indicators used in the vulnerability assessment was normalized before use (see Table 2).

2.4.1. Normalization of the Indicators

For multivariate statistical analysis, normalization is important since some variables have a wide and some others have a small variance range. The difference in unit of measurement for certain socioeconomic factors must also be normalized. The technique of normalization that requires the transformation of the dataset to a particular range (0–1) is therefore important [79]. We followed the suggestion made by Quackenbush [80] that recommended the normalization of data using transformation methods to create a more robust dataset. The dataset was normalized to avoid the effect of one variable on other variables. Normalization of the indicators was performed using the formula presented as Equations (2) and (3) below [81,82].
For the indicators having a positive relationship with the major component, this is
X d = X i X i m i n X i m a x X i m i n
For the indicators having a negative relationship with the major component, this is
X d = X i m a x X i X i m a x X i m i n
where, X i   is the observed value (mean) of the original subcomponent; X i m i n and X i m a x are the lowest and the highest value in the same collection, respectively, and X d is a standardized value of X i . For rendering variables equivalent to each other, this normalization allows for data with values varying from 0 to 1.

2.4.2. Principal Component Analysis (PCA)

The principal component analysis was introduced by Wold et al. [83] and in many ways, it forms the foundation for data involving multivariate analysis. To turn a series of observations that might be correlated variables into linearly uncorrelated variables known as principal components, PCA is a statistical method that applies an orthogonal transformation [79]. This transformation is performed in such a way that the first main component has the greatest possible variance, and after the restriction that it is orthogonal to the previous components, each of the next main components has the greatest variance possible. Finally, an uncorrelated orthogonal basis set is the resulting vectors generated by PCA [84].
PCA helps build uncorrelated components where the initial variables are a linear weighted combination of each component. The two-step PCA was performed based on Equation (4) [39] as follows:
P C 1 = a 11 X 1 + a 12 X 2 + a 1 n X n · · · · · · · P C m = a m 1 X 1 + a m 2 X 2 + + a m n X n }
A selection of variables that describe the greatest difference in the initial dataset is the first component; thus, this offers optimal values to summarize all input variables. The results of the first PCA components were maintained as weight in the first step and multiplied by their respective normalized values. Hence,
M j = i = 1 N a m X i
where, a m is the weight and X i is the normalized value. The second step, X M j was analyzed using PCA to determine the contribution of minor components to the major component. Again, the weights from the first principal component were preserved and Equation (5) applied as follows:
M C j = i = 1 N a m X i n
where M C j   is the jth major component (adaptive capacity, exposure, and sensitivity). These values were then consolidated and used to measure the drought vulnerability scores using Equation (7).
D V I = s * ( e a )
where D V I is the drought vulnerability index, s and e are the sensitivity and exposure to drought, respectively, and a is adaptive capacity at the household level.
The unit of analysis for the current study was agroecological zones and farm typologies to understand the differences within agroecological zones. Therefore, the level of the drought vulnerability of households was compared and presented in their respective agroecology as highland, midland, and lowland, as well as among livestock and on-farm-income-based, marginal and off-farm-income-based, and intensive-irrigation-farming-based farm livelihood typologies [44]. Even in the same agroecology, there could be variations depending on the characteristics of the households. Hence, we applied cluster analysis to categorize smallholders into farm livelihood typologies based on similar livelihood activity characteristics.

2.4.3. Farm Typology with Cluster Analysis

In total, 19 continuous variables that characterize smallholders were used to classify farmers into typologies using PCA. Variables generated an Eigen’s value of ≥1 (6 in number) by the PCA were selected and used in the cluster analysis to classify farmers (i.e., size of rainfed land, the monetary value of productive assets, annual off-farm and non-farm income, variety of crops produced, and amount of chemical fertilizer used). Then, using Ward’s method and the Euclidean distance matrix, we used hierarchical clustering on principal components to perform hierarchical, agglomerative clustering. As input, the minimum and the maximum number of necessary clusters were given. Ward method was applied to calculate the cluster number retained, in addition to the subjective inspection of the dendrogram, which was accompanied by statistics of inertia gain. Ward’s method is the sole among the agglomerative clustering approaches that are based on a sum-of-squares criterion, producing groups that minimize within-group differences at each agroecological zone [85]. Following the identification of farmer types, their characteristics were described and compared for each farmer type to better understand the differences in the major components of vulnerability.
Finally, the values of drought sensitivity, exposure, and adaptive capacity were used as input to map and spatially demonstrate the sensitivity, exposure, and level of adaptive capacity of the households in the sub-basin using the Aeronautical Reconnaissance Coverage Map (ArcMap) extension of the Arc Geographic Information System (ArcGIS) 10.5®. This farm-level VI was also superimposed on the farm typologies to understand farm typology level of vulnerability for overall systems and in each of the study AEZ. Hoque et al. [86] suggested that a spatial mapping system for drought vulnerability that incorporates all drought categories using an acceptable weighting scheme should be developed to generate comprehensive vulnerability information to formulate drought mitigation and adaptation strategies.

3. Results and Discussions

3.1. Farm Typologies

Based on the methods presented earlier, this study identified three distinct farm typologies and named them depending on their major asset and livelihood characteristics (Tables 4, 6 and 8). The vast majority of farms (68 percent) are in the livestock and on-farm-income-based category. Smallholders in this typology receive most of their income from on-farm activities, with minimal off-farm and non-farm activities, and they have the highest livestock holdings. The second farm typology, which accounts for 23% of all smallholders, is the marginal and off-farm-income-based category. The income for those in this group is dependent on non-farm activities, and farm practices are uncommon. The smallest portion of the farm typology (only 9%) is the third farm typology, which is named the intensive-irrigation-farming-based group. Irrigators in this typology have larger irrigation land holdings, use a higher rate of input of chemical fertilizer, and have the highest overall profits.

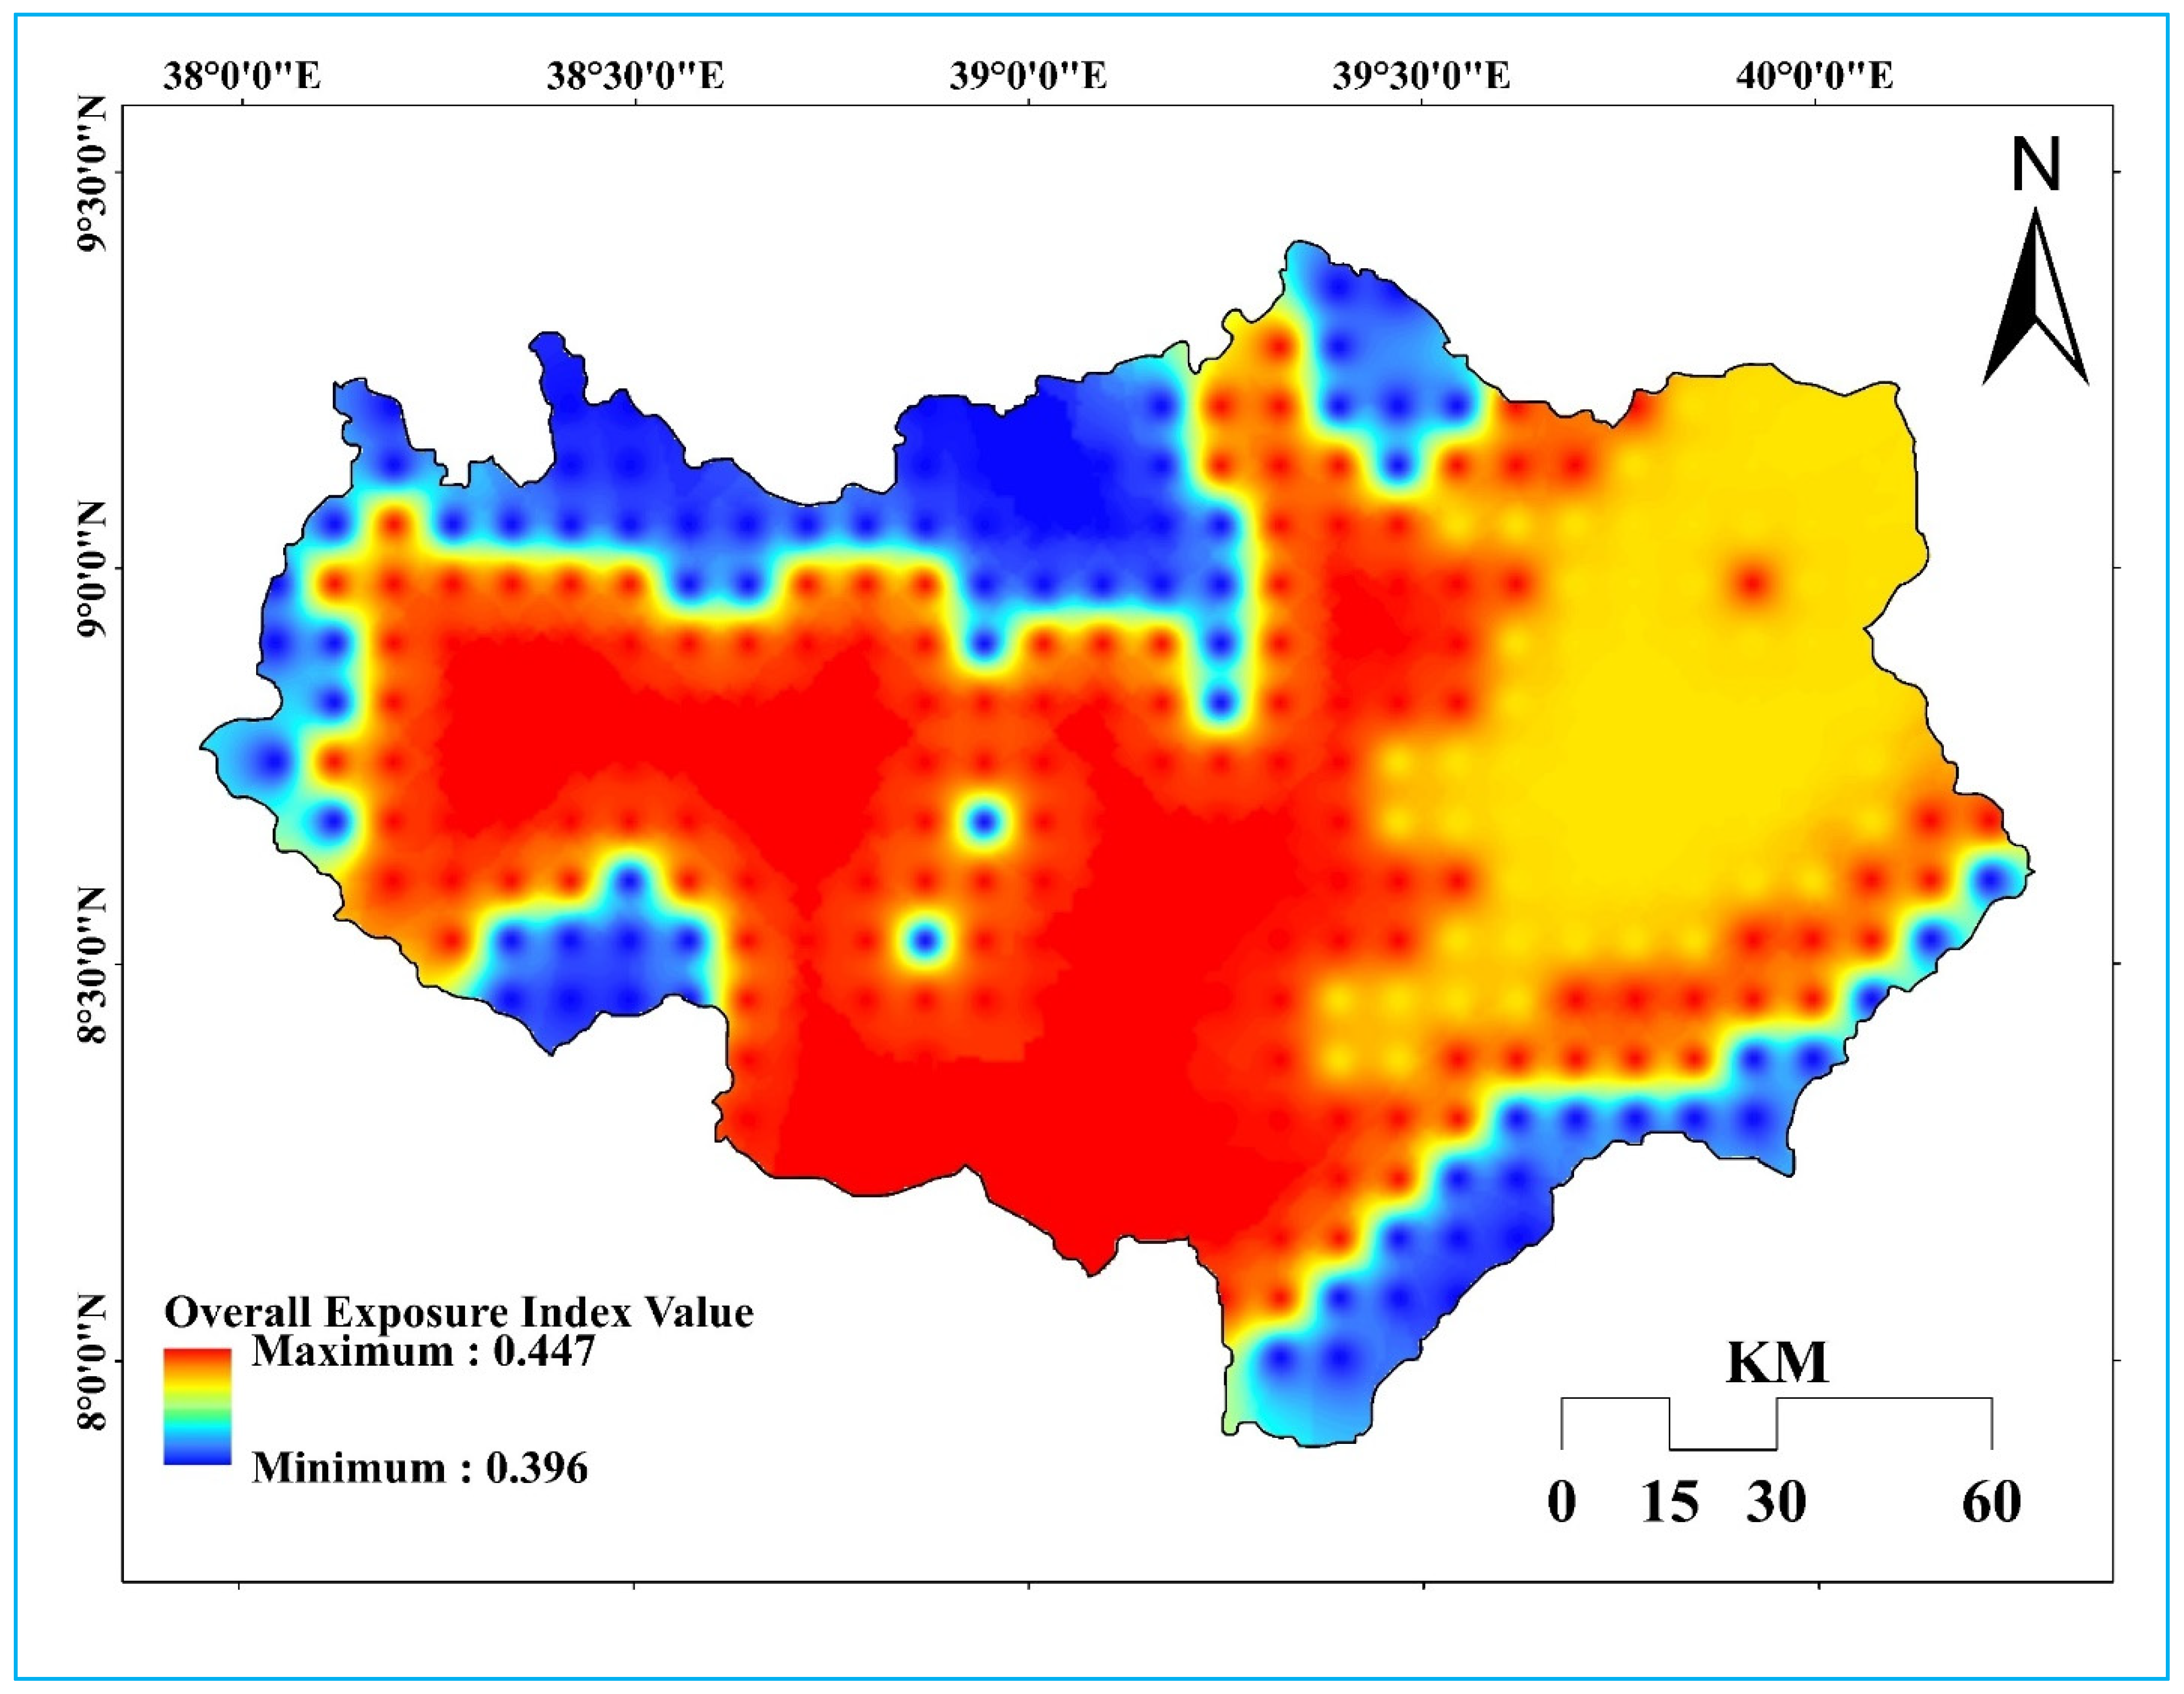
3.2. Exposure: Climate Change, Perception, and Drought Characteristics

The exposure profile of the smallholders in this study consists of three sub-components, including climate change and perception, as well as drought characteristics, which, in turn, merged the 10 indicators presented in Table 3. When the selected variable’s index value increases, the magnitude of exposure of a region to drought vulnerability increases [2]. In terms of the change and variability of the climate, it was the midland that showed the largest exposure with a 0.439 index value, followed by lowland and highland AEZs. This shows that temperature is increasing, and precipitation is decreasing in midlands, compared to the remaining AEZs. This contradicts a generally held idea that the climate in the arid lowland areas is rapidly changing. However, recent year trends in climate change show that temperature and precipitation have increasing and decreasing trends in midlands, respectively [87]. Hence, the focus of the adaptation and mitigation to climate change impacts, particularly in relation to drought, has to target areas where the actual change is observed [88].
The other component of exposure is the drought risk that aggregates drought magnitude, duration, and frequency. The score of drought risk was the highest (0.61) in the lowland (Figure 3 and Table 3), and the overall influence of the risk is the highest in describing the exposure profile of the farm households in the upper Awash sub-basin. The above assertion is supported by qualitative evidence, as presented by an interviewed farmer in the Fentale District of lowland agroecology. According to this respondent “getting two days of rainfall in a year is a surprise for us in this area since we lived in drought for decades and most of our ages pass in searching for water and fodder for our cattle. Our main demand in this arid land as pastoralists is water for ourselves and our cattle”. This explains the drought adaptation mechanism from the perspective of a household. To manage their exposure, pastoral and agropastoral communities should be reinforced by tackling certain pressing issues that they are currently facing, such as the changing nature of drought threats and the underlying vulnerability of the socioecological setting in which they live [89]. This entails livestock production, as well as land management and biodiversity conservation, and coping with a wide range of natural, social, and economic consequences.
More than 44 percent of households in the midland AEZ did not perceive that the climate was changing (Table 3). As a result, they are the worst in the perception of climate change and therefore the most vulnerable to the drought shock. As shown in Table 4, based on the farm typology, differences are noticed between the three typologies. For example, only 16.4% and 18.3% of the livestock and on-farm-income-based group did not perceive that the number of hot days in a year and temperature has increased. Early cessation of rainfall and rainfall decrement was not perceived by intensive-irrigation-farming-based farm typology, with percentage values of 57.9 and 42.9, respectively. Those in the Livestock and on-farm-income-based group most perceived the changing climate and hence were less exposed to drought. Smallholders in this typology are more connected to the climate for their crop and livestock production and hence perceive it more likely than other typologies. The less perception of climate change by intensive-irrigation-farming-based livelihood could be due to their engagement in irrigation activities irrespective of the naturally available moisture. Climate perception of communities plays a remarkable role in the management of the impacts [90]. The community’s exposure rises because of its inability to understand that the environment is changing. While Altieri et al. [88] argued that in the areas where the observation of drought is less (such as highlands and midlands), it is unlikely for farmers to perceive it as an occurrence. Sanderson and Curtis [91] confirmed that climate change was more likely to be discussed as less perceived by irrigators who cited it as a natural phenomenon.
Being a drought-prone part of the Awash Basin, the upper Awash is characterized by different magnitudes of overall exposure to drought. This variation is the result of the diversity in agroecology, livelihood condition, and the socioeconomic profile of the farmers. For instance, the changing climate and drought risks are the core determinants of exposure in the upper Awash sub-basin (Table 3). In terms of the overall exposure profile of the households in midland, lowland, and highland, AEZs are exposed with an indexed value of 0.447, 0.432, and 0.396, respectively (Table 3). This provides information on where to emphasize intervention related to the management of drought exposure in agricultural, agropastoral, and pastoral livelihood environments. A closer look at farm typology results dementated that there is the variability of degree of exposure. For indicators considered in estimating exposure index marginal and off-farm-income-based smallholders, as well as intensive-irrigation-farming-based smallholders, showed stronger values, implying the need for emphasis on raising awareness of climate change among these livelihood typologies (Table 4). Such efforts to change the farmers′ behavior will impact, for example, the irrigation water use and water productivity positively and creates opportunities to the saved water for other ecosystem services.

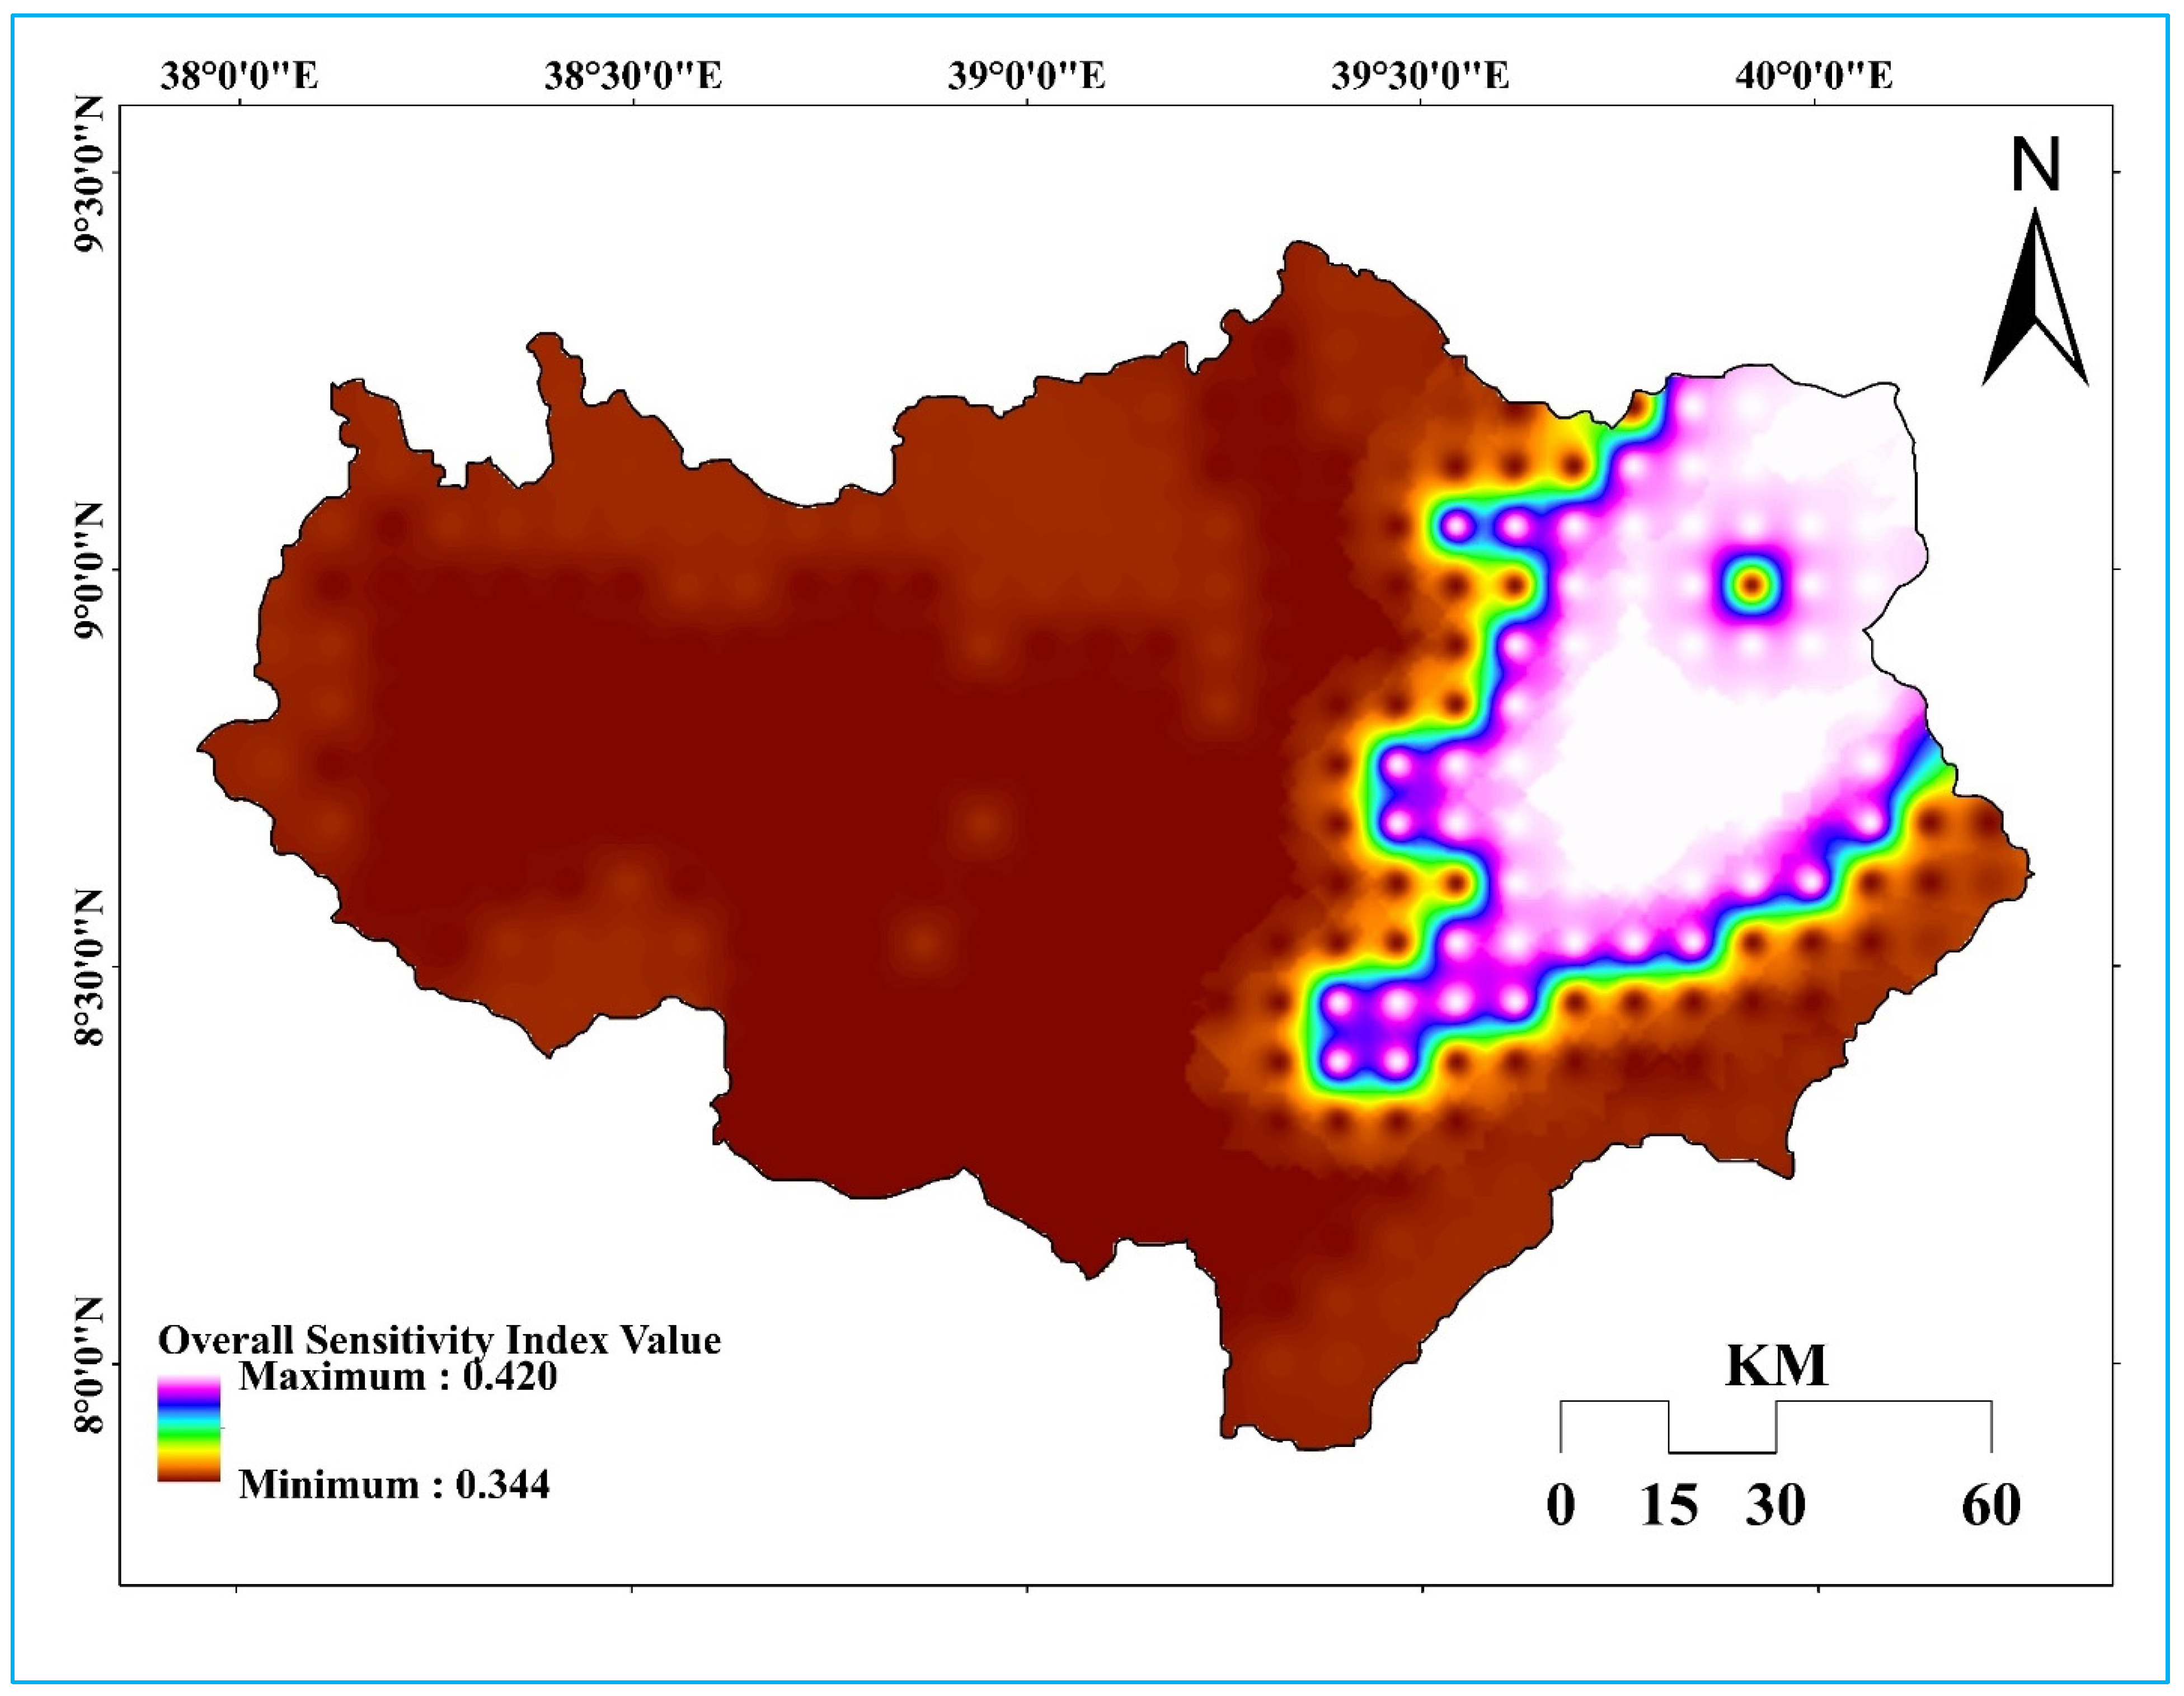
3.3. Sensitivity: Crop Failure, Diseases, and Crisis

Since the economy of the farmers in the upper Awash sub-basin depends on a small-scale, mixed crop–livestock farming system, the environmental sensitivity to the ecosystem services has a crucial role. Table 6 summarizes the eight indicators to define the sensitivity of smallholders to drought in the study area. In arid and semi-arid areas such as the study site, crop failure and hence reduction in crop production are common problems. The erratic nature of the rainfall during the main growing season with spatially fragmented appearance has negatively affected crop production. For example, the lowlands, with crop failure indexed value of 0.735, are the highest victim, followed by highlands, having a crop failure weight of 0.568 (Table 5). Moreover, more than 90 percent of pastoral and agropastoral households in the lowland reported that the average production of major crops reduced in the last decade. Table 6 indicates that the largest crop failure (59.1%) was reported by marginal and off-farm-income-based livelihood typology, and 86.9% of livestock and on-farm-income-based livelihood typology reported production reduction in the last 10 years. This reveals that in terms of crop failure and productivity reduction, lowland farmers are found to be more sensitive, while those farmers who live in midlands are less sensitive to drought. Livestock and on-farm-income-based and marginal and off-farm-income-based farm typologies are highly sensitive to drought than the intensive-irrigation-farming-based counterparts. The rainfall variability in space and time in the Awash Basin makes it difficult to predict where it falls, and it is this spatiotemporal variation in rainfall distribution that causes serious problems such as crop failure [92].
In terms of crop, animal, and human diseases, lowland AEZs are highly sensitive, with a weighted index of 0.216, followed by midlands, having an index value of 0.176. Invasive crop pests are highly expanding in the lowlands (Table 5). Especially, the spreading plant pest locally named shola or woyane (prosopis juliflora) is alarmingly in the lowlands of the sub-basin, particularly around the Fentale District. An interviewed farmer described the pest as follows: “This shola or woyane is something we have not seen in our generation. When we cut it, it coppices in a more number. It is highly depleting nutrients and soil moisture and therefore competes with crops and animal feed. It even kills our animals when they are stabbed by its thorn. It is causing the multidimensional challenge to our livelihood.” Rangelands are core livelihood resources for pastoralists [93], and the expansion of these pests exposes the smallholders to the impact of drought risks. Table 6 depicts the occurrence of the crop, livestock, and human infectious diseases in the upper Awash sub-basin based on farm typology. Farmers in the livestock and on-farm-income-based livelihood typology were most sensitive for crop and livestock diseases. The crop and livestock occurrence mean ± standard deviations of smallholders in this farm typology were 1.33 ± 1.4 and 1.03 ± 1.1, respectively, making them the highest susceptible to diseases compared to the rest of farm typologies.
Local conflicts, food crisis, and proportion of rainfed land made the ingredients of crisis sub-component, and as can be seen in Table 6, lowlands, with 0.144 index value, lead the conflict and the proportion of rainfed land is 0.502 weight value in the midland AEZ, which makes it more sensitive than other AEZs. In sum, with aggregate crisis score values, the midland AEZ was found to be more sensitive to the crisis than the other agroecological zones, while the lowland AEZ was least sensitive.
Analyzing the sensitivity of the households reveals the options for tackling the impacts of drought on the livelihood of farmers AEZ. For instance, the overall sub-components of sensitivity to drought impacts, crop failure, and production reduction have the highest score in the upper Awash sub-basin (Table 5). This could be highly related to the moisture stress and overexploitation of the farmlands in the basin. Hence, while management options that enhance the moisture such as irrigation schemes and soil and water conservation practices could be possible directions, it is also advisable if crop insurance schemes are introduced for the smallholders, especially for rainfed crops in highland and lowland AEZs. Adane et al. [94] have suggested agricultural insurance to mitigate damage to rainfed farmers in the upper Awash sub-basin on the occasion of delayed onset or early cessation of rainfall.
As presented in Figure 4, the sensitivity of smallholder farmers to the drought risk is dominating the lowland AEZ. The midland AEZ is the least sensitive. Therefore, the response mechanisms should consider the degree of sensitivity of the household against each indicator and sub-component with spatial information to apply sound adjustment mechanisms.

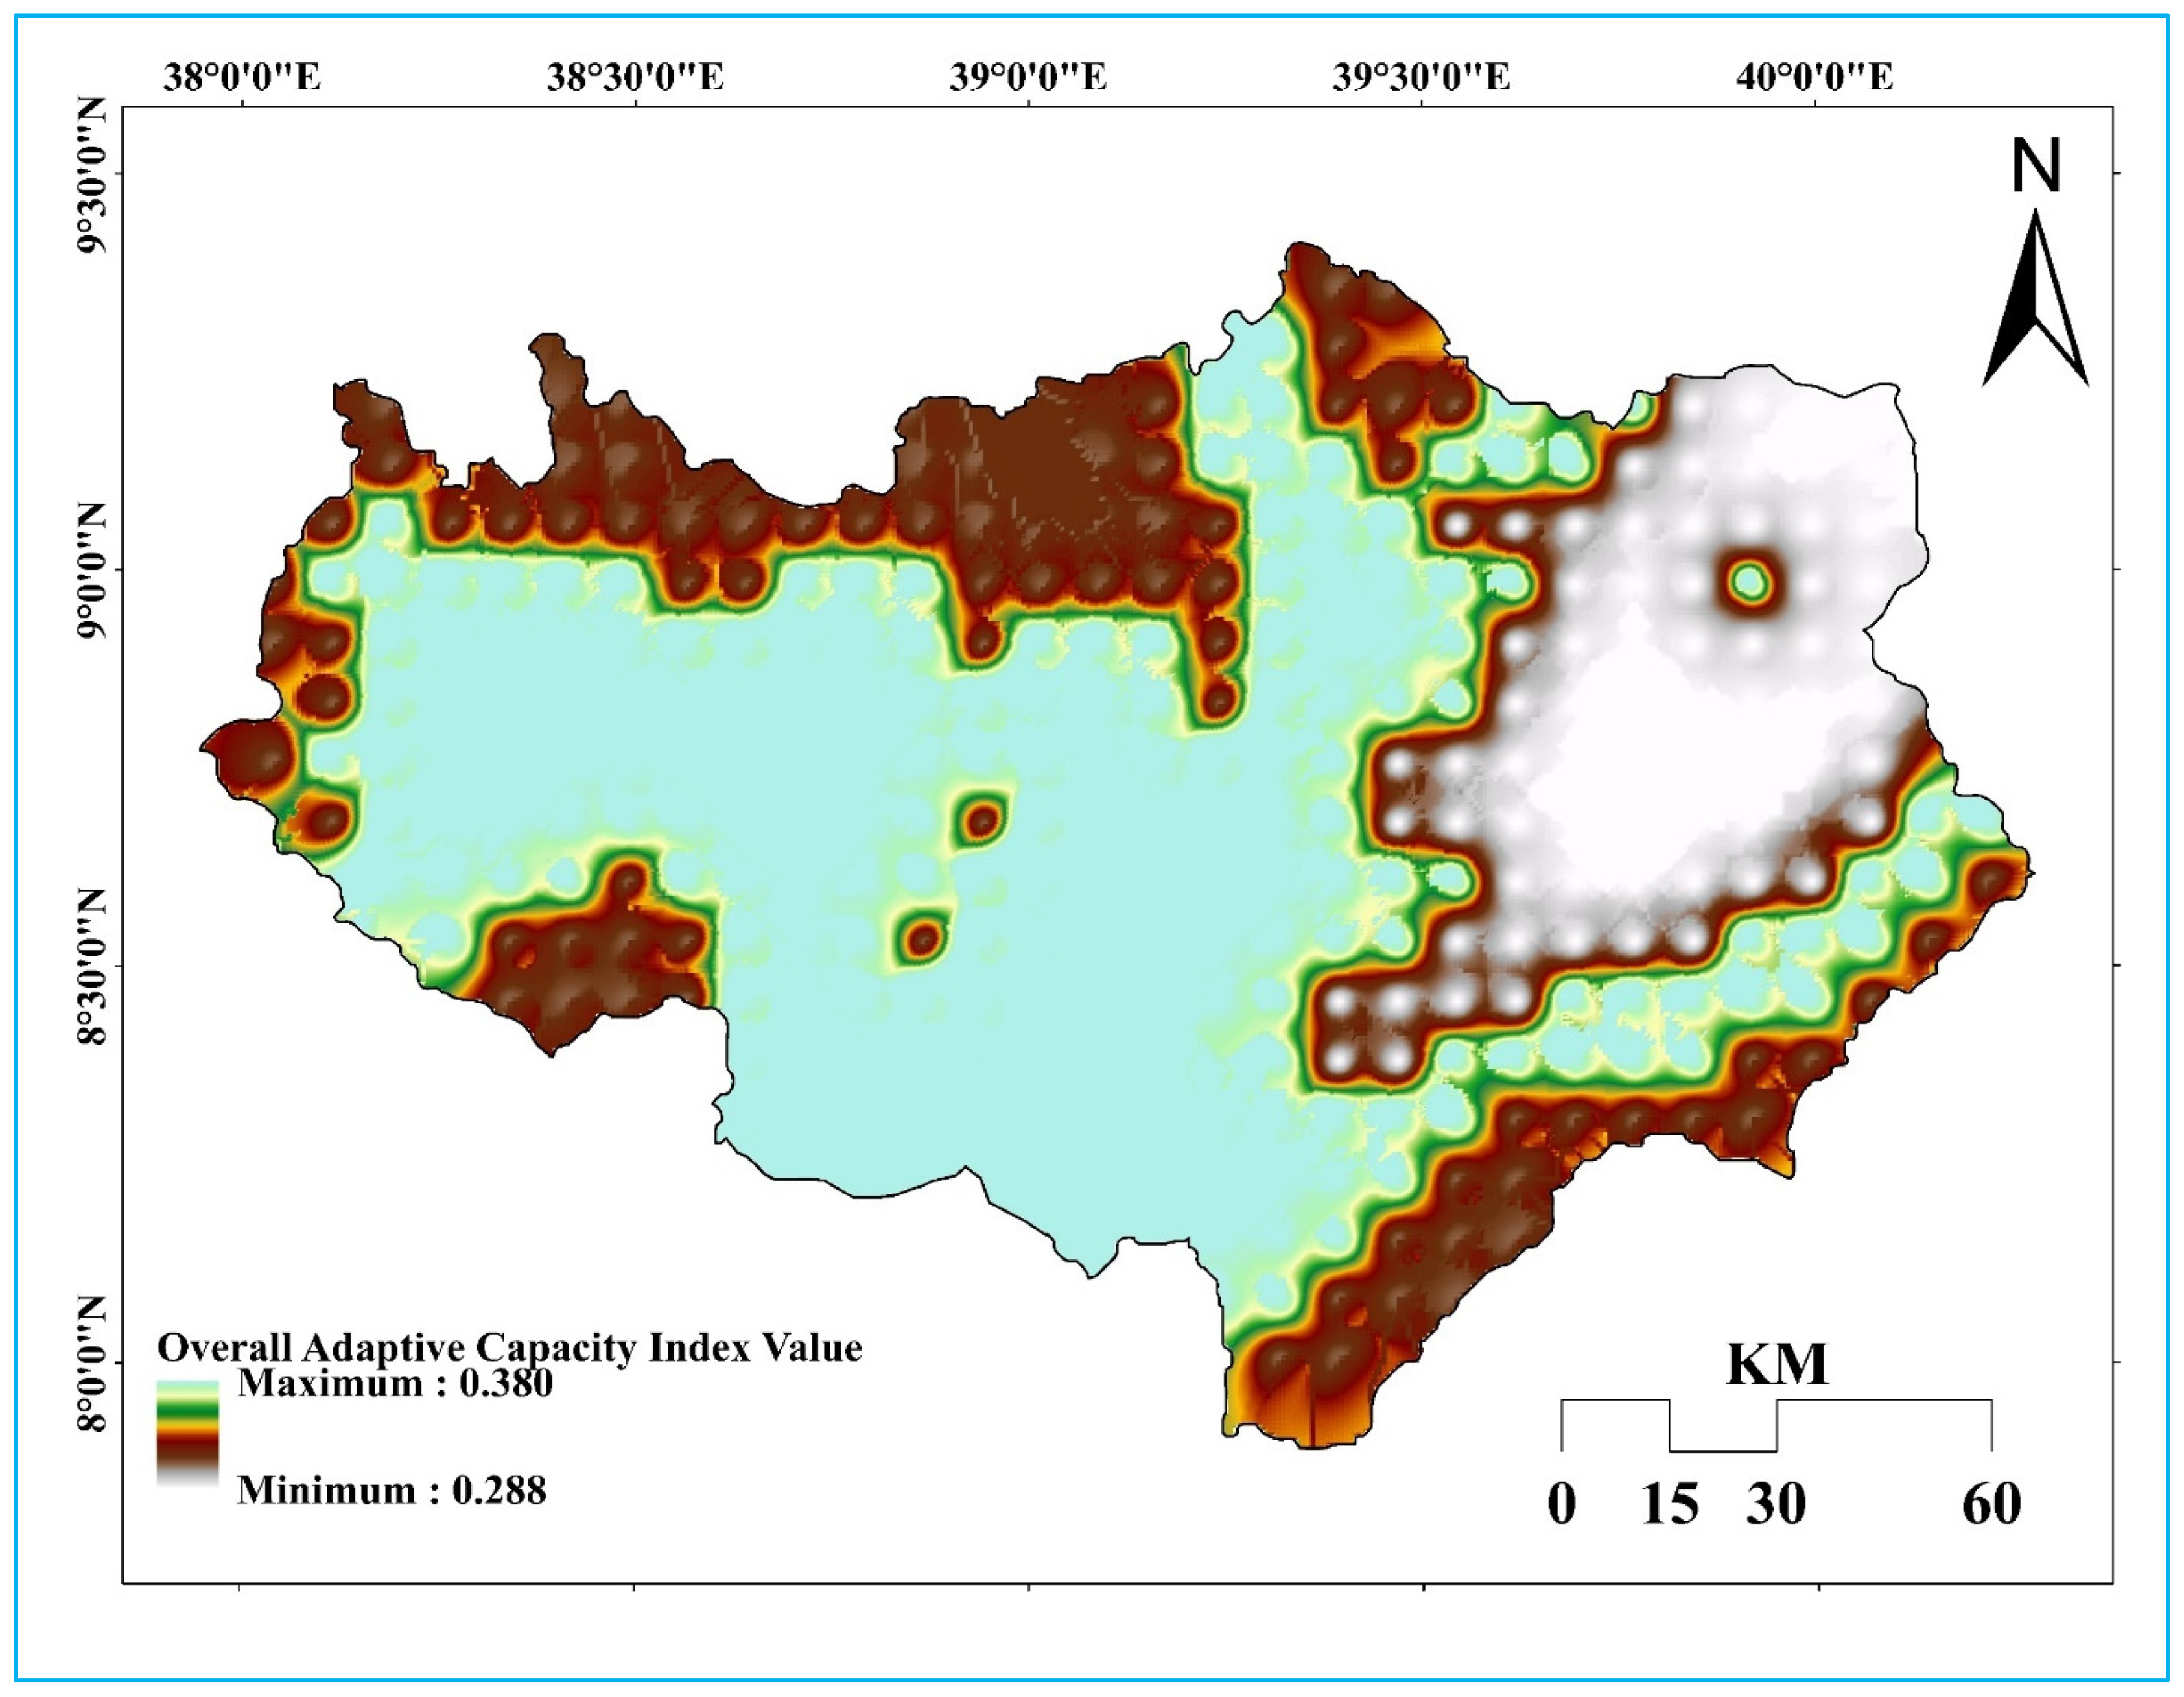
3.4. Adaptive Capacity: Accesses, Wealth, Technology, and Livelihood Diversification

In this study, 38 indicators, regrouped into 6 sub-components, were used to characterize households’ livelihood adaptive capacity to drought (Table 7). Increasing the number of indicators allows understanding each farmer’s livelihood factor and its contribution to their capacity to withstand drought shock from a multidimensional perspective.
Empirically, the adaptive capacity scores of the major components ranged from 0.091 to 0.603, as shown in Table 8. The sociodemographic characteristics of households in the midland AEZ showed the highest adaptive capacity, compared to the highland and lowland AEZs. Farm households with comparatively young and working-age, greater family sizes, and male household heads who had lived in the area for a long time were more resilient to the effects of drought shocks. Table 8 shows that male-headed households dominated intensive and irrigation-farming-based livelihood typologies (88.8%) and were older, with a mean age of 42 ± 12 standard deviations. With a mean age of 40 ± 12 standard deviations, those in the livestock and on-farm-income-based livelihood category were the youngest. A similar trend was observed for family size, with the livestock and on-farm-income-based livelihood typology having the highest mean (4.2 ± 1.7 standard deviations). This suggests that those in the livestock and on-farm-income-based livelihood typology had better values in terms of sociodemographic adaptive capacity than the other typologies. Similarly, the midland AEZ had the highest score in terms of access to infrastructures such as health and education institutions, transports, markets, electricity utility, and health insurance, with an average weight value of 0.507, while the lowland had the lowest value (0.284). Intensive-irrigation-farming-based livelihood typology showed greater adaptive capacity in terms of distances to health facilities and markets, with average walking minutes of 2621 and 2326 standard deviations. As far as transportation access is concerned, 97.8% of those in the livestock and on-farm-income-based livelihood typology had better access to transportation, while 45% of smallholders in the marginal and off-farm-income-based livelihood typology had electricity service at their homes (Table 8). Whether agroecology or farm typology disaggregation, access to the above-mentioned infrastructures is directly related to the quality of life, and the productivity of the farm households is an important point to consider. For example, access to electricity could diversify the income of the households through petty trading. As Phoumin and Kimura [95] indicated, adequate lighting and electricity supply can enable rural children to read and do more homework for longer periods, while families can listen to the radio, watch television, and access weather and market information, or earn extra money out of the linked service provision.
From all the six sub-components, the score for using rural technology was the lowest (0.091). That is, sample farmers had a low level of experience in practicing irrigation technologies (sprinklers, pumping generators, and water harvesting) and utilization of agricultural inputs (fertilizers, pesticide/herbicides, and improved seed). Differences were observed in the usage of chemical fertilizer between the three farm typologies. Livestock and on-farm-income-based farmers, who account for 68% of the total farmers in the study area, were the lowest in using chemical fertilizer during the study period, with the mean of 183 kg ± 234 standard deviations (Table 8). This could also influence the overall productivity and hence income of the households. Adaptive capacity enhancement programs by the government and the projects could target the improved access and adoption of rural technologies in the study area, especially for the livestock and on-farm-income-based farmers. As far as the wealth is considered, a 0.293 highest score was computed in the midland AEZ, followed by highland and lowland AEZs, with a score value of 0.252 and 0.212, respectively (Table 8). Wealth is very important for a society that depends mainly on agriculture for its livelihood [96]. For instance, it is difficult to meet livelihood expectations for a farmer who does not have cattle and cropland, which are the constituents of wealth. The same is true for agricultural equipment. As presented in Table 8, marginal and off-farm-income-based livelihood typology had the lowest number of farmers possessing livestock (6 ± 9 standard deviations in total livestock unit), indicating that they are highly vulnerable to drought impacts. Livestock resources are sources of food (milk, butter, and meat), means of production for agricultural smallholders, and wealth indicators for all types of farmers. In addition to determining the current level of capability of the household, wealth can determine the future prosperity of smallholders and holds the core element in assessing the adaptive capacity in absorbing drought impact [97].
Livelihood diversification is the other determining component of the adaptive capacity of the smallholders. Livelihood diversification, considering its positive contribution to the adaptive capacity, was analyzed using annual income (on-farm, off-farm, and non-farm), saving, engagement of household members in additional works besides farming, access to irrigation water, and hence engagement of farmers in irrigation activities, as well as the involvement of family members in seasonal migrant labor and food consumption diversification (Table 7).
The aggregate value of all the computed indicators informed that midland AEZ farmers were found to be less vulnerable in terms of livelihood diversification (with an average indexed value of 0.278), compared to the farmers in the rest of the AEZs. Farmers in the lowland AEZ were identified as the most vulnerable in their livelihood diversification, with an average weight of 0.175, compared to other households in the studied AEZ (Table 7). The analysis of data on livelihood diversification revealed that most of the households were not engaged in on-farm and off-farm livelihood activities in this AEZ. The overall level of annual income out of farm-related activities in the midland and lowland AEZs were 7.5% and 3.6%, respectively, which are much lower than the national average, at 57% in 2014, as Kassegn and Endris [98] reported. Similarly, the values of cash saving and migrant labor during off-farming seasons are very low indicating the lowest livelihood diversification. The above factors have limited farmers’ livelihood options and weaken their adaptive capacity to the impacts of drought. As indicated in Table 8, farmers engaged in non-farm livelihood activities and irrigation (typology 2 and 3) were better in their annual on-farm, non-farm, and off-farm income and hence have better adaptive capacity to the impacts of drought, compared to farmers who are crop and livestock dependent. This reflects that income diversification, and therefore more livelihood opportunities, are crucial for rural smallholders in creating resilience to the impact of drought. Increased livelihood diversification means more opportunities to move from one activity to another, allowing for greater response to the threats presented by climate change and associated shocks, as well as increased livelihood resilience [99].
At a household level, access to information can significantly impact the level of adaptive capacity [100]. In rural areas, the information could be accessed mainly through social networks. The social network was aggregated by household members’ membership to farmers association and water users’ association, the number of locally monthly gatherings called ”edir”, the trust of the farmers on water users committee, access to market information, and the cellphones number possessed by a farm household. Accordingly, lowland farmers were the lowest in social networks, as compared to the other farmers with an index value of 0.333 (Table 7) informing that their social network adaptive capacity is the lowest. It is evident that the arid lowland AEZs are fragmented in settlement and they are usually mobile in search of water. This might have contributed to the reduction in their social capital score in the context of adaptive capacity. Table 8 depicts that 86.2% of those in the livestock and on-farm-income-based livelihood typology had better access to market information, which makes them better than their counterparts in the marginal and off-farm-income-based and intensive irrigation-farming-based livelihood typologies, who reported 77.3% and 68.6% of market information access, respectively. This is in contradiction with the number of cellphones in a household, which was better in typology 2 and 3 (non-farm and irrigation based). The key informant irrigator farmer in Adea woreda described this situation as “The issue is not about having market information in selling our irrigation products. It is the role of brokers who misinform producer farmers and force us to sell vegetables at a lower price. We hear that the price of vegetables in Addis Ababa is high, but since our products are perishable, we are forced to sell them at a price which is fixed by brokers and buyers.” Therefore, to build the resilience of smallholders, especially irrigators, the market system has to be improved and the role of local brokers must be inspected, and corrective measures need to be taken.
As presented in Table 7, households had better values in their sociodemographics, access to infrastructure, and social network dimensions of the adaptive capacity. However, the farmers’ adaptive capacity, in terms of usage of rural technology, livelihood diversification, and wealth was found to be comparably low. Differences were observed in the magnitude of the components of adaptive capacity based on the profile of the households. There were differences in the components of adaptive capacity based on the farm typology. Livestock and on-farm-income-based typology’s sociodemographic adaptive capacity was better, while intensive-irrigation-farming-based farmers’ adaptive capacity was higher in terms of access to infrastructure, wealth, access, and usage of rural technologies, and livelihood diversification. However, the intensive-irrigation-farming-based typologies are only 9% of the total smallholders in the study area (Table 8). The remaining 91%, which was occupied by livestock and on-farm-income-based and marginal and off-farm-income-based smallholders, showed less adaptive capacity, signifying their low level of resisting the impacts of drought.
As overall adaptive capacity is influenced by the proper functioning of all the components as a system rather than each component as a separate unit, there is a need to make concerted efforts to consider the high-scoring components in the future drought-tackling mechanisms. It is essential to devise a proper balance between the various components. The ability to adapt is often fluid and subject to a variety of influences. In the programs of building the livelihood resilience of smallholders, the focus should also be on the livestock and on-farm-income-based and marginal and off-farm-income-based farmers as their adaptive capacities were lower, compared to their intensive-irrigation-farming-based counterparts. Finally, the focus should be on continuously enhancing the system’s overall performance to cope with the effects of drought risk and capitalize on the opportunities it presents.
As can be seen from Figure 5, low adaptive capacity situations dominated the lowland AEZ of the sub-basin, where the livelihood conditions of pastoralism prevail. This could inform that future overall adaptive capacity improvement schemes need to prioritize these dry and arid AEZs, especially focusing on the improvement of the farmers’ rural technology usage, livelihood strategy diversification, and boosting of their wealth status so that they can overcome the negative impacts of the recurrent drought.

3.5. The Overall Drought Vulnerability: Sensitivity, Exposure, and Adaptive Capacity

The three major components of vulnerability—adaptive capacity, exposure, and sensitivity to drought—were examined following the IPCC–DVI. High exposure values, compared to adaptive capacity, result in positive vulnerability ratings, while low exposure values concerning adaptive capacity have negative vulnerability ratings. With its multiplier impact, high sensitivity results in high vulnerability (large positive score) when exposure exceeds the adaptive capacity, whereas high sensitivity exceeds exposure results in lower vulnerability when adaptative capacity exceeds exposure (large negative score). In the current study, in all the study AEZs, exposure exceeds adaptive capacity, though the rate of change has disparities. The rate of change is the largest (0.144) in the lowland and the smallest (0.088) in the highland. Tessema and Simane [20] have also confirmed that lowlands have the highest exposure profile, compared to the other agroecological zones, and are hence more vulnerable in exposure vulnerability factors.
In this principle, the relative exposure was found to be higher (0.447) in midland, while adaptive capacity was lower (0.288) in the lowland (Table 9). Coupled with the relatively higher sensitivity (0.420) in the lowland (compared to the rest of the agroecological zones), this resulted in a larger negative vulnerability score (−1.956) implying relatively higher livelihood vulnerability to the drought of lowlanders, compared to farmers in the highland (−3.045) and the midland (−4.257) (Table 9). Conversely, the lower exposure (0.396) in the highland and the higher adaptive capacity (0.380) of the midland, compared to the rest (Table 9), resulted in a relatively small negative vulnerability score (−4.257) in the midland, showing that the overall vulnerability is estimated to be low in the midland, compared to the lowland and highland. Comparably, lowlands were highly vulnerable to the impacts of drought (−1.956), highlands (−3.045) were moderately vulnerable, and midlands were least vulnerable with an overall score value of −4.257 (Table 9).

4. Conclusions

The farmers in highland AEZ were highly exposed, compared to fellow farmers in midland and lowland AEZs. The core components that contributed to the high score of exposure were related to drought risks and the impacts of long-term climate change. In terms of the sensitivity of the households to drought, farms in all AEZs were sensitive. At the scale of farm typology, the vast majority of the households in the sub-basin who are in livestock and on-farm-income-based livelihood typology were more sensitive to drought, compared to the intensive-irrigation-farming-based farmers. Adaptive capacity, which makes farmers cope with the impacts of exposure and sensitivity, was better for farmers in midland than those in highland and lowland AEZs. Comparably, in the overall IPCC–DVI score, farm households living in the lowland AEZ were highly vulnerable, while those who live in highland and midland AEZ were medium and low, respectively. The farm typology level analysis results informed that intensive-irrigation-farming-based livelihood typology had higher adaptive capacity, while the components of adaptive capacity of the livestock and on-farm-income-based and marginal and off-farm-income-based livelihood typology was low, informing that they are more vulnerable to drought impacts.
To reduce the exposure and sensitivity of smallholder farmers’ livelihood to drought impacts and hence increase their adaptive capacity, crop varieties that can tolerate moisture stress need to be identified and integrated into the farm system. The sensitivity of the environment that causes the existence of crop and livestock diseases and pests has to be managed. For the supply of pesticides and herbicides to smallholders, considering the time and amount needed could be a better option. Since the vulnerability to the impacts of drought is a function of all the indicators used in this study, interventions in the weak index points (sensitivity, adaptive capacity, exposure) observed in the study’s agroecological zones and farm typologies are important entry points to consider. For example, interventions could include weather-indexed crop and livestock insurance and expansion of rural technologies and improved inputs, and create awareness among farmers to be engaged in livelihood diversification strategies such as trading of agricultural products especially during off-farm periods, which can improve their adaptive capacity. On the other hand, improved access to, and management of, water for irrigation is a potential entry point to reduce vulnerability to drought risk. Existing rainfed-dependent farming systems must be supported through supplementary or full irrigation, along with agroecology and farm typology specific natural resources conservation practices. In the long run, with the increasing exposure and sensitivity to the sources of water, it could be challenging to sustain irrigation due to the water supplies may be affected due to the impacts of drought. Hence, interventions related to water demand management could be better solutions to overcome this situation. Finally, as a procedure to build smallholders’ resilience to drought, efforts should better target AEZs to prioritize the focus region and farmers’ livelihood typology to tailor technologies to farms.

Author Contributions

Conceptualization, H.M. and A.H.; methodology, H.M. and A.H.; formal analysis, H.M., A.H. and B.E.; investigation, H.M.; resources, H.M., A.H. and T.Z.; data curation, H.M. and A.H.; writing—original draft preparation, H.M.; writing—review and editing, H.M., A.H., T.Z. and B.E.; supervision, A.H., T.Z. and B.E.; funding acquisition, A.H. and T.Z. All authors have read and agreed to the published version of the manuscript.

Funding

This research received no external funding.

Institutional Review Board Statement

Not applicable.

Informed Consent Statement

Not applicable.

Data Availability Statement

Data used in this study are available from the corresponding author only based on reasonable requests.

Acknowledgments

The authors are grateful and appreciate the provision of the gridded temperature and rainfall data from the National Meteorological Agency (NMA) of Ethiopia and its staff. We also would like to thank Water Land and Ecosystem (WLE), Addis Ababa University, and Wolaita Sodo University for the financial support they provided for the corresponding author to conduct this study.

Conflicts of Interest

The authors declare no conflict of interest.

References

  1. Farid, K.S.; Tanny, N.Z.; Rahman, M.W. Determinants of drought risk coping mechanisms among the farmers of Northern region of Bangladesh. J. Bangladesh Agric. Univ. 2019, 17, 58–64. [Google Scholar] [CrossRef] [Green Version]
  2. Balaganesh, G.; Malhotra, R.; Sendhil, R.; Sirohi, S.; Maiti, S.; Ponnusamy, K.; Sharma, A.K. Development of composite vulnerability index and district level mapping of climate change induced drought in Tamil Nadu, India. Ecol. Indic. 2020, 113, 106197. [Google Scholar] [CrossRef]
  3. GebreMichael, Y. Climate Change, Vulnerability, and Adaption under the Small Farming Households of Konso Community, Southern Ethiopia. In Handbook of Climate Change Resilience; Springer: Cham, Switzerland, 2020. [Google Scholar] [CrossRef]
  4. Jamshidi, O.; Asadi, A.; Kalantari, K.; Azadi, H.; Scheffran, J. Vulnerability to climate change of smallholder farmers in the Hamadan province, Iran. Clim. Risk Manag. 2019, 23, 146–159. [Google Scholar] [CrossRef]
  5. Tibesigwa, B.; Visser, M.; Turpie, J. The impact of climate change on net revenue and food adequacy of subsistence farming households in South Africa. Environ. Dev. Econ. 2015, 20, 327–353. [Google Scholar] [CrossRef] [Green Version]
  6. Aribi, F.; Sghaier, M. Livelihood vulnerability assessment to climate change and variability: The case of farm households in South-East Tunisia. Environ. Dev. Sustain. 2021, 23, 12631–12658. [Google Scholar] [CrossRef]
  7. Ndung’u, P.W.; Bebe, B.O.; Ondiek, J.O.; Butterbach-Bahl, K.; Merbold, L.; Goopy, J.P. Improved region-specific emission factors for enteric methane emissions from cattle in smallholder mixed crop: Livestock systems of Nandi County, Kenya. Anim. Prod. Sci. 2019, 59, 1136–1146. [Google Scholar] [CrossRef] [Green Version]
  8. Ahmad, M.I.; Ma, H. Climate Change and Livelihood Vulnerability in Mixed Crop–Livestock Areas: The Case of Province Punjab, Pakistan. Sustainability 2020, 12, 586. [Google Scholar] [CrossRef] [Green Version]
  9. Ghosh, M.; Ghosal, S. Determinants of household livelihood vulnerabilities to climate change in the Himalayan foothills of West Bengal, India. Int. J. Disaster Risk Reduct. 2020, 50, 101706. [Google Scholar] [CrossRef]
  10. Jellason, N.P.; Conway, J.S.; Baines, R.N.; Ogbaga, C.C. A review of farming challenges and resilience management in the Sudano-Sahelian drylands of Nigeria in an era of climate change. J. Arid Environ. 2021, 186, 104398. [Google Scholar] [CrossRef]
  11. Shiferaw, B.; Tesfaye, K.; Kassie, M.; Abate, T.; Prasanna, B.M.; Menkir, A. Managing vulnerability to drought and enhancing livelihood resilience in sub-Saharan Africa: Technological, institutional and policy options. Weather Clim. Extrem. 2014, 3, 67–79. [Google Scholar] [CrossRef] [Green Version]
  12. Lennox, R.J.; Crook, D.A.; Moyle, P.B.; Struthers, D.P.; Cooke, S.J. Toward a better understanding of freshwater fish responses to an increasingly drought-stricken world. Rev. Fish Biol. Fisher. 2019, 29, 71–92. [Google Scholar] [CrossRef]
  13. Dutra, E.; Magnusson, L.; Wetterhall, F.; Cloke, H.L.; Balsamo, G.; Boussetta, S.; Pappenberger, F. The 2010–2011 drought in the Horn of Africa in ECMWF reanalysis and seasonal forecast products. Int. J. Climatol. 2013, 33, 1720–1729. [Google Scholar] [CrossRef] [Green Version]
  14. Nicholson, S.E. A detailed look at the recent drought situation in the Greater Horn of Africa. J. Arid Environ. 2014, 103, 71–79. [Google Scholar] [CrossRef]
  15. Agutu, N.; Awange, J.; Ndehedehe, C.; Mwaniki, M. Consistency of agricultural drought characterization over Upper Greater Horn of Africa (1982–2013): Topographical, gauge density, and model forcing influence. Sci. Total Environ. 2020, 709, 135149. [Google Scholar] [CrossRef]
  16. Abid, M.; Ali, A.; Raza, M.; Mehdi, M. Ex-ante and ex-post coping strategies for climatic shocks and adaptation determinants in rural Malawi. Clim. Risk Manag. 2020, 27, 100200. [Google Scholar] [CrossRef]
  17. Epstein, A.; Bendavid, E.; Nash, D.; Charlebois, E.D.; Weiser, S.D. Drought and intimate partner violence towards women in 19 countries in sub-Saharan Africa during 2011–2018: A population-based study. PLoS. Med. 2020, 17, e1003064. [Google Scholar] [CrossRef] [Green Version]
  18. Gebrehiwot, T.; van der Veen, A. Farmers’ drought experience, risk perceptions, and behavioural intentions for adaptation: Evidence from Ethiopia. Clim. Dev. 2020, 13, 493–502. [Google Scholar] [CrossRef]
  19. Lottering, S.; Mafongoya, P.; Lottering, R. Drought and its impacts on small-scale farmers in sub-Saharan Africa: A review. S. Afr. Geogr. J. 2021, 103, 319–341. [Google Scholar] [CrossRef]
  20. Tessema, I.; Simane, B. Vulnerability analysis of smallholder farmers to climate variability and change: An agro-ecological system-based approach in the Fincha’a sub-basin of the upper Blue Nile Basin of Ethiopia. Ecol. Process. 2019, 8, 5. [Google Scholar] [CrossRef] [Green Version]
  21. Singh, R.K.; Singh, A.; Kumar, S.; Sheoran, P.; Sharma, D.; Stringer, L.C.; Quinn, C.H.; Kumar, A.; Singh, D. Perceived Climate Variability and Compounding Stressors: Implications for Risks to Livelihoods of Smallholder Indian Farmers. Environ. Manag. 2020, 66, 826–844. [Google Scholar] [CrossRef]
  22. Sam, A.S.; Padmaja, S.S.; Kächele, H.; Kumar, R.; Müller, K. Climate change, drought and rural communities: Understanding people’s perceptions and adaptations in rural eastern India. Int. J. Disaster Risk Reduct. 2020, 44, 101436. [Google Scholar] [CrossRef]
  23. Kumar, S.; Mishra, A.K.; Pramanik, S.; Mamidanna, S.; Whitbread, A. Climate risk, vulnerability and resilience: Supporting livelihood of smallholders in semiarid India. Land Use Policy 2020, 97, 104729. [Google Scholar] [CrossRef]
  24. Chavez Michaelsen, A.; Huamani Briceño, L.; Vilchez Baldeon, H.; Perz, S.G.; Quaedvlieg, J.; Rojas, R.O.; Brown, I.F.; Pinedo Mora, R. The effects of climate change variability on rural livelihoods in Madre de Dios, Peru. Reg. Environ. Chang. 2020, 20, 70. [Google Scholar] [CrossRef]
  25. Abeje, M.T.; Tsunekawa, A.; Haregeweyn, N.; Nigussie, Z.; Adgo, E.; Ayalew, Z.; Tsubo, M.; Elias, A.; Berihun, D.; Quandt, A. Communities’ livelihood vulnerability to climate variability in Ethiopia. Sustainability 2019, 11, 6302. [Google Scholar] [CrossRef] [Green Version]
  26. Maru, H.; Haileslassie, A.; Zeleke, T.; Esayas, B. Agroecology-based analysis of meteorological drought and mapping its hotspot areas in Awash Basin, Ethiopia. Model. Earth Syst. Environ. 2021, 1–22. [Google Scholar] [CrossRef]
  27. Auci, S.; Coromaldi, M. Climate variability and agricultural production efficiency: Evidence from Ethiopian farmers. Int. J. Environ. Stud. 2021, 78, 57–76. [Google Scholar] [CrossRef]
  28. Borgomeo, E.; Vadheim, B.; Woldeyes, F.B.; Alamirew, T.; Tamru, S.; Charles, K.J.; Kebede, S.; Walker, O. The distributional and multi-sectoral impacts of rainfall shocks: Evidence from computable general equilibrium modelling for the Awash Basin, Ethiopia. Ecol. Econ. 2018, 146, 621–632. [Google Scholar] [CrossRef]
  29. Shawul, A.A.; Chakma, S. Spatiotemporal detection of land use/land cover change in the large basin using integrated approaches of remote sensing and GIS in the Upper Awash basin, Ethiopia. Environ. Earth Sci. 2019, 78, 141. [Google Scholar] [CrossRef]
  30. Adane, G.B.; Hirpa, B.A.; Lim, C.-H.; Lee, W.-K. Spatial and Temporal Analysis of Dry and Wet Spells in Upper Awash River Basin, Ethiopia. Water 2020, 12, 3051. [Google Scholar] [CrossRef]
  31. Hailu, R.; Tolossa, D.; Alemu, G. Water institutions in the Awash basin of Ethiopia: The discrepancies between rhetoric and realities. Int. J. River Basin Manag. 2018, 16, 107–121. [Google Scholar] [CrossRef]
  32. De Haan, L.; Zoomers, A. Development geography at the crossroads of livelihood and globalisation. Tijdschr. Econ. Soc. Geogr. 2003, 94, 350–362. [Google Scholar] [CrossRef] [Green Version]
  33. Ellis, F. Household strategies and rural livelihood diversification. J. Dev. Stud. 1998, 35, 1–38. [Google Scholar] [CrossRef]
  34. Ndlela, S.; Worth, S. Creating self-reliance and sustainable livelihoods amongst small-scale sugarcane farmers. J. Agric. Educ. Ext. 2021, 27, 325–339. [Google Scholar] [CrossRef]
  35. Liu, X.; Wang, Y.; Peng, J.; Braimoh, A.K.; Yin, H. Assessing vulnerability to drought based on exposure, sensitivity and adaptive capacity: A case study in middle Inner Mongolia of China. Chin. Geogr. Sci. 2013, 23, 13–25. [Google Scholar] [CrossRef]
  36. IPCC. Climate Change 2007: Impacts, Adaptation and Vulnerability. Contribution of Working Group II to the Fourth Assessment Report of the Intergovernmental Panel on Climate Change; Parry, M., Parry, M.L., Canziani, O., Palutikof, J., Van der Linden, P., Hanson, C., Eds.; Cambridge University Press: Cambridge, MA, USA, 2007. [Google Scholar]
  37. IPCC. Climate change 2014—Impacts, Adaptation and Vulnerability: Regional Aspects; Field, C.B., Barros, V.R., Eds.; Cambridge University Press: Cambridge, MA, USA, 2014. [Google Scholar]
  38. Gessler, A.; Bottero, A.; Marshall, J.; Arend, M. The way back: Recovery of trees from drought and its implication for acclimation. New Phytol. 2020, 228, 1704–1709. [Google Scholar] [CrossRef] [PubMed]
  39. Adzawla, W.; Baumüller, H. Effects of livelihood diversification on gendered climate vulnerability in northern Ghana. Environ. Dev. Sustain. 2021, 23, 923–946. [Google Scholar] [CrossRef]
  40. Sharafi, L.; Zarafshani, K.; Keshavarz, M.; Azadi, H.; Van Passel, S. Drought risk assessment: Towards drought early warning system and sustainable environment in western Iran. Ecol. Indic. 2020, 114, 106276. [Google Scholar] [CrossRef]
  41. Choden, K.; Keenan, R.J.; Nitschke, C.R. An approach for assessing adaptive capacity to climate change in resource dependent communities in the Nikachu watershed, Bhutan. Ecol. Indic. 2020, 114, 106293. [Google Scholar] [CrossRef]
  42. Mukasa, J.; Olaka, L.; Yahya Said, M. Drought and households’ adaptive capacity to water scarcity in Kasali, Uganda. J. Water Clim. Chang. 2020, 11, 217–232. [Google Scholar] [CrossRef]
  43. Shukla, R.; Agarwal, A.; Gornott, C.; Sachdeva, K.; Joshi, P. Farmer typology to understand differentiated climate change adaptation in Himalaya. Sci. Rep. 2019, 9, 20375. [Google Scholar] [CrossRef] [Green Version]
  44. Haileslassie, A.; Craufurd, P.; Thiagarajah, R.; Kumar, S.; Whitbread, A.; Rathor, A.; Blummel, M.; Ericsson, P.; Kakumanu, K.R. Empirical evaluation of sustainability of divergent farms in the dryland farming systems of India. Ecol. Indic. 2016, 60, 710–723. [Google Scholar] [CrossRef] [Green Version]
  45. Chikowo, R.; Zingore, S.; Snapp, S.; Johnston, A. Farm typologies, soil fertility variability and nutrient management in smallholder farming in Sub-Saharan Africa. Nutr. Cycl. Agroecosyst. 2014, 100, 1–18. [Google Scholar] [CrossRef]
  46. Musafiri, C.M.; Macharia, J.M.; Ng’etich, O.K.; Kiboi, M.N.; Okeyo, J.; Shisanya, C.A.; Okwuosa, E.A.; Mugendi, D.N.; Ngetich, F.K. Farming systems’ typologies analysis to inform agricultural greenhouse gas emissions potential from smallholder rain-fed farms in Kenya. Sci. Afr. 2020, 8, e00458. [Google Scholar] [CrossRef]
  47. Nasir, J.; Assefa, E.; Zeleke, T.; Gidey, E. Meteorological Drought in Northwestern Escarpment of Ethiopian Rift Valley: Detection seasonal and spatial trends. Environ. Syst. Res. 2021, 10, 16. [Google Scholar] [CrossRef]
  48. Koech, G.; Makokha, G.O.; Mundia, C.N. Climate change vulnerability assessment using a GIS modelling approach in ASAL ecosystem: A case study of Upper Ewaso Nyiro basin, Kenya. Model. Earth Syst. Environ. 2020, 6, 479–498. [Google Scholar] [CrossRef]
  49. Asmamaw, M.; Mereta, S.T.; Beyene, E.M.; Ambelu, A. Multidimensional livelihood vulnerability analysis in Dinki watershed, central highlands of Ethiopia. Clim. Dev. 2020, 12, 814–826. [Google Scholar] [CrossRef]
  50. Das, M.; Das, A.; Momin, S.; Pandey, R. Mapping the effect of climate change on community livelihood vulnerability in the riparian region of Gangatic Plain, India. Ecol. Indic. 2020, 119, 106815. [Google Scholar] [CrossRef]
  51. Gupta, A.K.; Negi, M.; Nandy, S.; Kumar, M.; Singh, V.; Valente, D.; Petrosillo, I.; Pandey, R. Mapping socio-environmental vulnerability to climate change in different altitude zones in the Indian Himalayas. Ecol. Indic. 2020, 109, 105787. [Google Scholar] [CrossRef]
  52. Poudel, S.; Funakawa, S.; Shinjo, H.; Mishra, B. Understanding households’ livelihood vulnerability to climate change in the Lamjung district of Nepal. Environ. Dev. Sustain. 2020, 22, 8159–8182. [Google Scholar] [CrossRef]
  53. Nyairo, R.; Machimura, T.; Matsui, T. A combined analysis of sociological and farm management factors affecting household livelihood vulnerability to climate change in rural Burundi. Sustainability 2020, 12, 4296. [Google Scholar] [CrossRef]
  54. Singh, S. Bridging the gap between biophysical and social vulnerability in rural India: A community livelihood vulnerability approach. Area Dev. Policy 2020, 5, 390–411. [Google Scholar] [CrossRef]
  55. Endalew, H.A.; Sen, S. Effects of climate shocks on Ethiopian rural households: An integrated livelihood vulnerability approach. J. Environ. Plan. Manag. 2021, 64, 399–431. [Google Scholar] [CrossRef]
  56. Dechassa, C.; Simane, B.; Alamirew, B. Farm-level Determinants of Farmers’ Adaptation Decisions to Climate Variability and Change in Didessa Basin, Ethiopia. Asian J. Agric. Ext. Econ. Soc. 2020, 38, 42–55. [Google Scholar] [CrossRef]
  57. Wabwire, E.O.; Mukhovi, S.; Nyandega, I.A. The Perception of Rural Households on Climate Change Effect on Rural Livelihoods in Lake Victoria Basin. Ghana J. Geogr. 2020, 12, 62–83. [Google Scholar] [CrossRef]
  58. Huong, N.T.L.; Yao, S.; Fahad, S. Assessing household livelihood vulnerability to climate change: The case of Northwest Vietnam. Hum. Ecol. Risk Assess Int. J. 2019, 25, 1157–1175. [Google Scholar] [CrossRef]
  59. Rudiarto, I.; Pamungkas, D. Spatial Exposure and Livelihood Vulnerability to Climate-Related Disasters in the North Coast of Tegal City, Indonesia. Int. Rev. Spat. Plan. Sustain. Dev. 2020, 8, 34–53. [Google Scholar] [CrossRef]
  60. Zhu, R.; Fang, Y.; Neupane, N.; Koirala, S.; Zhang, C. Drought stress and livelihood response based on evidence from the Koshi River Basin in Nepal: Modeling and applications. Water 2020, 12, 1610. [Google Scholar] [CrossRef]
  61. Müller-Mahn, D.; Moure, M.; Gebreyes, M. Climate change, the politics of anticipation and future riskscapes in Africa. Camb. J. Reg. Econ. 2020, 13, 343–362. [Google Scholar] [CrossRef]
  62. Taye, M.T.; Dyer, E.; Hirpa, F.A.; Charles, K. Climate change impact on water resources in the Awash basin, Ethiopia. Water 2018, 10, 1560. [Google Scholar] [CrossRef] [Green Version]
  63. Shawul, A.A.; Chakma, S. Suitability of global precipitation estimates for hydrologic prediction in the main watersheds of Upper Awash basin. Environ. Earth Sci. 2020, 79, 53. [Google Scholar] [CrossRef]
  64. Tolera, M.B.; Chung, I.-M.; Chang, S.W. Evaluation of the climate forecast system reanalysis weather data for watershed modeling in Upper Awash basin, Ethiopia. Water 2018, 10, 725. [Google Scholar] [CrossRef] [Green Version]
  65. Tajebe, L.; Anjulo, A.; Ewnetu, Z. Apple based agroforestry in Dendi Woreda, Oromiya Region: Income contribution and determinants for adoption. Ethiop. J. Agric. Sci. 2013, 23, 61–73. [Google Scholar]
  66. Haileslassie, A.; Peden, D.; Gebreselassie, S.; Amede, T.; Descheemaeker, K. Livestock water productivity in mixed crop–livestock farming systems of the Blue Nile basin: Assessing variability and prospects for improvement. Agric. Syst. 2009, 102, 33–40. [Google Scholar] [CrossRef]
  67. Haileslassie, A.; Peden, D.; Gebreselassie, S.; Amede, T.; Wagnew, A.; Taddesse, G. Livestock water productivity in the Blue Nile Basin: Assessment of farm scale heterogeneity. Rangel. J. 2009, 31, 213–222. [Google Scholar] [CrossRef]
  68. Yadeta, D.; Kebede, A.; Tessema, N. Potential evapotranspiration models evaluation, modelling, and projection under climate scenarios, Kesem sub-basin, Awash River basin, Ethiopia. Model. Earth Syst. Environ. 2020, 6, 2165–2176. [Google Scholar] [CrossRef]
  69. Simane, B.; Zaitchik, B.F.; Foltz, J.D. Agroecosystem specific climate vulnerability analysis: Application of the livelihood vulnerability index to a tropical highland region. Mitig. Adapt. Strateg. Glob. Chang. 2016, 21, 39–65. [Google Scholar] [CrossRef] [Green Version]
  70. Kadam, P.; Bhalerao, S. Sample size calculation. Int. J. Ayurveda Res. 2010, 1, 55. [Google Scholar]
  71. Neset, T.-S.; Wiréhn, L.; Opach, T.; Glaas, E.; Linnér, B.-O. Evaluation of indicators for agricultural vulnerability to climate change: The case of Swedish agriculture. Ecol. Indic. 2019, 105, 571–580. [Google Scholar] [CrossRef]
  72. Marlon, J.R.; Wang, X.; Mildenberger, M.; Bergquist, P.; Swain, S.; Hayhoe, K.; Howe, P.D.; Maibach, E.; Leiserowitz, A. Hot dry days increase perceived experience with global warming. Glob. Environ. Chang. 2021, 68, 102247. [Google Scholar] [CrossRef]
  73. Tesema, K.B.; Haile, A.T.; Nakawuka, P. Vulnerability of community to climate stress: An indicator-based investigation of Upper Gana watershed in Omo Gibe basin in Ethiopia. Int. J. Disaster Risk Reduct. 2021, 102426. [Google Scholar] [CrossRef]
  74. Williams, P.A.; Crespo, O.; Abu, M. Adapting to changing climate through improving adaptive capacity at the local level–The case of smallholder horticultural producers in Ghana. Clim. Risk Manag. 2019, 23, 124–135. [Google Scholar] [CrossRef]
  75. Anandhi, A.; Douglas-Mankin, K.R.; Srivastava, P.; Aiken, R.M.; Senay, G.; Leung, L.R.; Chaubey, I. DPSIR-ESA Vulnerability Assessment (DEVA) Framework: Synthesis, Foundational Overview, and Expert Case Studies. Trans ASABE 2020, 63, 741–752. [Google Scholar] [CrossRef]
  76. Asfaw, S.; McCarthy, N.; Lipper, L.; Arslan, A.; Cattaneo, A. What determines farmers’ adaptive capacity? Empirical evidence from Malawi. Food Sec. 2016, 8, 643–664. [Google Scholar] [CrossRef]
  77. Villamayor-Tomas, S.; García-López, G. The influence of community-based resource management institutions on adaptation capacity: A large-n study of farmer responses to climate and global market disturbances. Glob. Environ. Chang. 2017, 47, 153–166. [Google Scholar] [CrossRef] [Green Version]
  78. Wright, H.; Kristjanson, P.M.; Bhatta, G.D. Understanding Adaptive Capacity: Sustainable Livelihoods and Food Security in Coastal Bangladesh; CCAFS Working Paper No. 32; CGIAR Research Program on Climate Change, Agriculture and Food Security (CCAFS): Copenhagen, Denmark, 2012; Available online: https://hdl.handle.net/10568/24794 (accessed on 10 June 2021).
  79. Uddin, M.N.; Islam, A.S.; Bala, S.K.; Islam, G.T.; Adhikary, S.; Saha, D.; Haque, S.; Fahad, M.G.R.; Akter, R. Mapping of Climate Vulnerability of the Coastal Region of Bangladesh using principal component analysis. Appl. Geogr. 2019, 102, 47–57. [Google Scholar] [CrossRef]
  80. Quackenbush, J. Microarray data normalization and transformation. Nat. Genet. 2002, 32, 496–501. [Google Scholar] [CrossRef] [PubMed]
  81. Hahn, M.B.; Riederer, A.M.; Foster, S.O. The Livelihood Vulnerability Index: A pragmatic approach to assessing risks from climate variability and change—A case study in Mozambique. Glob. Eviron. Chang. 2009, 19, 74–88. [Google Scholar] [CrossRef]
  82. Pandey, R.; Jha, S. Climate vulnerability index-measure of climate change vulnerability to communities: A case of rural Lower Himalaya, India. Mitig. Adapt. Strateg. Glob. Chang. 2012, 17, 487–506. [Google Scholar] [CrossRef]
  83. Wold, S.; Esbensen, K.; Geladi, P. Principal component analysis. Chemom. Intell. Lab. Syst. 1987, 2, 37–52. [Google Scholar] [CrossRef]
  84. Li, G.; Hu, A.; Zhang, J.; Peng, L.; Sun, C.; Cao, D. High-agreement uncorrelated secret key generation based on principal component analysis preprocessing. IEEE Trans. Commun. 2018, 66, 3022–3034. [Google Scholar] [CrossRef]
  85. Murtagh, F.; Legendre, P. Ward’s hierarchical agglomerative clustering method: Which algorithms implement Ward’s criterion? J. Classif. 2014, 31, 274–295. [Google Scholar] [CrossRef] [Green Version]
  86. Hoque, M.A.-A.; Pradhan, B.; Ahmed, N. Assessing drought vulnerability using geospatial techniques in northwestern part of Bangladesh. Sci. Total Environ. 2020, 705, 135957. [Google Scholar] [CrossRef] [PubMed]
  87. Esayas, B.; Simane, B.; Teferi, E.; Ongoma, V.; Tefera, N. Trends in extreme climate events over three agroecological zones of southern Ethiopia. Adv. Meteorol. 2018, 2018, 7354157. [Google Scholar] [CrossRef]
  88. Altieri, M.A.; Nicholls, C.I.; Henao, A.; Lana, M.A. Agroecology and the design of climate change-resilient farming systems. Agron. Sustain. Dev. 2015, 35, 869–890. [Google Scholar] [CrossRef] [Green Version]
  89. Leal Filho, W.; Taddese, H.; Balehegn, M.; Nzengya, D.; Debela, N.; Abayineh, A.; Mworozi, E.; Osei, S.; Ayal, D.Y.; Nagy, G.J. Introducing experiences from African pastoralist communities to cope with climate change risks, hazards and extremes: Fostering poverty reduction. Int. J. Disaster Risk Reduct. 2020, 50, 101738. [Google Scholar] [CrossRef]
  90. Poudel, P.; Thapa, S.; Ghimire, S.; Sen, E. A Study on Perception and Adaptation of the Farmers toward Climate Change in the Western Region of Nepal. Asian J. Agric. Ext. Econ. Soc. 2020, 38, 1–8. [Google Scholar] [CrossRef] [Green Version]
  91. Sanderson, M.R.; Curtis, A.L. Culture, climate change and farm-level groundwater management: An Australian case study. J. Hydrol. 2016, 536, 284–292. [Google Scholar] [CrossRef]
  92. Yadeta, D.; Kebede, A.; Tessema, N. Climate change posed agricultural drought and potential of rainy season for effective agricultural water management, Kesem sub-basin, Awash Basin, Ethiopia. Theor. Appl. Climatol. 2020, 140, 653–666. [Google Scholar] [CrossRef]
  93. Liao, C.; Agrawal, A.; Clark, P.E.; Levin, S.A.; Rubenstein, D.I. Landscape sustainability science in the drylands: Mobility, rangelands and livelihoods. Landsc. Ecol. 2020, 35, 2433–2447. [Google Scholar] [CrossRef]
  94. Adane, G.B.; Hirpa, B.A.; Song, C.; Lee, W.-K. Rainfall Characterization and Trend Analysis of Wet Spell Length across Varied Landscapes of the Upper Awash River Basin, Ethiopia. Sustainability 2020, 12, 9221. [Google Scholar] [CrossRef]
  95. Phoumin, H.; Kimura, F. Cambodia’s energy poverty and its effects on social wellbeing: Empirical evidence and policy implications. Energy Policy 2019, 132, 283–289. [Google Scholar] [CrossRef]
  96. Krishnaiah, P. Assessing Rural Households’ Adaptive Capacity to Climate Variability: A Comparative Study from Three Agro-Climatic Zones in North-West Ethiopia. J. Acad. Ind. Res. 2019, 8, 104. [Google Scholar]
  97. Tinch, R.; Jäger, J.; Omann, I.; Harrison, P.A.; Wesely, J.; Dunford, R. Applying a capitals framework to measuring coping and adaptive capacity in integrated assessment models. Clim. Chang. 2015, 128, 323–337. [Google Scholar] [CrossRef]
  98. Kassegn, A.; Endris, E. Review on livelihood diversification and food security situations in Ethiopia. Cogent Food Agric. 2021, 7, 1882135. [Google Scholar] [CrossRef]
  99. Mesfin, D.; Simane, B.; Belay, A.; Recha, J.W.; Schmiedel, U. Assessing the Adaptive Capacity of Households to Climate Change in the Central Rift Valley of Ethiopia. Climate 2020, 8, 106. [Google Scholar] [CrossRef]
  100. Matewos, T. The state of local adaptive capacity to climate change in drought-prone districts of rural Sidama, southern Ethiopia. Clim. Risk Manag. 2020, 27, 100209. [Google Scholar] [CrossRef]
Figure 1. Location map of the study area.
Sustainability 13 09764 g001
Figure 2. Workflow of the study, the indicators, and their relationship with the sub- and major components of the IPCC–DVI (dot lines represent mathematical relationships). Temp. = temperature; RF = rainfall HH = household; TLU = tropical livestock unit; Agri.—agricultural; Prod. = production; WUA = water users’ association; WHT = water harvesting technologies; FA = farmers’ association; IPCC–DVI = Intergovernmental Panel on Climate Change–drought vulnerability index.
Sustainability 13 09764 g002
Figure 3. The spatial distribution of exposure to drought in upper Awash sub-basin.
Sustainability 13 09764 g003
Figure 4. The spatial distribution of sensitivity to drought in upper Awash sub-basin.
Sustainability 13 09764 g004
Figure 5. The spatial distribution of adaptive capacity to drought in upper Awash sub-basin.
Sustainability 13 09764 g005
Table 1. Characteristics of districts and the distribution of sample respondents.
Agroecological ZonesSample DistrictsAltitude (m)Major LivelihoodMajor Crop TypeMajor LivestockNumber of Respondents
Highland (HL)Dendi2300–3600Mixed farmingWheat, Barley, TeffSheep, Cattle, Equines132
Midland (ML)Adea1500–2300Mixed farmingTeff, Wheat, MaizeCattle, Sheep132
Lowland (LL)Fentale500–1500Agropastoralism and PastoralismSorghum, MaizeCamels, Goats, Chickens132
Table 2. Indicators and their definitions used to analyze vulnerability to drought and relationship (used with Figure 2).
AttributesIndicatorMeasures and ExplanationsRelationship
(− or +) to Attribute
Sources
Exposure[E1] PrecipitationSD Ave. monthly precipitation (mm) (1983–2016)[71]
[E2] Minimum temperatureSD Ave. monthly minimum temperature (°C) (1983–2016)+[71]
[E3] Maximum temperatureSD Ave. monthly maximum temperature (°C) (1983–2016)+[71]
[E4] Drought magnitudeSD Drought magnitude (SPEI) (1983–2016)+[60]
[E5] Drought durationSD Drought duration (SPEI) (1983–2016)+[60]
[E6] Drought frequencySD Drought frequency (SPEI) (1983–2016)[60]
[E7] Temperature increase% of HHs that did not perceive temperature increase+[72]
[E8] Number of hot days% of HHs that did not perceive hot days in a year increase+[72]
[E6] Rainfall decrease% of HHs that did not perceive rainfall decrease+[72]
[E9] Cessation of rainfall% of HHs that did not perceive early cessation of rainfall+[72]
[E10] Rainfall decreaseSD Ave. monthly precipitation (mm) (1983–2016)+[72]
Sensitivity[S1] Crop failure% of HHs reporting crop failure over the last 10 years+[9]
[S2] Production reduction% of HHs reporting crop production reduction in 10 years+[71]
[S3] Crop diseaseNumber of crop pests/diseases in 10 years+[8]
[S4] Livestock diseaseNumber of livestock diseases in 10 years+[8]
[S5] Human diseaseNumber of human diseases in 10 years+[8]
[S6] Local conflict% of HHs reporting local conflicts in 10 years+[49]
[S7] Food crisisNumber of food crisis occurred in 10 years+[52]
[S8] Rainfed landSize of rainfed agriculture land per household/Hectare+[60]
Adaptive Capacity[A1] HH head% of male-headed households+[73]
[A2] AgeAge of the HH head (year)[73]
[A3] Family sizeFamily size of the household+[73]
[A4] Residence lengthLength of residence of the HH head (year)+[73]
[A5] HealthAve. time to reach health institution (walking minutes)[58]
[A6] EducationAve. time to reach school (walking minutes)[52]
[A7] MarketAve. time to reach marketplace (walking minutes)[9]
[A8] Transport% HHs having access to transport services+[9]
[A9] Electricity% HHs having access to electricity utility at home+[54]
[A10] Health insurance% HHs having access to health insurance+[59]
[A11] LivestockLivestock in Total Livestock Unit (TLU)+[73]
[A12] LandSize of cultivated farmland (ha)+[73]
[A13] AssetsMonetary value of productive assets (Birr)+[49]
[A14] Credit access% HHs reporting availability of credit access+[56]
[A15] Credit amountAmount of accessed credit for productive works+[49]
[A16] Equipment% of HHs having full agricultural equipment+[74]
[A17] Sprinkler% of HHs having irrigation sprinkler+[75]
[A18] Water pumping% of HHs having irrigation water pumping generator+[75]
[A19] WHT% of HHs using water harvesting technologies+[75]
[A20] Chemical fertilizerAmount of farm chemical fertilizers used (kg)+[76]
[A21] Organic fertilizerAmount of farm organic fertilizers used (kg)+[76]
[A22] Pesticide/herbicideAmount of farm pesticides/herbicides used (Liter)+[76]
[A23] Improved seedAmount of farm improved seeds used (kg)+[76]
[A24] Crop varietyCrop diversity score+[54]
[A25] On-farm incomeAnnual on-farm income (Birr)+[56]
[A26] Non-farm incomeAnnual non-farm income (Birr)+[56]
[A27] Off-farm incomeAnnual off-farm income (Birr)+[56]
[A28] SavingAmount of cash saved (Birr)+[59]
[A29] Additional work% of HHs engaged in additional works besides farming+[54]
[A30] Irrigation water% of HHs having access to irrigation water+[49]
[A31] Migrant labor% of HHs working as a migrant labor+[58]
[A32] FoodVariety of food consumed in the HH per 24 h+[58]
[A33] Farmers association% of HHs having membership of Farmers Association+[49]
[A34] WUA% of HHs having membership of Water Users Association+[77]
[A35] EdirNumber of “edir” a household has+[49]
[A36] Trust WUA% of HHs trusting Water Users Association+[77]
[A37] Market information% of HHs having access to market information+[52]
[A38] Cell phoneNumber of cellphones in the household+[78]
Table 3. Exposure drought vulnerability index along with indexed major and sub-components.
Sub-Component (Indicators)HLMLLLComponentHLMLLL
PRCP0.2490.2270.242Climate change
MINT0.4430.6360.6290.3760.4390.436
MAXT0.4370.4550.439
DRM0.4620.4990.443Drought risk
DRD0.6250.7850.8000.6090.4610.610
DRF0.7390.4380.588
TI-HH0.1110.2620.312Climate perception
HD-HH0.2270.3610.1750.2050.4410.250
RFD-HH0.3180.4250.231
ECR-HH0.1640.7140.283
Exposure 0.3960.4470.432
SPEI = standard precipitation and evapotranspiration index; PRCP = standardized average monthly precipitation (mm) (1983–2016); MINT = standardized average monthly minimum temperature (°C) (1983–2016); MAXT = standardized average monthly maximum temperature (°C) (1983–2016); DRM = standardized drought magnitude (SPEI) (1983–2016); DRD = standardized drought duration (SPEI) (1983–2016); DRF = standardized drought frequency (SPEI) (1983–2016); TI-HH = % of HHs that did not perceive temperature increase; HD-HH = % of HHs that did not perceive hot days in a year increase; RFD-HH = % of HHs that did not perceive rainfall decrease; ECR-HH = % of HHs that did not perceive early cessation of rainfall.
Table 4. Farm typologies with exposure indicators (mean and standard deviations for continuous variables, and frequency percentages for dummy variables).
IndicatorsHLMLLLTotal
1
(N = 94)
2
(N = 30)
3
(N = 8)
Sub-Total
(N = 132)
1
(N = 63)
2
(N = 51)
3
(N = 18)
Sub-Total
(N = 132)
1
(N = 112)
2
(N = 11)
3
(N = 9)
Sub-Total
(N = 132)
1
(N = 269)
2
(N = 92)
3
(N = 35)
TI-HH8.410.308.318.82844.525.835.8011.130.32218.325.7
HD-HH16.841.412.52229.73661.136.48.3006.816.432.334.3
RFD-HH29.534.537.531.134.44466.742.47.328.609.121.638.742.9
ECR-HH13.724.112.515.964.17877.871.222.942.927.329.529.555.957.1
1 = livestock and on-farm-income based; 2 = marginal and off-farm-income based; 3 = intensive-irrigation-farming based.
Table 5. Sensitivity DVI along with indexed major and sub-components.
Sub-Component (Indicators)HLMLLLComponentHLMLLL
CFL-HH0.5680.1680.735Crop failure0.6750.5200.821
CPR-HH0.7810.8710.907
NPD0.1480.2080.224Diseases0.1330.1760.216
NLD0.0910.0610.288
NHD0.1600.2600.137
LCF-HH0.1060.1360.144Crisis0.2340.3360.222
NFC0.1130.3700.154
RFL0.4820.5020.367
Sensitivity 0.3470.3440.420
CFL-HH = % of HHs reporting crop failure over the last 10 years; CPR-HH = % of HHs reporting crop production reduction in 10 years; NPD = number of crop pests/diseases in 10 years; NLD = Number of livestock diseases in 10 years; NHD = number of human diseases in 10 years; LCF-HH = % of HHs reporting local conflicts in 10 years; NFC = number of food crisis occurred in 10 years; RFL = size of rainfed agriculture land per household/hectare.
Table 6. Farm typologies with sensitivity indicators (mean and standard deviations for continuous variables, and frequency percentages for dummy variables).
IndicatorsHLMLLLTotal (N = 396)
1 (N = 94)2 (N = 30)3 (N = 8)Sub-Total (N = 132)1 (N = 63)2 (N = 51)3 (N = 18)Sub-Total (N = 132)1 (N = 112)2 (N = 11)3 (N = 9)Sub-Total (N = 132)1 (N = 269)2 (N = 92)3 (N = 35)
CFL-HH51.624.112.543.293.89488.993.230.37.111.126.55359.151.4
CPR-HH78.676.765.673.69389.58689.590.669.772.277.486.982.577.8
NPD1.33 ± 1.62.21 ± 3.60.88 ± 1.31.49 ± 2.20.84 ± 1.90.7 ± 0.70.56 ± 0.70.75 ± 1.41.61 ± 0.91.79 ± 11.44 ± 0.51.62 ± 0.91.33 ± 1.41.33 ± 2.20.86 ± 0.9
NLD0.83 ± 1.20.48 ± 0.80.38 ± 0.70.73 ± 1.10.63 ± 1.30.72 ± 0.70.28 ± 0.40.61 ± 11.43 ± 0.91.57 ± 11.33 ± 0.51.44 ± 0.91.03 ± 1.10.77 ± 0.80.57 ± 0.6
NHD0.48 ± 0.60.59 ± 0.60.13 ± 0.30.48 ± 0.60.5 ± 0.50.66 ± 0.50.22 ± 0.40.52 ± 0.51.31 ± 0.91.93 ± 2.31.22 ± 0.41.37 ± 1.10.82 ± 0.80.83 ± 1.10.46 ± 0.6
LCF-HH21.933.35027.518.866.75035.359.40037.311.916.111.4
NFC0.44 ± 0.60.52 ± 0.50.38 ± 0.50.45 ± 0.60.77 ± 0.40.78 ± 0.50.56 ± 0.50.74 ± 0.51.56 ± 1.41.5 ± 0.71.33 ± 0.51.54 ± 1.30.97 ± 1.10.81 ± 0.60.91 ± 1
RFL1.2 ± 1.10.62 ± 0.70.96 ± 1.61.1 ± 1.10.92 ± 0.81 ± 0.81.5 ± 1.11 ± 0.90.82 ± 0.80.47 ± 0.30.42 ± 0.30.75 ± 0.81 ± 0.90.82 ± 0.71.1 ± 1.2
1 = livestock and on-farm-income based; 2 = marginal and off-farm-income based; 3 = intensive-irrigation-farming based.
Table 7. Adaptive capacity DVI along with indexed major and sub-components.
Sub-Component (Indicators)HLMLLLComponentHLMLLL
M-HH0.8030.8330.909Sociodemographics
Age HH0.64106690.6740.5900.6030.593
FS-HH0.3910.4780.312
LR-HH0.5240.4330.478
D-HI0.2110.3740.242Access to Infrastructure
D-Sc0.1230.2670.1700.2930.5070.284
D-MP0.1170.4010.202
AT-HH0.9390.8790.992
AE-HH0.2800.6520.100
AHI-HH0.0910.4700.000
TLU0.1480.2370.221Wealth
Farmland0.1820.2400.1760.2520.2930.212
MV-PA0.1220.1560.188
AC-HH0.5150.2580.068
CA-HH0.0290.0320.021
AFE-HH0.5150.8330.598
EE-HH0.0910.0300.015Rural Technology
PG-HH0.0530.0830.008
WHT-HH0.4090.0450.1520.1260.0910.119
CF0.1530.1810.297
OF0.0900.2120.260
FPH0.0470.0120.093
FIS0.0400.0730.012
CDS0.5250.5760.402Livelihood Diversification
ONFI0.1270.1640.1180.2290.2780.175
NFI0.0780.1630.075
OFFI0.0270.0670.036
ACS0.1650.0400.072
AW-HH0.1670.3260.098
IW-HH0.5080.5680.598
ML-HH0.0610.2880.008
VF-HH0.4000.3080.172
FA-HH0.1290.4170.189Social Networks
WUA-HH0.1210.0980.0150.3570.5060.333
NE-HH0.4660.5660.216
TWUA-HH0.2050.3640.144
MRI-HH0.9320.7730.758
NCP-HH0.2880.8180.674
Adaptive Capacity 0.3080.3800.288
M-HH = % of male-headed households; Age HH = age of the HH head (year); FS-HH = family size of the household; LR-HH = length of residence of the HH head (year); D-HI = A= average time to reach health institution (walking minutes); D-Sc = average time to reach school (walking minutes); D-MP = average time to reach marketplace (walking minutes); AT-HH = % HHs having access to transport services; AE-HH = % HHs having access to electricity utility at home; AHI-HH = % HHs having access to health insurance; TLU = livestock in total livestock unit; Farmland = size of cultivated farmland (ha); MV-PA = monetary value of productive assets (Birr); AC-HH = % HHs reporting availability of credit access; CA-HH = amount of accessed credit for productive works; AFE-HH = % of HHs having full agricultural equipment; EE-HH = % of HHs having irrigation sprinkler; PG-HH = % of HHs having irrigation water pumping generator; WHT-HH = % of HHs using water harvesting technologies; CF = amount of farm chemical fertilizers used (kg); OF = amount of farm organic fertilizers used (kg); FPH = amount of farm pesticides/herbicides used (liter); FIS = amount of farm improved seeds used (kg); CDS = Crop diversity score; ONFI = annual on-farm income (Birr); NFI = annual non-farm income (Birr); OFFI = annual on-farm income (Birr); ACS = amount of cash saved (Birr); AW-HH = % of HHs engaged in additional works besides farming; IW-HH = % of HHs having access to irrigation water; ML-HH = % of HHs working as a migrant labor; VF-HH = variety of food consumed in the HH per 24 h; FA-HH = % of HHs having membership in a farmers’ association; WUA-HH = % of HHs having membership in a water users association; NE-HH = number of “edir” a household has; TWUA-HH = % of HHs trusting a water users association; MRI-HH = % of HHs having access to market information; NCP-HH = number of cellphones in the household.
Table 8. Farm typologies with adaptive capacity indicators (mean and standard deviation for continuous variables, and frequency percentages for dummy variables).
IndicatorsHLMLLLTotal
1 (N = 94)2 (N = 30)3 (N = 8)Sub-Total (N = 132)1 (N = 63)2 (N = 51)3 (N = 18)Sub-Total (N = 132)1 (N = 112)2 (N = 11)3 (N = 9)Sub-Total (N = 132)1 (N = 269)2 (N = 92)3 (N = 35)
M-HH82.175.97580.373.49010083.391.792.977.890.9848688.8
Age HH42 ± 1237 ± 1148 ± 1341 ± 1241 ± 1444 ± 13.142 ± 1242 ± 1339 ± 1238 ± 735 ± 739 ± 1140 ± 1241 ± 1242 ± 12
FS-HH3.8 ± 1.43.5 ± 1.53.9 ± 23.7 ± 1.63.7 ± 1.84.2 ± 1.73.9 ± 1.74.6 ± 1.75.9 ± 1.85 ± 14.8 ± 24 ± 1.84.2 ± 1.74.1 ± 1.74.1 ± 1.9
LR-HH40 ± 1331 ± 1248 ± 1339 ± 1339 ± 1642 ± 1538 ± 1440 ± 1538 ± 1338 ± 735 ± 738 ± 1339 ± 1438 ± 1440 ± 13
D-HI26 ± 1923 ± 1522 ± 825 ± 1824 ± 2748 ± 3527 ± 2834 ± 3230 ± 2027 ± 2128 ± 1630 ± 2027 ± 2237 ± 3026 ± 21
D-Sc21 ± 2322 ± 1236 ± 1322 ± 2115 ± 917 ± 1418 ± 1416 ± 1221 ± 1522 ± 1021 ± 721 ± 1419 ± 1819 ± 1323 ± 14
D-MP26 ± 2323 ± 1226 ± 1225 ± 2039 ± 3040 ± 3215 ± 1336 ± 3037 ± 2533 ± 1335 ± 736 ± 1033 ± 2334 ± 2623 ± 26
AT-HH10010010010092.29066.787.999.110010099.297.894.682.9
AE-HH29.52712.52870.3645065.29.214.311.19.8314531.4
AHI-HH8.413.809.142.24861.147000013.1.30.131.4
TLU6.3 ± 66 ± 912.8 ± 86.6 ± 72.9 ± 33 ± 25.3 ± 43.3 ± 311.3 ± 1116.6 ± 1614.8 ± 1412 ± 127.5 ± 76 ± 99.5 ± 9
Farmland1.3 ± 10.9 ± 0.81.4 ± 2.11.2 ± 1.11 ± 1.21.3 ± 0.92.4 ± 1.91.3 ± 1.31.2 ± 10.7 ± 0.30.8 ± 11.1 ± 11.2 ± 11 ± 0.81.8 ± 1.9
MV-PA1289 ± 1284927 ± 6671007 ± 7091193 ± 11532824 ± 31123148 ± 29844831 ± 36663220 ± 31891248 ± 9821997 ± 16811729 ± 14181360 ± 11231639 ± 19232282 ± 25053159 ± 3226
AC-HH43.26987.551.517.2285025.84.614.322.26.821.338.751.4
CA-HH3415 ± 12,6963472 ± 62664043 ± 52043465 ± 11,204721 ± 27341052 ± 25983972 ± 97091289 ± 4418155 ± 1039357 ± 9072222 ± 5068318 ± 16771446 ± 78191702 ± 41413538 ± 7705
AFE-HH52.644.862.551.582.88872.283.360.664.344.459.863.17162.9
EE-HH9.5006.83.105.62.31.8001.54.902.9
PG-HH5.33.412.55.36.3427.88.310013.73.217.1
WHT-HH33.758.662.540.96.3011.14.57.35055.615.216.425.834.3
CF146 ± 12498 ± 49173 ± 191137 ± 118405 ± 356567 ± 5941097 ± 639561 ± 54581 ± 89136 ± 80102 ± 8888 ± 89182 ± 234356 ± 492630 ± 672
OF54 ± 12139 ± 9793 ± 17454 ± 11947 ± 6845 ± 5715 ± 3242 ± 6131 ± 1642.5 ± 51.5 ± 425 ± 15043 ± 13137 ± 7029 ± 89
FPH31 ± 7819 ± 3819 ± 2328 ± 682.5 ± 23.5 ± 345 ± 1638.5 ± 601.5 ± 3.56 ± 61.5 ± 32 ± 412 ± 489 ± 2228 ± 117
FIS20 ± 5614 ± 2340 ± 5620 ± 5117 ± 4016 ± 293 ± 1114 ± 342 ± 56 ± 63 ± 52 ± 512 ± 4014 ± 2511 ± 31
CDS3.06 ± 13.07 ± 13.63 ± 13.10 ± 12.49 ± 13.12 ± 13.56 ± 12.88 ± 111.89 ± 12.73 ±2.56 ± 12.01 ± 12.44 ± 13.05 ± 13.31 ± 1
ONFI7826 ± 101566998 ± 52807737 ± 56477639 ± 904418,035 ± 15,65820,750 ± 25,32916,172 ± 21,10318,809 ± 20,45415,907 ± 20,03224,075 ± 24,56029,555 ± 47,79617,704 ± 23,38613,551 ± 16,59016,962 ± 21,95917,685 ± 28,785
NFI2710 ± 58087236 ± 676631,593 ± 23,6945455 ± 10,5777528 ± 13,67911,294 ± 16,70925,627 ± 24,84311,422 ± 17,5971638 ± 777613,135 ± 14,78820,444 ± 20,8454140 ± 11,4103424 ± 927410,306 ± 14,08025,658 ± 23,279
OFFI555 ± 34322103 ± 45585950 ± 16,0361222 ± 53381425 ± 33112842 ± 596510,255 ± 13,4683165 ± 7109308 ± 16434035 ± 636811,888 ± 18,4281493 ± 6022662 ± 28322791 ± 56039691 ± 15,109
ACS6593 ± 79807686 ± 757316,357 ± 13,1917425 ± 85235184 ± 79706869 ± 21,6996083 ± 92295945 ± 14,7764957 ± 14,30517,690 ± 22,00717,444 ± 22,0517159 ± 16,4205591 ± 10,9888753 ± 18,73811,353 ± 14,941
AW-HH11.6312516.723.43655.632.64.635.733.39.811.634.442.9
IW-HH48.455.262.550.853.15672.256.858.771.455.659.853.758.165.7
ML-HH6.33.412.56.128.1385.628.811.921.433.314.413.824.714.3
VF-HH2.61 ± 0.82.5 ± 0.62.75 ± 0.82.6 ± 0.82.58 ± 0.82.52 ± 0.72.44 ± 0.92.54 ± 0.81.97 ± 11.29 ± 0.41.44 ± 0.71.86 ± 0.92.34 ± 0.92.33 ± 0.72.26 ± 0.9
FA-HH11.613.82512.943.84816.741.720.214.311.118.922.832.317.1
WUA-HH11.610.32512.19.4125.69.82001.57.19.78.6
NE-HH2.3 ± 12.2 ± 0.72.25 ± 0.42.3 ± 0.92.7 ± 13 ± 12.8 ± 12.8 ± 11 ± 0.81 ± 11 ± 1.51 ± 0.91.9 ± 12.5 ± 12.2 ± 1
TWUA-HH17.927.62520.529.74244.436.416.57.1014.420.132.328.6
MRI-HH95.889.77593.287.57061.177.377.164.377.875.886.277.368.6
NCP-HH0.4 ± 0.70.3 ± 0.70.1 ± 0.30.3 ± 0.71.4 ± 11.7 ± 11.5 ± 11.5 ± 10.7 ± 0.60.9 ± 0.41.7 ± 1.30.8 ± 0.70.8 ± 0.91.1 ± 11.2 ± 1.3
1 = livestock and on-farm-income based; 2 = marginal and off-farm-income based; 3 = intensive-irrigation-farming based.
Table 9. Indexed major components, DVI contributing factors, and the overall DVI.
ComponentHLMLLLComponentHLMLLL
Climate change0.5900.6030.593Exposure
Drought Risk0.6090.4610.6100.3960.4470.432
Climate perception0.2050.4410.250
Crop failure0.6750.5200.821Sensitivity
Disease0.1330.1760.2160.3470.3440.420
Crisis0.2340.3360.222
Sociodemographics0.5900.6030.593Adaptive capacity
Access to infrastructure0.2930.5070.284
Wealth0.2520.2930.2120.3080.3800.288
Rural technology0.1260.0910.119
Livelihood diversification0.2290.2780.175
Social networks0.3570.5060.333
Overall DVI0.3500.3900.380
DVI = Sensitivity × (Exposure − Adaptive capacity)−3.045−4.257−1.956
Publisher’s Note: MDPI stays neutral with regard to jurisdictional claims in published maps and institutional affiliations.

