Article

Analysis Study of Current Transportation Status in Vietnam’s Urban Traffic and the Transition to Electric Two-Wheelers Mobility

Faculty of Energy Technology and Faculty of Electrical Engineering, Electric Power University, Hanoi 100000, Vietnam
*
Author to whom correspondence should be addressed.
Sustainability 2021, 13(10), 5577; https://doi.org/10.3390/su13105577
Submission received: 1 April 2021 / Revised: 27 April 2021 / Accepted: 14 May 2021 / Published: 17 May 2021

Abstract

:
In Vietnam’s major urban areas, private motorcycles are the main means of transportation that are suitable for socio-economic conditions, current transport infrastructure, and people’s habits. However, in recent years, the negative effects of a large number and high density of motorcycles in urban areas such as traffic congestion and noise and air pollution have resulted in a gradual change in the public’s opinion of private vehicle adoption, especially motorcycles. The public has also urged the authorities to issue policies of limiting or curving the growth in the number of private vehicles powered by fossil fuels in big cities. However, in order to achieve the goal, other alternative means of transport should be proposed to encourage people to move to a more sustainable and eco-friendly form of mobility. The alternatives also should be consistent with the average income level as well as social characteristics. In recent years, along with the development of a highly connected public transport network, efficient and less-polluting vehicles including electric two-wheelers have been emerging, thriving, and drawing more attraction from Vietnamese people and policy makers. The spread in the number of electric two-wheelers in Vietnam’s major cities may be a sign of the transition to a more sustainable and less-polluting means of transport as an alternative to gasoline-powered motorcycles. In this paper, the authors aim to analyze the current road traffic status in Vietnam’s major cities, as well as shed a light on the transition to the greener and more efficient alternative vehicles to motorcycles in Vietnam’s urban traffic. Several recommendations for encouraging this vehicle type development are also important outcomes of this paper.

1. Introduction

In Vietnam, road transportation plays a dominant role. In 2019, road vehicles transported about 26.8% of goods (million tons.km) and about 63.1% of passengers (million passengers.km) [1]. In 2030, the market shares of inter-provincial cargo transportation by road, railway, and inland waterway will be 51.2%, 7.9%, and 30.9%, respectively. The market shares of inter-provincial passenger transportation by road and railway will be around 92% and 4.7%, respectively [2]. In terms of urban traffic, with the high rate of urbanization and poor traffic infrastructure, meeting the mobility needs of urbanites becomes a major challenge.
The long-term state policies and orientations for urban transport are to build a highly connected and convenient public transport system. According to Decision No.355/QD-TTg [3] and Decision No.318/QD-TTg [2], by 2020, the proportion of public passenger transport in major cities in Vietnam will reach 25–30%. However, the current public transport share in big cities only meets 9–15% of the mobility demand, far lower than the target. Because of poor public transport services, private vehicles, especially motorbikes, are preferable.
The prevalence of private motorcycles in Vietnam’s urban traffic derives from many remarkable advantages including flexibility, suitability for short-distance travel, narrow road traffic condition, low land area occupation, and especially the purchase price and operation cost, which are consistent with living standard of the majority of people [4]. However, a large number and high density of private fossil fuel vehicles, of which motorcycles make up over 90%, put high pressure on traffic infrastructure, triggering traffic congestion as well as air and noise pollution in urban areas.
In recent years, with a young population structure (the median age in Vietnam is 32.5 years [5] and the population aged 15–24 accounts for 70% [6]) and improving average income per capita (Vietnam GNI per capita for 2019 was 2590 USD [7]), there has been an emergence of the more comfortable, safer, and/or greener means of transport. A significant change in the private car consumption in Vietnam has been witnessed recently. However, the expensive purchase price, tax, fees, and high operation costs are hindering the accessibility of this vehicle type. In addition, traffic congestion, lack of car parking, as well as poor urban transport infrastructure (land fund reserved for transportation is only about 7.5–9.75%) are also barriers to private car adoption.
Another notable transition also could be seen in the gradually increasing penetration of electric vehicles, especially electric bikes and electric motorcycles (hereafter referred to as electric two-wheelers or E2Ws), in Vietnam. With the current high rate of motorcycle ownership, the transition from gasoline-powered motorcycles to E2Ws is promising. E2Ws maintain the remarkable advantages that made motorcycles popular while adding other prominent advantages such as zero tailpipe emissions, better efficiency than internal combustion engine (ICE) vehicles, large potential for greenhouse gas (GHG) emissions reduction when coupled with a low-carbon electricity sector, less dependence on fossil fuel import, noise reduction, and provision of ancillary services to power systems [8]. Generally, the introduction of these greener means of transport would be a promising and sustainable solution to mitigating negative impacts of fossil fuel vehicles in urban traffic, and E2Ws could be seen as an alternative solution to replacing gasoline-powered motorcycles in Vietnam. However, although having high potential as well as a continuing growing market share, the deployment of these means of transport is still in the initial phase. In the scope of the literature, there has not been any comprehensively published research addressing the recent personal mobility evolution in Vietnam’s urban areas, especially the transition from fossil fuel motorcycles to E2Ws. Additionally, there are limited studies to assess the advantages and disadvantages of E2Ws in Vietnam as well as the trend of widespread usage of E2Ws in near future. Moreover, the lack of support policies of the government, guidelines on the infrastructure, people’s awareness, investment, and research on E2Ws in Vietnam are the main barriers. Hence, several essential questions for sustainable and successful development of E2Ws in Vietnam are raised as follows:
(1)
Whether the urban transportation characteristics of Vietnam are suitable or not for the development of E2Ws.
(2)
Analysis of benefits of E2Ws on: users, society in terms of environment, economics, health.
(3)
What is the trend of E2W employment in the medium and long-term in Vietnam?
(4)
What is key difficulty in deploying E2Ws in urban areas in Vietnam?
(5)
What solutions are needed in order to develop E2Ws suitable for specific conditions of Vietnam as a developing country?
In this paper, the authors conduct data acquisition and carefully study all signs and indicators of EV penetration and urban transport evolution in Vietnam. Hence, this paper is the first work assessing all aspects of the transition. The study also lays a foundation and is a good reference for policy makers as well as enterprises to encourage the development of EVs in Vietnam as an economic and sustainable transport solution. This study also provides a reference lesson to other developing countries with similar socio-economic conditions. It therefore makes a great contribution to the sustainable development of Vietnam in the transportation area and energy sector. Our study could be a useful reference for policy makers, people, researchers, and technology companies in this field.
The remaining paper is organized as follows: Section 2 introduces the current transportation status in Vietnam’s urban areas. Section 3 mentions the adverse effects of the overwhelming gasoline power motorcycles in urban traffic such as noise and air pollution, which urge the transition to electric two-wheeler mobility. In the last section, several recommendations for sustainable development of E2Ws in Vietnam are proposed and discussed carefully.

2. Current Transportation Status in Vietnam’s Urban Areas

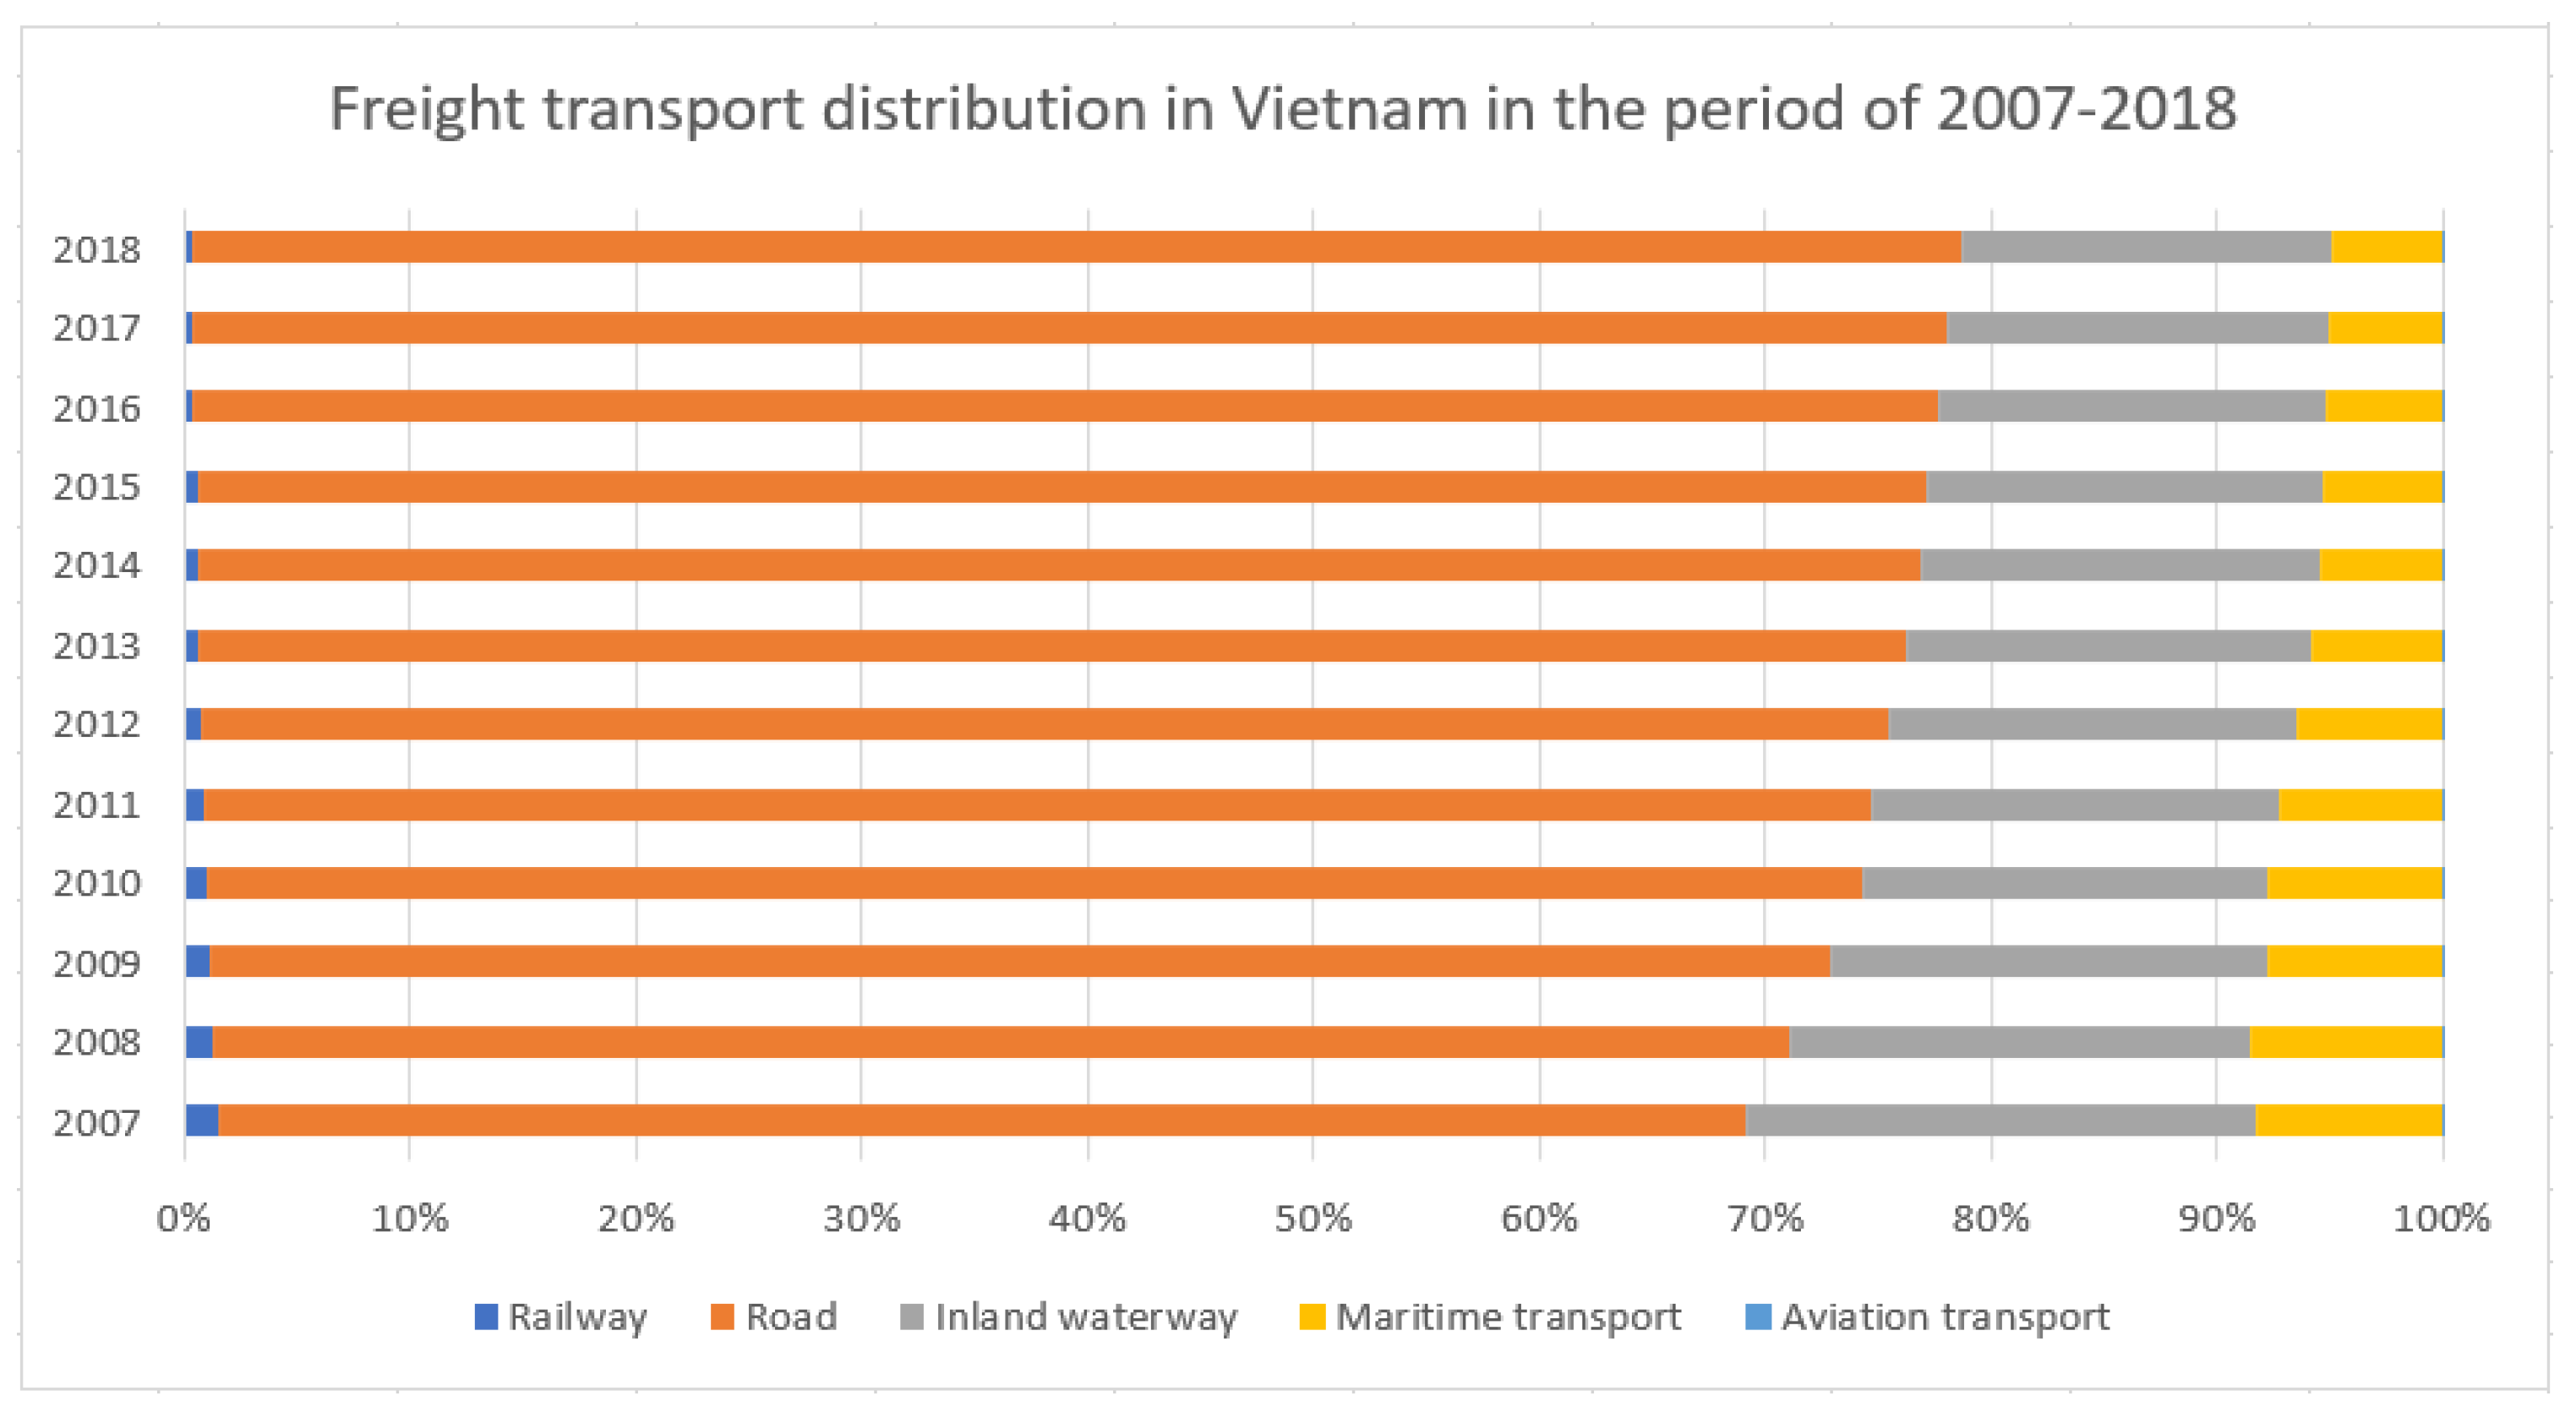
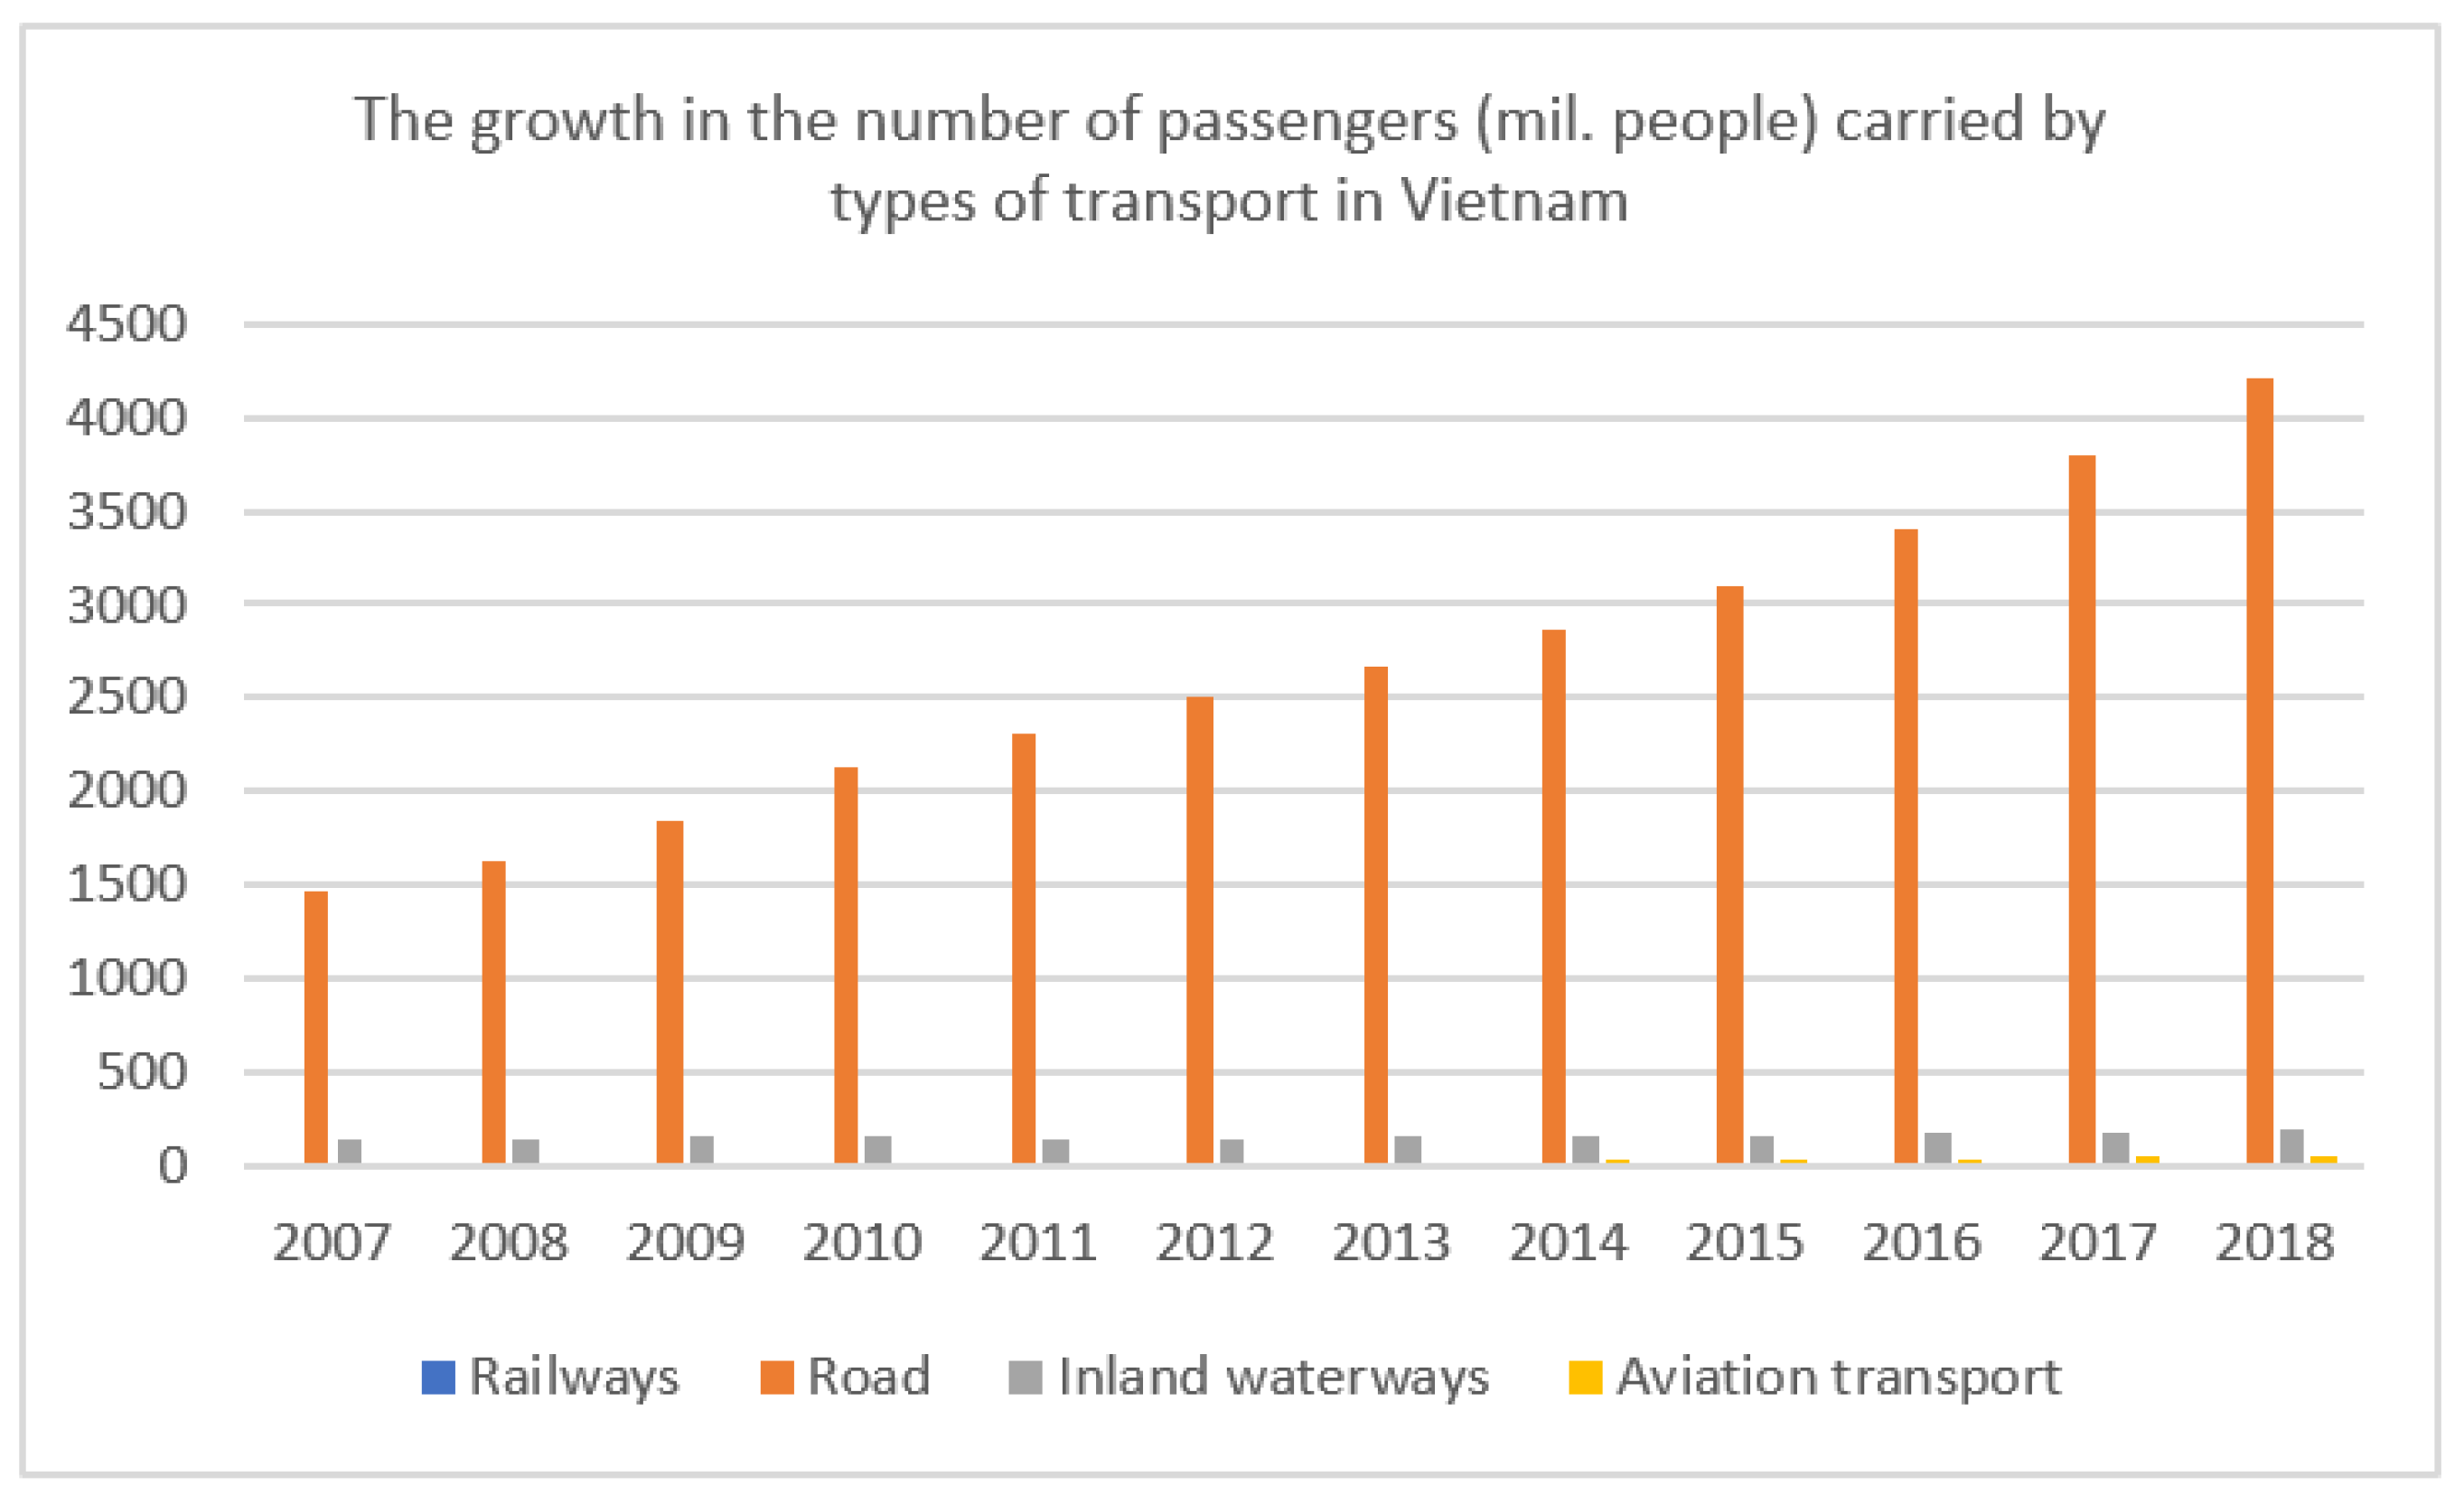
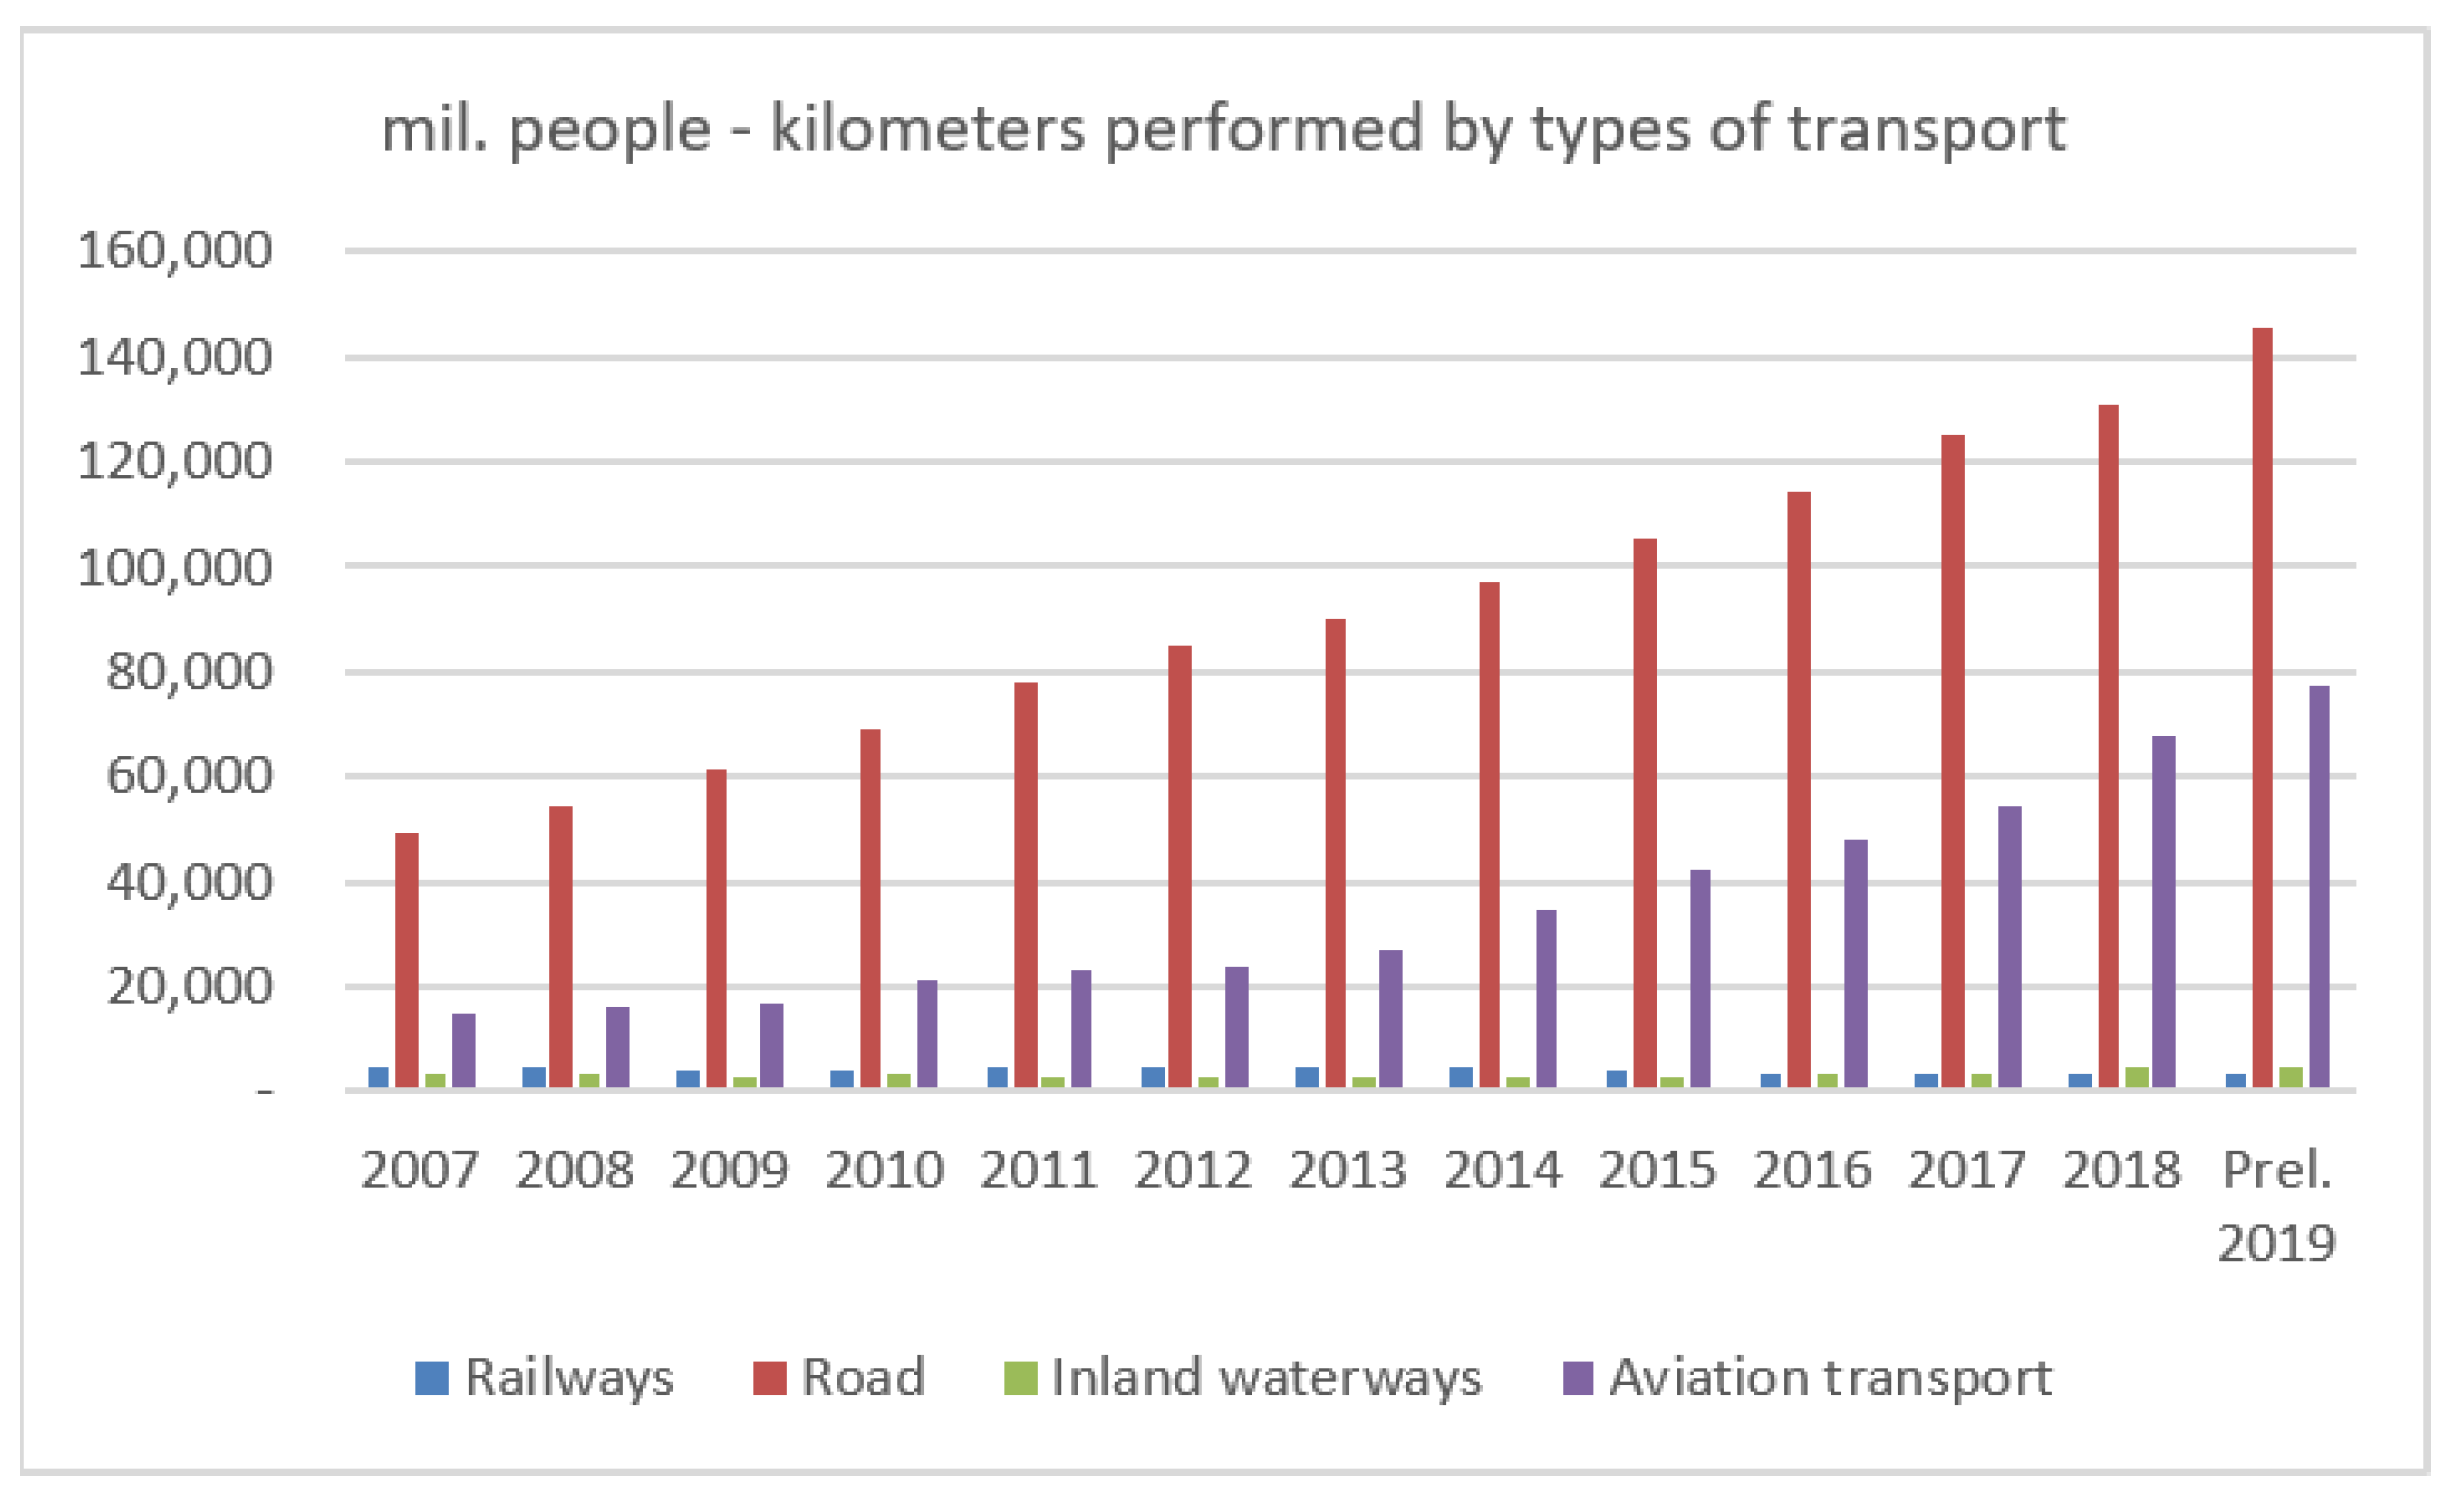
2.1. Dominant Share of Road Transporation

Road transport plays an important role in the transport complex of Vietnam because of its high mobility, door-to-door features, and its maneuverability. Road transport has received the greatest distribution and occupies a leading position in the transportation of passengers and freight. In Vietnam, road transport accounts for more than 77.4% of the volume of transported goods and 94% of the volume of passengers [9].
Table 1 and Figure 1 show the modal split of freight transport in Vietnam in the period of 2007–2018. Generally, road transport, inland waterways, and marine transport are the main modes of freight transport. However, road vehicles always express their salient role. In 2007, there was 403,361.8 tons of freight carried by road vehicles, followed by inland waterways with 135,282.8 tons. In 2018, roadways contributed up to 78.32% of the total volume of freight—a volume 4.78 times higher than the transportation capability of the second important transport mode—inland waterway. In the same period, a growth of 2.96 times in the volume of freight also could be seen in road transport, which highly outperforms the remaining transportations.
In terms of ton-kilometers performed and average travel distance, Table 2 depicts the share of domestic freight transport in Vietnam in 2016. Road vehicles are the preferable choice for short-range transportation. Nevertheless, in spite of shortest transport distance, road vehicles contributed up to 23.7% of total ton-kilometers of freight transport, reaching the second share of ton-kilometers transported.
With regard to passenger transport, the population growth, urbanization, business, commerce, and tourist activity have led to a rising demand for passenger mobility. In recent years, more than 4200 million passengers are transported by the roadway each year (Table 3). The growth in the number of passengers carried by types of transport in the period of 2007–2018 is shown in Figure 2. In correlation between other modes, roadways accounted for 94.4% of total passengers carried in 2018.
Table 4 and Figure 3 show the number of passengers traffic (million people.km) by types of transport. In 2019, roadway and aviation transport accounted for 96.5%, with the share of roadway approximately doubling air transport.
In terms of urban traffic, urban transportation services are mostly provided by private transportation, which is characterized by a dominating presence of motorcycles, a fast-growing number of cars, and decreasing number of bicycles. Public transportation services are composed of buses, taxis, motorcycle taxis, and cyclos (pedicabs). However, their share in urban transportation is low. “Personal mobility”—in the form of gasoline-powered scooters—is the heart of urban transportation. According to a United Nations report, Vietnam leads Southeast Asia in its reliance on motorized personal mobility. Motorcycles are currently responsible for about 80% of travel needs in the city.
In Hanoi, public transportation provides only about 15% of passenger trips, and in Ho Chi Minh City (HCMC) around 9%. The largest share of motorcycles nationwide is in the two main metropolises, with 15% in HCMC and 8.5% in Hanoi in 2010 (Ministry of Natural Resources and Environment (MONRE) and Ministry of Transport (MOT) 2012). Vehicles in HCMC accounted for one-third of total registered vehicles in Vietnam in 2012 (MONRE 2012). Judging from international experience, automobile ownership will increase as incomes rise. However, motorization rates (the number of automobiles per 1000 persons) remain below those in other countries at similar income levels, reflecting more barriers such as poorer traffic infrastructure and higher costs for automobiles, including import duties and other taxes [14].

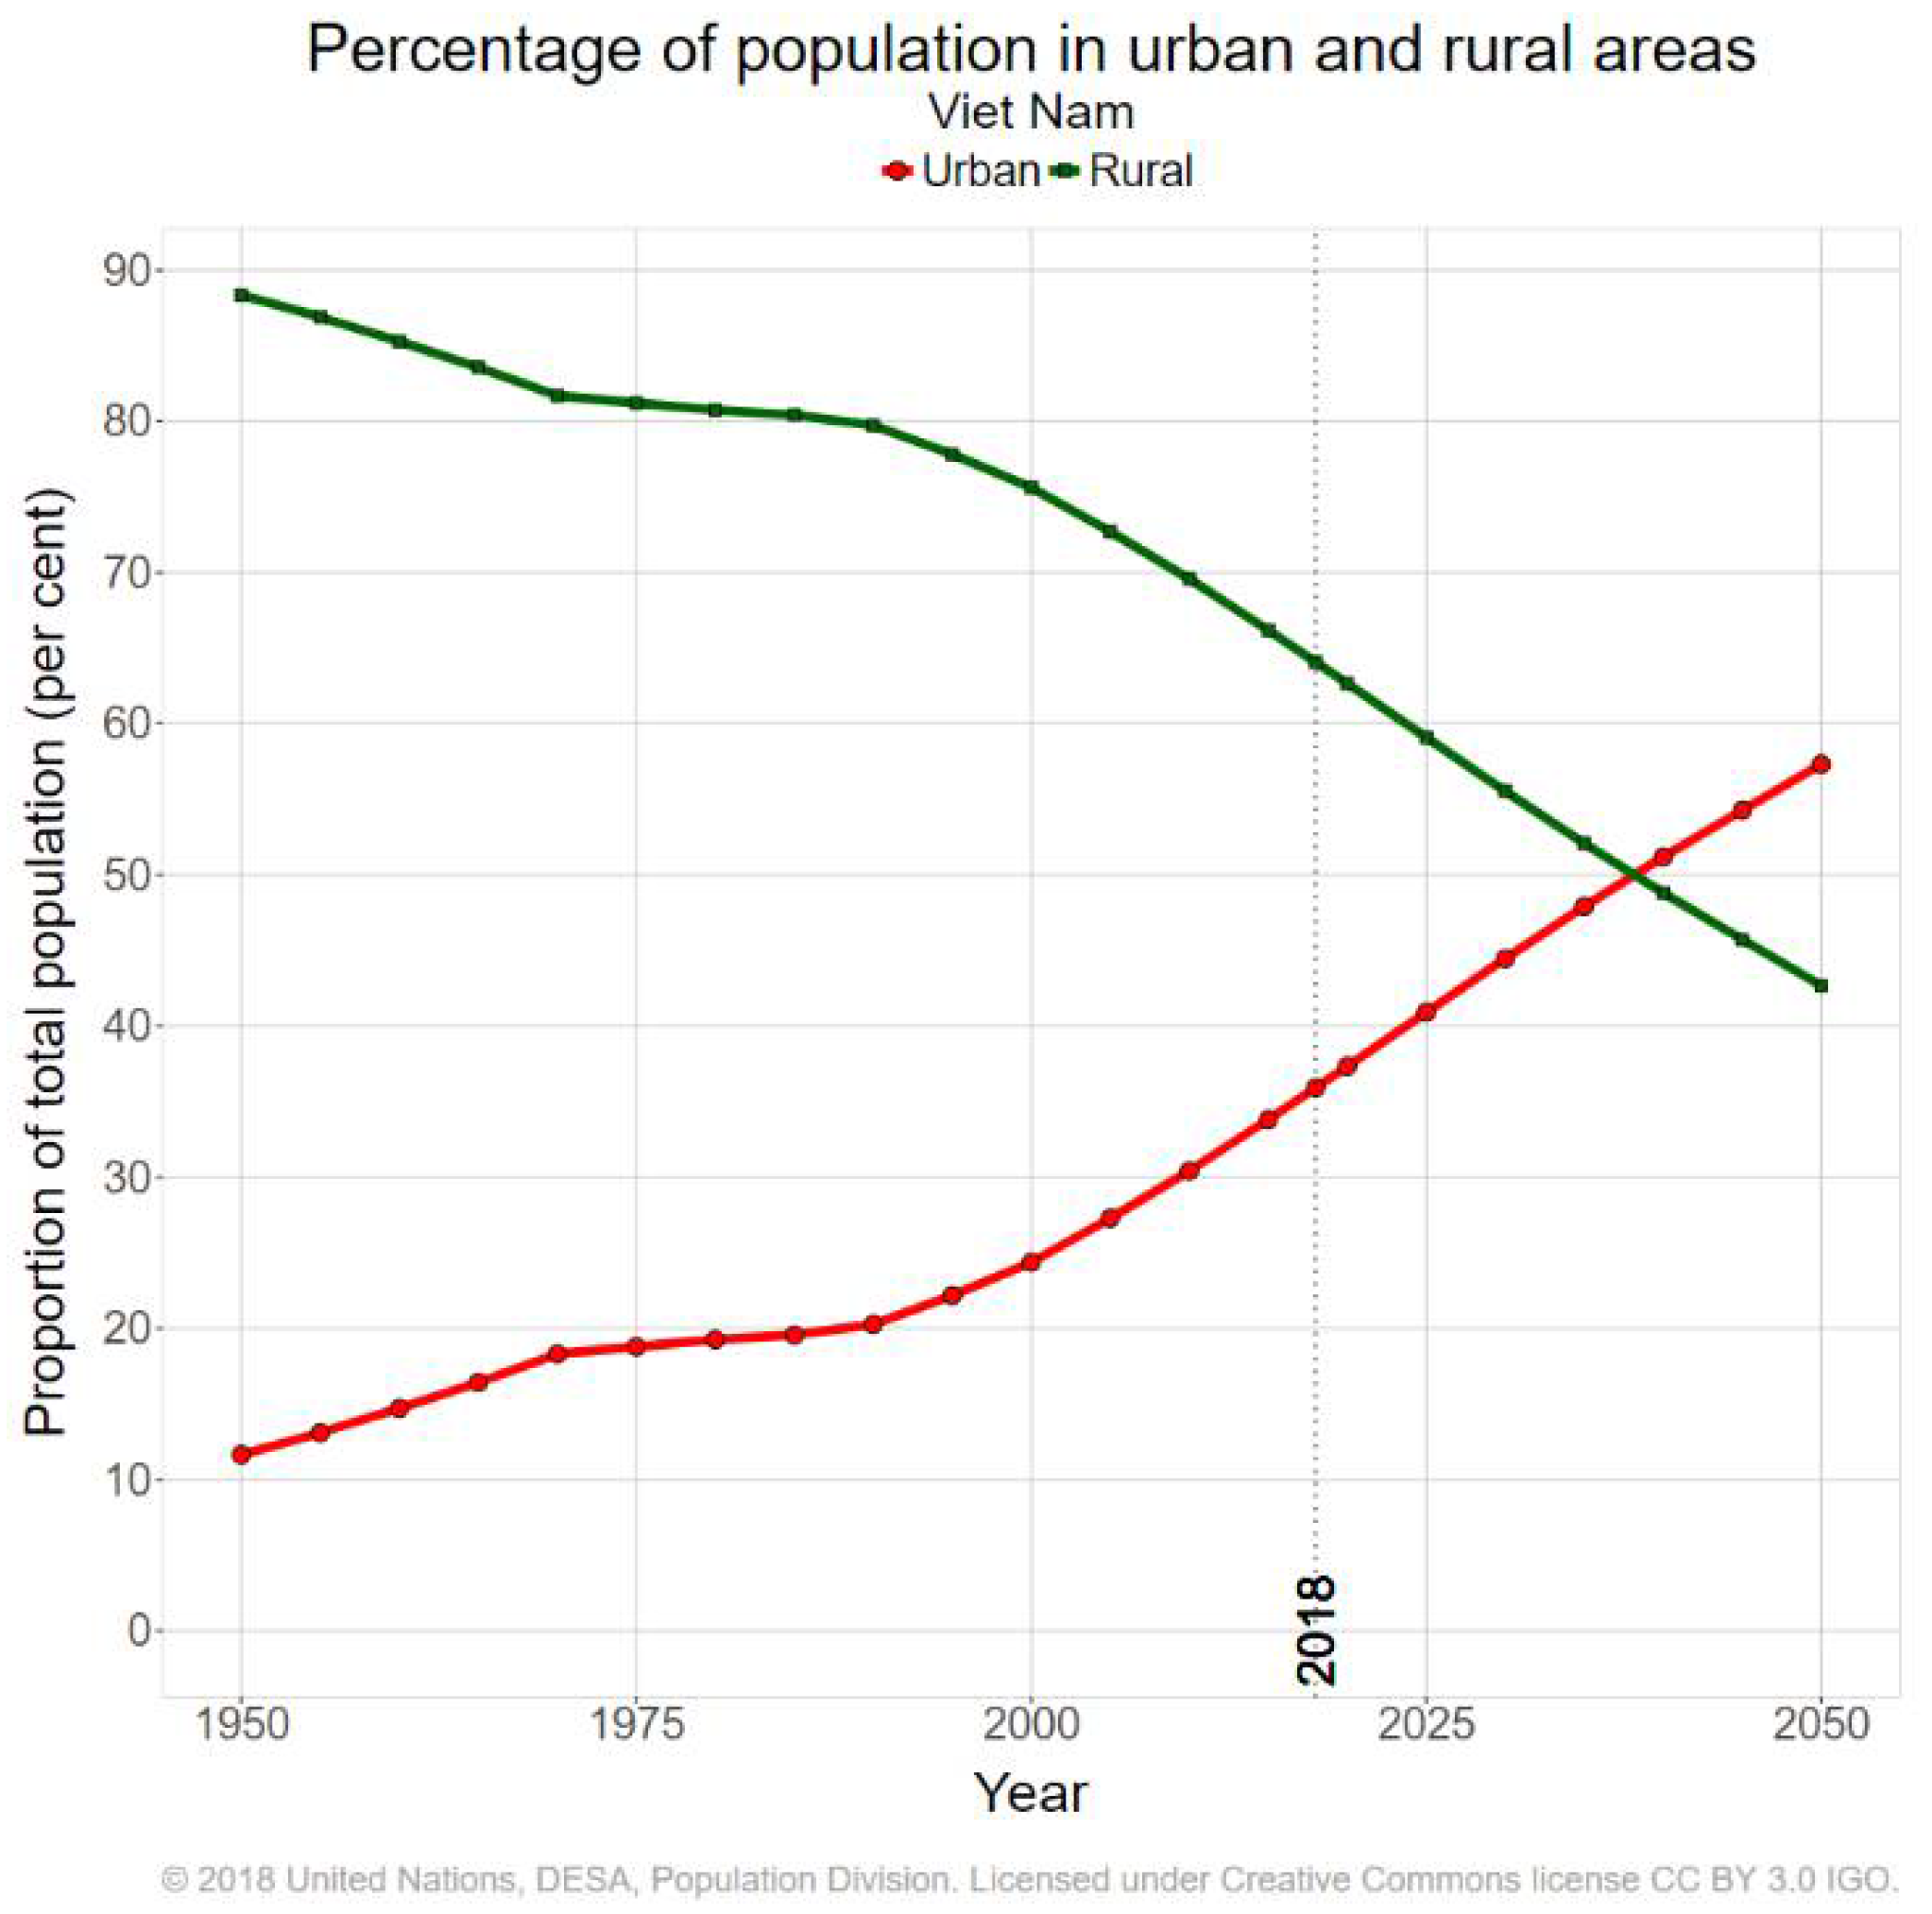
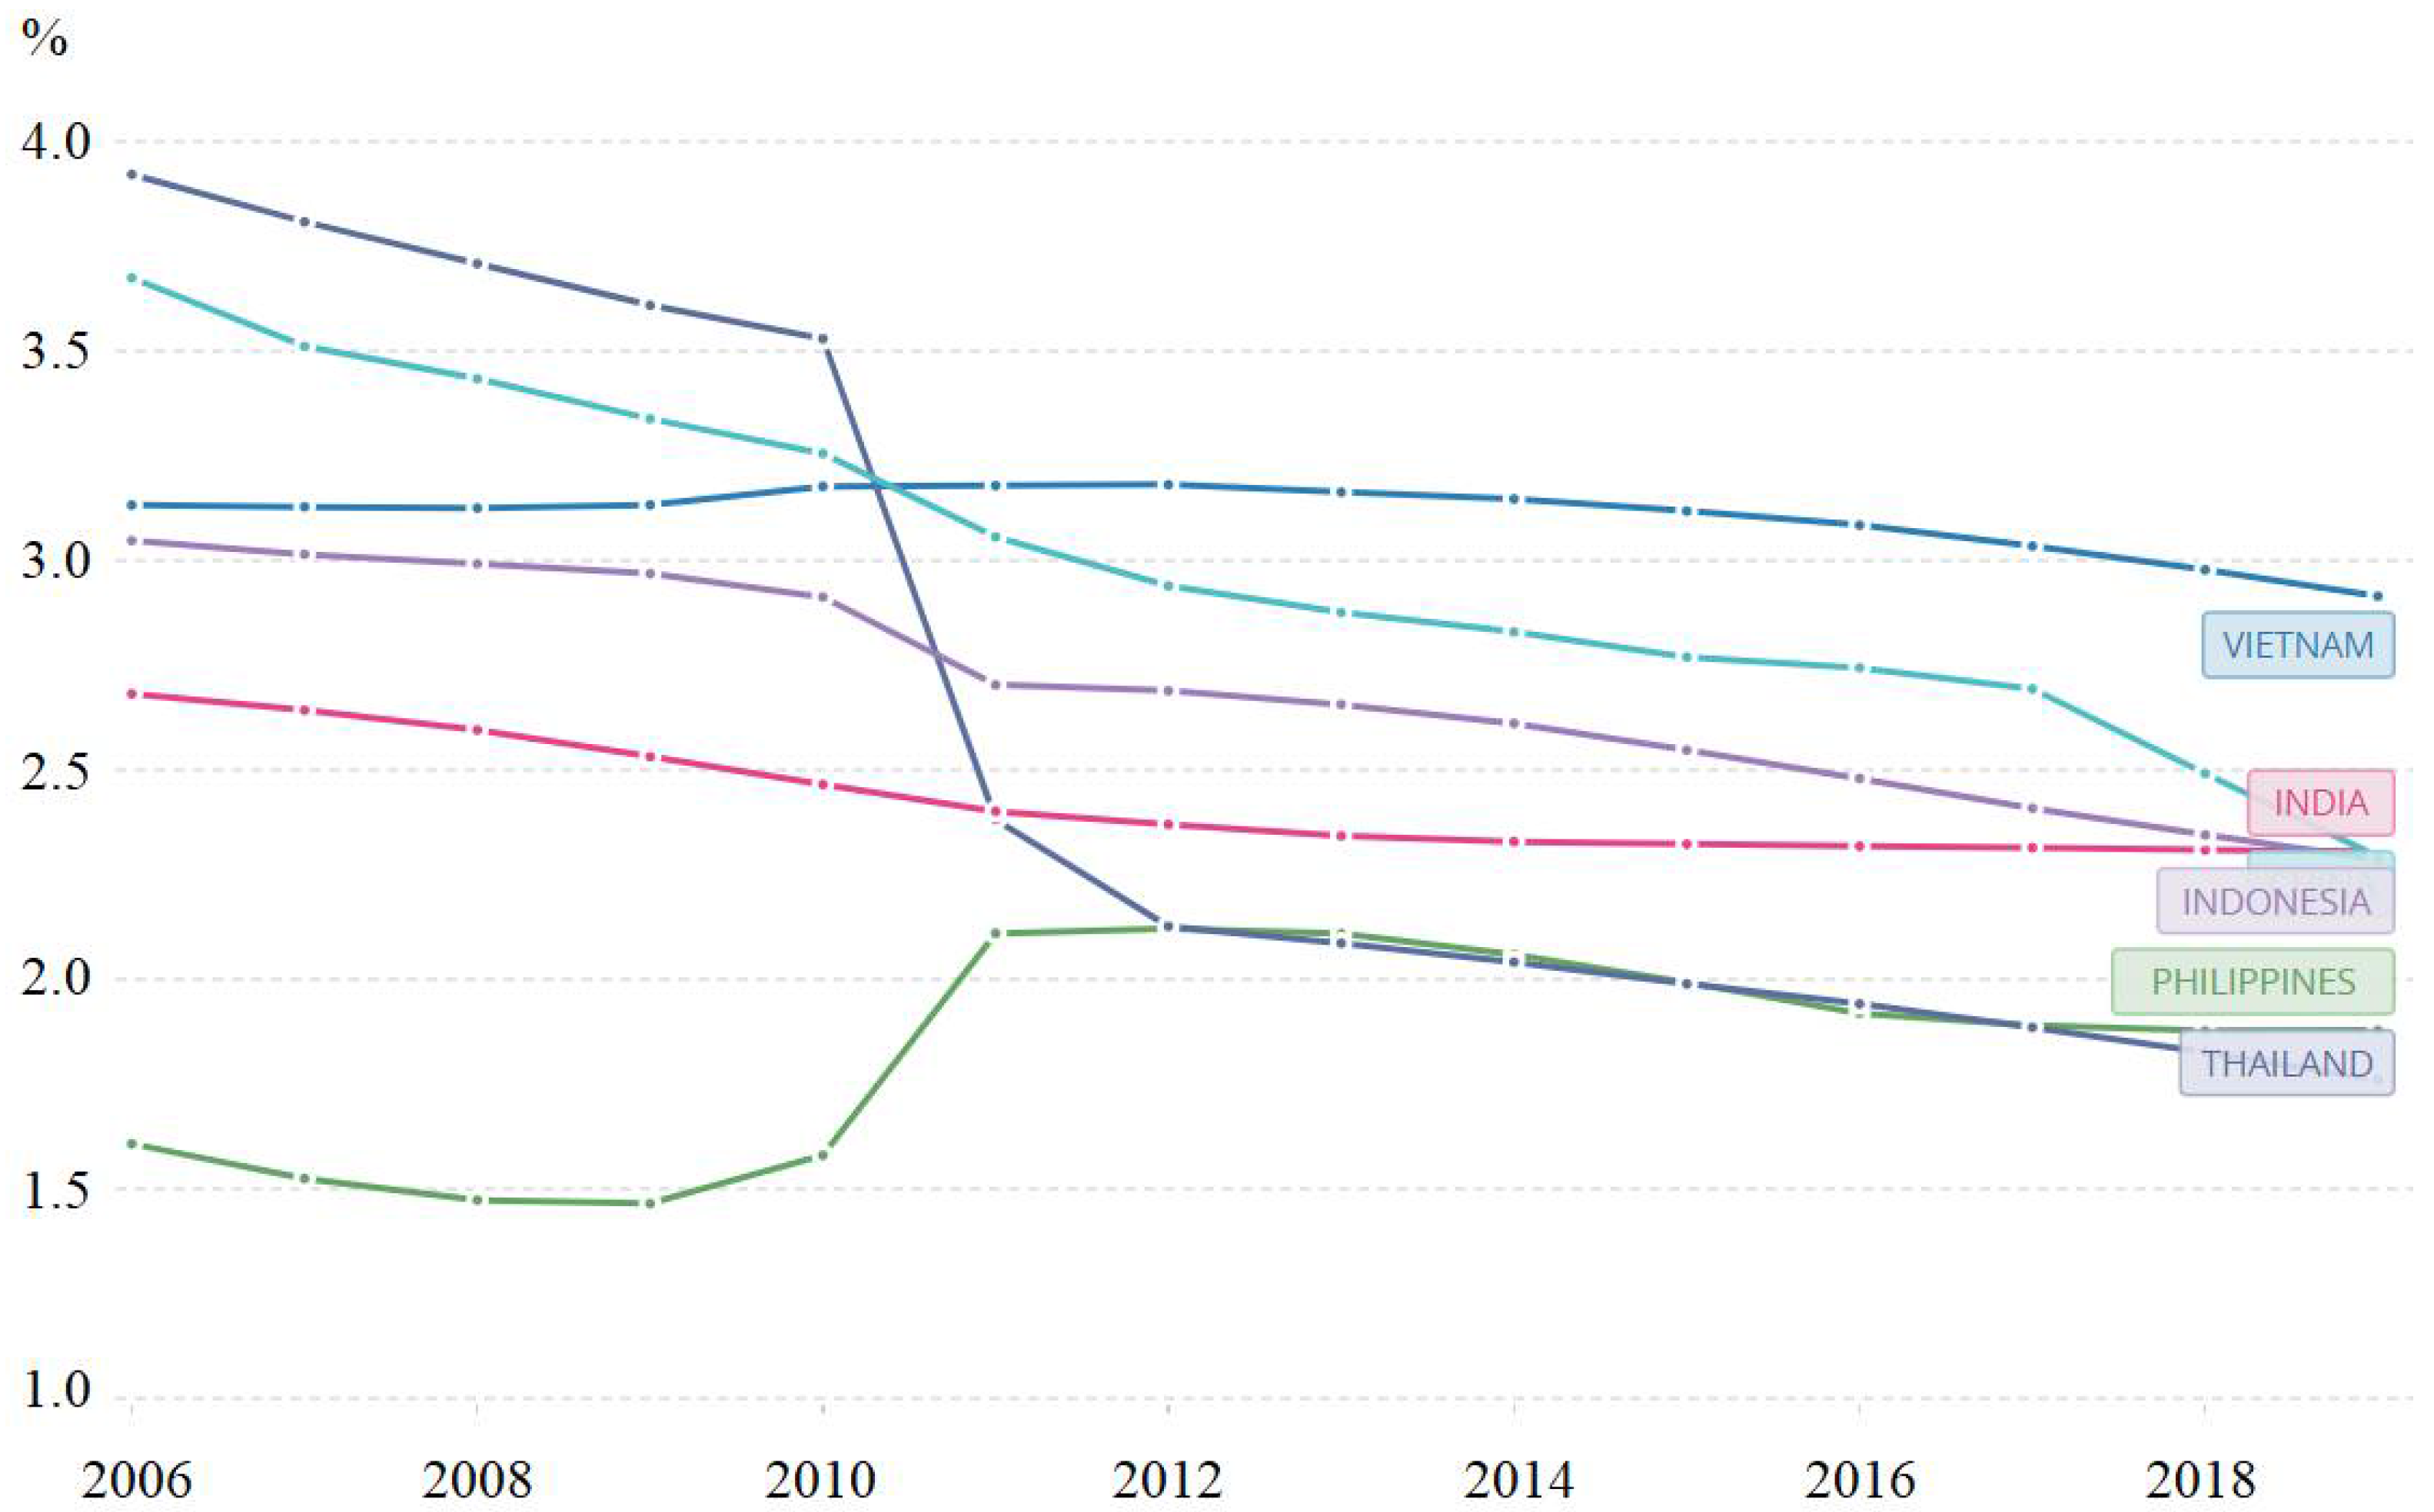
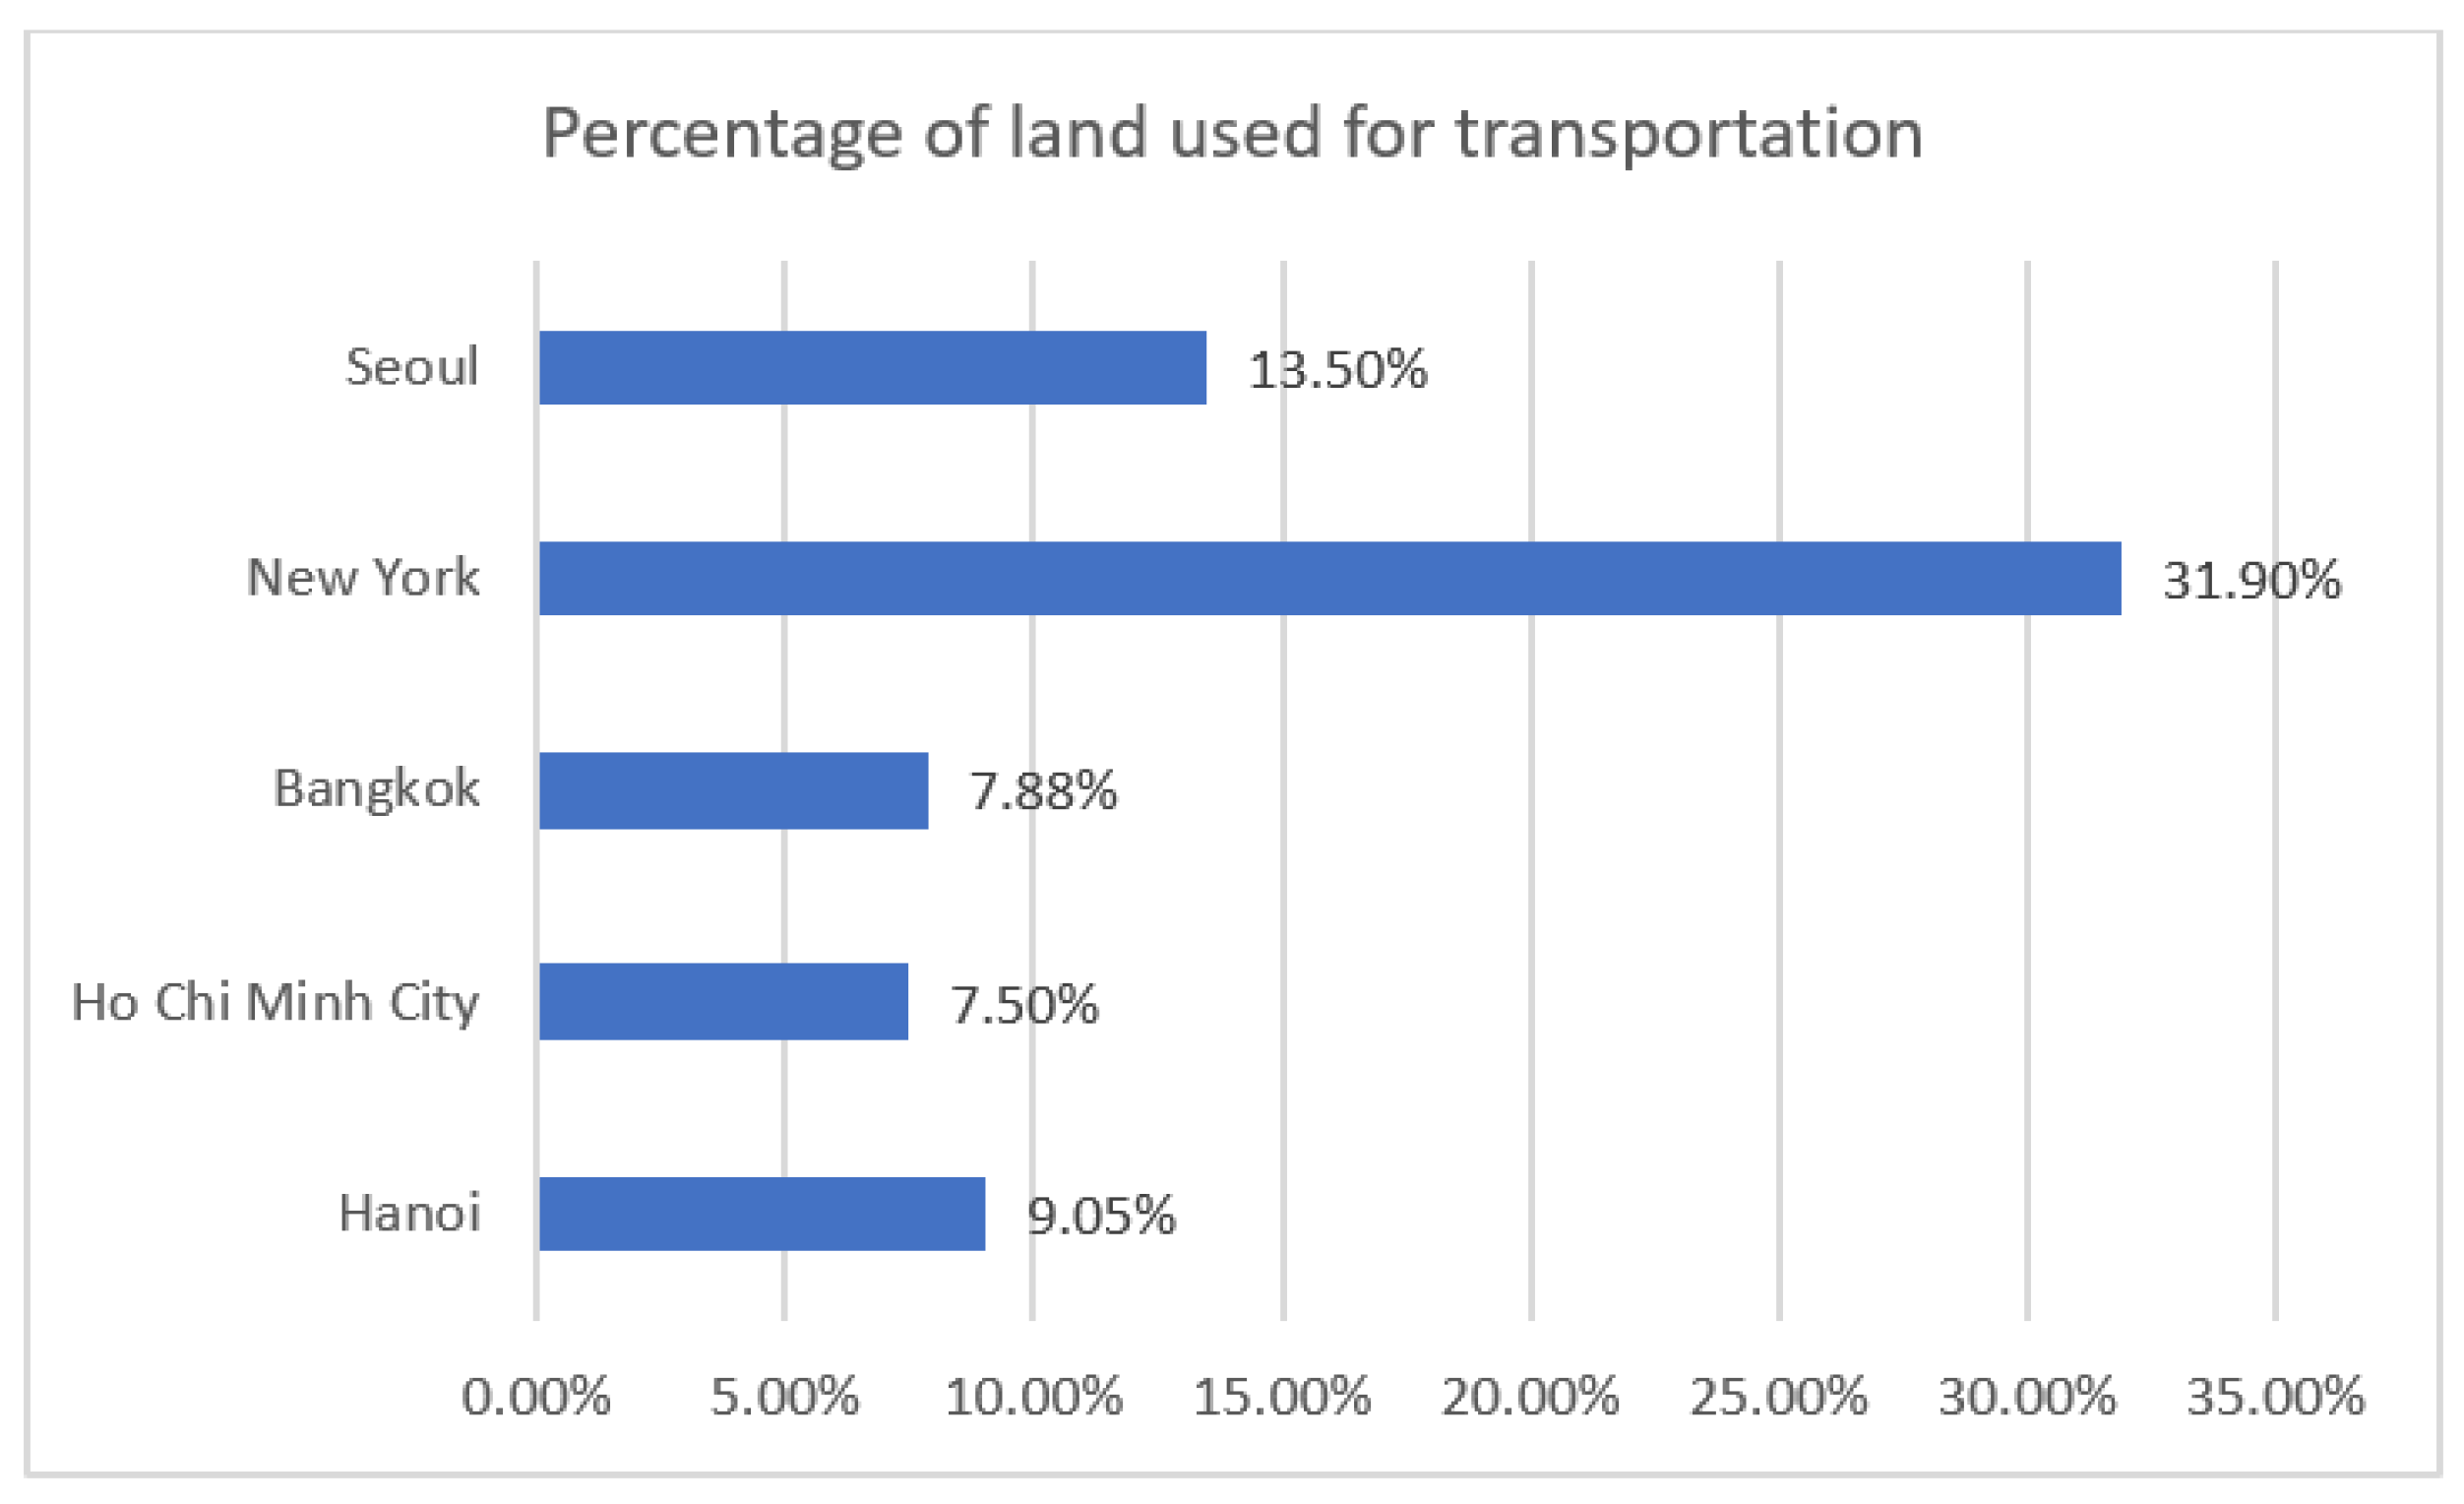
2.2. High Urbanization Rate and Inadequate Transport Infrastructure

Current global trends indicate a growth of about 50 million urbanites each year, roughly a million a week. More than 90% of that growth occurs in developing countries, which places intense pressures on urban infrastructures, particularly transportation, to cope [15].
Globally, more people live in urban areas than in rural areas, with 55% of the world’s population residing in urban areas in 2018. In 1950, 30% of the world’s population was urban, and by 2050, 68% of the world’s population is projected to be urban. There is significant diversity in the urbanization levels reached by different geographic regions [16].
The current population of Vietnam is 97,272,479 as of Thursday, 4 June 2020 based on the Worldometer elaboration of the latest United Nations data. Vietnam ranks number 15 in the list of countries (and dependencies) by population. A total of 37.7% of the population is urban [17]. It was forecasted that the share of the urban population will surpass the rural population by 2039 (Figure 4).
Compared to the global average, Vietnam’s urbanization level is still low but, in recent years, with 3% of annual growth in the urban population, the rate of urbanization in Vietnam is higher than the average in other developing countries as well as countries in Southeast Asia (Figure 5) [18].
According to statistics, the population of Hanoi increases by nearly 200,000 people each year [20]. Because high-rise buildings tend to cluster in the center (about 80% of high-rise buildings are located in Hanoi’s inner city) [21], there is a significant difference in population distribution between suburban and inner-city areas. Until September 2017, the average population density of Hanoi was about 2213 people per km2, concentrated in inner-city districts. In districts such as Dong Da, Ba Dinh, Hoan Kiem, Hai Ba Trung, Thanh Xuan, and Cau Giay, the average population density is over 30,500 people per km2. For instance, Dong Da district has 32,213 people per km2; this value is 45 times higher than Ba Vi district with 721 people per km2 [20].
The average number of inhabitants in HCMC’s peri-urban area is 5876 per km2 [22]. Other sources estimate a population density of roughly 4097 inhabitants per km2 for the entire metropolitan area [23]. However, the density in inner-city areas is much higher, with an average of 26,997 inhabitants per km2 and a peak of 44,135 inhabitants per km2 in the city’s 11th District. The city’s population swells beyond 8.7 million every day as workers travel in from neighboring provinces for business, while at least 200,000 to 400,000 people migrate from rural areas to the city every year [24].
The growing population of Vietnam, as well as people migrating from rural areas, contributes to an escalating number of inhabitants in the country’s already crowded cities, which contributes to further burdening of the urban traffic system.
Although the modernization of the transport infrastructure in urban areas has been accelerated, the unmet demand of Vietnam’s cities and its people is still great [25]. To be specific, the speed of infrastructure development only increases by about 3% per year; land area for transport rises by only 0.25–0.3% per year. This does not keep up with the annually average traffic growth of 10.2% [26]. Meanwhile, inner-city road expansion is very costly and time consuming. The prohibitive cost of clearance compensation for expanding roads put a high pressure on the city’s budget [20].
As reference [27], more than 10 million people live and work in HCMC. The number of vehicles is also very high with 6.2 million motorcycles, more than 600,000 cars, 2764 buses and trucks. In addition, about 1 million vehicles commute to and from the city every day. The number of taxis and contracted cars is more than 11,000 and 15,000 vehicles respectively. However, the land area for traffic is very low. By 2016, there was more than 4000 km of roads, and a road density is about 1.98 km/km2. As of 15 November 2016, the city had only 30 hectares of bus terminals and no taxi station (regarding planning, it needs 81 hectares for bus stops, and 3 hectares for taxis) [27].
In HCMC, the current rate of land for transportation is only about 7.5% (Figure 6) [28], while it must be projected to be 20–26% for the central urban area, 18–23% for satellite urban areas, and 16–20% for towns. The rate of parking lots on urban construction areas is less than 1% (3–4% required) [29].
With a population of 7,216,000 people, about 5 million motorbikes and 535,000 cars, the rate of using motor vehicles in Hanoi is more than 70%. The road density in Hanoi’s inner city is only about 0.74 km/km2, while the required value is 6.5–8 km/km2. The percentage of land for static traffic in Hanoi is only 0.3%, while the required proportion is between 3 and 5%. With increasing population density and high number of vehicles, traffic congestion in Hanoi and HCMC would be a challenge and require comprehensive measures to tackle [27].
According to the data of the Hanoi Department of Transport and Communications, in the past five years (2015–2020), the ratio of transportation land area to urban construction area has increased by only 0.3% each year. To be specific, in 2015, land ratio reserved for transportation was 8.65%. This increased to 8.83% and 9.0% in 2016 and 2017 respectively. By the end of 2019, the transportation land fund was 9.75% compared to 32% in Manhattan (New York, NY, USA) (Figure 6). The land devoted to transportation is expected to be 10.05% in 2020 [30]. The World Bank (WB) in 2011 calculated that, if the number of cars reached a moderate level as in Malaysia, then the entire capital of Hanoi would be paralyzed and unable to move [31].
Land use planning for roads should include land for parking lots (at least 1% of urban land, 10% of central land), whereas now, the land for static traffic has not reached 1% (the world standard, countries generally have to be from 3% to 3.5%). Even in small towns, the percentage of land allocated to static traffic is much smaller than required. This is partly due to the fact that compensation and clearance costs are too high, so the land area for parking lots is not paid much attention [28].
Considering effective land use of means of transport, buses have made positive contributions to reducing congestion: The area of occupancy dynamically for a bus ridership is 1.5–2 m2, while that for a person riding motorbikes is 8–12 m2 and for a car is 24–26 m2 [32]. With a modest land budget for transportation, narrow road conditions, and lack of parking spaces, it is clear that motorcycles would be more consistent than private cars in urban traffic. The long-term solution of the government is to develop an effective and high convenient public transport system. However, the authorities also should consider improving transit services as well as encouraging more effective and sustainable vehicles for easier public transport access and solving the first-mile/last-mile problem.

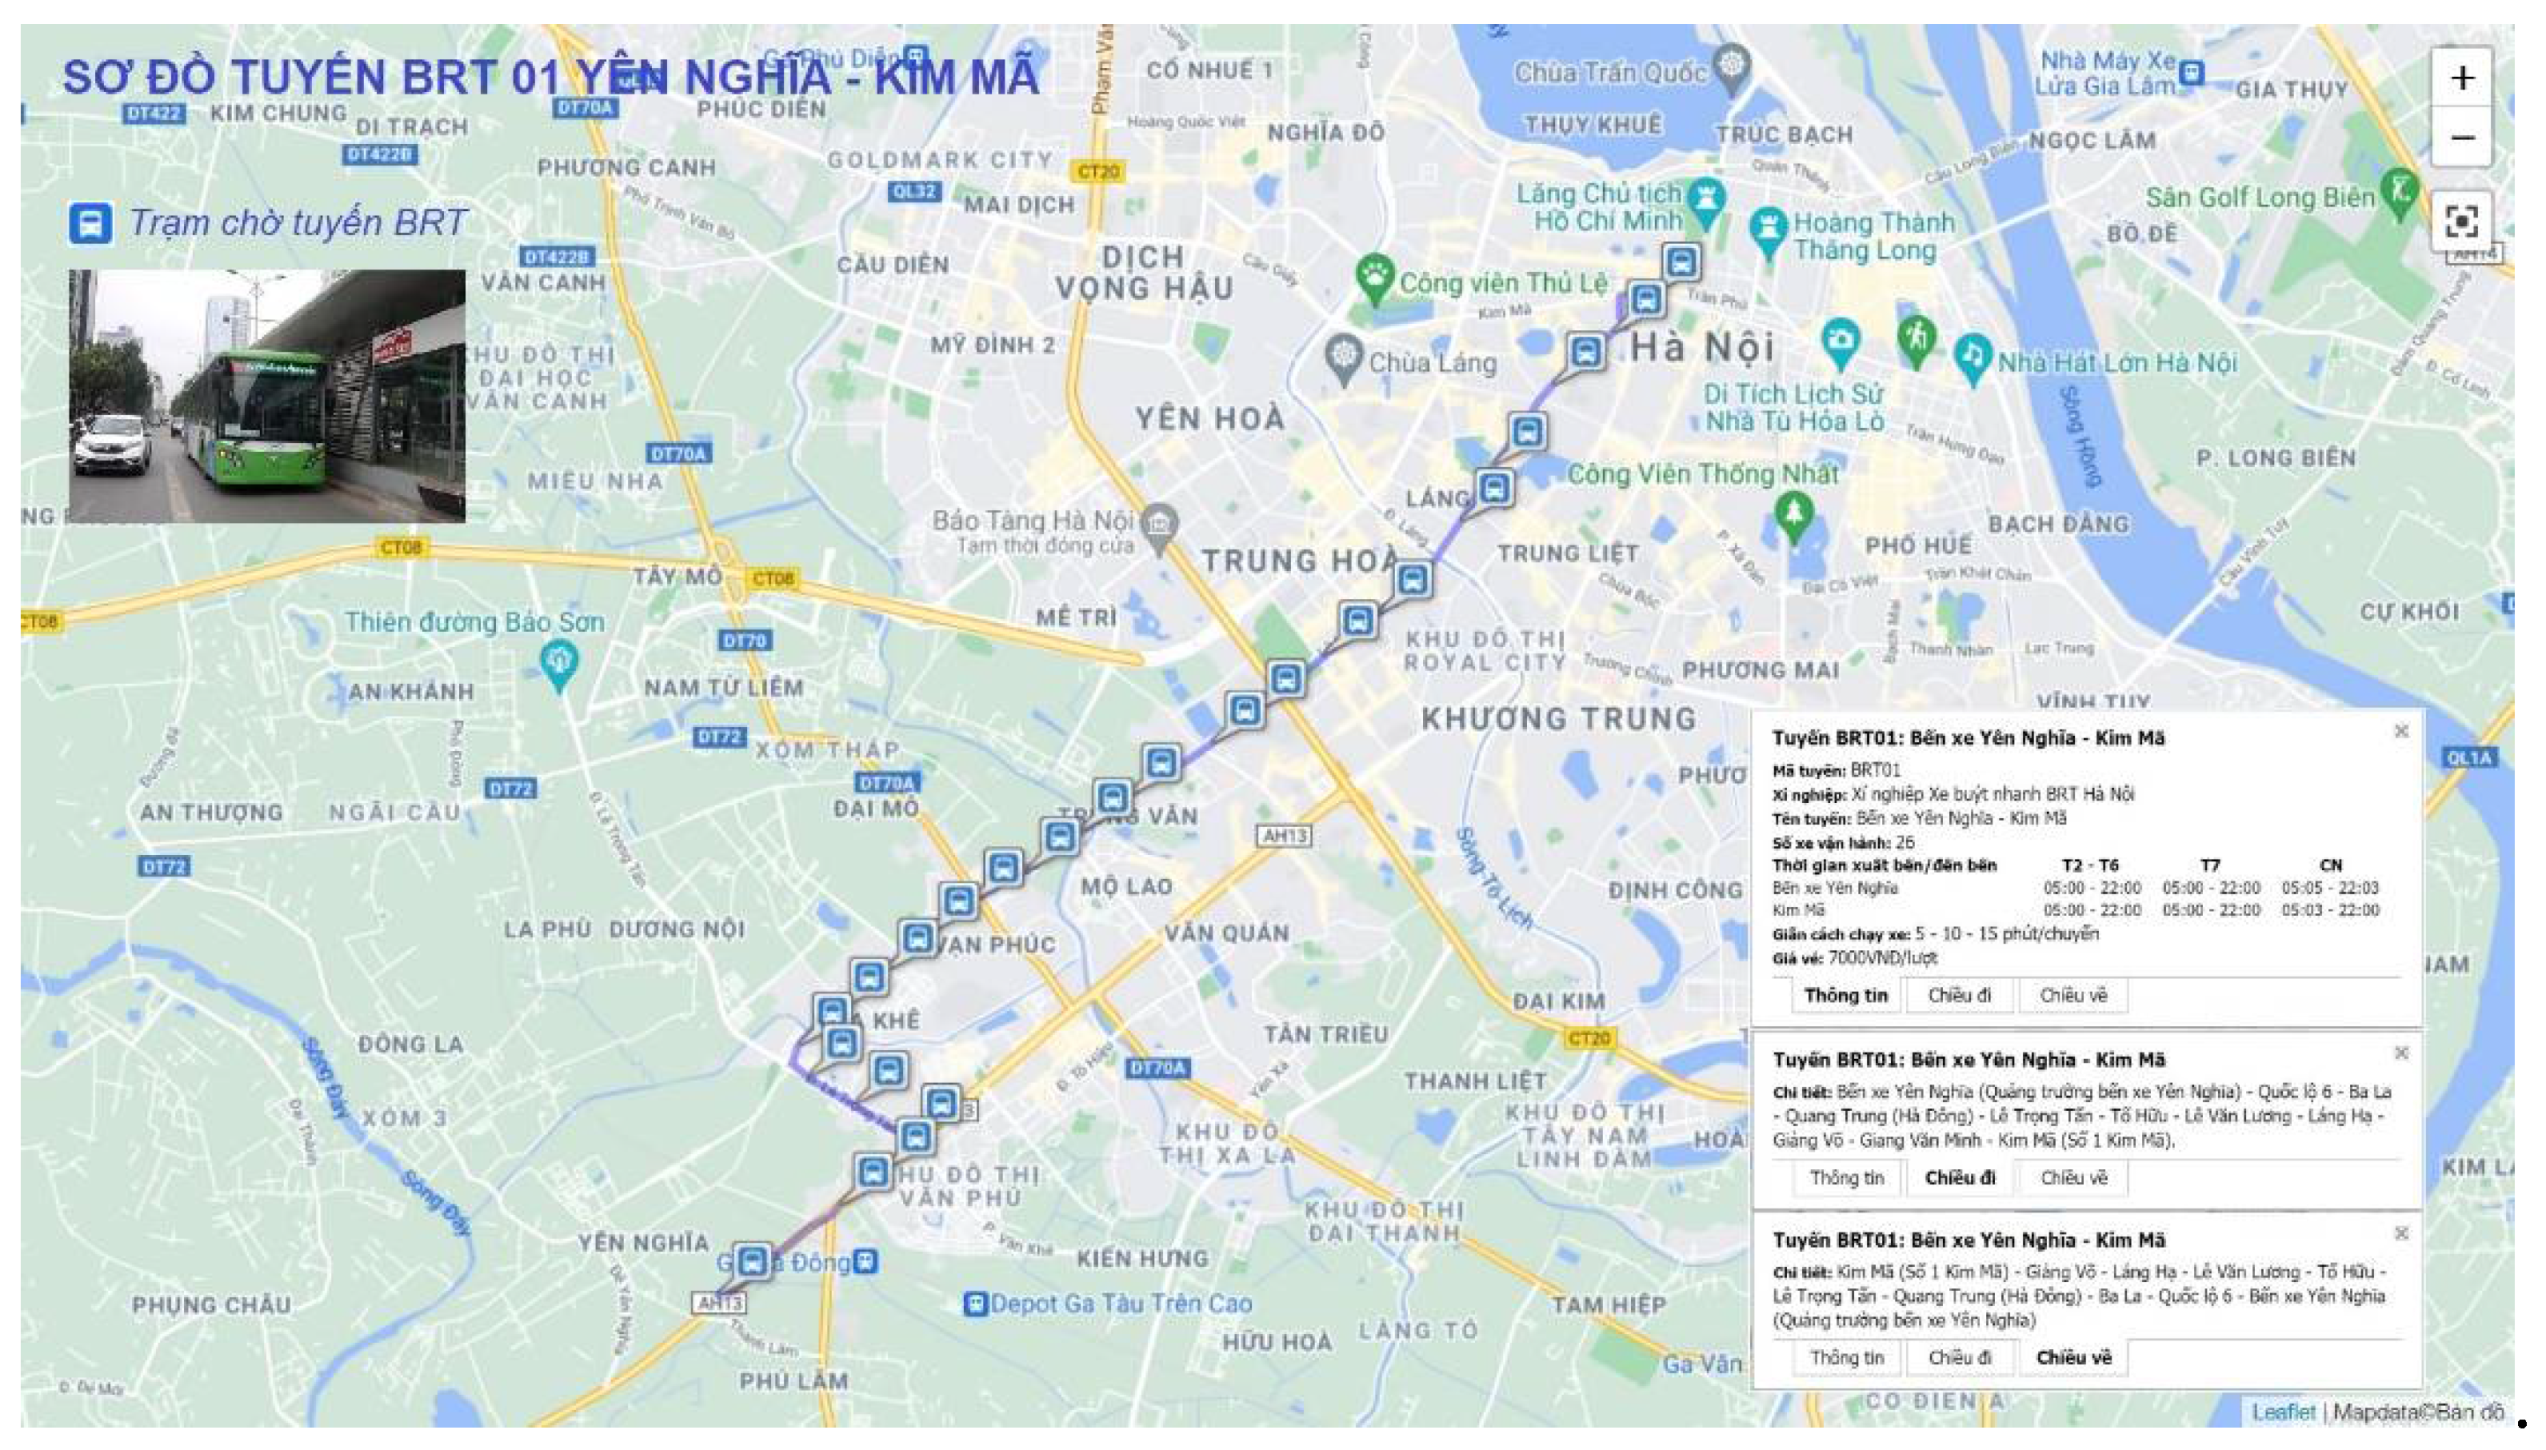
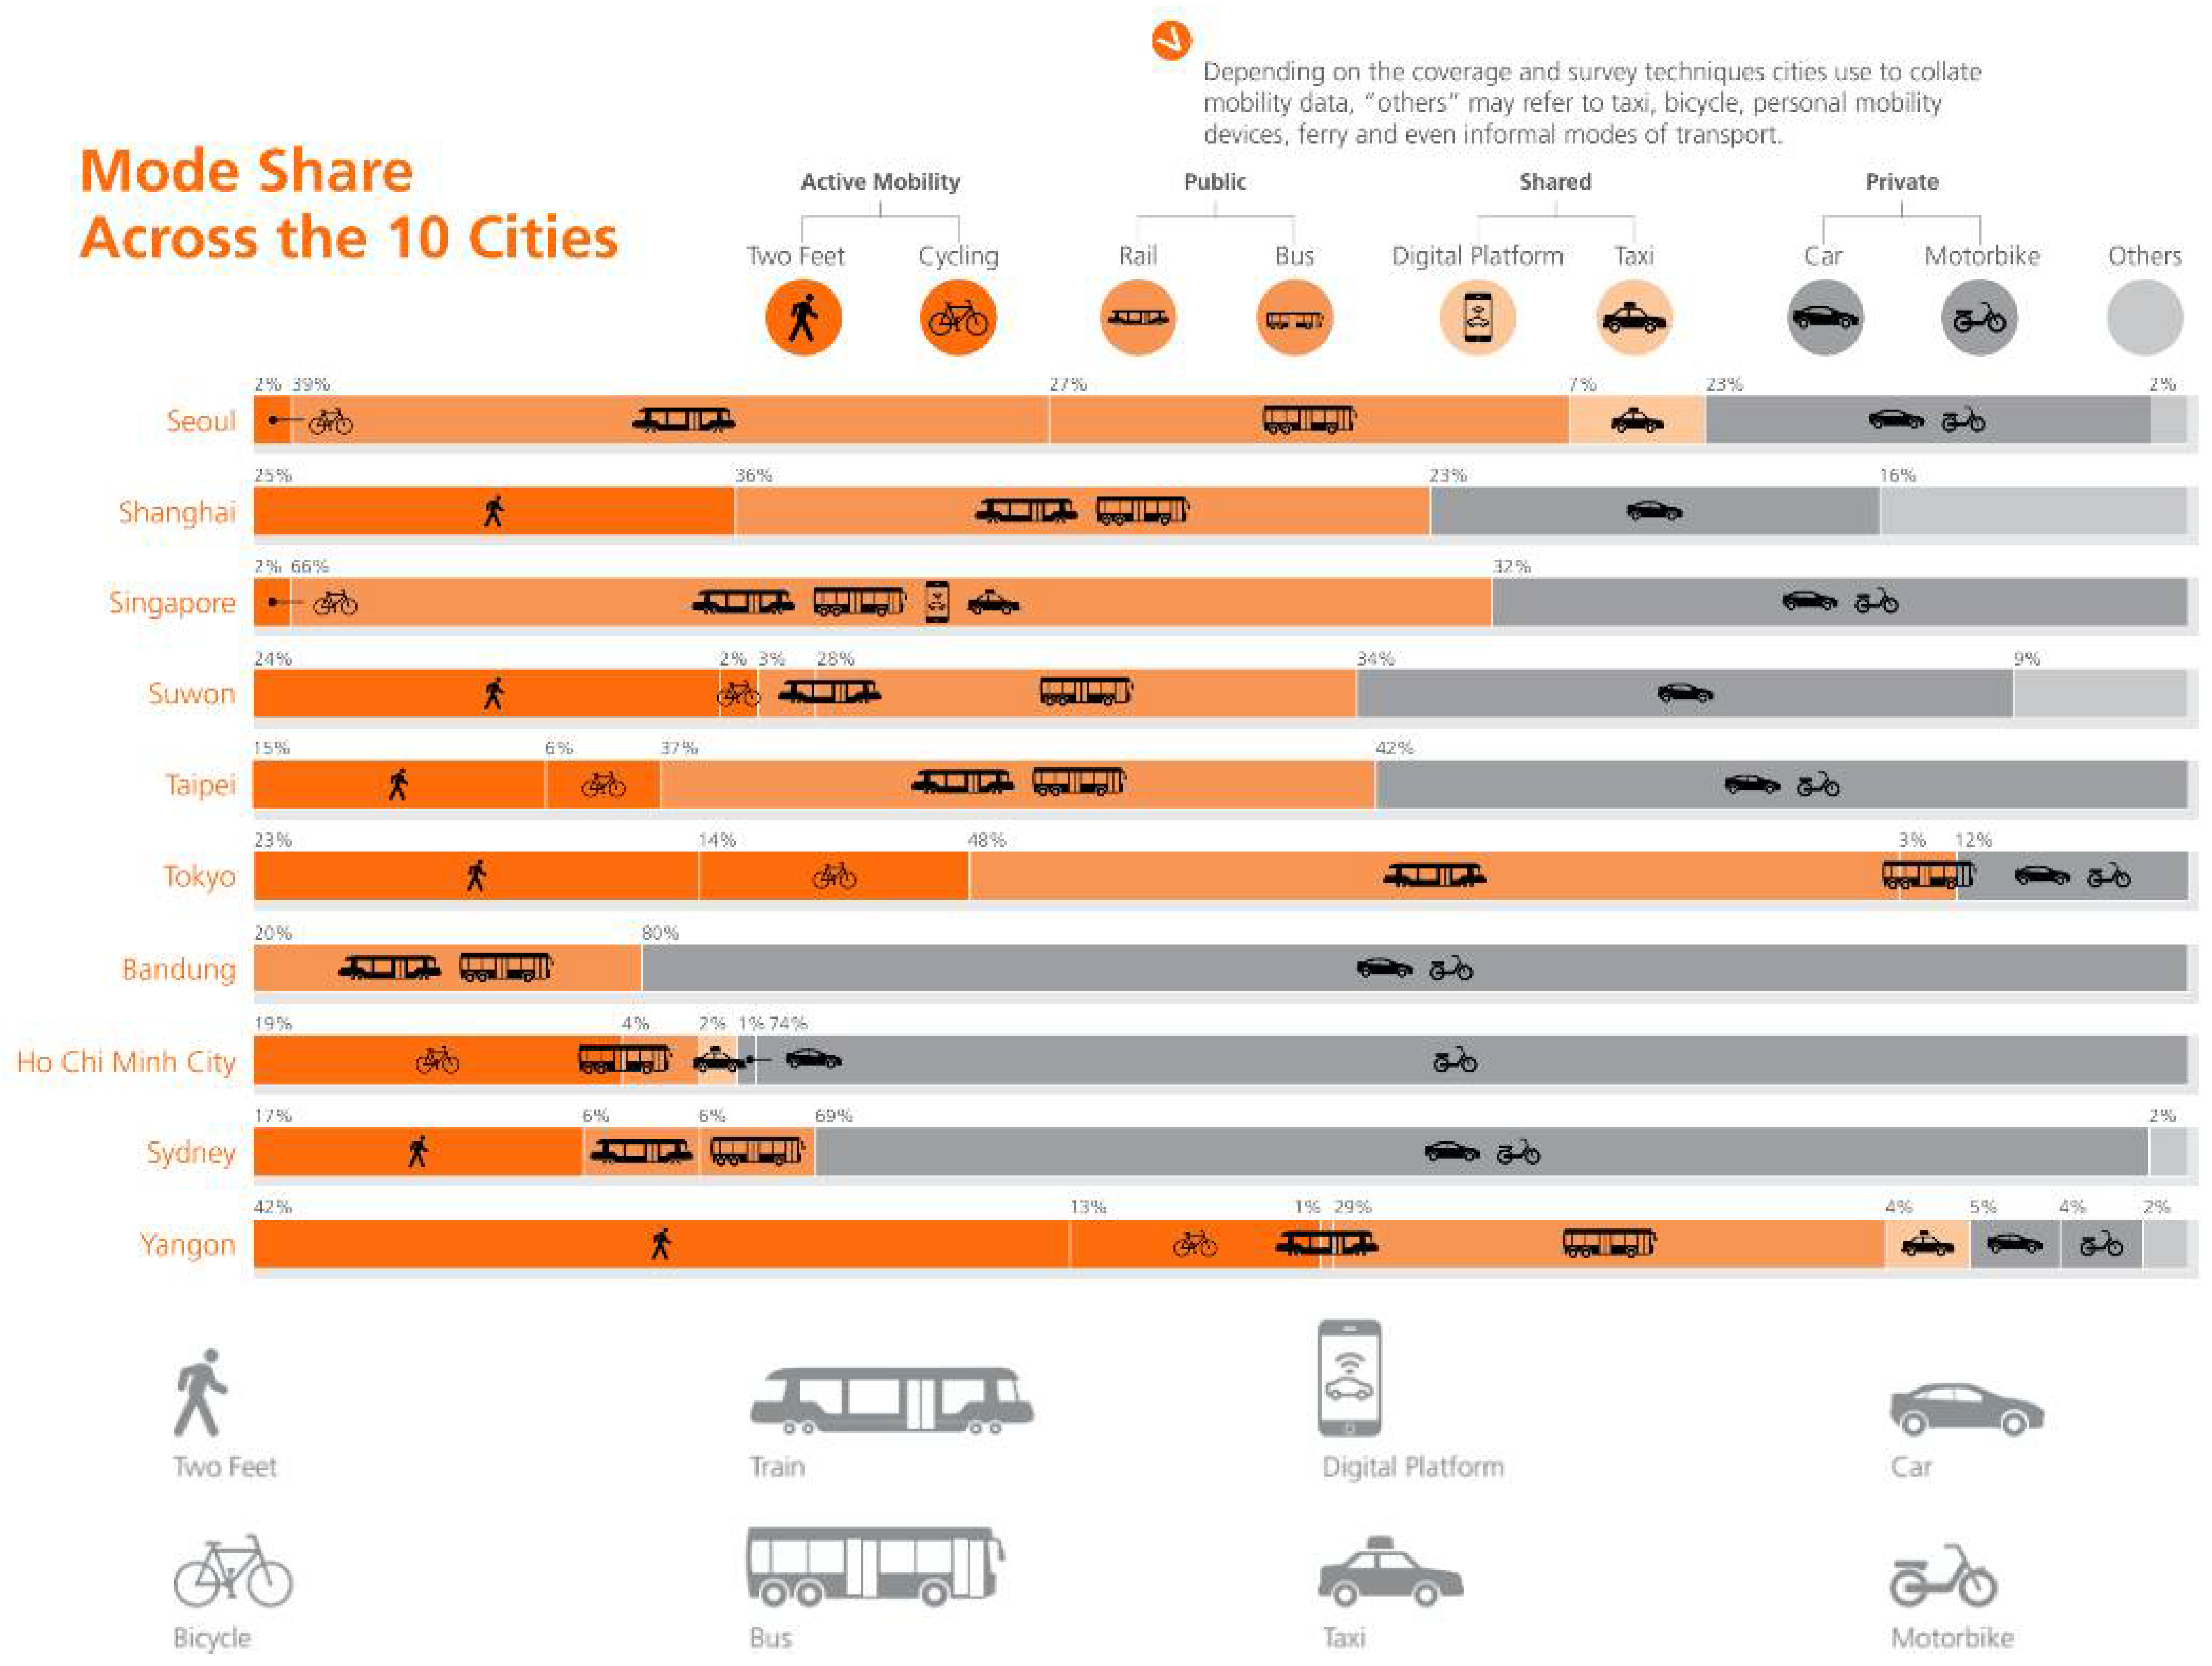
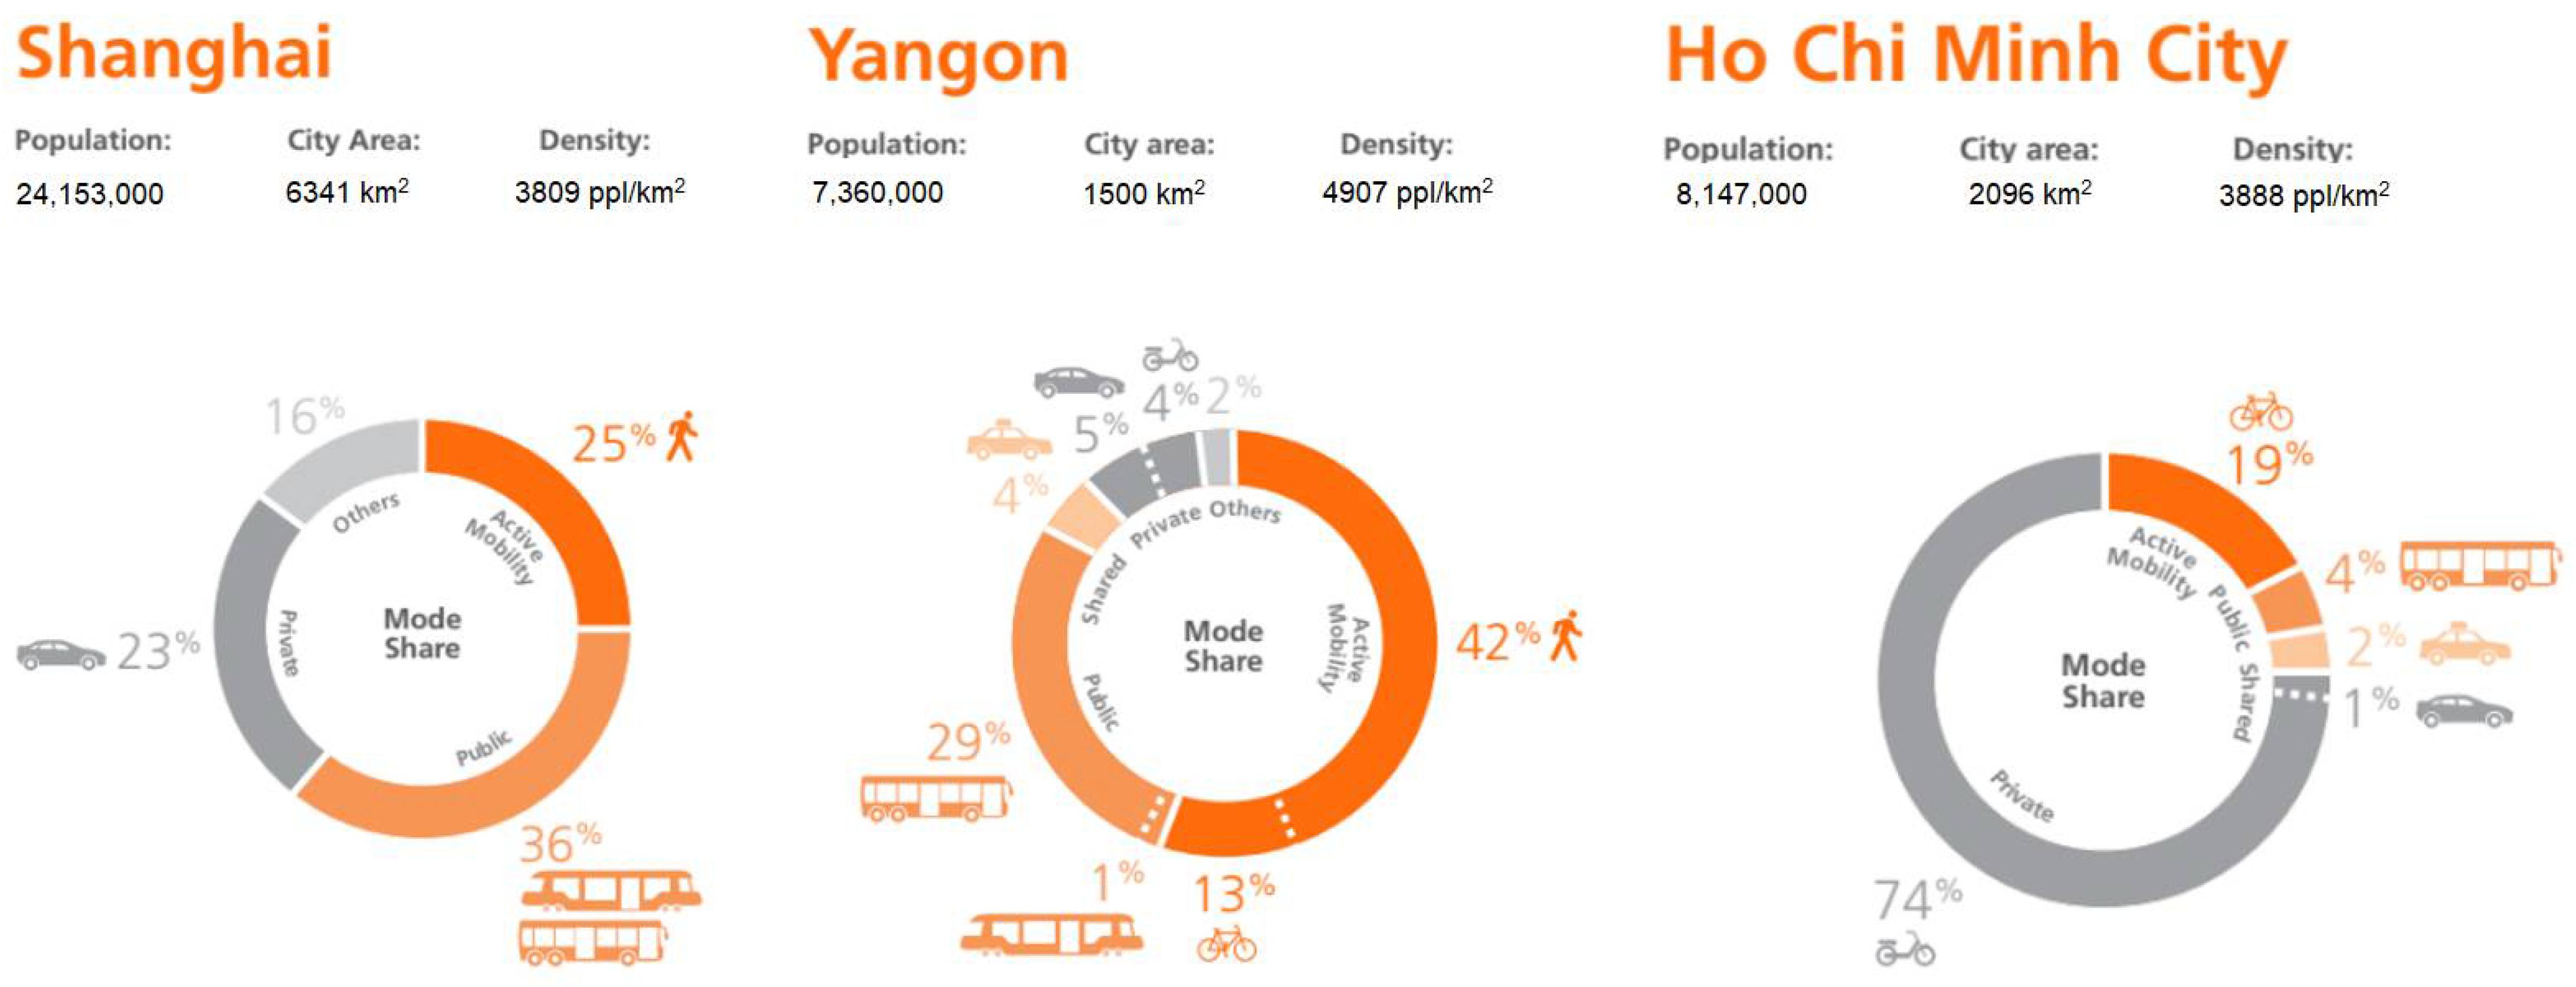
2.3. Limitations of Public Transport in terms of Level and Quality

Urban transport plays a very important role in the functioning of an urban space. In particular, public transport represents the backbone of sustainable urban mobility, moving millions of citizens [33]. Public transport makes it easier for urban people to move around the city and access urban services [25]. However, in 2015, public bus services in HCMC and Hanoi could meet only 7% and 14% of the demand, respectively [34]. Many streets are very narrow, so it is impossible to provide dedicated lanes for public transport. Additionally, bus service quality is poor, since it is affected by mixed traffic and traffic congestion [35].
In Hanoi, the primary means public of transport are bus and taxi, whose contribution to the total ridership is as low as 15%, while there is almost no rail-based transit for the time being [26]. However, the level and quality of bus exploitation is still very limited: some routes have not yet operated buses, the distance between the stations is quite far (more than 2 km), bus management process is pretty outdated, and the bus operating time is usually only up to 19 h and a few activities up to 21 h [9]. Infrastructure limitation and the rapid growth of personal vehicles led to the extension of bus travel time in 2018 up to 40% compared to that of 2015. On major corridor axes, buses frequently arrive from 10 to 15 min later than scheduled due to traffic jams [32]. The Hanoi Master Plan indicated that the bus system would be improved, and the target is to achieve 35% mode share by 2020 [36].
There is poor physical connection between transport facilities, transport modes, and the integration of transport services. Hanoi Bus Rapid Transit Project (BRT) is a typical example: The BRT is a component of the Hanoi Urban Transport Development Project that aims at increasing the use of public transport and promoting environmentally sustainable transport for Hanoi. After several major changes in Hanoi’s public transport strategy, the final output was cut down to only a single BRT route of 14.7 km in length (Figure 7). The route began its operation in January 2017 but has been basically under-utilized so far with only 20 buses per hour, equivalent to 1200 passengers per hour in each direction [37], significantly lower than the capacity if the route would be dedicated to private vehicles. The BRT and normal bus routes are currently not connected, so they cannot be a perfect replacement for motorbikes.
In HCMC, the bus system also does not work effectively. This consequence may derive from the fact that planning of the functional areas of HCMC is not clear, and as a result, the residential, economic, and industrial zones are spread out, which directly affects the organization of public transport, because it is difficult to connect different functional areas and thus to the meet mobility requirements [25].
Figure 8 shows the passenger modal split across the 10 cities of Asia-Pacific. By comparison with other cities, HCMC has seen the most limited public transport (including bus, taxi, and shared mobility).
Considering cities with similar population density (HCMC, Shanghai, and Yangon) (Figure 9), in 2016, while public transport is the main means of transportation in Shanghai (36%), it contributes 34% of total transport need in Yangon and a very low share of 7% in HCMC—the economic heart of Vietnam.
An ambitious plan to build an extensive public transport system has been introduced in HCMC, which will include mass rapid transit and bus rapid transit corridors. Nevertheless, it continues to be an uphill task for public transport to gain a foothold in HCMC. Besides having to raise capital to build the new public transport system within a short timeframe, the city faces difficulties such as fragmentation of funding, land acquisition and resettlement challenges, and administrative issues [39]. To be specific, HCMC aims that by 2020, the market of public passenger transport throughout the city will assume 15–20% of the needs of the people moving. By 2025, it will reach 20.5–26.6%, and by 2030, this ratio will increase to 29.3–36.8%. However, until now, public passenger transport in HCMC has only met about 9% of the travel needs of the people—the distance is quite far from the goal. In recent years, HCMC has focused a lot of investment in buses from infrastructure to policies to support new car loan interest and waiting stations. However, over the years, the number of bus passengers tends to reduce. Compared to the end of 2017, the bus network in HCMC is currently down seven routes (five subsidy routes including 37, 40, 60, 95, and 149 and two non-subsidized routes including 12 and 49) [39].
Generally, public transport systems in Hanoi and HCMC cannot accommodate a significant shift from motorcycle and other private transport modes. Buses do not meet the needs of the people, and there are few other public passenger transport options, inevitably causing most people to choose a personal motorcycle as the preferred means of transportation.

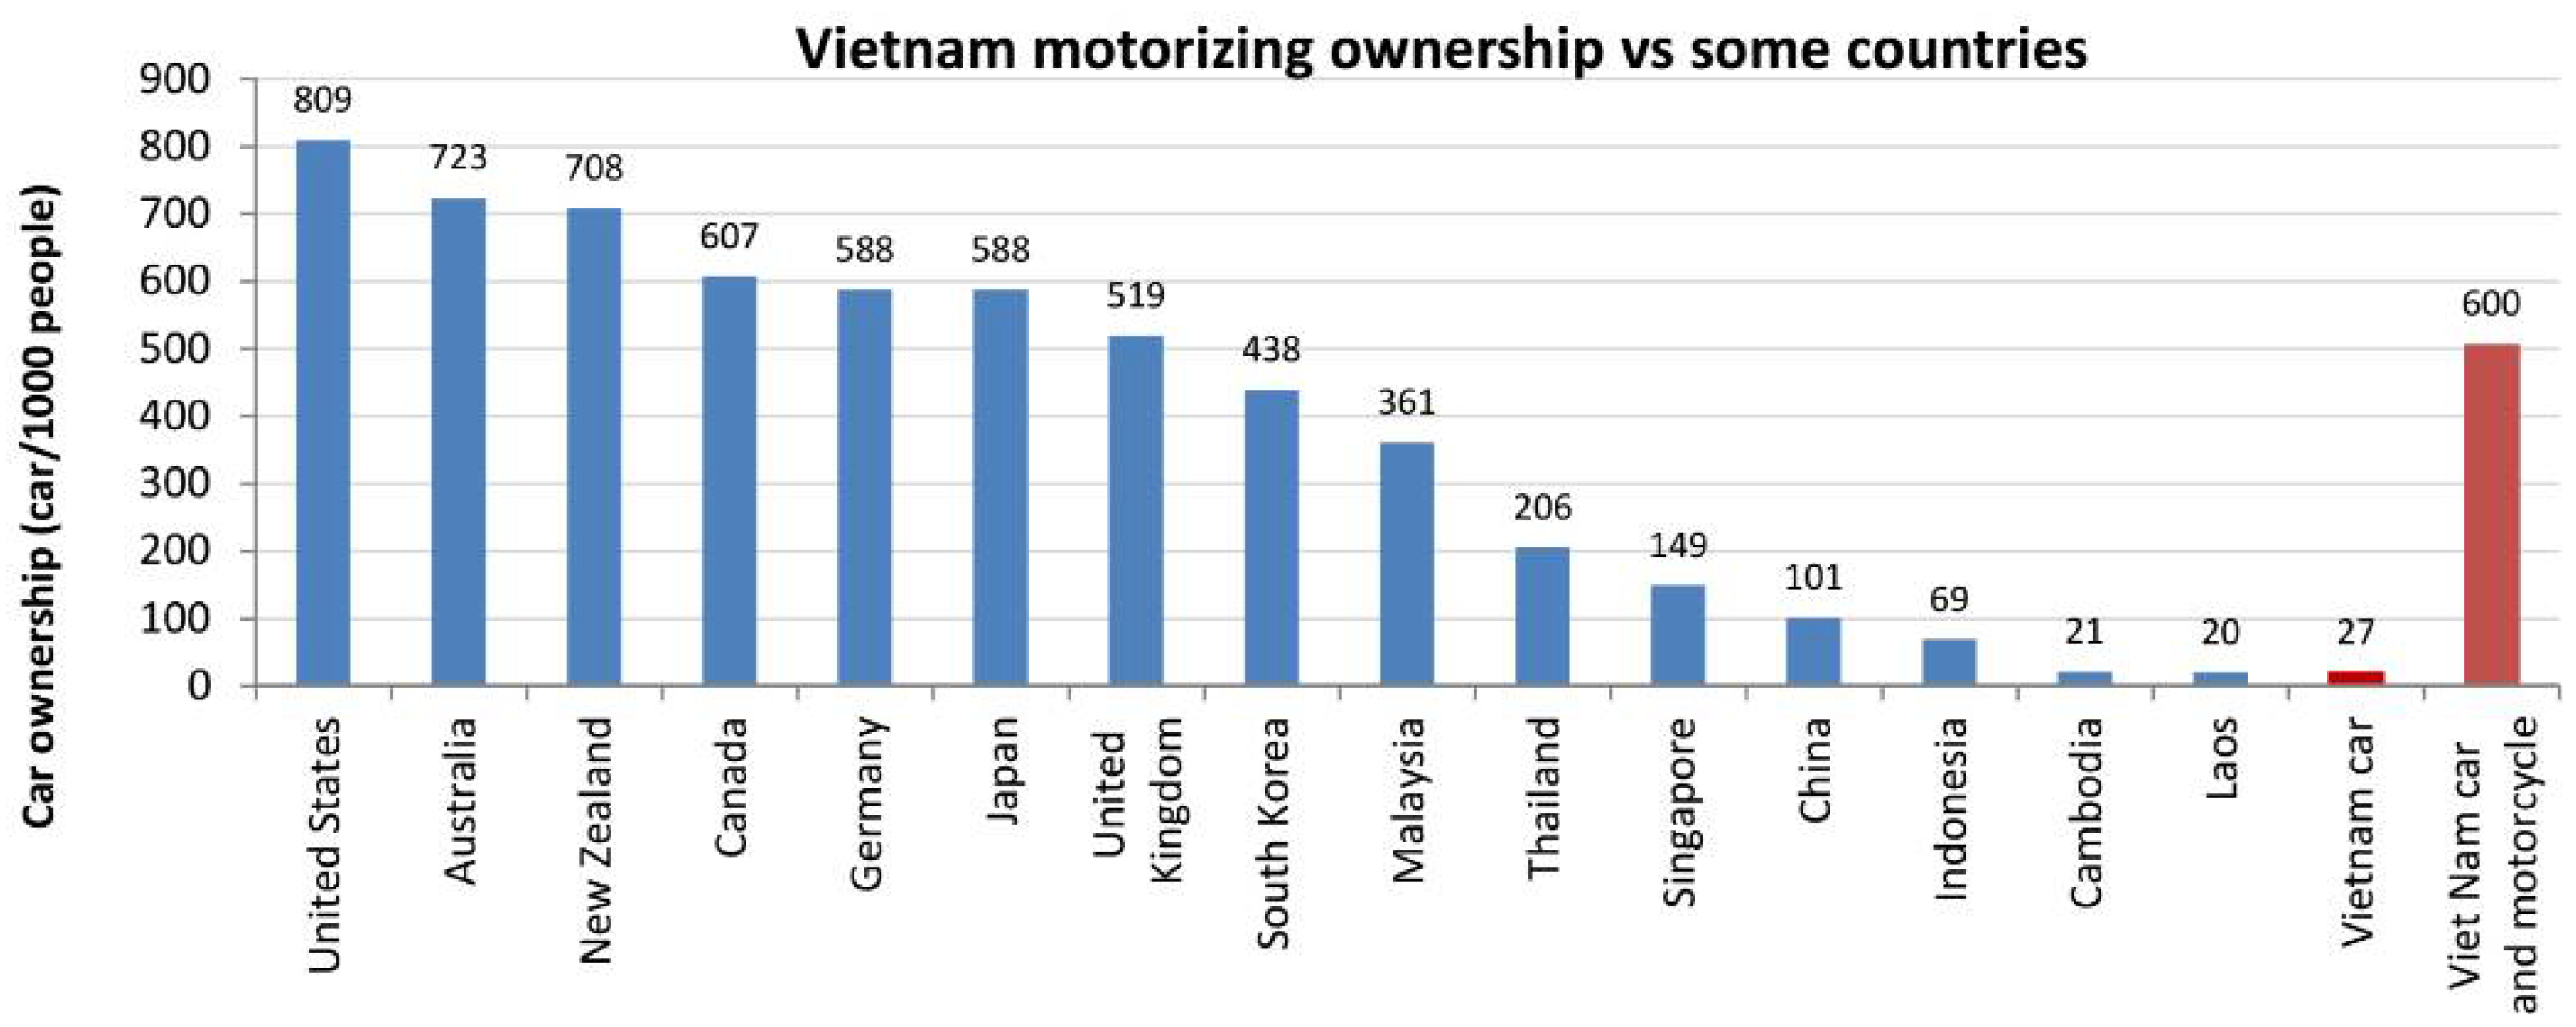
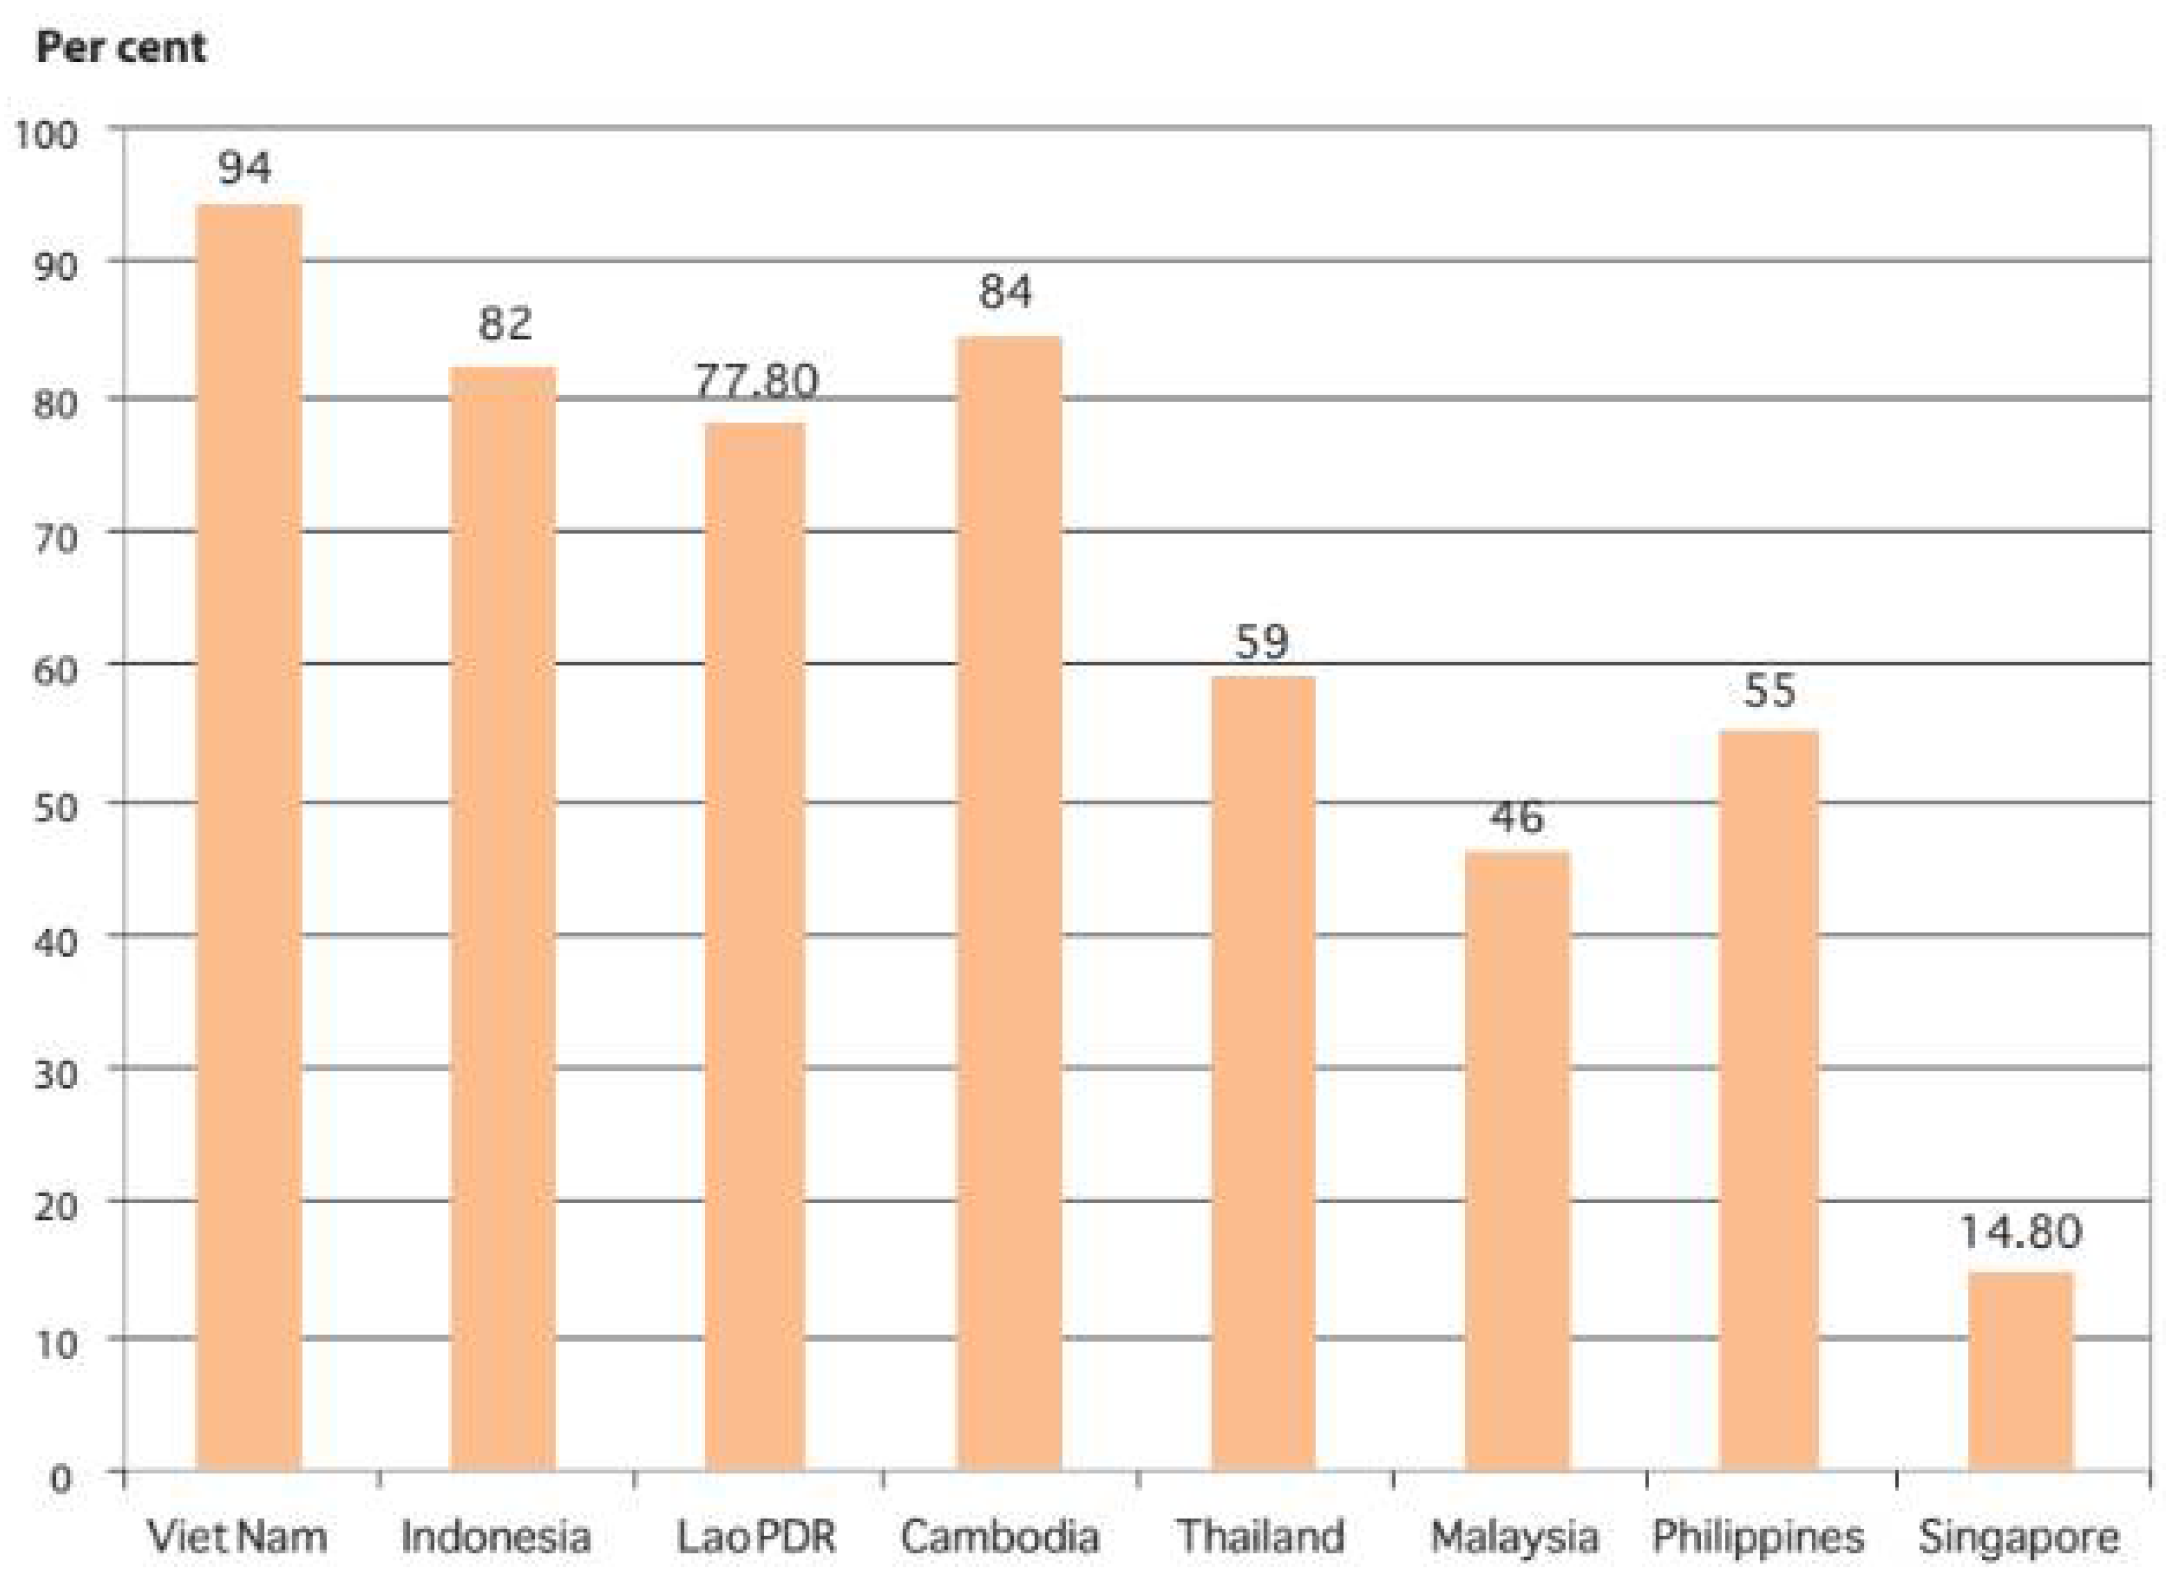
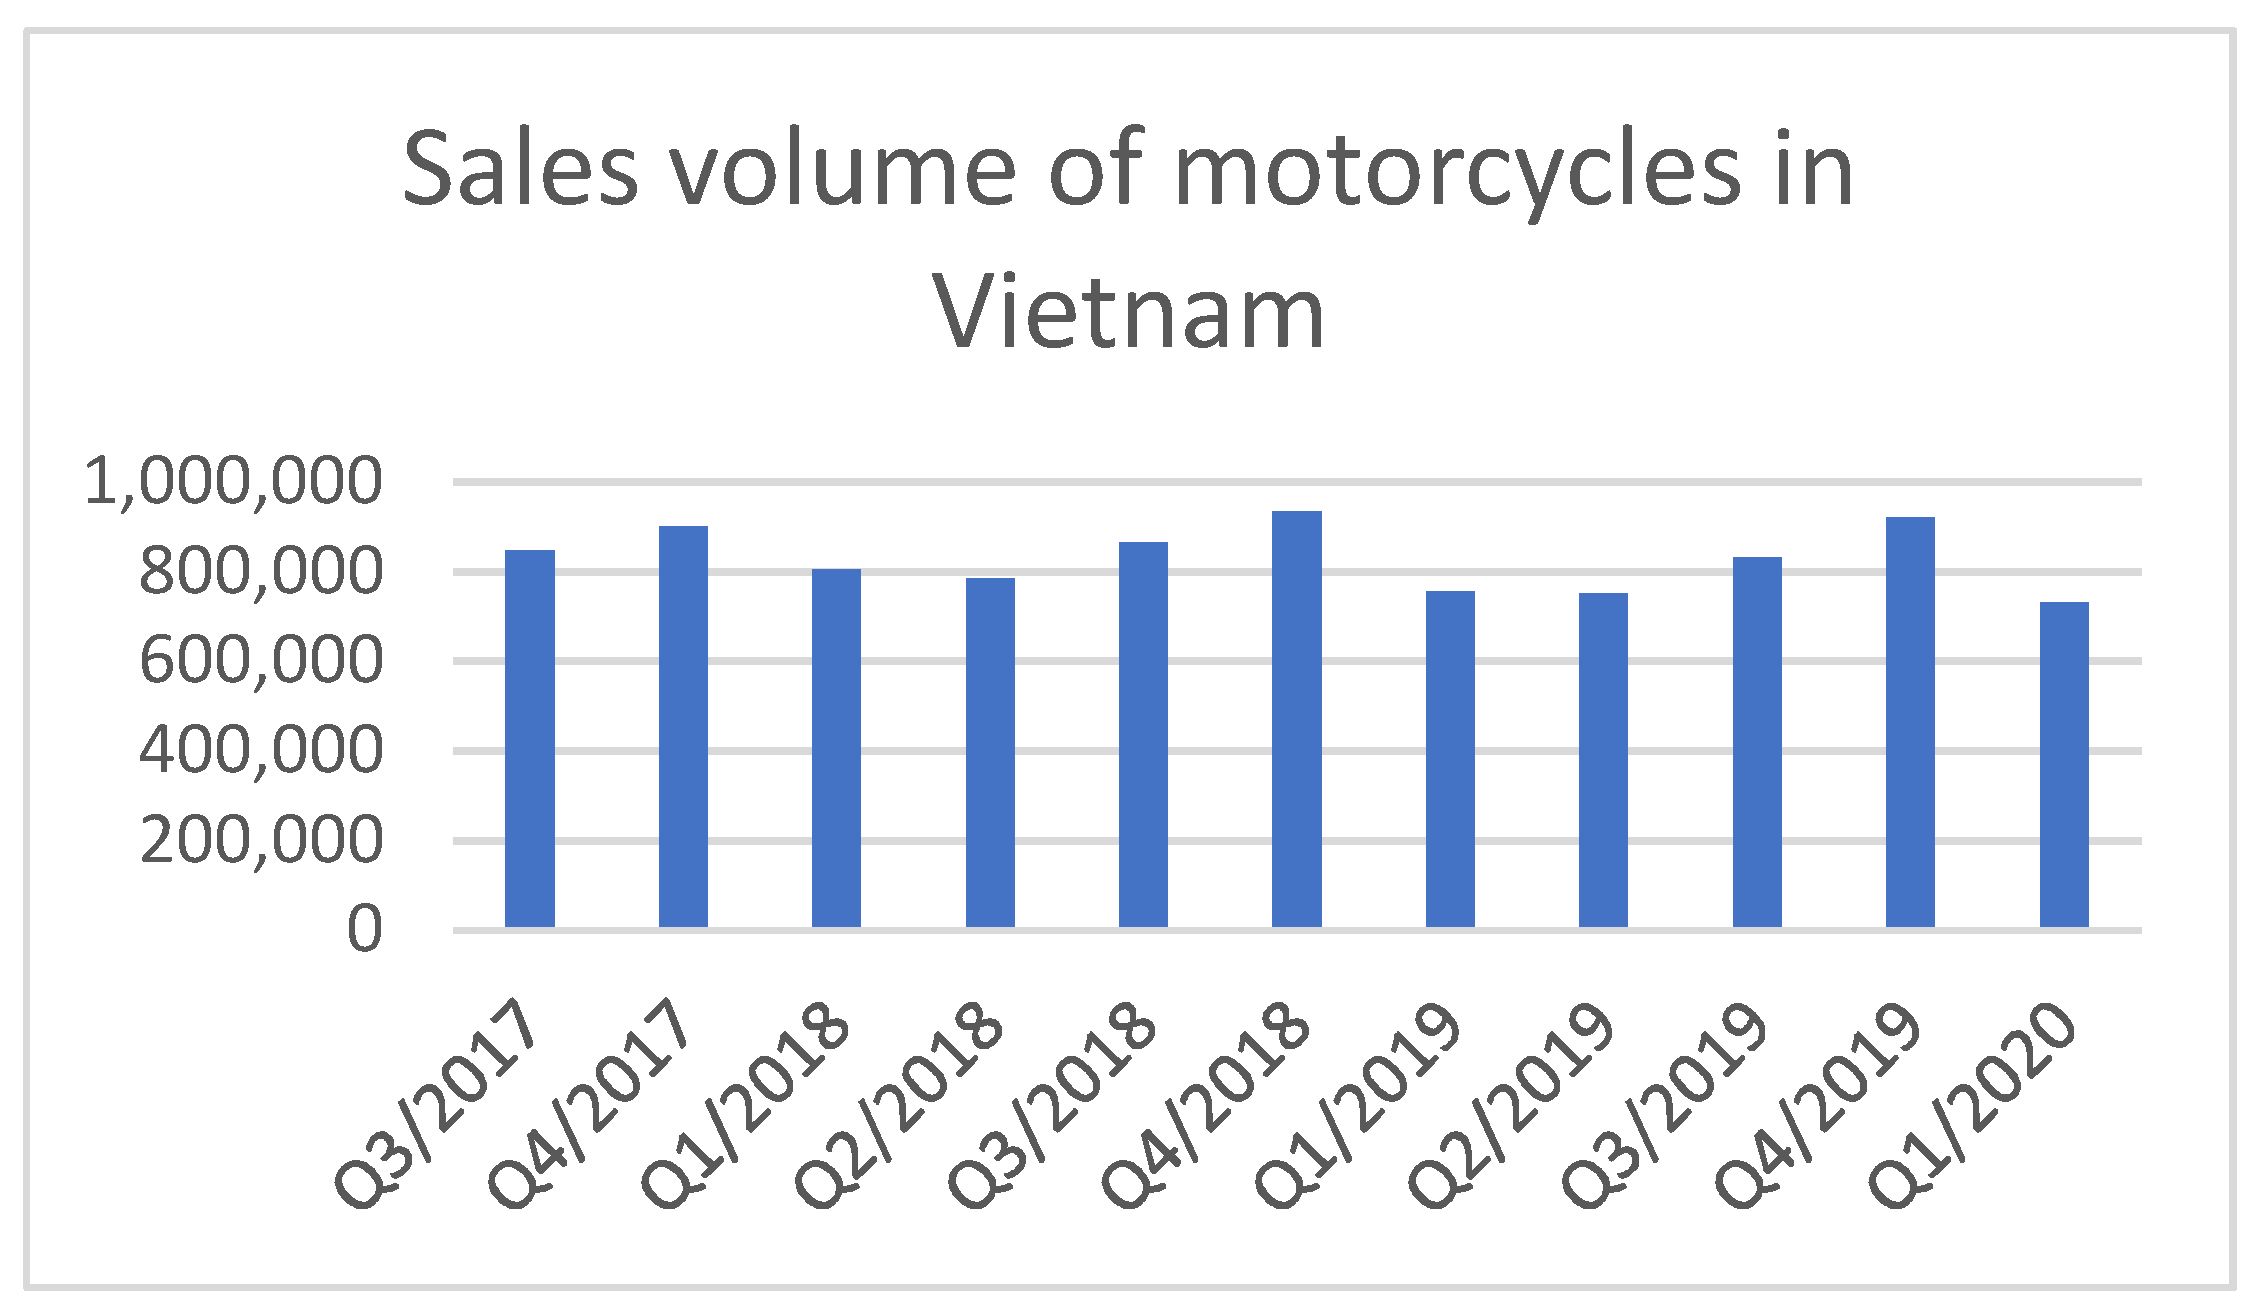
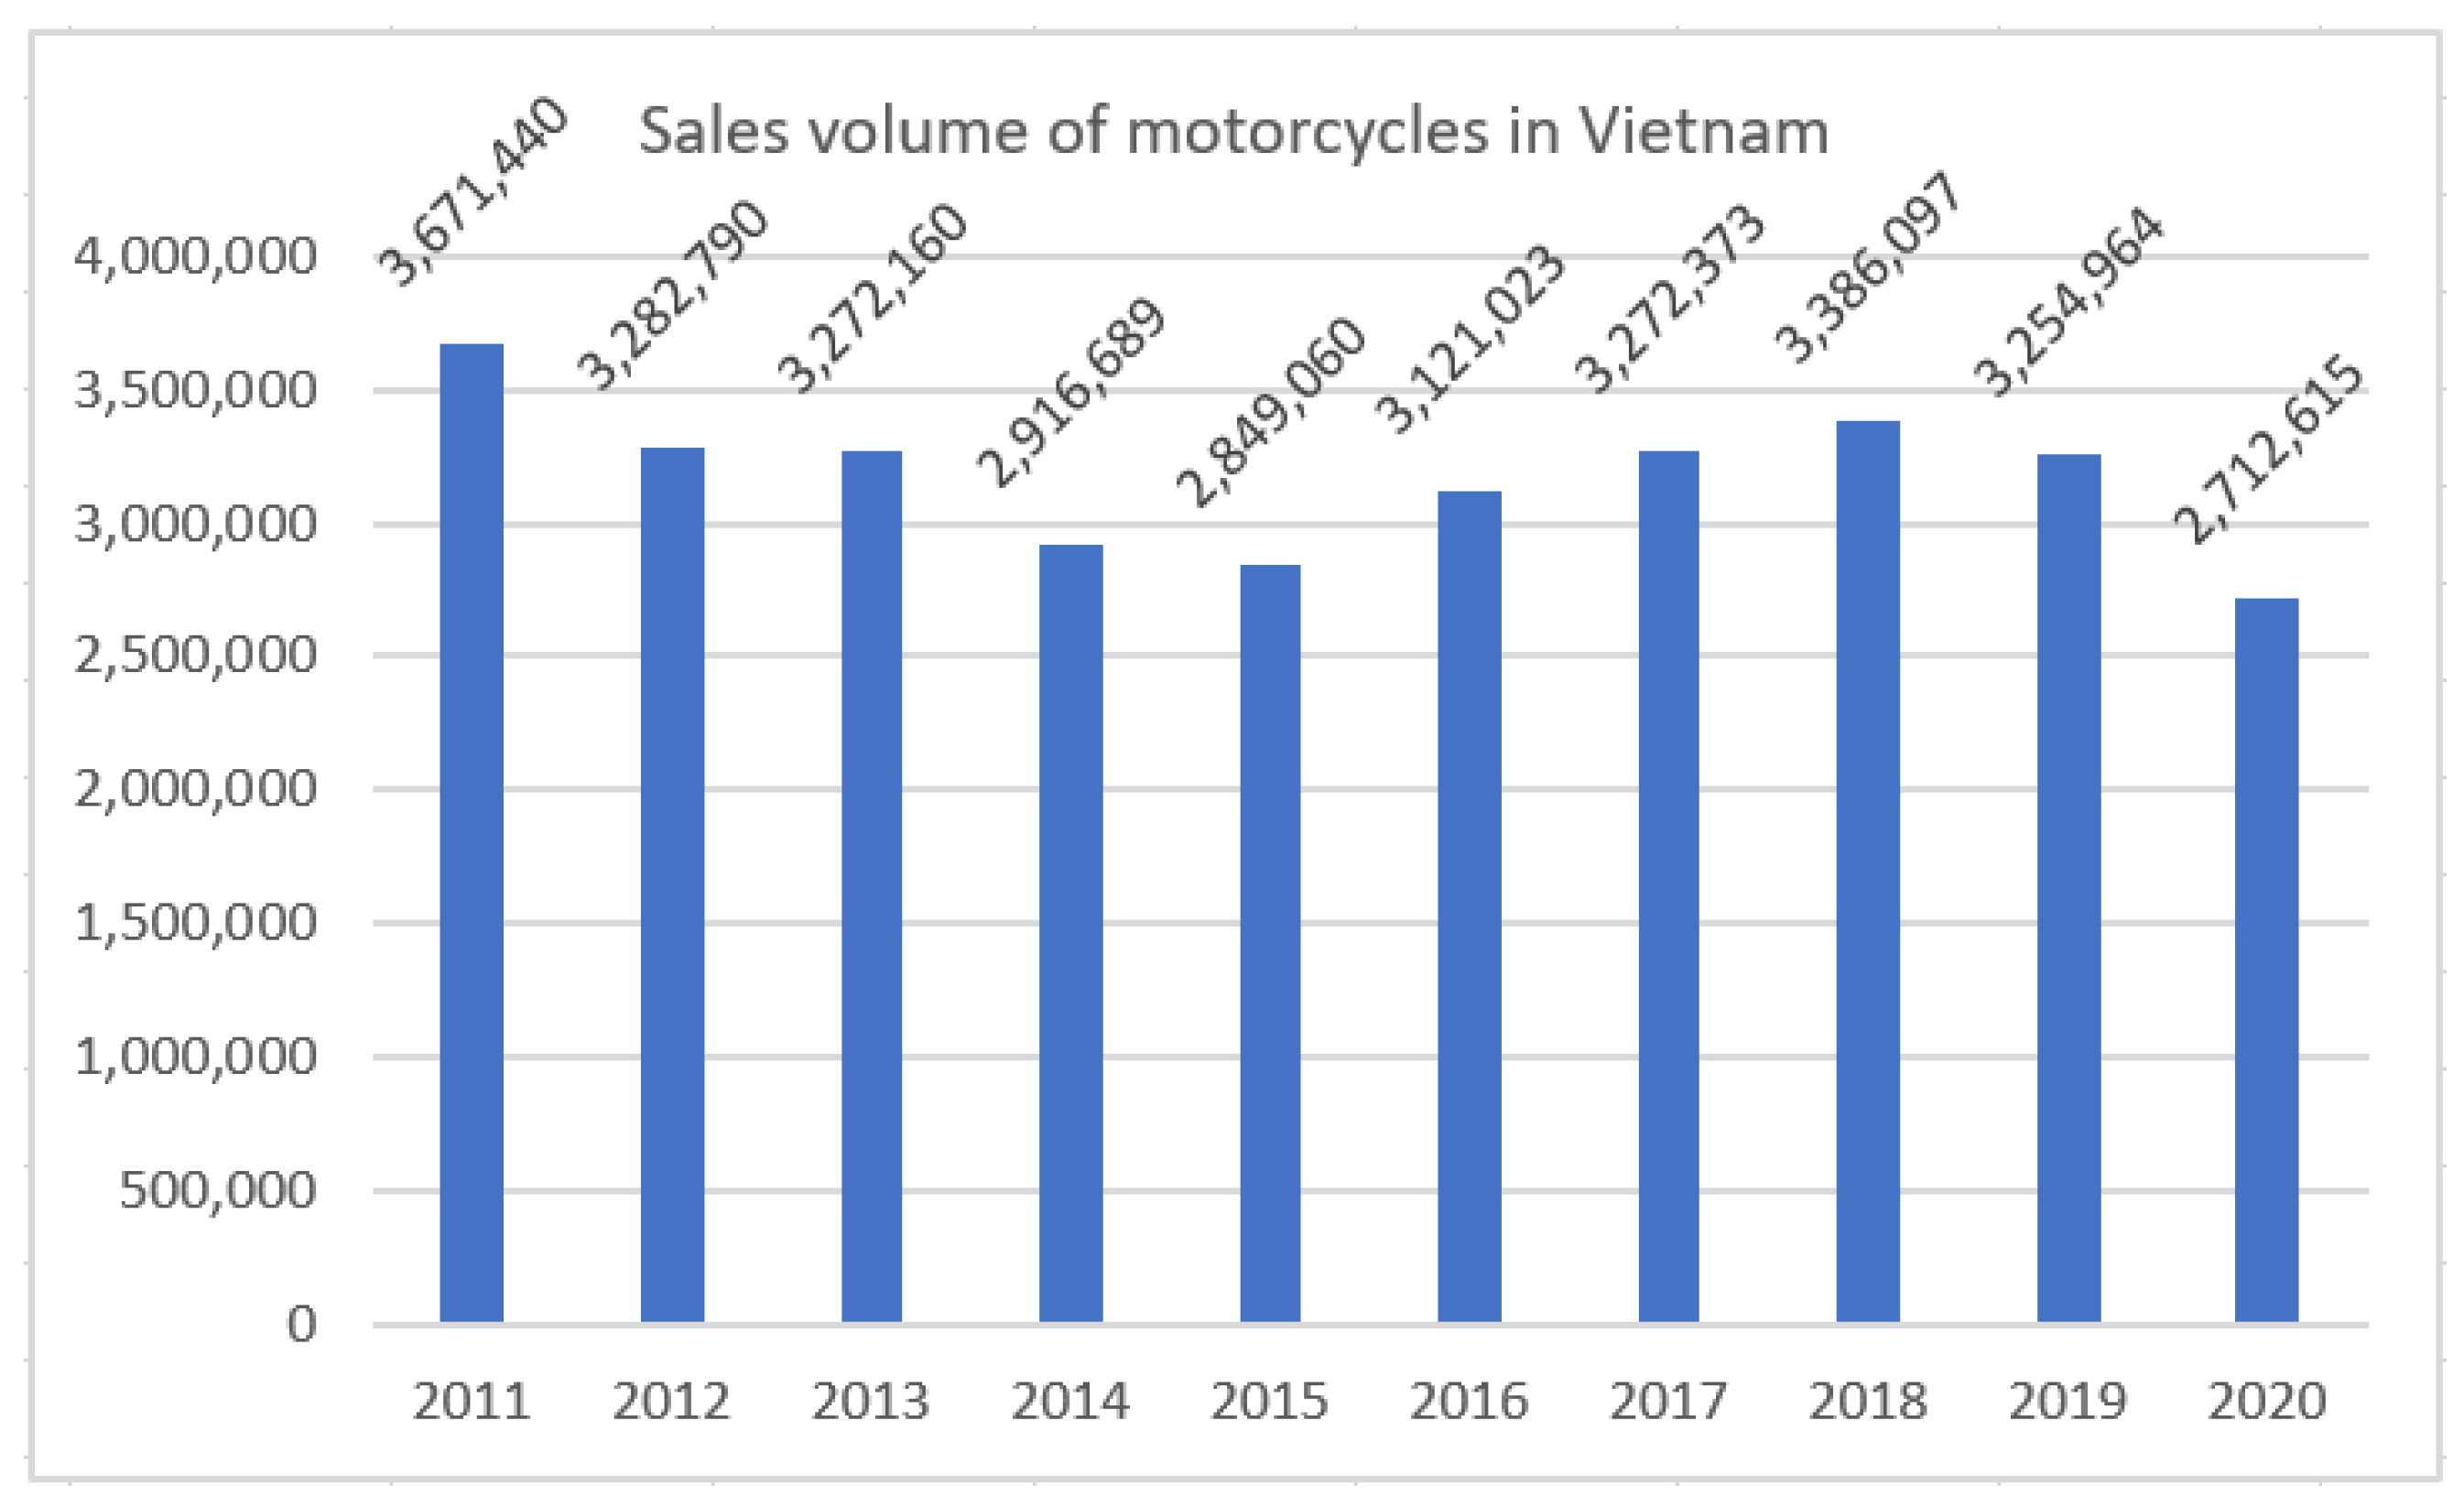
2.4. Gasoline-Powered Motorcycles—Popular Means of Urban Transport in Vietnam

While public transport in Vietnam cannot satisfy the travel demand of citizens, private vehicles become the major means of transport. Among them, motorcycles always express their prevalent existence.
Over the past 20 years, Vietnam has become both a production base and a large market for motorbikes. Vietnam is the fourth largest producer of motorcycles in the world with a scale of 3.7 million motorbikes/year (2017), just behind China, India, and Indonesia [40].
According to the statistics of the Vietnam registry, among private means of transport, the largest share in vehicle ownership has been seen in motorcycles and mopeds. Compared to other countries, the private car ownership rate in Vietnam is very low, with 27 cars per 1000 people, while the motorcycle ownership is about 21 times higher (Figure 10).
The number of motorcycles and mopeds on the road increased by 28,515,968 vehicles (153.2%) between 2006 and 2016 (Table 5). In recent years, the rate of growth in motorcycle and moped ownership has decreased. However, there are an enormous number of motorcycles in Vietnam (accounting for 93.3% of motorized vehicles), the highest number as a proportion of all motorized vehicles of any ASEAN country (Figure 11) [27].
In 2018, about 3.9 million cars, 58 million motorbikes, and 1 million electric bicycles were registered. The average annual growth rate is 7.3% for motorcycles and 6.3% for cars. In the 2016–2018 period, approximately 300,000 new cars and 3 million motorbikes were registered each year.
Considering yearly consumption, Vietnam’s consumer market for motorcycles reached its saturation stage of 3.3 million motorcycles in 2011, thus decreasing to 2.7 million in 2014. From 2015 onwards, however, consumption increased again, reaching the same number of sales as in 2011 [43]. In recent years, gasoline-powered motorcycle sales have seen a stable volume of 3.2 million units each year (Table 6).
Table 7 and Figure 12 show the sales volume of the motorcycle of the five biggest motorcycle manufacturers in Vietnam in recent quarters. Generally, an average number of 800,000 units are consumed each quarter. In 2020, after the first nine months, because of the effects of the COVID-19 pandemic, total gasoline-powered two-wheeler sales have dropped to 2.07 million, down 15.9%. Consequently, the full year 2020 outlook has been moderately downgraded at 3.07 million units, down 10.9% from the previous year [45].
The more popular circulation of fossil fuel motorcycles than cars in Vietnam’s urban areas comes from their salient advantages compared to cars. Many roads are simply too narrow for four-wheeled vehicles. And with incessant traffic jams occurring in the two major cities, motorcyclists can just simply weave through tight spaces or, although not recommended, simply continue their journey using the sidewalks. The lack of parking spaces is also another bugbear for those who own cars, with very little dedicated parking spaces available. Probably the most likely reason for such a strong motorbike presence is economics: many Vietnamese can’t afford a car. With an average monthly income per capita of only US$260 as of 2019 (Table 8), most cars available for sale in Vietnam are beyond the reach of the average Vietnamese [46] and motorcycles are more consistent. That difficulty is compounded by the inclusion of tariffs for imported brands and high operation cost. Tax and fees comprise 40–65% of car price [47], which also hinders private car adoption.
To sum up, motorcycles are the most affordable and efficient option for people to move inside the city. People who live in small alleys in residential areas far from the main road find it difficult to reach buses, while motorized vehicles are easy, fast and convenient [25].

3. Urban Air Pollution and Transition to Electric Two-Wheeler Mobility

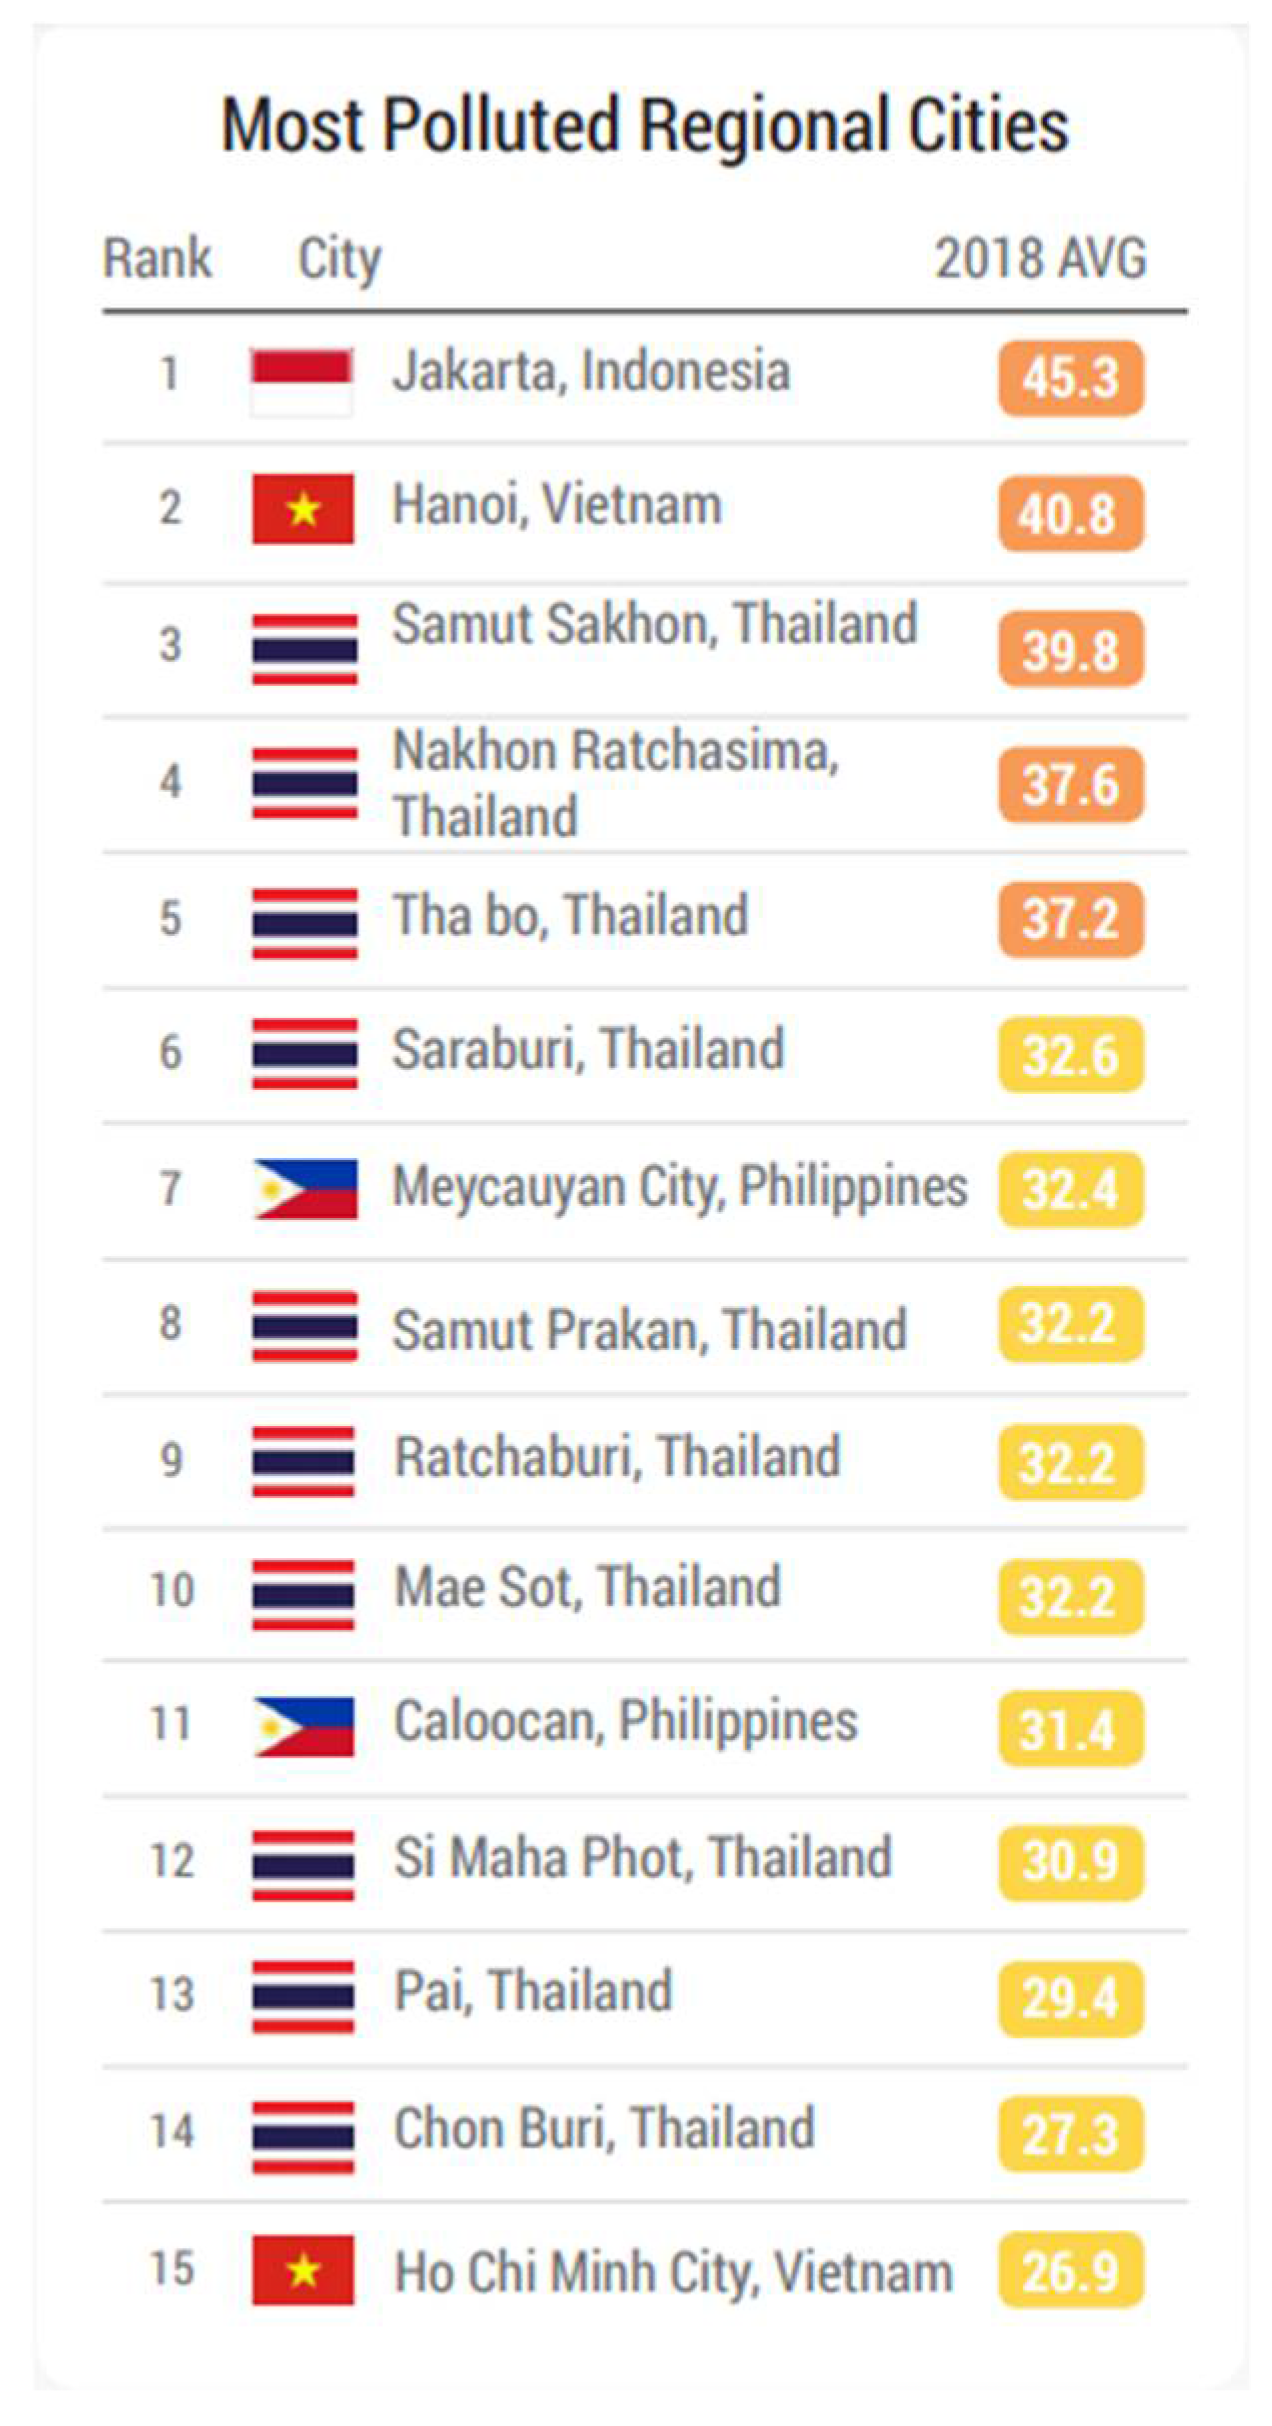
3.1. Urban Air Pollution

Vietnam currently contributes 0.6% of the world’s total GHG emissions and ranks 27th globally in terms of GHG emissions. For the period of 1990–2014, the country’s cumulative GHG emissions were 252 MtCO2e. During the same period, GHG emissions for energy (electricity sub-sector) were 50 metric tons, for transport: 31.9 metric tons and waste: 9.4 metric tons. Vietnam’s high dependence on private vehicles powered by fossil fuels has resulted in increased GHG emissions and air pollution. Transport accounts for 12.7% of the total GHG emissions of Vietnam [49].
Exposure to ambient air pollution results in 4.2 million deaths annually worldwide [50]. Among emission sources, the transport sector is the largest contributor [51]. More than 60,000 deaths from heart disease, stroke, lung cancer, chronic obstructive pulmonary disease and pneumonia in Vietnam in 2016 were linked to air pollution [52]. Air pollution threatens all, but the poorest and most marginalized people bear the brunt of the burden.
Serious risks to health not only come from exposure to atmospheric particulate matter (PM), but also from exposure to ozone (O3), nitrogen dioxide (NO2) and sulfur dioxide (SO2) (Table 9). As with PM, concentrations are often highest largely in the urban areas.
Fine particulate matter (PM2.5) is the most concerning air pollution in Vietnam. In 2016, these figures were 102.3 μg/m3 for PM10 and 47.9 μg/m3 for PM2.5 in Hanoi, and 89.8 μg/m3 for PM10 and 42 μg/m3 for PM2.5 in HCMC, according to the WHO database. The pollution is much higher than WHO air quality recommendations with annual mean values of 20 μg/m3 for PM10 and 10 μg/m3 for PM2.5 (Table 9). In 2018, Hanoi and HCMC was among the top 15 polluted cities in Southeast Asia (Figure 13) [53].
In 2019, Hanoi had only eight days with PM2.5 lower than the national standard of 50 μg/m3. The figure in HCMC was 36 days below the standard. Over ten million people in these cities was exposed to heavily polluted air [54].
Among the main causes of urban air pollution is transportation. Most of fossil fuel vehicles in Vietnam concentrated in big cities, emitting a large amount of air pollutants. Many old buses and motorbikes with limited emission control technology further worsen the situation. Stricter regulations on new vehicles emission standards have been proposed and applied recently. Euro 3 exhaust emission standards have been applied on two-wheeled motorcycles since 1 January 2017, while cars using petrol and other fuels, excluding diesel, applied Euro 4 standards. From 1 January 2018, diesel vehicles were required to follow Euro 4 standards, while new assembled or imported cars will be requested to follow Euro 5 standards from 1 January 2022.
Vietnam’s decision to apply Euro 5 emission standards from 1 January 2022 demonstrates the Government’s determination to cut emissions of atmospheric pollutants, thus protecting the environment and people’s health.
Worse air quality directly raises the awareness of the urbanites. A survey of households in 30 districts conducted by Hanoi police with more than 15,000 questionnaires also shows that 90.35% of people advocate restraining private vehicles and itinerary for stopping fossil fuel motorcycles [55].
For the traffic and environment concerns, the government is also planning to ban all motorcycles of scooters in big cities in 2025–2030. On 4 July 2017, Hanoi people’s committee issued resolution No.04/2017/NQ-HDND on approving project on tightening control over vehicles [56,57]. In August 2017, Hanoi City issued Decision No. 5953/QD-UBND approving the scheme “Strengthening the management of road transport means to reduce traffic congestion and environmental pollution in Hanoi city, the period of 2017–2020 vision 2030 “. According to the approved project, Hanoi may limit and proceed to stop operating motorcycles in the districts in 2030 which requires the public transportation system and alternative means to meet at least 65% of the travel needs of the people [58].
However, Hanoi should consider proceeding to restrict motorcycles step by step, not in a hurry to avoid causing social disturbance because the restriction of motorbikes will directly affect the daily life of a part of people in restricted areas and those wishing to come and go through this area. Therefore, it is necessary to introduce other alternative means of transport and develop the public transport system in both quality and quantity for buses, which including BRT, and urban railways [32]. In the immediate future, if it is a narrow area, there must be a bus system with frequency and operating time to meet the travel needs of people; minimize the impact on people’s travel needs as well as gradually creating habit for people to use public transport. For people to give up motorbikes, Hanoi must be determined to invest in public passenger transport in accordance with the approved plans and at the same time, coordinate with the competent authorities with city planning [59].
Following Hanoi, in August 2018, HCMC also issued the project “Strengthening public transport in combination with controlling motor vehicles in HCMC”. Under this project, HCMC can restrict motorbikes in some central districts and proceed to ban motorbikes by 2030. However, with current low share of public transport in major cities, the plan of motorbike restriction may not be feasible [60].
Under Prime Minister Directive No 03/CT-TTg dated 18 January 2021 on enhancing air pollution control, the Ministry of Transport is requested to urgently develop a national program to develop means of environmentally-friendly transport (including electric vehicles) and public transport and to promote the implementation of the roadmap for the application of the national technical regulation on the environment related to emissions from transport. The Ministry of Industry and Trade (MOIT) is requested to supplement the power development planning for provinces/cities, to meet the needs of electric vehicles development [61].

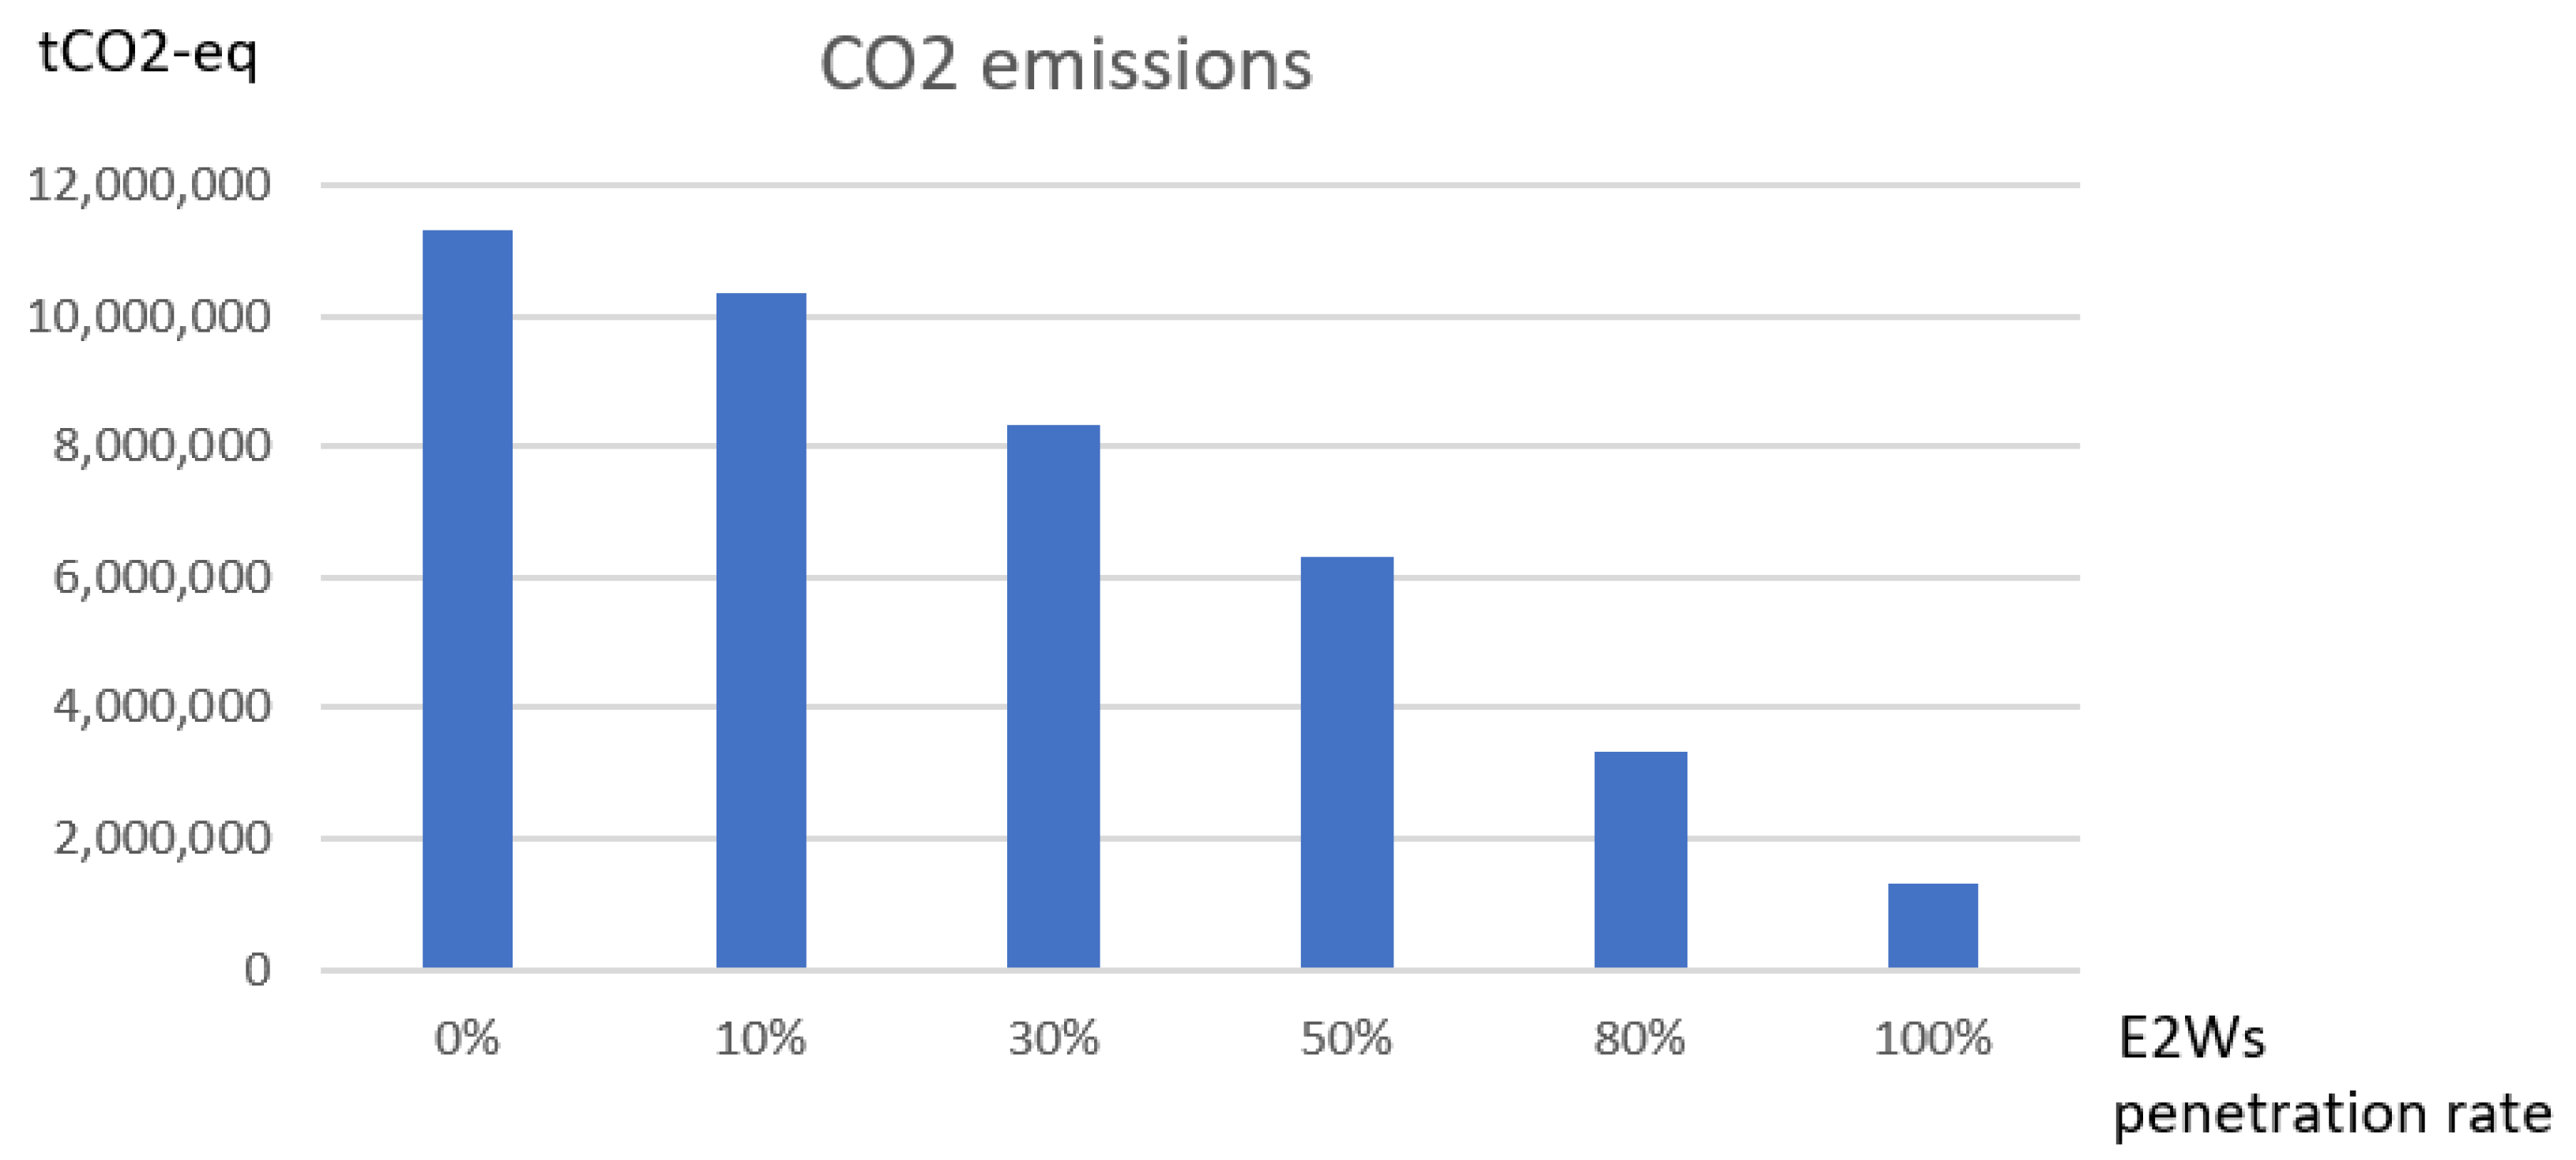
3.2. Transition to Electric Two-Wheeler Mobility

Several studies shown that compared to developed countries, in Vietnam as well as other developing countries, the transition to a more sustainable form of mobility—electric mobility—has notably distinct characteristics. Instead of electric four-wheelers, new forms of sustainable micro-mobility, such as electric scooters and shared bikes have been more thriving [62,63,64].
Except for China, the adoption of electric cars remains unpopular in developing nations [62]. Considering car ownership, less than 1% share of electric four-wheelers is seen in India [65]. In the emerging countries such as China and Vietnam, an overwhelming number of E2Ws are sold [63]. This is mainly related to the ease of travel and the low purchase price of E2Ws [4]. In 2018, E2Ws had a sale of 30 million units and a total stock of 250 million units in China [64]. Market share of E2Ws is slowly growing for other Asian countries as well, such as India, Vietnam and Taiwan.
In Vietnam, the immaturity of public transport, poor traffic infrastructure and economic condition are the main reasons of the prevalence of motorcycles which possess attractive attributes, including flexibility with regard to travel location, travel time and household travel arrangements, high space efficiency as well as moderate purchase costs and low operating costs (Table 10). However, factors that make moto use unattractive include poor safety, air and noise pollution and hot and wet weather, which are especially unpleasant for longer distance journeys. The drawbacks of the overwhelming gasoline-powered motorcycles in Hanoi and HCMC have directly heighten citizens and authorities’ awareness of air pollution as well-being of the community. The issue in accordance with the government’s GHG cut down commitment and sustainable development trend in energy and transportation sector have brought a more sustainable and less polluted alternative means of transport—E2Ws—to front.
With high rate of motorcycles adoption, the transition from gasoline-powered motorcycles to E2Ws would be more promising in Vietnam. It maintains remarkable advantages which make motorcycles become popular while adding other advantages such as zero tail-pipe emissions, higher efficiency, lesser noise and having potential of providing ancillary services.
Table 10 presents an assessment of different urban modes of transport for illustration purposes only as modes cover different trip distances and impacts may differ depending on local circumstances, particularly transport planning and environmental standards. Paratransit includes motorcycle taxies, three-wheelers and minibuses, which are sometimes used as feeder for mass public transport. Equity is based on typical travel costs including ticket prices for public transport and private vehicle total ownership costs. Parking and road space occupancy are considered in space efficiency. Lower CO2 emissions relate to higher energy efficiency. Public transport also involve physical activity since first/last mile trips are often done by walking or cycling. Other environmental factors such as battery production pollution, wear and tear pollution assessment are not considered here.
It is clearly that, compared to motorcycles, E2Ws would create lesser air pollutants, lesser noise and in some circumstances such as electric bicycles, it may provide more physical activity. E2Ws can also cover similar travel distance and have similar total cost of ownership while taking no more road space and space for parking than fossil fuel motorcycles. In terms of road safety, motorized two-wheelers are often associated with safety concerns. However, E2Ws, with lower speed than conventional motorcycles, may safer for people using them.
In Vietnam, unless E2Ws, other forms of electric micro-mobility such as Segway, electric kick scooter, hoverboard and monowheel have not been popular. In the dawn of electric vehicles in Vietnam, there are two types of E2Ws with modest price and quality: e-bike and e-scooters—mostly originating from China. At first, electric bicycles were more popular due to their low cost and can operate like bicycles when they run out of power. However, electric scooters quickly spread their appearance when Chinese manufacturers promoted this product. At that time, most of models had stylish designs (mostly copy popular scooter designs) and were cheaper than 50cc ICE counterparts. Therefore, E2Ws were often considered as an alternative to 50cc ICE vehicles, suitable for students who are under 18 years old. With their low speed, safer and modest price (around USD 400 [8]), E2Ws were also preferable choice of elders [66]. Compared with the ICE counterpart, electric bicycles provide a more comfortable experience and do not require driver’s license or vehicle registration. However, some of the reasons deterring people from the use of e-scooters/e-bikes is the presumption that e-vehicles cannot perform as well as their ICE counterpart in extreme weather conditions, such as flooding and heat. This belief is strengthened by the influx of low-quality electric vehicles into Vietnam [49].
The prejudice of low quality and old-fashioned electric scooters have changed somewhat when famous players participate the market and introduce their high-quality products, especially when Vietnamese carmaker—Vinfast—involves in this segment. The company has launched their electric motorcycle models (Klara, Ludo, Impes, Theon and Feliz) in a 6.4-hectare factory with a production capacity of 250,000 vehicles per year (up to 1 million vehicles) and plans to build thousands of charging and battery swapping stations. With modern Italian design, using components from famous brands such as Bosch, Nissin, or LG, moderate purchase price, multi-integrated features (eSim, anti-theft feature, cruise monitoring, operating history record, water resistance) and an excellent marketing campaign, VinFast’s electric motorcycles have greatly drawn the public’s attention.
Traditional motorcycle manufacturers, including Honda and Yamaha, are also showing their interest and taking actions towards the electric two-wheeler segment. Honda has launched and tested their electric scooters, Yamaha has introduced the Grande hybrid, while Piaggio introduced their electric Liberty model, electric bike (Wi-Bike) and Piaggio MP3 hybrid.
Year 2019 was a pretty booming year for electric scooters in Vietnam. Many brands have introduced new products such as Pega, Mbigo, Yadea, VinFast. Since then, electric scooters/electric bicycles have been “quietly” gaining market share. According to VinFast, the company currently sells an average of 10,000 electric scooters per month. There is currently no accurate statistics on the total number of electric vehicles consumed in Vietnam. But according to the International Association of Public Transport (UITP), by 2007, Vietnam had about 0.9 million low-speed E2Ws in its overall two-wheeler fleet of more than 40 million. By 2019, the number of E2Ws was about 5 million. Regarding vehicle manufacturers, according to data from the Registry Department, in 2018, there was 14 enterprises producing E2Ws with an output of 46,373 vehicles. In 2019, the number of manufacturing and assembling enterprises decreased to 11, but the output increased significantly to 52,938 vehicles. Market share are mainly of several manufacturers: VinFast, Pega (Vietnam), Yadea (China) and Mbigo (South Korea).
Currently, there are about 5 million electric bicycles and electric scooters in circulation nationwide. The growth rate of this segment is 30–40%/year.
In contrast, the traditional gasoline-powered motorcycles have begun to slow down in sales since the beginning of 2019. In 2020, the market was heavily affected by the Covid-19 pandemic. According to the Vietnam Association of Motorcycle Manufacturers (VAMM, with members including: Honda, Piaggio Vietnam, Suzuki, SYM and Yamaha), the number of motorbikes consumed in 2020 only reached 2,712,615 units, about 17% lower compared to 3,254,964 units in 2019 and was the lowest Figure in many years, after decreasing continuously during the 4 quarters of the year (Figure 14).
Hanoi’s planned project focuses on improving the attractiveness of e-scooters including plans for the development of charging stations and business models that will enable a wider use of e-scooters in the city, as well as developing charging solutions for e-mini-buses that are planned to be introduced in the city [49].
The project will include 200 shared e-scooters for first/last mile connectivity and include 20 e-mini-buses provided by the city and Vinfast. Fast charger (from ABB) will be used for testing. The shared e-scooter system will be equipped with 10 docking-cum-charging stations and contactless payment [49].
The fleet of shared electric scooters will provide connection with public transport system, solve first/last mile problems and encourage more people to move to public transport. The project will experiment innovative business models on E-minibuses and charging solutions, such as battery swapping technologies, using existing telecom and power distribution boxes to accommodate vehicle charging. Smart traffic system, eco-routing are other study purposes of the project. The demonstration project would have a high potential to not only raise the attractiveness of electric mobility but also reduce the GHG emissions and increasing the share of public transport use [49].
With regard to environment concern, how E2Ws can contribute to decreasing CO2 emission in Vietnam’s urbans? According to HCMC Transport Department, currently, HCMC has around 7.4 million motorbikes and those that have been in use for more than 10 years account for 68 percent of the total. The carbon monoxide and hydrocarbon, both harmful to humans, that is emitted from motorbikes account for 90 percent of the total emitted by all motor vehicles operating in the city. Recent research shows that, the average daily travel distance of motorcycle in HCMC is 19 km [67] and the emission factors are shown in Table 11.
Utilizing Equation (1), the amount of CO2 emissions for one year can be estimated:
E M = N M × E F c × D a v e . × 365 10 6  
where:
EM—Amount of CO2 emissions by motorcycles for one year
NM—Number of motorcycles
EFc—CO2 emission factor (g·km−1·vehicle−1)
Dave—average daily travel distance (km)
In case of replacing these vehicles by E2Ws, the amount of CO2 emissions depends on driving patterns, energy consumption per kilometer, and the electricity mix used to charge them. Table 12 depicts the CO2 emission factor of electricity generation in Vietnam in recent years.
With average energy consumption of electric motorcycles while driving in urban areas is 0.028 kWh/km [69], the amount of CO2 emissions can be calculated by Equation (2)
E E V = N E V × E F g r i d × D a v e × E C × 365 1000  
where:
EEV—Amount of CO2 emissions by E2Ws for one year
NEV—Number of E2Ws
EFgrid—Grid emission factor (tCO2·MWh−1)
Dave—Average daily travel distance (km)
EC—Energy consumption per kilometer (kWh/km)
Considering scenarios with E2Ws penetration rates in HCMC being 0%, 10%, 30%, 50%, 80%, and 100%, Table 13 and Figure 15 show the amount of CO2 emissions in each scheme.
It is obvious that the higher the rate of E2W penetration, the lower amount of CO2 emissions produced. When E2Ws substitute 10% of fossil fuel motorcycles in HCMC, it can help decrease CO2 emissions of 1,002,958 tCO2-eq. If all people in HCMC use E2Ws instead of gasoline motorcycles, a cut down of 88% can be seen in the CO2 emissions. This figure may be more impressive in the near future when more renewable electricity injects into the power grid.

4. Discussion and Recommendations

Substantial changes in urban mobility systems are required across the globe in order to reach sustainable development goals and climate change objectives. Indeed, sustainable urban transport is essential to achieve sustainable development targets related to urban access, reduced health impacts from air pollution and road traffic crashes, clean energy, inefficiency of fossil fuel subsidies, resilient infrastructure, climate change measures, and sustainable cities and communities.
In the transport sector, sustainable mobility means ensuring that the transport systems meet society’s economic, social, and environmental needs whilst minimizing their undesirable impacts on the economy, society, and the environment [70]. Users are provided with more affordable, accessible, healthier, and cleaner alternatives. In urban areas, regarding the sustainable combination of different means of transport, a multimodal transport system, the most efficient and sustainable modes should be prioritized. The system ensures effective integration of the transport modes and establishes interoperability at all levels of the transport system while encouraging the transition to more sustainable vehicles and allowing people to make choices that are more environmentally sustainable and/or physically beneficial.
Electric two-wheelers, which include vehicles ranging from bicycles to scooters, are becoming increasingly popular and important forms of urban transport in Asian cities, particularly in China. The potential environmental benefits to cities of electric two-wheelers could be significant, especially if they replace gasoline scooters [71].
However, whether electric two-wheelers can make a noteworthy contribution to the electrification of road transportation depends on their techno-economic, environmental, and social performance relative to competing modes of transportation. It is reasonable to assume that electric two-wheelers can decrease (i) urban air pollution when substituting conventionally powered two-wheelers and (ii) demand for infrastructure. However, anticipated benefits could turn into shortcomings if electric two-wheelers substitute public transportation and bicycle use [4]. Therefore, the development of electric two-wheelers also needs to consider their impacts on public transport and other sustainable means of transport.
In Vietnam, with a very high rate of gasoline-powered motorcycle ownership in big cities, immediate potentials for the electrification of road transport, notably in urban areas, may be offered by electric two-wheelers such as e-bikes, e-scooters, and e-motorcycles. Electric two-wheelers promise to better connect people with public transport and make better use of travel space, while being more consistent with the income level of the majority as well as existing infrastructure, reducing greenhouse gas emissions, and mitigating air and noise pollution. Although still in its infancy, electric micro-mobility including E2Ws could potentially help solve the first-mile/last-mile problem and narrow the gap between the transit services a community provides and the services its residents need [72].
To be explicit, most people might feel comfortable with the idea of walking a short distance to or from public transit stops (acceptable walking distance in Hanoi is from 400–500 m [73]). However, the problem arises when the walking distance is further than the acceptable distance to the necessary fixed-route stop. This is an inevitable side effect of a fixed-route transit system: stops are set at pre-determined locations to maximize efficiency, ease-of-planning and ease-of-operation. However, what is easiest for the agency is not what maximizes utility for the riders.
Of course, acceptable distances may vary based on uncontrollable factors such as weather conditions, time of day, and individuals’ practice habits.
In Hanoi, the average distance between bus stops is about 1.1 km. In the inner city, the proportion of people accessing buses with the distance of less than 500 m is about 80%. However, this figure is only about 30% in the suburbs. There are more than 3800 bus stops, but only 361 stations have waiting room. This means that, generally, after suffering from walking in the hot and wet weather condition to reach the bus stops, people must experience unpleasant time at the stops with no canopy and waiting chairs, waiting for buses.
Micro-mobility can eliminate public transit’s first-mile/last-mile problem by offering a more comfortable, more convenient experience for people reaching and accessing public transport services. However, this is only feasible if the public transport system is developed enough to meet the travel needs and attract citizens. Transportation hubs or multimodal stations also should be developed enough to accommodate the coordination of various modes of transport. Facilities at the transportation hubs should include “drop off and pick up” for first-mile/last-mile mobility such as taxis, motorbike taxis, cars, and motorcycles, parking, and bus interchanges with primary and feeder bus systems. This allows the smooth transfer of passengers from one transportation mode to another or convenient travel from public transport stations to home/work locations. E2Ws, which are useful for short trips [74], can provide first-mile/last-mile service as well as provision of a more sustainable mobility and zero tail-pipe emissions while circulating. This would be a remarkable advantage compared with gasoline-powered counterparts—the current popular vehicles that are blamed as the culprit of traffic congestion and air pollution in Vietnam.
However, studies show that while electric micro-mobility vehicles can help solve first-/last-mile problems, they can also create some issues in urban spaces and road safety. These vehicles occupy additional urban space as well as additional infrastructure such as charging points and parking slots. Unless E2Ws are used to replace gasoline-powered counterparts, they would contribute a heavier burden on existing transport infrastructure as well as existing power grid infrastructure.
Since EVs in Vietnam are mainly electric motorcycles and electric bikes (instead of Segways, hoverboards, and monowheels), they cannot be permitted to move on pavements or sidewalks. Therefore, there would be no conflict between pedestrians and EV users.
According to Decree No. 100/2019/ND-CP and road traffic legislation 2008, motorcyclists, electric motorcycle/e-bike drivers, and passengers on motorcycles/mopeds/electric scooters/electric bikes must wear helmets. Helmet-wearing regulation is applied to both conventional motorcycles and E2W users. With the purpose of replacing fossil fuel motorcycles, road safety issues are transferring from the higher speed vehicles to the lower ones. This contributes to being more acceptable by the public, who are suffering from the increasing noise and air pollution and want to transfer to a less polluting form of mobility. Obviously, the alternative should be an affordable option and should possess characteristics that make gasoline motorcycles popular in Vietnam’s urban traffic. To summarize, in the case of Vietnam, the transition to E2W mobility is inevitable and promising in the near future because of the following reasons:
  • Worse air quality in big cities raises the public’s awareness of environmental concerns. This urges people to move to less-polluting forms of mobility, and E2Ws emerge as a good alternative to fossil fuel motorcycles—a main culprit of urban air pollution.
  • Average income level in Vietnam is still low. Electric cars or even conventional cars are beyond the reach of the majority because of the expensive purchase price, tax, fees, and high operation costs. With regard to E2Ws, they are becoming more affordable, as total cost of ownership of E2Ws is approximately similar to motorcycles.
  • E2Ws are an efficient option for people to move in Vietnam’s narrow road traffic conditions. People who live in small alleys in residential areas far from the main road find it difficult to reach buses or use private cars, while E2Ws are easy, fast, and convenient. E2Ws also occupy smaller urban space in terms of parking and road occupancy.
  • The level and quality of public transport is relatively low. Therefore, in the immediate future, private vehicles including E2Ws are the preferred means of transportation.
  • Currently, the government’s orientation is sustainable development and low emissions (environmentally friendly, increasing the quality of urban life). In terms of urban transportation, the orientation is to develop two-wheeled electric vehicles that are suitable for Vietnam’s infrastructure.
  • Though EVs are more efficient than gasoline-powered vehicles and have no emissions at the tailpipe, the reduction in GHG emissions and overall air quality benefits they bring depend on the mix of generation sources on the grid used to charge them. In Vietnam, with a continuing larger share of renewable energy, EV adoption including E2Ws can help optimally utilize the surplus renewable energy or even take part in dispatch operation.
  • The development of E2Ws may promise the deployment of intelligent transport system in the near future.
Currently, there are signs of a transition towards two-wheeled electric mobility in Vietnam, especially in large metropolises. E2Ws are drawing more attention from the public and policy makers as an eco-friendly transport method and connecting vehicles to public transport. Although the growth rate of E2Ws ownership is 30–40%/year, there are only 5 million electric bicycles/electric scooters in circulation nationwide compared to 61.3 million gasoline motorcycles in 2019. The development of E2Ws in Vietnam still has some challenges. Currently, there is no research on the current status and development trends of electric vehicles in Vietnam, especially in big cities. The impacts of EVs on the existing transport systems, transport infrastructure, and charging requirements have not been studied yet. In addition, there are no technical standards and guidelines for EVs in Vietnam. The lack of policies for electric vehicles is also curving the development of this type of vehicle.
Our study is only the first step in research on sustainable development of E2Ws in Vietnam. In order to urge the transition from fossil fuel motorcycles to E2Ws, it requires the coordination of many parties, from policy makers, manufacturers, the media, and active participation of the citizens. For the sustainable development of E2Ws in Vietnam, several suggestions should be considered:
  • Build research groups to promote the development of electric vehicles in Vietnam. The research field may vary from impacts of EVs participation on urban traffic, urban planning, technical guidelines, standards, charging facilities, policies and regulations relating to EVs in Vietnam, or life cycle assessment.
  • Propose policies to encourage the development of E2Ws and support manufacturers and consumers when switching to electric vehicles. Measures could include banning non-electric powered two-wheelers, providing dedicated parking, creating charging areas and separate lanes for electric two-wheelers and special waiting areas at intersections for motorcycles, or excluding electric two-wheelers from city tolls.
  • Evaluate the impact of electric vehicles on existing infrastructure, especially on the power grid, and propose appropriate solutions.
  • Evaluate the environment impact, especially the process of handling the battery at the end of its life.
  • Currently, there are no general technical standards for E2Ws in Vietnam. Therefore, in the immediate future, it is necessary to study and propose technical standards and regulations applicable to electric bicycles/electric motorcycles, such as standards for charging and batteries.
  • Research and propose charging station infrastructure, especially when a large number of E2Ws are participating.
  • Propose and evaluate the efficiency of business models such as vehicle sharing, battery rental, and business models for charging stations.
  • Research planning E2Ws as effective vehicles for short-distance travel and a vehicle type for connecting with public transport system.

Author Contributions

Conceptualization, D.N.H. and V.N.N.; methodology, D.N.H. and V.N.N.; validation, D.N.H. and V.N.N.; formal analysis, D.N.H.; investigation, V.N.N.; resources, V.N.N.; data curation, V.N.N.; writing—original draft preparation, V.N.N.; writing—review and editing, D.N.H.; visualization, V.N.N.; supervision, D.N.H.; project administration, D.N.H. All authors have read and agreed to the published version of the manuscript.

Funding

This research received no external funding.

Acknowledgments

The authors further like to acknowledge Electric Power University for administrative support.

Conflicts of Interest

The authors declare no conflict of interest.

References

  1. General Statistics Office (GSO). Volume of Freight Traffic by Type of Transport. Available online: https://www.gso.gov.vn/en/px-web/?pxid=E0910&theme=Transport%2C%20Postal%20Services%20and%20Telecommunications (accessed on 20 September 2020).
  2. Decision No. 318/QD-TTg on Approving the Strategy for Development of Transportation Services through 2020 and Orientations toward 2030. Available online: http://vanban.chinhphu.vn/portal/page/portal/chinhphu/hethongvanban?class_id=2&mode=detail&document_id=172715 (accessed on 25 September 2020).
  3. Decision No. 355/QD-TTg on Approving the Adjusted Strategy for Transport Development Through 2020, with a Vision toward 2030. Available online: http://vanban.chinhphu.vn/portal/page/portal/chinhphu/hethongvanban?class_id=2&_page=1&mode=detail&document_id=165965 (accessed on 25 September 2020).
  4. Weiss, M.; Dekker, P.; Moro, A.; Scholz, H.; Patel, M.K. On the Electrification of Road Transportation—A Review of the Environmental, Economic, and Social Performance of Electric. Transp. Res. Part D 2015, 41, 348–366. [Google Scholar] [CrossRef] [PubMed]
  5. Worldometer. Vietnam Population. Available online: https://www.worldometers.info/world-population/vietnam-population/ (accessed on 25 September 2020).
  6. United Nations Population Fund (UNFPA), Vietnam Institute for Development Strategies. Impacts of Changes to the Population Age Structure on Vietnam’s Economy and Policy Recommendations; UNFPA: Hanoi, Vietnam, 2016. [Google Scholar]
  7. The World Bank. GNI Per Capita, Atlas Method—Vietnam. Available online: https://data.worldbank.org/indicator/NY.GNP.PCAP.CD?locations=VN (accessed on 15 October 2020).
  8. International Energy Agency. Global EV Outlook 2020; IEA: Paris, France, 2020. [Google Scholar]
  9. Thai, H.T.; Rementsov, A.; Nguyen, K.M.; Le, A. Taxi transport characteristics in Vietnam. In IOP Conference Series Materials Science and Engineering; IOP Publishing: Bristol, UK, 2020; Volume 832. [Google Scholar]
  10. General Statistics Office (GSO). Volume of Freight Carried by Types of Transport. Available online: https://www.gso.gov.vn/en/px-web/?pxid=E0909&theme=Transport%2C%20Postal%20Services%20and%20Telecommunications (accessed on 15 October 2020).
  11. Hoang, D.A.; Lam, Y.Y.; Amos, P.; Reddel, P.; Phuong, P.T.; Hien, N.T.P. Sustainable Development of Inland Waterways Transport in Vietnam: Strengthening the Regulatory, Institutional and Funding Frameworks; World Bank working paper; World Bank Group: Washington, DC, USA, 2019. [Google Scholar]
  12. General Statistics Office (GSO). Number of Passengers Carried by Types of Transport. Available online: https://www.gso.gov.vn/en/px-web/?pxid=E0901&theme=Transport%2C%20Postal%20Services%20and%20Telecommunications (accessed on 12 December 2020).
  13. General Statistics Office (GSO). Number of Passengers Traffic by Types of Transport. Available online: https://www.gso.gov.vn/en/px-web/?pxid=E0902&theme=Transport%2C%20Postal%20Services%20and%20Telecommunications&subtheme=Number%20of%20passengers%20traffic%20by%20types%20of%20transport%20(*) (accessed on 12 December 2020).
  14. World Bank; Ministry of Planning and Investment of Vietnam. Vietnam 2035: Toward Prosperity, Creativity, Equity, and Democracy; World Bank: Washington, DC, USA, 2016. [Google Scholar]
  15. Rodrigue, J.; Comtois, C.; Slack, B. The Geography of Transport Systems, 3rd ed.; Taylor & Francis Group: London, UK; New York, NY, USA, 2013. [Google Scholar]
  16. United Nations. World Urbanization Prospects—The 2018 Revision; United Nations: New York, NY, USA, 2019. [Google Scholar]
  17. United Nations. World Urbanization Prospects: Country Profiles—Vietnam. Available online: https://population.un.org/wup/Country-Profiles/ (accessed on 15 January 2021).
  18. Ha, N.M.; Le, N.D.; Trung-Kien, P. The Impact of Urbanization on Income Inequality: A Study in Vietnam. J. Risk Financ. Manag. 2019, 12, 146. [Google Scholar] [CrossRef] [Green Version]
  19. The World Bank. Urban Population Growth—Vietnam, Philippines, Thailand, India, China, Indonesia. Available online: https://data.worldbank.org/indicator/SP.URB.GROW?end=2019&locations=VN-PH-TH-IN-CN-ID&start=2006 (accessed on 15 January 2021).
  20. Truong, T. Land Fund for Traffic in Hanoi Is Only 1/3 Compared with the World’s Average. Available online: https://thuongtruong.com.vn/news/quy-dat-gianh-cho-giao-thong-tai-ha-noi-chi-bang-1-3-cua-the-gioi-19020.html (accessed on 15 January 2021).
  21. Vietnam Times. Land Fund for Traffic in Hanoi, Ho Chi Minh City Only Account for 9 Percent. Available online: https://thoidai.com.vn/quy-dat-danh-cho-giao-thong-tai-ha-noi-tp-hcm-chi-chiem-9-78317.html (accessed on 15 January 2021).
  22. Zhu, J. Development of Sustainable Urban Forms for High-Density Low-Income Asian Countries: The Case of Vietnam: The Institutional Hindrance of the Commons and Anticommons. Cities 2012, 29, 77–87. [Google Scholar] [CrossRef]
  23. World Population Review. Ho Chi Minh Population. Available online: https://worldpopulationreview.com/world-cities/ho-chi-minh-city-population (accessed on 20 January 2021).
  24. Vietnam Briefing. Ho Chi Minh City: How Vietnam’s Emerging Megacity Will Develop. Available online: https://www.vietnam-briefing.com/news/ho-chi-minh-city-how-vietnams-emerging-megacity-will-develop.html/ (accessed on 20 January 2021).
  25. Truong, T.H.; Thao, T.T.; Tung, S.T. Housing and Transportation in Vietnam’s Ho Chi Minh City—Case Studies in Social Urban Development; Friedrich-Ebert-Stiftung (FES): Hanoi, Vietnam, 2017. [Google Scholar]
  26. Toan, T.D.; Van Dong, D. Integrated Transport Planning for Sustainable Urban Development—Singapore’ Approach and Lessons for Vietnam. In CIGOS 2019, Innovation for Sustainable Infrastructure; Springer: Singapore, 2019; pp. 947–952. [Google Scholar]
  27. United Nations. Road Safety Performance Review—Vietnam; United Nations: New York, NY, USA; Bangkok, Thailand, 2018. [Google Scholar]
  28. Chu, X.N.; Thi, H.D. Actual situation and solutions for reducing the traffic jams and congestion in Vietnam. Adv. Nat. Appl. Sci. 2017, 11, 26–33. [Google Scholar]
  29. Hai Quan Online. Land Fund for Traffic Is Too Small, Causing Congestion in Big Cities. Available online: https://haiquanonline.com.vn/quy-dat-danh-cho-giao-thong-qua-it-gay-un-tac-tai-thanh-pho-lon-105488.html (accessed on 8 February 2021).
  30. Thong, G. Land Fund for Transport in Hanoi “Stands Still”. Available online: https://www.baogiaothong.vn/vi-sao-quy-dat-giao-thong-ha-noi-dam-chan-tai-cho-d465795.html (accessed on 8 February 2021).
  31. Zhang, H. Using Accessibility to Evaluate the Benefits of a Bus Rapid Transit Line: A Case Study in Hanoi. Master’s Thesis, University of Twente, Enschede, The Netherlands, 2014. [Google Scholar]
  32. Nguyen, D.T.; Kajita, Y. Traffic Congestion and Impact on the Environment in Vietnam: Development of Public Transport System—Experience from Actual Operation of Bus in Hanoi. J. Civ. Environ. Eng. 2018, 8, 3017. [Google Scholar] [CrossRef]
  33. Lozzi, G.; Rodrigues, M.; Marcucci, E.; Teoh, T.; Gatta, V.; Pacelli, V. Research for TRAN Committee—COVID-19 and Urban Mobility: Impacts and Perspectives; European Parliament, Policy Department for Structural and Cohesion Policies: Brussels, Belgium, 2020. [Google Scholar]
  34. Ngoc, T.B. Challenges and Solutions for Sustainable Urban Transport in Cities of Vietnam; Vietnam Ministry of Transport: Hanoi, Vietnam, 2015. [Google Scholar]
  35. Huong, N.T.T. Bus signal priority by active signal program—A case study in Ho Chi Minh City (HCMC), Vietnam. In CIGOS 2019, Innovation for Sustainable Infrastructure; Springer: Singapore, 2019; pp. 971–976. [Google Scholar]
  36. VietNamNet. Hanoi Announces Transport Plan to 2030. Available online: http://english.vietnamnet.vn/fms/society/161424/hanoi-announces-transport-plan-to-2030.html#:~:text=Hanoi%20a-nounces%20transport%20plan%20to%202030%20%2D%20News%20VietNamNet&text=VietNamNet%20Bridge%20%E2%80%93%20The%20Hanoi%20People%27s,billion%20(nearly%20%2455.4%20billion) (accessed on 15 February 2021).
  37. Far East Mobility. World Bank’s First BRT in Asia Is Designed to Fail. Available online: https://www.fareast.mobi/en/feature/hnbrtjan17 (accessed on 15 February 2021).
  38. Dan, N. WB Specialist Believes in First BRT Route’s Effects in Hanoi. Available online: https://en.nhandan.com.vn/society/item/4879702-wb-specialist-believes-in-first-brt-route%E2%80%99s-effects-in-hanoi.html (accessed on 15 February 2021).
  39. CENTRE for Liveable Cities (CLC), Urban Land Institute—Asia Pacific. Urban Mobility: 10 Cities Leading the Way in Asia-Pacific; CLC: Singapore, 2017.
  40. Hoang, A.T.; Pham, V.V. A study of emission characteristic, deposits, and lubrication oil degradation of a diesel engine running on preheated vegetable oil and diesel oil. Energy Sources Part A Recovery Util. Environ. Eff. 2019, 41, 611–625. [Google Scholar] [CrossRef]
  41. Hung, K.V. Traffic Safety Strategies for Vietnam. In Proceedings of the 8th Asian Transport Research Society (ATRANS) Symposium “Transportation for a Better Life”, Bangkok, Thailand, 18 August 2015. [Google Scholar]
  42. World Health Organization (WHO). Global Status Report on Road Safety; World Health Organization: Geneva, Switzerland, 2015. [Google Scholar]
  43. United Nations Industrial Development Organization (UNIDO); Ministry of Industry and Trade of Vietnam; In Partnership with the Republic of Korea. Vietnam Industry Whitepaper 2019—Manufacturing and Subsector Competitiveness; UNIDO: Hanoi, Vietnam, 2019.
  44. The Vietnam Association of Motorcycle Manufacturers (VAMM). Sales Data. Available online: https://vamm.vn/sales-data/ (accessed on 5 March 2021).
  45. MotorCycles Data (McD), Vietnam 2020. Motorcycles Market Dropped below the 3 Million Sales after a Decade. Available online: https://www.motorcyclesdata.com/2020/10/26/vietnam-motorcycles/ (accessed on 5 March 2021).
  46. Tuoi Tre. 90% of Buyers in Hanoi, HCMC cannot Afford New Cars: Automaker. Available online: https://tuoitrenews.vn/news/business/20140831/90-of-buyers-in-hanoi-hcmc-cannot-afford-new-cars-automaker/6598.html (accessed on 5 March 2021).
  47. Thuy, N.T.X.; Linh, D.T.; Truong, N.H.; Diep, T.T.N. A Research on Supporting Industry for Automobile Assemblers in Vietnam; Japan International Cooperation Agency (JICA): Hanoi, Vietnam, 2016.
  48. General Statistics Office (GSO). Monthly Average Income per Capita at Current Prices by Income Quintile, by Residence, by Sex of Household Head and by Region. Available online: https://www.gso.gov.vn/en/px-web/?pxid=E1130&theme=Health%2C%20Culture%2C%20Sport%20and%20Living%20standard (accessed on 7 March 2021).
  49. Shrestha, S.; Kodukula, S. Hanoi e-Mobility for Last-Mile Connectivity; Project Scoping Urban Pathway; URBAN: Berlin, Germany, 2019. [Google Scholar]
  50. World Health Organization (WHO). Ambient (Outdoor) Air Pollution. Available online: http://www.who.int/en/news-room/fact-sheets/detail/ambient-(outdoor)-air-quality-and-health (accessed on 15 March 2021).
  51. Karagulian, F.; Belis, C.A.; Dora, C.F. Contributions to cities’ ambient particulate matter (PM): A systematic review of local source contributions at global level. Atmos. Environ. 2015, 120, 475–483. [Google Scholar] [CrossRef]
  52. World Health Organization (WHO). More than 60,000 Deaths in Vietnam Each Year Linked to Air Pollution. Available online: https://www.who.int/vietnam/news/detail/02-05-2018-more-than-60-000-deaths-in-viet-nam-each-year-linked-to-air-pollution (accessed on 15 March 2021).
  53. VnExpress. Hanoi Air Quality Improves, Still among Southeast Asia’s Worst. Available online: https://e.vnexpress.net/news/news/hanoi-air-quality-improves-still-among-southeast-asia-s-worst-3890174.html (accessed on 20 March 2021).
  54. The Diplomat. Vietnam’s Big Air Pollution Challenge. Available online: https://thediplomat.com/2020/03/vietnams-big-air-pollution-challenge/ (accessed on 20 March 2021).
  55. Khuat Viet, H. Motorcycle dependent city—A case study in Hanoi. In Proceedings of the Second International Conference on Sustainability Science in Asia, Hanoi, Vietnam, 2–4 March 2011. [Google Scholar]
  56. VietnamNet. Hanoi will Ban Motorcycles, Charge Fees on Cars Entering the Inner-City. Available online: https://vietnamnet.vn/vn/thoi-su/an-toan-giao-thong/ha-noi-se-cam-xe-may-thu-phi-o-to-noi-do-nam-2030-581970.html (accessed on 20 March 2021).
  57. Resolution No. 04/2017/NQ-HDND on Approving Project on Tightening Control over Vehicles in Order to Reduce Traffic Jam and Environmental Pollution in the 2017–2020 Period and Vision to 2030. Available online: https://vanban.hanoi.gov.vn/vanbanphapquy/-/vb/nsGpxUlb7ddQ/2737707.html (accessed on 26 September 2020).
  58. Decision No. 5953/QD-UBND on Approving the Scheme “Strengthening the Management of Road Transport Means to Reduce Traffic Congestion and Environmental Pollution in Hanoi city, the Period of 2017–2020 Vision 2030”. Available online: https://sogtvt.hanoi.gov.vn/van-ban-phap-quy?p_p_id=4_WAR_portalvbpqportlet&p_p_lifecycle=0&p_p_state=normal&p_p_mode=view&p_p_col_id=column-1&p_p_col_count=1&_4_WAR_portalvbpqportlet_id=69414&_4_WAR_portalvbpqportlet_mvcPath=%2Fhtml%2Fportlet%2Flist%2Fview_detail.jsp (accessed on 27 September 2020).
  59. Duong, Q.H. Bus Rapid Transit in Hanoi, A Case Study of Applying a New Model of Public Transportation. Bachelor’s Thesis, JAMK University of Applied Sciences, Jyväskylä, Finland, 2019. [Google Scholar]
  60. VnExpress. Experts Warn against Hanoi Motorbike Ban, Say Public Transport Not Good Enough. Available online: https://e.vnexpress.net/news/news/experts-warn-against-hanoi-motorbike-ban-say-public-transport-not-good-enough-3895112.html (accessed on 25 March 2021).
  61. Prime Minister Directive No 03/CT-TTg on Enhancing Air Pollution Control. Available online: http://vanban.chinhphu.vn/portal/page/portal/chinhphu/hethongvanban?class_id=2&_page=1&mode=detail&document_id=202407 (accessed on 21 February 2021).
  62. Rajper, S.Z.; Albrecht, J. Prospects of Electric Vehicles in the Developing Countries: A Literature Review. Sustainability 2020, 12, 1906. [Google Scholar] [CrossRef] [Green Version]
  63. Doucette, R.T.; McCulloch, M.D. Modeling the CO2 Emissions from Battery Electric Vehicles given the Power Generation Mixes of Different Countries. Energy Policy 2011, 39, 803–811. [Google Scholar] [CrossRef]
  64. Bakker, S. Electric Two-Wheelers, Sustainable Mobility and the City. In Sustainable Cities-Authenticity, Ambition and Dream; IntechOpen: London, UK, 2019. [Google Scholar]
  65. International Energy Agency. Global EV Outlook 2019; IEA: Paris, France, 2019. [Google Scholar]
  66. PwC. Vietnam Automotive Industry: Impact of COVID-19 and Navigating the Turbulence; PwC: Hanoi, Vietnam, 2020. [Google Scholar]
  67. Nguyen, T.T.Q.; Takeuchi, W.; Misra, P. Technical note: Emission mapping of key sectors in Ho Chi Minh city, Vietnam using satellite derived urban land-use data. Atmos. Chem. Phys. 2021, 21, 2795–2818. [Google Scholar] [CrossRef]
  68. Ministry of Natural Resources and Environment, Department of Climate Change. Final Report on the Study and Development of Emission Factor (EF) for Vietnamese Electrical Grid in 2018; Ministry of Natural Resources and Environment: Hanoi, Vietnam, 2020. [Google Scholar]
  69. Koossalapeerom, T.; Satiennam, T.; Satiennam, W.; Leelapatra, W.; Seedam, A.; Rakpukdee, T. Comparative Study of Real-World Driving Cycles, Energy Consumption, and CO2 Emissions of Electric and Gasoline Motorcycles Driving in a Congested Urban Corridor. Sustain. Cities Soc. 2019, 45, 619–627. [Google Scholar] [CrossRef]
  70. Gallo, M.; Marinelli, M. Sustainable Mobility: A Review of Possible Actions and Policies. Sustainability 2020, 12, 7499. [Google Scholar] [CrossRef]
  71. Asian Development Bank. Electric Two-Wheelers in India and Viet Nam: Market Analysis and Environmental Impacts; ADB: Mandaluyong City, Philippines, 2009. [Google Scholar]
  72. Deloitte Insights. Transportation Trends 2020; Deloitte: New York, NY, USA, 2020. [Google Scholar]
  73. Hoang-Tung, N.; Kato, H.; Huy, T.T.; Le Binh, P.; Duy, L. Impact of the introduction of bus rapid transit on travel behaviors of commuters in Hanoi, Vietnam: A quasi-experimental approach. Case Stud. Transp. Policy 2021, 9, 95–102. [Google Scholar] [CrossRef]
  74. Boglietti, S.; Barabino, B.; Maternini, G. Survey on e-Powered Micro Personal Mobility Vehicles: Exploring Current Issues towards Future Developments. Sustainablity 2021, 13, 3692. [Google Scholar] [CrossRef]
Figure 1. Freight transport distribution in Vietnam.
Sustainability 13 05577 g001
Figure 2. The growth in the number of passengers carried (mil. people) by types of transport in the period of 2007–2018.
Sustainability 13 05577 g002
Figure 3. The growth in the number of passengers traffic (mil. people. km) by types of transport in the period of 2007–2019.
Sustainability 13 05577 g003
Figure 4. Percentage of population in urban and rural areas in Vietnam [17].
Sustainability 13 05577 g004
Figure 5. Vietnam, China, India, Indonesia, Philippines, and Thailand: Urbanization from 2006 to 2019 [19].
Sustainability 13 05577 g005
Figure 6. Percentage of land used for transportation in several cities [28].
Sustainability 13 05577 g006
Figure 7. The first BRT route map in Hanoi [38].
Sustainability 13 05577 g007
Figure 8. Mode share across the 10 cities [39].
Sustainability 13 05577 g008
Figure 9. Passenger modal split in Shanghai, Yangon, and Ho Chi Minh city [39].
Sustainability 13 05577 g009
Figure 10. Vietnam motorizing ownership vs. other countries [41].
Sustainability 13 05577 g010
Figure 11. Proportion of motorcycles out of total motorized vehicles compared to other ASEAN countries, 2013 [42].
Sustainability 13 05577 g011
Figure 12. Motorcycle sales volume in Vietnam from Q3/2017 to Q1/2020 [44].
Sustainability 13 05577 g012
Figure 13. The 15 most polluted cities in Southeast Asia in 2018 (source: livingasean).
Sustainability 13 05577 g013
Figure 14. Sales volume of motorcycles in Vietnam from 2011–2020.
Sustainability 13 05577 g014
Figure 15. CO2 emission (tCO2-eq) in different E2Ws penetration rate scenarios.
Sustainability 13 05577 g015
Table 1. Volume of freight (thousand tons) carried by types of transport in the period of 2007–2018 [10].
YearTotal (Thous. Tons)Railway (Thous. Tons)Road (Thous. Tons)Inland Waterway (Thous. Tons)Maritime Transport (Thous. Tons)Aviation Transport (Thous. Tons)
2007596,800.99050403,361.8135,282.848,976.7129.6
2008653,235.38481.1455,898.4133,027.955,696.5131.4
2009715,522.48247.5513,629.9137,714.555,790.9139.6
2010800,8867861.5587,014.2144,22761,593.2190.1
2011885,681.57285.1654,127.1160,164.563,904.5200.3
2012961,128.46952.1717,905.7174,385.461,694.2191
20131,010,413.96525.9763,790181,212.758,701.6183.7
20141,078,580.97178.9821,700190,60058,900202
20151,146,895.76707877,628.4201,530.760,800229.6
20161,255,458.25209969,721215,768.264,474.4285.6
20171,383,212.95611.11,074,450.9232,813.870,019.2317.9
20181,526,917.257351,195,863.9250,274.974,640.5402.9
Table 2. Percentage of domestic freight transport in Vietnam by mode of transport (2016) [11].
ModeTons Loaded (%)Ton-Kilometers Performed (%)Average Distance (Kilometers)
Road77.2%23.7%50
Rail0.4%1.3%615
Inland waterways17.1%18.9%212
Coastal shipping5.2%55.7%2046
Aviation0.0%0.3%2333
Table 3. Number of passengers carried (mil. people) by types of transport in the period of 2007–2018 [12].
YearTotal (Mil. People)Railways (Mil. People)Road (Mil. People)Inland Waterways (Mil. People)Aviation Transport (Mil. People)
2007163811.61473144.58.9
20081793.511.3162914310.2
20092016.911.11843.6151.310.9
20102315.211.22132.3157.514.2
20112476.111.92306.7142.415.1
20122676.512.22504.314515
20132839.912.12660.5150.416.9
20143056.8122863.5156.924.4
20153310.511.23104.7163.531.1
20163623.29.83401.9172.938.6
20174027.19.53793.2179.944.5
20184456.28.64206.6192.148.9
Table 4. Number of passengers traffic (mil. people. km) by types of transport [13].
YearTotal (Mil. People. km)Railways (Mil. People. km)Road (Mil. People. km)Inland Waterways (Mil. People. km)Aviation Transport (Mil. People. km)
200771,864.64659.549,372.13151.414,681.6
200878,1804560.454,221.13246.216,152.3
200985,202.74138.161,508.83048.216,507.6
201097,931.84377.969,197.43194.521,162
2011108,709457178,013.32855.723,269
2012116,043.74600.684,9822835.123,626
2013124,528.24416.690,319.82914.126,877.7
2014139,060.44481.996,885.32985.734,707.5
2015154,664.74149.6105,382.23064.542,068.4
2016169,076.93421.6114,198.83219.948,236.6
2017186,834.43625.1125,390.33504.654,314.4
2018206,672.73542.1130,774.74499.967,856
Prel. 2019230,779.93170.5145,612.64812.977,183.9
Table 5. Motorized road vehicles, 2005–2016 (Source: Department of Traffic Police).
Year Number of Motorcycles/Mopeds Registered Increase over Previous Year Increase Rate (Percent) Total Vehicles
200516,086,644 2,710,625 17,094,028
200618,615,960 2,529,316 15.7219,670,689
200721,721,282 3,105,322 16.6822,961,618
200825,481,039 3,759,757 17.3127,097,735
200928,431,079 2,950,040 11.5830,141,421
201031,452,503 3,021,424 10.6333,344,344
201133,925,839 2,473,336 7.8635,977,885
201236,102,943 2,177,104 6.4232,205,155
201338,643,091 2,540,148 7.0440,946,010
201441,212,965 2,569,874 6.6543,764,558
201544,128,822 2,915,857 7.0847,105,166
201647,131,928 3,033,106 6.8750,535,727
Table 6. Motorcycle sales volume of five biggest manufacturers in Vietnam from 2016 to 2019 [44].
Year2016201720182019
Sales volume3,121,0233,272,3733,386,0973,254,964
Table 7. Motorcycle sales volume of five biggest manufacturers in Vietnam from Q3/2017 to Q1/2020 [44].
TimeAccumulated Sales Volume
Q3/2017845,604
Q4/2017899,461
Q1/2018803,204
Q2/2018783,940
Q3/2018864,958
Q4/2018933,996
Q1/2019753,934
Q2/2019749,516
Q3/2019831,440
Q4/2019920,074
Q1/2020731,077
Q2/2020518,920
Q3/2020677,739
Table 8. Monthly average income per capita at current prices (thous. Dong) [48].
20102012201420162018Prel. 2019
Whole country(thous. Dong)138720002637309838764295
Residence—Urban (thous. Dong)213029893964455156236022
Residence—Rural (thous. Dong)107015792038242329903399
Table 9. Ambient (outdoor) air pollution guide line value [50].
Guidelines forGuideline ValuesHealth EffectsPrincipal Sources
Particulate Matter (PM)Fine particulate matter (PM2.5)
10 μg/m3 annual mean
25 μg/m3 24-h mean
Coarse particulate matter (PM10)
20 μg/m3 annual mean
50 μg/m3 24-h mean
Air pollution-related diseases, including acute lower respiratory infections, cardiovascular disease, chronic obstructive pulmonary disease and lung cancerIn low- and middle-income countries, exposure to pollutants in and around homes from the household combustion of polluting fuels on open fires or traditional stoves for cooking, heating and lighting
Ozone (O3)100 μg/m3 8-h meanOzone is a major factor in asthma morbidity and mortality
It can cause breathing problems, trigger asthma, reduce lung function and cause lung diseases
Ozone at ground level is one of the major constituents of photochemical smog. It is formed by the reaction with sunlight (photochemical reaction) of pollutants such as nitrogen oxides (NOx) from vehicle and industry emissions and volatile organic compounds (VOCs) emitted by vehicles, solvents and industry.
Nitrogen dioxide (NO2)40 μg/m3 annual mean
200 μg/m3 1-h mean
NO2 can play a role in asthma, bronchial symptoms, lung inflammation and reduced lung function
Symptoms of bronchitis in asthmatic children increase in association with long-term exposure to NO2
NO2 is the main source of nitrate aerosols, which form an important fraction of PM2.5 and, in the presence of ultraviolet light, of ozone. The major sources of anthropogenic emissions of NO2 are combustion processes (heating, power generation, and engines in vehicles and ships).
Sulfur dioxide (SO2)20 μg/m3 24-h mean
500 μg/m3 10-min mean
SO2 can play a role in asthma, bronchial symptoms, lung inflammation and reduced lung function
SO2 can affect the respiratory system and the functions of the lungs, and causes irritation of the eyes.
SO2 is a colourless gas with a sharp odour. It is produced from the burning of fossil fuels (coal and oil) and the smelting of mineral ores that contain sulfur. The main anthropogenic source of SO2 is the burning of sulfur-containing fossil fuels for domestic heating, power generation and motor vehicles.
Table 10. Environmental and social sustainability impacts of urban transport modes [64].
ModeTypical Trip Distance (km)EquitySpace EfficiencyAir PollutionCO2 Emissions/Energy UseNoisePhysical Activity
Walking<1.5++++++++++++++++++
Cycling1–5++++++++++++++++++
E2W1–15++++++++++++++
Motorcycle1–15++++++00
PT + NMT1–20 ++++++++++++++
PT + paratransit1–20 ++++++++++
Paratransit1–5++++0++0
Car1–20 ++0+0+0
Note: PT, public transport; NMT, nonmotorized transport; 0, lowest rating; +, low rating; ++, medium rating; +++, high rating.
Table 11. The emission factors (g·km−1·vehicle−1) [67].
PollutantMotorcyclesCar and TaxiBusTruck
CO12.5922.216.9053.1
NOx0.1951.0516.95417
SO20.010.170.641.06
PM2.50.0180.030.91.1
PM100.0940.32.083.28
NMVOC2.3415.0289.9289.92
CO22215302050486
Table 12. The emission factors (tCO2·MWh−1) [68].
Emission Factor201620172018
EFgrid0.91850.86490.9130
Table 13. The amount of CO2 emissions in different E2Ws penetration scenarios.
Total VehicleE2Ws Penetration RateNumber of E2WsNumber of Gasoline MotorcyclesGasoline Motorcycle CO2 Emissions (tCO2-eq)E2Ws CO2 Emissions (tCO2-eq)Total CO2 Emissions (tCO2-eq)
7,400,0000%07,400,00011,341,499.00.0011,341,499.00
7,400,00010%740,0006,660,00010,207,349.1131,191.8910,338,540.99
7,400,00030%2,220,0005,180,0007,939,049.3393,575.678,332,624.97
7,400,00050%3,700,0003,700,0005,670,749.5655,959.466,326,708.96
7,400,00080%5,920,0001,480,0002,268,299.81,049,535.133,317,834.93
7,400,000100%7,400,00000.01,311,918.921,311,918.92
Publisher’s Note: MDPI stays neutral with regard to jurisdictional claims in published maps and institutional affiliations.

