Article

Natural Resource Rent and Finance: The Moderation Role of Institutions

1
School of Finance, Zhongnan University of Economics and Law, Wuhan 430073, China
2
Azad Jammu and Kashmir, Faculty of Management Sciences, University of Kotli, City Kotli 11100, Pakistan
3
Faculty of Economics and Social Sciences, Szent István University, 2100 Gödölő, Hungary
4
TRADE Research Entity, North-West University, Potchefstroom 2351, South Africa
5
Faculty of Economics and Business, University of Debrecen, 4032 Debrecen, Hungary
*
Author to whom correspondence should be addressed.
Sustainability 2020, 12(9), 3897; https://doi.org/10.3390/su12093897
Submission received: 20 March 2020 / Revised: 23 April 2020 / Accepted: 6 May 2020 / Published: 10 May 2020

Abstract

:
This study empirically examines the nexuses between the natural resource rent and financial development in the context of the emerging economy of Pakistan, between 1984 and 2018, by subsuming the important role of institutional quality in this context under symmetric, asymmetric, and threshold settings. The literature to date provides no evidence on the asymmetric relationship between natural resource rent and financial development, and the moderation role of institutional quality in this connection. We show that natural resource rent negatively influences financial development, whereas institutional quality boosts financial development and positively moderates the relationship in the context of Pakistan. Also, we find a single significant threshold value of 3.097 above which the relationship of resource rent-finance turns nonlinear—as up to this threshold the coefficient is 3.228, which declines slightly to 2.804 above the threshold level. This implies that regulators should maintain at least an institutional quality level of up to 3.097 to experience the most desired financial benefits of the natural resource rent in Pakistan. Moreover, the results corroborate the existence of asymmetries in the relationship between the natural resource rent and financial development. This empirical evidence provides fresh insight for stakeholders regarding ambiguous natural resource rents and financial sector development nexuses and recommends that planning organs in Pakistan and other countries in a similar development cadre should use institutional quality as a tool to avoid the resource curse and view natural resources as a blessing rather than a curse.

1. Introduction

Since the emergence of a finance-led growth view [1,2,3,4,5,6,7,8,9], researchers have devoted great attention to exploring the determinants of financial development (FD) (e.g., [10,11,12,13,14,15,16,17,18,19,20,21,22,23]), and this debate is still evolving. The natural resource rent (NRR) as a determinant of FD has received substantial attention among research scholars, such as [24,25,26,27,28], but they have failed to determine its role conclusively. Most of the extant literature (e.g., [24,25,27,29]) has reported a negative impact of the NRR on FD in various resource-rich countries (famously referred to as “the resource curse hypothesis” (RCH) or “the natural resource curse paradox”) [30,31,32].
However, this orthodox perspective on the natural resource curse as a hurdle to development has been refuted by many scholars in previously published empirical literature; [26,28] for example, reported natural resources as a stimulus to FD and proved it is a blessing rather than a curse. Thus, the negative impact of the NRR on the development of the financial sector has not always existed, as reported by [26,28]. Various factors could help countries in obtaining benefits from resource revenue and turn the resource curse into a blessing. According to [33], the resource curse hypothesis is attributed to the rent-seeking behavior of the public office holders entrusted with the management of economic affairs. Atkinson and Hamilton [34] reported that the incapability of the government to manage and channel the resource revenue to sustainable development is the basic reason behind the existence of the resource course hypothesis [33].
Therefore, the theory postulates that the presence of strong institutions mitigates the negative impact of resource revenue by controlling rent-seeking behavior (Mehlum, et al. [35]). This issue of a potential negative impact can be mitigated by enhancing the quality of economic and political institutions [36]. Thus, the NRR requires a high-quality institutional setup which may control misuse of resource rent and may allow a country to escape from the negative impact of the NRR and thereby enhance FD [37]. The quality of institutions decides the impact of resource rent on FD, and whether resource abundance is a blessing or curse for any country [38].
Surprisingly, the extant literature has generally ignored the decisive role of institutional quality in relationships of NRR and FD [24,25,26,27,28]. Hence, the fact that the role of institutional quality in the resource-finance nexus has been overlooked has made the theme difficult to locate in the existing literature.
Moreover, the literature has largely focused on developed countries, especially American and European countries (see, for example, [26,39]), or developing economies such as, African countries (see, for example, [29,40,41,42]), which have different institutional and financial sector dynamics. From emerging countries perspective (such as Pakistan) the literature is scant. Pakistan is an emerging economy, blessed with huge natural resource wealth. Considering the natural resource abundance, researchers have recently focused their attention on examining the impact of the NRR on various economic indicators, mainly on economic growth (see, for example, [43]). However, the literature has very much ignored the nexus between natural resources and FD, which is regarded as an important driver of economic growth. Recently, Asif et al. [44] has provided the only scholarly evidence relating to the impact of the NRR on FD in Pakistan, and has documented a natural resource curse in the financial sector of Pakistan. However, their study does not consider the role of IQ in this context, which makes their findings elusive. Hence, to the best of our knowledge, this may be the first study in the context of Pakistan which captures the moderation role of IQ in the nexus of the NRR-FD.
Furthermore, it has been established in the literature that various country-specific attributes such as culture, institutional environment, development level, etc. significantly influence the relationship between the macro-economic variables of any country [45,46]. Therefore, the findings of these studies cannot be generalized to emerging economies such as Pakistan. Pakistan is an emerging economy that possesses a unique institutional framework and FD dynamics along with abundant natural resources which make it an important case to study. Finally, the existing literature assumes a linear relationship among the NRR, FD, and IQ, although this relationship could be non-linear (asymmetric).
Shin, et al. [47] postulate that the economic and financial shocks/crises, restructuring programs, regional and international disparities, and abrupt shifts in policies may influence macroeconomic variables, which consequently, could engender asymmetries in their dynamic relationship. Moreover, if non-linearities exist in a relationship then linear models may fail to give reliable and consistent estimates.
Therefore, overlooking the existence of non-linearities in resource-finance nexuses may produce biased empirical results. Furthermore, through asymmetric analysis, the response of FD to both positive and negative changes to the NRR could be captured separately, which is imperative for policy formulation [48]. The FD could respond differently to positive and negative changes to the NRR. For policy formulation, it is imperative to know the response of FD to both appreciation and depreciation in the NRR. However, to the best of our knowledge, no study has attempted to explore the asymmetric relationship between the NRR and FD.
Given the foregoing observation, the objective of this study is to answer the following two critical questions empirically. First, “In the context of the Pakistani economy, what is the long-run relationship between the NRR and FD when IQ acts as a moderator? Second, “Do asymmetrical relationships exist between the NRR and FD in Pakistan?” Our study has made an invaluable contribution by investigating the ambiguous relationship between the NRR and FD, and the role of IQ in this paradigm. The findings of this study are useful for stakeholders seeking a source to help turn the resource curse into a blessing for the financial sector.
Furthermore, unlike the existing literature, which ignores asymmetries in the resource-finance relationship, this study has applied the nonlinear autoregressive distributed lag (NARDL) cointegration approach of [47] along with the Autoregressive Distributed Lag (ARDL) bound test to cointegration [49], to explore potential asymmetries in the NRR and FD nexuses for the first time in the economic literature and to provide valuable insight for policymakers.
Finally, we find a single significant threshold value of 3.097 above which the relationship of the NRR and FD turns nonlinear. It is interesting to note that up to a threshold of 3.097 the coefficient is 3.228, and above this threshold, the coefficient declines slightly to 2.804. Importantly, above the identified threshold the variation explained by the NRR declines slightly. This implies that regulators should maintain at least an IQ level of up to 3.097 to experience the most desirable financial benefits of the NRR.
The rest of this study is organized as follows; Section 2 contains the literature review, Section 3 provides details of the research design and methods, Section 4 discusses the empirical results, and Section 5 outlines the conclusion and policy implications of the study.

2. Literature Review

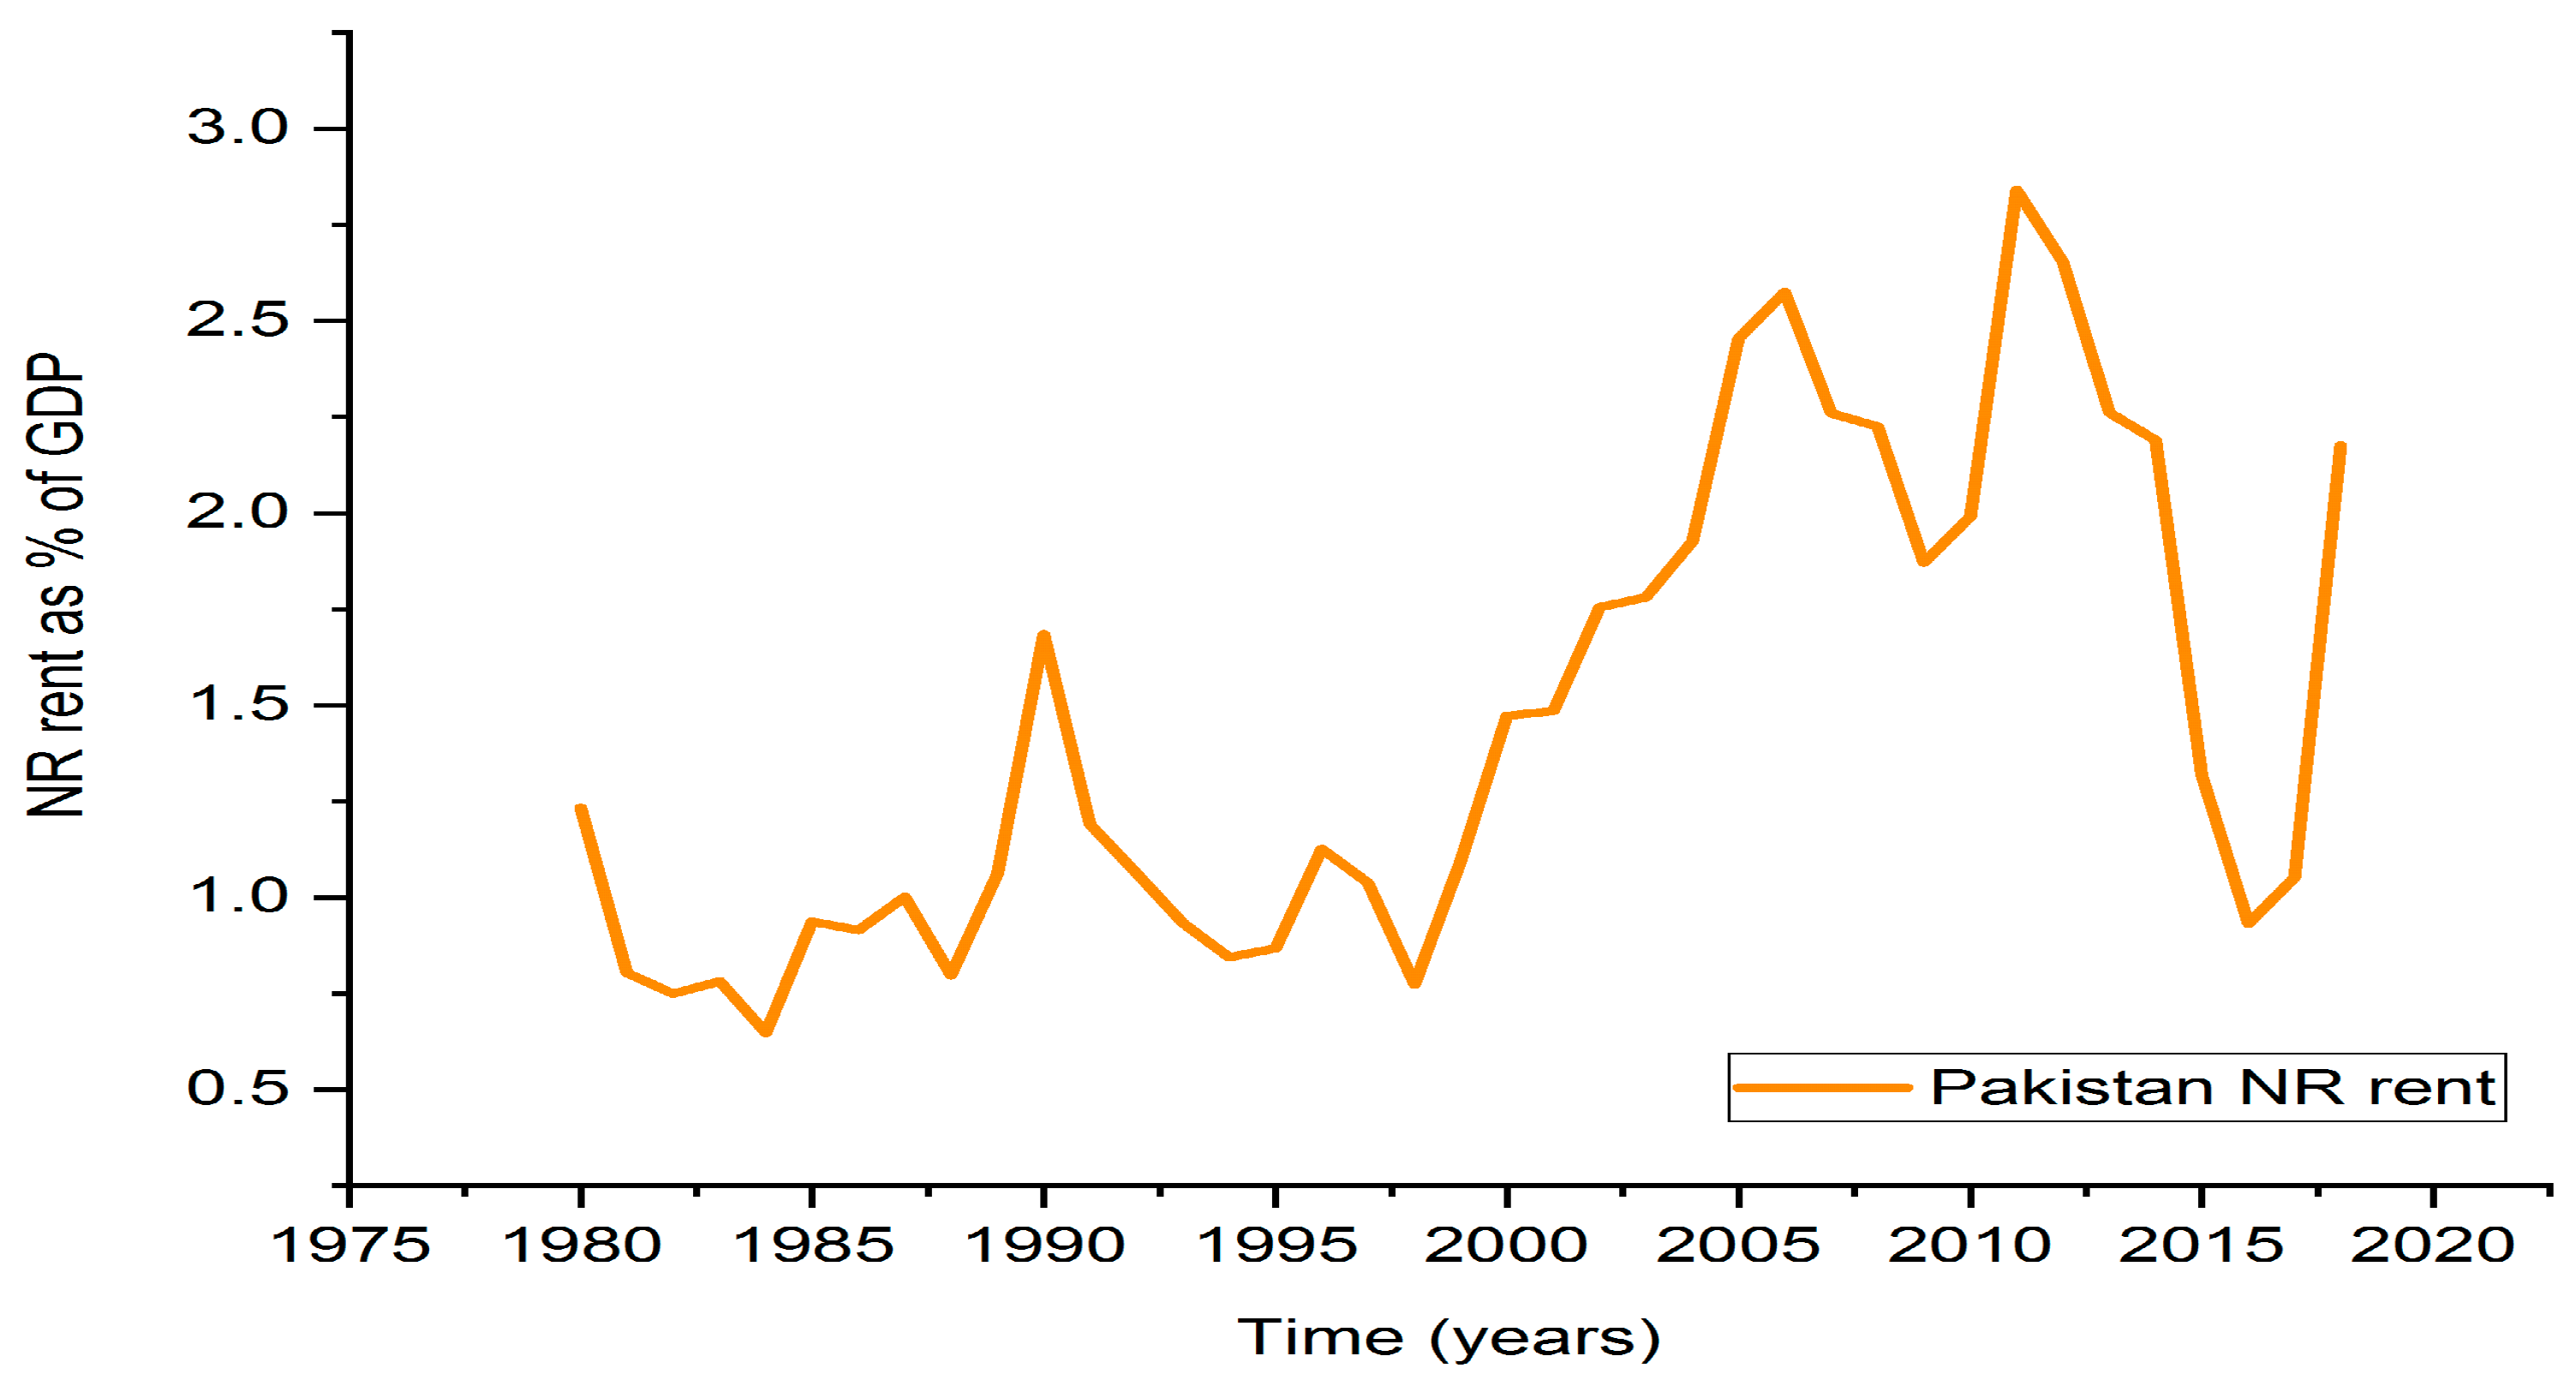
The NRR is profit accrued from trading natural resources, after deducting the cost of such trade (payments to factors of production) and also considering the opportunity costs of production [50]. The literature has mainly focused on the role of the NRR in the economic progress of countries and has reported mixed evidence [51,52,53,54,55,56,57,58]. The adverse effect of the NRR on economic growth is coined as a “the resource curse hypothesis”, which is widely investigated in diverse contextual settings. Classical growth theory postulates that natural resource wealth does not foster economic performance [38,59,60]; low economic growth is attributed to a poor institutional environment characterized by corruption, the inefficiency of the bureaucracy and mismanagement [57].
However, the positive role of the NRR in stimulating economic growth has also been observed by famous economists such as David Ricardo and Adam Smith. Natural resource endowment enhances economic growth by creating ample investment opportunities and markets in developing economies [61,62]. Brunnschweiler [63], articulated that natural resource endowment fosters economic growth through sound institutions. Many other scholars have rejected the resource curse hypothesis, for example, [64,65,66,67], and concluded that the NRR is a blessing rather than a curse. Arin and Braunfels [68] also rejected the resource curse view of natural resources and provided fresh evidence regarding the positive role of natural resources on growth via a sound institutional environment. Erdoğan, et al. [69] examined the impact of natural resource exports on economic growth and the role of financial deepening in this context. They evidenced that the impact of natural resource exports on economic growth is sensitive to the level of financial deepening; when financial deepening crosses a threshold of 45% natural resource exports significantly enhance economic growth.
Likewise, considering the question of whether the NRR is a “curse” or “blessing” for the development of the financial sector, the empirical literature has produced conflicting evidence. The traditional view suggests the NRR hinders FD by influencing trade openness, Dutch diseases, rent-seeking, and corruption. Arguably, Yuxiang and Chen [24] were the first to explore the relationship between the NRR and FD in the context of China and reported an adverse effect of the NRR on FD. They argue that the NRR has a negative impact on FD through enhancing corruption, rent-seeking, misuse of the NRR and Dutch diseases. Recently, Guan, Kirikkaleli, Bibi and Zhang [25] also reported similar results in China. Furthermore, Mlachila and Ouedraogo [27] investigated the resource curse hypothesis in a sample of 68 resource-rich countries and found strong evidence of the natural resource curse in the financial sector of sample countries, operating through the commodity price shocks channel.
Recently, the role of institutions in economic and financial development has been widely acknowledged [70,71]. Economists generally agree that the outcome of economic policies and resource abundance in an economy is sensitive to the quality of its institutions [72]. Irrespective of how well-devised policy is, or how many resources a country has, if institutions are not supportive then the positive outcome from such policies or resources cannot be realized [73]. Institutions are the humanly created rules of the game in a society which shape economic, political, and social interactions. They include the formal and informal standards that decide how people treat and interact with each other [74]. Bhattacharyya and Hodler [75], studied the mediating role of IQ between the NRR and FD and reported that in the absence of sound political institutions in a country, natural resource wealth weakens contract enforcement, which is consequently harmful for FD, ceteris paribus, while the presence of sound institutions enhances contract enforcement, which is useful in accelerating FD. Meager economic development in resource-abundant economies is attributed to corruption, the potential existence of rent-seeking and patronage [76]. Further, [76] recommended addressing rent-seeking behavior and patronage by enhancing IQ through focused policies along with macro-economic management in resource-abundant economies. Costa and Santos [37], examining the role of institutions in allotting royalties from hydrocarbon resources to minimize the resource curse, reported huge misappropriation by institutions. They recommend that enhancing the quality of institutions responsible for monitoring oil rents disbursement and utilization and enhancing public participation may help to avoid the misappropriation of oil rents. Taguchi and Lar [77] studied the natural resources curse hypothesis for two different periods in selected economies from 1980–1995 and 1995–2014. For the first period, their results validate the natural resource curse hypothesis [33], while the results are reversed for the second period, due to a better institutional environment in the sample countries.
Rathinam and Raja [78] studies the nexuses between IQ and FD in the Indian context and observed a causal relationship between institutional development and FD, which eventually enhances economic growth. Similarly, Khan et al. [79] examine a long-run association between IQ and stock market development in the context of Pakistan. Recently, Dwumfour and Ntow-Gyamfi [29] have empirically studied the relationship between resource-abundance, FD, and IQ, and evidenced that IQ reduced the negative impact of the NRR on FD. Bulte, et al. [80] noticed that the direct influence of mineral resource rent on financial sector development is ambiguous; however, indirectly mineral resource rent positively influences FD when IQ is introduced into the analysis. Huang [81] examined whether an improvement in the quality of political institutions enhances FD. The empirical findings revealed that IQ fosters FD in the short-run in developing economies and an increase in FD is observed following a democratic transformation in a country.
Summing up, the NRR can undermine FD by enhancing corruption, rent-seeking, misuse of resources, and Dutch diseases, and weakening contract enforcement. The literature contends that a sound institutional environment can potentially check channels through which the natural resource curse operates in the financial sector and turn the curse into a blessing. Moreover, the literature suggests that various macroeconomic variables as fundamental determinants of FD such as economic growth, economic policy uncertainty, trade openness, and capital must be taken as control variables in our model for efficient and reliable results.
The FD and economic growth relationship is a bidirectional phenomenon, i.e., a supply-leading and demand-following hypothesis. The earlier view considers economic growth as a function of FD, as a developed financial system minimizes the information asymmetry and transaction costs, which attracts domestic and foreign financial resource into the economic system [33,82,83,84]. The latter view holds that economic growth stimulates FD (banking sector and financial markets) via increased investment opportunities and demand for financial services [13,39,85,86]. Therefore, economic growth as an important determinant of FD is included as a control for FD in our analysis.
Trade openness is a stimulus to exports and—accompanied by increased demand for financial services and the scale of the financial sector—is also an important determinant of FD [87,88,89]. Openness enhances FD only in the presence of sound institutions [90]. Moreover, according to Baltagi, et al. [91], capital account and trade openness are significant determinants of FD. Trade openness seems to have a positive impact on FD; therefore, we take openness as a control for FD in our study. [92] defined economic risk as a risk that emerges from the uncertainty of fiscal and monetary policies devised by the government and central bank of a country.
The author argues that the government uses economic policy as a tool to shape financial markets and make frequent adjustments according to the economic conditions. Uncertainty regarding government economic policy has a profound effect on financial markets and it undermines the development process [93,94,95]. Therefore, we have used the economic risk index developed by Baker et al. [96] as a control variable in our model. Capital also significantly influences the FD; therefore, in line with [26,39,97] we also incorporate capital as a control variable in our model.
Moreover, as mentioned in the introduction section the existing literature on the NRR and FD nexuses only assumes a symmetric relationship and ignores the existence of asymmetries. Abdulahi, Shu and Khan [51] empirically investigated the links between the NRR and economic growth and found an asymmetric relationship between the NRR and economic growth, subject to a certain threshold level of IQ. When IQ crosses a certain threshold level, only then can the NRR benefit economic growth. Likewise, Tiba [98] also found non-linearity in the relationship between the NRR and economic growth. In the same vein, Shin, Yu and Greenwood-Nimmo [47] postulate that economic and financial shocks/crises, restructuring programs, regional and international disparities, and abrupt shifts in policies may influence the macroeconomic variables, which consequently, could engender asymmetries in their dynamic relationship. Moreover, if non-linearities exist in a relationship then linear models may fail to give reliable and consistent estimates.
Hence, based on the resource-growth experience, we have assumed non-linearity in the relationship between the NRR and FD, to be empirically verified at a later stage of the study. The literature discussed above laid down the conceptual foundations to study the impact of the NRR on FD and the role of IQ in this paradigm by controlling FD for economic growth, trade openness, economic policy uncertainty, and capital. Relying on the given literature, we postulate our hypothesis as follows;
Hypothesis (H1): 
Institutional quality significantly positively moderates the relationship between the NRR and FD in Pakistan.
Hypothesis (H2): 
The relationship between the NRR and FD is asymmetric and depends on a certain IQ threshold.

3. Research Design and METHOD

3.1. A Brief Overview of the NRR, IQ, and FD in Pakistan

Pakistan is endowed with abundant valuable fuel and non-fuel natural resources, including coal, gas, oil, hydropower potential, fertile land, copper, gold, salt, and others. Pakistan possesses a huge coal reserve, famously known as black gold (175 billion tons), which is equivalent to 618 billion barrels of crude oil. The value of Pakistan’s coal reserves is far greater (more than double) than the value of the oil reserves possessed by the world’s top four oil-rich countries. Moreover, Pakistan holds 885.3 billion cubic meters of natural gas reserves. Indeed, in a global comparison, Pakistan has the second largest coal reserves, the second largest rock salt reserves, the seventh largest copper mine, and the fifth largest gold reserves, as well as the twelfth largest rice production, and the eleventh largest wheat production [99].
These huge reserves of natural resources could potentially revolutionize the FD of Pakistan in the long run. Figure 1 depicts the average natural resource revenue of Pakistan over the study period from 1984 to 2018. It covers the maximum available data regarding the natural resource revenue of Pakistan from the World Bank development indicators dataset. The following figure outlines an unstable pattern with enormous fluctuations of natural resource revenue for Pakistan, which could be attributed to the unstable political and institutional environment (floods, earthquakes, terrorism) during the said period and in line with general perceptions regarding an unstable developing economy. The natural resources revenue of Pakistan reached its ever-highest figure in 2011 and the lowest ever figure was observed in the year 1970. A major upward trend is reported from 1996 to 2008, from 2010 to 2012 and from 2016 to date. However, a declining trend is experienced in natural resource revenue from 1992 to 1995, as well as from 2012 to 2015.
The dynamic pattern of the natural resource revenue of Pakistan reveals the unstable nature of this revenue in Pakistan, which is expected to significantly spur FD along with other sectors of the economy. Furthermore, according to the Global Competitiveness Index (GCI), in 2019 Pakistan ranked 110th/141 worldwide. In terms of the quality of institutions and financial systems, the ranks are 107th (score 47.7) and 99th (score 55), respectively. The institutional position has improved by 1.4 points (47.7–46.3), while the financial system has reported a rise of only 0.9 points (55.0–54.1). Among South-Asian economies (Afghanistan, Bhutan, and the Maldives are not covered by the GCI index) the country ranking of Pakistan is 4th in terms of institutional quality and financial system development.
We also include the graph showing the historical position of Pakistan over the period, based on IQ and FD statistics of the ICRG and IMF, respectively. Figure 2 depicts the pattern of FD and IQ in Pakistan over the period from 1980 to 2018. The pattern indicates an unstable position of both IQ and FD in Pakistan and is consistent with general perceptions in the context of developing and emerging economies. IQ has dropped drastically from its ever highest level in the year 1999, possibly due to the military take over in 1999. However, after 1999 a series of the event occurred that led to constant improvements in the institutional framework. Most notably, the establishment of the National Accountability Bureau (NAB) (a governmental agency with a mandate to control corruption in the country), the emergence of a relatively independent judiciary following a successful movement by lawyers and a couple of back to back relatively stable political regimes.

3.2. Variables and Data

This study used annual time series data of Pakistan for the 34 years from 1984 to 2018 for analysis. The study period was selected based on the maximum availability of data. We have used a comprehensive FD index of the IMF, developed in [100] as a proxy for FD, which is our dependent variable. This index comprises nine sub-indices and measures FD in terms of financial markets and the depth, access, and efficiency of institutions. We also employed a traditional proxy of FD, i.e., domestic credit to the private sector as a ratio of GDP (abbreviated as DC in the following pages) as an alternate measure of FD for a robustness analysis of our main results. This proxy of FD is also considered good and has been employed in recent studies [39,97].
Our main explanatory variable is the NRR, which is comprised of the sum of all fuel and non-fuel natural resources rents (including oil, natural gas, coal, minerals, and forest rents) and is sourced from the World Bank’s world development indicators from 2018. The IQ is used as a moderating variable in our study and is measured by an IQ index from six indicators of IQ designated by the Political Risk Service. The IQ indicators are “government stability, control of corruption, democratic accountability, bureaucratic quality, law and order and investment profile” [101,102]. The international country risk guide (ICRG) rating mechanism gives a score to each of the IQ indicators out of a total of 100 points. The highest score implies high risk and hence low IQ, and the lowest score indicates low risk and high IQ. We used Political Risk Service (PRS) indicators because they cover a longer time period compared to other sources, i.e., world governance indicators (WGI).
Furthermore, in line with the literature, we have used economic growth, economic risk, trade openness, and capital as controls for FD in our model. Real GDP per capita is used to measure economic growth; the economic risk index developed by Baker, Bloom and Davis [96] is employed as a proxy for economic risk, trade openness is the ratio of imports and exports to GDP and capital is captured by the total gross fixed capital formation. We obtained FD data from the IMF database, IQ indicators and economic risk data are sourced from the ICRG, data for the NRR, economic growth, openness, and DC—which is an alternative measure of FD—is taken from the World Bank’s world development indicators.

3.3. Econometric Model

Our study empirically examines the long-run relationship between the NRR and FD and the role of IQ in this paradigm in both linear and non-linear settings. To this end, guided by the foregoing theoretical and empirical backdrop, the baseline econometric model of our study can be stated in general functional form as follows:
F D t = f ( I Q t ,   N R R t , E C G t ,   E C R t ,   K t ,   T O t ,   I Q t N R t )
where subscript t represents time, and FD, IQ, NR, ECG, ECR, K, TO and IQNR stand for FD, IQ, the NRR, economic growth, economic risk, capital, trade openness and the interactive term of IQ and the NRR, respectively.
Following recent literature [39,103], we transformed variables into per capita and natural-log form for efficient estimation. Such log-linear transformation normalizes the data distribution by reducing the variability in the data and provides reliable results.
The following is the functional form of our empirical model:
ln F D t = γ 0 + γ 1 ln N R R t + γ 2 ln I Q t + γ 3 E C G + γ 4 ln E U P t + γ 5 ln K t + γ 6 ln T O t   + γ 7 ln I Q t N R R t + μ i
where, ln   stands   for   the natural log of the respective study variable, γ 0 is the intercept, γ 1 γ 7 are the coefficients of IQ, the NRR, economic growth, economic risk, capital, openness, and the moderation effect of IQ and the NRR, respectively, and μ i shows an error term which is normally distributed.

3.4. Methods

Conventionally, it is essential to test the unit root of each variable to identify the order of integration before estimating any long-term association between variables. Based on the order of integration or stationarity characteristics, suitable methods are specified for the study. Therefore, we identified the stationarity properties of the variables, using Augmented Dickey-Fuller (ADF) proposed by Dickey and Fuller [104,105], Phillip-Peron (PP) of Phillips and Perron [106], and Zivot-Andrews [107] (ZA) tests; the results are presented in results and discussion section.
Based on the integration order of our study variables, to answer research questions empirically, we employed two recently advanced robust econometric methodologies, i.e., the autoregressive distributed lag (ARDL) bounds-testing approach to cointegration of [49] for symmetric and the Non-linear autoregressive distributed lag approach abbreviated as NARDL (which is an asymmetric extension of ARDL) presented by [47] for the investigation of asymmetry and non-linear relationships among underlying variables. In related literature [108,109], various techniques have been employed to study the long-run association between the variables, however, aligned with a recent study [110] and following superior characteristic we use this technique:
First, both ARDL and NARDL models are conditioned to be applied when underlying variables are having mixed integration order I(0), and I(1) and none of the series should be integrated at second order I(2). Importantly, other related conventional cointegration methods are strict to I(0), and I(1) series only [47,49]. Secondly, the ARDL framework gives efficient results because it is free from serial correlation and endogeneity problems and can be estimated in the presence of endogenous explanatory variables [49]. Thirdly, both techniques give more robust results for a small sample size than other conventional cointegration models [111].
Moreover, the NARDL model contains a dynamic error-correction representation which makes it possible to capture nonlinearities in both the short and long run. The NARDL approach allows testing of any hidden nonlinear cointegration among the variables which are not identified by the conventional linear ARDL and ensures that any unobserved relationship is considered/explored. Therefore, the NARDL framework has the potential to identify any asymmetric long-run relationship between study variables.

3.4.1. The Linear ARDL Bounds Test to the Cointegration Framework

For exploring short-run and long-run linear relationships between the variables of the study, based on [49], the ARDL bounds testing approach to cointegration has been specified by the authors, as follows in Equation (3).
Δ ln F D t = γ 0 + γ 1 ln F D t 1 + γ 2 ln N R R t 1 + γ 3 ln I Q t 1 + γ 4 ln E C G t 1 + γ 5 ln E C R t 1 + γ 6 ln K t 1 + γ 7 ln T O t 1 + γ 8 ln I Q t 1 ln N R R t 1 + t 1 p φ 9 Δ ln N R R t 1 + t 0 q φ 10 Δ ln I Q t 1 + t 0 r φ 11 Δ ln E C G t 1 + t 0 s φ 12 Δ ln E C R t 1 + t 0 t φ K Δ ln K t 1 + t 0 u φ 13 Δ ln T O T 1 + t 0 u φ 14 Δ ln I Q t 1 ln N R R t 1 + φ 15 D 1 + μ i
Here, Δ is the first difference operator,   t in subscript represents time, a is the intercept or constant parameter, p -   u is the optimal number of lags (determined by using AIC, SC and HQ criteria under VAR lag order selection criteria, not reported here for the sake of brevity), and γ   a n d   φ are the short run and long run coefficients, respectively.   D indicates a dummy variable which captures the structural breaks in a series, determined by the Zivot-Andrews [107] unit root test, and μ i denotes residuals.
The ARDL bounds testing approach tests the null hypothesis of no cointegration among the underlying variables ( H 0 :   γ 1 = γ 2 = γ 3 = γ 4 = γ 5 = γ 6 = γ 7 = γ 8 = 0 ) , compared to an alternative hypothesis of the existence of linear cointegration among variables ( H 0 :   γ 1 = γ 2 = γ 3 = γ 4 = γ 5 = γ 6 = γ 7 = γ 8 0 ) . These hypotheses are tested based on the non-standard F-test proposed by Pesaran, Shin and Smith [49], famously denoted by FPSS. They give critical bound values at various significance levels. If the calculated value of the test statistics exceeds the critical value of the upper bound, the null hypothesis of no cointegration is rejected.
On the other hand, if the test statistics are lower than the lower bound critical value, then the null hypothesis is accepted, which indicates no integration among variables. Finally, if the test statistics lie between the upper and lower bound critical values, the result appear inconclusive, and other cointegration tests could be used. Furthermore, the fundamental assumption of this ARDL approach is that all explanatory variables have an asymmetric effect on the dependent variable.

3.4.2. The Non-Linear ARDL (NARDL) Bounds Testing Approach for the Cointegration Framework

Additionally, we assumed that the relationship between the NRR and FD may be asymmetric, i.e., FD may respond differently to positive and negative changes in the NRR. To explore and distinguished the response of FD to both appreciation and depreciation in the NRR, i.e., the explanatory variable, following [47] we employed the NARDL, which is modeled as follows.
Firstly, following recent literature [112,113] we make positive and negative changes to the NRR, symbolized as Δ L n N R R + and Δ L n N R R , respectively. Then we generate two new series, one indicating appreciation (indicated by P O S t ) . and the other depreciation (indicated by N E G t ). The earlier is the partial sum of positive changes and the latter is the partial sum of negative changes, which are specified by the authors below:
  P O S t = j = 1 t Δ   I n   N R R j + = j = 1 t m a x   (   Δ   I n   N R R j ,   0 )
  N E G t = j = 1 t Δ   I n N R R J = j = 1 t m i n   (   Δ   I n   N R R j ,   0   )
The NARDL framework of [47] with the asymmetric error correction model, is specified by the authors as follows:
Δ L n   F D t = θ 0 + k = 1 n 1 θ 1 k   Δ L n   F D t k + + k = 0 n 2 θ 2 k Δ L n   N R R _ P O S t k + k = 0 n 3 θ 3 k Δ L n N R R _ N E G t k + k = 0 n 4 θ 4 k Δ L n   I Q t k + k = 0 n 5 θ 5 k Δ L n   E C G t k + k = 0 n 6 θ 6 k Δ L n   E C R t k + k = 0 n 7 θ 7 k Δ L n   K t k + k = 0 n 8 θ 8 k Δ L n   T O t k + k = 0 n 9 θ 9 k Δ L n   I Q t k L n   N R R t k   + λ 0   L n   F D t 1 + λ 1   L n   N R R P O S t 1 + λ 2   L n   N R R N E G t 1 + λ 4   L n   I Q t 1 + λ 5   L n   E C G t 1 + λ 6   L n   E C R t k + λ 7   L n   K t k   + λ 8   L n   T O t k + λ 9   L n   I Q t k   L n   N R R t k   + D t + μ t
After estimating the linear model from Equation (3) above and establishing cointegration, we could then test the hypothesis regarding the asymmetric effects of the NRR on FD in Pakistan. In the NARDL framework, the null hypothesis of asymmetric cointegration among the NRR and FD is tested against the alternative hypothesis of asymmetric cointegration among the underlying variables. Here, we will also use the F-test proposed by [49] to decide the status of the asymmetric cointegration hypothesis among variables, in the same way as we used in the linear ARDL model above.

3.4.3. Threshold Regression

Although the NARDL specification uncovers the important dimensions of the connection between the NRR and FD under the moderation role of IQ, it does not give any insight into what might be the minimum level of IQ as a threshold at which the coefficient changes to another point. For this purpose, we use threshold regression, which provides the possible threshold(s) where the linear relationship turns into a nonlinear one. We consider a threshold model [114] in the following equation containing two regions defined by the threshold variable IQ.
In Equation (7), y t is the dependent variable FD, X is the vector of independent variables and q is the threshold variable IQ, while t is time. φ 1 , φ 2 and δ 1 ,   δ 2 are respective coefficients to independent and threshold variables, whereas ϑ is the threshold value, and ε t is the error term with an assumed zero mean, finite variance and it is independent with identical distribution.
y t = { φ 1 X t + δ 1 q t + ε t ,   q i < ϑ φ 2 X t + δ 2 q t + ε t ,   q i ϑ  

4. Results and Discussion

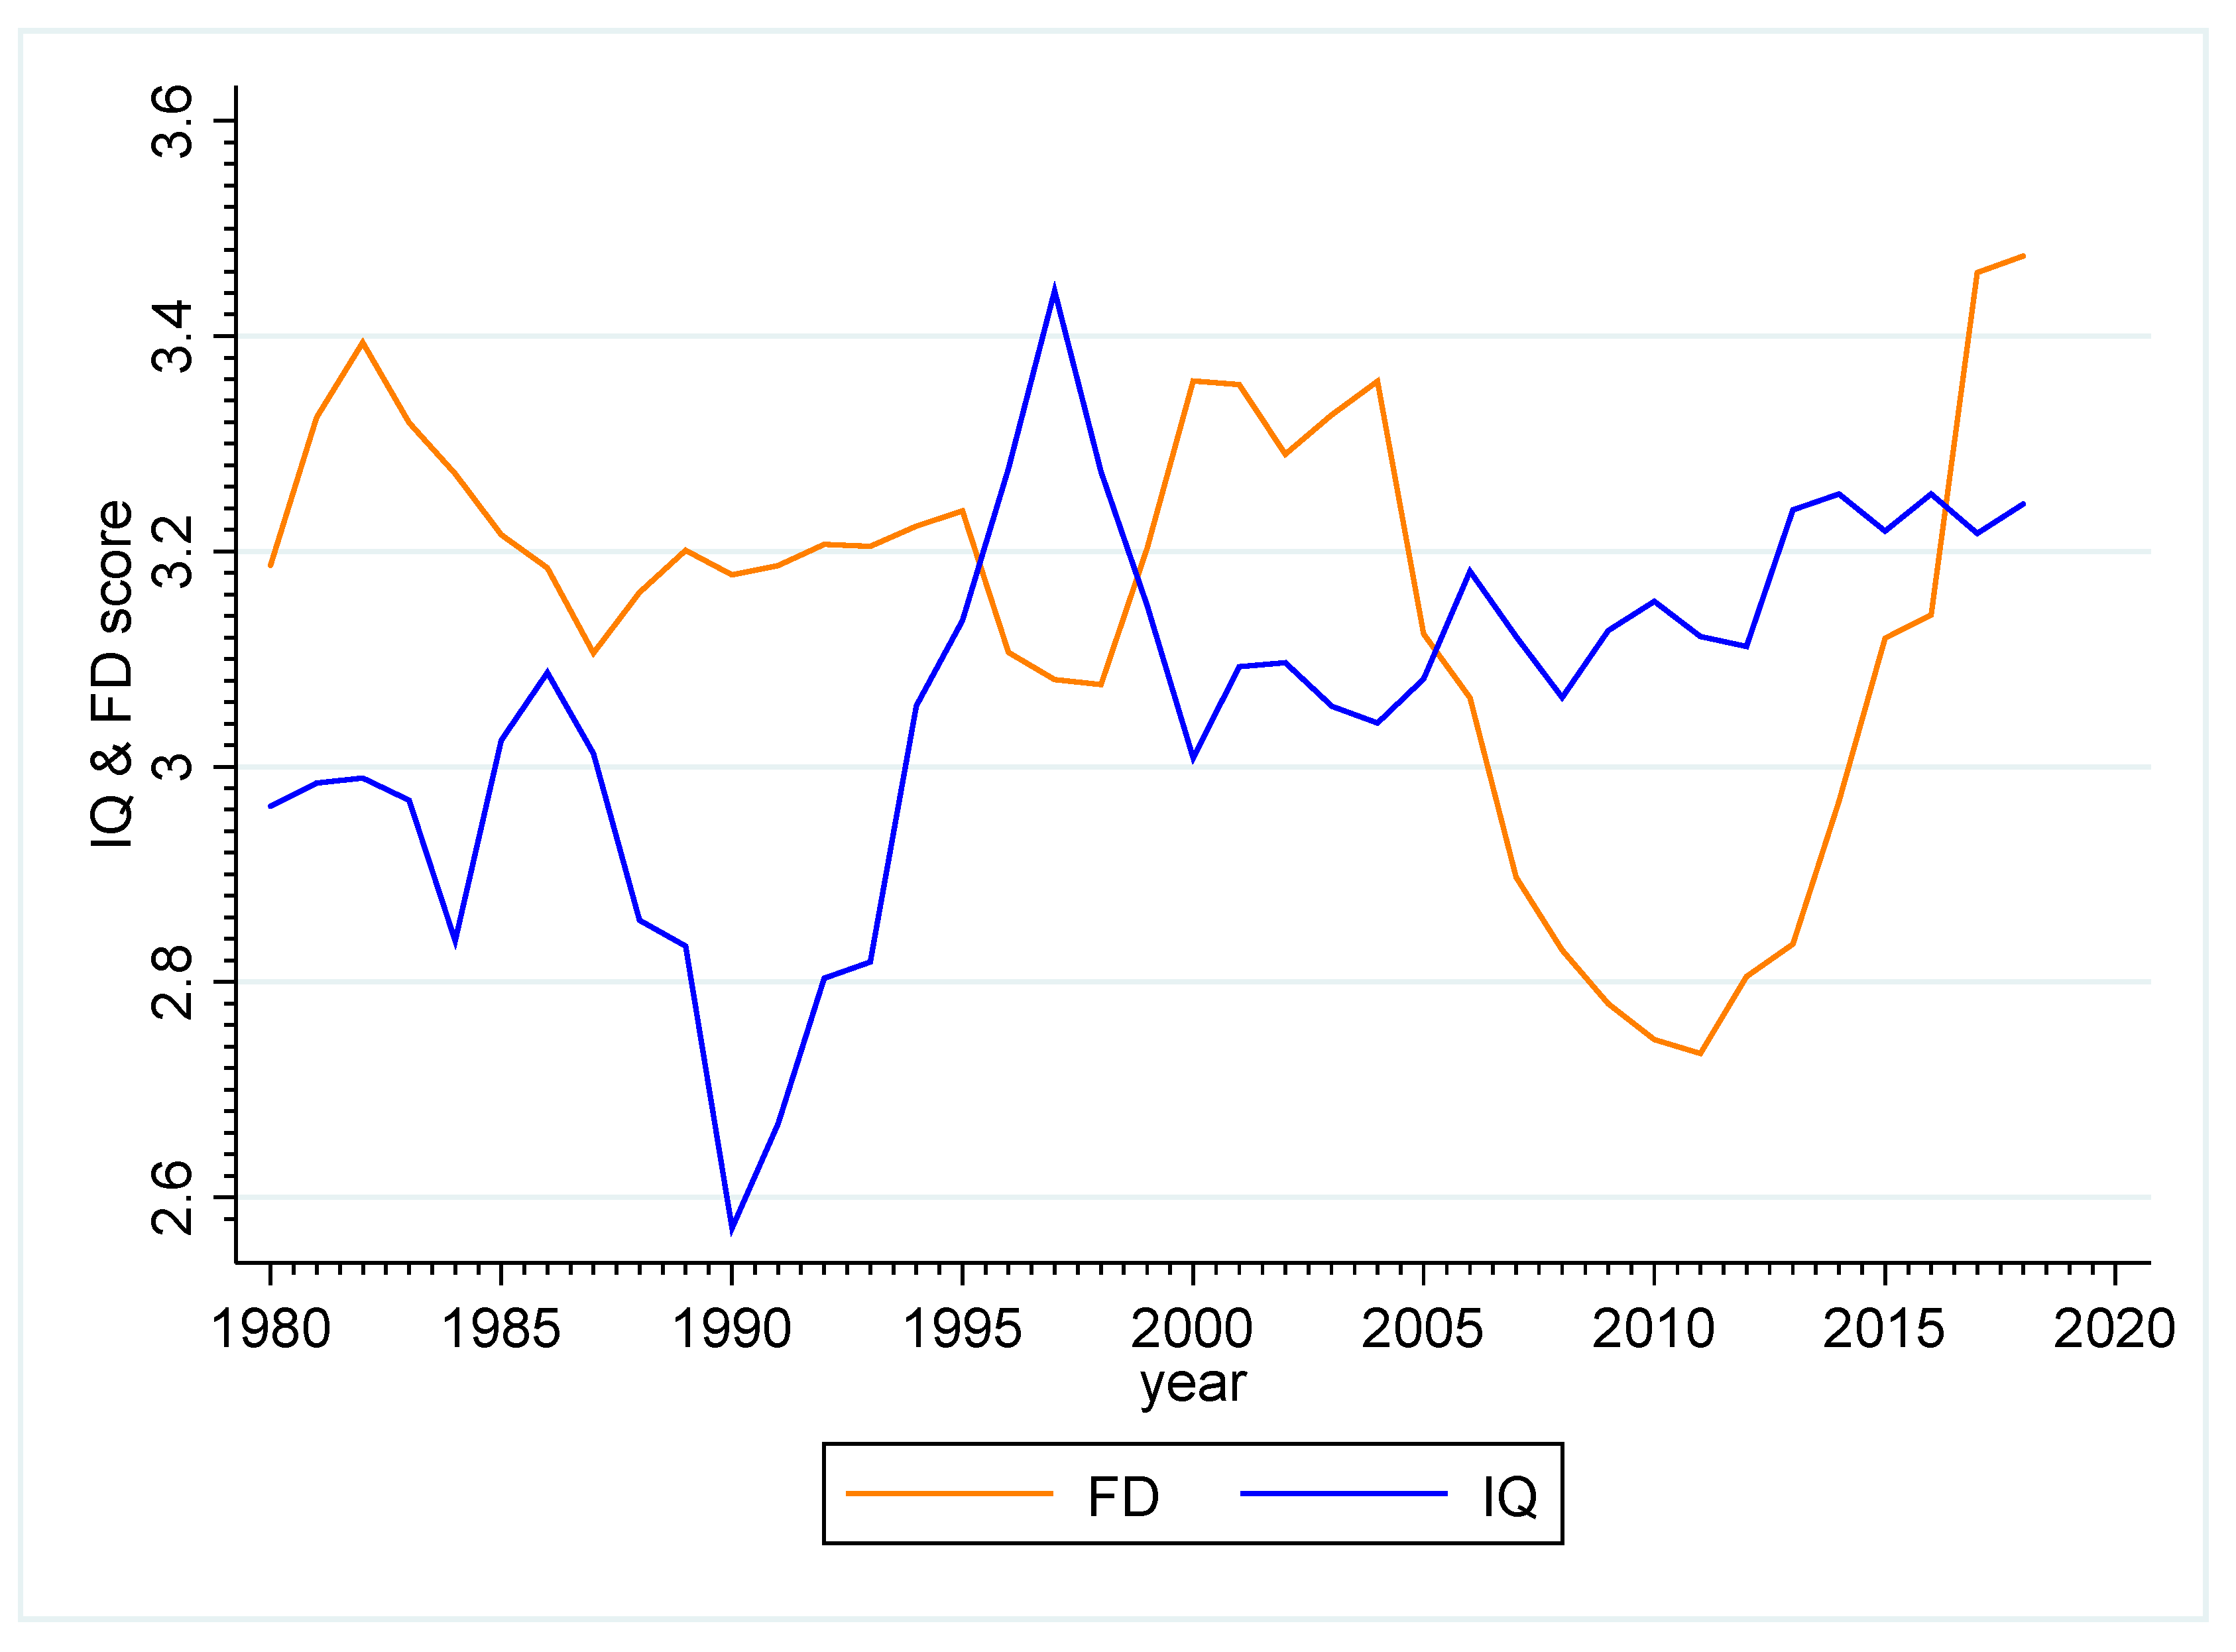
Table 1 shows descriptive and normality statistics (mean, standard deviation, minimum, maximum values and p-values of the Cramer von Mises, Shapiro-Wilk and Anderson Darling tests, respectively) of all variables of the study. The mean values of economic growth, economic risk, trade openness, and FD are comparatively higher. Standard deviation as relative to the rest of the variables shows a high volatility in the NRR, in economic growth and in both the series of FD. Moreover, we have tested the normality of our variables by using widely used methods of normality, i.e., Cramer von Mises [115], Shapiro-Wilk [116] and Anderson Darling [117] tests and the p-values of the respective tests are reported in the last three columns of Table 1, respectively. Yap and Sim [118] compared various tests of normality based on their power and ranked the Shapiro-Wilk test at the top, followed by the Anderson Darling and Cramer von Mises tests.
The p-values of all the tests are greater than 0.05, which shows that we fail to reject the null hypothesis of normality in all cases, i.e., all the series are normally distributed and satisfy the presumption of normality for further empirical analysis.
Furthermore, we calculated Pearson’s correlation which is reported in Table 2. The choice of Pearson’s correlation was decided by the normal distribution of the residual obtained by Jarque-Bera [Jarque-Bera normality test: 3.264, p-value 0.1956].
The results in Table 2 show that the NRR has a negative correlation with FD, economic risk, and openness. However, it is positively correlated with the rest of the variables. The IQ, economic growth, moderating term and capital show a positive correlation with FD.
As mentioned in Section 3.4, the ARDL bounds test to cointegration can be applied only to variables with mixed integration order I(0) or I(1). Thus, we determined the stationary properties of the variables, using the Augmented Dickey-Fuller (ADF) test, proposed by Dickey and Fuller [104,105], and the Phillip-Peron (PP) test of Phillips and Perron [106]; the results are presented in Table 3. This reveals that both the series of FD, the NRR, the interactive term (meaning the interaction variable generated by multiplying IQ and the NRR to explore the moderating role of IQ), economic growth, and policy uncertainty are non-stationary at the level, although they are stationary after taking the first difference, as per ADF. The PP test also confirms ADF results, except for the NRR which is stationary both at the level and at first difference according to the PP test. The IQ, trade openness and capital are found to be stationary at both the level and first difference, and both tests affirm these findings, indicating the robustness of the unit root results. However, both the ADF and PP tests are criticized in the literature, as they do not consider any structural break in the series resulting from any abrupt policy change or natural calamity, and so may give misleading results. To overcome this drawback, the literature gives various unit root tests with the ability to consider any structural break in a series, such as [107,119].
Following recent literature [113], we used the Zivot-Andrews [107] structural break unit root test. The results of this are reported in Table 3, which reveals that FD, the NRR, trade openness, economic growth, economic risk, and capital are non-stationary at the level; however, these variables are stationary at the first difference, while IQ is stationary at both the level and first difference. The overall results confirm a mixed integration order and importantly none of the variables is integrated at the second order.
Furthermore, structural breaks represent the structural changes which appear in the individual time series. We tested the overall structural break after estimating the regression using STATA 15, which captured 2007 as a single significant structural break. This break represents a year of political instability in the country caused by a series of events, including the Seventeenth Amendment in the constitution of Pakistan, the state of emergency in 2007, the National Reconciliation Ordinance, the siege of Lal Masjid, the suspension of the Chief Justice of the Pakistan Supreme Court, Iftikhar Muhammad Chaudhry, and the movement to impeach Pervez Musharraf. These events collectively disrupted the overall economy and political institutions, as well as financial activities.
After testing the stationarity of the variables accordingly, we first applied the linear ARDL bound test to cointegration, the results of which are shown in Table 4. These results show that ARDL F-statistics are greater than the upper bond critical values given by [49], at all—1%, 5% and 10%—significance levels for all models from Equations (3)–(7), specified by swapping all variables as dependent variables; this verifies the existence of 7 cointegrating vectors in the above model. This proved the existence of a long-run equilibrium relationship/cointegration between the FD, the NRR, IQ, economic growth, policy uncertainty, trade openness, capital, and the interactive term for Pakistan over the period studied. Additionally, to confirm the robustness of the results, we performed diagnostic and stability tests; the result proved the robustness, reliability, and usefulness of the results obtained from the ARDL bounds test of [49] for policy formulation.
After confirming the linear cointegration among the FD of Pakistan and its determinants, we then also estimated the Non-linear ARDL model of [47], specified in Equation (6) above, in order to explore the presence of any protentional asymmetric long-run relationship in Pakistan among FD and its determinants. Specifically, we intended to document the response of FD to both appreciation and depreciation of the NRR and offer more comprehensive findings for policy implications. The results of the non-linear ARDL model (significant F-statistics) reported in the bottom portion of Table 4 are in line with linear ARDL results and this proves the existence of a strong long term cointegration among variables of the study.
Having confirmed the cointegration among the variables of the study, we then proceeded to estimate the long-run and short-run coefficients. Table 5 presents long-run and short-run parameters in the upper and bottom segment, respectively. The results revealed that the IQ, moderating term, economic growth, trade openness, and capital significantly stimulate FD in Pakistan, while economic risk has a significant negative impact on FD, and natural resource exerts no significant effect on FD in Pakistan in the short run. In the long run, IQ, moderating term, economic growth, capital, and trade openness have a significant cointegrating relationship with FD, whereas the NRR and economic risk have an adverse significant effect on FD in Pakistan. These empirical findings regarding the role of the NRR in FD are consistent with the existing body of literature on the subject compiled in different contextual settings [24,75]. A sound institutional environment significantly explains the FD [120]; high-quality institutions exert pressure on policymakers to devise a policy framework that reduces uncertainty and thereby enhances the FD [121,122,123]. The significant positive coefficient of IQ in both the short- and long run confirms the vital role of IQ in stimulating FD in Pakistan and supplements the existing theoretical and empirical view regarding this phenomenon.
Moreover, our results depict a statistically significant moderating term (i.e., the interaction of the NRR with IQ ) which confirms the moderating role of IQ (both in the short- and long run) in the NRR and FD nexuses in Pakistan. Kolstad and Søreide [76] argued that to examine the real effect of the NRR on FD, the interactive role of IQ with the NRR must be taken into account. Omitting IQ from the model will lead to empirical mis-specification and result in an overestimation of results. Bhattacharyya and Hodler [75] evidenced that in counties with weak institutions, the NRR hinders FD. Overall, our findings are consistent with the extant literature, for example [24,26,39,75,124], which reported similar results. Furthermore, a plausible justification of our findings is the growing level of IQ, which acts as a tool to avoid the resource-curse in Pakistan. The quality of institutions has considerably improved in Pakistan due to the successful transition of back to back political regimes over the last two decades. Furthermore, after the establishment of the National Accountability Bureau (NAB), established to curb corruption in Pakistan, and its anti-corruption campaign, the level of corruption has slightly decreased (for example from June 2002 the corruption score was 1.50, which improved to 2.00 by 2008). Since 2007 the independent judiciary movement in Pakistan has led to a more independent and efficient judiciary, which is an essential part of a sound institutional framework. Law and order were rated by the ICRG at 3.00 points in 2009, which increased to 3.42 in 2010 and 3.50 in the next three years. Similarly, democratic accountability has substantially improved, as the score was only 1.00 until 2007, but then reached 4.50 in 2016. The gradual improvement in IQ appears as an important consideration for policymakers.
The policymakers in Pakistan and other resource-rich countries that are in a similar development cadre should focus on the institutional framework to avoid the negative impact of the NRR on various development indicators and to utilize natural resources as a blessing rather than a curse. Moreover, the coefficient of the error correction term (ECMt-1) is significant and negative, which further supports the existence of cointegration between FD in Pakistan and its selected determinants; it also implies that any deviation from the equilibrium relationship in the short run is corrected with a speed of approximately 65% percent annually. We found no anomaly regarding the results of the controlling variables.
As one of the objectives of this study is to investigate asymmetries in the resource-finance nexuses, to this end we separated depreciation from appreciation in the NRR and estimated the Non-linear Autoregressive Distributed Lag model (NARDL), and the results for the short- and the long run are given in Table 6. We find a significant negative coefficient of the NRR in the long run, which indicates that the NRR significantly negatively influences the FD in Pakistan during an appreciation period, whereas in a depreciation period the NRR has a positive and statistically significant coefficient, which shows that FD responds positively to a decline in the NRR.
As both the positive and negative partial sum of natural resources rent changes have statistically significant coefficients, which are different in sign and size, this shows that the NRR changes had an asymmetric effect on FD in Pakistan, whereas in the short-run an appreciation in natural resources has no effect on FD and depreciation harms FD. Furthermore, the results of the control variables are in line with the theoretical and empirical literature and free from any incongruity.
Moreover, the E C M t 1 is highly significant, which further supports the rationale for using the non-linear model in this context. The stability and diagnostic tests are applied to authenticate the reliability of our estimates. The insignificant RESET test confirms the correct specification of our non-linear model. The CUSUM and CUSUM Square graphs of the respective models are not reported to maintain brevity, as we have an estimated number of estimators. Other diagnostic tests confirm that our model is free from serial correlation and heteroscedasticity, and that residuals follow a normal distribution.
For robustness, we use an alternative measure of FD, i.e., domestic credit as a percentage of GDP (DC), which is also widely used in the literature. The results are reported in Table 7 and prove the robustness of our main primary results. The results of the bound test also confirm long-run cointegration relationships among FD measures by “DC” and the NRR, IQ, moderating term, economic growth, policy uncertainty, trade openness, and capital. These results are in line with our baseline model estimates and prove the usefulness of our primary results.
We also estimated the long run and short run coefficient to confirm the robustness of our baseline model; the results are shown in Table 8. The NRR significantly negatively influences the FD measured by DC in both the short- and long run. The IQ, the moderating term, holds significant positive coefficients, in the short- and long run, which are in line with the results of the primary model. Moreover, the results of controlling variables are in line with the literature.

Threshold Analysis

Table 9 incorporates the results of the single threshold estimation. We find a single significant threshold value of 3.097 above which the relationship of the NRR and FD turns nonlinear. It is important to note that up to a threshold of 3.097 the coefficient is 3.228, and above this threshold the coefficient declines slightly to 2.804. Importantly, above the identified threshold the variation explained by the NRR declines slightly. This implies that regulators should maintain at least an IQ level of up to 3.097 to experience the most positive financial benefits of the NRR.

5. Conclusions

This study aimed to explore the long-run relationship between the NRR and FD in Pakistan by incorporating the moderating role of IQ in this framework in both symmetric and asymmetric settings and offers valuable policy implications for stakeholders. We used the ARDL bounds test and NARDL to cointegration approaches to answer the research questions. To validate the robustness of our results, we have re-estimated our primary model by using the alternate traditional proxy of FD (i.e., DC) and the results confirm the robustness of our primary results. The empirical findings proved a long run equilibrium association between the NRR and FD and the positive moderating role of IQ in this paradigm. Specifically, the resource rent negatively influences the FD in Pakistan, IQ has a positive association with FD and the significant positive coefficient of the moderating term proves the positive moderating role of IQ in the NRR and FD nexuses in Pakistan.
Furthermore, the results of the NARDL prove the existence of asymmetries in the relationship between the NRR and FD, both in the short and long run. FD does not respond identically to both appreciation and depreciation in the NRR, as both the positive and negative significant coefficients of the NRR reveals that changes in the NRR have an asymmetric effect on FD in Pakistan.
It is worth mentioning that we find a single significant threshold value of 3.097 above which the relationship of the NRR-FD turns nonlinear—as up to this threshold the NRR explains substantial (coefficient is 3.228) in FD, which declines slightly to 2.804 above the threshold level. Based on the findings of this study we offer the following policy implication for stakeholders:
Policy attention should be directed to improve the institutional framework, in order to challenge the resource curse puzzle in the financial sector and stimulate FD by understanding and incorporating the moderating role of IQ in resource finance nexuses. IQ is an essential factor for FD [121,125]. On the other hand, weak institutions are a hurdle to FD [75]. Moreover, there is a need to identify other channels through which the NRR could enhance FD, and policies should be devised to improve them in order to fully reap the benefits of the natural resource. However, this process is very complicated and needs careful attention from researchers.
The NRR may indirectly stimulate FD, potentially via a sound institutional framework. This implies that IQ prevents the misuse of the NRR and allocates it to the efficient sectors of the economy through the financial system, as the view that the NRR undermines FD [126] is attributed to misuse of natural resource revenue. The threshold result implies that regulators should maintain at least an IQ level of up to 3.097 to experience the most lucretive financial benefits of the natural resource rent in Pakistan. Furthermore, considering the findings of this study regarding other controlling variables, policymakers should come up with policies that enhance the financial and economic development of the country.
The findings of this study are subject to a few limitations that could be addressed in future research. As FD is composed of two sub-sectors i.e., financial institutions development and financial markets development, in future an attempt to explore the impact of the NRR on these two components individually would be a great contribution to the resource-finance literature. Likewise, future studies can also investigate the role of each dimension of IQ individually in the NRR and FD relationship.

Author Contributions

Conceptualization is done by M.A.K. (Muhammad Atif Khan); methodology is designed by, K.A.; Data compilation and formal analysis are performed by M.A.K. (Muhammad Asif Khan), and M.A.K. (Muhammad Atif Khan); validation is undertaken by, J.O., J.P. original draft is prepared by M.A.K. (Muhammad Atif Khan), and K.A., while review and editing are done by J.O., and J.P. All authors have read and agreed to the published version of the manuscript.

Funding

This article was supported by the János Bolyai Research Scholarship of the Hungarian Academy of Sciences. This research was funded by the National Research, Development, and Innovation Fund of Hungary. Project no. 130377 has been implemented with the support provided by the National Research, Development and Innovation Fund of Hungary, financed under the KH_18 funding scheme.

Conflicts of Interest

No potential conflict of interest is declared.

References

  1. Pradhan, R.P.; Bahmani, S.; Kiran, M.U. The dynamics of insurance sector development, banking sector development and economic growth: Evidence from G-20 countries. Glob. Econ. Manag. Rev. 2014, 19, 16–25. [Google Scholar] [CrossRef]
  2. Demetriades, P.; Andrianova, S. Finance and growth: What we know and what we need to know. In Financial Development and Economic Growth; Division of Economics, School of Business, University of Leicester Palgrave Macmillan: London, UK, 2004; pp. 38–65. [Google Scholar]
  3. Levine, R. More on finance and growth: More finance, more growth? Rev. Fed. Reserve Bank St. Louis 2003, 85, 31–46. [Google Scholar] [CrossRef]
  4. Bongini, P.; Iwanicz-Drozdowska, M.; Smaga, P.; Witkowski, B.J.S. Financial development and economic growth: The role of foreign-owned banks in CESEE countries. Sustainability 2017, 9, 335. [Google Scholar] [CrossRef] [Green Version]
  5. Paun, C.V.; Musetescu, R.C.; Topan, V.M.; Danuletiu, D.C.J.S. The impact of financial sector development and sophistication on sustainable economic growth. Sustainability 2019, 11, 1713. [Google Scholar] [CrossRef] [Green Version]
  6. Dinulescu, G.L.; Robescu, V.O.; Radu, F.; Croitoru, G.; Radu, V. A Bioeconomic Solution for Replacing Chemical Fertilizers by Organic Processes for Atmospheric Nitrogen Fixation in Soil. Amfiteatru Econ. 2018, 20, 510–520. [Google Scholar] [CrossRef]
  7. Meyer, N.; Meyer, D.F. Best practice management principles for business chambers to facilitate economic development: Evidence from South Africa. Pol. J. Manag. Stud. 2017, 15, 144–153. [Google Scholar] [CrossRef]
  8. Sanusi, K.A.; Meyer, D.; Ślusarczky, B. The relationship between changes in inflation and financial development. Pol. J. Manag. Stud. 2017, 16, 253–265. [Google Scholar] [CrossRef]
  9. Schumpeter, J.A. The Theory of Economic Development: An Inquiry into Profits, Capital, Credit, Interest, and the Business Cycle; Harvard University Press: Cambridge, MA, USA, 1911. [Google Scholar]
  10. Khan, H.; Khan, S.; Zuojun, F. Institutional Quality and Financial Development: Evidence from Developing and Emerging Economies. Glob. Bus. Rev. 2020, 0972150919892366. [Google Scholar] [CrossRef]
  11. Abdalla, I.S.A.; Murinde, V. Exchange rate and stock price interactions in emerging financial markets: Evidence on India, Korea, Pakistan and the Philippines. Appl. Financ. Econ. 1997, 7, 25–35. [Google Scholar] [CrossRef]
  12. Agyemang, O.S.; Gatsi, J.G.; Ansong, A. Institutional structures and financial market development in Africa. Cogent Econ. Financ. 2018, 6, 1488342. [Google Scholar] [CrossRef] [Green Version]
  13. Aluko, O.A.; Ajayi, M.A. Determinants of banking sector development: Evidence from Sub-Saharan African countries. Borsa Istanb. Rev. 2018, 18, 122–139. [Google Scholar] [CrossRef]
  14. Ashraf, B.N. Do trade and financial openness matter for financial development? Bank-level evidence from emerging market economies. Res. Int. Bus. Financ. 2018, 44, 434–458. [Google Scholar] [CrossRef]
  15. Ben Naceur, S.; Cherif, M.; Kandil, M. What drives the development of the MENA financial sector? Borsa Istanb. Rev. 2014, 14, 212–223. [Google Scholar] [CrossRef] [Green Version]
  16. BenNaceur, S.; Ghazouani, S. Does Inflation Impact on Financial Sector Performance in the MENA Region? Rev. Middle East Econ. Financ. 2005, 3, 219–229. [Google Scholar] [CrossRef]
  17. Bittencourt, M. Inflation and financial development: Evidence from Brazil. Econ. Model. 2011, 28, 91–99. [Google Scholar] [CrossRef] [Green Version]
  18. Bolgorian, M. Corruption and stock market development: A quantitative approach. Phys. A Stat. Mech. Appl. 2011, 390, 4514–4521. [Google Scholar] [CrossRef]
  19. Gupta, S.; Pattillo, C.A.; Wagh, S. Effect of Remittances on Poverty and Financial Development in Sub-Saharan Africa. World Dev. 2009, 37, 104–115. [Google Scholar] [CrossRef]
  20. Herger, N.; Hodler, R.; Lobsiger, M. What Determines Financial Development? Culture, Institutions or Trade. Rev. World Econ. 2008, 144, 558–587. [Google Scholar] [CrossRef] [Green Version]
  21. Sayılır, Ö.; Doğan, M.; Soud, N.S. Financial development and governance relationships. Appl. Econ. Lett. 2018, 25, 1466–1470. [Google Scholar] [CrossRef]
  22. Toroyan, H.; Anayiotos, G.C. Institutional Factors and Financial Sector Development: Evidence from Sub-Saharan Africa; International Monetary Fund: Washington, DC, USA, 2009. [Google Scholar]
  23. Yartey, C.A. The institutional and macroeconomic determinants of stock market development in emerging economies. Appl. Financ. Econ. 2010, 20, 1615–1625. [Google Scholar] [CrossRef]
  24. Yuxiang, K.; Chen, Z. Resource abundance and financial development: Evidence from China. Resour. Policy 2011, 36, 72–79. [Google Scholar] [CrossRef]
  25. Guan, J.; Kirikkaleli, D.; Bibi, A.; Zhang, W. Natural resources rents nexus with financial development in the presence of globalization: Is the “resource curse” exist or myth? Resour. Policy 2020, 66, 101641. [Google Scholar] [CrossRef]
  26. Shahbaz, M.; Naeem, M.; Ahad, M.; Tahir, I. Is natural resource abundance a stimulus for financial development in the USA? Resour. Policy 2018, 55, 223–232. [Google Scholar] [CrossRef]
  27. Mlachila, M.; Ouedraogo, R. Financial development curse in resource-rich countries: The role of commodity price shocks. Q. Rev. Econ. Financ. 2019. [Google Scholar] [CrossRef]
  28. Zaidi, S.A.H.; Wei, Z.; Gedikli, A.; Zafar, M.W.; Hou, F.; Iftikhar, Y. The impact of globalization, natural resources abundance, and human capital on financial development: Evidence from thirty-one OECD countries. Resour. Policy 2019, 64, 101476. [Google Scholar] [CrossRef]
  29. Dwumfour, R.A.; Ntow-Gyamfi, M. Natural resources, financial development and institutional quality in Africa: Is there a resource curse? Resour. Policy 2018, 59, 411–426. [Google Scholar] [CrossRef]
  30. Hodler, R. The curse of natural resources in fractionalized countries. Eur. Econ. Rev. 2006, 50, 1367–1386. [Google Scholar] [CrossRef] [Green Version]
  31. Satti, S.L.; Farooq, A.; Loganathan, N.; Shahbaz, M. Empirical evidence on the resource curse hypothesis in oil abundant economy. Econ. Model. 2014, 42, 421–429. [Google Scholar] [CrossRef] [Green Version]
  32. Williams, A. Shining a light on the resource curse: An empirical analysis of the relationship between natural resources, transparency, and economic growth. World Devel. 2011, 39, 490–505. [Google Scholar] [CrossRef]
  33. Petkovski, M.; Kjosevski, J. Does banking sector development promote economic growth? An empirical analysis for selected countries in Central and South Eastern Europe. Econ. Res. Ekonomska Istraživanja 2014, 27, 55–66. [Google Scholar] [CrossRef]
  34. Atkinson, G.; Hamilton, K. Savings, Growth and the Resource Curse Hypothesis. World Dev. 2003, 31, 1793–1807. [Google Scholar] [CrossRef]
  35. Mehlum, H.; Moene, K.; Torvik, R. Institutions and the resource curse. Econ. J. 2006, 116, 1–20. [Google Scholar] [CrossRef] [Green Version]
  36. Boschini, A.D.; Pettersson, J.; Roine, J. Resource curse or not: A question of appropriability. Scand. J. Econ. 2007, 109, 593–617. [Google Scholar] [CrossRef] [Green Version]
  37. Costa, H.K.; Santos, E.M.D. Institutional analysis and the “resource curse” in developing countries. Energy Policy 2013, 63, 788–795. [Google Scholar] [CrossRef]
  38. Badeeb, R.A.; Lean, H.H.; Clark, J. The evolution of the natural resource curse thesis: A critical literature survey. Resour. Policy 2017, 51, 123–134. [Google Scholar] [CrossRef]
  39. Khan, M.A.; Khan, M.A.; Abdulahi, M.E.; Liaqat, I.; Shah, S.S.H. Institutional quality and financial development: The United States perspective. J. Multinatl. Financ. Manag. 2019, 49, 67–80. [Google Scholar] [CrossRef]
  40. Adams, D.; Ullah, S.; Akhtar, P.; Adams, K.; Saidi, S. The role of country-level institutional factors in escaping the natural resource curse: Insights from Ghana. Resour. Pol. 2019, 61, 433–440. [Google Scholar] [CrossRef]
  41. Zallé, O. Natural resources and economic growth in Africa: The role of institutional quality and human capital. Resour. Policy 2019, 62, 616–624. [Google Scholar] [CrossRef]
  42. De Jongh, J.J.; Meyer, N.; Meyer, D.F. Perceptions of local businesses on the Employment Tax Incentive Act: The case of the Vaal Triangle Region. J. Contemp. Manag. 2016, 13, 409–432. [Google Scholar]
  43. Nawaz, K.; Lahiani, A.; Roubaud, D. Natural resources as blessings and finance-growth nexus: A bootstrap ARDL approach in an emerging economy. Resour. Policy 2019, 60, 277–287. [Google Scholar] [CrossRef]
  44. Asif, M.; Khan, K.B.; Anser, M.K.; Nassani, A.A.; Abro, M.M.Q.; Zaman, K. Dynamic interaction between financial development and natural resources: Evaluating the ‘Resource curse’ hypothesis. Resour. Policy 2020, 65, 101566. [Google Scholar] [CrossRef]
  45. Park, W.G.; Lippoldt, D.; Directorate, O.T. The Impact of Trade-Related Intellectual Property Rights on Trade and Foreign Direct Investment in Developing Countries; OECD: Paris, France, 2003. [Google Scholar]
  46. Valaskova, K.; Kliestik, T.; Kovacova, M. Management of financial risks in Slovak enterprises using regression analys is. Oeconomia Copernic 2018, 9, 105–121. [Google Scholar] [CrossRef] [Green Version]
  47. Shin, Y.; Yu, B.; Greenwood-Nimmo, M. Modelling Asymmetric Cointegration and Dynamic Multipliers in a Nonlinear ARDL Framework. In Festschrift in Honor of Peter Schmidt: Econometric Methods and Applications; Sickles, R.C., Horrace, W.C., Eds.; Springer: New York, NY, USA, 2014; pp. 281–314. [Google Scholar]
  48. Kliestik, T.; Misankova, M.; Valaskova, K.; Svabova, L. Bankruptcy Prevention: New Effort to Reflect on Legal and Social Changes. Sci. Eng. Ethics 2018, 24, 791–808. [Google Scholar] [CrossRef] [PubMed]
  49. Pesaran, M.H.; Shin, Y.; Smith, R.J. Bounds testing approaches to the analysis of level relationships. J. Appl. Econom. 2001, 16, 289–326. [Google Scholar] [CrossRef]
  50. Van der Ploeg, F. Natural Resources: Curse or Blessing? J. Econ. Lit. 2011, 49, 366–420. [Google Scholar] [CrossRef] [Green Version]
  51. Abdulahi, M.E.; Shu, Y.; Khan, M.A. Resource rents, economic growth, and the role of institutional quality: A panel threshold analysis. Resour. Policy 2019, 61, 293–303. [Google Scholar] [CrossRef]
  52. Boschini, A.; Pettersson, J.; Roine, J. The Resource Curse and its Potential Reversal. World Dev. 2013, 43, 19–41. [Google Scholar] [CrossRef] [Green Version]
  53. Gylfason, T. Natural resources, education, and economic development. Eur. Econ. Rev. 2001, 45, 847–859. [Google Scholar] [CrossRef]
  54. Gylfason, T. Natural Resources and Economic Growth: From Dependence to Diversification; Centre for Economic Policy Research: Clerkenwell, London, UK, 2004. [Google Scholar]
  55. Gylfason, T.; Herbertsson, T.T.; Zoega, G. A Mixed Blessing: Natural Resources and Economic Growth. Macroecon. Dyn. 1999, 3, 204–225. [Google Scholar] [CrossRef]
  56. Gylfason, T.; Zoega, G. Natural Resources and Economic Growth: The Role of Investment. World Econ. 2006, 29, 1091–1115. [Google Scholar] [CrossRef]
  57. Sachs, J.D.; Warner, A.M. Natural Resource Abundance and Economic Growth; National Bureau of Economic Research: Cambridge, MA, USA, 1995. [Google Scholar]
  58. Sachs, J.D.; Warner, A.M. The curse of natural resources. Eur. Econ. Rev. 2001, 45, 827–838. [Google Scholar] [CrossRef]
  59. Arezki, R.; Van der Ploeg, F. Do natural resources depress income per capita? Rev. Dev. Econ. 2011, 15, 504–521. [Google Scholar] [CrossRef]
  60. Ascher, W. Why Governments Waste Natural Resources: Policy Failures in Developing Countries; Johns Hopkins University Press: Baltimore, MD, USA, 1999. [Google Scholar]
  61. Rostow, W.W.; Rostow, W.W. The Stages of Economic Growth: A Non-Communist Manifesto; Cambridge University Press: Cambridge, UK, 1990. [Google Scholar]
  62. Viner, J.J.T.P. America’s Aims and the Progress of Underdeveloped Countries; University of Chicago Press: Chicago, IL, USA, 1952; pp. 175–202. [Google Scholar]
  63. Brunnschweiler, C.N.J.W. Cursing the blessings? Natural resource abundance, institutions, and economic growth. World Dev. 2008, 36, 399–419. [Google Scholar] [CrossRef] [Green Version]
  64. Koitsiwe, K.; Adachi, T. Relationship between mining revenue, government consumption, exchange rate and economic growth in Botswana. Contaduría y Administración 2015, 60, 133–148. [Google Scholar] [CrossRef] [Green Version]
  65. Mohsen, M. Reconsidering the resource curse in oil-exporting countries. Energy Policy 2009, 37, 1165–1169. [Google Scholar]
  66. Philippot, L.-M. Natural Resources and Economic Development in Transition Economies; International Conference Environment and Natural Resources Management in Developing and Transition Economies: Clermont-Ferrand, France, 2010. [Google Scholar]
  67. Zagozina, M. The Resource Curse Paradox: Natural Resources and Economic Development in the Former Soviet Countries; Department of Forest Sciences, University of Helsinki: Helsinki, Finland, 2014. [Google Scholar]
  68. Arin, K.P.; Braunfels, E. The resource curse revisited: A Bayesian model averaging approach. Energy Econ. 2018, 70, 170–178. [Google Scholar] [CrossRef]
  69. Erdoğan, S.; Yıldırım, D.Ç.; Gedikli, A. Natural resource abundance, financial development and economic growth: An investigation on Next-11 countries. Resour. Policy 2020, 65, 101559. [Google Scholar] [CrossRef]
  70. Khan, M.A.; Domicián, M.; Abdulahi, M.E.; Sadaf, R.; Khan, M.A.; Popp, J.; Oláh, J. Do Institutional Quality, Innovation and Technologies Promote Financial Market Development? Eur. J. Int. Manag. 2020. [Google Scholar] [CrossRef]
  71. Khan, M.A.; Kong, D.; Xiang, J.; Zhang, J. Impact of Institutional Quality on Financial Development: Cross-Country Evidence based on Emerging and Growth-Leading Economies. Emerg. Mark. Financ. Trade 2019, 1–17. [Google Scholar] [CrossRef]
  72. North, D.C. Institutional change: A framework of analysis. Soc. Rules 1994, 189–201. [Google Scholar] [CrossRef] [Green Version]
  73. Sarmidi, T.; Hook Law, S.; Jafari, Y. Resource Curse: New Evidence on the Role of Institutions. Int. Econ. J. 2014, 28, 191–206. [Google Scholar] [CrossRef]
  74. North, D.C. Institutions. J. Econ. Perspect. 1991, 5, 97–112. [Google Scholar] [CrossRef]
  75. Bhattacharyya, S.; Hodler, R. Do natural resource revenues hinder financial development? The role of political institutions. World Dev. 2014, 57, 101–113. [Google Scholar] [CrossRef] [Green Version]
  76. Kolstad, I.; Søreide, T. Corruption in natural resource management: Implications for policy makers. Resour. Pol. 2009, 34, 214–226. [Google Scholar] [CrossRef]
  77. Taguchi, H.; Lar, N. The resource curse hypothesis revisited: Evidence from Asian economies. Bull. Appl. Econ. 2016, 3, 31–42. [Google Scholar]
  78. Rathinam, F.X.; Raja, A.V. Law, regulation and institutions for financial development: Evidence from India. Emerg. Mark. Rev. 2010, 11, 106–118. [Google Scholar] [CrossRef]
  79. Khan, M.A.; Ilyas, R.M.A.; Hashmi, S.H. Cointegration between Institutional Quality and Stock Market Development. Numl Int. J. Bus. Manag. 2018, 13, 90–103. [Google Scholar]
  80. Bulte, E.H.; Damania, R.; Deacon, R.T. Resource intensity, institutions, and development. World Dev. 2005, 33, 1029–1044. [Google Scholar] [CrossRef]
  81. Huang, Y. Political Institutions and Financial Development: An Empirical Study. World Dev. 2010, 38, 1667–1677. [Google Scholar] [CrossRef]
  82. Fufa, T.; Kim, J. Stock markets, banks, and economic growth: Evidence from more homogeneous panels. Res. Int. Bus. Financ. 2018, 44, 504–517. [Google Scholar] [CrossRef]
  83. Hsueh, S.-J.; Hu, Y.-H.; Tu, C.-H. Economic growth and financial development in Asian countries: A bootstrap panel Granger causality analysis. Econ. Model. 2013, 32, 294–301. [Google Scholar] [CrossRef]
  84. Nyasha, S.; Odhiambo, N.M. Banks, stock market development and economic growth in South Africa: A multivariate causal linkage. Appl. Econ. Lett. 2015, 22, 1480–1485. [Google Scholar] [CrossRef]
  85. Chow, W.W.; Fung, M.K. Financial development and growth: A clustering and causality analysis. J. Int. Trade Econ. Dev. 2013, 22, 430–453. [Google Scholar] [CrossRef]
  86. Shahbaz, M. Does trade openness affect long run growth? Cointegration, causality and forecast error variance decomposition tests for Pakistan. Econ. Model. 2012, 29, 2325–2339. [Google Scholar] [CrossRef] [Green Version]
  87. Kim, D.-H.; Lin, S.-C.; Suen, Y.-B. Dynamic effects of trade openness on financial development. Econ. Model. 2010, 27, 254–261. [Google Scholar] [CrossRef]
  88. Menyah, K.; Nazlioglu, S.; Wolde-Rufael, Y. Financial development, trade openness and economic growth in African countries: New insights from a panel causality approach. Econ. Model. 2014, 37, 386–394. [Google Scholar] [CrossRef]
  89. Todorovic, S.; Radisic, M.; Takaci, A.; Borocki, J.; Kliestikova, J. Impact of internal additional compensations policy on revenues in cross-sectoral SME environment. Eur. J. Int. Manag. 2019, 13, 843–863. [Google Scholar] [CrossRef]
  90. David, M.A.; Mlachila, M.M.; Moheeput, A. Does Openness Matter for Financial Development in Africa? International Monetary Fund: Washington, DC, USA, 2014. [Google Scholar]
  91. Baltagi, B.H.; Demetriades, P.O.; Law, S.H. Financial development and openness: Evidence from panel data. J. Dev. Econ. 2009, 89, 285–296. [Google Scholar] [CrossRef]
  92. Adjei Frederick, A. Economic policy uncertainty, market returns and expected return predictability. J. Financ. Econ. Policy 2017, 9, 242–259. [Google Scholar] [CrossRef]
  93. Phan, D.H.B.; Sharma, S.S.; Tran, V.T. Can economic policy uncertainty predict stock returns? Global evidence. J. Int. Finan. Mark. Inst. Money 2018, 55, 134–150. [Google Scholar] [CrossRef]
  94. Raza, S.A.; Shah, N.; Shahbaz, M. Does economic policy uncertainty influence gold prices? Evidence from a nonparametric causality-in-quantiles approach. Resour. Policy 2018, 57, 61–68. [Google Scholar] [CrossRef]
  95. Zhang, G.; Han, J.; Pan, Z.; Huang, H. Economic policy uncertainty and capital structure choice: Evidence from China. Econ. Syst. 2015, 39, 439–457. [Google Scholar] [CrossRef] [Green Version]
  96. Baker, S.R.; Bloom, N.; Davis, S.J. Measuring Economic Policy Uncertainty. Q. J. Econ. 2016, 131, 1593–1636. [Google Scholar] [CrossRef]
  97. Liu, H.; Islam, M.A.; Khan, M.A.; Hossain, M.I.; Pervaiz, K. Does financial deepening attract foreign direct investment? Fresh evidence from panel threshold analysis. Res. Int. Bus. Financ. 2020, 53, 101198. [Google Scholar] [CrossRef]
  98. Tiba, S. Modeling the nexus between resources abundance and economic growth: An overview from the PSTR model. Resour. Policy 2019, 64, 101503. [Google Scholar] [CrossRef]
  99. Pakistan Government. Pakistan Economic Survey; Ministry of Finance: Islamabad, Pakistan, 2016; pp. 19–40.
  100. Svirydzenka, K. Introducing a New Broad-Based Index of Financial Development; International Monetary Fund: Washingtron, DC, USA, 2016. [Google Scholar]
  101. Law, S.H.; Azman-Saini, W.N.W.; Ibrahim, M.H. Institutional quality thresholds and the finance—Growth nexus. J. Bank. Financ. 2013, 37, 5373–5381. [Google Scholar] [CrossRef]
  102. Law, S.H.; Habibullah, M.S. Financial Development, Institutional Quality and Economic Performance in East Asian Economies. Rev. Appl. Econ. 2016, 2, 201–216. [Google Scholar]
  103. Ahmed, K.; Mahalik, M.K.; Shahbaz, M. Dynamics between economic growth, labor, capital and natural resource abundance in Iran: An application of the combined cointegration approach. Resour. Pol. 2016, 49, 213–221. [Google Scholar] [CrossRef]
  104. Dickey, D.A.; Fuller, W.A. Distribution of the Estimators for Autoregressive Time Series with a Unit Root. J. Am. Stat. Assoc. 1979, 74, 427–431. [Google Scholar]
  105. Dickey, D.A.; Fuller, W.A. Likelihood Ratio Statistics for Autoregressive Time Series with a Unit Root. Econometrica 1981, 49, 1057–1072. [Google Scholar] [CrossRef]
  106. Phillips, P.C.B.; Perron, P. Testing for a unit root in time series regression. Biometrika 1988, 75, 335–346. [Google Scholar] [CrossRef]
  107. Zivot, E.; Andrews, D.W.K. Further evidence on the great crash, the oil-price shock, and the unit-root hypothesis. J. Bus. Econ. Stat. 2002, 20, 25–44. [Google Scholar] [CrossRef]
  108. Engle, R.F.; Granger, C.W.J. Co-Integration and Error Correction: Representation, Estimation, and Testing. Econometrica 1987, 55, 251–276. [Google Scholar] [CrossRef]
  109. Johansen, S. Estimation and Hypothesis Testing of Cointegration Vectors in Gaussian Vector Autoregressive Models. Econometrica 1991, 59, 1551–1580. [Google Scholar] [CrossRef]
  110. Mahi, M.; Phoong, S.W.; Ismail, I.; Isa, C.R.J.S. Energy–Finance–Growth Nexus in ASEAN-5 Countries: An ARDL Bounds Test Approach. Sustainability 2020, 12, 5. [Google Scholar] [CrossRef] [Green Version]
  111. Romilly, P.; Song, H.; Liu, X. Car ownership and use in Britain: A comparison of the empirical results of alternative cointegration estimation methods and forecasts. Appl. Econ. 2001, 33, 1803–1818. [Google Scholar] [CrossRef]
  112. Li, C.; Pervaiz, K.; Khan, M.A.; Rehman, F.U.; Oláh, J. On the Asymmetries of Sovereign Credit Rating Announcements and Financial Market Development in the European Region. Sustainability 2019, 11, 6636. [Google Scholar] [CrossRef] [Green Version]
  113. Rehman, F.U.; Khan, M.A.; Khan, M.A.; Pervaiz, K.; Liaqat, I. The Causal, Linear and Nonlinear Nexus Between Sectoral FDI and Infrastructure in Pakistan: Using A New Global Infrastructure Index. Res. Int. Bus. Financ. 2020, 52, 101–129. [Google Scholar] [CrossRef]
  114. Hansen, B.E. Threshold autoregression in economics. Stat. Interface 2011, 4, 123–127. [Google Scholar] [CrossRef]
  115. Darling, D.A. The kolmogorov-smirnov, cramer-von mises tests. Ann. Math. Stat. 1957, 28, 823–838. [Google Scholar] [CrossRef]
  116. Shapiro, S.S.; Wilk, M.B. An analysis of variance test for normality (complete samples). Biometrika 1965, 52, 591–611. [Google Scholar] [CrossRef]
  117. Anderson, T.W.; Darling, D.A. A test of goodness of fit. J. Am. Stat. Assoc. 1954, 49, 765–769. [Google Scholar] [CrossRef]
  118. Yap, B.W.; Sim, C.H. Comparisons of various types of normality tests. J. Stat. Comput. Simul. 2011, 81, 2141–2155. [Google Scholar] [CrossRef]
  119. Clemente, J.; Montañés, A.; Reyes, M. Testing for a unit root in variables with a double change in the mean. Econ. Lett. 1998, 59, 175–182. [Google Scholar] [CrossRef]
  120. Law, S.H.; Azman-Saini, W.J.E. Institutional quality, governance, and financial development. Econ. Gov. 2012, 13, 217–236. [Google Scholar] [CrossRef] [Green Version]
  121. Cherif, M.; Gazdar, K.J.I. Finance, Macroeconomic and institutional determinants of stock market development in MENA region: New results from a panel data analysis. Int. J. Bank. Financ. 2010, 7, 139–159. [Google Scholar]
  122. Ibrahim, Y.; Ahmed, I.; Minai, M.S. The Influence of Institutional Characteristics on Financial Performance of Microfinance Institutions in the OIC Countries. Econ. Sociol. 2018, 11, 19–35. [Google Scholar] [CrossRef] [Green Version]
  123. Su, D.T.; Nguyen, P.C.; Christophe, S. Impact of foreign direct investment, trade openness and economic institutions on growth in emerging countries: The case of Vietnam. J. Int. Stud. 2019, 12, 243–264. [Google Scholar] [CrossRef]
  124. Bhattacharyya, S.; Hodler, R. Natural resources, democracy and corruption. Eur. Econ. Rev. 2010, 54, 608–621. [Google Scholar] [CrossRef] [Green Version]
  125. Islam, M.A.; Khan, M.A.; Sroka, W.; Popp, J.; Oláh, J. Financial Development and Foreign Direct Investment—The Moderating Role of Quality Institutions. Sustainability 2020, 12, 3556. [Google Scholar] [CrossRef]
  126. Law, S.H.; Moradbeigi, M. Financial development and oil resource abundance-growth relations: Evidence from panel data. Environ. Sci. Pollut. Res. Int. 2017, 24, 22458–22475. [Google Scholar] [CrossRef] [PubMed]
Figure 1. The NRR in Pakistan from 1980–2018.
Sustainability 12 03897 g001
Figure 2. IQ and FD in Pakistan from 1980–2018.
Sustainability 12 03897 g002
Table 1. Descriptive statistics.
VariableObsMeanStd. Dev.MinMaxCVMSWAD
lnFDt343.1470.1962.7333.4740.1020.1140.116
lnNRRt340.2840.4310.4351.0440.7130.4160.843
lnIQt343.0620.1762.5713.4420.2410.1310.117
lnIQt*NRt340.8871.341.2343.2580.4510.2330.328
lnECGt346.7470.2176.3217.1090.1810.2090.174
lnECRt343.3530.1622.9853.6020.2110.6120.815
lnKt342.7710.1072.5272.9570.7510.7340.739
lnTOt343.4090.1043.1833.6330.6430.2710.205
Notes: CVM is Cramer von Mises; SW depicts Shapiro-Wilk, and AD is Anderson Darling. The last three columns show p-values corresponding to these tests.
Table 2. Pearson pairwise correlations matrix.
VariableslnFDtlnNRRtlnIQtlnIQt*NRtlnECGtlnECRtlnKtlnTOt
lnFDt1
lnNRRt−0.319 *1
lnIQt0.238 *0.2381
lnIQt*NRt0.423 *0.999 *0.2611
lnECGt0.405 *0.6780.5540.6861
lnECRt−0.084 *−0.505 *−0.638 *0.521 *−0.449 *1
lnKt0.275 *0.418−0.53−0.432−0.604−0.515 *1
lnTOt−0.375 *−0.442−0.1280.4330.031 *−0.1090.3581
* shows significance at the 0.05 level.
Table 3. Unit root testing.
Level First difference
VariableADFPPZABreakADFPPZABreak
lnFDt−2.73−6.95−2.762007−4.95 ***−9.34 ***−7.80 ***2007
lnNRRt−2.59−3.07 *−4.352002−4.26 **−4.69 ***−5.11 **1999
lnIQt−3.45 *−2.66−5.15 **1994−5.41 ***−5.20 ***−6.24 ***1998
lnIQt*NRRt−2.61−3.05−4.482002−4.31 ***−4.37 ***−5.20 ***1999
lnECGt−2.60−2.59−3.411993−6.48 ***−3.79 ***−5.41**2003
lnECRt−2.38−1.95−4.111996−5.39 ***−5.42 ***−6.63 ***1991
lnKt−3.11 *−2.65−3.462010−4.01 ***−5.43 ***−6.23 ***2009
lnTOt−3.22 *−3.28 *−4.232005−6.05 ***−7.22 ***−7.41 ***2012
Note: ADF = Augmented Dicky Fuller; PP = Philip Perron; ZA = Zivot-Andrews. Critical values for Zivot-Andrews: 1%: −5.57 5%: −5.08 10%: −4.82. Note: (***) (**) and (*) depicts level of significance at 1%, 5% and 10%, respectively.
Table 4. Linear and non-linear ARDL bounds test to cointegration.
Estimation Method Diagnostic and Stability Tests
ARDL Bounds TestLag LengthF-StatisticsJBLMBPGRR
Linear
1FDt = f(NRt, IQt, IQt*NRRt, ECGt, ERt, TOt, Kt)(2,2,2,2,0,2,1,0)6.607 ***0.5090.1740.1120.759
2NRt = f(FDt, IQt, IQt*NRt, ECGt, ECRt, TOt, Kt)(2,1,2,2,1,0,0,0)5.480 ***0.4880.1170.1950.825
3IQt = f(NRt, FDt, IQt*NRt, ECGt, ECRt, TOt, Kt)(2,2,1,0,0,0,2,0)2.2980.9870.2190.1090.086
4IQt*NRt = f(IQt, NRt, FDt, ECGt, ECRt, TOt, Kt)(2, 2,2,1,1,0,0,0)7.528 ***0.9690.7770.9640.648
5ECGt = f(IQt*NRt, IQt, NRt, FDt, ECRt, TOt, Kt)(1,2,0,2,1,0,0,1)4.676 ***0.6020.6560.6470.562
6ECRt = f(ECGt, IQt*NRt, IQt, NRt, FDt, TOt, Kt)(1,2,1,0,0,2,2,2)6.200 ***0.5830.9490.4990.158
7TOt = f(ECRt, ECGt, IQt*NRt, IQt, NRt, FDt, Kt)(1,2,1,1,0,1,0,2)6.708 ***0.5120.5230.4320.142
8Kt = f(TOt, EPUt, ECGt, IQt*NRt, IQt, NRt, FDt)(0,2,0,1,2,0,2,1)3.150 *0.8810.1340.2180.094
Non-Linear
9FDt = f(NRRt_POS, NRR_ NEGt, IQt, IQt*NRRt, ECGt, ECRt, TOt, Kt)(2,2,2,2,2,0,1,1,2,1)8.43 ***0.8810.7340.6880.258
Note: (***) and (*) depicts level of significance at 1%, and 10%, respectively. JB is the p-values of Jarque-Bera; LM depicts p-values of the LM-Breusch-Godfrey Serial Correlation LM Test; PBG is the p-values of the Heteroskedasticity Test; BPG and RR are the p-values of the Breusch-Pagan-Godfrey test and the RR-Ramsey RESET test of model stability, respectively.
Table 5. Short run and long run analysis (Linear Model).
Dependent Variable lnFDt
VariableCoefficientStd. Errort-StatisticP-Value
Long-run
lnNRRt−0.08370.0401−2.090.050
lnIQt,0.33820.08813.840.001
lnIQt*NRRt0.08660.03812.270.034
lnECGt0.71640.22873.130.004
ln ECRt−0.33910.31781−1.070.296
ln TOt0.1020.041442.460.027
ln Kt,0.010540.00432.440.022
Dt0.09220.02893.190.004
C−1.06890.4779−2.230.035
Shor-run
VariableCoefficientStd. Errort−Statisticp−value
ΔlnNRt−0.0740.324−0.230.822
ΔlnIQt,0.5990.1743.440.003
ΔlnIQt*NRRt0.4600.1533.000.007
ΔlnECGt0.5990.1743.440.003
ΔlnECRt−0.1090.032−3.400.003
ΔlnTOt0.3990.1872.130.043
ΔlnKt,0.5650.1284.400.000
ECMt-1−0.6570.108−6.060.000
Dt−0.1110.031−3.570.002
C−6.4612.769−2.330.004
R-squared0.742
F-statistics67.005
p-value0.000
Diagnostics and Stability Testing
TestF−Statp−value
JB1.5380.436
LM2.3580.083
BPG2.0310.072
RR2.8690.326
Table 6. Short run and long run analysis. Non-Linear Model.
Dependent Variable lnFDt
VariableCoefficientStd. Errort-Statisticp-Value
Long-run
lnNRRt_POS−0.4790.154−3.090.005
lnNRRt_NEG0.1950.0812.400.025
lnIQt0.8390.3512.390.027
lnIQt*NRRt0.0910.0184.880.000
lnECGt0.4130.1682.460.023
ln ECRt−0.2650.061−4.300.000
ln TOt0.5010.1513.310.004
ln Kt0.0900.0184.840.000
Dt−0.0360.016−2.170.044
C−6.6162.783−2.380.026
Shor -run
VariableCoefficientStd. Errort-Statisticp-value
ΔlnNRRt_POS−0.0411.063− 0.040.970
ΔlnNRRt_NEG−0.0680.0307−2.240.037
ΔlnIQt,0.0850.0223.850.001
ΔlnIQt*NRt0.0980.0273.570.002
ΔlnECGt0.3980.15922.500.025
ΔlnECRt−0.1390.158−0.880.388
ΔlnTOt0.3610.1802.010.058
ΔlnKt0.8650.3512.460.023
ECMt-1−0.8430.176−4.790.000
Dt0.0800.0342.340.030
C0.8390.3512.390.027
R-squared 0.7713
F-statistics69.0086
p-value0.0000
Diagnostics and Stability Testing
TestF-Statp-value
JB2.5210.124
LM4.0030.084
BPG2.5100.097
RR3.1240.421
Table 7. Robustness with alternative measures (DC).
ARDL Bounds TestDiagnostic and Stability Tests
Estimation MethodF-StatisticsJBLMBPGRR
1.DCt = f(NRt, IQt, IQt*NRt, ECGt, ECRt, TOt, Kt)5.204 ***0.7310.0790.4210.324
2.NRt = f(DCt, IQt, IQt*NRt, ECGt, ECRt, TOt, Kt)7.304 ***0.3400.1840.2010.723
3.IQt = f(NRt, DCt, IQt*NRt ECGt, ECRt, TOt, Kt)3.751 ***0.8140.1540.4120.461
4.IQt*NRt = f(IQt, NRt, DCt, ECGt, ECRt, TOt, Kt)6.447 ***0.6320.2640.8730.923
5.ECGt = f(IQt*NRt, IQt, NRt, DCt, ECRt, TOt, Kt)8.471 ***0.9320.0920.4570.102
6.ECRt = f(ECGt, IQt*NRt, IQt, NRt, DCt, TOt, Kt)6.031 ***0.4370.5320.2370.091
7.TOt = f(ECRt, ECGt, IQt*NRt, IQt, NRt, DCt, Kt)5.630 ***0.7120.0060.5140.1421
8.Kt = f(TOt, ECRt, ECGt, IQt*NRt, IQt, NRt, DCt)2.1340.6320.1030.3850.094
Note: (***) indicate significance at 1%. Critical lower-bound values at 10%, 5% and 1% = 2.12, 2.45, 3.15; for upper bound = 3.23, 3.61 and 4.43, respectively. JB is the p-values of Jarque-Bera; LM depicts p-values of the LM-Breusch-Godfrey Serial Correlation LM Test; PBG is p-values of Heteroskedasticity test: BPG and RR are the p-values of Breusch-Pagan-Godfrey test and the RR-Ramsey RESET test of model stability, respectively.
Table 8. Robustness with DC (Short run and long run analysis).
Dependent Variable ln DCt
VariableCoefficientStd. Errort-Statisticp-Value
Long-run
lnNRRt−0.0620.017−3.600.002
lnIQt,0.0410.0172.870.022
lnIQt*NRRt0.1760.0612.270.007
lnECGt0.9410.1655.700.000
ln EPUt−0.4380.167−2.610.017
ln TOt0.1900.0892.120.047
ln Kt,0.0200.0044.970.000
C−5.1070.757−6.740.000
Short-run
VariableCoefficientStd. Errort-Statisticp-value
ΔlnNRRt−0.0410.017−2.420.002
ΔlnIQt,0.0400.0065.800.000
ΔlnIQt*NRRt0.0800.0392.040.050
ΔlnECGt0.4690.02122.010.000
ΔlnECRt0.0010.2120.010.993
ΔlnTOt0.5780.2172.660.015
ΔlnKt,0.8500.2513.380.002
ECMt-1−0.4960.100−4.950.000
C−3.1511.124−2.800.010
R-squared0.661
F-statistics65.058
p-value0.000
Diagnostics and Stability Testing
TestF-Statp-value
JB1.7230.374
LM4.8340.145
BPG5.3100.084
RR2.8450.614
Table 9. Threshold regression.
VariableThresholdCoefficient (Region 1)Coefficient (Region 2)
IQt3.097 ***3.228 ***2.804 ***
Note: *** denote significance level at 1%.

