Article

Does the Mixed-Ownership Reform Affect the Innovation Strategy Choices of Chinese State-Owned Enterprises?

1
School of Economics and Management, Yanshan University, Qinhuangdao 066004, China
2
Faculty of Management Sciences, University of Kotli, Azad Jammu and Kashmir, Kotli 11100, Pakistan
3
Business School, University of Leeds, Leeds LS2 9JT, UK
*
Authors to whom correspondence should be addressed.
Sustainability 2020, 12(7), 2587; https://doi.org/10.3390/su12072587
Submission received: 26 February 2020 / Revised: 21 March 2020 / Accepted: 22 March 2020 / Published: 25 March 2020

Abstract

:
In recent years, the innovation of state-owned listed enterprises has gained substantial momentum in academic research due to their vital role in sustainable economic development. This article examines and evaluates the influence of mixed-ownership reform on the innovation strategy of Chinese State-Owned Enterprises (SOEs) from the two dimensions of ownership structure adjustment and control right allocation. We extend extant research in that: The diversity of mixed shareholders, the depth of mixed equity, and the control of mixed equity can significantly promote the exploratory innovation investment of SOEs. Our study investigates the impact of the shareholding ratio of foreign investors, natural persons, and institutional investors. The empirical results found a significant positive correlation between the increase of the shareholding ratio of institutional investors and the exploratory and exploitative innovation investment. On the other hand, private shareholders’ shareholding ratio has no impact on the innovation strategy choices of SOEs. Specifically, the results proved that the promotion of exploratory innovation investment by mixed-ownership reform is more significant in SOEs controlled by the central government or in competitive industries. To a large extent, this promotion is achieved by improving the proportion of executives with a professional R&D background in SOEs.

1. Introduction

Innovation is an important galvanic force for national economic growth and sustainability [1,2]. Currently, China is in a crucial moment of economic transformation and upgrading. The 13th Five-Year Plan on Technology and Innovation points out that developing independent innovation capacity is an important step to building China into an innovative country, which is contemplated in the major discoveries in basic research and strategic high technology as well as substantial progress in original innovation capacity and international competitiveness. According to the ambidexterity innovation theory, the innovation activities of enterprises are categorized into exploratory innovation and exploitative innovation. Exploratory innovation deals with seeking fundamental advancement through basic research, in which the R&D cycle is longer and the risk is higher than is the case with exploitative innovation [3]. It can be observed that exploratory innovation plays a more intense role in the improvement of national independent innovation capacity. As the micro-subject of innovation activities, companies can perceptively assign resources among several innovation strategies by steadily increasing innovation investment and, as a result, laying a sturdy substructure for the long-term development of the national economy and the enhancement of global competitiveness.
There have been numerous surveys on impacting factors of innovation strategy choice, especially centering on corporate governance, including ownership structure [4], the board of directors structure [5], executive incentive [6], and manager characteristics [7,8]. In addition, the financial market has an important influence on the sustainability of developing countries [9]; Sun and Zhang [10] find that the improvement of financial development level can maintain the sustainability of enterprise operations by promoting exploratory innovation. The contemporary research has assisted in clarifying the affecting factors and mechanisms of innovation strategy choice but overlooked the influence of the institutional environment on innovation strategies. The institutional reform in the economic and social fields along with the systemic reform of science and technology can break through the institutional hindrance of the integration of science, technology, and the economy, and encourage the original breakthrough and transformation of innovation results. In rapidly changing ecosystems, with the intention of inspiring the vitality and competitiveness of State-Owned Enterprises (SOEs), the government is robustly promoting mixed-ownership reform. This institutional reform introduces non-state-owned shareholders and their appointed executives, which not only impacts the ownership structure of enterprises, but also affects the allocation of control rights. The interest appeals and risk preferences of the non-state-owned shareholders are different, which is going to have an impact on the original innovation strategy.
The prevailing research about the effect of mixed-ownership reform on enterprise innovation is mostly studied from the aspect of changes in enterprise ownership structure. The political view indicates that non-state-owned shareholders have a positive influence on the innovation activities of enterprises by diminishing political pressure [11,12] and over-investment [13]. According to the managerial view, non-state-owned shareholders release innovation resources by curtailing the rent-seeking motivation of the management [14]. However, simple equity consolidation cannot facilitate non-state shareholders to fully play their pertinent role. Compared with the state-owned major shareholders, the low shareholding ratio of non-state-owned shareholders makes their interests vulnerable to infringement of state-owned major shareholders. In the process of mixed-ownership reform, SOEs can assure their prestige in management decisions by the excessive appointment of directors of non-state-owned shareholders to give them certain control rights [15]. However, it is a pity that there is scarce research regarding the impact of reconfiguration of control rights inflicted by mixed-ownership reform on innovation activities, and the research on the economic consequences of mixed-ownership reform from the position of innovative strategy choices is still blank.
Despite the remarkable sustainable growth of research in the field of SOEs published in recent years, there are fruitful avenues for future research. Following these lines of thought, we used panel data of listed state-owned enterprises from 2013 to 2017 to seek the impact of the mixed-ownership reform on the innovation strategy choices of SOEs. The subtasks include (1) verifying whether the ownership of non-state shareholders and their appointed executives have an impact on innovation strategies, (2) verifying whether different types of non-state shareholders have different preferences of innovation strategies, (3) group tests to examine the distinction of the relationship between non-state shareholders and their preferred innovation strategy in different situations, and (4) exploring the approach with which non-state shareholders influence their preferred innovation strategy. The conceptual model is shown in Figure 1.

2. Theoretical Background and Hypothesis Development

2.1. Types and Implications of Innovation Strategies

March [3] finds that the search for new ideas, markets, or relations has less certain outcomes, longer time horizons, and more scatter effects than does further development of extant ones. For that reason, exploratory innovation and exploitative innovation are differing innovation strategies that result in fundamental organizational changes and progressive changes in enterprises [16], and their traits are different. Exploitative innovation, characterized by subtle changes in a technological trajectory, builds on the current technical competences and knowledge of enterprises, planes to meet the needs of prevailing customers, reduces the risk in new product evolution and advancement, and obtains a slightly short-term but consistent return on investment. Exploratory innovation radically changes the technological trajectory, relies on the new technical capabilities and knowledge of enterprises, and is organized to meet the needs of emerging markets and customers. It also pursues breakthrough changes to form long-term competitive advantages and brings excess returns to enterprises, but its investment activities have high assurance and have a long payback period [17,18]. Assessing from the features of the above two types of innovation strategies, exploratory innovation emphasizes progress of new products and opening up new markets. Its R&D risks and investment returns are substantially higher than those of exploitative innovation. As reported by Tang and Li [4], compared to NSOEs (non-state-owned enterprises), the absence of owners, the agency problem, and the quest of political performance of executives make SOEs fancy the exploitative innovation with short R&D cycles and low risk.

2.2. The Approach of Mixed-Ownership Reform

Since the reform and opening up, the reform of SOEs has been constantly encouraged. However, owing to the economic system and historical issues, the rational allocation of the ownership structure of SOEs cannot be realized by the supervision of the capital market, and the process of establishing a modern enterprise system is sluggish. The mixed-ownership reform has become the primary mode of optimizing the ownership structure of SOEs, and improves their operating proficiencies and marketization levels. At present, the mixed-ownership reform of SOEs is notably conducted through a two-way street. First, the change of the ownership structure of SOEs resulted in the perpetual introduction of non-state-owned shareholders in the process of mixed-ownership reform. It casts the diversity of mixed shareholders formed by the cross-shareholding of heterogeneous shareholders, as well as the depth of mixed equity structured by the increasing shareholding ratio of non-state-owned shareholders. The change in the ownership structure has brought heterogeneous resource elements and caused checks and balances on the state-owned major shareholders. Second, non-state-owned shareholders acquire certain control by appointing executives to SOEs, which has an impact on the operating decisions of enterprises and reduces the possibility of executives appointed by the government making decisions that deflect from the interests of the enterprises. Brickley et al. [19] investigate that shareholders of different properties have distinctions in the resource base, benefit function, and risk preference, etc. Therefore, the entry of heterogeneous shareholders into SOEs will surely bring different risk preferences and interest demands that influence the original innovation strategy choices of SOEs.

2.3. Hypothesis Development

(1) Diversity of mixed shareholders and innovative strategy choice
Shareholders with different properties in SOEs have their target priorities. For example, major state-owned shareholders place more emphasis on policy-related tasks and tend to prefer exploitative innovation that can obtain stable returns, while private and foreign shareholders pay more attention to their benefits and tend to prefer exploratory innovation that can obtain high returns [20]. Heterogeneous shareholders have stronger checks, balances, and regulatory causes in the decision-making process due to the differences in interest demands, risk preferences, and information costs. Bennedsen and Wolfenzon [21] highlight that, in the case of multiple shareholders of different properties in the enterprise, the supervisory stimulation of a single shareholder is stronger. In addition, most SOEs under the full control of the government carry out exploitative innovation based on the original products and markets to maintain the current operation situation, while the abundant subjects of property rights can reduce the government’s control over enterprises, make the heterogeneous shareholders reasonably allocate their resources in SOEs, and incline the resources toward the exploratory innovation in line with their interests.
Similarly, Ma et al. [22] examine the introduction equity of different properties of mixed-ownership reform of SOEs. They eventually developed a balance allocation for rights through a mutual game, which can bring resource elements for SOEs that are complicated to acquire through market competition but vital for the development of enterprises, as well as to realize conjoined consolidation and complementary advantages of resources. The integration of heterogeneous resources and production factors is beneficial to the formation of a trust mechanism for SOEs and the congruity of innovation capacity in the context of the market transmission mechanism of SOEs favored by investors in the external market. As a result, this increases the capital fountain of innovation investment, and the complementarity of technical knowledge and innovation environment makes for the fulfillment of innovation-driven development [23]. Luo et al. [24] explore how the entry of multiple heterogeneous shareholders brings different capital and resources to SOEs. SOEs used to access capital mainly through state-owned commercial banks, but now they can boost capital through seasoned new equity offerings or original financing approaches of non-state-owned shareholders, which broaden the financing channels of enterprises to a definite instant. The diversity of shareholders makes investors evaluate information in different ways; the entry of multiple shareholders reveals to investors the favorable news of policy support for SOEs, making exploratory innovation simpler for acquiring external investment. In the process of evolution of new products, exploratory innovation comprises core technology secrets that cannot be disclosed, and is more susceptible to external financing constraints. Therefore, the positive impact of the diversity of mixed shareholders on exploratory innovation investment is more obvious.
Regarding the aforementioned considerations, this paper presents the following hypothesis:
Hypothesis (H1).
Compared to exploitative innovation, the diversity of mixed shareholders is more efficacious in promoting investment in exploratory innovation.
(2) Depth of mixed equity and innovative strategy choice
Although the diversity of mixed shareholders will have an impact on the innovation strategy choices of SOEs, this effect will also vary to some extent due to the difference in the depth of mixed equity. Wu and Li [25] used the variable of new product sales to examine the degree of product innovation efforts of private enterprises and SOEs. They showed that a higher proportion of state-owned shares will harm product innovation due to the tight control of market expenditure and the regulation of government marketing behavior. Choi et al. [26] emphasize that, in comparison with state-owned shareholders, non-state-owned shareholders pay more observance to how enterprises procure stable and lasting competitive advantages which depend on their innovation proficiency. Both exploratory innovation and exploitative innovation need a maximum resource and capital input, along with a lot of input that ascertains the technological R&D and innovation capabilities of enterprises [27]. Exploratory innovation is especially about searching for new opportunities and possibilities by carrying out a radical and subversive study with a longer R&D cycle, and additional capital and more remarkable innovation ability are required; it is more favored by non-state-owned shareholders. Therefore, in the process of increasing the shareholding ratio of non-state-owned shareholders, the innovation strategy of SOEs has shifted from low-risk exploitative innovation to exploratory innovation that can shape the competitive advantages of enterprises. The shareholding ratio of non-state-owned shareholders depicts the capital that they provide for SOE; to a specific extent, it is comparable to equity financing by SOEs. According to classical financial theory, compared with debt financing, there is no pressure to repay principal and interest, and the financial risk of equity financing is low. Equity financing is suitable for enterprises to carry out a strategic investment with strong specificity, and provides financial support for exploratory innovation investment with greater capital demand. The more shares held by non-state-owned shareholders, the more equity financing the SOEs receive, which can bring more capital flow for exploratory innovation.
There has always been the problem of “one-share jumbo” in the SOEs. The highly centralized ownership structure offers realistic soil for the tunneling behavior of the large state-owned shareholders. Porta et al. [28] notice that under the condition of inadequate external governance mechanisms, the high concentration of equity in enterprises monitored by the state or family makes the rights of ultimate controlling shareholders far exceed their cash flow rights, which is likely to violate the interests of middle–small shareholders. Li et al. [29] apply related party transactions to measure the capital occupation degree of major shareholders and examine the influence of ownership structure on the tunneling behavior of major shareholders. The results reveal that the capital occupation degree of controlling shareholders is extensively negatively correlated with the shareholding ratio of other shareholders. The non-state-owned shareholders introduced by the SOEs can restrict the tunneling behavior and restrain the private benefit of the state-owned major shareholders through strict supervision, and decentralized ownership structure can decrease the cost of the supervision of the other shareholders [30], which avoids the wasting of resources, improves the risk-taking abilities of SOEs, and makes non-state-owned shareholders increase the capital investment in innovation projects that are conducive to long-term value improvement of enterprises. The increase in the proportion of shares held by non-state-owned shareholders in SOEs has gradually improved their shareholding structures, which can balance the interests of state-owned and non-state-owned shareholders in making investment decisions and can reflect the demands of non-state-owned shareholders in innovation strategies. Non-state-owned shareholders have a higher excitement for the development and implementation of new products. At the same time, they have granted sufficient capital for enterprises by soothing financing constraints and reducing type II agency costs, which has made the development of exploratory innovation possible.
In reliance on the above analysis, this paper suggests the following hypothesis:
Hypothesis (H2).
Compared with exploitative innovation, the depth of mixed equity is more effective in promoting investment in exploratory innovation.
(3) Control of mixed equity and innovation strategy choice
External social shareholders enter the SOEs and achieve their interests by appointing directors to participate in the corporate decisions of the board of directors and compete with the management for control, thus influencing the innovation strategies of the SOEs. The absence of an owner in SOEs may lead to the occurrence of “eager expression” or “inaction” in pursuing political promotion and avoiding operating risks that would weaken the abilities of the enterprises to capture investment opportunities [31], so that they can only conduct exploitative innovation in the existing market and products. However, SOEs have an easier approach to securing resources related to innovation activities under the support of government policies; Li and Liu [32] review how executives of SOEs primarily concentrate on political promotion and job treatment because of their fixed salaries. According to the championship theory of political promotion, when SOEs pledge policy tasks, executives may not use the capital for innovation activities with goals of policy objectives and are more likely to invest in projects conducive to the improvement of short-term performance. Furthermore, executives of SOEs who invest in innovation projects need to tolerate the risk of innovation failure. Enterprises may reassess whether to continue to employ executives because of innovation failure that leads to executives’ dislike of innovation risk for their inherent position and their reputation [33]. The technology research and development executed by innovation activities has a high uncertainty and cannot be observed. The absence of actual controllers in SOEs leads to serious information asymmetry between executives and shareholders, which motivates executives to manipulate R&D investment. Richardson [34] analyzes how executives are not the main beneficiaries of innovative activities that need long-term management. They can only obtain a small amount of income according to regulations, which causes the managers to spend little energy on exploratory innovation that needs to break through the basic technology, and prefer to invest in exploitative innovation with mature technology.
In the process of mixed-ownership reform, non-state-owned shareholders have an incentive to appoint directors to SOEs for their interests, so that the existence of directors on the board representing state-owned and non-state-owned interests reduces the inaction of original directors, improves the effectiveness of the board of directors, and facilitates the investment of innovation activities [35]. The directors appointed by non-state-owned shareholders to SOEs also serve in NSOEs (other shareholder units). The research of Zhou and Xue [36] showed that the directors who serve in other shareholder units represent the interests of the shareholder units, will actively exercise the right to supervise and control the general manager, promote the effective communication between the general manager and shareholder units as well as make shareholder units obtain enough information to judge whether the innovation decision is scientific, reduce the short-sighted behavior of original managers, and increase the exploration innovation investment for bringing long-term benefits. Moreover, Choi, Lee, and Williams [26] investigate how employees of NSOEs are more sensitive to market demands and tend to establish long-term and stable cooperative relations with enterprises through technology research and development. Executives appointed by non-state shareholders can better identify exploratory innovation opportunities through a keen sense of market demand. Meanwhile, non-state-owned shareholders have appointed executives to enter SOEs, making them turn into the enforcers of innovation activities that make non-state-owned shareholders more aware of the relevant information of innovation projects in order to reduce the degree of information asymmetry and to better understand the commitment of executives of SOEs to innovation activities, reduce the possibility of executives being dismissed due to innovation failure, and improve the executives’ motivation for exploratory innovation. With the enhancement of the control of mixed equity, the supervision function of managers appointed by non-state-owned shareholders is strengthened, which reduces the risk of original managers in SOEs in conducting adverse selection, alleviates the type I agency problem, and provides a guarantee for exploratory innovation investment.
In reliance on the above analysis, this paper proposes the following hypothesis:
Hypothesis (H3).
Compared with exploitative innovation, the control of mixed equity is more effective in promoting investment in exploratory innovation.

3. Materials and Methods

3.1. Sample Selection and Data Sources

With the proposal of the Third Plenary Session of the eighteen in 2013 to actively develop the mixed-ownership economy, the phenomenon of SOEs introducing non-state-owned strategic investors has begun to appear. In addition, the information disclosure of R&D investment and property ownership of listed state-owned enterprises has become more sophisticated, which provides an appropriate starting point for research and a reliable data source for this article. Therefore, this paper uses panel data of listed state-owned enterprises from 2013 to 2017 as the research sample. Due to the lag of the influence of the change of non-state-owned shareholders’ equity and control rights on the innovation decision, the empirical test is conducted on the R&D expenditure of the first-phase lagging, that is, the research deadline is 2018. According to the needs of the research questions, the samples are processed as follows: (1) Excluding ST, *ST, and financial industry samples (ST refers to the stocks that are specially treated by Chinese listed companies, and it is also a warning of delisting risk); (2) excluding data anomaly (asset–liability ratio greater than 1) samples; (3) excluding samples with missing main variables; (4) excluding samples that cannot be determined from the database, the annual report, or the enterprises’ website, leading ultimately to 4550 observations.
The collection steps of the basic data of mixed-ownership reform are as follows: First, obtain the names and shareholding ratios of the top ten shareholders of the listed state-owned enterprises from the WIND database. Secondly, download the annual reports of the corresponding SOEs from the WIND database and make a preliminary identification of the properties of the top ten shareholders according to the enterprise’s name and the properties of the shareholders disclosed in the annual report. Finally, for shareholders whose properties cannot be determined, they will be supplemented by manual capture of the ultimate controller of the shareholders through Tianyancha. Moreover, industry classification was derived from the WIND database. The data of other variables were derived from the CSMAR database. To avoid the influence of extreme values on the research results, this paper performed 1% up-and-down winsorization on all continuous variables.

3.2. Model Construction and Variable Definition

Based on the practice of Bi et al. [37] and Sun and Zhang [10], this paper constructs the following regression model to be tested:
I N N O V i , t + 1 = α 0 + α 1 M I X i , t + α 2 S I Z E i , t + α 3 L E V i , t + α 4 G R O W T H i , t + α 5 R O A i , t + α 6 C F i , t + α 7 B O A R D i , t + α 8 I N D E P i , t + α 9 D U A L i , t + α 10 A G E i , t + α 11 Y E A R + α 12 I N D U S T R Y + ε i , t
The explained variable INNOV is a measure of the innovation strategy of the enterprise. The division of intangible assets in the “Accounting Standards for Business Enterprises No. 6—Intangible Assets”, issued by the Ministry of Finance in 2006, divides the R&D investment of enterprises into two stages of research and development. The research and development expenditures in the research phase are expensed, and the expenditures in the development phase are capitalized. Exploratory innovation is mainly to carry out basic research and development to generate disruptive changes. The investment in the research phase is riskier and more uncertain than that in the development phase, which is more inclined to exploratory expenditure. Meanwhile, this measurement method can eliminate the drawback of the questionnaire being too subjective. Therefore, this paper draws on the research of Tang and Xiao [38] and Bi, Zhai, and Jiang [37], using the expense of R&D investment to measure exploratory innovation (R) and capitalization expenditure to measure exploitative innovation (D). To eliminate the impact of the enterprises’ scale, the two-stage R&D investments are standardized by the total assets at the beginning of the fiscal year and the operating income of the last year in the main regression and robustness tests.
The explanatory variable MIX is the degree of mixed-ownership reform of SOEs, which is mainly measured from the changes of ownership structure and the allocation of control rights. This paper measures different ways and degrees of mixed-ownership reform of SOEs through the types of the heterogeneous shareholders of the top ten shareholders, the shareholding ratio, and the proportion of executives appointed by non-state-owned shareholders in SOEs. For the properties of heterogeneous shareholders of SOEs, this paper relies on the research of Porta, Lopez-De-Silanes, and Shleifer [28], Hao and Gong [39], and Yang and Yin [40] to classify the properties of shareholders into state-owned (SOE), private (PRIVATE), foreign (FOREIGN), a natural person (NATURE), institutional investor (INSTITUTION), and others (OTHERS). The reason is that because the number of other shareholders and the shareholding ratio are very small, they are not the research objects of this article; the specific classification is shown in Table 1.
The diversity of mixed shareholders ( M I X S ) is defined as the types of heterogeneous shareholders included in the top ten shareholders according to the practice of Ma, Wang, and Zhang [22]. If only one kind of shareholder is involved in the enterprise, the value of M I X S is 1; the value of two kinds is 2. By similarity, there can be at most five types of shareholders, where the value of M I X S is 5. Broadly, the larger the value of M I X S is, the more types of heterogeneous shareholders are entering the SOEs and the higher the degree of mixed-ownership reform is. Depth of mixed equity ( M I X O ) is defined as the sum of the four non-state-owned shareholding ratios of private, foreign, and natural persons as well as institutional investors among the top ten shareholders. The higher the shareholding ratio of non-state-owned shareholders is, the more the heterogeneous ownership structure can play a function, and the degree of mixed-ownership reform of SOEs may be higher. Control of mixed equity ( M I X _ D J G ), referring to the research of Wei et al. [41] and Cai et al. [42], is defined as the proportion of directors, supervisors, and executives appointed by non-state-owned shareholders in the top ten shareholders. Overall, the higher the proportion of directors, supervisors, and executives appointed, the greater the discourse rights of non-state shareholders and the stronger the supervisory role played. In addition, concerning the research of Lu and Jiang [20], this paper also computes the total shareholding ratio of each type of non-state-owned shareholder among the top ten shareholders and analyzes the differences in the innovation strategy choices of SOEs by the entry of each type of shareholder.
Based on the relevant research, this paper selects the company size ( S I Z E ), leverage ( L E V ), growth ( G R O W T H ) and profitability ( R O A ), free cash flow ( C F ), the scale of the board ( B O A R D ), the proportion of independent directors ( I N D E P ), duality ( D U A L ), and age of listed companies ( A G E ) as control variables, and, at the same time, sets the date ( Y E A R ) and industry ( I N D U S T R Y ) as virtual variables. The definitions and description of the variables are shown in Table 2:

4. Results

4.1. Descriptive Statistics and Correlation Analysis

Table 3 reports the descriptive statistics and correlation analysis of the main variables in this paper. Based on the relevant indicators of innovation strategy choice, the ratio of exploratory innovation investment to total assets (R1) is 1.148%, and the proportion of exploitative innovation to total assets (D1) is 0.120%. It can be seen that the preference of the innovation strategy in SOEs is quite different. From the perspective of standard deviation, the investment in innovation activities among SOEs is quite different, which indicates that the strength of innovation activities of SOEs is uneven. The mean value of diversity of mixed shareholders (MIXS) is 2.918, indicating that there are three kinds of heterogeneous shareholders on average in SOEs. The mean value of depth of mixed equity (MIXO) is 11.4% and the standard deviation is 10.6%, which signifies that the non-state-owned shareholders introduced by the mixed-ownership reform have a relatively low shareholding ratio and the problem of “one-share jumbo” still exists. The mean value of control of mixed equity (MIX_DJG) is 2.1% and the standard deviation is 5.7%, which notes that the proportion of executives appointed by non-state-owned shareholders is generally lower than that of the shareholding ratio of non-state-owned shareholders and the control rights of non-state-owned shareholders are not equal to their shareholding.
From the correlation coefficients between the main variables, the diversity of mixed shareholders (MIXS) is positively correlated with exploratory innovation investment (R1) and exploitative innovation investment (D1), but not significantly. Depth of mixed equity (MIXO) and control of mixed equity (MIX_DJG) are positively correlated with exploratory innovation investment (R1) and exploitative innovation investment (D1). As the correlation coefficient between the variables is less than 0.6, there is no multicollinearity in the model (1). This test only supports that the change of ownership structure and the allocation of control rights of SOEs have an impact on the investment of the two innovation strategies. However, the innovation strategy that SOEs prefer after the reform needs further verification.

4.2. Basic Regression Results of Mixed-Ownership Reform and Innovation Strategy Choices of SOEs

Table 4 shows the regression results of the influence of different mixed-ownership reform approaches on innovation strategies. According to the research results, the investment levels of mixed-ownership reforms of innovation strategies are different. The regression coefficient of the diversity of mixed shareholders (MIXS) and exploratory innovation (R1) is 0.074, which is significantly positively correlated at the level of 1%, and the regression coefficient with exploitative innovation (D1) is 0.0001 and is not significant, denoting that the more types of heterogeneous shareholders are introduced by mixed-ownership reforms of SOEs, the stronger the promotion effect on exploratory innovation, but there is no substantial influence on exploitative innovation. The regression coefficient of the depth of mixed equity (MIXO) and exploratory innovation (R1) is 0.476, which is significantly positively correlated at the level of 5%, and the regression coefficient with exploitative innovation (D1) is 0.028 and is not significant, representing that the higher the shareholding ratio of non-state-owned shareholders is, the more likely the SOEs are to carry out exploratory innovation. Control of mixed equity (MIX_DJG) is significantly positively correlated with exploratory innovation (R1) and exploitative innovation (D1) at the level of 1%, indicating that the executives appointed by non-state-owned shareholders have a positive impact on the investment of both innovation strategies, but have a stronger promotion effect on exploratory innovation.
The results show that the change of ownership structure caused by the mixed-ownership reform of SOEs can promote the investment in exploratory innovation, which is consistent with the assumptions. The control rights formed by non-state-owned shareholders through appointing executives in SOEs promote the exploratory and exploitative innovation investment simultaneously. This may be because equity diversification is only the initial stage of mixed-ownership reform of SOEs. At this time, non-state-owned shareholders tend to adopt more radical innovation strategies to obtain long-term benefits and accelerate the marketization process of SOEs. When the executives appointed by the non-state-owned shareholders enter the SOEs, the non-state-owned shareholders have higher discourse and decision-making rights. The existence of heterogeneous executives improves the ability of managers, which makes them have a stronger autonomy in the innovation strategy choice. Based on improving the investment in exploratory innovation, appropriate exploitative innovation should be carried out to balance the two innovation strategies, such that to reduce the risks faced by the SOEs and assemble the SOEs, more stable and long-term development is obtained.
In the regression of panel data, it is necessary to consider whether the model is suffering from heteroscedasticity, serial correlation, and section-correlation dependence. For the sake of averting these three aspects, the main regression was conducted with Driscoll–Kraay standard errors. Table 5 shows the estimated results, which are the same as above.

4.3. Basic Regression Results of Heterogeneous Shareholder Holdings and the Innovation Strategy Choices of SOEs

Table 6 further examines the impact of heterogeneous shareholdings on innovation strategies of SOEs. Columns (1)–(2) show that the relationships between private shareholding ratio and exploratory innovation investment or exploitative innovation investment are not significant. The main reason is that the mean value of private shareholding is only 2.8% and the median is 0, which means that the ownership and discourse rights of private shareholders in most SOEs are not up to their expectations, and they are unable to conduct effective checks and balances on state-owned shareholders; there is also a lack of motivation to supervise executives, thus failing to make a substantial impact on the innovative strategy choices of SOEs. Columns (3)–(4) clarify that the shareholding ratio of foreign shareholders is significantly positively correlated with the exploratory innovation investment and is not related to exploitative innovation, mainly because foreign shareholders are more effective than domestic shareholders in the process of market transformation [43]. The entry of foreign shareholders has injected implicit ability and knowledge into the enterprise, which has brought rich management experience and can effectively supervise state-owned shareholders and management. At the same time, foreign shareholders pay more attention to the competitive advantage of the enterprise and tend to carry out subversive exploratory innovation to enhance the core competitiveness of the SOEs. Columns (5)–(6) demonstrate that the shareholding ratio of natural person shareholders is significantly positively correlated with exploratory innovation investment and it is not related to exploitative innovation, which showed that the higher the shareholding ratio of natural person shareholders is, the stronger the role of promoting the exploratory innovation will be. Unlike other minority shareholders, natural persons as the top ten shareholders enter the SOEs not to obtain short-term benefits, but to exercise their rights as the owners of the SOEs and fully play to the role of shareholder; they choose innovation strategies that can promote the long-term development of the enterprises. Columns (7)–(8) manifest that the shareholding ratio of institutional investors is significantly positively correlated with exploratory innovation and exploitative innovation. The stronger correlation with exploitative innovation indicates that institutional investors are mostly involved in SOEs to obtain high price differences and look for opportunities to withdraw in a timely manner. Therefore, they are more inclined to exploit innovations that can quickly obtain revenues. However, the external institutional investors have a relatively high proportion of shares in SOEs, which reduces the opportunistic behavior of managers, makes enterprises have more abundant cash flow, and indirectly promotes exploratory innovation with large capital demand.

4.4. Basic Regression Results of the Moderation Effect of Administrative Levels and Industry Competition

The output of the earlier study reveals that the mixed-ownership reform of SOEs has a significant role in promoting the exploratory innovation investment in both the equity and the control dimensions, and only has a positive impact on the exploitative innovation investment in the control dimension. Therefore, this paper further explores the impact of the degree of mixed-ownership reform of SOEs on exploratory innovation investment.

4.4.1. The Moderation Effect of Administrative Levels

Because SOEs are controlled by different levels of government, their operating decisions will naturally be affected by the administrative power of governments at all levels. Central SOEs have more advantages in resource allocation, professional knowledge, talent reserves, etc. [44,45]. Once heterogeneous shareholders reach a consensus, they can quickly identify opportunities for innovation, provide timely capital for innovation activities, and reduce the likelihood of failures in innovation activities. In addition, under the policy guidance of the state, compared with local SOEs, the mixed-ownership reform generally starts from large-scale central enterprises, takes the lead in introducing diversified non-state-owned strategic investors, and the implementation of the reform is even deeper. For example, in the process of implementing mixed-ownership reform, China Unicom has introduced complementary strategic investors, formed a governance structure of mutual checks and balances by appointing directors which can better integrate and optimize heterogeneous resources and make full use of the advantages of heterogeneous shareholders [15], and improved the enthusiasm of non-state shareholders to participate in decision-making. In summary, from the perspective of ability and willingness, it can be seen that mixed-ownership reform has a stronger role in promoting exploratory innovation investment in central SOEs.
For the judgment of the administrative levels of SOEs, referring to the research of Xia and Fang [46], this paper divides SOEs into central and local controlled enterprises according to the type of ultimate controller. When the ultimate controller of an SOE is the central government, SASAC, Ministry of Finance, or another institution, it is defined as a central SOE (NATURE), with a value of 1; otherwise, it is defined as a local SOE, with a value of 0. Table 7 further reports the group regression results of the impact of administrative level on the relationship between mixed-ownership reform and exploratory innovation. In central SOEs, the diversity of mixed shareholders, the depth of mixed equity, and exploratory innovation investment are significantly positively correlated at the level of 1%, but not significantly in local SOEs. The control of mixed equity and exploratory innovation are significantly positively correlated at the level of 1% in both central and local SOEs, and the correlation is stronger in central SOEs. According to the group spacing test, the degree of influence of control of mixed equity on exploratory innovation investment is significantly different among SOEs at different levels, but the positive driving effect has always existed.

4.4.2. The Moderation Effect of Industry Competition

The motivation of non-state-owned shareholders and their appointed executives to participate in the operating decision of SOEs is affected by the industry competition. An important feature of monopoly SOEs controlled by the government is the high barrier to entry. The cost and difficulty of equity participation for non-state-owned shareholders are relatively high and their willingness for equity participation is relatively low. It is also difficult for non-state-owned shareholders and their appointed executives to play a role in monopoly SOEs, and they cannot form an effective check and balance for state-owned shareholders. In addition, non-state-owned shareholders enter the monopoly SOEs mainly to obtain monopoly resources and to share their monopoly income, and will not spend energy on high-risk innovation projects if the existing income has reached expectations. The SOEs in the competitive industry face more intense competitive pressure [42]. For their interests, non-state-owned shareholders mainly focus on fundamental innovation activities to obtain a competitive advantage. To gain a place in the industry competition, non-state-owned shareholders will strictly supervise managers to prevent damage to their interests. In summary, mixed-ownership reform has a stronger role in promoting exploratory innovation investment in SOEs of the competitive industry.
For the judgment of industry competition, this paper draws on the practice of Yue et al. [47], who define the petroleum and natural gas exploitation industry, tobacco product industry, petroleum processing and coking industry, nuclear fuel processing industry, electricity, gas, and water production and supply industry, railway, water, and air transport industry, postal industry, and telecom and other information transmission service industry as monopoly industries (IC), with a value of 1. Other industries are defined as a competitive industries, with a value of 0. Table 8 further reports the group regression results of the impact of industry competition on the relationship between mixed-ownership reform and exploratory innovation. The results show that the diversity of mixed shareholders (MIXS), the depth of mixed equity (MIXO), and the control of mixed equity (MIX_DJG) are significantly positively correlated with exploratory innovation in SOEs in competitive industries, but are not relevant in SOEs in monopoly industries. The results are consistent with the above inference.

4.5. Endogenous Test

The entry of non-state-owned shareholders will have an impact on the innovation strategy choice. On the contrary, the investment levels of different innovation strategies of SOEs may also attract the entry of potential non-state-owned shareholders. Therefore, there may be a reverse causal relationship. In this paper, the diversity of mixed shareholders, the depth of mixed equity, and the control of mixed equity with a lag period are adopted as their respective instrumental variables, and the two stage least square(2SLS) method is used for regression to alleviate endogenous problems. Exogenous variables have passed the relevant weak instrumental variable test. Table 9 shows the regression results of the two stages, which further confirm that the improvement of the diversity of mixed shareholders, the depth of mixed equity, and the control of mixed equity can all promote exploratory innovation investment.

4.6. Other Robustness Test

In this paper, three measures of robustness testing were adopted, namely a replacement measurement index of innovation strategy, replacement measurement index of mixed-ownership reform degree of SOEs, and change in sample size, to ensure the robustness of the results.

4.6.1. Replacement Measurement Index of Innovation Strategy

Regarding the research of Li [5] and Sun and Zhang [10], this paper standardized the innovation investments of different types with the operating incomes of the previous period and conducted the replacement test. As shown in Table 10, the diversity of mixed shareholders (MIXS) and the depth of mixed equity (MIXO) are significantly positively correlated with exploratory innovation investment (R2), but not with exploitative innovation investment (D2). The control of mixed equity (MIX_DJG) has a significant positive correlation with exploratory innovation investment (R2) and exploitative innovation investment (D2), and the results are consistent with the above.

4.6.2. Replacement Measurement Index of Mixed-Ownership Reform Degree of SOEs

According to the research of Chen and Sun [48] and Wang and Sun [49], the diversity of mixed shareholders ( M I X S _ 1 ) is measured by the Herfindal index of the shareholder category ( H H I = 1 P i 2 , P i represents the proportion of the class i shareholders in the top ten shareholders), the depth of mixed equity ( M I X O _ 1 ) is measured by the entropy index (E I = Q j × ln ( 1 / Q j ) , Q j represents the proportion of shares held by class j shareholders in the total number of shares held by the top ten shareholders), and the control of mixed equity ( D U M _ D J G ) is measured by whether the non-state-owned shareholders appoint directors, supervisors, and executives in the SOEs (dummy variable, if the non-state-owned shareholders of the top ten shareholders appoint the directors, supervisors, and executives, take 1, otherwise take 0). As shown in Table 11, the diversity of mixed shareholders ( M I X S _ 1 ) and the control of mixed equity ( D U M _ D J G ) are significantly positively correlated with exploratory innovation ( R 1 ), not with exploitative innovation ( D 1 ), but the depth of mixed equity ( M I X O _ 1 ) is significantly positively correlated with both exploratory innovation and exploitative innovation and is more correlated with exploratory innovation; it may be that when non-state-owned shareholders are fully integrated, the innovation ability of enterprises will be improved, and enterprises tend to adopt the innovation strategy of seeking improvement in stability and carry out disruptive innovation based on ensuring the steady development of SOEs. The results are slightly different from the previous one, but are stable.

4.6.3. Robustness with the Modified Sample Size

According to the research of Yang and Yin [40], the SOEs in which the total shareholding ratio of the top ten shareholders is less than 50% are deleted to avoid the sample selection bias caused by the adoption of the properties of the top ten shareholders of listed state-owned companies to construct the indicators of mixed-ownership reform degrees of the SOEs. The regression results are shown in Table 12. The diversity of mixed shareholders (MIXS), the depth of mixed equity (MIXO), and the control of mixed equity (MIX_DJG) are significantly positively correlated with exploratory innovation (R1), not with exploitative innovation (D1), and the results are consistent with the above.

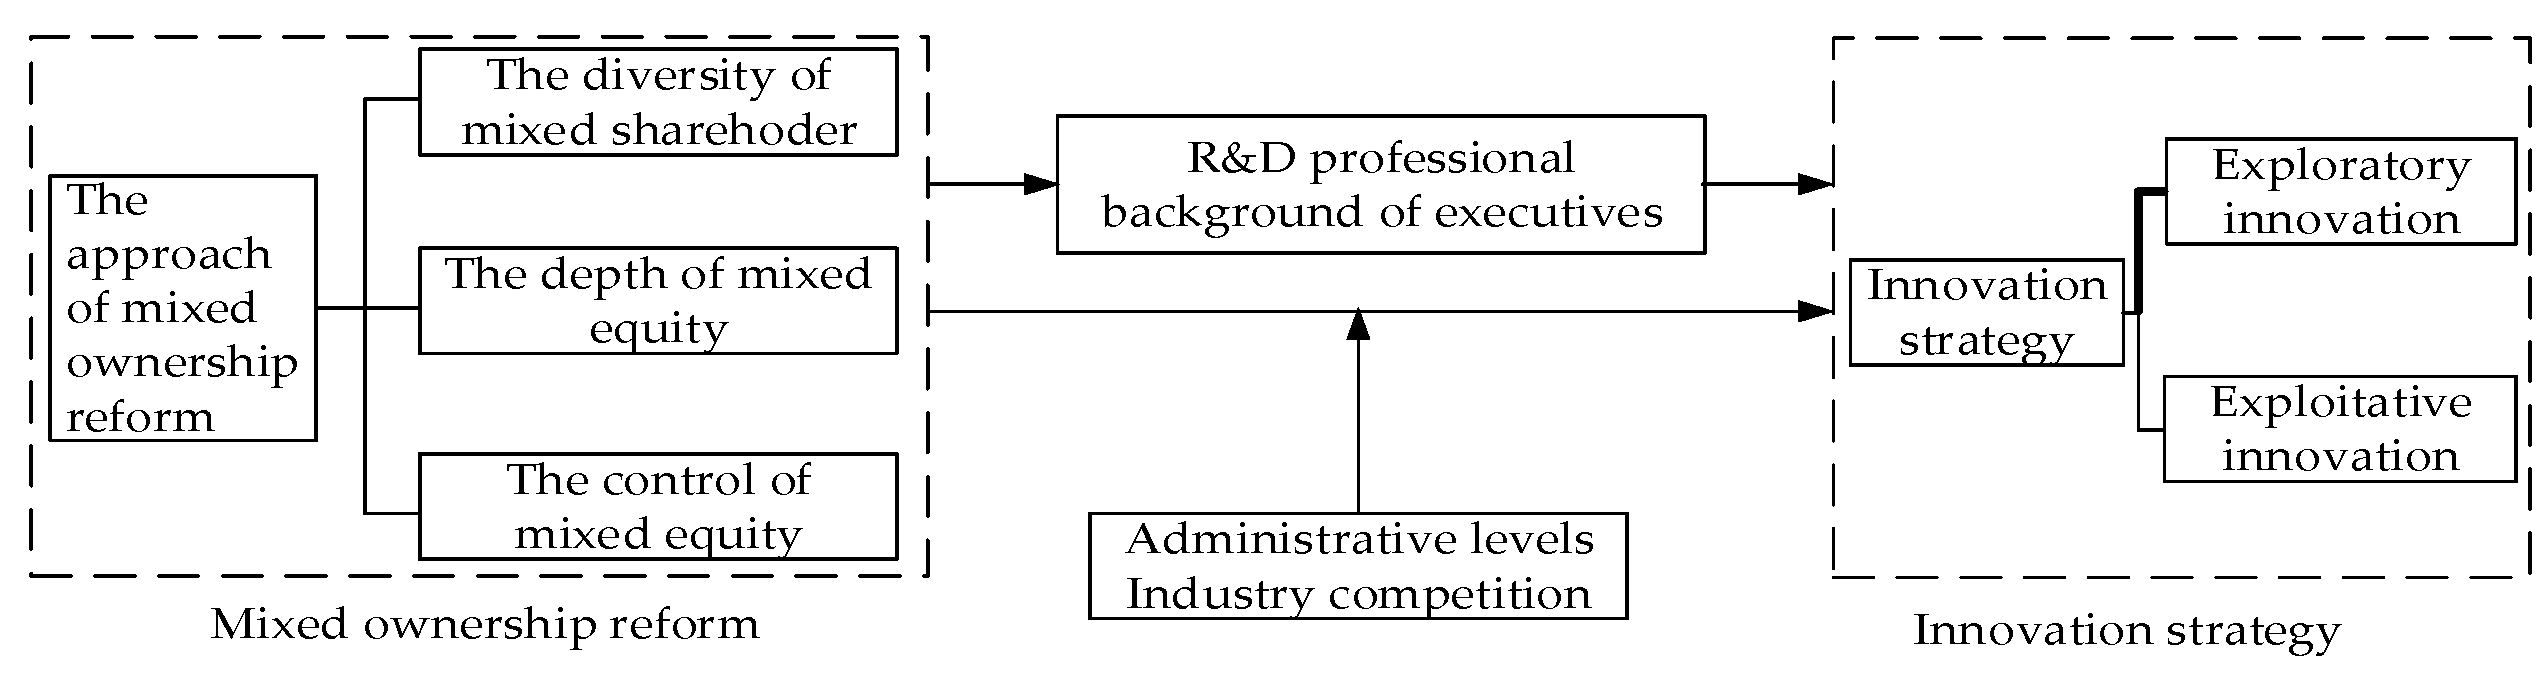
5. Further Analysis: Mechanism Analysis of the Impact of Mixed-Ownership Reform on the Innovation Strategies of SOEs

In the process of mixed-ownership reform of SOEs, the entry of non-state-owned shareholders led to the continuous implementation of the professional manager mechanism, and more executives have entered the SOEs through the market selection and recruitment mechanism. The Outline of the National Medium- and Long-Term Talent Development Plan (2010–2020) reminds that the selection and recruitment of professional executives by SOEs requires the establishment of qualification evaluation standards, such as professional quality and ability, professional knowledge and skills, and professional history and experience. As a solid force for SOEs to make innovation decisions, the R&D professional background of executives is an important factor affecting their decisions [50]. When the board of directors employs the executives in a market-oriented approach, they tend to introduce the executives with a professional R&D background into the SOEs. On the other hand, the executives appointed by non-state-owned shareholders to SOEs represent their interests and have discourse rights on the innovation strategy choices of SOEs. To give full play to the role of executives in the decision-making process, non-state-owned shareholders also tend to appoint executives with professional R&D backgrounds to protect their interests. As a result, mixed-ownership reform has increased the number of executives with professional R&D backgrounds in SOEs. Han et al. [51] highlight that executives with professional R&D backgrounds are more likely to exert an innovative spirit and accurately grasp the market demand. Executives with professional R&D backgrounds in SOEs can use their own professional experience to effectively judge internal scientific innovation decisions, improve the probability of success of R&D activities, reduce the uncertainty of exploratory innovation, and increase its investment level to enhance the competitiveness of SOEs.
Through the main regression test results shown in Table 4, it can be seen that compared with exploitative innovation, the mixed-ownership reform of SOEs pays more attention to the development of exploratory innovation. To further explore whether mixed-ownership reform has an impact on exploratory innovation investment through the professional backgrounds of executives in SOEs, this paper conducts a mediation effect test by referring to the research of Baron and Kenny [52].
D G J _ R D i , t = β 0 + β 1 M I X i , t + β 2 S I Z E i , t + β 3 L E V i , t + β 4 G R O W T H i , t + β 5 R O A i , t + β 6 C F i , t + β 7 B O A R D i , t + β 8 I N D E P i , t + β 9 D U A L i , t + β 10 A G E i , t + β 11 Y E A R + β 12 I N D U S T R Y + ε i , t
R 1 i , t + 1 = γ 0 + γ 1 M I X i , t + γ 2 D G J _ R D i , t + γ 3 S I Z E i , t + γ 4 L E V i , t + γ 5 G R O W T H i , t   + γ 6 R O A i , t + γ 7 C F i , t + γ 8 B O A R D i , t + γ 9 I N D E P i , t + γ 10 D U A L i , t   + γ 11 A G E i , t + γ 12 Y E A R + γ 13 I N D U S T R Y   + ε i , t
The mediation variable DJG_RD is a measure of the professional R&D backgrounds of executives, which is measured by the ratio of the number of directors, supervisors, and executives with professional R&D backgrounds to the total number of directors, supervisors, and executives in the SOEs. Among them, the mediation variable data were obtained through the professional background information of the executives in the CSMAR database.
Table 13 shows the mediation effect test results of the professional R&D backgrounds of executives. Columns (1), (4), and (7) are the regression results of Formula (1). The diversity of mixed shareholders, the depth of mixed equity, and the control of mixed equity are positively correlated with exploratory innovation investment, and the regression coefficients are 0.074, 0.478, and 2.313. Columns (2), (5), and (8) are the regression results of Formula (2). The diversity of mixed shareholders, the depth of mixed equity, and the control of mixed equity are positively correlated with the proportion of directors, supervisors, and executives with professional R&D backgrounds. Columns (3), (6), and (9) are the regression results of Formula (3). After adding the mediation variables, the influence of the diversity of mixed shareholders, the depth of mixed equity, and the control of mixed equity on exploratory innovation investment is still significant, with coefficients of 0.064, 0.381, and 1.905; compared with the three coefficients of Formula (1), they are all reduced. The above results manifest that the proportion of directors, supervisors, and executives with professional R&D backgrounds has passed partial mediation effect tests, which further explains that the changes of ownership structure and the allocation of control rights caused by the mixed-ownership reform ultimately have an impact on the exploratory innovation investment through the increase of the proportion of directors, supervisors, and executives with professional R&D backgrounds.

6. Conclusions

Based on the heterogeneity of R&D expenditure, this paper explores the impact of mixed-ownership reform on the innovation strategy choices of SOEs and its mechanism from the two aspects of ownership structure adjustment and control right allocation. The main research conclusions are as follows: (1) Mixed ownership reform can indeed influence the innovation strategy choice, which is reflected in the fact that such reform can promote the increase of exploratory innovation investment and sustainability. Among them, only the improvement of the control of mixed equity can promote exploitative innovation, which indicates that the SOEs undergoing mixed-ownership reform are more inclined towards exploratory innovation. Although the control of mixed equity that goes deep into the control level has different degrees of impact on the two innovation strategies of SOEs, it has a promotion effect on both and has a more pronounced governance effect on the improvement of the overall innovation ability and sustainability of the operations of SOEs. (2) The shareholding ratio of heterogeneous shareholders has a different influence on the innovation strategy choice. The increase of the shareholding ratio of foreign shareholders, natural person shareholders, and institutional investors can improve the level of exploratory innovation investment of SOEs, and institutional investors who aim to obtain the price difference can also significantly promote the exploitative innovation investment, while private shareholders who fail to achieve the expected shareholding level have no impact on the innovation strategy choice. (3) The mixed-ownership reform plays a stronger role in promoting the exploratory innovation investment in SOEs controlled by the central government or in competitive industries, which illustrates that in different circumstances, the roles of non-state-owned shareholders and their appointed executives in the decision-making of enterprises have significant distinctions. (4) To a large extent, the promotion effect of mixed-ownership reform on exploratory innovation investment is realized through the increase of the proportion of executives with professional R&D backgrounds in SOEs, which shows that the professional backgrounds of executives are also an important path to influencing innovation decisions.
Based on the above study findings, we suggest the following policy recommendations for improving the independent innovation abilities and accelerating the marketization processes of SOEs: First, the SOEs should broaden the participation levels of non-state-owned shareholders and give full play to their governance roles. The research results of this paper clarify that the shareholding levels of private shareholders have not reached their expectations at this stage, which makes them lack the motivation to supervise the state-owned shareholders and the impetus to participate in operating decisions. This shows that the mixed-ownership reform of SOEs cannot merely introduce diversified shareholders, but should also pay more attention to increasing the depth of shareholder shareholding, give full play to the market initiatives of non-state shareholders, promote SOEs to improve their governance systems, and optimize existing decision-making mechanisms. Second, the mixed-ownership reform should be deepened to the level of control rights, giving non-state-owned shareholders the right to be the owners of SOEs. Non-state-owned shareholders can appoint executives to SOEs, which can input mature management experience and technical knowledge to the enterprises, ensure that non-state-owned shareholders have a certain degree of control, stimulate the entrepreneurship of executives and promote them to formulate innovative scientific strategies to cope with market competition, and improve the operating efficiency and sustainability of SOEs. Third, we will strengthen the mixed-ownership reform of local SOEs and promote the classified reform of SOEs. The above research results show that the change of ownership structure of local SOEs has no impact on the exploratory innovation investment, which indicates that local SOEs are greatly interfered with by the government and that the intensity of mixed-ownership reform is relatively small, so it is necessary to promote mixed-ownership reform of local SOEs to cultivate market subjects and, at the same time, keep opening government regulations such as industry access, fully develop the competitive business of monopoly industries, and stimulate the innovation vitality of SOEs.

Author Contributions

R.Y., X.S., and C.L. conceived and designed the experiment; K.P. compiled the data; M.A.K. and X.S. analyzed the data and contributed analysis tools; R.Y., K.P., and X.S. wrote the paper. All authors have read and agreed to the published version of the manuscript.

Funding

This research is funded by the major project of Education Department of Hebei Province: “Research on the path selection and countermeasures for accelerating the transformation and upgrading of state-owned enterprises in Hebei province” (ZD201904).

Conflicts of Interest

The authors declare no conflict of interest.

References

  1. Solow, R.M. Technical change and the aggregate production function. Rev. Econ. Stat. 1957, 39, 312–320. [Google Scholar] [CrossRef] [Green Version]
  2. Cadil, J.; Mirosnik, K.; Petkovova, L.; Mirvald, M. Public Support of Private R&D–Effects on Economic Sustainability. Sustainability 2018, 10, 4612. [Google Scholar] [CrossRef] [Green Version]
  3. March, J.G. Exploration and exploitation in organizational learning. Organ. Sci. 1991, 2, 71–87. [Google Scholar] [CrossRef]
  4. Tang, Q.Q.; Li, H.W. The choice of innovation mode of Chinese enterprises-based on the perspective of corporate governance. Contemp. Econ. Manag. 2011, 33, 23–31. [Google Scholar]
  5. Li, Y.H. Corporate governance and heterogeneous R&D innovation of enterprises-An empirical study based on GEM listed companies of strategic emerging industries. Secur. Mark. Her. 2014, 26–31. [Google Scholar]
  6. Wang, Y.X.; Sun, Y.Y. The impact of corporate governance on innovation strategy-An empirical study based on R&D expenditure heterogeneity. Res Financ. Econ. Issues 2018, 5, 113–121. [Google Scholar]
  7. Zhu, L.; Xu, X.T.; Wang, C.Y. Industrial environment, tenure of managers and ambidexterity innovation investment of enterprises-empirical data from GEM. Secur. Mark. Her. 2017, 6, 4–11. [Google Scholar]
  8. Zhai, S.P.; Bi, X.F. Environmental uncertainty, management confidence and ambidexterity innovation investment of enterprises. J. Zhongnan Univ. Econ. Law 2016, 91–100. [Google Scholar] [CrossRef]
  9. Li, C.; Pervaiz, K.; Khan, M.A.; Ur Rehman, F.; Oláh, J. On the Asymmetries of Sovereign Credit Rating Announcements and Financial Market Development in the European Region. Sustainability 2019, 11, 6636. [Google Scholar] [CrossRef] [Green Version]
  10. Sun, J.J.; Zhang, Y. Financial development, agency cost and innovation strategy of enterprises. Res Financ. Econ. Issues 2019, 50–59. [Google Scholar] [CrossRef]
  11. Li, W.G.; Yu, M.G. Ownership structure and innovation of private enterprises. Manag. World 2015, 112–125. [Google Scholar] [CrossRef]
  12. Wang, Y.W.; Chen, L. Does mixed ownership reform promote enterprise innovation? Res. Econ. Manag. 2017, 38, 112–121. [Google Scholar]
  13. Yuan, J.G.; Hou, Q.S.; Cheng, C. The curse effect of enterprise political resources-Based on the investigation of political connection and enterprise technological innovation. Manag. World 2015, 139–155. [Google Scholar] [CrossRef]
  14. Ren, S.M.; Li, X.Q.; Wang, Y.L.; Han, Y.Q. Private equity participation, institutional environment and enterprise innovation. R D Manag. 2019, 31, 59–71. [Google Scholar]
  15. Zhang, J.D.; Liu, S.H. Viewing the choice of strategic investors from China Unicom’s mixed ownership reform. Account. Res. 2018, 28–34. [Google Scholar] [CrossRef]
  16. Gavetti, G.; Levinthal, D. Looking forward and looking backward: Cognitive and experiential search. Adm. Sci. Q. 2000, 45, 113–137. [Google Scholar] [CrossRef] [Green Version]
  17. Green, S.G.; Gavin, M.B.; Aiman-Smith, L. Assessing a multidimensional measure of radical technological innovation. IEEE Trans. Eng. Manag. 1995, 42, 203–214. [Google Scholar] [CrossRef]
  18. Levinthal, D.A.; March, J.G. The myopia of learning. Strateg. Manag. J. 1993, 14, 95–112. [Google Scholar] [CrossRef]
  19. Brickley, J.A.; Lease, R.C.; Smith, C.J. Ownership structure and voting on antitakeover amendments. J. Financ. Econ. 1988, 20, 267–291. [Google Scholar] [CrossRef]
  20. Lu, J.C.; Jiang, G.S. Mixed ownership and cash dividend distribution of state-owned enterprises. Econ. Manag. 2018, 40, 5–20. [Google Scholar]
  21. Bennedsen, M.; Wolfenzon, D. The Balance of Power in Closely Held Corporations. Soc. Sci. Electron. Publ. 2001, 58, 113–139. [Google Scholar] [CrossRef] [Green Version]
  22. Ma, L.F.; Wang, L.L.; Zhang, Q. The priority choice of mixed ownership: The logic of market. China’s Ind. Econ. 2015, 5–20. [Google Scholar] [CrossRef]
  23. Wang, Y. Mergers and acquisitions of mixed ownership and innovation-driven development-A longitudinal case study of “hanlan environment” of local state-owned enterprises in guangdong province from 2001 to 2015. Manag. World 2016, 150–163. [Google Scholar] [CrossRef]
  24. Luo, F.K.; Pang, T.Y.; Wang, J. Does the mixed ownership reform affect the R&D investment of enterprises?-Based on the empirical evidence of A-share listed companies in China. R D Manag. 2019, 31, 56–66. [Google Scholar]
  25. Wu, C.Q.; Li, T.K. Enterprise behavior in mixed market. Donyue Trib. 2005, 38–47. [Google Scholar] [CrossRef]
  26. Choi, S.B.; Lee, S.H.; Williams, C. Ownership and firm innovation in a transition economy: Evidence from China. Res. Policy 2011, 40, 441–452. [Google Scholar] [CrossRef]
  27. Faber, J.; Hesen, A.B. Innovation capabilities of European nations: Cross-national analyses of patents and sales of product innovations. Res. Policy 2004, 33, 193–207. [Google Scholar] [CrossRef]
  28. Porta, R.L.; Lopez-De-Silanes, F.; Shleifer, A. Corporate Ownership Around the World. J. Financ. 1999, 54, 471–517. [Google Scholar] [CrossRef]
  29. Li, Z.Q.; Sun, Z.; Wang, Z.W. “Tunneling” and ownership arrangement-Empirical evidence from capital occupation of major shareholders of listed companies in China. Account. Res. 2004, 25, 3–13. [Google Scholar]
  30. Pagano, M.; Röell, A.A. The choice of stock ownership structure: Agency costs, monitoring, and the decision to go public. Q. J. Econ. 1998, 113, 187–225. [Google Scholar] [CrossRef]
  31. Jin, Y.C.; Jin, Q.L.; Xuan, Y. “Inaction” or “eager expression”: The political motivation in enterprise investment. Econ. Res. J. 2016, 51, 126–139. [Google Scholar]
  32. Li, H.J.; Liu, S.Y. Bank credit, ownership nature and enterprise innovation. Stud. Sci. Sci. 2015, 33, 1089–1099. [Google Scholar]
  33. Aghion, P.; Reenen, J.V.; Zingales, L. Innovation and Institutional Ownership. Am. Econ. Rev. 2013, 103, 277–304. [Google Scholar] [CrossRef] [Green Version]
  34. Richardson, S. Over-investment of free cash flow. Rev. Account. Stud. 2006, 11, 159–189. [Google Scholar] [CrossRef]
  35. Chen, G.; Zhang, J.J.; Pifer, N.D. Corporate Governance Structure, Financial Capability, and the R&D Intensity in Chinese Sports Sector: Evidence from Listed Sports Companies. Sustainability 2019, 11, 6810. [Google Scholar] [CrossRef] [Green Version]
  36. Zhou, J.; Xue, Y.Z. The impact of corporate internal governance mechanism on R&D investment-An empirical study based on the shareholding of the general manager and the structure of the board of directors. R D Manag. 2008, 20, 1–9. [Google Scholar]
  37. Bi, X.F.; Zhai, S.P.; Jiang, B.Q. The impact of government subsidy and financial redundancy on ambidexterity innovation of high-tech enterprises. Account. Res. 2017, 46–52. [Google Scholar] [CrossRef]
  38. Tang, Q.Q.; Xiao, H.L. Financing constraints and innovation investment-cash flow sensitivity- Based on the perspective of R&D heterogeneity. South China J. Econ. 2012, 11, 40–54. [Google Scholar]
  39. Hao, Y.; Gong, L.T. Mixed participation of state-owned and private shareholders and improvement of corporate performance. Econ. Res. J. 2017, 52, 122–135. [Google Scholar]
  40. Yang, X.Q.; Yin, X.Q. How does the mixed ownership reform of state-owned enterprises affect the company’s cash holding? Manag. World 2018, 34, 93–107. [Google Scholar]
  41. Wei, M.H.; Cai, G.L.; Liu, J.H. Research on classified governance of state-owned listed companies in China. J. Sun Yatsen Univ. Soc. Sci. Ed. 2017, 57, 175–192. [Google Scholar]
  42. Cai, G.L.; Liu, J.H.; Ma, X.X. Governance of non-state-owned shareholders and executive compensation incentive in state-owned enterprises. Manag. World 2018, 34, 137–149. [Google Scholar]
  43. Newman, K.L. Organizational transformation during institutional upheaval. Acad. Manag. Rev. 2000, 25, 602–619. [Google Scholar] [CrossRef]
  44. Liu, Y.G.; Zheng, Q.; Cai, G.L. Does non-state-owned shareholders improve the quality of internal control of state-owned enterprises?-Evidence from state-owned listed companies. Account. Res. 2016, 11, 61–68. [Google Scholar]
  45. Liu, Q.L.; Luo, L.; He, W.F.; Chen, H.W. Nature of property rights, institutional environment and internal control. Account. Res. 2012, 4, 52–61. [Google Scholar]
  46. Xia, L.J.; Fang, Y.Q. Government control, governance environment and corporate value: Empirical evidence from China’s securities market. Econ. Res. J. 2005, 5, 40–51. [Google Scholar]
  47. Yue, X.M.; Li, S.; Shi, T.L. Discussion on the high income problem of monopoly industry. Soc. Sci. China 2010, 3, 77–93. [Google Scholar]
  48. Chen, C.M.; Sun, J.H. Background characteristics of entrepreneur population and diversification strategy choice: An empirical study based on panel data of Chinese listed companies. Manag. World 2008, 5, 124–133. [Google Scholar]
  49. Wang, F.S.; Sun, H.X. Ultimate controller, diversification strategy and cash holding level. Manag. World 2012, 7, 124–136. [Google Scholar]
  50. Peng, H.X.; Mao, X.S. Government innovation subsidy, corporate executives’ background and R&D investment: Empirical evidence from China’s high-tech industry. Financ. Trade Econ. 2017, 38, 147–161. [Google Scholar]
  51. Han, Z.X.; Cui, J.W.; Wang, S. Do technology executives improve the technical efficiency of enterprises? Stud. Sci. Sci. 2014, 32, 559–568. [Google Scholar]
  52. Baron, R.M.; Kenny, D.A. The moderator-mediator variable distinction in social psychological research: Conceptual, strategic, and statistical consideration. J. Personal. Soc. Psychol. 1986, 51, 1173–1182. [Google Scholar] [CrossRef]
Figure 1. Conceptual model.
Sustainability 12 02587 g001
Table 1. Classification and definition of shareholders.
ClassificationDefinition
State-owned shareholdersShareholders formed by the state through direct control of government departments (Ministry of Finance, state-owned assets supervision and administration commission (SASAC), etc.) or through controlling industrial enterprises and government-owned management enterprises
Private shareholdersShareholders formed by the investment of non-state-owned legal persons in China
Foreign shareholdersShareholders formed by the investment of overseas legal persons, overseas natural persons, and foreign-invested enterprises
Natural person shareholdersShareholders formed by the investment of natural persons or families in China
Institutional investorsShareholders (Listed Open-ended Fund, Qualified Foreign Institutional Investor, insurance, fund, securities enterprises, financial institutions, etc.) formed by the securities investment of legal persons in the financial market
OthersShareholders other than the above five categories
Table 2. The variable definition and description.
Type of VariableVariableVariable SymbolMeasurement of Variable
Explained variableExploratory innovation investment R 1 Research expensed expenditure/Total assets at the fiscal year-begin × 100%.
Exploitative innovation investment D 1 Research capitalized expenditure/Total assets at the fiscal year-begin × 100%.
Explanatory variableDiversity of mixed shareholders M I X S The types of heterogeneous shareholders included in the top ten shareholders. If only one kind of shareholder is involved in the enterprise, the value of M I X S is 1; the value of two kinds is 2. By analogy, there can be at most five types of shareholders, where the value of M I X S is 5.
Depth of mixed equity M I X O The sum of the four non-state-owned shareholding ratios of private, foreign, and natural persons as well as institutional investors among the top ten shareholders.
Control of mixed equity M I X _ D J G The proportion of directors, supervisors, and executives appointed by non-state-owned shareholders in the top ten shareholders.
The shareholding ratio of private shareholders M I X O _ P The sum of the shareholding ratios of private shareholders in the top ten shareholders.
The shareholding ratio of foreign shareholders M I X O _ F The sum of the shareholding ratios of foreign shareholders in the top ten shareholders.
The shareholding ratio of natural persons M I X O _ N The sum of the shareholding ratios of natural persons in the top ten shareholders.
The shareholding ratio of institutional investors M I X O _ I The sum of the shareholding ratios of institutional investors in the top ten shareholders.
Control variableCompany size S I Z E Natural logarithm value of total assets at the fiscal year-end.
Leverage L E V The company’s total liabilities/Total assets at the fiscal year-end.
Growth G R O W T H Percentage change in operating revenue over the fiscal year.
Profitability R O A The company’s total profits/Total assets at the fiscal year-end.
Free cash flow C F Free cash flow scaled/Total assets at the fiscal year-end.
The scale of the board B O A R D Natural logarithm of the number of directors on the board.
The proportion of independent directors I N D E P The number of independent directors/The number of directors on the board.
Duality D U A L Dummy variable, if the chairman concurrently serves as the general manager, take 1, otherwise, take 0.
Age of listed companies A G E Age of the company at the year of IPO.
Year Y E A R Year dummy variable
Industry I N D U S T R Y Industry dummy variable.
Table 3. Descriptive statistics of the variables and correlation analysis.
Variablemeansd123456
1. R 1 1.1481.6721
2. D 1 0.1200.4080.236 ***1
3. M I X S 2.9181.0330.0210.0041
4. M I X O 0.1140.1060.046 ***0.030 **0.342 ***1
5. M I X _ D J G 0.0210.0570.135 ***0.081 ***0.063 ***0.374 ***1
6. S I Z E 22.8201.381−0.149 ***−0.0120.288 ***0.124 ***−0.131 ***1
7. L E V 0.5090.202−0.145 ***−0.042 ***0.007−0.032 **−0.145 ***0.431 ***
8. G R O W T H 0.0810.2700.060 ***0.071 ***0.050 ***0.096 ***0.090 ***0.047 ***
9. R O A 0.0500.0510.033 **0.0140.144 ***0.101 ***0.134 ***0.071 ***
10. C F 0.0440.0700.020−0.054 ***0.133 ***0.033 **0.0170.092 ***
11. B O A R D 0.0230.002−0.040 ***0.0000.094 ***0.087 ***0.031 **0.184 ***
12. I N D E P 0.3690.053−0.0120.0160.049 ***−0.020−0.099 ***0.160 ***
13. D U A L 0.0960.294−0.011−0.0060.0050.0190.038 **−0.040 ***
14. A G E 18.765.043−0.035 **−0.041 ***0.0190.0180.007−0.098 ***
Variable7891011121314
7. L E V 1
8. G R O W T H 0.0221
9. R O A −0.303 ***0.214 ***1
10. C F −0.192 ***0.035 **0.378 ***1
11. B O A R D 0.060 ***−0.0080.0190.068 ***1
12. I N D E P 0.077 ***−0.009−0.048 ***−0.022−0.384 ***1
13. D U A L 0.004−0.0060.0170.007−0.079 ***0.061 ***1
14. A G E 0.0090.042 ***0.027 *−0.031 **−0.032 **−0.073 ***0.025 *1
Note: *, **, *** are significant at the 10%, 5%, and 1% levels, respectively.
Table 4. The influence of mixed-ownership reform on the innovation strategy choice of State-Owned Enterprises (SOEs).
(1)(2)(3)(4)(5)(6)
V a r i a b l e R 1 D 1 R 1 D 1 R 1 D 1
M I X S 0.074 ***0.0001
(3.39)(0.01)
M I X O 0.476 **0.028
(2.34)(0.50)
M I X _ D J G 2.313 ***0.365 ***
(6.13)(3.48)
SIZE−0.120 ***0.011 **−0.109 ***0.011 **−0.093 ***0.013 **
(−5.96)(2.04)(−5.53)(2.03)(−4.77)(2.39)
L E V −0.232 *−0.024−0.248 *−0.023−0.223 *−0.017
(−1.72)(−0.65)(−1.84)(−0.62)(−1.66)(−0.46)
G R O W T H 0.298 ***0.098 ***0.288 ***0.097 ***0.270 ***0.093 ***
(3.62)(4.29)(3.49)(4.24)(3.29)(4.07)
R O A 1.554 ***0.318 **1.590 ***0.314 **1.341 ***0.269**
(3.19)(2.35)(3.26)(2.32)(2.75)(1.99)
C F 0.461−0.480 ***0.549−0.479 ***0.605 *−0.468 ***
(1.36)(−5.10)(1.62)(−5.09)(1.79)(−4.98)
B O A R D −9.5121.125−8.8401.012−9.3930.733
(−0.69)(0.29)(−0.64)(0.26)(−0.68)(0.19)
I N D E P −0.4590.114−0.4010.115−0.2390.141
(−1.02)(0.92)(−0.89)(0.92)(−0.53)(1.13)
D U A L −0.0810.0002−0.083−0.0001−0.100−0.003
(−1.13)(0.01)(−1.16)(−0.00)(−1.35)(−0.14)
A G E −0.016 ***−0.004 ***−0.015 ***−0.0036 ***−0.014 ***−0.004 ***
(−3.51)(−2.94)(−3.43)(−2.94)(−3.29)(−2.87)
C O N S T A N T 3.501 ***0.3063.331 ***0.3112.784 ***0.234
(4.72)(1.49)(4.51)(1.52)(3.77)(1.14)
Y E A R Controlcontrolcontrolcontrolcontrolcontrol
I N D U S T R Y Controlcontrolcontrolcontrolcontrolcontrol
O b s e r v a t i o n s 455045504550455045504550
R 2 0.2960.0910.2950.0910.3000.094
A d j .   R 2 0.2910.0850.2910.0850.2960.088
Note: *, **, and *** are significant at the 10%, 5%, and 1% levels, respectively. t-statistics are reported in brackets.
Table 5. The results of Driscoll–Kraay estimation.
(1)(2)(3)(4)(5)(6)
V a r i a b l e R 1 D 1 R 1 D 1 R 1 D 1
M I X S 0.027 ***0.008 **
(4.24)(2.35)
M I X O 1.092 **−0.019
(2.53)(−1.44)
M I X _ D J G 0.332 **−0.096
(2.29)(−0.52)
SIZE−0.474 ***−0.049 ***−0.492 ***−0.048 ***−0.473 ***−0.048 ***
(−2.72)(−4.13)(−2.75)(−4.01)(−2.71)(−3.88)
L E V −0.207 **0.055−0.0360.052−0.206 **0.054
(−2.06)(1.34)(−0.37)(1.30)(−2.04)(1.29)
G R O W T H 0.116 *0.0060.1010.0080.118 *0.008
(1.75)(0.24)(1.46)(0.30)(1.76)(0.31)
R O A −0.1800.106 **−0.1540.105 **−0.1960.109 **
(−0.65)(2.16)(−0.60)(2.19)(−0.71)(2.20)
C F 0.137−0.0270.149−0.02300.158−0.025
(1.08)(−0.88)(1.16)(−0.71)(1.24)(−0.91)
B O A R D −35.940 **−5.048 *−36.220 **−4.663−34.760 **−4.680
(−2.41)(−1.68)(−2.35)(−1.56)(−2.40)(−1.56)
I N D E P −0.703 *−0.002−0.6440.0004−0.680 *−0.002
(−1.73)(−0.02)(−1.64)(0.00)(−1.71)(−0.02)
D U A L −0.054 *−0.039 ***−0.049 *−0.039 ***−0.052 *−0.039 ***
(−1.91)(−3.35)(−1.74)(−3.34)(−1.86)(−3.33)
A G E 0.137 ***0.011 ***0.138 ***0.012 ***0.139 ***0.011 ***
(9.12)(6.74)(9.30)(6.69)(9.47)(7.68)
C O N S T A N T 10.320 ***1.106 ***10.570 ***1.095 ***10.290 ***1.102 ***
(2.60)(3.34)(2.63)(3.28)(2.59)(3.31)
O b s e r v a t i o n s 455045504550455045504550
G r o u p s 989989989989989989
Note: *, **, and *** are significant at the 10%, 5%, and 1% levels, respectively. t-statistics are reported in brackets.
Table 6. The influence of heterogeneous shareholding ratio on the innovation strategy choices of SOEs.
(1)(2)(3)(4)(5)(6)(7)(8)
V a r i a b l e R 1 D 1 R 1 D 1 R 1 D 1 R 1 D 1
M I X O _ P −1.1990.211
(−1.53)(0.97)
M I X O _ F 0.904 ***−0.087
(2.89)(−1.00)
M I X O _ N 1.450 **0.273
(2.40)(1.63)
M I X O _ I 1.160 **0.536 ***
(2.27)(3.81)
S I Z E −0.105 ***0.012 **−0.121 ***0.013 **−0.092 ***0.014 **−0.108 ***0.009 *
(−5.36)(2.19)(−5.89)(2.32)(−4.58)(2.44)(−5.49)(1.67)
L E V −0.273 **−0.024−0.238 *−0.027−0.269 **−0.024−0.267 **−0.023
(−2.02)(−0.63)(−1.76)(−0.73)(−2.00)(−0.64)(−1.98)(−0.63)
G R O W T H 0.313 ***0.096 ***0.309 ***0.097 ***0.285 ***0.094 ***0.297 ***0.095 ***
(3.78)(4.20)(3.75)(4.27)(3.45)(4.12)(3.60)(4.17)
R O A 1.685 ***0.311 **1.670 ***0.316 **1.627 ***0.313 **1.570 ***0.281 **
(3.46)(2.30)(3.43)(2.34)(3.34)(2.33)(3.22)(2.09)
C F 0.516−0.478 ***0.495−0.477 ***0.587 *−0.467 ***0.550−0.469 ***
(1.52)(−5.08)(1.46)(−5.07)(1.73)(−4.98)(1.62)(−5.02)
B O A R D −5.7030.918−8.1181.245−6.6381.123−6.7221.153
(−0.41)(0.24)(−0.59)(0.32)(−0.48)(0.29)(−0.48)(0.30)
I N D E P −0.4060.114−0.4070.114−0.3990.114−0.3980.117
(−0.90)(0.92)(−0.91)(0.92)(−0.89)(0.92)(−0.89)(0.95)
D U A L −0.075−0.0003−0.0810.0006−0.083−0.0008−0.079−0.0002
(−1.04)(−0.01)(−1.13)(0.03)(−1.15)(−0.04)(−1.09)(−0.01)
A G E −0.015 ***−0.004 ***−0.015 ***−0.004 ***−0.015 ***−0.004 ***−0.015 ***−0.003 ***
(−3.40)(−2.93)(−3.49)(−2.90)(−3.37)(−2.91)(−3.32)(−2.81)
C O N S T A N T 3.318 ***0.2933.631 ***0.2692.955 ***0.2533.275 ***0.322
(4.49)(1.43)(4.84)(1.29)(3.95)(1.23)(4.44)(1.58)
Y E A R controlcontrolControlcontrolcontrolcontrolcontrolcontrol
I N D U S T R Y controlcontrolControlcontrolcontrolcontrolcontrolcontrol
N 45504550455045504550455045504550
R 2 0.2950.0920.2960.0920.2950.0920.2950.095
A d j .   R 2 0.2900.0860.2910.0860.2910.0860.2900.089
Note: *, **, and *** are significant at the 10%, 5%, and 1% levels, respectively. t-statistics are reported in brackets.
Table 7. The regression results of the moderation effect of administrative levels.
(1)(2)(3)(4)(5)(6)
V a r i a b l e R 1 R 1 R 1 R 1 R 1 R 1
M I X S 0.217 ***0.012
(4.95)(0.52)
M I X O 1.905 ***−0.082
(4.78)(−0.36)
M I X _ D J G 3.537 ***1.621 ***
(4.84)(3.84)
S I Z E −0.220 ***−0.077 ***−0.190 ***−0.073 ***−0.149 ***−0.066 ***
(−5.62)(−3.27)(−5.00)(−3.17)(−3.95)(−2.91)
L E V −0.162−0.219−0.255−0.227−0.258−0.194
(−0.59)(−1.47)(−0.93)(−1.52)(−0.94)(−1.30)
G R O W T H 0.2440.324 ***0.2160.328 ***0.1490.314 ***
(1.45)(3.66)(1.28)(3.69)(0.88)(3.55)
R O A 3.601 ***0.3753.483 ***0.4103.320 ***0.163
(3.99)(0.67)(3.85)(0.74)(3.66)(0.29)
C F 0.8840.4861.283 *0.4941.235 *0.532
(1.33)(1.29)(1.93)(1.31)(1.86)(1.41)
B O A R D 50.530 *−30.740 **48.240 *−29.760 **51.120 *−32.660 **
(1.73)(−2.04)(1.65)(−1.98)(1.75)(−2.18)
I N D E P 0.347−0.7990.537−0.7860.582−0.660
(0.41)(−1.55)(0.63)(−1.53)(0.69)(−1.29)
D U A L 0.283 *−0.130 *0.258−0.128 *0.247−0.141 *
(1.68)(−1.76)(1.53)(−1.74)(1.46)(−1.91)
A G E −0.025 ***−0.002−0.024 ***−0.0015−0.021 **−0.001
(−2.69)(−0.33)(−2.65)(−0.31)(−2.33)(−0.29)
C O N S T A N T 5.324 ***2.889 ***5.007 ***2.831 ***4.027 ***2.671 ***
(4.33)(4.60)(4.09)(4.52)(3.29)(4.28)
Y E A R controlcontrolcontrolcontrolcontrolcontrol
I N D U S T R Y controlcontrolcontrolcontrolcontrolcontrol
O b s e r v a t i o n s 153430161534301615343016
R 2 0.3220.2780.3210.2780.3210.282
A d j .   R 2 0.3080.2710.3080.2710.3080.275
S a m p l e centrallocalcentrallocalcentrallocal
Note: *, **, and *** are significant at the 10%, 5%, and 1% levels, respectively. t-statistics are reported in brackets.
Table 8. The regression results of the moderation effect of industry competition.
(1)(2)(3)(4)(5)(6)
V a r i a b l e R 1 R 1 R 1 R 1 R 1 R 1
M I X S 0.0730.069 ***
(1.61)(2.92)
M I X O 0.2520.467 **
(0.51)(2.13)
M I X _ D J G −0.4472.344 ***
(−0.41)(5.83)
S I Z E −0.053−0.125 ***−0.038−0.115 ***−0.036−0.099 ***
(−1.43)(−5.52)(−1.06)(−5.19)(−1.02)(−4.51)
L E V −0.098−0.266 *−0.115−0.279 *−0.136−0.254 *
(−0.35)(−1.79)(−0.41)(−1.88)(−0.48)(−1.72)
G R O W T H 0.0370.317 ***0.0360.306 ***0.0450.288 ***
(0.19)(3.57)(0.18)(3.45)(0.23)(3.26)
R O A 1.0391.458 ***1.0631.486 ***1.0451.215 **
(0.80)(2.79)(0.82)(2.84)(0.80)(2.32)
C F −1.0890.548−0.9650.631 *−1.0280.666 *
(−1.18)(1.51)(−1.05)(1.74)(−1.10)(1.84)
B O A R D 45.920 *−15.69052.320 **−15.70054.780 **−16.660
(1.72)(−1.02)(1.97)(−1.02)(2.08)(−1.09)
I N D E P 2.222 **−0.7582.373 **−0.7092.389 **−0.532
(2.22)(−1.56)(2.38)(−1.46)(2.40)(−1.09)
D U A L 0.071−0.0840.092−0.0880.098−0.105
(0.51)(−1.06)(0.66)(−1.11)(0.71)(−1.33)
A G E −0.040 ***−0.014 ***−0.038 ***−0.014 ***−0.039 ***−0.013 ***
(−3.59)(−2.91)(−3.48)(−2.86)(−3.48)(−2.75)
C O N S T A N T 0.0744.394 ***−0.3144.268 ***−0.3713.720 ***
(0.07)(5.47)(−0.31)(5.33)(−0.37)(4.64)
Y E A R controlcontrolcontrolcontrolcontrolcontrol
I N D U S T R Y controlcontrolcontrolcontrolcontrolcontrol
O b s e r v a t i o n s 506404450640445064044
R 2 0.3330.2820.3290.2810.3290.286
A d j .   R 2 0.3090.2760.3060.2760.3060.281
S a m p l e monopolycompetitivemonopolycompetitivemonopolycompetitive
Note: *, **, *** are significant at the 10%, 5%, and 1% levels, respectively. t-statistics reported in brackets.
Table 9. Regression results of the endogeneity test.
M I X S M I X O M I X _ D J G
F i r s t I V F i r s t I V F i r s t I V
V a r i a b l e R 1 D 1 R 1 D 1 R 1 D 1
M I X S 0.169 ***−0.005
(2.78)(−0.34)
M I X O 1.382 ***0.201 **
(4.07)(2.45)
M I X _ D J G 3.566 ***0.794 ***
(5.40)(4.97)
M I X t 1 0.471 *** 0.797 *** 0.758 ***
(31.78) (82.05) (80.89)
S I Z E 0.125 ***−0.212 ***0.0030.004 ***−0.191 ***−0.00126−0.0002−0.162 ***0.004
(9.42)(−7.42)(0.38)(4.98)(−7.59)(−0.21)(−0.44)(−6.54)(0.64)
L E V −0.179 **−0.550 ***−0.109 ***−0.016 ***−0.557 ***−0.096 **−0.007 **−0.560 ***−0.092 **
(−2.04)(−3.20)(−2.62)(−2.64)(−3.27)(−2.34)(−2.10)(−3.31)(−2.24)
G R O W T H 0.139 **0.479 ***0.126 ***0.012 ***0.456 ***0.120 ***0.005 ***0.446 ***0.114 ***
(2.54)(4.54)(4.96)(3.11)(4.31)(4.69)(2.77)(4.23)(4.49)
R O A 1.307 ***−0.2900.1720.041 *−0.0830.1480.022*−0.3090.090
(3.89)(−0.44)(1.08)(1.78)(−0.13)(0.95)(1.82)(−0.48)(0.58)
C F 0.538 **0.0419−0.475 ***−0.032 **0.212−0.472 ***−0.0030.233−0.464 ***
(2.35)(0.09)(−4.43)(−2.01)(0.48)(−4.42)(−0.38)(0.53)(−4.35)
B O A R D 20.118 **−11.424.718−0.272−11.503.8580.126−9.9843.815
(2.12)(−0.62)(1.06)(0.41)(−0.62)(0.87)(0.37)(−0.55)(0.86)
I N D E P 0.3840.3340.1080.0210.4230.104−0.0170.6600.156
(1.24)(0.56)(0.75)(0.97)(0.71)(0.72)(−1.52)(1.11)(1.08)
D U A L 0.054−0.166 *0.010−0.003−0.166 *0.008−0.001−0.175 *0.005
(1.09)(−1.74)(0.44)(−0.97)(−1.75)(0.34)(−0.35)(−1.86)(0.21)
A G E 0.005−0.022 ***−0.005 ***0.0003−0.022 ***−0.005 ***0.0001−0.020 ***−0.005 ***
(1.57)(−3.94)(−3.40)(1.55)(−3.85)(−3.58)(0.57)(−3.64)(−3.45)
C O N S T A N T −1.971 ***6.401 ***0.078−0.077 ***6.207 ***0.1500.0125.490 ***0.020
(−5.64)(9.12)(0.46)(−3.19)(9.17)(0.92)(0.99)(8.19)(0.12)
Y E A R controlcontrolcontrolcontrolcontrolcontrolcontrolcontrolcontrol
I N D U S T R Y controlcontrolcontrolcontrolcontrolcontrolcontrolcontrolcontrol
O b s e r v a t i o n s 356635663566356635663566356635663566
R 2 0.3140.0410.0170.6700.0420.0170.6630.0510.024
A d j .   R 2 0.3120.0380.0150.6690.0390.0140.6620.0480.021
Note: *, **, *** are significant at the 10%, 5%, and 1% levels, respectively. t-statistics reported in brackets.
Table 10. Regression results of changing dependent variables.
(1)(2)(3)(4)(5)(6)
V a r i a b l e R 2 D 2 R 2 D 2 R 2 D 2
M I X S 0.087 **0.001
(2.30)(0.07)
M I X O 1.034 ***0.178
(2.71)(1.53)
M I X _ D J G 6.105 ***0.828 ***
(9.36)(4.15)
S I Z E −0.154 ***0.029 ***−0.147 ***0.027 ***−0.107 ***0.033 ***
(−4.38)(2.74)(−4.27)(2.60)(−3.19)(3.19)
L E V −1.909 ***−0.127 *−1.912 ***−0.121 *−1.832 ***−0.111
(−8.13)(−1.78)(−8.15)(−1.70)(−7.88)(−1.57)
G R O W T H 0.433 ***0.188 ***0.407 ***0.183 ***0.353 **0.177 ***
(3.03)(4.34)(2.84)(4.21)(2.49)(4.07)
R O A −0.8270.270−0.8400.250−1.527 *0.161
(−0.98)(1.05)(−0.99)(0.97)(−1.81)(0.63)
C F −1.287 **−1.089 ***−1.165 **−1.081 ***−1.007 *−1.061 ***
(−2.18)(−6.07)(−1.98)(−6.04)(−1.72)(−5.94)
B O A R D 2.754−2.6272.004−3.260−0.762−3.497
(0.11)(−0.36)(0.08)(−0.44)(−0.03)(−0.48)
I N D E P −0.7170.149−0.6450.151−0.2110.209
(−0.92)(0.63)(−0.83)(0.64)(−0.27)(0.88)
D U A L −0.0620.021−0.0720.018−0.1080.014
(−0.49)(0.55)(−0.58)(0.48)(−0.87)(0.37)
A G E −0.029 ***−0.006 **−0.029 ***−0.006 ***−0.027 ***−0.006 **
(−3.84)(−2.58)(−3.78)(−2.59)(−3.61)(−2.50)
C O N S T A N T 5.753 ***0.4805.619 ***0.5064.237 ***0.312
(4.46)(1.23)(4.38)(1.30)(3.32)(0.80)
Y E A R controlcontrolcontrolcontrolcontrolcontrol
I N D U S T R Y controlcontrolcontrolcontrolcontrolcontrol
N 455045504550455045504550
R 2 0.3040.0900.3040.0900.3170.093
A d j .   R 2 0.2990.0840.3000.0840.3120.087
Note: *, **, and *** are significant at the 10%, 5%, and 1% levels, respectively. t-statistics are reported in brackets.
Table 11. Regression results of changing independent variables.
(1)(2)(3)(4)(5)(6)
V a r i a b l e R 1 D 1 R 1 D 1 R 1 D 1
M I X S _ 1 0.313 *−0.014
(1.92)(−0.32)
M I X O _ 1 0.217 ***0.080 ***
(2.75)(3.69)
D U M _ D J G 0.274 ***0.009
(4.78)(0.55)
S I Z E −0.102 ***0.011 **−0.103 ***0.011 **−0.096 ***0.012 **
(−5.24)(2.12)(−5.28)(2.10)(−4.91)(2.16)
L E V −0.258*−0.024−0.253 *−0.018−0.246 *−0.023
(−1.91)(−0.65)(−1.88)(−0.49)(−1.83)(−0.62)
G R O W T H 0.301 ***0.097 ***0.278 ***0.088 ***0.280 ***0.097 ***
(3.66)(4.28)(3.36)(3.87)(3.40)(4.24)
R O A 1.665 ***0.316 **1.601 ***0.300 **1.426 ***0.310 **
(3.42)(2.36)(3.29)(2.23)(2.92)(2.30)
C F 0.519−0.478 ***0.565 *−0.465 ***0.558*−0.477 ***
(1.53)(−5.11)(1.67)(−4.97)(1.65)(−5.10)
B O A R D −8.4291.146−8.8090.366−9.2651.000
(−0.61)(0.30)(−0.63)(0.10)(−0.67)(0.26)
I N D E P −0.4240.114−0.4260.106−0.2550.118
(−0.94)(0.92)(−0.95)(0.86)(−0.57)(0.95)
D U A L −0.0770.0002−0.091−0.005−0.091−0.0002
(−1.08)(0.01)(−1.27)(−0.25)(−1.27)(−0.01)
A G E −0.015 ***−0.004 ***−0.016 ***−0.004 ***−0.015 ***−0.004 ***
(−3.44)(−2.92)(−3.53)(−3.12)(−3.46)(−2.94)
C O N S T A N T 3.087 ***0.3153.126 ***0.2642.876 ***0.296
(4.16)(1.54)(4.23)(1.30)(3.89)(1.45)
Y E A R controlcontrolcontrolcontrolcontrolControl
I N D U S T R Y controlcontrolcontrolcontrolcontrolControl
N 455045504550455045504550
R 2 0.2950.0920.2960.0940.2980.092
A d j .   R 2 0.2900.0860.2910.0880.2930.086
Note: *, **, and *** are significant at the 10%, 5%, and 1% levels, respectively. t-statistics are reported in brackets.
Table 12. Regression results of eliminating sample selection bias.
(1)(2)(3)(4)(5)(6)
V a r i a b l e R 1 D 1 R 1 D 1 R 1 D 1
M I X S 0.120 ***0.009
(4.67)(1.32)
M I X O 0.503 **0.058
(2.11)(0.91)
M I X _ D J G 1.797 ***0.117
(4.02)(0.98)
S I Z E −0.159 ***−0.001−0.135 ***0.001−0.120 ***0.002
(−6.74)(−0.16)(−5.88)(0.10)(−5.25)(0.31)
L E V 0.150−0.0590.101−0.0620.119−0.062
(0.89)(−1.33)(0.60)(−1.40)(0.71)(−1.39)
G R O W T H 0.247 **0.124 ***0.248 **0.123 ***0.242 **0.124 ***
(2.40)(4.52)(2.39)(4.47)(2.35)(4.51)
R O A 1.587 ***0.2321.688 ***0.2381.512 **0.228
(2.67)(1.46)(2.83)(1.50)(2.53)(1.44)
C F 0.746 *−0.494 ***0.883 **−0.483 ***0.901 **−0.483 ***
(1.83)(−4.55)(2.16)(−4.45)(2.21)(−4.46)
B O A R D −20.7300.111−17.2400.288−16.7500.428
(−1.29)(0.03)(−1.07)(0.07)(−1.04)(0.10)
I N D E P −0.8060.003−0.6920.011−0.5380.021
(−1.54)(0.02)(−1.32)(0.08)(−1.02)(0.15)
D U A L −0.092−0.042*−0.091−0.042*−0.092−0.042 *
(−1.02)(−1.75)(−1.00)(−1.75)(−1.02)(−1.74)
A G E −0.013 **−0.003 **−0.012 **−0.003 **−0.012 **−0.003 **
(−2.43)(−2.41)(−2.35)(−2.40)(−2.25)(−2.36)
C O N S T A N T 5.650 ***0.1115.199 ***0.0834.797 ***0.049
(6.60)(0.49)(6.10)(0.37)(5.65)(0.22)
Y E A R controlcontrolcontrolcontrolcontrolControl
I N D U S T R Y controlcontrolcontrolcontrolcontrolControl
N 314831483148314831483148
R 2 0.3210.0990.3170.0990.3190.099
A d j .   R 2 0.3140.0910.3100.0900.3130.090
Note: *, **, and *** are significant at the 10%, 5%, and 1% levels, respectively. t-statistics are reported in brackets.
Table 13. The mechanism test of the influence of mixed-ownership reform on the innovation strategy choices of SOEs.
(1)(2)(3)(4)(5)(6)(7)(8)(9)
V a r i a b l e R 1 D J G _ R D R 1 R 1 D J G _ R D R 1 R 1 D J G _ R D R 1
M I X S 0.074 ***0.004 **0.064 ***
(3.39)(2.03)(3.03)
D J G _ R D 2.591 ***
(14.58)
M I X O 0.478 **0.037 **0.381 *
(2.17)(2.07)(1.77)
D J G _ R D 2.598 ***
(14.61)
M I X _ D J G 2.313 ***0.161 ***1.905 ***
(6.13)(5.21)(5.15)
D J G _ R D 2.537 ***
(14.27)
S I Z E −0.120 ***−0.003 **−0.112 ***−0.109 ***−0.003 *−0.101 ***−0.093 ***−0.002−0.088 ***
(−5.96)(−2.09)(−5.65)(−5.52)(−1.90)(−5.23)(−4.77)(−1.20)(−4.62)
L E V −0.232 *−0.010−0.206−0.250 *−0.010−0.223 *−0.223 *−0.009−0.201
(−1.72)(−0.91)(−1.56)(−1.85)(−0.94)(−1.69)(−1.66)(−0.78)(−1.53)
G R O W T H 0.298 ***0.0070.279 ***0.288 ***0.0060.271 ***0.270 ***0.0050.257 ***
(3.62)(1.09)(3.47)(3.49)(0.95)(3.36)(3.29)(0.79)(3.19)
R O A 1.554 ***0.141 ***1.189 **1.591 ***0.141 ***1.225 **1.341 ***0.124 ***1.026 **
(3.19)(3.53)(2.50)(3.26)(3.54)(2.57)(2.75)(3.11)(2.15)
C F 0.461−0.049 *0.588 *0.549−0.0440.664 **0.605 *−0.0410.708 **
(1.36)(−1.77)(1.77)(1.62)(−1.60)(2.00)(1.79)(−1.47)(2.14)
B O A R D −9.5126.355 ***−25.980 *−8.6646.345 ***−25.150 *−9.3936.309 ***−25.400 *
(−0.69)(5.60)(−1.91)(−0.62)(5.59)(−1.85)(−0.68)(5.58)(−1.87)
I N D E P −0.459−0.063 *−0.295−0.402−0.060 *−0.245−0.239−0.049−0.114
(−1.02)(−1.73)(−0.67)(−0.90)(−1.65)(−0.56)(−0.53)(−1.34)(−0.26)
D U A L −0.081−0.010 *−0.054−0.084−0.011 *−0.056−0.097−0.012 **−0.067
(−1.13)(−1.77)(−0.77)(−1.17)(−1.82)(−0.80)(−1.35)(−1.97)(−0.96)
A G E −0.016 ***−0.003 ***−0.008 *−0.015 ***−0.003 ***−0.008 *−0.014 ***−0.003 ***−0.007 *
(−3.51)(−7.91)(−1.86)(−3.41)(−7.86)(−1.77)(−3.29)(−7.77)(−1.70)
C O N S T A N T 3.501 ***0.0403.396 ***3.322 ***0.0343.233 ***2.784 ***−0.0042.794 ***
(4.72)(0.67)(4.69)(4.50)(0.56)(4.48)(3.77)(−0.07)(3.87)
Y E A R controlcontrolcontrolcontrolcontrolcontrolcontrolcontrolcontrol
I N D U S T R Y controlcontrolcontrolcontrolcontrolcontrolcontrolcontrolcontrol
N 455045504550455045504550455045504550
R 2 0.2960.2400.3280.2950.2400.3270.3000.2440.330
A d j .   R 2 0.2910.2350.3230.2900.2350.3220.2960.2390.326
Note: *, **, and *** are significant at the 10%, 5%, and 1% levels, respectively. t-statistics are reported in brackets.

