Article

Impacts of Tourism Demand on Retail Property Prices in a Shopping Destination

1
Department of Urban Studies, University of Electronic Science and Technology of China, Chengdu 611731, China
2
Department of Urban and Rural Planning, School of Architecture and Design, Southwest Jiaotong University, Chengdu 611756, China
3
Department of Real Estate and Construction, Faculty of Architecture, The University of Hong Kong, Hong Kong, China
*
Author to whom correspondence should be addressed.
Sustainability 2020, 12(4), 1361; https://doi.org/10.3390/su12041361
Submission received: 19 January 2020 / Revised: 5 February 2020 / Accepted: 10 February 2020 / Published: 13 February 2020

Abstract

:
Understanding the relationship between tourism demand and retail property prices is of great significance to tourist destinations, especially shopping destinations. The increase in tourism demand may alter the implicit prices of certain retail property characteristics (e.g., age and accessibility to transit). This study examines how tourism demand (measured by tourist volume) affects retail property prices in the tourist precinct of a shopping destination, namely Hong Kong. The implementation of the policy Individual Visit Scheme (IVS) in 2003 in Hong Kong has substantially increased tourist shoppers from Mainland China, and it is used as a quasi-natural experiment of the increased tourist volume. Spatial and non-spatial hedonic pricing models are developed based on the ground-floor retail property transaction data of Causeway Bay, Hong Kong before and after the IVS (1993–2011). The findings of this study are as follows. (1) Accessibility to transit has a larger positive price effect after the implementation of the IVS. (2) The implicit price of accessibility to accommodation facilities is not significantly altered by the implementation of the IVS. (3) Age has a larger negative price effect after the implementation of the IVS. The first two outcomes are related to the economic concerns of tourist shoppers, while the last can be explained by their hometown experience. Finally, practical implications are discussed.

1. Introduction

Driven by forces such as economic upswings and long holiday durations [1], tourism demand worldwide has dramatically increased in recent years. For example, global international tourist volume (visitor arrivals) in 2018 saw a 5.4% increase, compared with 2017; and the growth of global international tourism receipts from 2017 to 2018 was 4.4% [2], while world GDP growth during the same period was only 3.0% (Source: https://data.worldbank.org/indicator/NY.GDP.MKTP.KD.ZG).
Shopping is one of the most important tourism activities in tourist destinations, especially shopping destinations (e.g., Paris, Hong Kong, Singapore, Seoul, and Dubai) [3,4,5]. On the one hand, shopping fulfills the utilitarian needs of tourists (purchasing miscellaneous necessities for daily needs and duty-free goods). On the other hand, shopping provides a precious opportunity for tourists to expose to the host culture and offers tourists with a fruitful hedonic, recreational, and touristic experience (fleeing from mundane routine and buying souvenirs and artworks as reminders of the travel experience) [6,7]. As such, in many cases, shopping is a major reason behind travel [7]. More importantly, it is especially essential in the current era of materialism and consumption [6,7,8,9].
Hong Kong has an established worldwide reputation for being a “shopping paradise” and is a typical shopping destination, especially for tourists from mainland China [10]. According to the Hong Kong Tourism Board [11], shopping constituted the majority of travel expenditure: 86.7% for same-day visitors (or day-trippers) and 51% for overnight visitors in 2018. This demonstrates that shopping appeals to the majority of inbound tourists. Choi et al. [4] suggested that a trip to Hong Kong is deemed incomplete without shopping activities.
In Hong Kong, the implementation of the policy Individual Visit Scheme (IVS) has introduced numerous tourist shoppers from Mainland China. The IVS was initially launched on 28 July 2003, under the Closer Economic Partnership Arrangement between Mainland China and Hong Kong. The IVS is a tourism liberalization and tourism–promotion strategy that allows eligible residents with permanent household registration in specific Mainland Chinese cities to visit Hong Kong individually. Before the implementation of the IVS, Mainland Chinese visitors must apply business visas or group-based tours for a Hong Kong visit.
Understanding the linkages between tourism demand and the retail property market in a shopping destination is of paramount importance. Existing literature, however, has inadequately delved into the linkages. Three exceptions are the work of Li et al. [12], Yang et al. [13], and Jayantha and Yung [14]. Li et al. [12] utilized the street-level retail property transaction data to examine the impacts of cross-border tourist shoppers on the retail property market of Hong Kong and found that the policy Multiple-entry Permit leads to the increase in the prices of retail properties, especially those in young age and of large floor area. Yang et al. [13] adopted standard and error-correction-model-based Granger causality tests to examine the relationships between tourism development and retail property prices between 2002Q1 and 2014Q4 in Hong Kong. The authors concluded that tourism development Granger causes an increase in retail property prices in the popular tourism shopping area, but not in the unpopular. Jayantha and Yung [14] estimated semi-log hedonic pricing models for the rentals of ground-floor retail properties in the old area of Wanchai, Hong Kong and observed that revitalized historical projects are positively associated with the rentals of nearby retail properties.
How does tourism demand (more specifically, the substantial increase in tourist shoppers permitted by the IVS) affect the retail property market? Does the increase in tourist shoppers alter implicit prices of certain retail property attributes (or characteristics) (e.g., age, accessibility to transit, and accessibility to accommodation facilities)? These questions are insufficiently answered by existing studies [12,13,14] and thus are what this study attempts to probe into (explained in Section 3). To address the abovementioned issues, this study examines the association between tourism demand, more specifically, the increase in tourist shoppers, and retail property prices in Hong Kong under the hedonic framework. This is viable for the following two reasons: (1) The IVS can be used as a quasi-natural experiment to investigate the effect of the increasing volume of tourist shoppers on the pricing of retail properties; and (2) more importantly, Hong Kong has an active traded and transparent market for street-level retail properties. In addition, given that the presence of spatial autocorrelation is a major problem in property price modeling, this study estimates the traditional hedonic pricing model and spatial econometric models to tackle the spatial autocorrelation problem and tests our hypotheses regarding tourism demand and street-level retail property prices (explained in Section 3).
The contributions of this study are fourfold. First, to the best of our knowledge, this study is among the first to empirically investigate how tourism demand affects the pricing of street-level retail properties in a shopping destination. Second, this study infers the behavior of tourist shoppers from transaction prices of street-level retail properties as an alternative to the questionnaire survey or interview. Third, this study uses a policy change, that is, the implementation of the IVS as a quasi-natural experiment to test a number of hypotheses concerning the behavior of tourist shoppers. Fourth, this study contributes to the hot debate on the interaction between tourism development and the retail property market.
The remainder of the paper is organized as follows. Section 2 reviews the related literature. Section 3 develops a set of hypotheses. Section 4 describes the data and variables. Section 5 introduces the spatial econometric technique used in this study. Section 6 reports and discusses the empirical results. Section 7 concludes the paper and discusses potential practical implications.

2. Literature Review

Tourist shoppers have certain preferences and behavior that are deemed to be different from those of local shoppers (or regular shoppers, domestic shoppers) [4]. Choi et al. [4], Litirell et al. [15], and Oh et al. [16] indicated that tourist shoppers care more about the shopping environment (e.g., shop locations, variety of goods, and atmosphere of shops), partially for excitement and pleasure, and spend more on well-known brand goods; and that local shoppers care more about the merchandise quality and price and put more weight on after-sales services. Lloyd et al. [17] observed that local shoppers emphasize more on service quality and merchandise quality, while tourist shoppers list the perceived risk, price, and product quality to be the top three important factors in determining customer perceived value.
It is widely recognized that shopping satisfaction is affected by a host of factors. Early literature [18] only attributed shopping satisfaction to product value that directly fulfills customers’ needs. Lindquist [19] elaborated that shopping satisfaction can be influenced by and broken down into 9 facets: goods quality, convenience, promotion, service, post-transaction service, the physical environment, atmosphere, clientele, and institutional factors. Among these factors, convenience refers to the location and geographical accessibility of the store, and the physical environment and atmosphere emphasize the shopping environment. Christiansen and Snepenger [20] revealed that shopping satisfaction is affected not only by the nature of the product but also by service quality, shopping environment, and after-sales service.
Regarding the pricing of the shopping space, the majority of existing research concentrates on shopping malls. Various factors that significantly affect shopping mall prices or rentals are identified, such as tenant mix [21], architectural design, layout and image [22], and financial returns and profitability [23]. Sirmans and Guidry [24] summarized that shopping center rentals are mainly affected by four factors, including market conditions, customer drawing power, building design, and location. They also concluded that center square footage, age, and the anchor tenant are the primary factors affecting retail rentals; and that the rental effect of anchor tenant is positive, while the rental effect of age is negative.
Little is done about relatively small-scale, street-level retail properties that are quite typical in old urban areas in metropolitan cities, like Hong Kong. Chau et al. found that locational characteristics are more significant than physical characteristics in shaping street-level retail property prices in Hong Kong and suggested that pedestrian flow is a significant price-influencing factor [25]. Li et al. [12] investigated the impact of cross-border tourists on street-level retail property prices and concluded that newer and larger-sized retail properties benefited more from the implementation of the policy Multiple-entry Permit in Hong Kong. Jayantha and Yung [14] stated that gross floor area and transit accessibility contribute to explain the rentals of ground-floor retail properties in the old area of Wanchai, Hong Kong, while age and property management body are too weak to determine the rentals.

3. Development of Hypotheses

According to Lindquist [19], shopping satisfaction is affected by attributes of the retail space, such as convenience, physical environment, and atmosphere. Some attributes of the retail space can be reflected by and measured with corresponding variables. This provides the theoretical foundation for linking the increase in tourist shopper volume with retail property transaction prices. Thus, we aim to investigate tourist shoppers’ behavior from the perspective of the pricing of the shopping space instead of relying on the commonly-used research approach, namely questionnaire surveys. Identifying utility-bearing, price-influencing attributes of retail properties in the tourist precinct of a shopping destination helps reveal the preferences of tourist shoppers (primary targets of such retail properties).
Consumer behavior is essentially rational: consumers often carefully consider or evaluate the costs and benefits of each possible choice before making the final decision [26]. Economic factors are highly important in choice evaluation. As such, in theory, tourist shoppers highly care about economic factors, such as travel cost (including time and monetary costs) and may highly value transportation accessibility (e.g., accessibility to transit) [27,28] when selecting where to shop [29].
For tourist shoppers, the time of stay in a tourist destination is relatively short. Therefore, tourist shoppers have a much higher value-of-time than local shoppers. Tourist shoppers tend to minimize the time of accessing shopping attractions and consequently maximize their valuable shopping time (which derives utility). Therefore, tourist shoppers are more willing to shop in accessible locations or locations with a high level of transportation accessibility than local shoppers [30].
Hong Kong is a quintessential compact, high-density, and transit-oriented city. The Mass Transit Railway (MTR) is the most extensively used travel mode that takes the largest market share (over 30%) [31]. In addition, the MTR is more frequently used by tourists than local residents [31]. In Hong Kong, one easily observable and quantifiable indicator of geographical accessibility is the accessibility to the MTR. Generally, accessibility to the MTR has positive effects on retail property prices, given that MTR travel often saves consumers’ travel time and monetary cost of reaching shopping opportunities. The demand for locations with high MTR accessibility should, in theory, increase if the tourist shopper volume increases. In other words, after the implementation of the IVS (which induces a huge number of tourists), the benefits (or price effects) of accessibility to the MTR should, in theory, increase.
Based on the above reasoning, we formulate the first hypothesis (H1):
Hypothesis 1 (H1).
The implicit price of accessibility to the MTR would increase after the implementation of the IVS.
Accommodation facilities in a tourist destination (e.g., hotels or guesthouses) offer paid lodging to people on a short-term basis. They are always a big issue, especially for overnight tourist shoppers. Tourist shoppers have a higher cost of stay and a tighter schedule than local shoppers. Thus, tourist shoppers care more about accommodation issues. A retail property located near accommodation facilities reduces travel costs, increases shopping time, and eases shopping activities [32]. Retail properties with good accessibility of accommodation facilities may have a positive effect on tourist shoppers’ shopping experience. Similar to the reasoning of H1, after the implementation of the IVS, the benefits of accessibility to accommodation facilities may increase.
However, according to Hong Kong Tourism Board [11], in Hong Kong, the majority (approximately 60%) of tourists from Mainland China (beneficiary of the IVS) are same-day in-town visitors (The proportion of same-day tourists to all tourists (which consist of same-day and overnight tourists) from Mainland China is 59.62% in 2014, 60.74% in 2015, 59.35% in 2016, 58.29% in 2017, and 60.97% in 2018 [11]). They do not stay overnight and thus are too transient to utilize accommodation facilities [12]. Moreover, the accommodation cost in tourist precincts (or popular tourism shopping area) of a shopping destination, such as Causeway Bay in Hong Kong (the study area of this study), is in general extraordinarily high. As such, only a small proportion of tourist shoppers stay within the tourist precincts. Thus, the implicit price of accessibility to accommodation facilities may not be significantly altered by the implementation of the IVS.
Accordingly, we propose two contrasting or competing hypotheses (H2A and H2B):
Hypothesis 2A (H2A).
The implicit price of accessibility to accommodation facilities would increase after the implementation of the IVS.
Hypothesis 2B (H2B).
The implicit price of accessibility to accommodation facilities would not be altered by the implementation of the IVS.
Besides the above economic concerns on transportation and accommodation, psychological factors, such as the hometown shopping experience, can affect tourists’ shopping behavior [16]. People (not necessarily tourist shoppers) often make unconscious decisions based on past experience [33] and sometimes even have done that without realizing the involvement of past memories in the decision-making process [34,35].
Attitudes of tourist shoppers (mainly those from Mainland China) toward the shopping environment in tourist destinations can be affected by their hometown experience. Mainland China has a short history of urbanization. In Mainland China, reputable retailers are mainly located in newly built shops. By contrast, old shops usually attract non-reputable retailers, so the chance of getting counterfeited items is high in such shops. Therefore, tourist shoppers from Mainland China can easily associate shops located in old buildings with low-quality retailers based on their local experience and psychological implications in home areas. In other words, tourist shoppers will take such shops as a signal of low quality and service. By contrast, local shoppers have much more information to make decisions than tourist shoppers and rarely do so. Old shops reduce shopping intention of tourist shoppers, which indirectly affects the sales price of retail properties.
Thus, we propose the third hypothesis (H3):
Hypothesis 3 (H3).
Age would have a larger negative price effect after the implementation of the IVS.

4. Data and Variables
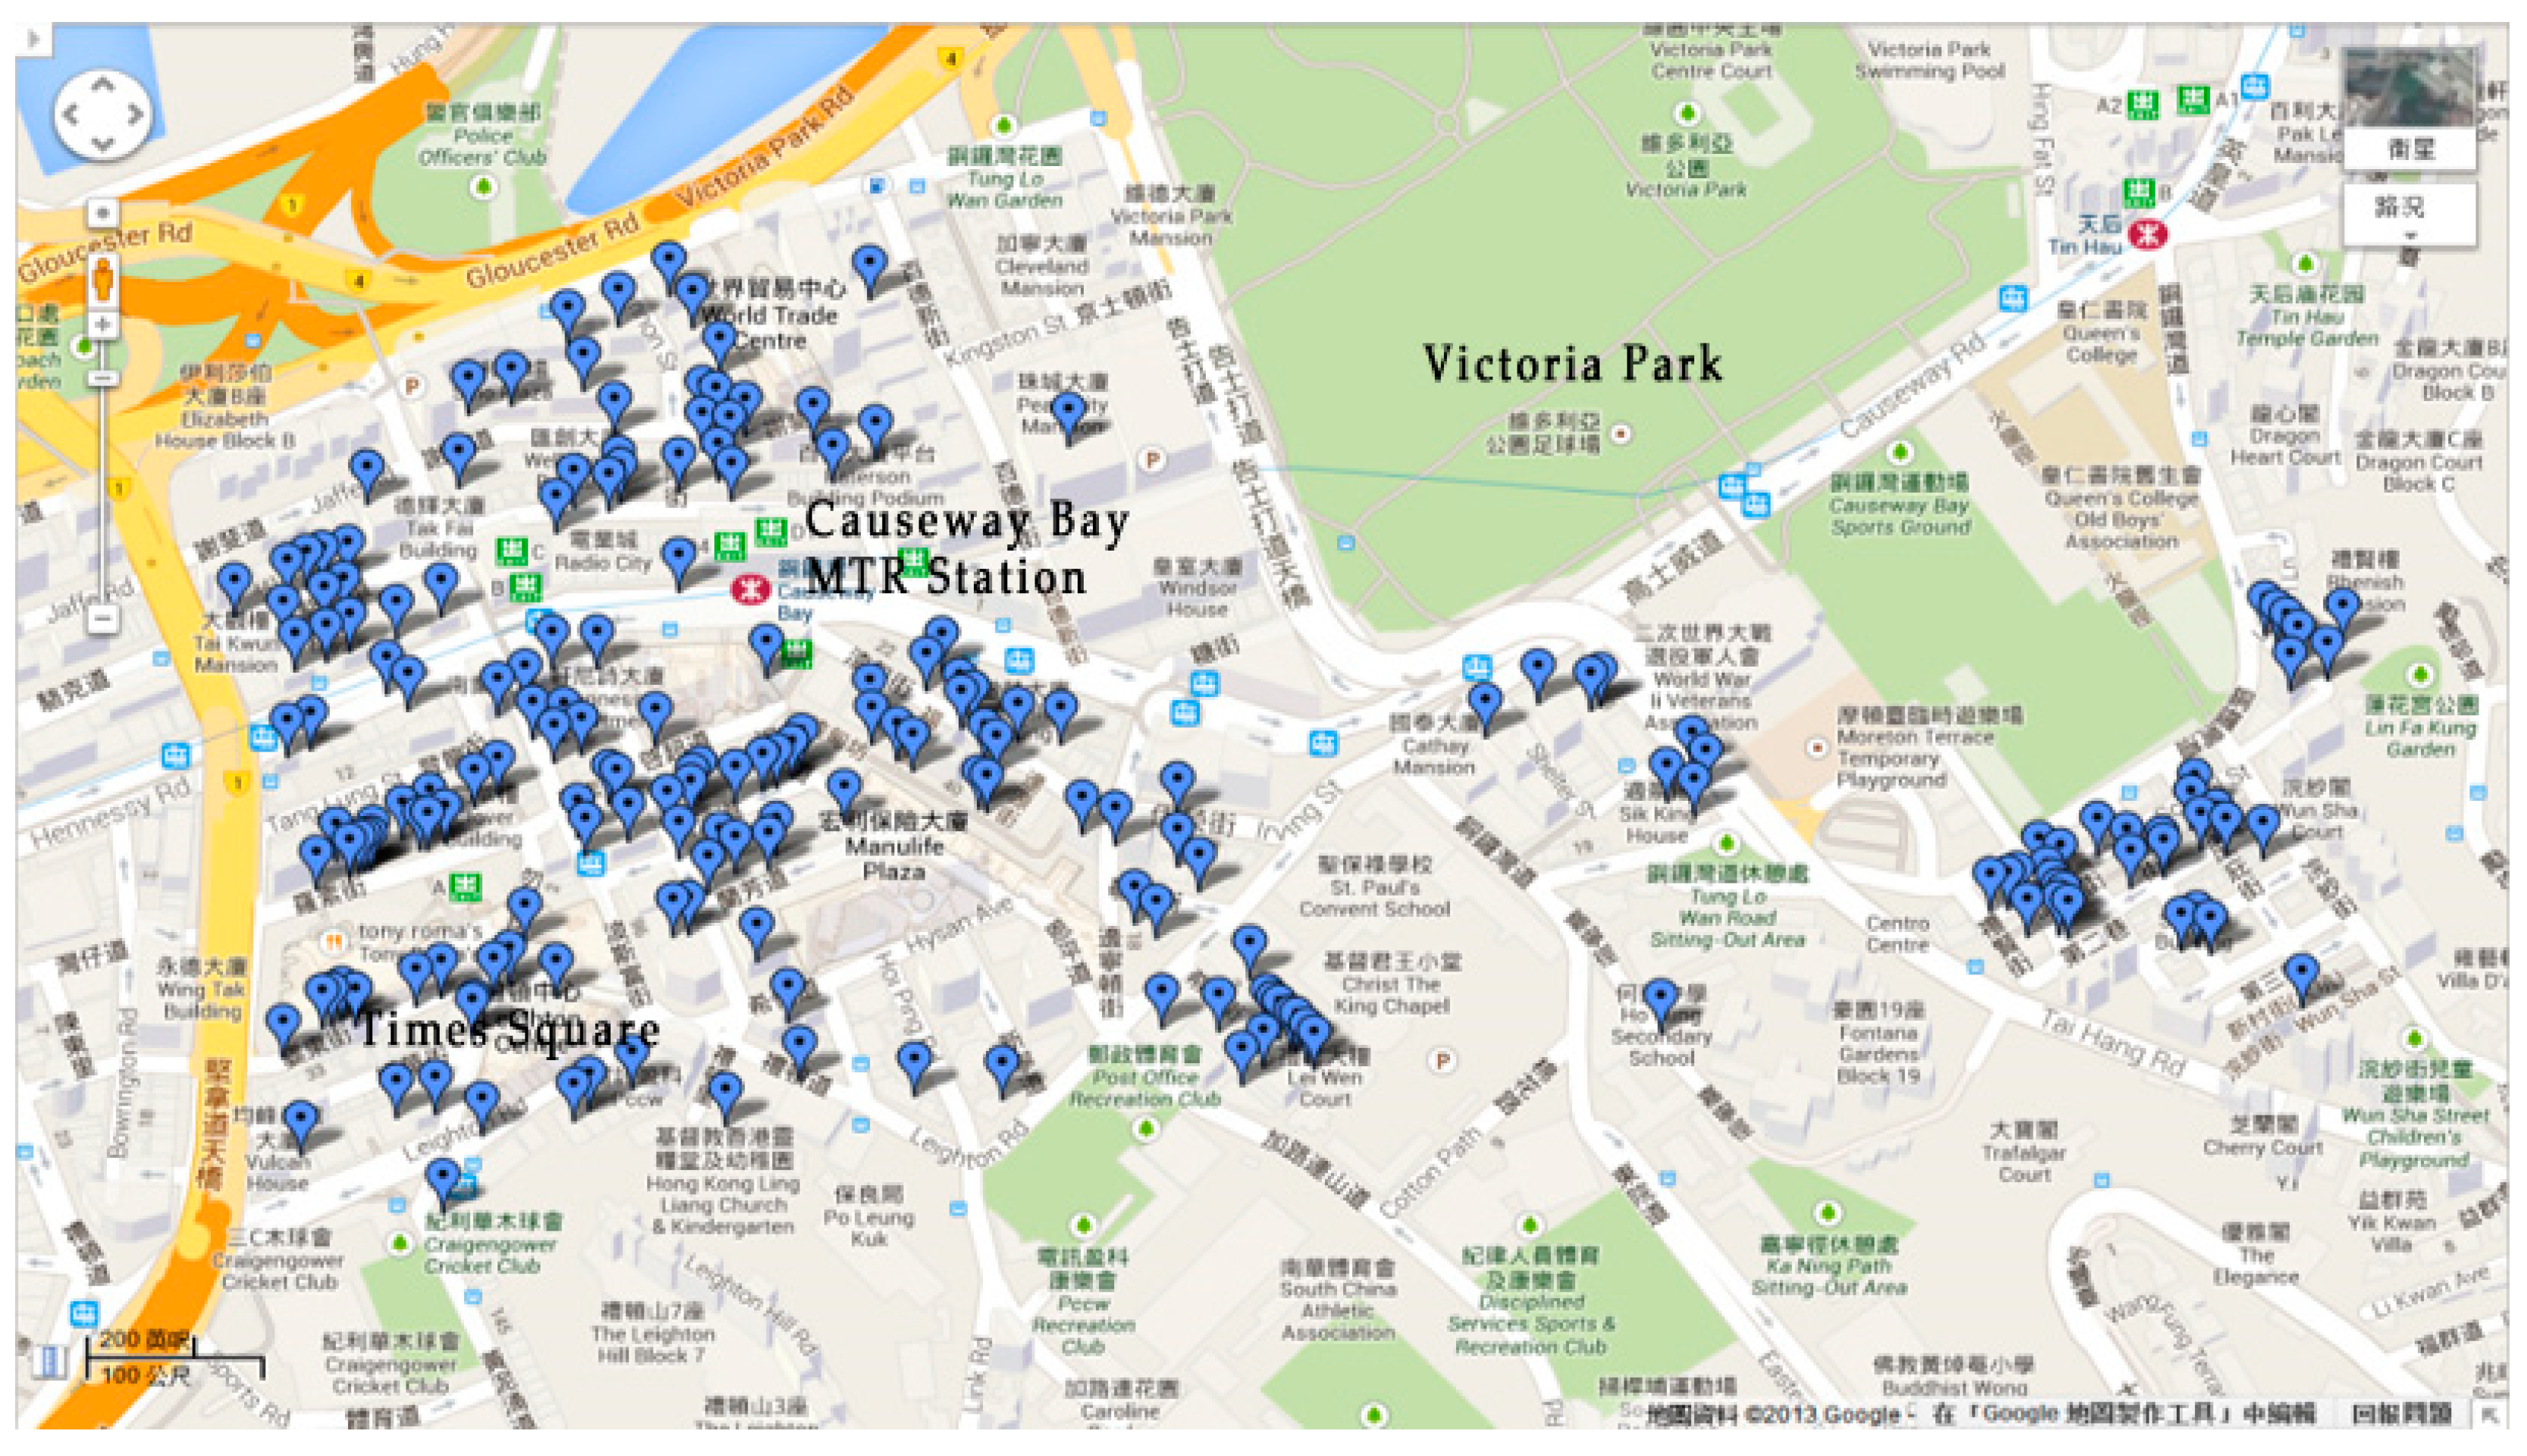
4.1. Data

To avoid the influence of numerous hard-to-control and even unobservable confounding attributes, especially locational and environmental attributes, on retail property prices, focusing on a small geographical area is better than the entire city and a large area (e.g., Hong Kong Island and Kowloon) [36,37]. According to Cushman and Wakefield that tracks retail property rentals in the world’s shopping locations (Source: https://www.cushmanwakefield.com/en/japan/news/2019/11/hong-kong-tops-global-ranking-of-most-expensive-shopping-streets), Causeway Bay is among the world’s most expensive retail property locations. Moreover, according to the Transport Department of Hong Kong [31], Causeway Bay attracts many trips of inbound tourists. Therefore, Causeway Bay, the area widely recognized as the tourist precinct of Hong Kong that has the long-known worldwide reputation “shopping paradise”, is chosen as the study area.
Transaction price rather than rental (which is used in a voluminous body of previous literature) of retail properties is used as the dependent variable in this study. The reasons are as follows: (1) the rental of retail properties is determined not only by property attributes but also by other factors including leasing terms and type of tenant [21]; and (2) the rental is often composed of minimum (or base) and overage (or percentage) rentals [38]. The feature makes property rental modeling extremely difficult. Understandably, obtaining the details of each rental contract is impractical. Moreover, there is no available lease-by-lease retail rental data in Hong Kong. Thus, transaction price is a more reliable, consistent, and available measure than rental, especially in the context of Hong Kong.
The transaction records of ground-floor retail properties in Causeway Bay within the period of 1993–2011 serve as our database. The transaction price data are purchased from the Economic Property Research Center (EPRC). The total number of retail property transaction observations during the time frame is 3806. After excluding observations with missing information, 580 transaction observations are left. The samples used for the subsequent analysis are mapped in Figure 1.

4.2. Variables

It is widely recognized that the property price is widely influenced by a multitude of variables. Independent variables used in existing hedonic literature are often categorized into three categories: structural (e.g., size and age), locational (e.g., access to the downtown), and neighborhood (e.g., landscape view and crime) [36]. In this study, the selection of variables is mainly informed by previous studies (e.g., [12,14,24,25]), while taking data availability into consideration. Mainland China is the largest sub-market for the Hong Kong tourism industry, and IVS tourist shoppers hold a great consumption capacity. Therefore, three IVS-relevant variables are incorporated into the retail property price modeling framework to test the three sets of hypotheses.
The detailed description of variables is listed in Table 1. The last three interaction variables are used for hypothesis testing.
Table 2 shows the summary statistics of the main variables. The area of the smallest retail property (which may be used as a fruit or take-away beverage shop) is only 5 m2. In addition to the property price data from the EPRC, other data were collected from the Hong Kong Tourism Board, the Census and Statistics and the Rating and Valuation Departments of Hong Kong. Moreover, we manually collected the frontage length with a laser measurer during site visits.

5. Methodology

It is widely documented that the price of a property is influenced by the attributes of the property, such as gross floor area, age, transportation accessibility, and landscape view. The (traditional) hedonic pricing model is an extensively-adopted reveal-preference method for quantifying the contributions of various characteristics, from which utility is derived, to the prices of heterogeneous goods (e.g., properties) sold in a particular market [39,40,41,42,43,44]. The hedonic pricing model assumes that implicit prices (or hedonic prices) for each characteristic of a good can be decomposed into prices of a set of observable attributes [45] and estimated by observing purchasers’ willingness to pay.
The model can be expressed as follows.
Y = α l n + X β + ε ,
where Y denotes an n × 1 vector of property price; n is the number of observations; l n is an n × 1 vector of ones associated with the constant α; X is an n × k matrix of hedonic characteristics of the property (e.g., size, age, and distance to the nearest transit station); β is a k × 1 vector of coefficients; and ε is an n × 1 vector of random error terms that follow a normal distribution. α and β are parameters to be jointly estimated by the ordinary least squares (OLS) method.
Spatial autocorrelation (or spatial dependence) always exists in the real estate market [46]. Related explanations include but are not limited to spatial externality, external force, and spatial interaction [47,48]. Ignoring the presence of spatial autocorrelation would lead to biased and inconsistent parameter estimates. The traditional, plain linear regression that cannot tackle spatial effects (e.g., spatial autocorrelation and spatial heterogeneity) is not as acceptable as it used to be in spatial data modeling [49,50,51,52,53].
A host of spatial econometric models, such as the spatial lag model (SLM), the spatial error model (SEM), and the spatial Durbin model (SDM), can address the spatial autocorrelation issue, and they have been widely used to explain the relationship between property prices and property characteristics [54,55,56,57,58]. The SLM and the SEM are two basic spatial econometric models and focus on the endogenous interaction relationship (or spatial interaction in the dependent variable) and the correlated relationship (or spatial interaction in the error term), respectively. They, however, cannot address the exogenous interaction relationship (or spatial interaction in independent variables) [59].
The SDM jointly considers the spatial dependence of the dependent variable and that of independent variables [57,58,60,61] and allows for prices and hedonic characteristics of nearby properties to shape the price of a specific property. The SDM is proved to outperform the two basic models (the SLM and the SEM) and even regarded as “the only means of producing unbiased coefficient estimates” (p. 26) [61]. The SDM can be specified as follows:
Y = ρ W Y + α l n + X β + W X θ + ε ,
where W is an n × n spatial weight matrix, exogenously defined by either contiguity or distance; WY is the spatially lagged property price; ρ is the spatial autoregressive parameter, representing the price effect of WY; WX is the spatially lagged hedonic characteristics; θ is a k × 1 vector of coefficients, reflecting the price effects of WX; and other variables are as defined before. α, β, ρ, and θ are parameters to be jointly determined by the maximum likelihood estimation method. ρWY and WXθ capture endogenous and exogenous interaction relationships, respectively.

6. Results

A pairwise correlation matrix was first calculated to showcase the correlation between the independent variables. Results (not shown here) show that multi-collinearity is not an issue for the data.
Table 3 lists the OLS estimation results. Most of the variables perform as expected. The model can explain approximately 56% of the variation in retail property prices. The goodness of fit value is acceptable for the limited sample size (N = 580).
A Moran’s I test is undertaken for testing the spatial autocorrelation in the data. Results illustrate that the spatial autocorrelation is significant (Moran’s I value = 0.128, p < 0.001) and thus reject the null hypothesis (no spatial dependence exists). The results are highly consistent with the majority of, though not all, hedonic studies. As such, the traditional hedonic pricing model that fails to incorporate spatial autocorrelation is deemed to be inappropriate as it produces biased results, which should be interpreted with caution. We opt for spatial econometric models in subsequent analysis.
After comparing the performance of the SDM and the other two basic spatial econometric models (i.e., the SLM and the SEM), we find that the SDM performs best, which concurs with existing literature. Table 4 shows coefficient estimates of the SDM. Results illustrate that the SDM fit the data modestly better than the traditional hedonic pricing model (see Table 3); or that directly incorporating spatial effects increases the explanatory power of the model. By comparing Table 3 and Table 4, we find that OLS regression is biased and may either overestimate or underestimate the coefficients associated with independent variables. Furthermore, the spatial autoregressive parameter ( ρ ) is significant at the 1% level and has a positive sign. This result indicates the presence of spatial autocorrelation and agrees with a priori expectations.
Table 5 reveals direct, indirect (or spillover), and total effects of hedonic variables. A total of 10 variables (e.g., AGE, LnMTR, and LnMALL) have spatial spillover effects on retail property prices. This finding supports the notion that the price of a property is affected by the prices and characteristics of nearby properties.
The following interpretations are simply based on total effects. “AGE”, “SIZE”, and “FRON” are classified as structural attributes. The price effect of “SIZE” is positive and significant, whereas that of “SIZE2” is negative and significant. This observation shows that an inverted-U (non-linear) relationship exists between size and property prices (in natural logarithm form). Moreover, the price effect of “FRON” is insignificant in this empirical study. A possible reason for this outcome is the limited sample size (N = 580).
For locational attributes, the price effect of “LnMTR” is insignificant at the 10% level, indicating that MTR accessibility is too weak to shape (or determine) retail property prices before the implementation of the IVS. In addition, the price effect of “LnMALL” is negative and significant at the 10% level. This result means that accessibility to shopping malls is positively associated with retail property prices. Furthermore, the price effect of “CORN” is positive and significantly different from zero at the 1% level. This observation implies that the street corner location is positively correlated with retail property prices, consistent with a priori expectations and existing literature [62]. A possible explanation is that the street corner location can attract more spotlights from potential customers [25,62].
For neighborhood and other variables, “ACM”, which reflects the cumulative opportunities of accommodation facilities, has a positive price effect before the implementation of the IVS, whereas “ACM2” has an insignificant price effect. This outcome is reasonable and indicates a positive linear relationship between accessibility to accommodation facilities and retail property prices (in natural logarithm form). It can be explained by the fact that retail properties with better accessibility to accommodation facilities are more likely to be patronized by tourist shoppers. Moreover, regarding the vertical neighborhood use variables, “UCU” and “URU” have significant negative and positive price effects, respectively. However, “UOU” is insignificant at the 10% level. Furthermore, “IVS” is significant at the 5% level, and its price effect holds a positive sign. This finding confirms the significant positive price effect of the IVS (which introduces numerous mainland Chinese tourist shoppers) in Causeway Bay and is consistent with [12].
Interpretations of the three interaction terms that are directly related to hypothesis testing are of predominant interest in this study. The summary of the corresponding results is shown in Table 6. First, the price effect of “IVS×LnMTR” is negative and significant at the 5% level, which verifies H1. This outcome indicates that after the implementation of the IVS, MTR accessibility has been more valued and is associated with higher retail property prices. This finding and is consistent with previous research. Second, the price effect of “IVS×ACM” is insignificantly different from zero, which contrasts H2A but confirms H2B. This means that the economic value of accessibility to accommodation facilities is not significantly altered by the implementation of the IVS. Last, the price effect of “IVS×AGE” is negative and significant at the 5% level, which verifies H3 and agrees with existing literature [12].

7. Conclusions

This study investigates the impact of the increase in tourist shoppers on the prices of retail properties in the tourist precinct of Hong Kong (a typical shopping destination where tourists allocate a high budget for shopping during their trips). Based on previous studies [12,14] and relevant theories [19,33,34,35], three sets of hypotheses related to economic and psychological concerns are developed. This study makes use of the implementation of the policy IVS in Hong Kong in 2003 and the transaction records of ground-floor retail properties in Causeway Bay during 1993–2011 to test these hypotheses. Notably, due to the presence of spatial autocorrelation, conventional hedonic price models may lead to biased results. This study solves this problem by employing a widely-used spatial econometric technique, namely the spatial Durbin model. Our findings are listed as follows. (1) Ground-floor retail property prices are spatially correlated. (2) The implementation of the IVS has a positive impact on retail property prices. (3) The implicit price of accessibility to transit increases after the implementation of the IVS. (4) The implicit price of accessibility to accommodation facilities is not significantly altered by the implementation of the IVS. (5) Age has a larger negative price effect after the implementation of the IVS. This outcome can be related to the hometown experience of tourist shoppers.
This study advances our understanding of the interaction between tourism demand and retail property prices in a shopping destination and enriches or supplements the existing literature on this topic [12,13,14]. Moreover, our empirical results can have significant practical implications. Tourism policy-makers and practitioners can improve the physical environment of shopping spaces, which can greatly attract more potential consumers. Public sectors can organize regular refurbishment in the core areas of a tourist destination to enhance the attractiveness of the destination. Retail practitioners can invest in newer retail shops to pursue higher returns. These implications are believed to be applied to other shopping destinations with an increasing volume of tourists.
The study makes a small step towards the exploration of possible interactions between the tourism industry and the retail real estate market. Indeed, several future research directions exist. We point out two: (1) analyzing how changes in the local-tourist shopper mix affect the dynamics of the rental and vacancy adjustment in the retail space market using time series or panel data; and (2) examining the determination of the equilibrium retail property price as a result of change in macro-economic variables of the tourism industry.
There are a few limitations in this study. First, to test the three sets of hypotheses, this study focuses on a small geographical area (i.e., Causeway Bay) instead of the whole city or a large area (e.g., Hong Kong Island and Kowloon) [14,36,37,63]. The area is carefully selected by the authors (see Section 4.1 for justifications). This economically rigorous approach helps statistically control for numerous locational and neighborhood attributes (e.g., accessibility to Luohu Port, Lok Ma Chau Port, and Shenzhen Bay Port) and thus largely relieves, though definitely does not eliminate, a much-derided problem of hedonic pricing, namely missing variable bias. Admittedly, it is far from perfect and suffers from the following two distinct shortcomings: (1) generalization or transferability of the results and (2) limited sample size. The number of observations used for analysis (N = 580) is much less than that for a wider area, which may to some extent distort the results. Therefore, we suggest that more empirical studies on this topic should be conducted, which is indispensable to reach stronger conclusions. Second, this study only links tourism demand to the retail trade. Understandably, the wholesale trade is also expected to be affected by tourism demand. Analyzing their interaction is interesting and fascinating, but it cannot be completed by this study because the wholesale trade of Hong Kong is normally not conducted in Causeway Bay. We suggest that it should be explored in upcoming research.

Author Contributions

Conceptualization, Y.L., K.W.C., and L.Y.; methodology, Y.L., K.W.C., and L.Y.; software, Y.L.; validation, K.W.C.; formal analysis, Y.L.; writing—original draft preparation, Y.L. and L.Y.; writing—review and editing, K.W.C.; supervision, K.W.C.; project administration, K.W.C.; and funding acquisition, Y.L. All authors have read and agreed to the published version of the manuscript.

Funding

This study was supported by Humanities and Social Sciences Research Fund of Ministry of Education of China (No. 18YJC630105), Social Science Fund of Chengdu (No. 2019R11), and Regional Public Administration Informatization Research Center of Sichuan (No. QGXH17-08).

Acknowledgments

The authors are grateful to the editor and the three reviewers for their helpful comments.

Conflicts of Interest

The authors declare no conflicts of interest.

References

  1. Biagi, B.; Brandano, M.G.; Lambiri, D. Does tourism affect house prices? Evidence from Italy. Growth Chang. 2015, 46, 501–528. [Google Scholar] [CrossRef]
  2. UNWTO. International Tourism Highlights, 2019 ed.; UNWTO: Madrid, Spain, 2019. [Google Scholar]
  3. Xu, Y.; McGehee, N.G. Shopping behavior of Chinese tourists visiting the United States: Letting the shoppers do the talking. Tour. Manag. 2012, 33, 427–430. [Google Scholar] [CrossRef]
  4. Choi, M.; Law, R.; Heo, C.Y. Shopping destinations and trust–tourist attitudes: Scale development and validation. Tour. Manag. 2016, 54, 490–501. [Google Scholar] [CrossRef]
  5. Pantano, E.; Dennis, C. Store buildings as tourist attractions: Mining retail meaning of store building pictures through a machine learning approach. J. Retail. Consum. Serv. 2019, 51, 304–310. [Google Scholar] [CrossRef]
  6. Murphy, L.; Moscardo, G.; Benckendorff, P.; Pearce, P. Evaluating tourist satisfaction with the retail experience in a typical tourist shopping village. J. Retail. Consum. Serv. 2011, 18, 302–310. [Google Scholar] [CrossRef]
  7. Meng, F.; Xu, Y. Tourism shopping behavior: Planned, impulsive, or experiential? Int. J. Cult. Tour. Hosp. Res. 2012, 6, 250–265. [Google Scholar] [CrossRef]
  8. Zaidan, E.A. Tourism shopping and new urban entertainment: A case study of Dubai. J. Vacat. Mark. 2016, 22, 29–41. [Google Scholar] [CrossRef]
  9. Bao, Z.; Lu, W.; Chi, B.; Yuan, H.; Hao, J. Procurement innovation for a circular economy of construction and demolition waste: Lessons learnt from Suzhou, China. Waste Manag. 2019, 99, 12–21. [Google Scholar] [CrossRef]
  10. Yeung, S.; Wong, J.; Ko, E. Preferred shopping destination: Hong Kong versus Singapore. Int. J. Tour. Res. 2004, 6, 85–96. [Google Scholar] [CrossRef]
  11. Hong Kong Tourism Board. A Statistical Review of Hong Kong Tourism; Hong Kong Tourism Board: Hong Kong, China, 2018.
  12. Li, L.-H.; Cheung, K.S.; Han, S.Y. The impacts of cross-border tourists on local retail property market: An empirical analysis of Hong Kong. J. Prop. Res. 2018, 35, 252–270. [Google Scholar] [CrossRef]
  13. Yang, L.; Chau, K.W.; Lu, Y.; Cui, X.; Meng, F.; Wang, X. Locale-varying relationships between tourism development and retail property prices in a shopping destination. Int. J. Strateg. Prop. Manag. 2020, in press. [Google Scholar]
  14. Jayantha, W.M.; Yung, E.H.K. Effect of Revitalisation of Historic Buildings on Retail Shop Values in Urban Renewal: An Empirical Analysis. Sustainability 2018, 10, 1418. [Google Scholar] [CrossRef] [Green Version]
  15. Litirell, M.A.; Baizerman, S.; Kean, R.; Gahring, S.; Niemeyer, S.; Reilly, R.; Stout, J. Souvenirs and tourism styles. J. Travel Res. 1994, 33, 3–11. [Google Scholar] [CrossRef]
  16. Oh, J.Y.-J.; Cheng, C.K.; Lehto, X.Y.; O’Leary, J.T. Predictors of tourists’ shopping behaviour: Examination of socio-demographic characteristics and trip typologies. J. Vacat. Mark. 2004, 10, 308–319. [Google Scholar] [CrossRef]
  17. Lloyd, A.E.; Yip, L.S.; Luk, S.T. An examination of the differences in retail service evaluation between domestic and tourist shoppers in Hong Kong. Tour. Manag. 2011, 32, 520–533. [Google Scholar] [CrossRef]
  18. Zeithaml, V.A. Consumer perceptions of price, quality, and value: A means-end model and synthesis of evidence. J. Mark. 1988, 52, 2–22. [Google Scholar] [CrossRef]
  19. Lindquist, J.D. Meaning of image: A survey of empirical and hypothetical evidence. J. Retail. 1974, 50, 29–38. [Google Scholar]
  20. Christiansen, T.; Snepenger, D.J. Is it the mood or the mall that encourages tourists to shop? J. Shop. Center Res. 2002, 9, 7–26. [Google Scholar]
  21. Benjamin, J.D.; Boyle, G.W.; Sirmans, C. Retail leasing: The determinants of shopping center rents. Real Estate Econ. 1990, 18, 302–312. [Google Scholar] [CrossRef]
  22. Iii, W.G.H.; Wolverton, M.L. Neighborhood Center Image and Rents. J. Real Estate Financ. Econ. 2001, 23, 31–46. [Google Scholar]
  23. Brown, G.R.; Chau, K.W. Excess returns in the Hong Kong commercial real estate market. J. Real Estate Res. 1997, 14, 91–106. [Google Scholar]
  24. Sirmans, C.F.; Guidry, K.A. The determinants of shopping center rents. J. Real Estate Res. 1993, 8, 107–116. [Google Scholar]
  25. Chau, K.W.; Pretorius, F.; Yu, C.K. The determinants of street level retail shop prices in Hong Kong. In Proceedings of the Pacific Rim Real Estate Society Conference, Sydney, Australia, 23–27 January 2000. [Google Scholar]
  26. Li, Y.; Yang, L.; Shen, H.; Wu, Z. Modeling intra-destination travel behavior of tourists through spatio-temporal analysis. J. Dest. Mark. Manag. 2019, 11, 260–269. [Google Scholar] [CrossRef]
  27. Xu, W.A.; Zhou, J.; Yang, L.; Li, L. The implications of high-speed rail for Chinese cities: Connectivity and accessibility. Transp. Res. Part A Policy Pract. 2018, 116, 308–326. [Google Scholar]
  28. Xu, W.A.; Yang, L. Evaluating the urban land use plan with transit accessibility. Sustain. Cities Soc. 2019, 45, 474–485. [Google Scholar] [CrossRef]
  29. Seiders, K.; Berry, L.L.; Gresham, L.G. Attention, retailers! How convenient is your convenience strategy? MIT Sloan Manag. Rev. 2000, 41, 79–89. [Google Scholar]
  30. Kang, C.-D. Spatial access to pedestrians and retail sales in Seoul, Korea. Habitat Int. 2016, 57, 110–120. [Google Scholar] [CrossRef]
  31. Transport Department. Travel Characteristics Surveys 2011 Final Report; Hong Kong Transport Department: Hong Kong, China, 2014.
  32. Simon, D. Inherent complexity: Disability, accessible tourism and accommodation information preferences. Tour. Manag. 2010, 31, 816–826. [Google Scholar]
  33. Pierce, W.D.; Cheney, C.D. Behavior Analysis and Learning; Psychology Press: London, UK, 2013. [Google Scholar]
  34. Gollwitzer, P.M.; Heckhausen, H.; Ratajczak, H. From weighing to willing: Approaching a change decision through pre- or postdecisional mentation. Organ. Behav. Hum. Decis. Process. 1990, 45, 41–65. [Google Scholar] [CrossRef]
  35. Wimmer, G.E.; Shohamy, D. Preference by association: How memory mechanisms in the hippocampus bias decisions. Science 2012, 338, 270–273. [Google Scholar] [CrossRef] [Green Version]
  36. Yang, L.; Chau, K.W.; Chu, X. Accessibility-based premiums and proximity-induced discounts stemming from bus rapid transit in China: Empirical evidence and policy implications. Sustain. Cities Soc. 2019, 48, 101561. [Google Scholar] [CrossRef]
  37. Wong, S.K.; Chau, K.W.; Yau, Y.; Cheung, A.K.C. Property price gradients: The vertical dimension. J. Hous. Built Environ. 2011, 26, 33–45. [Google Scholar] [CrossRef] [Green Version]
  38. Eppli, M.; Benjamin, J. The evolution of shopping center research: A review and analysis. J. Real Estate Res. 1994, 9, 5–32. [Google Scholar]
  39. Chau, K.W.; Wong, S.K.; Yiu, C.Y.; Leung, H.F. Real estate price indices in Hong Kong. J. Real Estate Lit. 2005, 13, 337–356. [Google Scholar]
  40. Chau, K.W.; Chin, T. A critical review of literature on the hedonic price model. Int. J. Hous. Sci. Appl. 2003, 27, 145–165. [Google Scholar]
  41. Zhang, D.; Jiao, J. How Does Urban Rail Transit Influence Residential Property Values? Evidence from An Emerging Chinese Megacity. Sustainability 2019, 11, 534. [Google Scholar] [CrossRef] [Green Version]
  42. Perez-Sanchez, V.R.; Serrano-Estrada, L.; Marti, P.; Mora-Garcia, R.-T. The What, Where, and Why of Airbnb Price Determinants. Sustainability 2018, 10, 4596. [Google Scholar] [CrossRef] [Green Version]
  43. Ye, Y.; Xie, H.; Fang, J.; Jiang, H.; Wang, D. Daily Accessed Street Greenery and Housing Price: Measuring Economic Performance of Human-Scale Streetscapes via New Urban Data. Sustainability 2019, 11, 1741. [Google Scholar] [CrossRef] [Green Version]
  44. Xiao, Y.; Lu, Y.; Guo, Y.; Yuan, Y. Estimating the willingness to pay for green space services in Shanghai: Implications for social equity in urban China. Urban For. Urban Green. 2017, 26, 95–103. [Google Scholar] [CrossRef]
  45. Rosen, S. Hedonic prices and implicit markets: Product differentiation in pure competition. J. Political Econ. 1974, 82, 34–55. [Google Scholar] [CrossRef]
  46. Anselin, L. Lagrange multiplier test diagnostics for spatial dependence and spatial heterogeneity. Geogr. Anal. 1988, 20, 1–17. [Google Scholar] [CrossRef]
  47. Wong, S.K.; Yiu, C.Y.; Chau, K.W. Trading volume-induced spatial autocorrelation in real estate prices. J. Real Estate Financ. Econ. 2013, 46, 596–608. [Google Scholar] [CrossRef] [Green Version]
  48. Li, C.W.; Wong, S.K.; Chau, K.W. An analysis of spatial autocorrelation in Hong Kong’s housing market. Pac. Rim Prop. Res. J. 2011, 17, 443–462. [Google Scholar]
  49. Cao, X.J.; Hough, J.A. Hedonic value of transit accessibility: An empirical analysis in a small urban area. J. Transp. Res. Forum 2008, 47, 171–183. [Google Scholar] [CrossRef]
  50. Cao, X.J.; Lou, S. When and how much did the green line LRT increase single-family housing values in St. Paul, Minnesota? J. Plan. Educ. Res. 2018, 38, 427–436. [Google Scholar] [CrossRef]
  51. Xu, P.; Huang, H. Modeling crash spatial heterogeneity: Random parameter versus geographically weighting. Accid. Anal. Prev. 2015, 75, 16–25. [Google Scholar] [CrossRef]
  52. Xu, P.; Huang, H.; Dong, N.; Wong, S.C. Revisiting crash spatial heterogeneity: A Bayesian spatially varying coefficients approach. Accid. Anal. Prev. 2017, 98, 330–337. [Google Scholar] [CrossRef] [Green Version]
  53. Yang, H.; Zhang, Y.; Zhong, L.; Zhang, X.; Ling, Z. Exploring spatial variation of bike sharing trip production and attraction: A study based on Chicago’s Divvy system. Appl. Geogr. 2020, 115, 102130. [Google Scholar] [CrossRef]
  54. Zhong, H.; Li, W. Rail transit investment and property values: An old tale retold. Transp. Policy 2016, 51, 33–48. [Google Scholar] [CrossRef]
  55. Lan, H.; Cheng, B.; Gou, Z.; Yu, R. An evaluation of feed-in tariffs for promoting household solar energy adoption in Southeast Queensland, Australia. Sustain. Cities Soc. 2020, 53, 101942. [Google Scholar] [CrossRef]
  56. Zhou, L.; Tian, L.; Gao, Y.; Ling, Y.; Fan, C.; Hou, D.; Shen, T.; Zhou, W. How did industrial land supply respond to transitions in state strategy? An analysis of prefecture-level cities in China from 2007 to 2016. Land Use Policy 2019, 87, 104009. [Google Scholar] [CrossRef]
  57. Hui, E.C.M.; Liang, C. Spatial spillover effect of urban landscape views on property price. Appl. Geogr. 2016, 72, 26–35. [Google Scholar] [CrossRef]
  58. Chen, Z.; Haynes, K.E. Impact of high speed rail on housing values: An observation from the Beijing–Shanghai line. J. Transp. Geogr. 2015, 43, 91–100. [Google Scholar] [CrossRef]
  59. Manski, C.F. Identification of endogenous social effects: The reflection problem. Rev. Econ. Stud. 1993, 60, 531–542. [Google Scholar] [CrossRef] [Green Version]
  60. LeSage, J.P.; Dominguez, M. The importance of modeling spatial spillovers in public choice analysis. Public Choice 2012, 150, 525–545. [Google Scholar] [CrossRef]
  61. Elhorst, J.P. Applied spatial econometrics: Raising the bar. Spat. Econ. Anal. 2010, 5, 9–28. [Google Scholar] [CrossRef]
  62. Nase, I.; Berry, J.; Adair, A. Hedonic modelling of high street retail properties: A quality design perspective. J. Prop. Invest. Financ. 2013, 31, 160–178. [Google Scholar] [CrossRef]
  63. Brasington, D.M. The supply of public school quality. Econ. Edu. Rev. 2003, 22, 367–377. [Google Scholar] [CrossRef]
Figure 1. Geographical location of retail property samples.
Sustainability 12 01361 g001
Table 1. Variables and description.
VariableDescriptionExpected
Sign
Remark
LnPLogarithm of transaction price (in natural logarithm form) (HK$)NADependent Variable
AGE(year)?Control
SIZESize or gross floor area (m2)+Control
SIZE2Square term of SIZE?Control
FRONLength of frontage facing the street (m)+Control
LnMTRLogarithm of distance to the nearest MTR station exit (m) (in natural logarithm form)Control
LnMALLLogarithm of distance to the nearest shopping mall (m) (in natural logarithm form)Control
CORNDummy variable, 1 if the property is located in the street corner and 0 otherwise+Control
ACMNumber of hotels and guesthouses within the 250m radius+Control
ACM2Square term of ACMControl
UCUDummy variable, 1 if the property’s upper story is commercial use and 0 otherwise+Control
UOUDummy variable, 1 if the property’s upper story is office use and 0 otherwise+Control
URUDummy variable, 1 if the property’s upper story is residential use and 0 otherwise+Control
LnINDEXPrivate Retail Prices Index (1999=100) (in natural logarithm form)+Control
OTHERSNumber of non-IVS visitors+Control
IVSNumber of visitors under the IVS+Control
IVS × LnMTRInteraction between IVS and LnMTRH1
IVS×ACMInteraction between IVS and ACM+H2A and H2B
IVS×AGEInteraction between IVS and AGEH3
Table 2. Descriptive statistics of continuous variables.
VariableACMAGEFRONINDEXIVSLnMTRLnMALLPRICEOTHERSSIZE
Mean20.6532.494.23152.87358.935.445.66122.241300.7359.41
Median1634.213.7138.5627.985.355.6773.341353.8245.06
Max.5453.522.76344.61786.256.557787.412175.31656.08
Min.00.43079.402.642.42.41427.255.02
Std. Dev.14.8311.453.0560.29463.990.670.68128.89390.3658.5
Notes: Prices are at 1999 constant price levels.
Table 3. Coefficient estimates of the OLS model.
VariableCoefficientt-Statisticp-Value
AGE−0.0002−0.0410.968
SIZE0.0151 ***11.1260.000
SIZE2−0.00002 ***−7.0080.000
FRON−0.7949 **2.1750.030
LnMTR−0.1115 ***−6.3790.000
LnMALL0.0511−0.8930.372
CORN−0.0008 **2.2820.023
ACM0.0352 ***5.1020.000
ACM20.2395 ***−4.2150.000
UCU−0.3118 *−1.8960.059
UOU0.39631.5060.133
URU−0.0819−0.9410.347
LnINDEX−0.0461−0.2570.797
OTHERS0.21161.1730.241
IVS−1.1021−1.3940.164
IVS×LnMTR−0.0032−0.4560.649
IVS×ACM0.2297 *1.8640.063
IVS×AGE0.00570.9040.366
Constant14.5565 ***13.0230.000
R-squared0.569
Adjusted R-squared0.555
Number of observations580
Notes: *** significant at the 1% level; ** significant at the 5% level; and * significant at the 10% level.
Table 4. Coefficient estimates of the SDM.
VariableCoefficientt-StatisticVariableCoefficientt-Statistic
AGE−0.0041−1.300W-AGE0.0302 ***8.698
SIZE0.0147 ***2.703W-SIZE0.0055 ***2.801
SIZE20.0000−0.012W-SIZE2−0.0001−0.032
FRON0.0281 ***414.103W-FRON0.0358 ***141.582
LnMTR−0.5319 ***−13.996W-LnMTR1.2102 ***13.298
LnMALL0.1117 ***2.708W-LnMALL−0.9153 ***−9.717
CORN0.2259 ***13.658W-CORN0.5342 ***12.462
ACM0.0212 ***4.598W-ACM0.0370 ***3.207
ACM2−0.0003−0.165W-ACM2−0.0004−0.148
UCU0.0413 ***3.944W-UCU−0.7653 ***−8.900
UOU0.7428 ***3.592W-UOU−1.9626 ***−3.782
URU−0.1577−1.500W-URU0.6691 ***8.676
LnINDEX−0.0397 ***−6.641W-LnINDEX0.4750 ***3.542
OTHERS0.1896 ***5.697W-OTHERS−0.0695 ***−4.316
IVS−1.2468 ***−10.602W-IVS14.1643 ***26.942
IVS×LnMTR0.2043 ***90.737W-IVS×LnMTR−1.9169 ***−181.821
IVS×ACM0.0103 ***10.276W-IVS×ACM−0.0490 ***−4.043
IVS×AGE0.00351.202W-IVS×AGE−0.0960 ***−14.666
Rho0.2780 ***16.383Constant3.915 ***85.369
R-squared0.662
Adjusted R-squared0.639
Number of observations580
Notes: *** significant at the 1% level.
Table 5. Direct, indirect, and total price effect estimates of the SDM.
VariableDirect Effect (t-Statistic)Indirect Effect (t-Statistic)Total Effect (t-Statistic)
AGE−0.0039 (−0.885)0.0411 * (1.821)0.0372 * (1.668)
SIZE0.0146 *** (11.863)0.0129 (1.143)0.0276 ** (2.461)
SIZE20.0000 *** (−7.558)−0.0001 ** (−2.443)−0.0001 *** (−2.908)
FRON0.0279 * (1.833)0.0670 (0.741)0.0949 (1.063)
LnMTR−0.5238 *** (−3.516)1.5536 * (1.836)1.0298 (1.262)
LnMALL0.1113 (0.674)−1.2839 * (−1.805)−1.1726 * (−1.823)
CORN0.2320 ** (2.503)0.8208 (1.438)1.0528 * (1.789)
ACM0.0214 (1.475)0.0611 (1.240)0.0825 * (1.787)
ACM2−0.0003 (−0.986)−0.0008 (−0.937)−0.0010 (−1.430)
UCU0.0456 (0.250)−1.0706 ** (−1.968)−1.0251 * (−1.801)
UOU0.7442 *** (2.899)−2.7011 * (−1.657)−1.9569 (−1.184)
URU−0.1609 (−1.538)0.8949 ** (2.084)0.7340 * (1.793)
LnINDEX−0.0417 (−0.261)0.6126 (0.555)0.5710 (0.504)
OTHERS0.1914 (1.195)−0.1213 (−0.086)0.0701 (0.049)
IVS−1.1895 * (−1.705)19.8424 ** (2.498)18.6529 ** (2.298)
IVS×LnMTR0.1960 * (1.775)−2.6588 ** (−2.237)−2.4628 ** (−2.011)
IVS×ACM0.0102 * (1.792)−0.0649 (−1.203)−0.0547 (−0.991)
IVS×AGE0.0032 (0.474)−0.1362 *** (−3.480)−0.1330 *** (−3.399)
Notes: *** significant at the 1% level; ** significant at the 5% level; and * significant at the 10% level.
Table 6. Summary of the three sets of hypotheses.
Theoretical BackgroundEconomic ConcernPsychological Implication
HypothesisH1H2A and H2BH3
Hedonic variableIVS×LnMTRIVS×ACMIVS×AGE
Expected sign-+/insignificant-
Test resultConfirmReject H2A and confirm H2BConfirm

