1. Introduction
China’s outward foreign direct investment (OFDI) in Africa has generate controversy in the West, both academic and policy circles. The West’s main concerns over Chinse investment include its big size, its focus on natural resources, and its disregard for quality institutions or good governance [
1,
2,
3]. The first concern stems largely from the sharp rise of Chinese OFDI in Africa in such a short period of time. Indeed, Chinese investment in Africa increased rapidly over 2003–2018, OFDI flows from
$0.07 billion to
$5.39 billion, and OFDI stock from
$0.49 billion to
$46.10 billion [
4]. These numbers, however, amount to only 5% of total foreign direct investment (FDI) stock into the continent by the end of 2018, and merely 2.9% of total China’s OFDI stock [
5]. The European Union economies, led by France and the UK, are the overwhelmingly largest investors in Africa. The US is also significant, and even South Africa invests more on the continent than China does [
6]. No doubt China’s investment is growing rapidly, but it still is relatively small.
The other two concerns seem to be clarified with much more systematically analyses. China’s involvement in Africa has become one of hot topics, as conveyed by some typical headlines from the Western press, as indicated by Brautigam [
1] and Dollar [
2,
3]: “Into Africa: China’s Wild Rush,” “China in Africa: Investment or Exploitation?” and “Clinton warns against ‘new colonialism’ in Africa.” As some studies point out [
7,
8,
9], Chinese investment indeed is attracted to natural resources, but no more so than Western investment. The allocation of Chinese investment overall seems to be indifferent to recipient countries’ property rights/rule of law, whereas Western investment tends to stay away from the poor governance environments. Since Chinese investment is equally distributed between good and poor governance environments, whereas Western investment is concentrated in the former, the share of Chinese investment in the poor governance environments tends to be high [
10]. What drives China’s OFDI in Africa? Are natural resources the only target of the Chinese firms? How important are institution factors to China’s OFDI in Africa? This paper attempts to work on the issues by conducting econometric regressions with panel data over 2003–2013.
There is a large body of the literature on determinations of overall China’s OFDI, and these studies have provided useful insights (e.g., [
11,
12,
13,
14,
15,
16,
17,
18]). Research on the presence of Chinese multinational corporations (MNCs) in Africa, however, has been limited but growing [
18]. These studies that focus on determinations of China’s OFDI in Africa may fall into two groups in terms of the work with or without econometric analyses. The first group of studies derives their conclusions mainly from qualitative and non-econometric analyses, including Brautigam [
1], Brautigam et al. [
8], Dollar [
2,
3], OECD [
6], and Zhang [
18]. There are only a few studies with formal econometric analyses in the second group (e.g., [
5,
6,
13]). Using the country-level data in 2003–2006, Kolstad & Wiig [
12] study determinations of China’s OFDI in 29 African countries. Based on a dataset in 2003–2007, Cheung et al. [
19] employ the Tobit regression technique and Heckman two-stage method in analyzing China’s OFDI behavior. Chen et al. [
9] examine factors behind Chinese firms’ investment decisions in Africa with the firm-level data in 1998–2011. The paucity of quality data on both the Chinese OFDI and Africa’s location-institution characteristics is perhaps a major hurdle for formal econometric analyses.
Aiming at closing the gap, this study has several distinct features. First, it employs and modifies a theoretical framework that focuses on the role of resource-based location advantages and institution-based advantages in China’s OFDI in Africa. Second, it develops a straightforward empirical model that consist of three specifications of China’s OFDI in Africa: host-country resource-based drivers, host-country institution-based drivers, and home-country institution drivers. Third, the panel data used include host countries as many as possible and cover the period that is from China’s OFDI starting to rise to the latest year that data are available. Fourth, it takes a close look at effects of three groups of OFDI drivers: natural resources vs. market size, host institutions, and home institutions. Last, it conducts several tests to check if the estimation results are robust.
2. China’s Investment in Africa
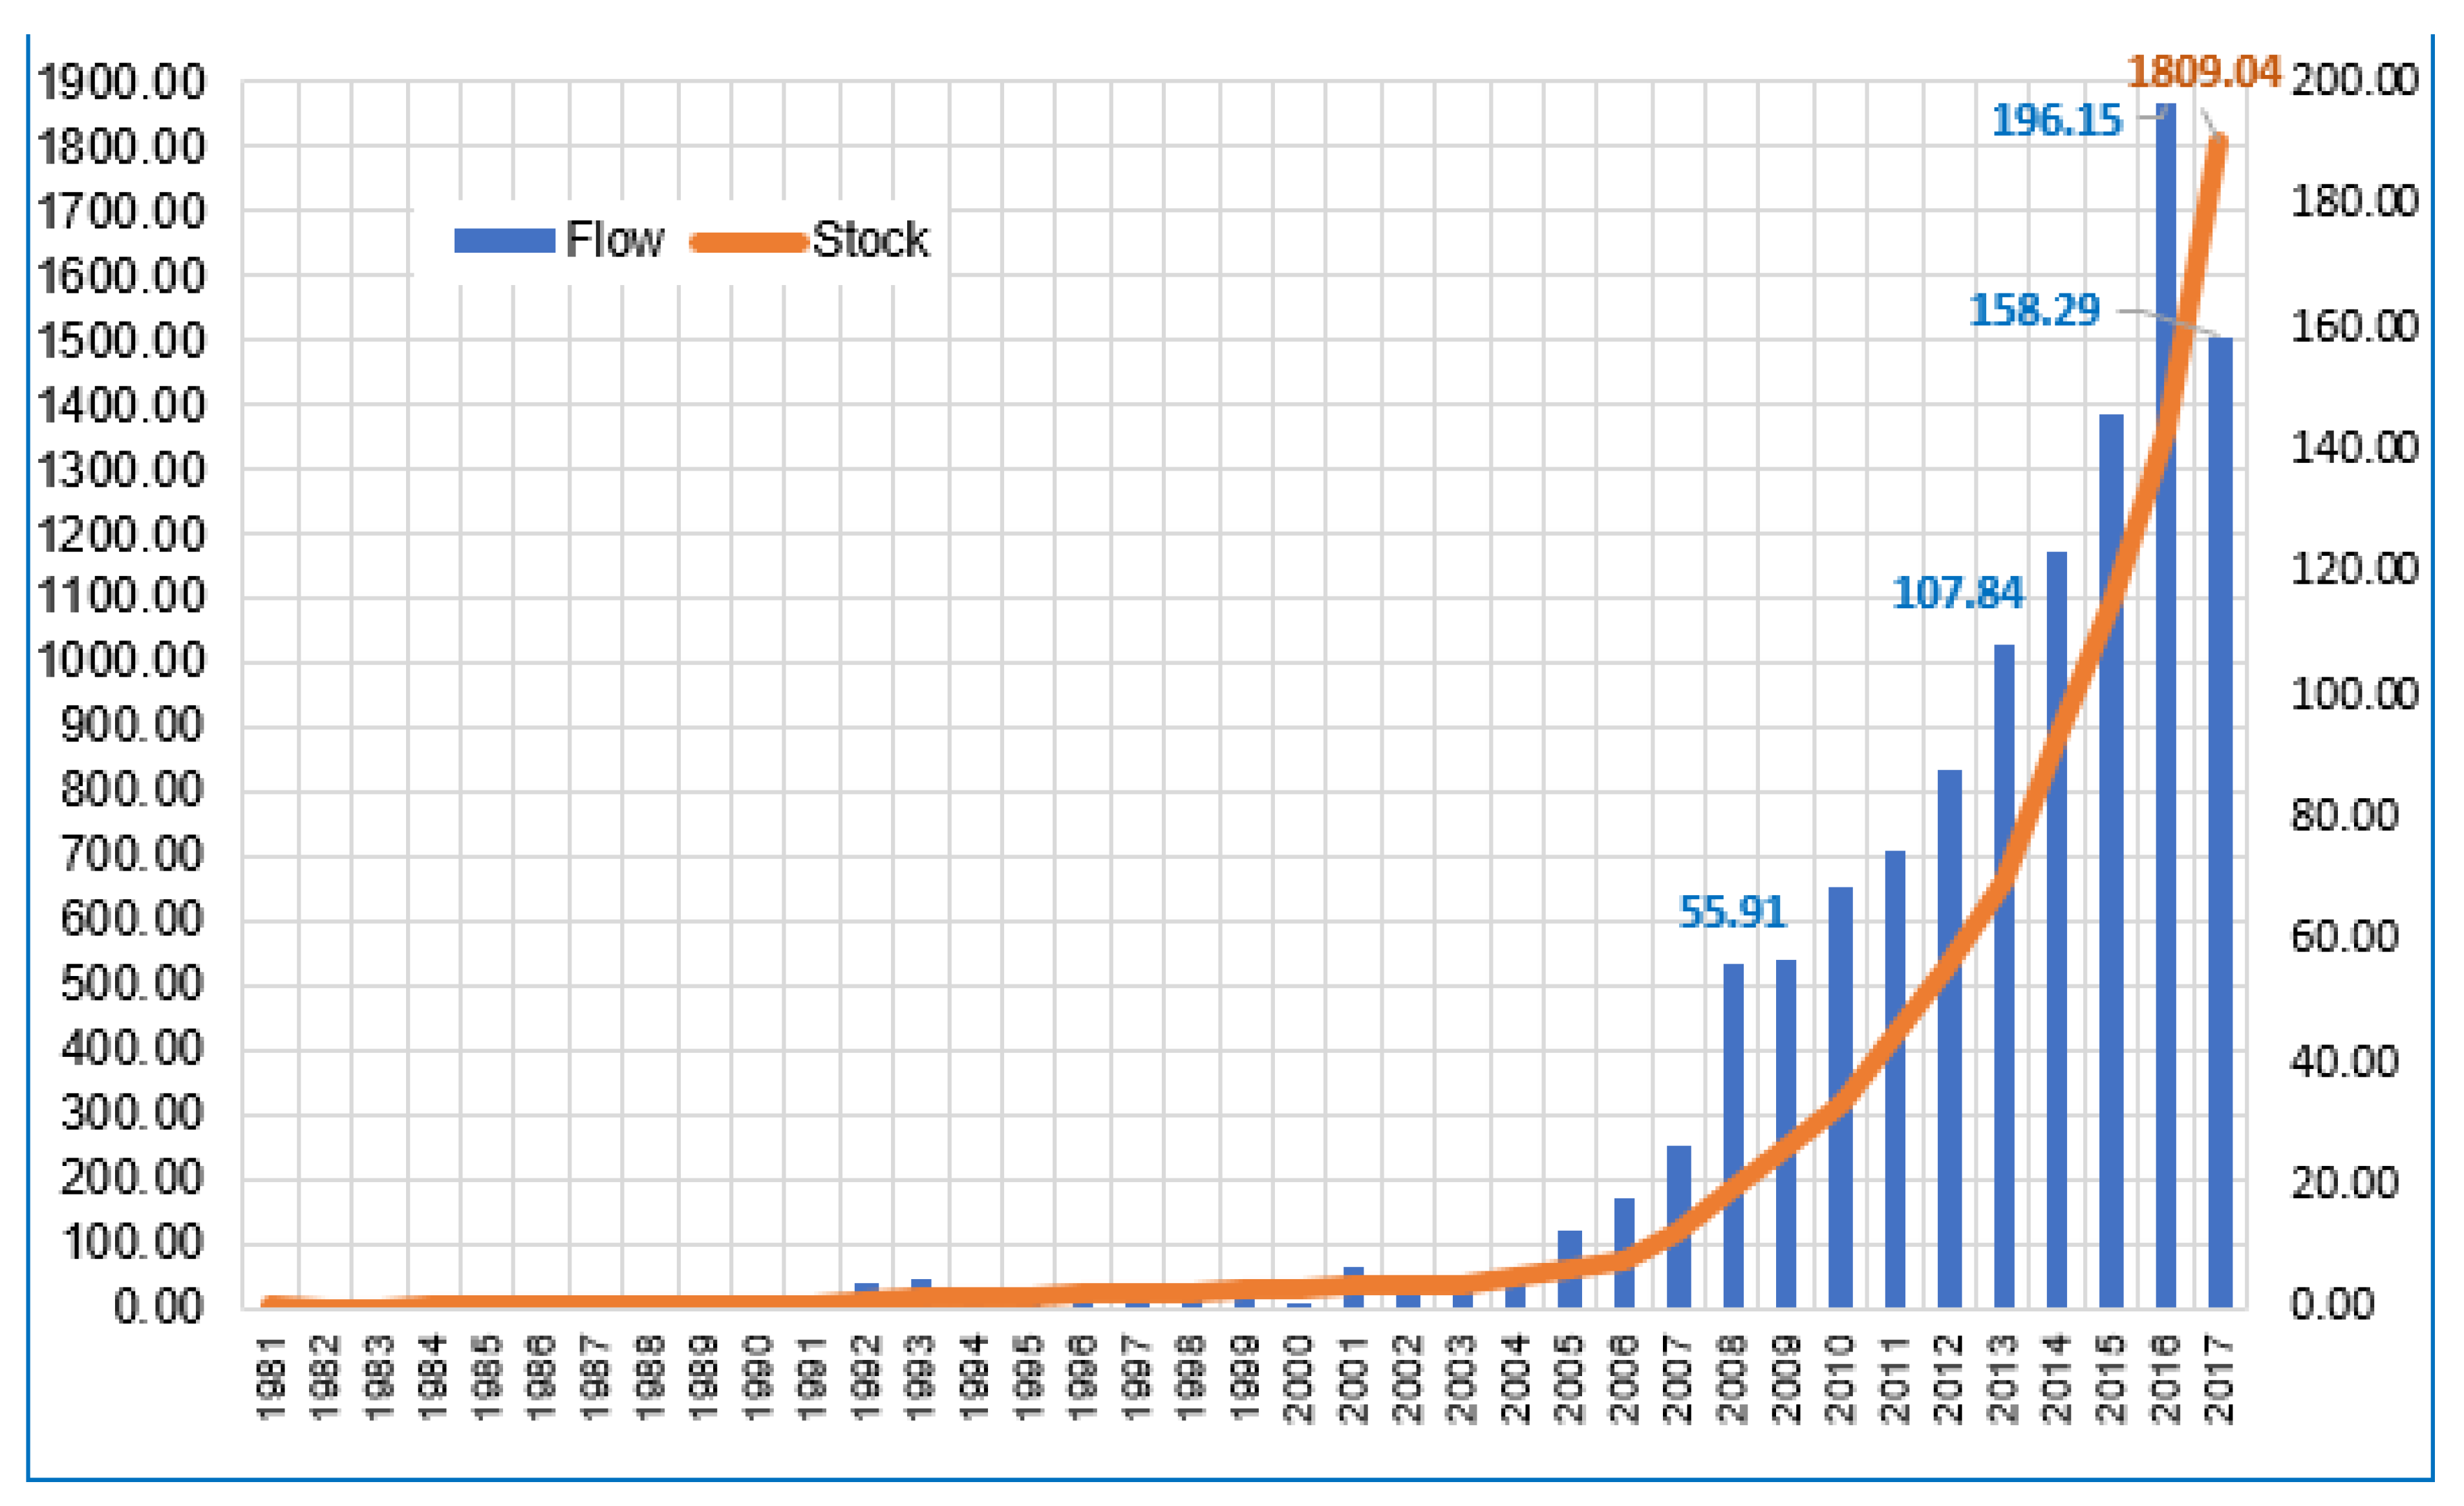
Following its success in opening the economy and attracting inward FDI, China has been rapidly becoming an important source of outward FDI (OFDI) in the new century. Starting from virtually no OFDI in the early 1980s, China had accumulated
$1809 billion of OFDI stock overseas by the end of 2017, with OFDI flows of
$158 billion in 2017, as indicated in
Figure 1. China’s OFDI flows (
$143 billion) and stock (
$1980 billion) in 2018 stand the second largest and the third largest in the world, respectively, and the largest in both flows and stock among developing countries [
5].
China-Africa relationships have evolved from being highly influenced by ideological and political considerations to being increasingly driven by commercial motivations. In the 1950s and the 1960s, Africa-China relations were more political rather than economic linkages [
6]). Africa’s importance in China’s foreign policy, however, declined in the 1980s and 1990s while China turned its focus to internal economic reform and modernization by attracting foreign capital and technology into the country. Since the turn of the 21st century, a great revival of China’s relationship with Africa has been driven by commercial impulse and economic rationale, supported by China’s economic success and growing confidence in participating in the global economy.
Since the turn of the 21st century, Chinese firms have poured into African countries, seeking natural resources, new markets, and other business opportunities. China’s trade with the continent has skyrocketed; in 2009, China surpassed the United States to become Africa’s largest trading partner. China increasingly considers Africa as not only an important source of energy and other crucial natural resources required for its fast growing economy but also a rapidly expanding market for Chinese products, especially manufactured goods.
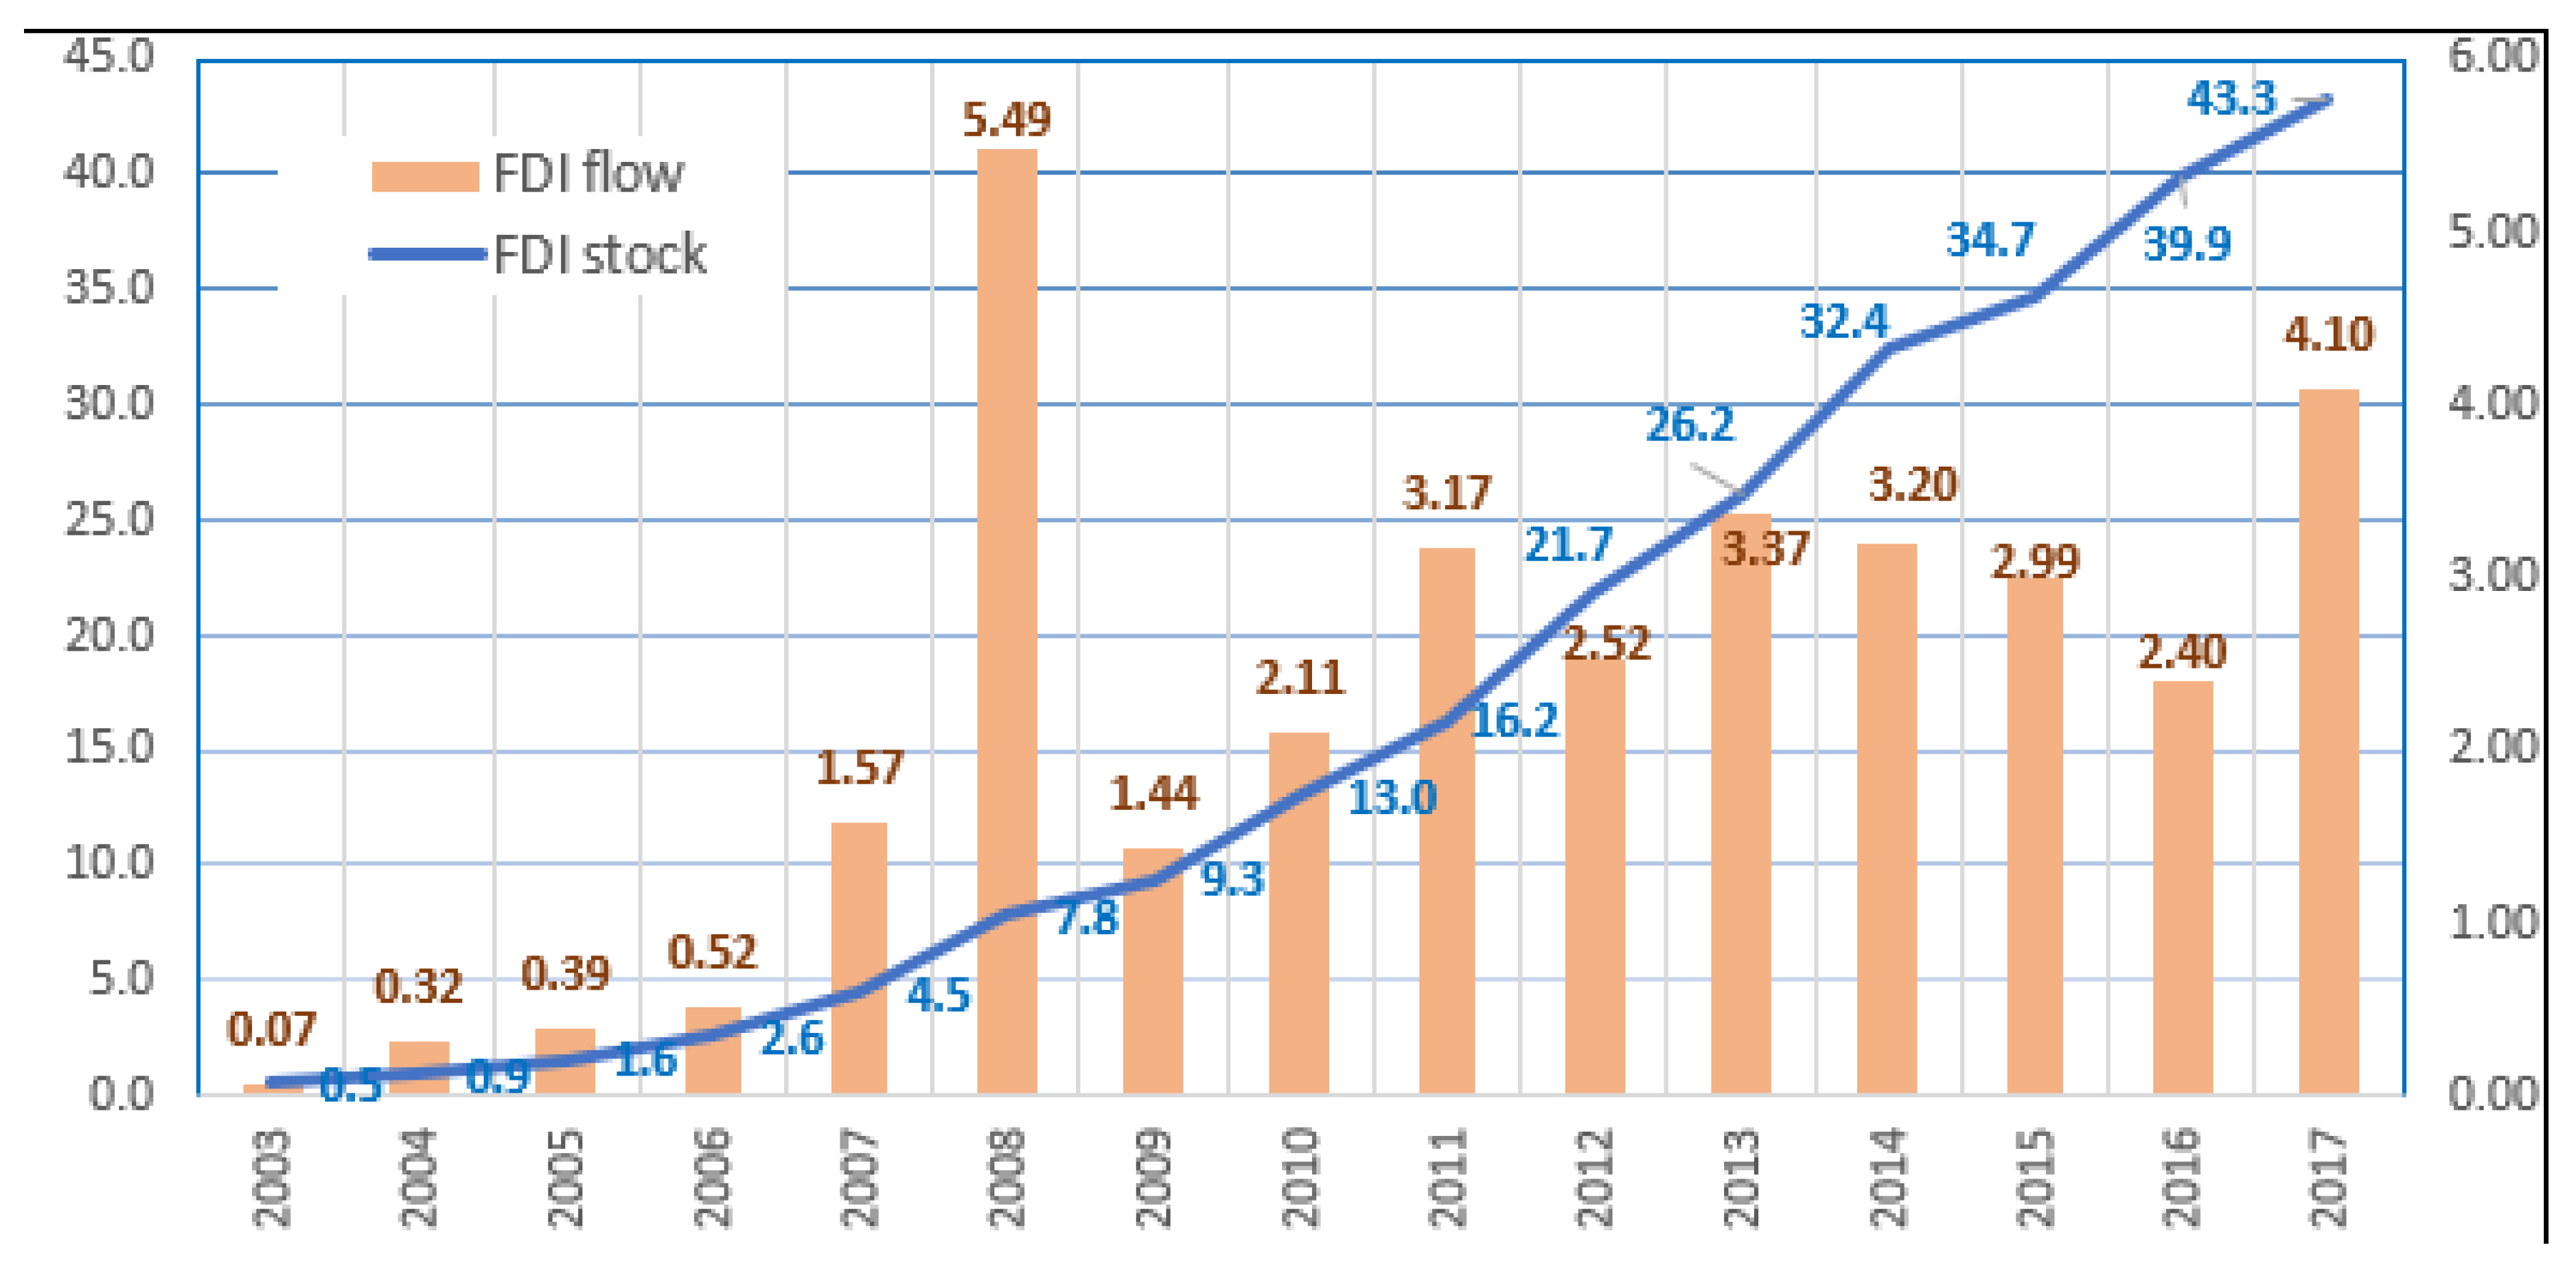
Starting from a very low base, China’s OFDI in Africa has rapidly increased since the early 2000s, keeping pace with the general trend of China’s OFDI volume worldwide (
Figure 1 and
Figure 2). During the period 2003–2017, an average of
$2244 million of investment was made annually by Chinese enterprises in Africa. By end 2017, China’s OFDI stock in Africa had reached
$43.3 billion, with OFDI flows of
$4.1 billion (
Figure 2). While its OFDI flows into Africa have accelerated in recent years, China has so far remained a relatively small investor in Africa, accounting for only 4.5% of total FDI stock found in Africa. The average share of China’s OFDI flows over 2003–2014 in total FDI flows into Africa is less than 4%. However, more than half of Chinese OFDI stock is reported as going to Hong Kong, even though much of this transits to other locations. In other words, figures for Chinese investment in different countries are likely to be than those in reality. But even if one doubled the estimate of China’s OFDI in Africa, China’s share of overall OFDI would still be modest. Even China’s OFDI in Africa constitutes even a smaller portion in China’s total OFDI: 3.7% of stock by 2014 and 2.5% of flows in 2014, as reported in
Table 1.
The main motives for Chinese enterprises to invest in Africa are market seeking and resource- seeking. Given China’s relative natural resource scarcity, firms in these sectors were inclined to expand globally in order to find new supplies, including in Africa. Not surprisingly, the natural resource–abundant countries in Africa have been especially attractive to Chinese investors.
Table 2 presents top five sectors of Chinese investment in Africa and in the world as a whole. By end of 2014, construction sector received the largest amount of China’s investment flows (24.7%), followed by resource extraction (24.5%), finance (16.4%), manufacturing (13.6%), and scientific research and technical services (4.2%). Considering that about 50–80 % of total FDI goes to natural resource exploitation in most African countries, China’s OFDI in Africa is not particularly biased towards the natural resources extraction sector in international comparison. A large portion of China’s investment in the services sector has been in construction due to China’s long engagement in investing in infrastructure projects in Africa.
3. Theoretical Framework and Hypotheses
Foreign direct investment (FDI) arises from activities of firms operating across countries. In this study, we concentrate on main factors influencing Chinese FDI in Africa, especially the role of natural resources and home-host-country institutions. While there is a large body of the literature on FDI drivers and determinants, two recognized theories seem to be relevant to our study: the ownership-location-internalization framework (so called OLI eclectic paradigm) and the investment development paths (IDP). According to the OLI framework [
20], a firm with
ownership advantages in home country would open a subsidiary (or acquire existing firms) in host country with
location advantages to maximize profits. Both ownership and location advantages can be best captured by the
internalization of production via direct investment in the foreign country. The IDP theory identifies a five-stage path (from least developed to developed), in which a country’s inward and outward FDI evolves with the country’s economic development [
21,
22]. The OLI framework focuses on three advantages that a firm must possess to go multinational, and the IDP emphasizes how a country’s position of inward and outward FDI is systematically related to the country’s level and structure of economic development. The two theories share the view that FDI is influenced by both host- and home- country determinants. There are various views about FDI determinations, theoretical predictions in the context of China’s OFDI in Africa, however, may be summarized by two approaches: resourced-based view and institution-based view [
22].
The resource-based view is based on host-country location advantages and home-country motivations. From perspectives of MNCs, host-country location advantages are those resources that attract FDI for profit maximization. Thus a firm that invests overseas is motivated by foreign resources, such as abundant mineral deposits and raw materials (natural resource-seeking FDI); new and more customers (market-seeking FDI); cheap labor/other factor inputs (efficiency-seeking FDI); advanced technologies (asset-seeking FDI). Such location advantages alone, however, do not guarantee FDI inflows, and basic infrastructure (roads, railways, airports, and telecommunications) is a necessary condition. Thus, we propose the following hypothesis:
Hypothesis 1a (H1a). Chinese OFDI is attracted to host-countries’ location advantages such as natural resources, better infrastructure, larger markets, and greater labor forces.
The institution-based view is a complement to conventional FDI theory in explaining the rise of MNCs from developing economies like China. The question with developing country MNCs has been the sources of their competitive edge in world markets, since certain ownership advantages must exist if a firm is to go multinational. Yet, developing-country firms appear to lack such assets - neither have they possessed advanced proprietary technology, nor established brand names, special marketing and organizational skills. Moreover, their competitors include not just local enterprises in the host countries, but established MNCs from developed countries. For past decade, Chinese MNCs have already acquired some competitive advantages, including proprietary expertise and technology, which will allow them to operate in overseas environments and compete effectively with foreign firms. Many of Chinese MNCs possess sophisticated and distinctive advantages which they have created and nurtured over last decade. Nevertheless, the overall ownership advantages possessed by Chinese MNCs are weak relative to developed country MNCs.
One way for developing country MNCs to offset such technology disability is to benefit from home-country institutional factors such as access to cheap funds, which translate into significant advantages for these firms. Home-country government may give financial support to firms going abroad. Host-country institutional factors such trade liberalization, fiscal freedom, business freedom, and labor freedom could also influence investment location decisions of MNCs. This consideration leads to the following hypothesis:
Hypothesis 1b (H1b). Chinese OFDI is attracted to host-countries’ institution advantages such as liberalized trade regimes, fiscal freedom, business freedom, and labor freedom.
Regulations and inducements in both China and African countries encouraging FDI (such as Chinese government financial promotion measures), and multilateral or bilateral trade-investment treaties facilitating FDI (such as Africa-China bilateral investment protection treaties and bilateral double-taxation-avoidance treaties) can all be pull factors for MNCs. We cover this point in the following hypotheses:
Hypothesis 1c (H1c). Chinese OFDI is encouraged to go Africa by home-country government incentive policies and bilateral promotion treaties.
4. Empirical Models and Data
The preceding discussions and the three hypotheses suggest an important role of natural resources and institutions in China’s OFDI in Africa, which leads to three empirical specifications: host-country resource model, host-country institution model, and home-country institution model. Several empirical specifications can be considered in a study of FDI determinants. The focus of this paper on the role of resources and institutions in Chinese investment in Africa, however, necessitates the use of a model that could capture and isolate the basics of the linkages between resource-institution-based variables and China’s OFDI. Therefore, we have three corresponding equations of China’s
OFDI determination for an African country
i in year
t:
where in the three equations,
OFDI is China’s OFDI flows in current value of US dollar.
α0 is the constant term and
εit as stochastic component.
θi and
μt are unobserved country-specific and year-specific effects, respectively.
Z is a vector of control variables, including China-host country trade share in host-country total trade (
TS), and the host country’s openness to the world economy (
OPEN), defined as the trade to GDP ratio, as suggested in the literature [
11,
14,
22]. The two variables measure how close a host country’s economic ties with China are, and how open the country’s trade to the rest of the world. It should be noted that other determinants may exist but are excluded from the specification. This model, therefore, should not be treated as an exhaustive China’s OFDI study but, rather, as a narrowly focused investigation of the resource-institution-OFDI links.
The host-country resource model, specified as equation (1), focuses African countries’ resource-based location factors. Energy (
ENG) output is used to denote natural resource endowments, measured by primary energy such as petroleum, natural gas, and solid fuel based on World Bank’s calculation [
7,
23]. Ideally the measurement of
ENG should include manganese, cobalt, and coltan are other resources as well as petroleum, natural gas, and solid fuel. The availability of data does not allow us to do so.
MSIZE represents market size of host economies, measured by GDP in constant price of US dollars. Human resources (
HR) is measured by shares of secondary school enrollments, regardless of age, in the population of the age group that officially corresponds to the level of education shown. Data on schooling years of labor forces are incomplete for many African countries in the sample, though they are better proxy of human capital (
HR). Four infrastructure indices are included due to their complement effects to location attractiveness:
AP for number of airports,
RDL and
RWL for road length and railway length (both in kilometer per kilometer square of areas), respectively, and
TEL for telephone rental of mobile cellular wireless communication system per 100 persons.
The host-country institution variables in equation 2 are defined as follows. TF denotes trade freedom or trade liberalization, measured by weighted average of tariff rates and non-tariff barriers. FF represents fiscal freedom or fiscal policy liberalization, measured by average of three indices (maximum of personal income tax, maximum of corporation revenue tax, and tax revenue share in GDP). BF is business freedom, defined as ease of opening and operation, including indices of government corruption, consistence of regulation, and costs imposed on firms due to regulations. LF denotes labor freedom or labor market liberalization, measured by government regulations on labor markets, including wage controls and constraints of hiring and layoff.
Equation 3 of the home-country institution model includes three home-institution factors in addition to control variables. CRDT denotes Chinese government financial supporting policies, measured by favorable credit policies provided to firms with OFDI in Africa. BIT represents investment protection policies, proxied by bilateral investment protection (BIT). BDTAT is investment incentive fiscal policy, measured by bilateral double taxation avoidance treaties (BDTAT).
Equations (1)–(3) constitute the basis for our panel analyses of China’s OFDI determinations in Africa in 2003–2013. The period selected here is totally based on data availability and consistence of all variables used in the work. While the data on OFDI in 2004–2017 are available, the data on some of the explanatory variables in equations (1)–(3) are missing for many African countries in the sample, over the period of 2004–2017, particularly for variables such as human capital, infrastructure, and institutions. Availability of the data for low-income developing countries in general seems to be poor, especially for some countries in Africa, as displayed in some well-known cross-country data sources such as World Bank’s
World Development Indicators. Another consideration is that the significant amount of China’s OFDI in Africa started in 2003. Definitions of all variables and their data sources are presented in
Table A1 of
Appendix A, and the descriptive statistics of all variables are reported in
Appendix A as well (
Table A2). Every country in Africa for which data for the relevant variables are available in the sources cited has been included. Thus, there is no direct selection bias in the sample. The countries included in the sample are as follows. Algeria, Benin, Botswana, Cameroon, Cape Verde, Chad, Democratic Republic of Congo, Egypt, Ethiopia, Gabon, Ghana, Guinea, Kenya, Lesotho, Madagascar, Mauritius, Morocco, Mozambique, Namibia, Nigeria, Republic of Congo, Senegal, Seychelles, Sierra Leone, South Africa, Togo, and Zambia.
5. Estimate Results and Robust Checks
All regressions are conducted with the general least square (GLS) method because assumptions for fixed effects and random effects are rejected. The Haussmann tests are significant at the 1% level, indicating random effect models are not valid. However, regressions with the fixed effect models are invalid either due to problems of the approximate singular matrix.
The correlation matrix of all variables used in the estimations is presented in
Appendix A (
Table A3). The value of computed variance inflation factor (VIF) turns out to be less than 10, indicating a small probability for existence of multi-collinearity problems, which tentatively confirms GLS method to be valid. Multicollinearity generally occurs when there are high correlations between two or more independent variables. In other words, one independent variable may be used to predict the other. It is more likely to have the problem when a multiple regression model includes more similar independent variables.
Table 3,
Table 4 and
Table 5 report estimations of China’s OFDI determinants, focusing on the roles of host-country resources, host-country institutions, and home-country institutions. In general, the regression estimates are reasonable and plausible, and the explanatory power is fairly good. Adjusted
R2 and
F statistic of regressions are reasonable in all cases of
Table 3,
Table 4 and
Table 5, indicating that a significant part of the variance in the dependent variable can be accounted for with the independent variables.
Some points are discerned easily from the tables. First, the resource-based factors seem to attract China’s OFDI in China substantially, as suggested by
Table 3. The coefficients of natural resources (
ENG), market size (
MSIZE), and three infrastructure indicators (
AP,
RDL, and
TEL) are significantly positive, although the coefficient of human resources (
HR) is insignificant, and that of railway (
RWL) is negative. It is noted that some estimates in
Table 3 seem to point towards potential problems of multicollinearity, as indicated by one referee, for which we appreciate very much. When we include market size (
MSIZE) in Model 3 and human capital (
HR) in Model 4 separately, only
MSIZE is significant. When we include both variables in Model 6, the outcome switches and only
HR is significant. Similar problems seem to appear for
RWL and
RDL in Models 5 and 6, since they are significant with opposite signs. As presented in
Table A3 of the correlation matrix,
RWL and
RDL are fairly highly correlated (correlation coefficient = 0.560), so are
HR-OPEN (0.567) and
HR-ENG (0.638). The correlation between
HR and
MSIZE is negative and not high (-0.423). We expect the issue in model 6 may be related to the high correlations of the three pairs of variables:
RWL-RDL,
HR-OPEN, and
HR-ENG. The estimates confirm the widely held view that that natural resource-seeking and market-seeking are major motivations for the Chinese firms to invest in Africa, and the countries with good infrastructure are attractive to China’s OFDI. The finding is consistent with the theoretical prediction of
H1a and evidence in the literature, including Dollar [
2], OECD [
6], Brautigam et al. [
8], Chen et al. [
9], Kolstad & Wiig [
12], Zhang [
18], and Cheung et al. [
19]. China is resource-scarce relative to its population and economic size in terms of GDP. China possesses a small share of global resources such as petroleum, metals, and mineral deposits. By contrast, the African continent is much more resource-rich which is most attractive to foreign investors including China. Africa’s known mineral wealth places it among the world’s richest continents. Its large share of the world’s mineral resources includes coal, petroleum (more than 10% of global oil reserves), natural gas (7.5% of global natural gas reserves), uranium, radium, low-cost thorium, iron ores, chromium, cobalt, copper, lead, zinc, tin, bauxite, titanium, antimony, gold, platinum, tantalum, germanium, lithium, phosphates, and diamonds [
1,
20]. FDI to access natural resources is strategically important for China as well as the West, since the security of supply of petroleum and raw materials is deemed essential for China’s rapidly growing economy. China considers Africa not only as a key source of energy and other natural resources, but also as an expanding market for Chinese products, especially manufactured goods. As of 2018, aggregate GDP of Africa was
$2.36 trillion and 1.27 billion people live in 54 countries in the continent [
5]. The World Bank in 2013 projected that Africa’s GDP would rise by an average of over 6% a year in 2013–2023 period, and most African countries would reach “middle income” status (defined as at least
$1000 per person a year) by 2025 if current growth rates continue.
Second, the institution-based factors in host and home countries seem to have strong influences on China’s OFDI in Africa. As reported in
Table 4, the coefficients of all host-country institution factors (
TF,
FF, BF, and
LF) are positive and highly statistically significant, implying that the Chinese firms, like MNCs from other countries, are encouraged by positive institutional factors. The estimates in
Table 5 show significantly positive effects of all home-country institution factors (
CRED, BIT, and
BDTAT), suggesting that the promoting policies and incentives provided by the Chinese government indeed enhance Chinese firms to go Africa. The finding supports our hypotheses of H2 and H3, is consistent with the conclusions from several studies, including Brautigam [
1], Dollar [
2], OECD [
6], Brautigam et al. [
8], and Zhang [
18]. Using the cross-section data in 2003–2006 and conducting regressions with 29 observations, Kolstad & Wiig [
12] found that China’s OFDI is uncorrelated with a measure of property rights and rule of law. Particularly, Chinese investment in strong and weak institutions is about the same, but its share of foreign investment is higher in the weak governance states.
Third, estimates for control variables seem to be mixed: the parameters for host-home trade relation (
TS) shows expected positive sign and statistical significance in most cases in
Table 3,
Table 4 and
Table 5, while that for host openness (
OPEN) is significant but negative in most cases. The estimating results of
TS reflect the fact that the closer China-host country economic links are, the more China’s OFDI goes into the host countries. Specifically, the Chinese firms tend to invest more in the countries that already engage more trade with China. The unexpected negative effects of
OPEN may be explained by African market competition faced by Chinese firms and the state ownership of many Chinese MNCs. The FDI theory predicts more FDI into the countries with high economic openness measured by trade to GDP ratio. Such open economies in Africa, however, may offer limited opportunities to China, since the Chinese MNCs are later comers relative to the western MNCs that have operated in open African economies for several decades. What left for China are the host markets that are less open and thus less attractive to private MNCs. Unlike the western MNCs, a lot of China’s OFDI in Africa are made by state-owned enterprises, which could overcome some difficulties and operate well in less open markets due to their institutional advantages [
4].
Several tests and sensitivity checks must be conducted for robustness. First, a regression of the model with all independent variables (for instance, Model 6 in
Table 3) is conducted, and comparisons of the estimates from Model 6 with those from the multilevel models (Models 2–5 in
Table 3) indicate consistent results for almost all cases. In fact, except one variable (market size,
MSIZE), all of other six resource variables in the multilevel models and Model 6 show consistent estimates of both sign and statistical significance. Similarly, estimates reported in
Table 4 and
Table 5 show consistence in sign and significance for all of four host-country institution variables except business freedom (
BF), and the consistence for all of three home-country institution variables except one variable (bilateral investment protection treaty,
BIT) with insignificant coefficient.
Second, random-effect (RE) panel regressions are employed to re-run all models in
Table 3,
Table 4 and
Table 5 in order to see if estimating results may change due to different methods of estimation used. The estimation results, presented in
Table 6,
Table 7 and
Table 8, are similar in large to those in
Table 3,
Table 4 and
Table 5 and none of them is significantly affected by the alternative regression methods. In other words, the observed results seem not to depend on specific estimation techniques and thus are quite stable.
Third, the regression of a model that includes all independent variables (i.e., control variables, host-country resource variables, and host- and home-country institution variables) is conducted with to check if estimation results may change. The GLS estimates reported in
Table 9 suggest a similar pattern in general to that revealed in
Table 3,
Table 4 and
Table 5, though the potential problems of multicollinearity seem to emerge in the coefficients of a few of independent variables. The estimates of estimates of
FF, LF, CRDT and
BDTAT in
Table 9 are likely to have potential problems of multicollinearity. The coefficients of
FF, LF, CRDT and
BDTAT are no longer significant in
Table 9, contrast to highly significant in
Table 4 and
Table 5. Like the similar issue in Model 6 of
Table 3, we expect the problem in the regression model, which include all independent variables, may be caused by high correlations of the following pairs of variables as indicated in
Table A3:
TEL-MSIZE (correlation coefficient = 0.794),
BF-MSIZE (0.570),
CRDT-TEL (0.548),
BDTAT-RDL (0.577),
BDTAT-TEL (0.596), in addition to
RWL-RDL(0.560),
HR-OPEN (0.567) and
HR-ENG (0.638).


