Article

Work Flexibility, Job Satisfaction, and Job Performance among Romanian Employees—Implications for Sustainable Human Resource Management

by
Adriana AnaMaria Davidescu
1,2,*,
Simona-Andreea Apostu
1,3,
Andreea Paul
4 and
Ionut Casuneanu
5
1
Department of Statistics and Econometrics, Bucharest University of Economic Studies, Romana Square, 15–17 Dorobanți St., Sector 1, 010552 Bucharest, Romania
2
Labour Market Policies Department, National Scientific Research Institute for Labour and Social Protection, 6–8, Povernei Street, 010643 Bucharest, Romania
3
Institute of National Economy, Romanian Academy House-Bucharest, District 5, Calea 13 Septembrie, 13, 010374 Bucharest, Romania
4
Department of International Economic Relations, Bucharest University of Economic Studies, 15–17 Dorobanti St., Sector 1, 010552 Bucharest, Romania
5
Department of Management, Bucharest University of Economic Studies, 15–17 Dorobanti St., Sector 1, 010552 Bucharest, Romania
*
Author to whom correspondence should be addressed.
Sustainability 2020, 12(15), 6086; https://doi.org/10.3390/su12156086
Submission received: 5 June 2020 / Revised: 21 July 2020 / Accepted: 23 July 2020 / Published: 29 July 2020
(This article belongs to the Special Issue Designing Sustainable HRM)

Abstract

:
In light of future work challenges, actual human resource management (HRM) needs to be redesigned, including long-term development, regeneration, and renewal of human resources, passing from consuming to developing human resources by incorporating the concept of sustainability. Thus, sustainable HRM is seen as an extension of strategic human resources, presenting a new approach to human resource management. The labor market is constantly changing, atypical work acquiring a significant relevance, especially in these current times of coronavirus crisis restrictions. In Romania, promoting the law of teleworking transformed labor flexibility into a topic of interest, and became an increasingly vital requirement for employment and a motivating factor for Romanian employees. In such a context, this paper aims to investigate the link between employee development and worktime and workspace flexibility as relevant characteristics of sustainable HRM, job satisfaction and job performance among Romanian employees in order to identify how to redesign HRM in the face of “future work” challenges. Additionally, the paper aims to examine the impact of different types of flexibility—contractual, functional, working time, and workspace flexibility—in order to highlight the relevance of employee development and employee flexibility as important aspects of sustainable HRM in increasing the overall level of employee job satisfaction. In order to make this possible, an “employee flexibility composite indicator,” which takes into account different types of flexibility, has been developed using feedback from Romanian employees, which was gathered by a national representative survey using multiple correspondence analysis. Furthermore, the impact of both individual and employee flexibility on overall level of job satisfaction has been quantified using binary logistic regression models. Within the research, there is a particular focus on the impact of new types of workspaces (flex office, co-working, total home office, partial home office—FO, CW, HOT, HOP) on job performance, job satisfaction, organizational performance, professional growth and development, social and professional relationships, and personal professional performance as well as on the overall level of work motivation. The empirical results revealed that these new types of workspaces are highly appreciated by employees, generating a growing interest among them. Partial home working, the mix between working from home and working in a company’s office, has been considered an optimal solution in increasing organizational performance, social and professional relationships, learning and personal development, and the overall level of work motivation. The results of the multiple correspondence analysis highlighted a medium level of flexibility among those Romanian employees interviewed, with only one third of them exhibiting high levels of flexibility. The empirical analysis of logistic regression analysis pointed out the role of functional flexibility, working time, and workspace flexibility along with the flexibility composite indicator in increasing the level of job satisfaction in employees. Therefore, if the challenge is to redesign the actual human resource management in order to include the concept of sustainability, attention needs to be on a combination of employee development-flexible time and flexible places, leading to an increase in both employee job satisfaction and organizational performance as important outcomes of sustainable HRM.

1. Introduction

Employees are key stakeholders in the formation and development of the organisation’s human and social capital and are a key source of knowledge and support for the development and implementation of sustainable human resource management (HRM). In the face of current challenges, the concept of HRM needs to be redefined, with sustainable HRM being a more appropriate approach to actual human resource management. Sustainable HRM’s aims is for long-term objectives and results, with a focus on employee and environmental care, employee participation and development, external partnership, flexibility, compliance with labor regulations, cooperation between employees, equity, and equality, all without affecting profitability.
Among the main characteristics of sustainable HRM, the two core characteristics—employee development and a combination of flexible working time and new types of workspaces—are particularly important in terms of their impact on the two main outcomes of sustainable HRM—job satisfaction and job performance.
The labor market is constantly changing, and the role of the employee is incredibly important. When employees are able to choose their preferred working hours, they tend to be more motivated and spend a longer period of time without changing jobs. In recent years, this paradigm shift resulted in an increase in employee autonomy, interruptions during work schedules to meet employee needs, employee participation in decision making, workspace modelling, and increasing employee creativity and productivity. Sustainable HR practices are largely influenced by the level of job performance and satisfaction; therefore, in-depth knowledge of these factors is essential in redefining HRM according to current needs.
Work flexibility offers employees a balance between their professional and personal lives, leading to job satisfaction and high performance and an overall improvement of the organization as a whole. Work flexibility is very important, and with digital advancements and improved technology, employees are able to continue their work anywhere they wish, provided they have an internet connection.
Atypical job roles have become significantly more common, especially characterized today by the restrictions caused by the coronavirus crisis. Although full-time permanent employment represents most of today’s workforce, the increasing prevalence of non-standardized forms of employment has brought structural change to work patterns, most likely resulting in a change to employee job satisfaction levels, providing information that could be incredibly valuable to us.
In Romania, promoting the law of teleworking transformed labor flexibility into a topic of interest, becoming an increasingly essential condition required for employment and a motivating factor for Romanian employees.
In such a context, this paper aims to investigate the link between employee development and worktime and workspace flexibility as relevant characteristics of sustainable HRM, job satisfaction, and job performance among Romanian employees in order to identify how to redesign HRM in the face of ‘future work’ challenges. Furthermore, the paper aims to examine the impact of different types of flexible contracts, functional, working hours, and workspace flexibility in order to highlight the relevance of employee development and employee flexibility as important aspects of sustainable HRM in increasing the overall level of employee job satisfaction.
Could different forms of work flexibility lead to an increase in job satisfaction and job performance? This is the main question of our research. In attempting to answer to this question, the empirical analysis will be structured on three levels. On the first level, we will examine the main characteristics of both job satisfaction and work flexibility among Romanian employees, highlighting the impact of new forms of workspace flexibility on job performance, job satisfaction, personal time and space management, level of comfort, level of organizational performance, level of personal and professional relationships, level of professional development, and the overall level of work motivation.
First, we will investigate the key differences regarding the main forms of work flexibility among Romanian employees, focusing particularly on contractual flexibility, working time flexibility, functional flexibility, and workspace flexibility. Second, we will identify the main determinants of work flexibility for Romanian employees and build a composite flexibility indicator using the results from the multiple correspondence analysis (MCA). Finally, we will investigate both the potential impact of the composite flexibility indicator and the impact of individual flexibility forms on the overall level of job satisfaction of Romanian employees using the binary logistic regression model, revealing its main implications for achieving the desideratum of sustainable HRM.
This paper contributes to the sustainable HRM literature in several ways. First, it analyses the impact of two important characteristics of sustainable HRM employee development and worktime and workspace flexibility, grounded in an evidence-based approach on two major outcomes of sustainable HRM (job satisfaction and job performance), contributing to the diminution of the gap in scientific knowledge especially at a national level. Second, the paper offers a first attempt at investigating the impact of the new forms of workspaces on job performance, job satisfaction, personal time and space management, level of comfort, level of organizational performance, level of personal and professional relationships, level of professional development, and the overall level of work motivation. This is particularly important when taking into account the restrictions regarding social distancing in the context of the current health crisis. Third, the paper considers a multi-dimensional approach of work flexibility from the perspective of working time and workspaces as well as employee development, which is considered to be an important characteristic of sustainable HRM. Fourth, the paper provides, to our knowledge, a first composite measure of work flexibility seen from different angles at an individual level that offers a global view of the main elements of flexibility present within Romanian organizations. Furthermore, the paper analyzes how this synthetic measure impacts employee job satisfaction as an important outcome of sustainable HRM, thus highlighting the way in which the HRM needs to be redesigned.
The paper is organized in the following sections. Section 1 represents the introduction, highlighting the relevance of the topic and the main aim of our research. Section 2, the literature review has been organized into four main sub-sections and starts with an introductory section on sustainable HRM presenting the main conclusions from the literature regarding job satisfaction, work flexibility, and sustainable HRM and a short presentation of the particularities of work flexibility in times of crisis. Section 2.2, Section 2.3 and Section 2.4 present the most relevant conclusions from literature regarding the relationship between work flexibility and job satisfaction, work flexibility and job performance, as well as work flexibility and a combination of the two.
Section 3 is dedicated to the presentation of survey design, some theoretical considerations, the methodology, and the data.
Section 4 is dedicated to empirical results and it is divided into seven sub-sections. The first is dedicated to the presentation of a profile of Romanian employees profile, while the next two present the main characteristics of job satisfaction and work flexibility among Romanian employees. Analysis of the impact of new forms of workspace flexibility on job satisfaction, job performance, personal time and space management, level of comfort, level of organizational performance, level of personal and professional relationships, level of professional development, and the overall level of work motivation. Section 4.5 presents the main differences among Romanian employees regarding different forms of work flexibility, and Section 4.6 is dedicated exclusively to the development of a composite indicator of Romanian employee flexibility using multiple correspondence analysis. The last sub-section tries to respond to the following question, “Does flexible working increase job satisfaction?” to capture the impact of both the flexibility composite indicator and the individual forms of work flexibility on job satisfaction using the binomial logistic regression models emphasizing the main implications for achieving sustainable HRM desideratum. The paper ends with main conclusions and policy implications, which are considered fundamental in the process of redesigning HRM in the face of “future work” challenges.

2. Theoretical Considerations and Hypothesis Development

2.1. Sustainable Human Resource Management Literature

Employees are key stakeholders in the formation and development of the organisation’s human and social capital and are a key source of knowledge and support for the development and implementation of sustainable HRM. The employees are one of the most important stakeholders in an organization and the organization as a whole is a stakeholder of HRM.
In a volatile labor market, it is becoming increasingly important to change the prevailing situation where human resources are consumed rather than developed, if the focus is to increase the retention of employees. In this endeavor, sustainable HRM has been included as a response to changes regarding societal levels, labor market, and employment relations. Sustainable HRM represents an extension of strategic HRM and presents a new approach to people management [1], being seen as a possible solution to lead humanity back into HRM [2], while sustainability refers to resource regeneration, development, and renewal. However, the difference between strategic and sustainable HRM implies larger aims; while strategic HRM is determined by organizational performance, mainly in terms of economic outcomes, sustainable HRM also considers social human, environmental, and financial outcomes [1].
In terms of sustainability, it represents a survival strategy for organizations to arrange systems where employees would have (a) the intention to work for a particular organization, (b) the capability to perform tasks in a proper manner for business, and (c) the possibility to work toward better health, lower stress, or a work–life balance [3].
Sustainable HRM is the result of various disciplines and research areas, focusing on corporate sustainability and social responsibility and sustainable work systems. It respects the classic concepts and practices regarding strategic management of human resources from the private sector [4]. Most HRM models present the concept of work flexibility as having a direct and significant influence on the management of people in organizations [5].
It has a wide scope, involving the creation of adequate working conditions, sustainable leadership, cooperation and teamwork, diversity and multiculturalism, ethics and governance, value creation and inculcation, health and safety, workforce involvement, and a sustainable environment [6]. Sustainability can be used as a principle for HRM itself and the tasks of sustainable HRM are twofold. First, it cultivates the conditions for personal employee sustainability and advances the ability of HRM systems to regularly attract, regenerate and develop motivated and engaged employees by sustainably building the HRM system itself [3].
Esfahani et al. investigated the important features of a sustainable HRM in innovative organizations to identify the relationship between psychological capital, human resource flexibility, and sustainable HRM [7]. They examined HRM in innovative organizations that can benefit from psychological capital and flexibility of human resources, with the results indicating that flexibility and functional optimism of human resources significantly influenced the sustainability of human resources. Kazlauskaite and Buciuniene [8] strongly believed that, in order to achieve and support the sustainable competitive advantage, companies need to have unique, valuable, and inimitable employees.
A relevant contribution to the literature concerns the proposal made by Stankeviciute and Savaneviciene [1] identifying 11 characteristics of sustainable HRM—long-term orientation, care of employees, care of the environment, profitability, employee participation and social dialogue, employee development, external partnership, flexibility, compliance beyond labor regulations, employee cooperation, fairness, and equality. From all these characteristics, employee development and flexibility affect overall level of job satisfaction, which is the subject matter of our research.
In designing sustainable HRM, Cohen et al. [9] mentioned three characteristics—equity, well-being, and employee development—and the study is particularly relevant for our research in terms of the last factor.
Zaugg [10] have taken into account the following characteristics of sustainable HRM: flexibility, employee participation, value orientation, strategy orientation, competency and knowledge orientation, stakeholder orientation, and building mutually trustful employee–employer relationships. Park [11] associated six themes with sustainable HRM—a diverse workforce, employees’ development, flexibility, volunteer work, employees’ health, and green HRM.
A model of sustainable HRM and organizational performance was proposed by Nyameh [12], highlighting the role of training, rewards, and participation on sustainable HRM outcomes, such as employee satisfaction, employee motivation, and employee retention or loyalty.
Stankevičiūtė and Savanevičienė [1] argued that sustainable HRM reduces the negative impact of HRM on employees and contributing to employee wellbeing by decreasing work-related stress, work-family conflict, and burnout.
HRM practices lead to attracting, motivating, and retaining employees to ensure the survival of the organization [13]. This practice considers that human capital plays a significant role in achieving the organization’s goals [14], being positively correlated with the employee engagement if used properly [15]. HRM practices are influenced by organizational performance and improve employee well-being through job satisfaction and organizational commitment [16]. Other HRM practices such as training and development and performance assessment encourage the employees to work better, thus increasing the organizational performance [17]. Training gives employees the opportunity to obtain knowledge and skills that can help them achieve their responsibilities adequately, resulting in improved performance [18]. The characteristics of sustainable HRM affect employee satisfaction; therefore, to ensure sustainability and increase the efficiency of the organization, it is necessary to meet the needs of employees who benefit from good working conditions [1].
Figure 1 highlights the most relevant studies focusing on work flexibility, job satisfaction and job performance, and also studies at the intersection of these three relevant topics. Table 1 presents an overview of the most relevant studies regarding work flexibility, job satisfaction, and job performance at a national level.
In order to increase business efficiency, competitiveness, success, and to ensure sustainability, it is commonly agreed that the focus needs to also be on satisfying the needs of employees by providing them with good working conditions [19,20,21]. Additionally, Al Mamun et al. [22], Cantele and Zardini [23], Delmas and Pekovic [24], Pintão et al. [25], and Dongho [26] reinforced the core importance of employee satisfaction and the fact that their productivity crucially impacts the company’s success or failure. An increase in the overall level of employee satisfaction also increases the level of retention. Work environment and working conditions are very important in this context. The ideal situation is for employees to be satisfied with their conditions and work environment [27,28,29]. The importance of work environment in terms of enhancing satisfaction and motivation of employees, while increasing corporate sustainability performance, has been highlighted by Chang et al. [30], Chatterjee et al. [31], Gianni et al. [32], Roxas et al. [33], and Chandrasekar [34].
Strenitzerová and Achimsky [6] offer a new perspective of the achievement of employee satisfaction and loyalty as part of sustainable human resource management, revealing that higher financial rewards lead to the greatest satisfaction, while the employees’ age, job position, and length of employment strongly impact employee loyalty. The results present a particular interest for our research, since employee satisfaction is seen as a key challenge for sustainable human resource management.
Giovanis [35] explored the relationship between job satisfaction, employee loyalty, and two types of flexible employment arrangements—teleworking and flexible timing—revealing a positive causal effect from these employment arrangements on job satisfaction and employee loyalty. Also, our research treats the relationship between different forms of work flexibility and job satisfaction among Romanian employees.
Analyzing different forms of employment and their relationship with employee loyalty, Kot-Radojewska and Timenko [36] provided evidence that the employees with an indefinite duration employment contract exhibited a higher level of loyalty compared to those with a fixed-term employment contract. This relevant finding will also be included in our research, but with an impact on job satisfaction.
Although there is an extensive body of literature written of job satisfaction, Gazioglu and Tansel [37] provide an interesting analysis of the determinants of job satisfaction in Britain considering the following four different measures of job satisfaction: satisfaction with their influence over the job, satisfaction with the amount of pay received, satisfaction with the sense of achievement gained, and satisfaction with the level of respect given from supervisors. Among the interesting results obtained, and taking into account the aim of our research, they found that long working hours reduce satisfaction, while those employees who had job training were more satisfied than those who had no training opportunities. These results are even more relevant from the perspective of working time and functional flexibility and led us to research how these characteristics affect Romanian employee satisfaction.
Flexibility is an important characteristic of sustainable HRM [1,11] that primarily reflects the needs of employees. Sustainability in the field of human resources and its benefits imply a broader approach to labor regulations, as compliance with institutional requirements does not lead to sustainability [38]. It represents the capability of organizations to confront the dynamics and uncertainty of their environments, rapidly changing their organizational routines or resource bases.
Work flexibility and its implementation have occupied an important place in the last few decades in industrial sociology and human resource management, becoming a popular term in many fields and directions of research, presented as a necessity in the contemporary workplace [39]. Since organizational environments have become more complex and dynamic, companies increasingly use HRM practices that enhance their flexibility, such as contingent work, part-time or temporary work, and flexible contract work [40].
From the perspective of employees’ initiatives regarding the work they performed or the way they are employed, Reilly [41] proposed five types of work flexibility—functional, numerical, temporal, local, and financial. An alternative classification of work flexibility arrangements have been proposed by the International Classification for Standards, according to which there are two types of work flexibility—on the one hand, there is a quantitative flexibility (involving changes regarding the number of employees and working hours), and on the other hand, there is a qualitative flexibility (involving the content of competence and quality of work) [42].
Among the main characteristics of sustainable HRM pointed out by Stankeviciute and Savaneviciene [1], two core characteristics are of particular interest for our research—employee development and a mix of flexible working time, and new types of workspaces to increase job satisfaction leading to sustainable HRM. Casuneanu identified the following four different forms of work flexibility: working time flexibility, contractual flexibility, functional flexibility (vocational training), and wage flexibility [43].
In light of sustainability, functional flexibility achieved through employee development is even more important from the perspective of acquiring of skills and developing capacities that employees will need in the future. Thus, the development of employees needs to take into account the investment in future skills, and the employees’ need to be regarded as two facets: the main asset as well as an agent of change [1]. Hirsig et al. [44] argue that, “it becomes more and more important to invest in continuous training and education for the workforce rather than in infrastructure and equipment.”
Hirsig et al. [44] and Stankevičiūtė and Savanevičie [1] highlighted the importance of investment in training and education for human resources, creating a win–win situation both for employees (future employability and career opportunities) and for employer (profitability and success).
The presence of sustainability in HRM can be revealed through employee development through on the job training, which can be seen as a cost-saving approach, leading in turn to higher job motivation [45] as well as through mentoring and sharing the knowledge with new employees [46], sending the message that through training and development, the company is interested in their long term retention. Employee development can be seen also as a mechanism for helping individuals in achieving their own self-development and self-enrichment goals or as learning opportunities seen as a “sustainable” investment in personnel [46,47]. In conclusion, employees’ development is regarded as an important element of sustainable HRM and represents an important aspect of our research, aiming to examine its relationship with job satisfaction.
Flexibility represents another important characteristic of sustainable HRM, mainly being reflected in terms of employee needs. Furthermore, we refer to different types of work flexibility, from contractual flexibility or flexible employment to working time arrangements and new workspaces.
Among these forms of work flexibility, the relatively short-term perspective of contractual flexibility based on different types of employment contracts (part-time work or fixed-term employment) makes it difficult to support in some ways the idea of sustainability, which implies a long-run approach. According to Stankevičiūtė and Savanevičienė [1], the only way in which this contractual flexibility could lead to sustainability is if it helps the labor market integrate particular groups (students or persons with disabilities). Although flexible employment does not support the idea of sustainability within HRM, the increasing incidence of non-standardized forms of employment are creating structural changes regarding work patterns in Romania, leading us to include it in the analysis with the aim of revealing its impact on the overall level of job satisfaction.
On the other hand, flexible working time and workspaces support the sustainability in the HRM, not only from the perspective of the environmental benefits, due to working from home and thus less use of company cars and less need for large company buildings [48], but also from the perspective of the employees’ heightened satisfaction, freedom, and control, it being acknowledged that a mix of flexible working time and new types of workspaces increases job satisfaction, leading to sustainable HRM [1]. From this precise point of view, it very important to identify the forms of work flexibility that exhibited a positive impact on employee job satisfaction and job performance.
If a company intends to adopt a sustainable HRM, their focus needs to be on their employees’ development, advancing them in sustainability by assigning task forces, in-depth training, flexible workhours, and a workspace with beneficial environmental impacts.

Work Flexibility in Times of Crisis

Before the coronavirus crisis, employees were already demanding a new focus on life. Workplaces faced constant change prior to the pandemic, and there will be more to come. In her article published on Gallup website [49], Mullen O’Keefe argued that, “Flexibility will look different in each workplace because culture is as unique to an organization as DNA is to a person.”
Certain jobs require employees to be physically present. Thus, this particularly situation which we are facing, offers the opportunity of revisiting the company policies in order to better incorporate flexibility overall. There is a debate how the labor market will look after the pandemic, and an answer needs to be given of whether employees will continue working from home when public health restrictions are no longer necessary.
According to Mullen O’Keefe, in addition to the “when,” managers should consider if the “where” for workers can change too [49]. Full-time remote work is not the only solution. According to Cheremond [50], the main findings of the recent Gartner poll revealed that one of the future work trends post pandemic refers to the increase of remote working, stipulating that 48% of employees most likely will decide to work remotely at least part of the time after COVID-19 compared with only 30% of them before the pandemic; flexible working will be a new normal after the virus.
The measures of social and physical distance aimed at stopping the transmission of COVID-19 and preventing the emergence of new ones imposed physical distance between people (at least one meter) and reduced contact with contaminated surfaces, encouraging and supporting a virtual connection within families and communities. Regarding the development of professional activities, work flexibility was introduced, such as teleworking, distance learning, reduction and avoidance of congestion, and the closure of non-essential facilities and services [51].
The coronavirus pandemic resulted in the largest number of employees worldwide being forced to work remotely, with working at home becoming the new normal [52]. The impact of COVID-19 on the labor market differs considerably between countries. Employees in Germany have a well-established short-term work schedule and are unlikely to be affected by the crisis. Within countries, impacts are uneven and exacerbate existing inequalities. Workers in alternative employment arrangements and occupations, characterized by a small part of the tasks performed from home, have experienced reduced hours, job losses, and declining earnings [53]. Working from home can be useful for people working in IT or other industries, but there are employees for whom working from home is not possible, even in a crisis. The health crisis has affected training efforts; therefore, retraining has become a challenge. All these consequences could have been minimized if they had been planned well in advance or if employees had been familiar with such strategies [54].
All measures taken during the coronavirus crisis will have short-term and long-term effects on people’s lives, especially on working life, given the changes regarding work arrangements (short-term work, flexible location, and time). The relationships between work and career of people working in flexible roles could be affected by the COVID-19 pandemic, generating an examination of the effects on the work and career of those people, so that the pandemic can contribute to the flexible working offset [55]. The importance of employee satisfaction during the crisis, referring to the coronavirus crisis, was analyzed by Shan and Thang. The results indicated that companies with higher employee satisfaction are more resistant to negative shocks across the market during the COVID-19 outbreak [56].
Akkermans et al. identified the Covid-19 pandemic as a career shock, which will have a major impact on people’s work and careers. The impact of the crisis will depend on contextual and individual factors and will affect people differently depending on their stage of career and life. Although the pandemic represents a negative career shock, it can have long-term positive implications, the short-term consequences are different from the long-term ones [57].
Before the coronavirus crisis, the business world was already opening up to the idea of remote work. A survey conducted by LinkedIn at the end of 2019, indicated that home working is an attractive concept for both employers and employees, with benefits such as better work–life balance, increased productivity, and lower costs for buildings and infrastructure. This idea was strengthened during the pandemic, as it was observed that flexibility in work is a viable solution, with some managers claiming that it increased employee productivity, which could lead to a reassessment of how people will work after the pandemic [58].
Megan Brenan [59] has already indicated a change—“three out of five US workers who did their homework during the coronavirus pandemic would prefer to continue working as far away as possible,” and 41% said they would prefer to return to their work or office to work after the crisis. These changes will result in a work reorganization, as long as flexibility does not change performance targets. Flexibility at work must be “business as usual” and not just something to resort to in times of crisis.
As the pandemic resets major work trends, HR leaders need to rethink workforce and employee-related strategies. Among these trends, one already marked shifts, others have new impacts, referring to an increase the remote work, contingent worker expansion, a separation of critical skills and roles, the (de)humanization of employees, and a transition from designing for efficiency to designing for resilience.

2.2. Work Flexibility and Job Satisfaction Literature

Job Satisfaction is an essential criterion that cannot be overestimated, representing a combination of psychological, physiological, and environmental circumstances that determine an employee’s satisfaction with their job [48], emotional stability, and conscientiousness [60].
Regarding the employee role at work, satisfaction can be defined as emotional orientations on the part of employees toward the work roles they perform [47], greatly influencing employee motivation, which influences productivity and, therefore, organization performance as a whole [61].
Many studies have highlighted the fact that employee motivation influences job satisfaction, while the level of motivation has an impact on productivity and therefore on company performance. The employees’ perceptions of the nature of their work have a considerable impact on job satisfaction level, with financial compensation having a significant impact on overall employee satisfaction [47]. Other studies have analyzed job performance, satisfaction and the intention of resigning, the result of which indicates that low-performing employees leave their jobs for various reasons [62].
The factors that significantly influence job satisfaction and career advancement are age, work seniority, gender, education, position in the organization [63,64,65], employee abilities, and country of residence [42]. Other determinants of job satisfaction are communication and the nature of work [66], as well as the national culture, which moderates the relationship between leadership behavior and job satisfaction [67] and generates an increase in satisfaction [68].
At a national level, employee job satisfaction has been the subject of many empirical studies, analyzing factors influencing employee satisfaction [69] and testing empirically motivation theories [70].
Key factors enhancing overall levels of job satisfaction are communication and nature of work [71], the economic status provided by a particular job [69], emotional stability [60], financial incentives [72], and the combination between extrinsic factors (bonuses and monetary benefits) and intrinsic factors (professional fulfilment and good relationships) [73].
Origo and Pagani [42] and Possenriede and Plantenga [74] analyzed the relationship between work flexibility and job satisfaction revealing that temporary and local work flexibility requires employees’ control over their professional life, improving the link between paid work and private life, and leading to an increase in the overall level of job satisfaction. Flexible work leads to greater job satisfaction and low level of burnout and stress [75], with benefits to employee health and well-being [76] correlating with a good work–family relationship and high job satisfaction [77]. The results of these studies are of particular importance, since the relationship between work flexibility and job satisfaction is the subject matter of our research.
The main factors that influence job satisfaction and flexibility in different Romanian companies were investigated by Căşuneanu et al. [78], revealing that a flexible schedule is essential in improving work motivation, with employees of small companies assigning a higher level of importance to remote work or teleworking. Romanian employees expect to be rewarded for personal characteristics and work behavior with non-financial rewards, appreciation, and recognition being equally important as any financial rewards [71]. Other studies have indicated that rewards positively influence job satisfaction [79].
Based on previous theoretical considerations, the following hypotheses are created to stipulate how the main four types of flexibility (contractual, functional, working time, and workspace) will highlight the relevance of employee development and employee flexibility as part of sustainable HRM in increasing the overall level of job satisfaction:
Hypothesis 1 (H1).
On average, there is a moderate level of work flexibility among Romanian employees.
Hypothesis 2 (H2).
Different types of work flexibility lead to an increase in the overall level of job satisfaction, contributing to the achievement of sustainable HRM.
Hypothesis 3 (H3).
The employee flexibility composite indicator leads to an increase in overall level of job satisfaction, contributing to the achievement of sustainable HRM.

2.3. Work Flexibility and Job Performance Literature

Job performance is a central element within industrial and organizational psychology, reflecting scalable actions, behaviors, and outcomes that employees engage with, or contribute to, within organizations [80], and being defined by how employee behaviors contribute to organizational goals [81]. Job performance is influenced by individual characteristics (experience and ability), outcomes (e.g., feedback and job security), work environment [82], and education [83]. The general individual determinants for job performance are declarative knowledge, procedural knowledge and skills, and motivation [84].
In accordance to our objectives, it is worth to mention the findings of Waldman and Spangler [85], who developed an integrated model of job performance, influenced by individual characteristics (experience, ability), outcomes (feedback, job security), but also by work environment.
In Romania, several intrinsic factors contribute to increased job performance, resulting in employees feeling appreciated and consequently pursuing the organization’s objectives, leading to an increase in job involvement, a decrease in absenteeism, and a boost in self-confidence [86] leading to fewer fluctuations regarding the job [85]. Additionally, factors such as self-determination [87], job tability, authority, responsibility and autonomy at work, workplace comfort, advancement prospects, benefits packages, professional development, job attractiveness, remuneration [85], effective communication between management and employees, early distribution of tasks, a feeling of recognition, and an attractive salary [88] are also important in increasing employee performance.
Work adjustment theory states that work flexibility leads to higher employee involvement and an increased level of job performance. If Bal and DeLane [89] proved that the relationship between work flexibility and job performance was mediated by employee commitment, it was also demonstrated that time flexibility significantly impacted labor productivity [90,91].
Significant results proving that work flexibility leads to performance has been provided by Beltrán-Martín et al. [92], Lepak et al. [93], Martinez-Sanchey et al. [90], Bran and Udrea [91] and Valverde et al. [94].
Research has also proven that investments in human capital also increase labor productivity, as well as employee stability in the labor market, employability, and adaptability to new global labor conditions, including job performance [95,96].
Today, flexibility in the workplace is an increasing need in companies in order to recruit the best staff and to increase productivity among employees. Labor market flexibility is important as it is a positive quality that is highly valued by both jobseekers and employers.
Based on previous theoretical considerations, the following hypotheses have been created in order to stipulate how the new forms of workspace flexibility lead to an increase in job performance, a better management of personal time and space, a higher level of comfort, improved personal and professional relationships, a higher level of learning and professional development, and increased work motivation:
Hypothesis 4 (H4).
Total home office (HOT), as a new type of working, is associated with a higher level of job performance, a better management of personal time and space, and a higher level of comfort.
Hypothesis 5 (H5).
Partial home office (HOP), as a new type of working, is associated with a higher level of organizational performance, improved work motivation, improved personal and professional relationships, and higher level of learning and professional development.
Hypothesis 6 (H6).
Co-working (CW), as new type of working, is associated with improved personal and professional relationships and higher levels of learning and professional development.
Hypothesis 7 (H7).
Flex office [FO], as new type of working, is associated with improved personal and professional relationships.
Hypothesis 8 (H8).
Partial home office (HOP) is associated with an improved level of work motivation.

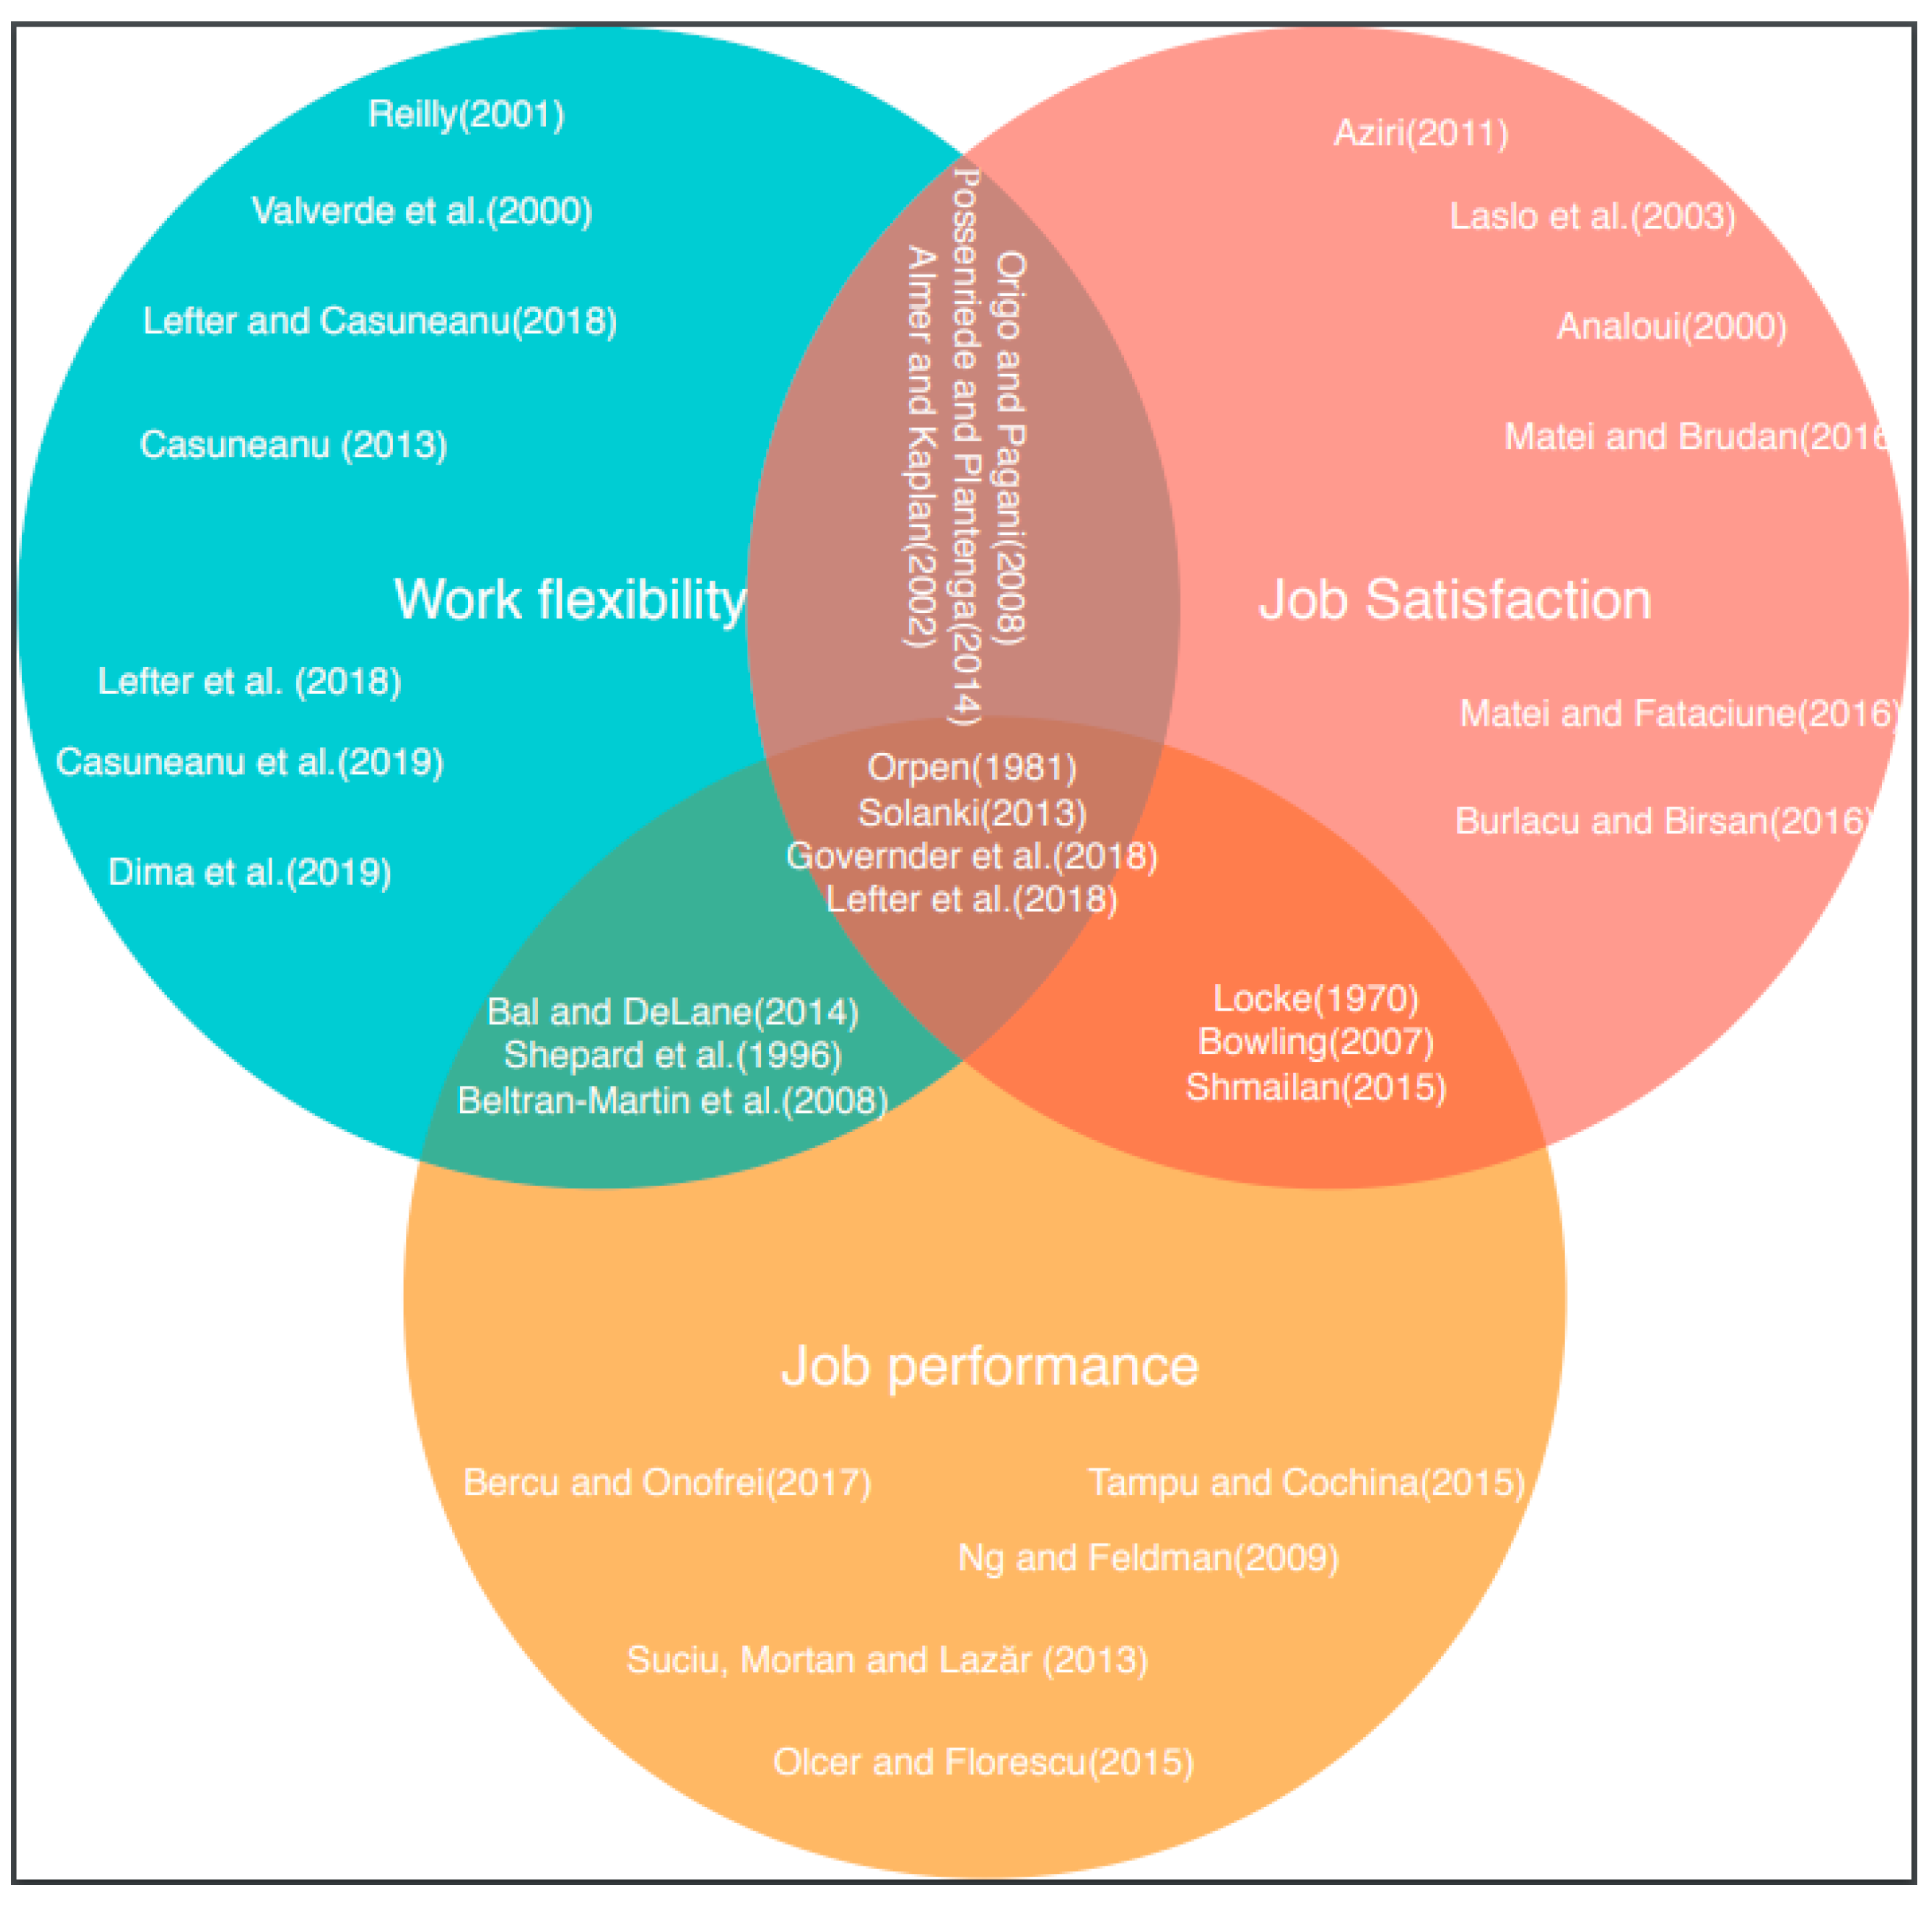
2.4. Theoretical Considerations on the Relationship between Work Flexibility, Job Satisfaction, and Job Performance

Flexible work practices are designed to meet the needs of employers, thus improving the work–life balance of employees in a manner consistent with the needs of the company and conducing to job satisfaction and job performance. For both companies and the labor market in general, work flexibility is seen as the key to success, influencing working conditions, productivity, profitability, and overall performance. Economists argue that work flexibility has relevant effects on workers’ well-being and job satisfaction [3,95].
Carvalho and Cabral-Cardoso revealed that numerical and functional flexibility can be achieved simultaneously and interdependently by implementing a unique HRM system based on workforce commitment [97]. Businesses with flexible operations often have several forms of flexible working models that reflect an innovation in human resource management [98].
Analyzing the influence of sustainable human resource management (HRM) practices on workplace performance, Manzoor et al. demonstrated that HRM practices, such as employee selection, participation, and empowerment significantly and positively influenced employee work performance [95].
National empirical evidence on work flexibility has been demonstrated by the studies of Casuneanu [96], Lefter et al. [99], Dima et al. [100], Lefter and Casuneanu [101], and Lefter et al. [102], and Casuneanu et al. [78].
In summary, the core idea of all empirical studies regarding work flexibility characteristics of Romanian employees refers to teamwork and usage of information technology as primordial elements of flexibility, while the most important forms of flexibility in the opinion of Romanian employees are team autonomy and working time flexibility. Therefore, the importance of work flexibility is once again highlighted, and the motivation of our research could also be explained from this perspective.
Although there are several other studies examining the relationship between work flexibility and job satisfaction, and studies examining the relationship between work flexibility and job performance, there are relatively few studies analyzing the relationship between work flexibility and both job performance and satisfaction simultaneously.
Significant results of the impact of work flexibility on job satisfaction and job performance have been provided by Orpen [103], Solanki [104], Al Omar et al. [105], Govender et al. [106], Lefter et al. [101], Casuneanu [96], and Burtăverde [107]. In his study, Orpen [103] validated only the relationship between work flexibility and job satisfaction and invalidated the relationship between work flexibility and job performance.
The link between flexible work arrangements, satisfaction, and performance was investigated by Govender et al. [106]. The results indicated that most employees are satisfied with their actual work arrangements and work flexibility which could contribute to their decision to remain with their current employer. Job performance and work flexibility have a strong positive correlation and flexible work arrangements improve employee retention and job satisfaction, increasing productivity.
The link between work flexibility, job satisfaction and job performance in Romania was analyzed by Lefter et al. [99] using survey data based on a sample of 220 employees; the empirical results highlighting that work flexibility (flexible schedule, teleworking, or reduced working time) significantly influences job satisfaction and job performance. In addition, flexible work has been found to significantly influence employee well-being, personal and professional performance, and the overall level of motivation. Casuneanu [96] pointed out the importance of flexible hours, among other motivational factors, in increasing the overall level of employee job satisfaction.
In this context of work flexibility and job satisfaction, and respectively, work flexibility and job performance, it is also worth analyzing potential links between job satisfaction and job performance within the literature. The relationship between job satisfaction and job performance has been studied throughout the history of industrial and organizational psychology, with many researchers considering a causal relationship between satisfaction and performance [108].
Satisfied employees are found to perform better and contribute to the organization success [109]. The positive relationship between job satisfaction and job performance has been provided by the studies of Christen et al. [110], Katzell et al. [111], O’Leary et al. [112], Norris and Niebuhr [113], Petty et al. [114], and Neagu [115].
Pavalache-Ilie [80] studied the relationship between “good soldier syndrome” and job satisfaction by researching two independent studies (public and private) conducted in Romania. The results indicated that job satisfaction is associated with performance behaviors (e.g., organizational citizenship, self-efficacy, hospitality, and seniority within the organization), with the involvement in public organizations being more intense than in private ones.
In the context of today’s economy, when professionals can choose from a wide range of offers available on the labor market, employers must reinvent themselves and begin to offer potential employee’s alternative benefits other than simply financial ones. Most of the time, the flexibility of the organization can determine, not only the employee’s longevity but, more importantly, their motivation to work hard and to be productive. Employer flexibility benefits not only the employees but also the organization that offers it. Rigidity removes talent, and in a free, growing market, potential employees have the opportunity to explore their options before they choose a position.
Table 1. An overview of the most relevant studies on work flexibility job satisfaction and job performance at a national level.
DomainAuthorsStudyMethodResults
Work flexibilityLefter, Davidescu, and Casuneanu (2017) [99]Sample of 100 employeesPrincipal Components AnalysisMost respondents consider teamwork and the use of information technology to be key elements of work flexibility.
Dima, Țuclea, Vrânceanu, and Țigu [100]Sample of 1180 employeesModel based on structural equationsAt an individual level, telework could establish a greater work-life balance, and at a social level, it could generate lasting effects for long-term labor management.
Lefter and Căşuneanu (2018) [101]Sample of 220 employeesQuestionnaireThe main forms of flexibility at work in Romanian companies are represented by teamwork, computer use, and telework.
Casuneanu, Lefter, and Davidescu (2019) [78]Sample of 220 employeesQuestionnaireMeasures to be taken to improve employee motivation are flexible program in case of big companies, while the small companies employees consider the ability to work from home (remote work) or near to the house (teleworking) to be important.
Lefter, Casuneanu, and Enache (2018) [102]Sample of 220 employeesQuestionnaireThe main elements of flexibility (teamwork and usage of information technology) are very important for Romanian employees-autonomy of work teams and working time flexibility.
Job satisfactionPook, Fustos, and Marian (2003) [65]Sample of 932 employees from Hungary, Poland and RomaniaQuestionnaireDegree of functioning, gender and position significantly influence job satisfaction and advancement.
Analoui (2000) [74]23 Romanian organizationsQuestionnaire and sample interviewsRecognition and appreciation, salary and remuneration, promotion status and professional satisfaction are key factors among Romanian managers.
Săveanu and Săveanu (2011) [69]Sample of 1489 subjectsEuropean Values Survey 2008Work is very important for Romanians, and the main factor that influences job satisfaction is the economic situation.
Matei and Abrudan (2016) [68]100 online recruitment companiesQuestionnaireIntrinsic factors have generated an increase regarding the level of satisfaction, proving that the theory is not adequate to the Romanian cultural context.
Burlacu and Birsan (2016) [116]Sample of 500 subjectsQuestionnaireAlmost half of the interviewees consider that the salary is not sufficient to cover the monthly expenses, the salaries cannot be considered satisfactory nor can they ensure a proper quality of life.
Tampu (2016) [72]Sample of 629 employeesQuestionnaireMain motivational factors are focusing on extrinsic and intrinsic motivation, attitude at work, job satisfaction, rewards, and incentives.
Matei and Fataciune (2016) [66]Sample of 120 employees from public and private sectorJob satisfaction surveyCommunication and the nature of work are determinants of job satisfaction work, highlighting a higher satisfaction for private employees.
Cristescu, Stănilă, and Andreica (2013) [73]Sample of 355 employees from public sectorQuestionnaireA combination of external advantages (bonuses and non-monetary benefits) and intrinsic factors (satisfaction and professional fulfilment, good relations with the local community) increase the professional motivation of civil servants.
Job performanceMihalcea (2013) [85]SampleQuestionnaireLeaders who registered task orientation, dominance, ambition, independence, and self-confidence generate a low level of satisfaction among their employees, being identified by moderate correlation, and managers who generated professional satisfaction were characterized by sensitivity to other people’s problems, the need for affiliation and support, less assertive and reduced control over the work of subordinates.
Ölçer and Florescu (2015) [87]SampleQuestionnaireCompetence, self-determination and impact have positively influenced the work performance of employees. Job satisfaction led to job performance, and job satisfaction partially mediated the relationships between competence and performance at work.
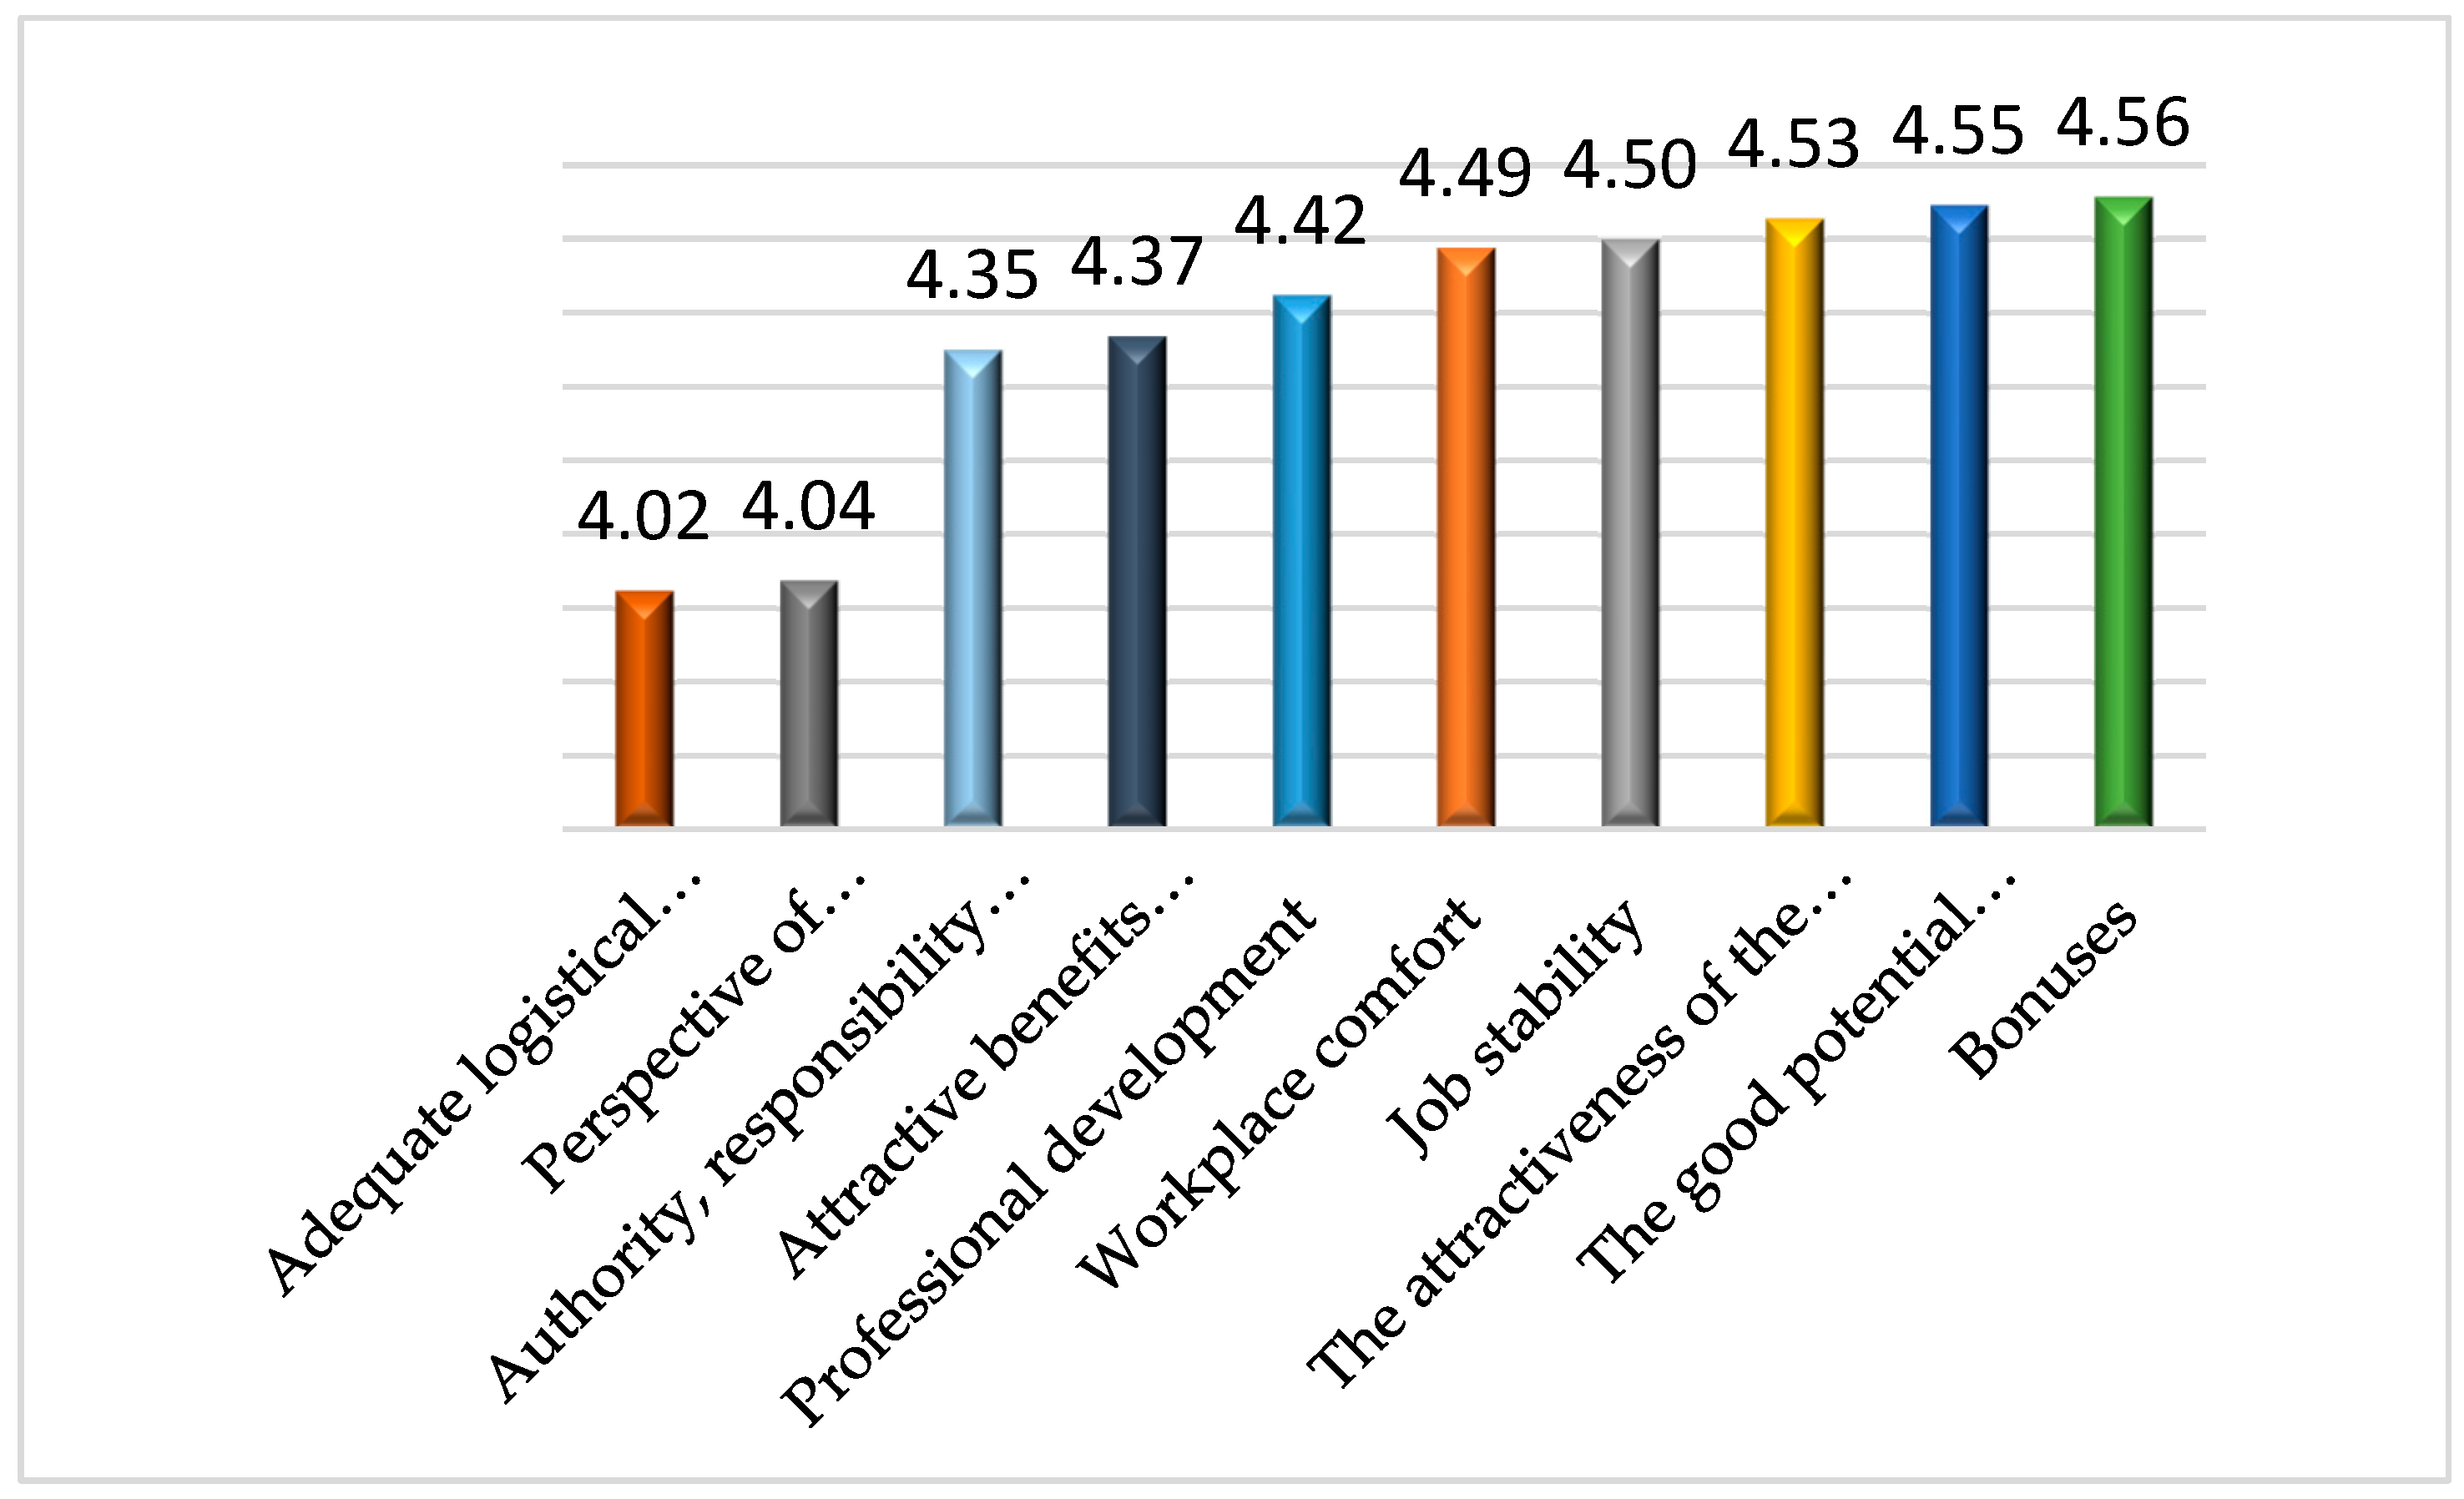
Bercu and Onofrei (2017) [86]SampleQuestionnaireThe results revealed that intrinsic factors are a priority, employees who feel valued will pursue the organization’s goals, work involvement will increase, absenteeism will be reduced and there will be less fluctuations in the workplace. The main motivation of civil servants leading to job performance is job stability, followed by authority, responsibility and autonomy at work, comfort, prospect of advancement, benefits package, professional development, job attractiveness, and remuneration.
Tampu and Cochina (2015) [88]Sample of 629 employees from multinationals in BucharestQuestionnaireCommunication between the management team and employees, early distribution of tasks, recognition or an attractive salary are relevant in increasing employee performance.
Suciu, Mortan, and Lazăr (2013) [70]Sample of civil servants in the North-West RegionQuestionnaireThe results highlighted a direct link between job performance and expectation, influencing their motivation to work.
Work flexibility and job satisfactionCăşuneanu, Lefter, and Davidescu (2019) [78]SampleQuestionnaireThe empirical results revealed that the employees of small companies are the most satisfied with their current job and the salary received, and the least satisfied are the employees of medium or large companies.
Buzea (2014) [79]SampleQuestionnaireThe results showed that Romanian employees expect to be rewarded for personal characteristics, followed by work behavior. Non-financial rewards, appreciation, and recognition are just as important as the financial reward.
Tănăsescu and Leon (2019) [117]SampleQuestionnaireThe results showed that rewards positively influence job satisfaction, while the relationships between job satisfaction and job performance, and between rewards and job performance are not significant.
Flexibility and job performanceWallace (2003) [118]Sample in eight countries (UK, Netherlands, Sweden, Czechia, Hungary, Slovenia, Romania, and Bulgaria) The results identified high flexibility for highly educated people and low flexibility for people with low education, low incomes, and often with young workers and those in rural areas.
Bran and Udrea (2016) [91]SampleQuestionnaireThe results identified that increasing work flexibility significantly improved job performance, motivation leading to performance, and in conjunction with flexibility lead to superior performance.
Serban (2012) [119]SampleQuestionnaireLabor market flexibility has a beneficial impact on labor productivity. Investments in human capital increase labor productivity, employee stability in the labor market, employability and adaptability to new global labor conditions, including job performance.
Job satisfaction and job performanceNeagu (2010) [115]SampleQuestionnaireThe results concluded that job satisfaction is positively correlated with communication and motivation, and inversely correlated with organizational commitment.
Pavalache-Ilie (2013) [80]SampleQuestionnaireThe results showed that job satisfaction is associated with performance behaviors (organizational citizenship, self-efficacy, hospitality, and seniority within the organization), and the involvement in public organizations being more intense than in private ones.
Ionescu and Horga (2013) [120]Sample of employees in tourism sectorQuestionnaireThe results highlighted the importance of job satisfaction and effective communication within companies, leading to higher financial performance.
Work flexibility, job satisfaction and job performanceLefter, Davidescu, and Casuneanu (2017) [99]Sample of 220 employeesQuestionnaireEmpirical results identified that work flexibility (flexible working hours, teleworking or reduced working hours) significantly influenced job satisfaction and job performance. In addition, flexible work has significantly influenced well-being, personal and professional performance, and motivation.
Burtăverde (2015) [107]Sample of 144 employeesQuestionnaireThe results indicated life satisfaction in general is directly correlated with honesty and health, and between emotional factor and job satisfaction the link is reversed. A positive relationship was determined between conscientiousness, job satisfaction, satisfaction with life and health, and between openness and satisfaction with life.
Casuneanu (2011) [96]Sample of 402 employeesCATI system (telephone-assisted telephone interview).Employees are looking for jobs that provide them with stability and security.

3. Data and Methods

In order to investigate the relationship between work flexibility as part of sustainable HRM and job satisfaction and job performance as sustainable HRM outcomes among Romanian employees, the research aims to respond to the following specific questions:
What kind of work flexibility elements are present in Romanian organizations? To what extent are different forms of work flexibility present within Romanian organizations? Is HOT, as a new type of working, related to a higher level of job performance and comfort and better management of personal time and space? Is HOP, as a new type of working, related to a higher level of organizational performance, higher work motivation, higher personal, professional relationships, and higher level of learning and professional development? Is CW, as a new type of working, related to higher personal, professional relationships and higher level of learning and professional development? Is FO, as a new type of working, associated with higher personal, professional relationships? Is HOP related to a higher level of work motivation? Overall, is there an average medium level of work flexibility among Romanian employees? What is the level of work flexibility registered by most employees? How many employees have a high level of work flexibility?
Do different forms of work flexibility increase the overall level of job satisfaction? Does an employee flexibility composite index lead to an increase in the overall level of job satisfaction, contributing to the achievement of sustainable HRM?
In order to assess this, a quantitative sociological survey was conducted based on a structured questionnaire among adults aged 15–64 who, at the time of the survey, were employees. The sampling was of probabilistic stage-type stratified. The sampling layers targeted were employee regional distribution, distribution by areas of activity, gender distribution, and distribution by area of residence (urban/rural). The study was conducted on a nationally representative sample of 220 people. Data collection was performed on 16 counties and Bucharest, cumulating a total of 50 sampling points (national, urban and rural). The study was conducted face to face and the collection period was 29 October–11 November 2018. The national representation of the sample has been assessed, by testing that there is no statistically significant difference between population mean and sample mean for the characteristic-respondent age, by testing that there is no statistically significant difference between population variance at regional level and sample variance at regional level, and through a similar sample gender distribution at national level with that one of the population.
The questionnaire contains information regarding the overall level of job and salary satisfaction, the most relevant motivational factors, the main elements of work flexibility present in Romanian companies, the main forms of work flexibility, urgent measures to be taken by the organization’s management to improve flexibility and job satisfaction, new spaces of working and how working in these spaces could impact wellbeing, professional growth and development, social and professional relationships, personal professional performance, and organizational performance.
The research assessed the notoriety of new types of working (HOT, HOP, FO, and CW) on organizational performance and feedback from people in offices.
Flex office (FO) designates spaces with impersonal and non-territorial workstations, correlated with spaces that create better facilities for meetings, concentration, creative activities, learning activities, and others. Co-working (CW) refers to the activities carried out in rented spaces, by people with diverse, frequently complementary activities, which they could also carry out at home, but prefer to do in a multi-relationship environment. Home office is work from home, either full time (HOT) or part time (HOP).
Within the survey, the following four types of work flexibility have been analyzed: working time flexibility, contractual flexibility, functional flexibility, and workspace flexibility.
Contractual flexibility was assessed through different types of contracts—full-time employment contract, part-time employment contract, fixed-term employment contract, work-from-home contract, distance work (work from a distance, from home or close to home), or other types of contracts (on request, division of labor) using dichotomous variables coded by 1—for presence and 0—otherwise.
Working time flexibility was evaluated based on seven items quantified using dichotomous variables coded by 1—for presence and 0—otherwise.
Functional flexibility was evaluated based on three items quantified using dichotomous variables coded by 1—for presence and 0—otherwise.
Working space flexibility was evaluated based on three items quantified using dichotomous variables coded by 1—for presence and 0—otherwise.
The presence of the main forms of work flexibility was assessed using dichotomous variables encoded by 1—for presence and 0—otherwise.
The major characteristics of working time and functional flexibility were quantified using dichotomous variables encoded by 1—for presence and 0—otherwise.
The urgent measures to be taken by the organization’s management to improve flexibility and job satisfaction of employees’ work were quantified using dichotomous variables coded by 1—for presence and 0—otherwise.
The potential impact of new types of working on work efficiency and productivity, on improving interpersonal relationships by meeting new people, the ability to gain new knowledge, the ability to increase company performance due to increased profit and more efficient use of workspace, increased personal comfort, and more efficient management of working time, and the increase of employee motivation was evaluated based on nine items quantified using dichotomous variables coded by 1—for presence and 0—otherwise.
The analysis of the main specificities of work flexibility and job satisfaction was performed based on descriptive statistics and charts. The investigation of the main differences of opinion regarding the main forms of work flexibility among Romanian employees was performed based on the non-parametric Mann–Whitney and Kruskal–Wallis tests.
In order to develop a multidimensional flexibility indicator, we have incorporated information from four areas totaling 18 binary items with 36 categories as follows (Figure 2):
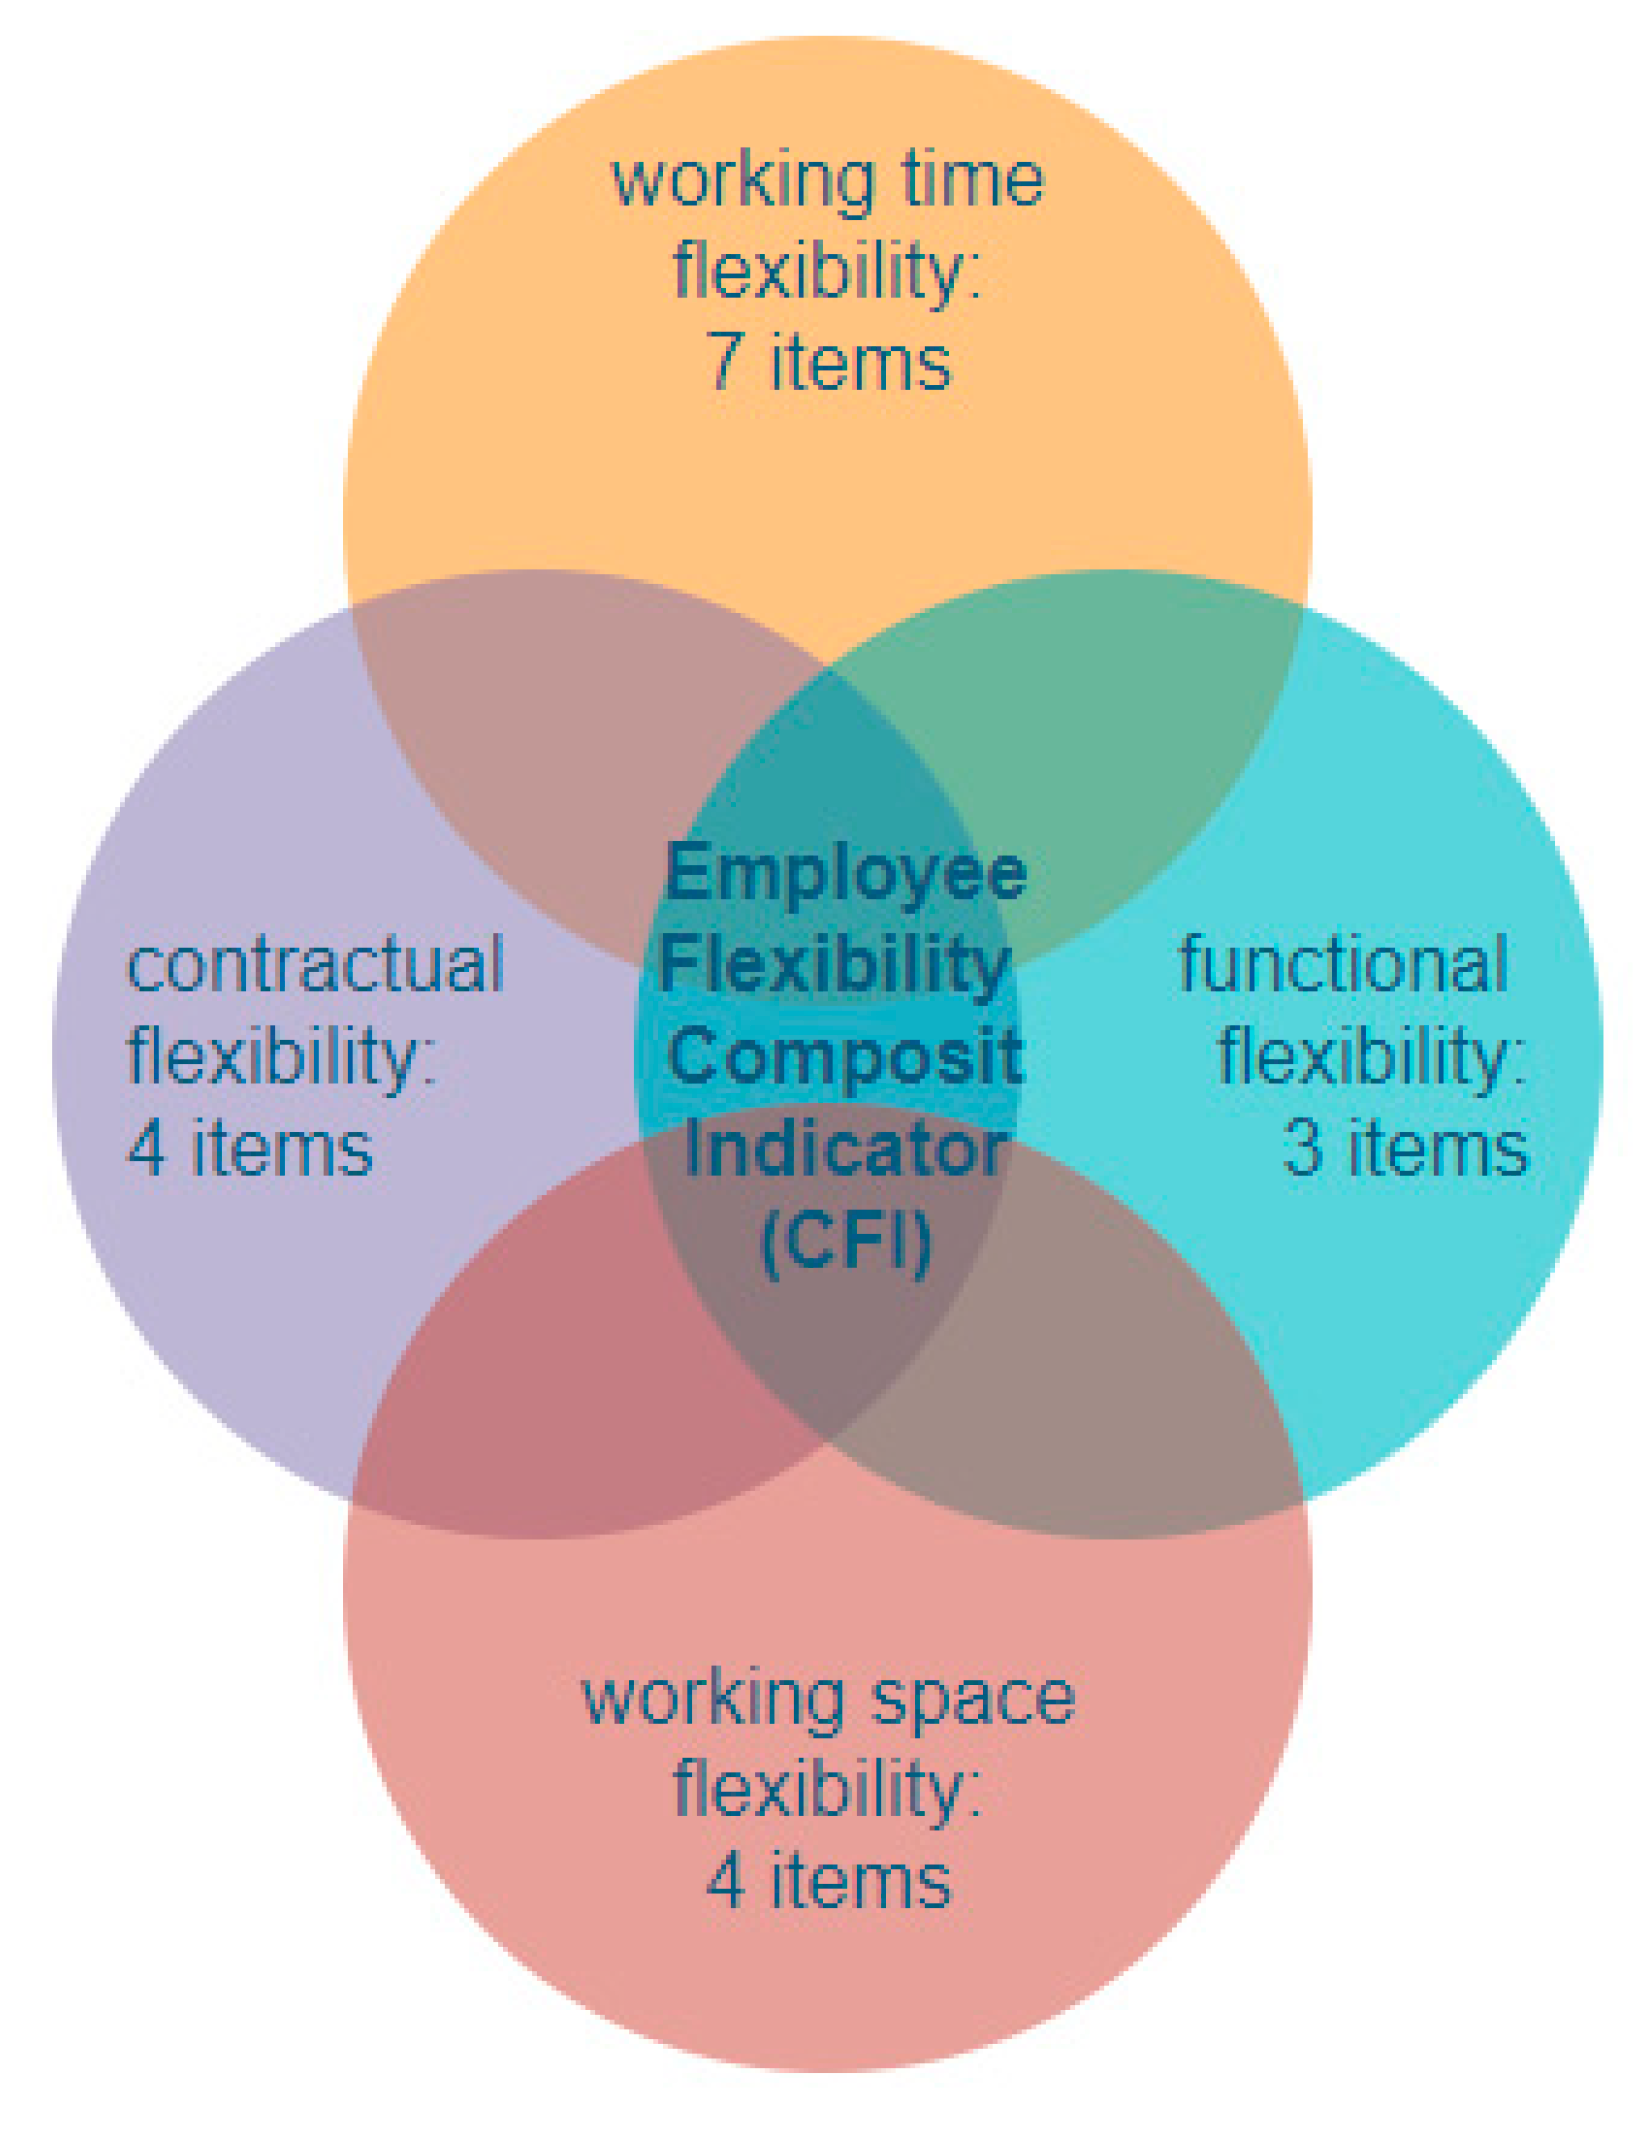
contractual flexibility: four items;
working time flexibility: seven items;
functional flexibility: three items;
working space flexibility: four items.
Taking into account the fact that the variables are dichotomous, multiple correspondence analysis (MCA) has been applied [121]. MCA has been applied by Asselin and Vu Tuan [122] in Vietnam; Ki et al. [123] in Senegal; Ningaye and Ndjanyou [124] and Njong and Ningaye [125] in the case of Cameroon; and be Njong and Ningaye [125], Ezzari and Verme [126], Canuel et al. [127], and Asselin [121] to generate composite indices for poverty.
From the technical point of view, MCA is obtained by using a standard correspondence analysis on an indicator matrix (i.e., a matrix whose entries are 0 or 1). The MCA assumption is extracting a first factor which retains maximum information contained in this matrix and furthermore, to use this information to generate a composite indicator for each employee [128]. The difference between this approach and PCA is that the dependent variable is unobserved and cannot be used directly to estimate correlation coefficients, employee flexibility being considered as a multidimensional latent (unobserved) variable [128].
For the construction of a CFI from K ordinal categorical indicators, the monotonicity axiom, stipulating that if employee “i” increases its situation for a given variable, then its composite flexibility index value CFIi increases: its flexibility level increases (larger values mean higher flexibility).
The monotonicity axiom translates into the first axis ordering consistency (FAOC) principle [123]. This implies that the first axis must have growing factorial scores indicating a movement from non-flexible to flexible working status. For each of the nominal variables, the MCA calculates a discrimination measure on each of the factorial axes. It represents the variance of the factorial scores of all the modalities of the variable on the axis and measures the magnitude with which the variable explains the axis.
Category quantification plots represent an alternative method of presenting discrimination of variables that can identify category relationships. The coordinates of each category on each dimension are presented in order to dispose which categories are related to each variable [129].
In order to build the composite indicator of flexibility, the weights given by MCA, corresponding to the standardized scores on the first factorial axis, will be used. When all the variable modalities have been converted into a dichotomous nature coded 0/1, giving a total of P binary indicators, the CFI for a certain employee “i” can be written as [121]
C P I i = 1 K ( W 1 I i 1 + W 2 I i 2 + + W p I i p ) ,
where W = the weight (score of first standardized axis, (score/√λ1)) of category p, I p = binary indicator 0/1, which takes on the value 1 when the employee has the modality and 0 otherwise. The CFI value reflects the average global flexibility level of a particular employee. Furthermore, the index is transformed using the percentile rank to take values between 0 and 100.
Using the composite indicator of employee work flexibility, we can assess the impact of work flexibility on the overall level of job satisfaction using binomial logistic regression. Alternatively, as robustness analysis, we have taken into account in the analysis the potential influence of each type of work flexibility (contractual flexibility, working time, and functional flexibility and workspace flexibility) together with individual control variables on the job satisfaction.
In order to do that, we have considered:
-
Dependent variable:
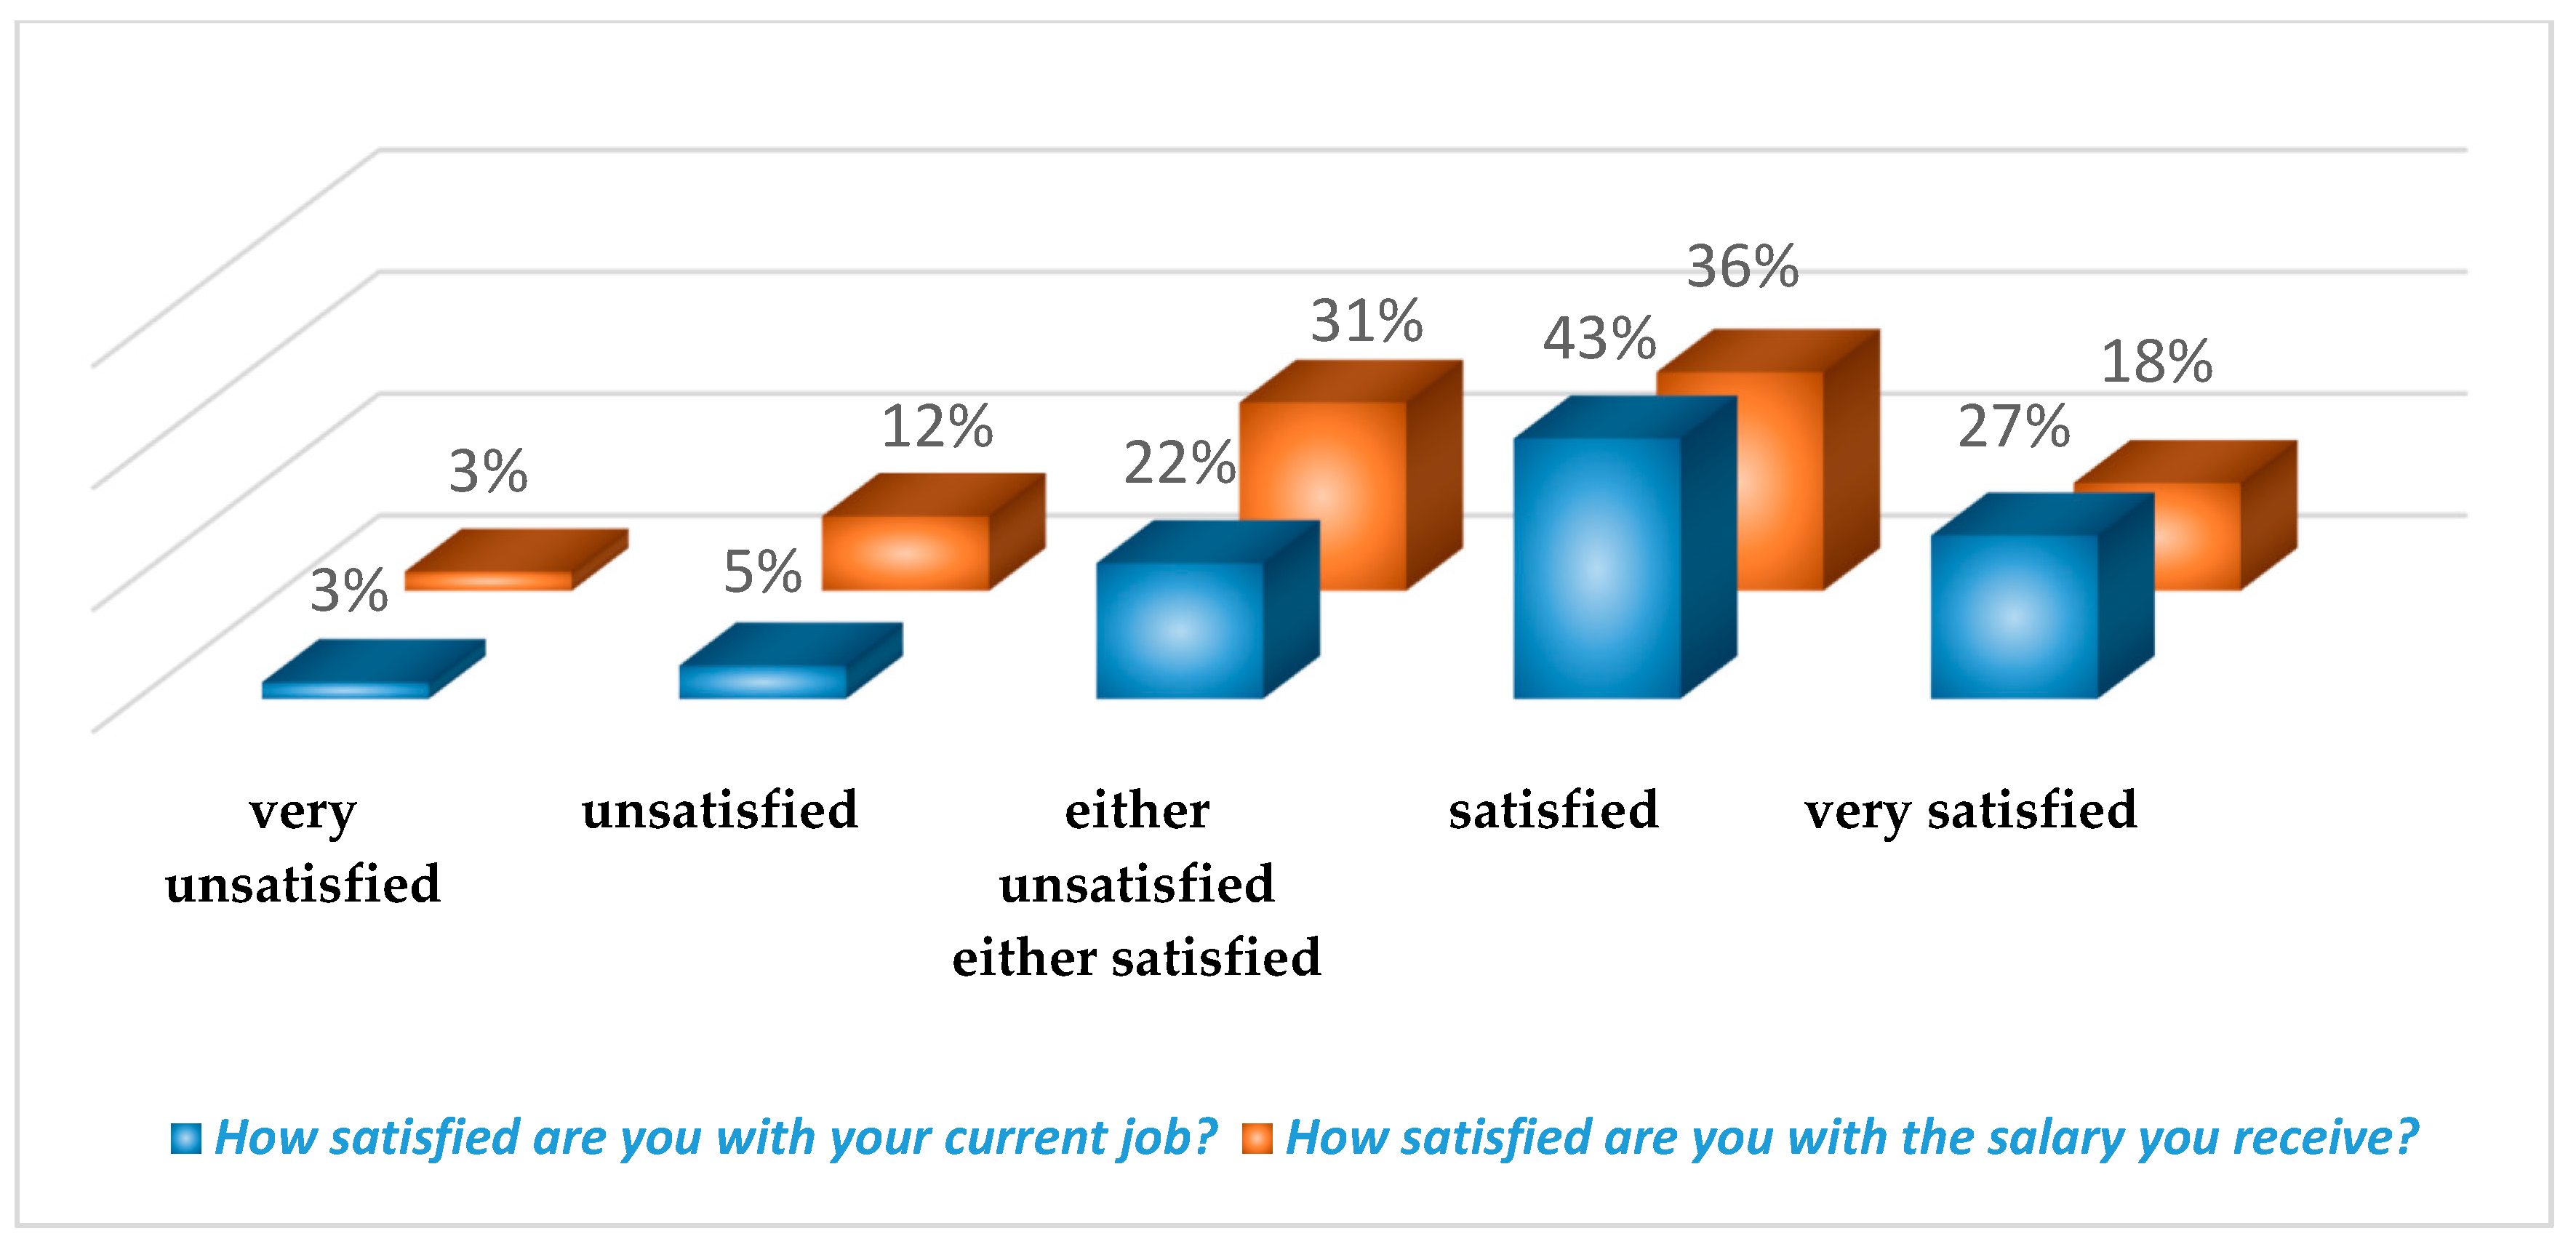
  • Job satisfaction level was measures using a five-point Likert scale using the following categories: 1—very dissatisfied to 5—very satisfied answering to the following question: Are you satisfied with your current job? Furthermore, the variable has been transformed into a dichotomous one with the categories 1—satisfied and 0—otherwise.
-
Explanatory variables on work flexibility:
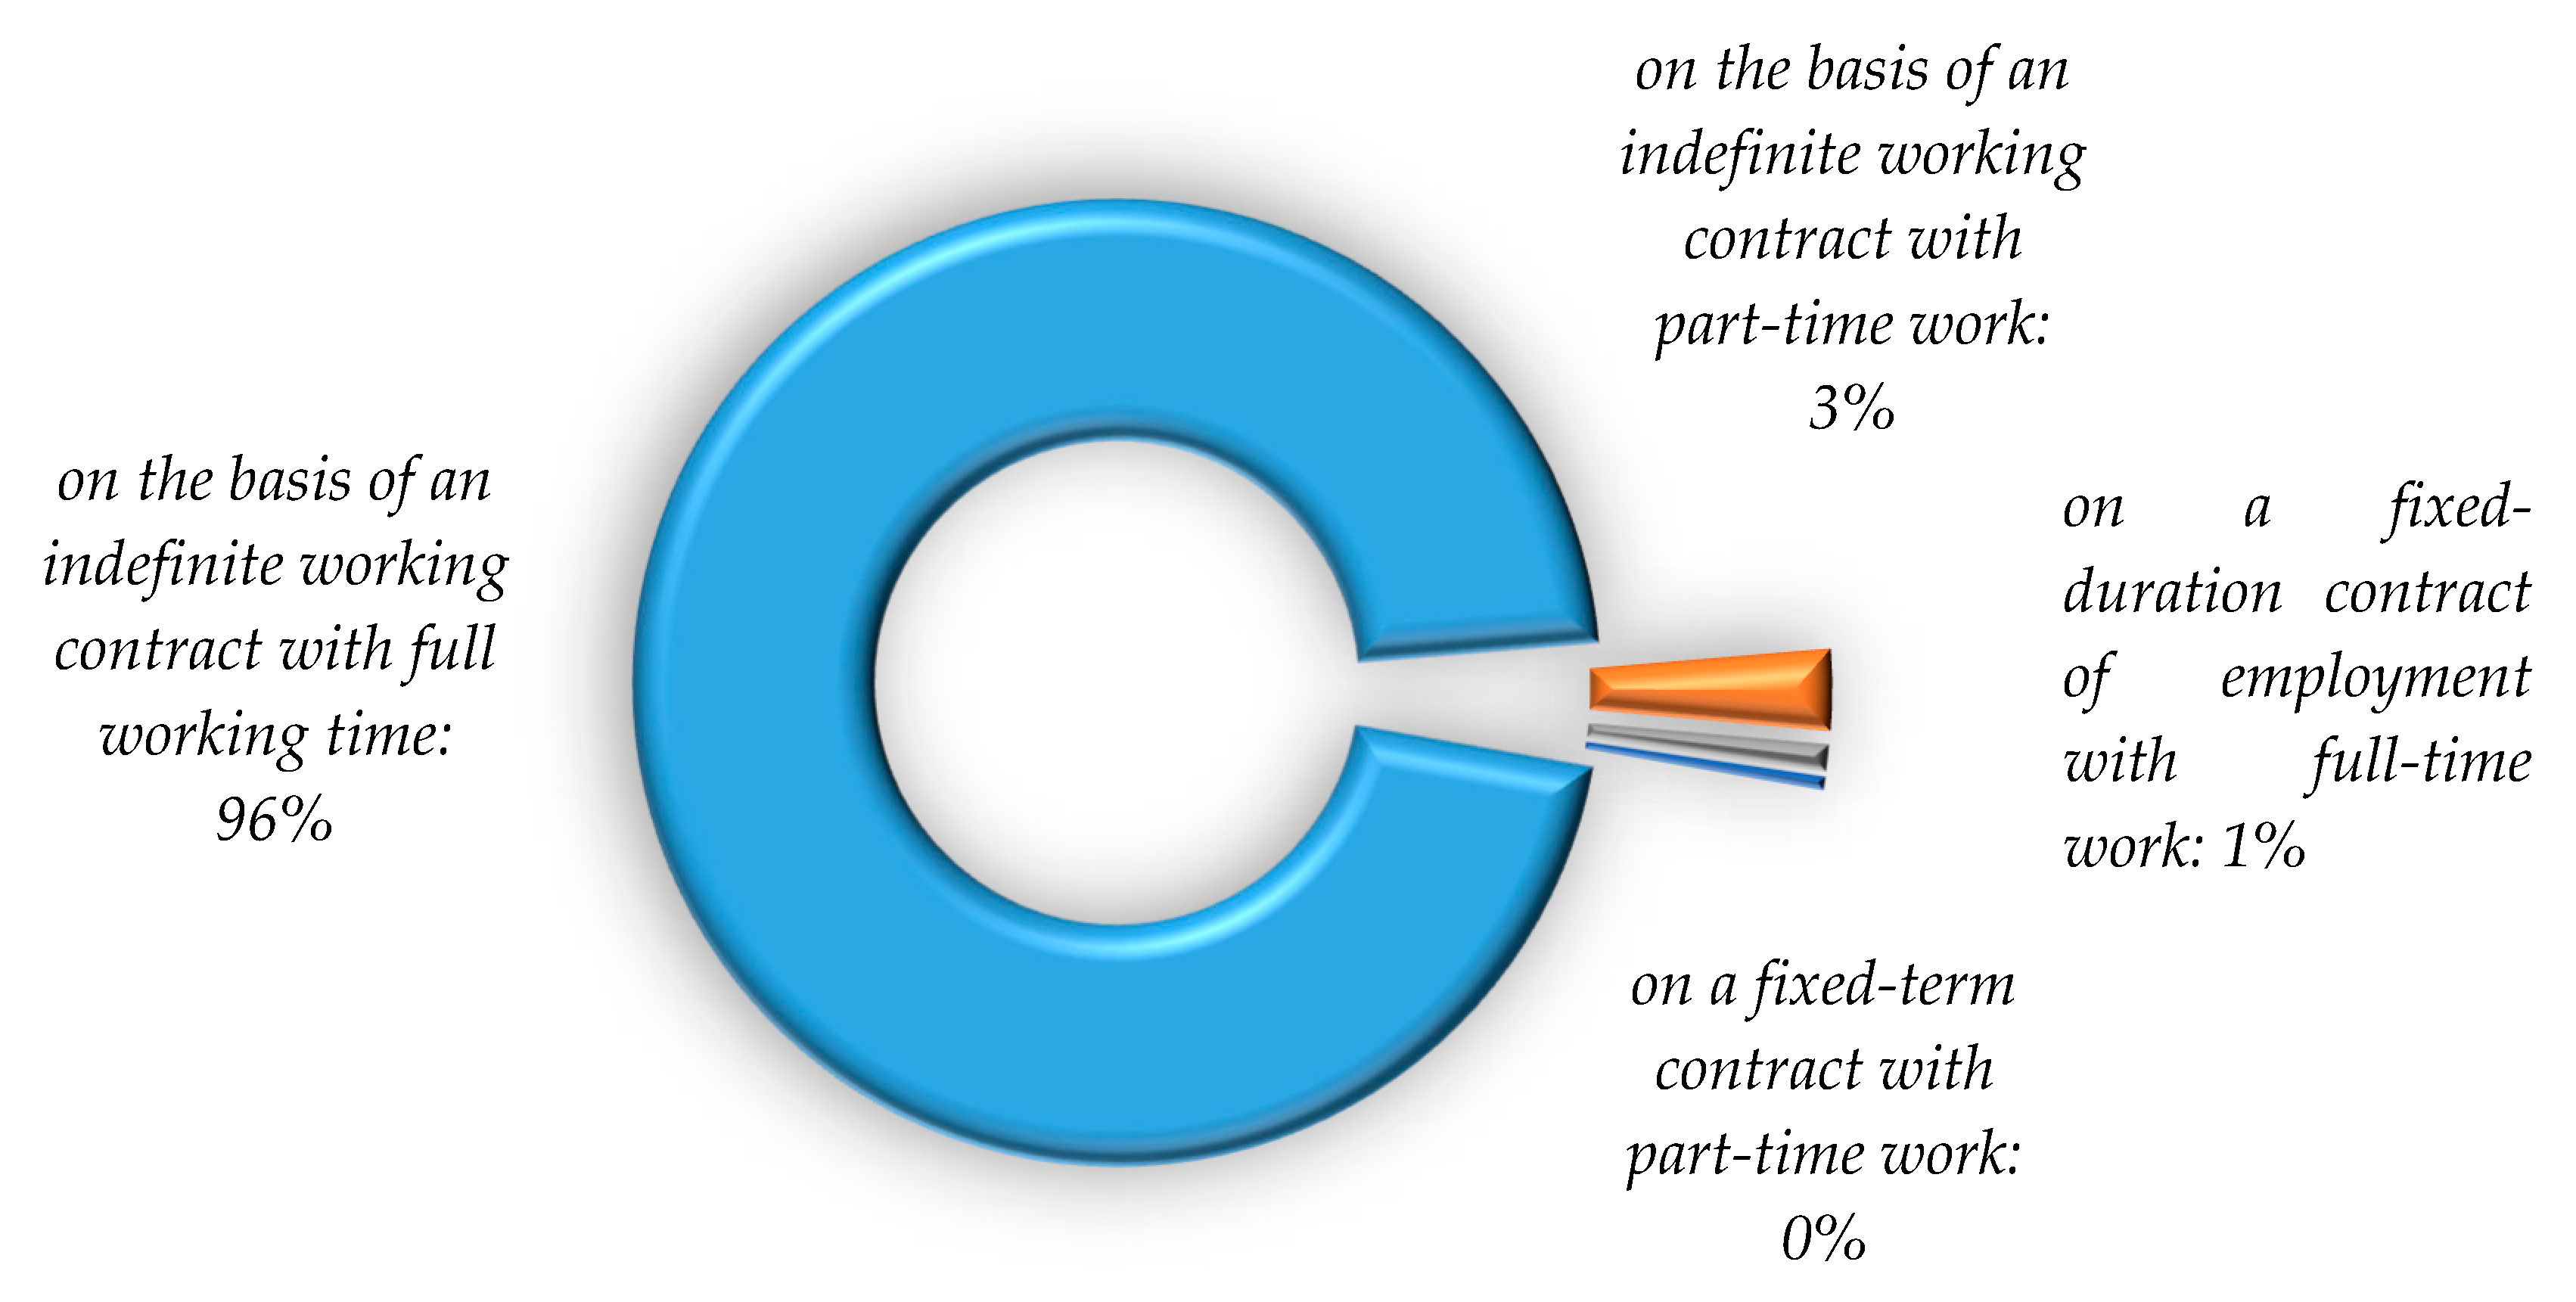
  • Contractual flexibility: Within the organization you are employed: (1) based on an indefinite duration employment contract with full time working; (2) on the basis of an employment contract of indefinite duration with part-time work; (3) based on a fixed-term employment contract with full working time; (4) based on a fixed-term employment contract with part-time work; (5) based on home working contract; based on “telework” contract (work at distance, from home or from a space near the house); based on other types of contracts (on call, job sharing) coded with 1—yes, 0—no.
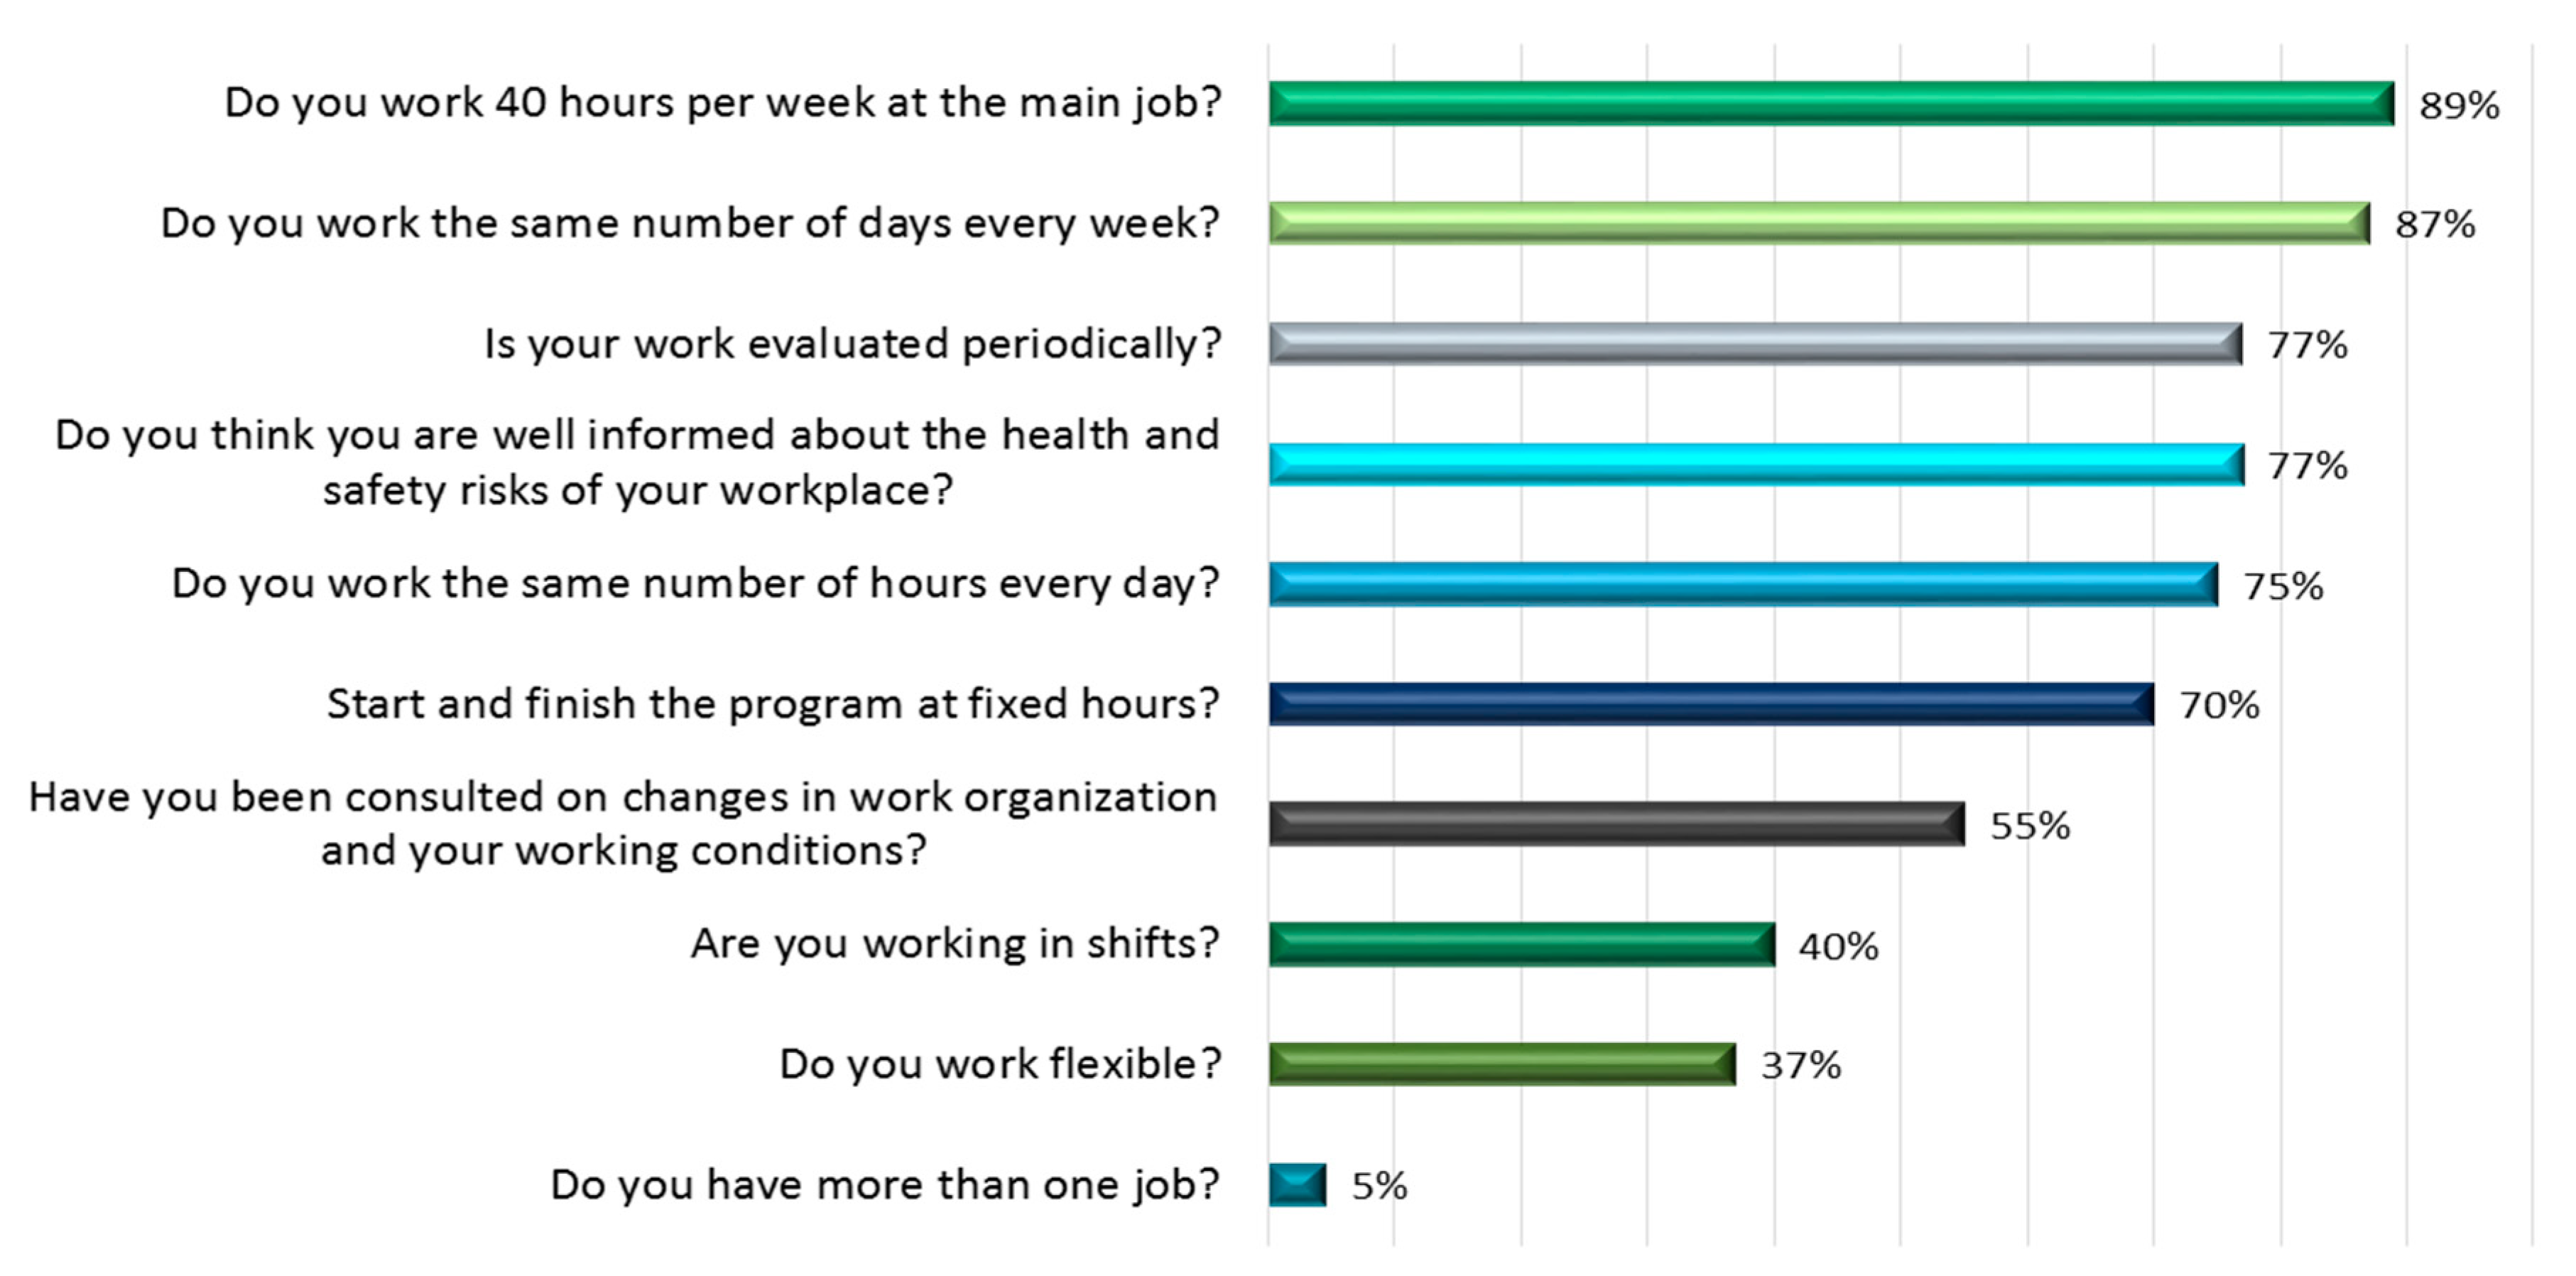
  • Elements of working time flexibility coded by 1—yes, 0—no: Do you work 40 h a week at the main job? Do you have more than one job? Do you work the same number of hours every day? Do you work the same number of days every week? Do you start and end the program at fixed hours? Do you work in shifts? Do you work flexible hours?
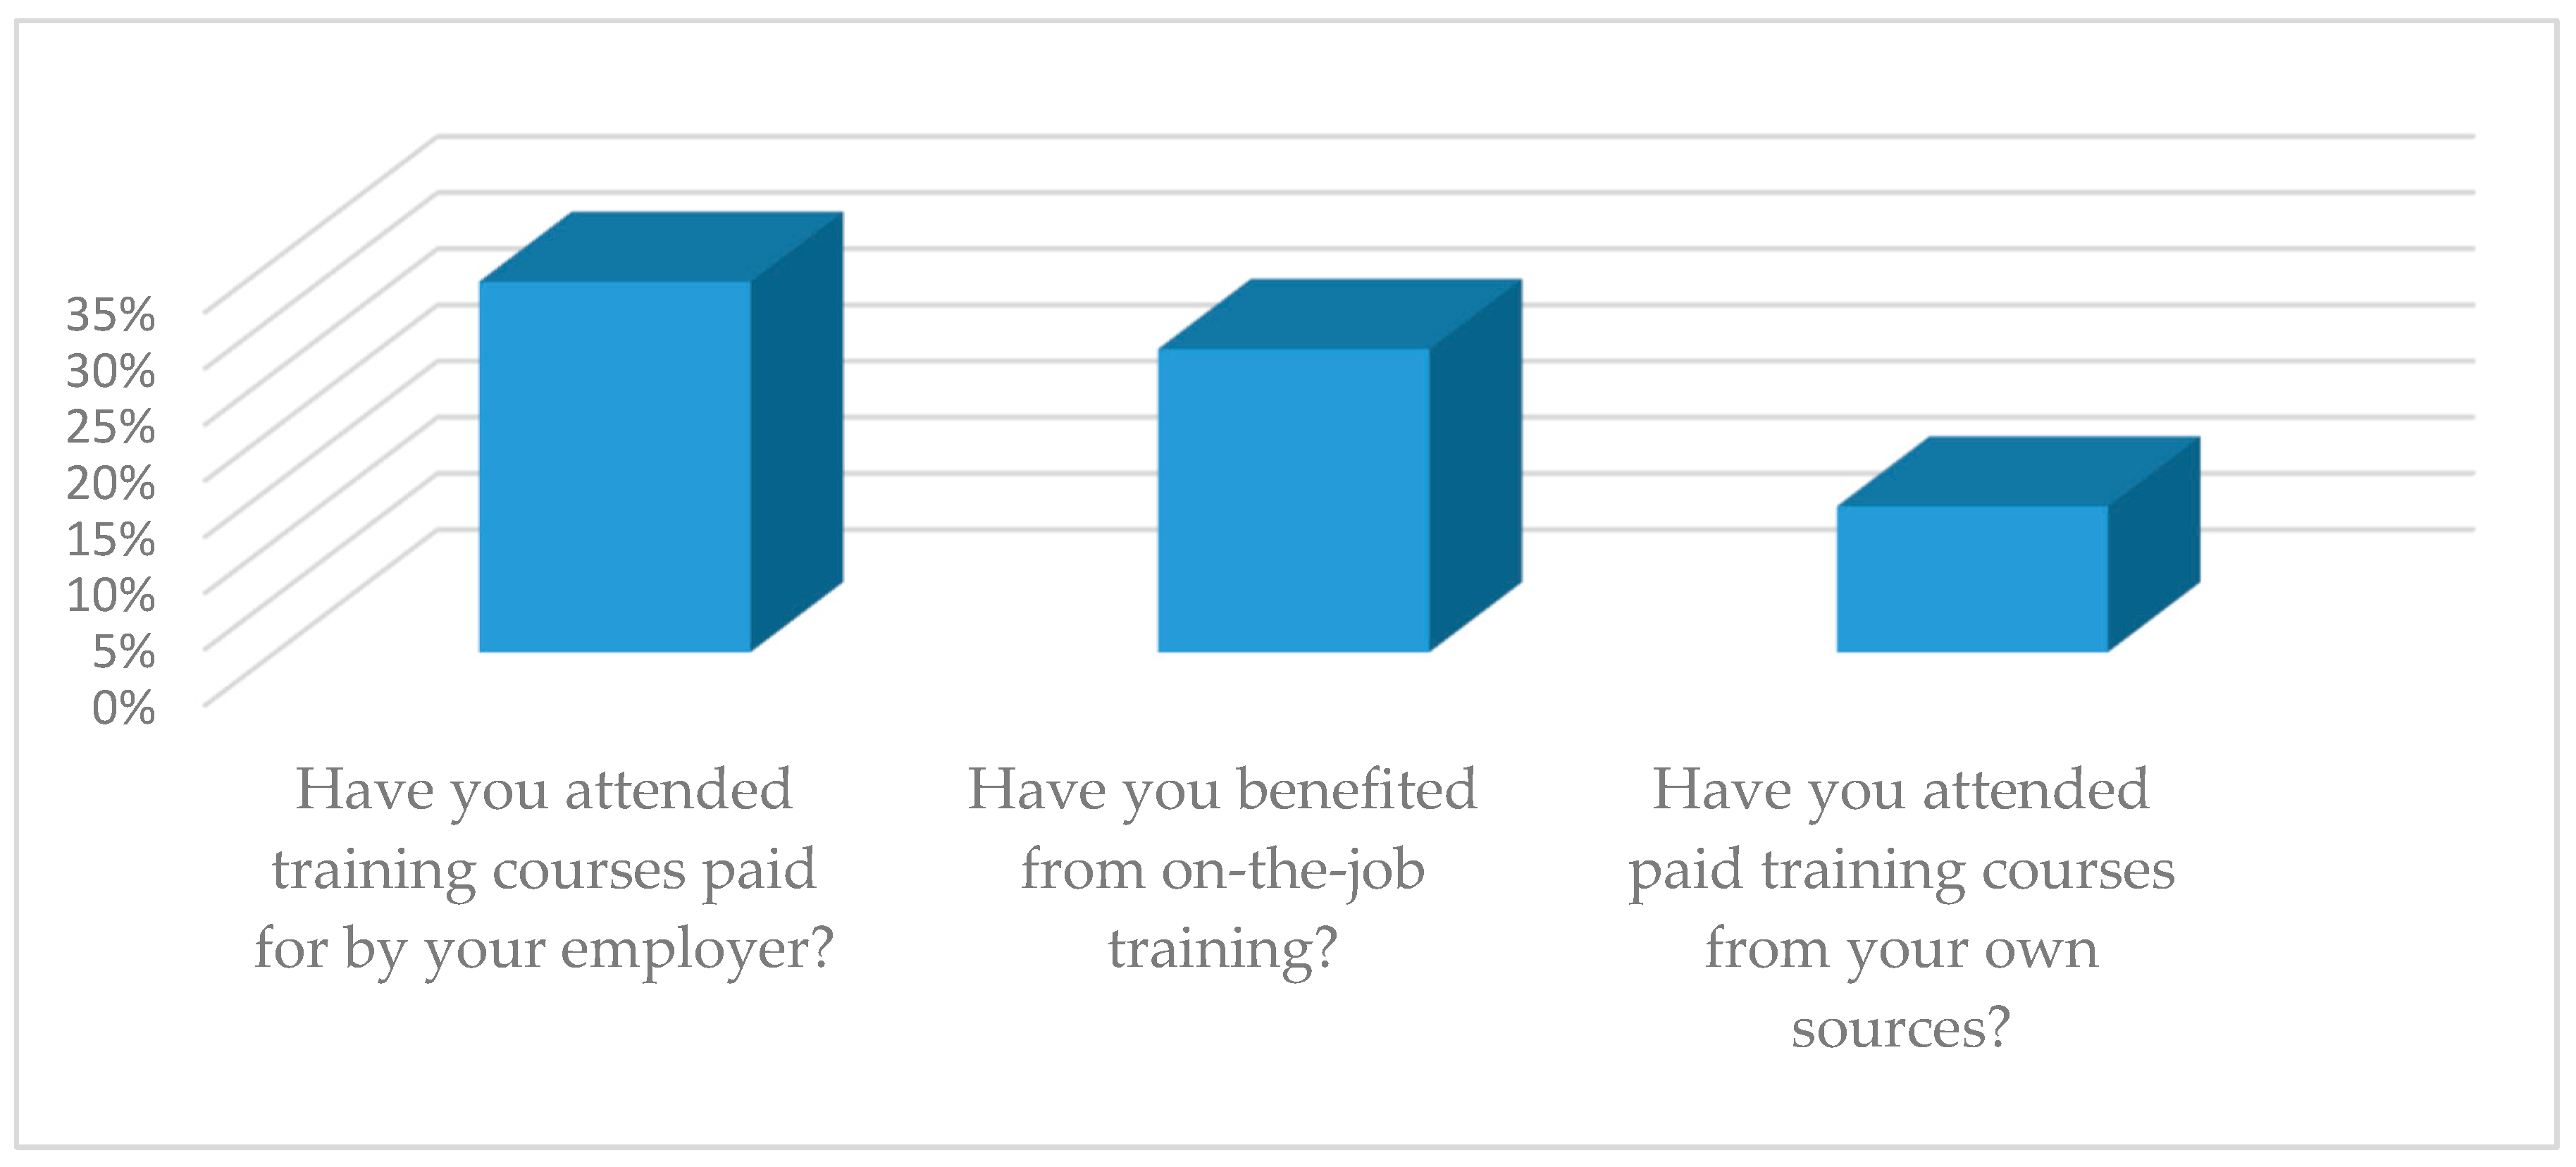
  • Elements of functional flexibility conditioned by 1—yes, 0—no: Participation in training courses paid by the employer; Participation in payment courses from own sources; Beneficiaries of on-the-job training;
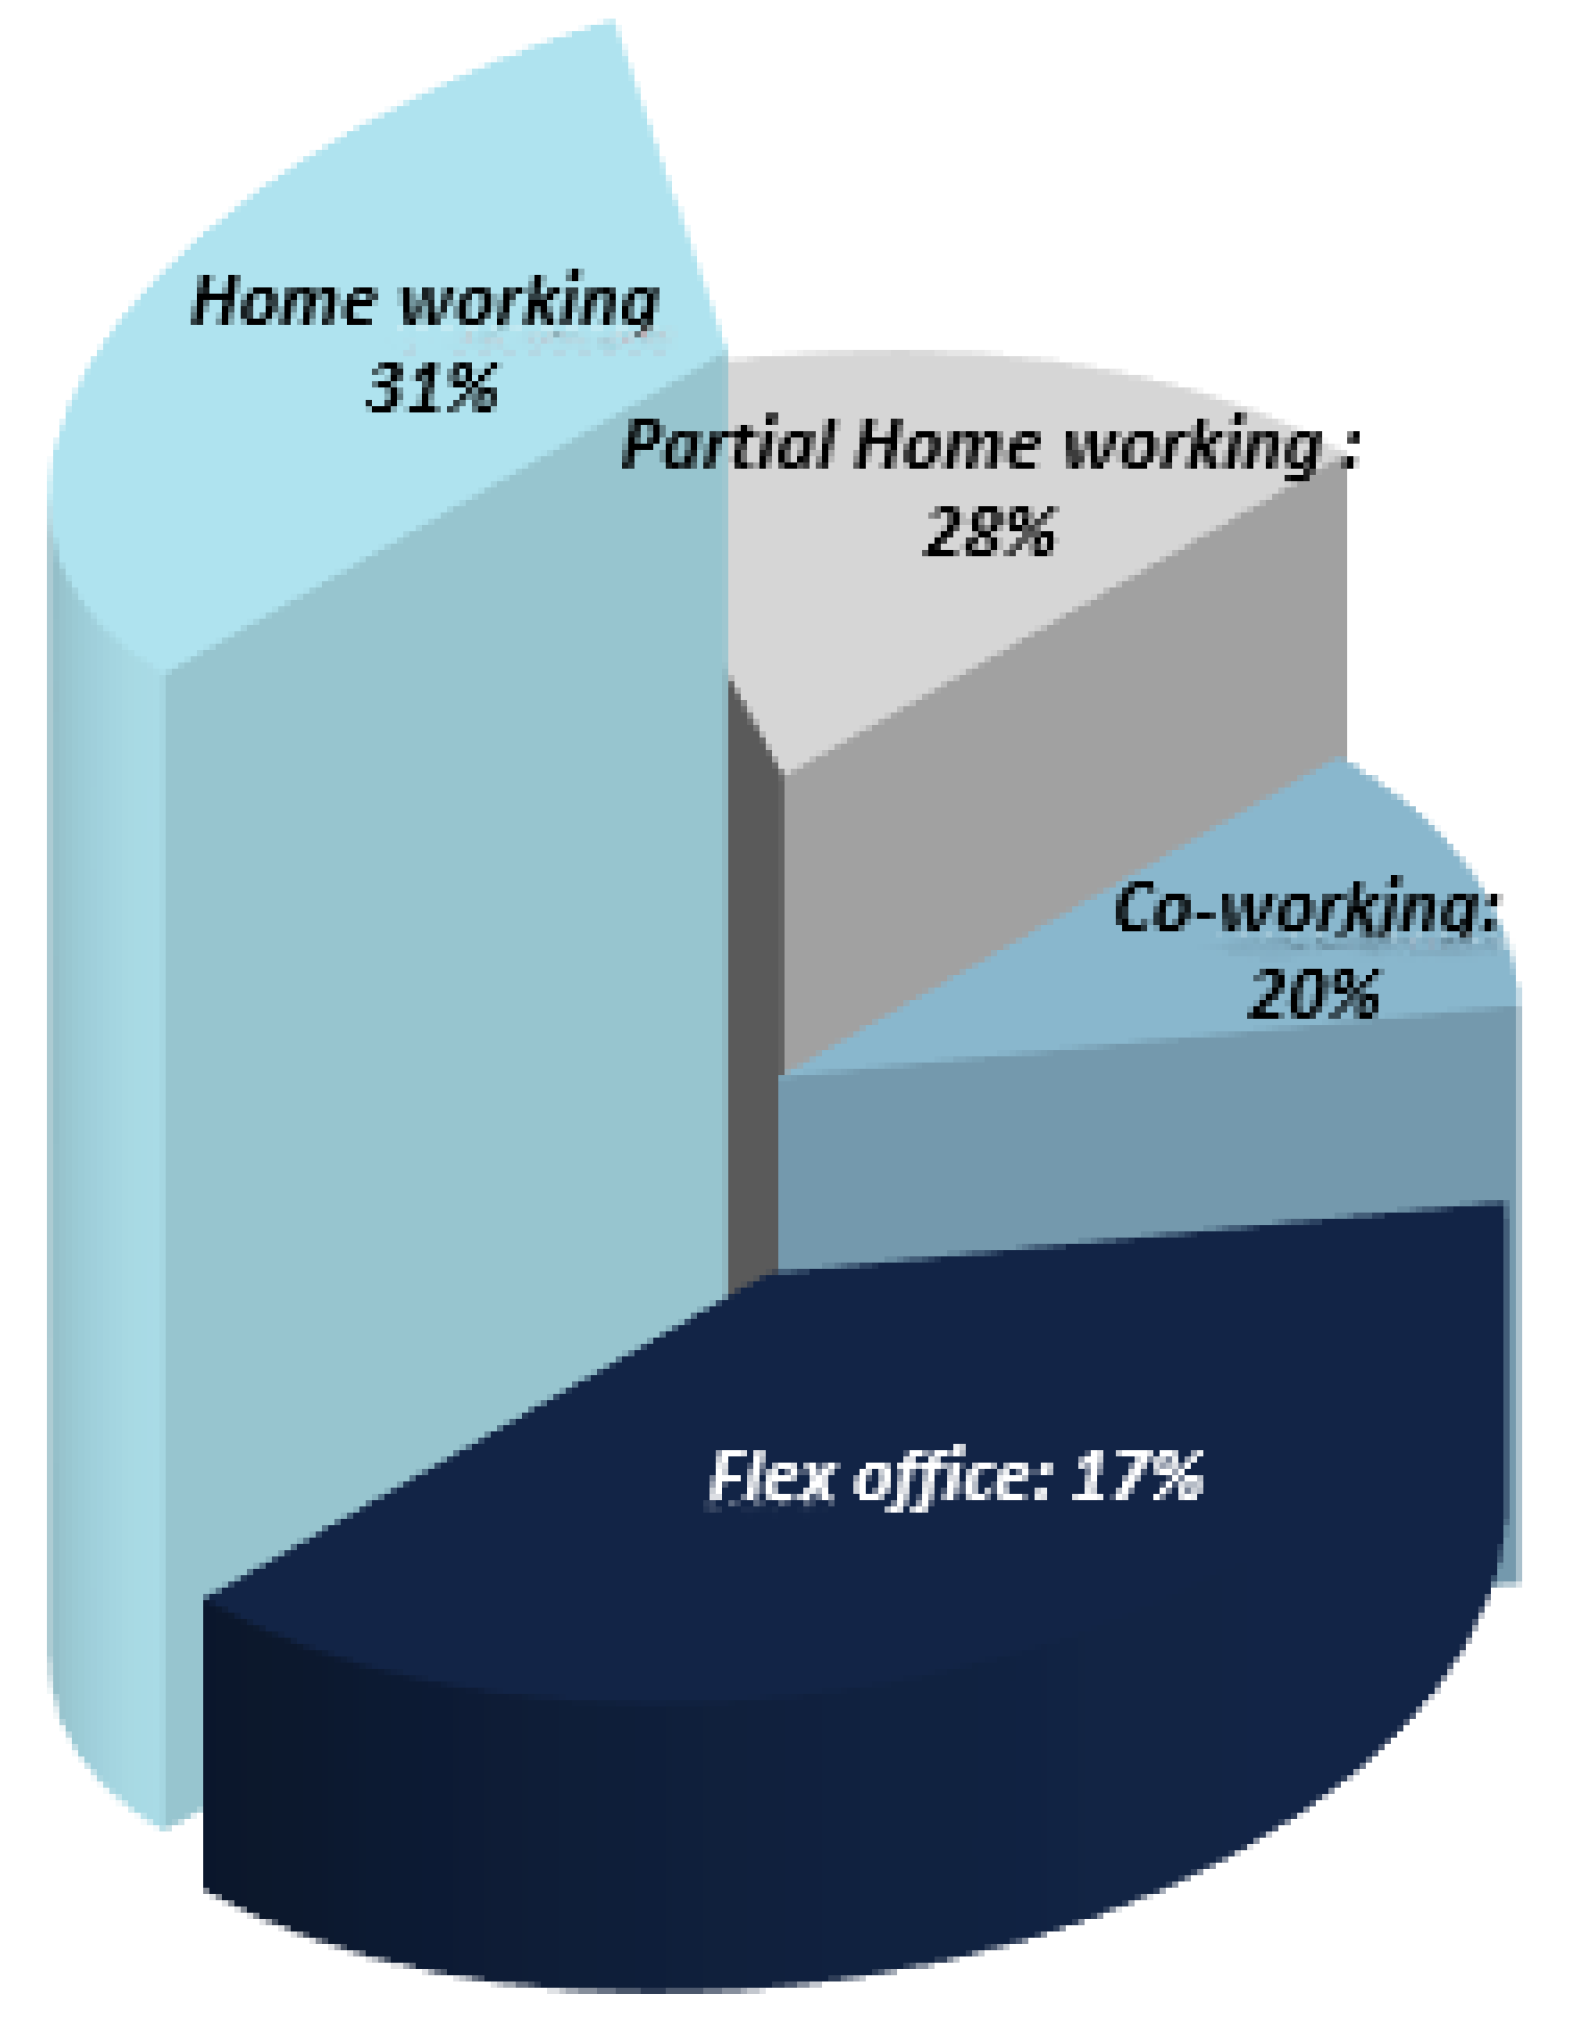
  • Elements of new workspace flexibility, coded by 1—yes, 0—no: total home working, partial home working, coworking, and flex office.
-
Control variables:
  • Gender: a dummy variable in which 1—man and 2—women.
  • Age: a polychotomous variable with values: 1 for under 26 years, 2 for 26–35 years, 3 for 36–45 years, 4 for 46–55 years, 5 for over 55 years.
  • Principal occupation: a polychotomous variable with the following values: 1—specialist with higher education; 2—general manager, director or person holding a senior management position; 3—person holding a middle management position (head of department, head of office); 4—Technician; 5—employee in public services (hospital, public catering, education, police, fire, etc.); 6—skilled worker; 7—unskilled worker; 8—another situation.
  • Degree of salary satisfaction: a dichotomous variable that answers the question, How satisfied are you with the salary you receive? With: 1—satisfied, 0—otherwise.
  • Degree of satisfaction regarding working conditions: a dichotomous variable that answers the question, How satisfied are you with working conditions? With: 1—satisfied, 0—otherwise.
  • Seniority within the company: a polychotomous variable with values: 1 for under 1 year; 2 for 1–3 years; 3 for 3–5 years; 4 for 5–10 years; 5 for over 10 years.
  • Company size: a polychromatic variable with the following values: 1 for 1–9 employees; 2 for 10–49 employees; 3 for 50–249 employees; 4 for more than 250 employees.
  • Sector of activity: a polychotomous variable with values 1—agriculture; 2—manufacturing industry; 3—wholesale; 4—retail trade; 5—services; 6—construction; 7—other sector.
  • Legal status of the company: a polychotomous variable with values 1—limited liability company (srl); 2—joint stock company; 3—partnership; 4—limited partnership (joint stock company); 5—autonomous company; 6—national society; 7—other.
Logistic regression models the relationship between a set of independent variables xi (categorical, continuous) and a dichotomous dependent variable (nominal, binary) Y. Such a dependent variable occurs when it belongs to two classes, categories—presence/absence, yes/no.
The regression equation obtained provides information about (1) the importance of variables in class differentiation and (2) the classification of an observation into a class. Logistic regression can be extended to incorporate more than one explanatory variable, which can be quantitative or qualitative. The logistic regression model can then be written as follows:
ln ( p 1 p ) = β 0 + β 1 x 1 + β 2 x 2 + + β k x k ,
where p being P(y = 1|x1, x2,…, xk) and is the probability of the event and x1, x2, … xk are the explanatory variables:
P ( y = 1   | x 1 ,   x 2 , , x k ) = exp ( β 0 + β 1 x 1 + β 2 x 2 + + β k x k ) 1 + exp ( β 0 + β 1 x 1 + β 2 x 2 + + β k x k ) ,
For the coefficient βi, we obtain
exp β 0 = P ( y = 1   |   x 1 ,   x 2 , , x k = 0 ) 1 P ( y = 1   |   x 1 ,   x 2 , , x k ) = P ( y = 1   | x 1 ,   x 2 , , x k = 0 P ( y = 0   |   x 1 ,   x 2 , , x k = 0 ,
After estimating the coefficients, the significance of the coefficients, the general goodness of the model classification, and the capacity of the model to discriminate between the two groups defined by the response variable is evaluated.
When building the model step by step, checking if the variable removed from the model is significant, so if the model can be simplified, the LR test is recommended.
Because some data is “rare” (scattered), statistics comparing two models is not distributed χ2, using the Hosmer–Lemeshow test. The test consists of classifying the predicted probabilities into deciles (10 groups based on the percentile rank) and calculating the χ2 statistic that compares the observed frequencies with the predicted ones. Small values of the statistics indicate a good fit of the forecasted data, so an adequacy of the model. In the logistic regression, were used Cox & Snell Pseudo-R2 and Nagelkerke Pseudo-R2 as goodness of fit indicators.

4. Empirical Results

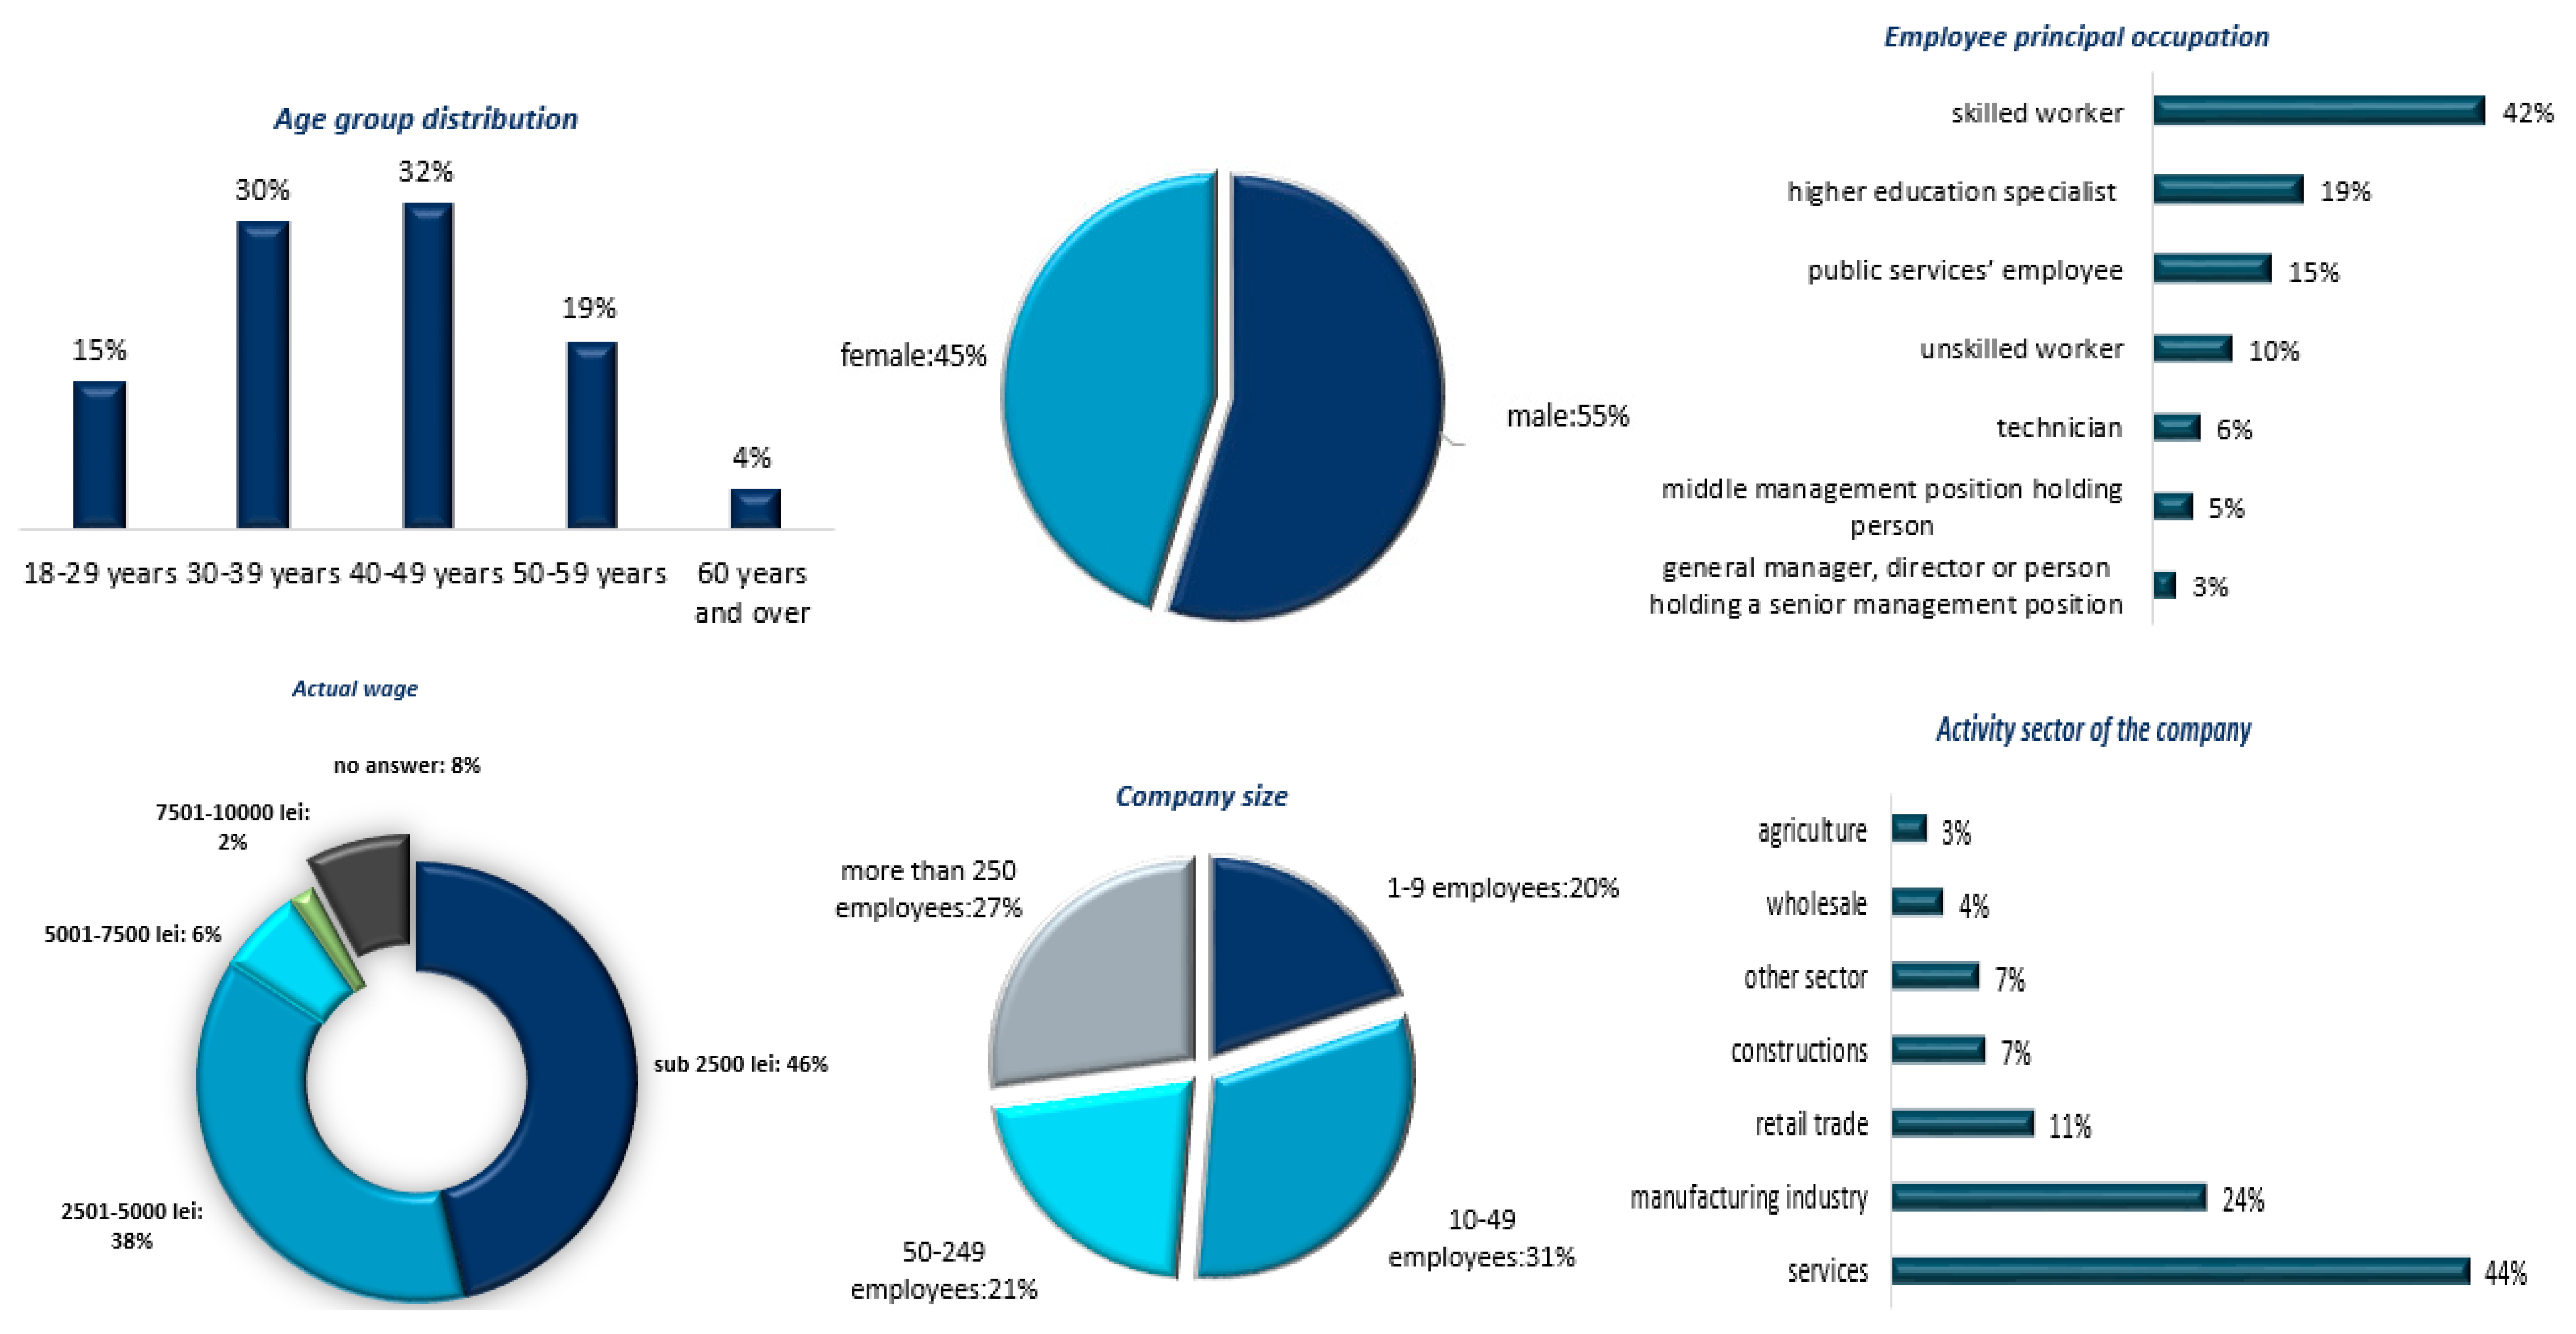
4.1. Romanian Employee Sample Profile

From the total of 220 Romanian employees interviewed, 55% were males, 30% aged between 36–45 years old, and 30% aged between 46–55 years old. Five percent of them registered their age as under 26 years old, and 7% were elderly (55 years and over). Almost 27% of employees have as length of service over 10 years, while 82% of employees declared not to have management position experience. Regarding the received monthly salary, 46% of the respondents declared to earn less than 2500 lei, while only 38% of them declared to earn between 2500–5000 lei. Only a very small proportion of 2% of the respondents declared to have a salary greater than 7500 lei.
Taking into account professional status, 42% of employees were declared to be skilled workers, only 19% were higher education specialists, and 15% were public services employees. Most of the employees come from Bucharest-Ilfov (20%) or the north-west and center regions (13%), most of them working in small companies with at most 50 employees (31%), followed by those ones from large companies (27%), from services (44%), manufacturing industry (24%), and retail trade (11%). Seventy percent of respondents were declared to work in limited liability companies, and only 7% were in the public sector (Figure 3).

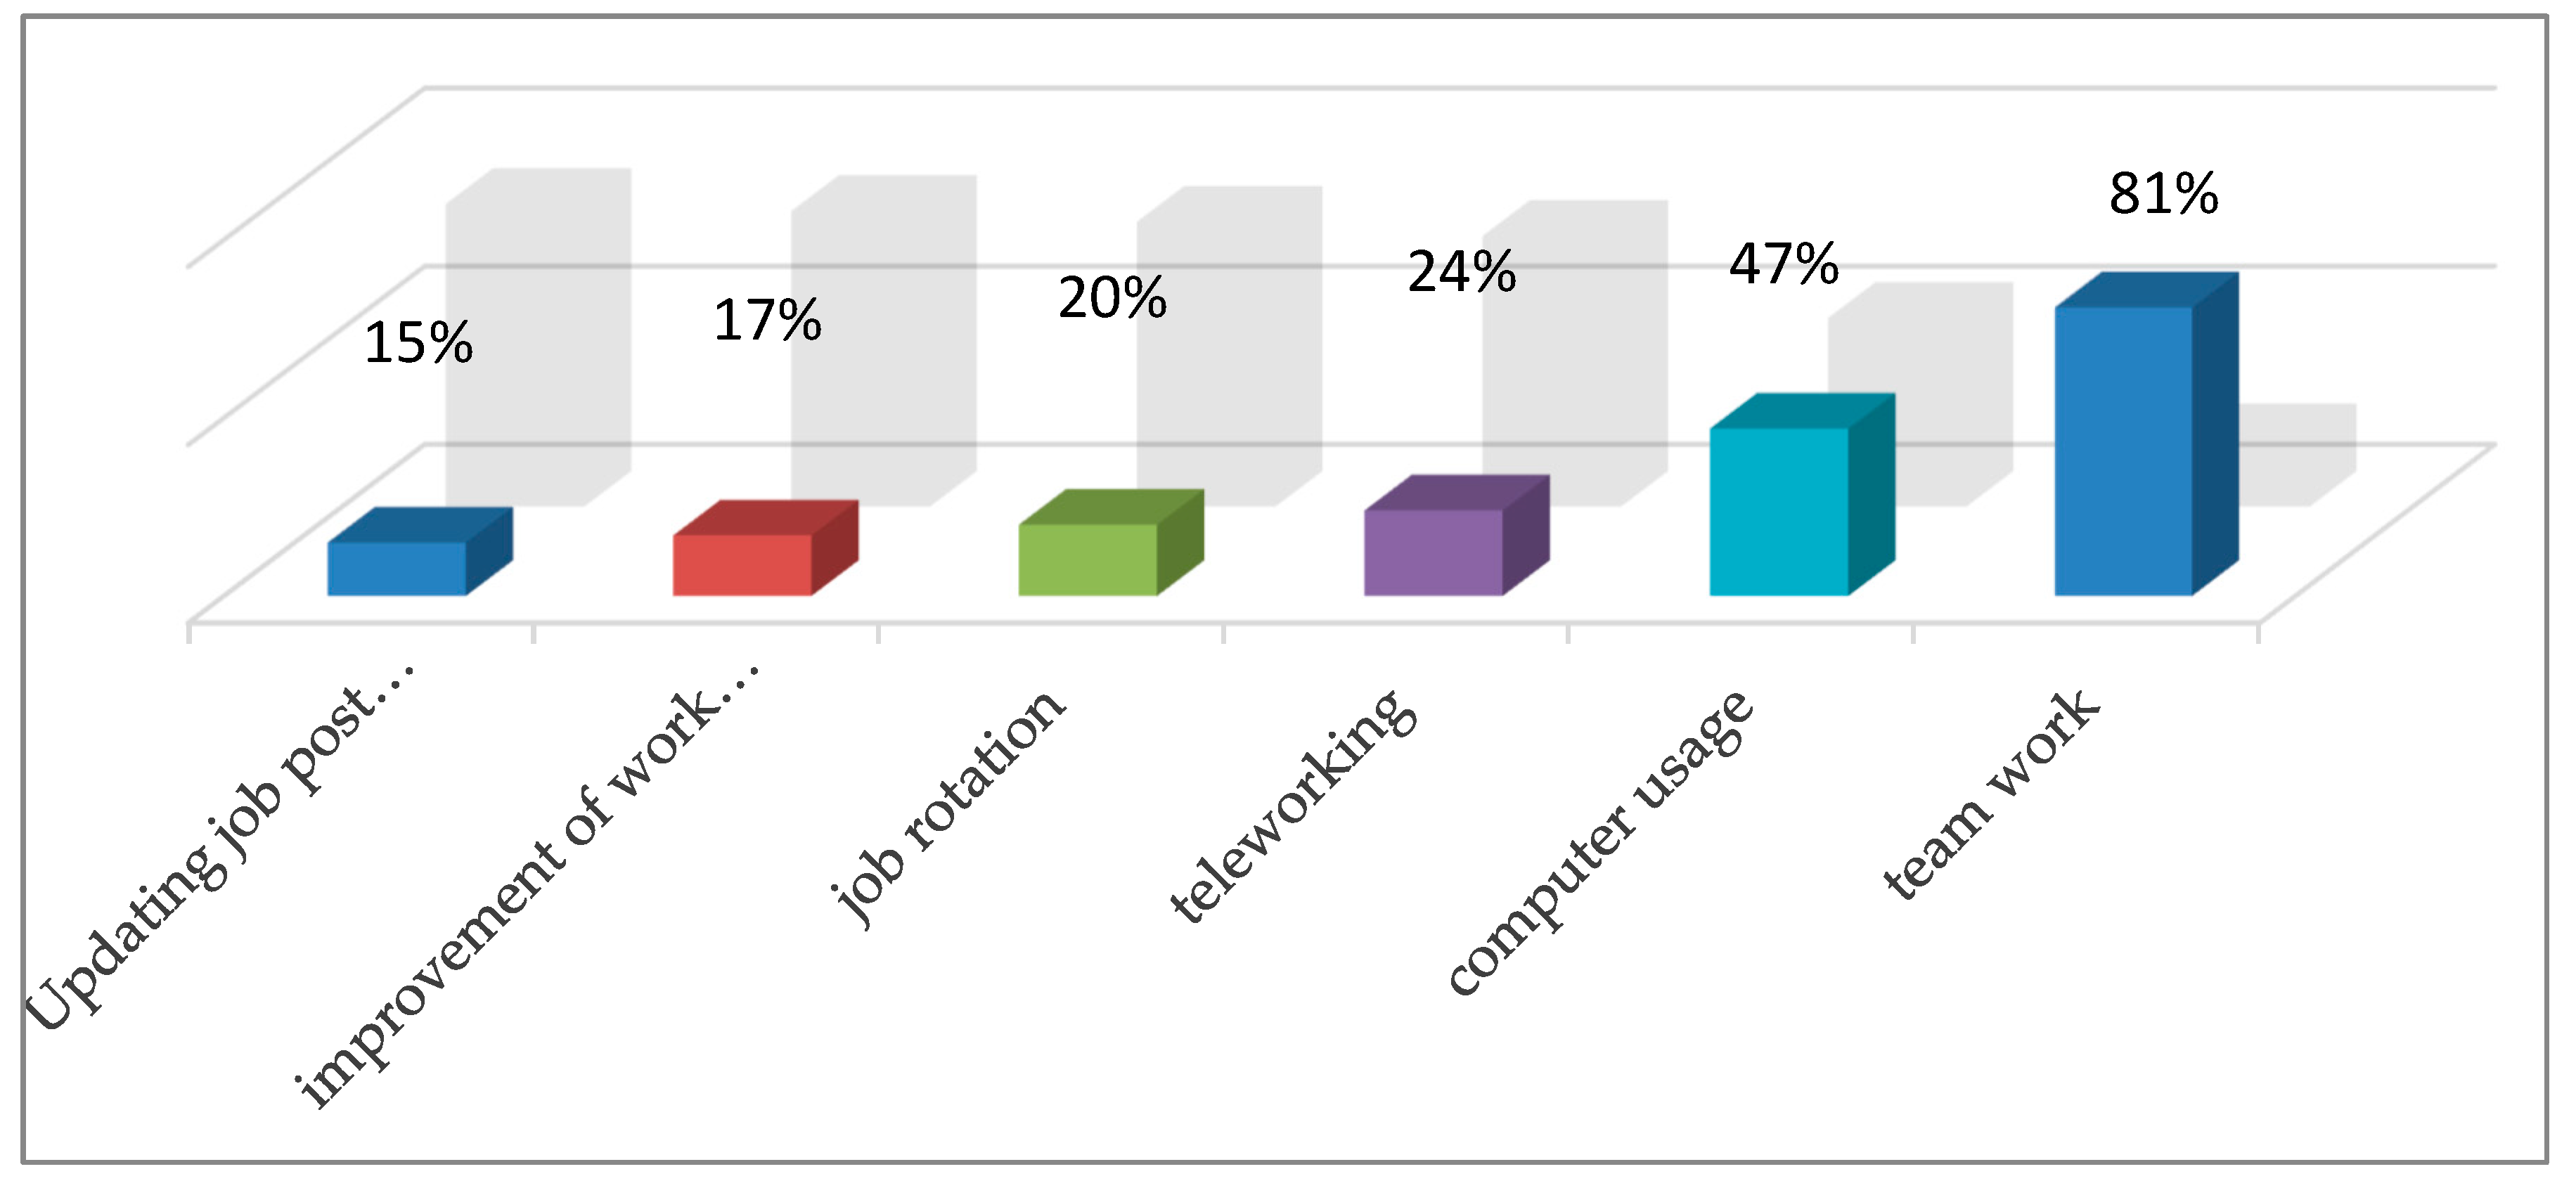
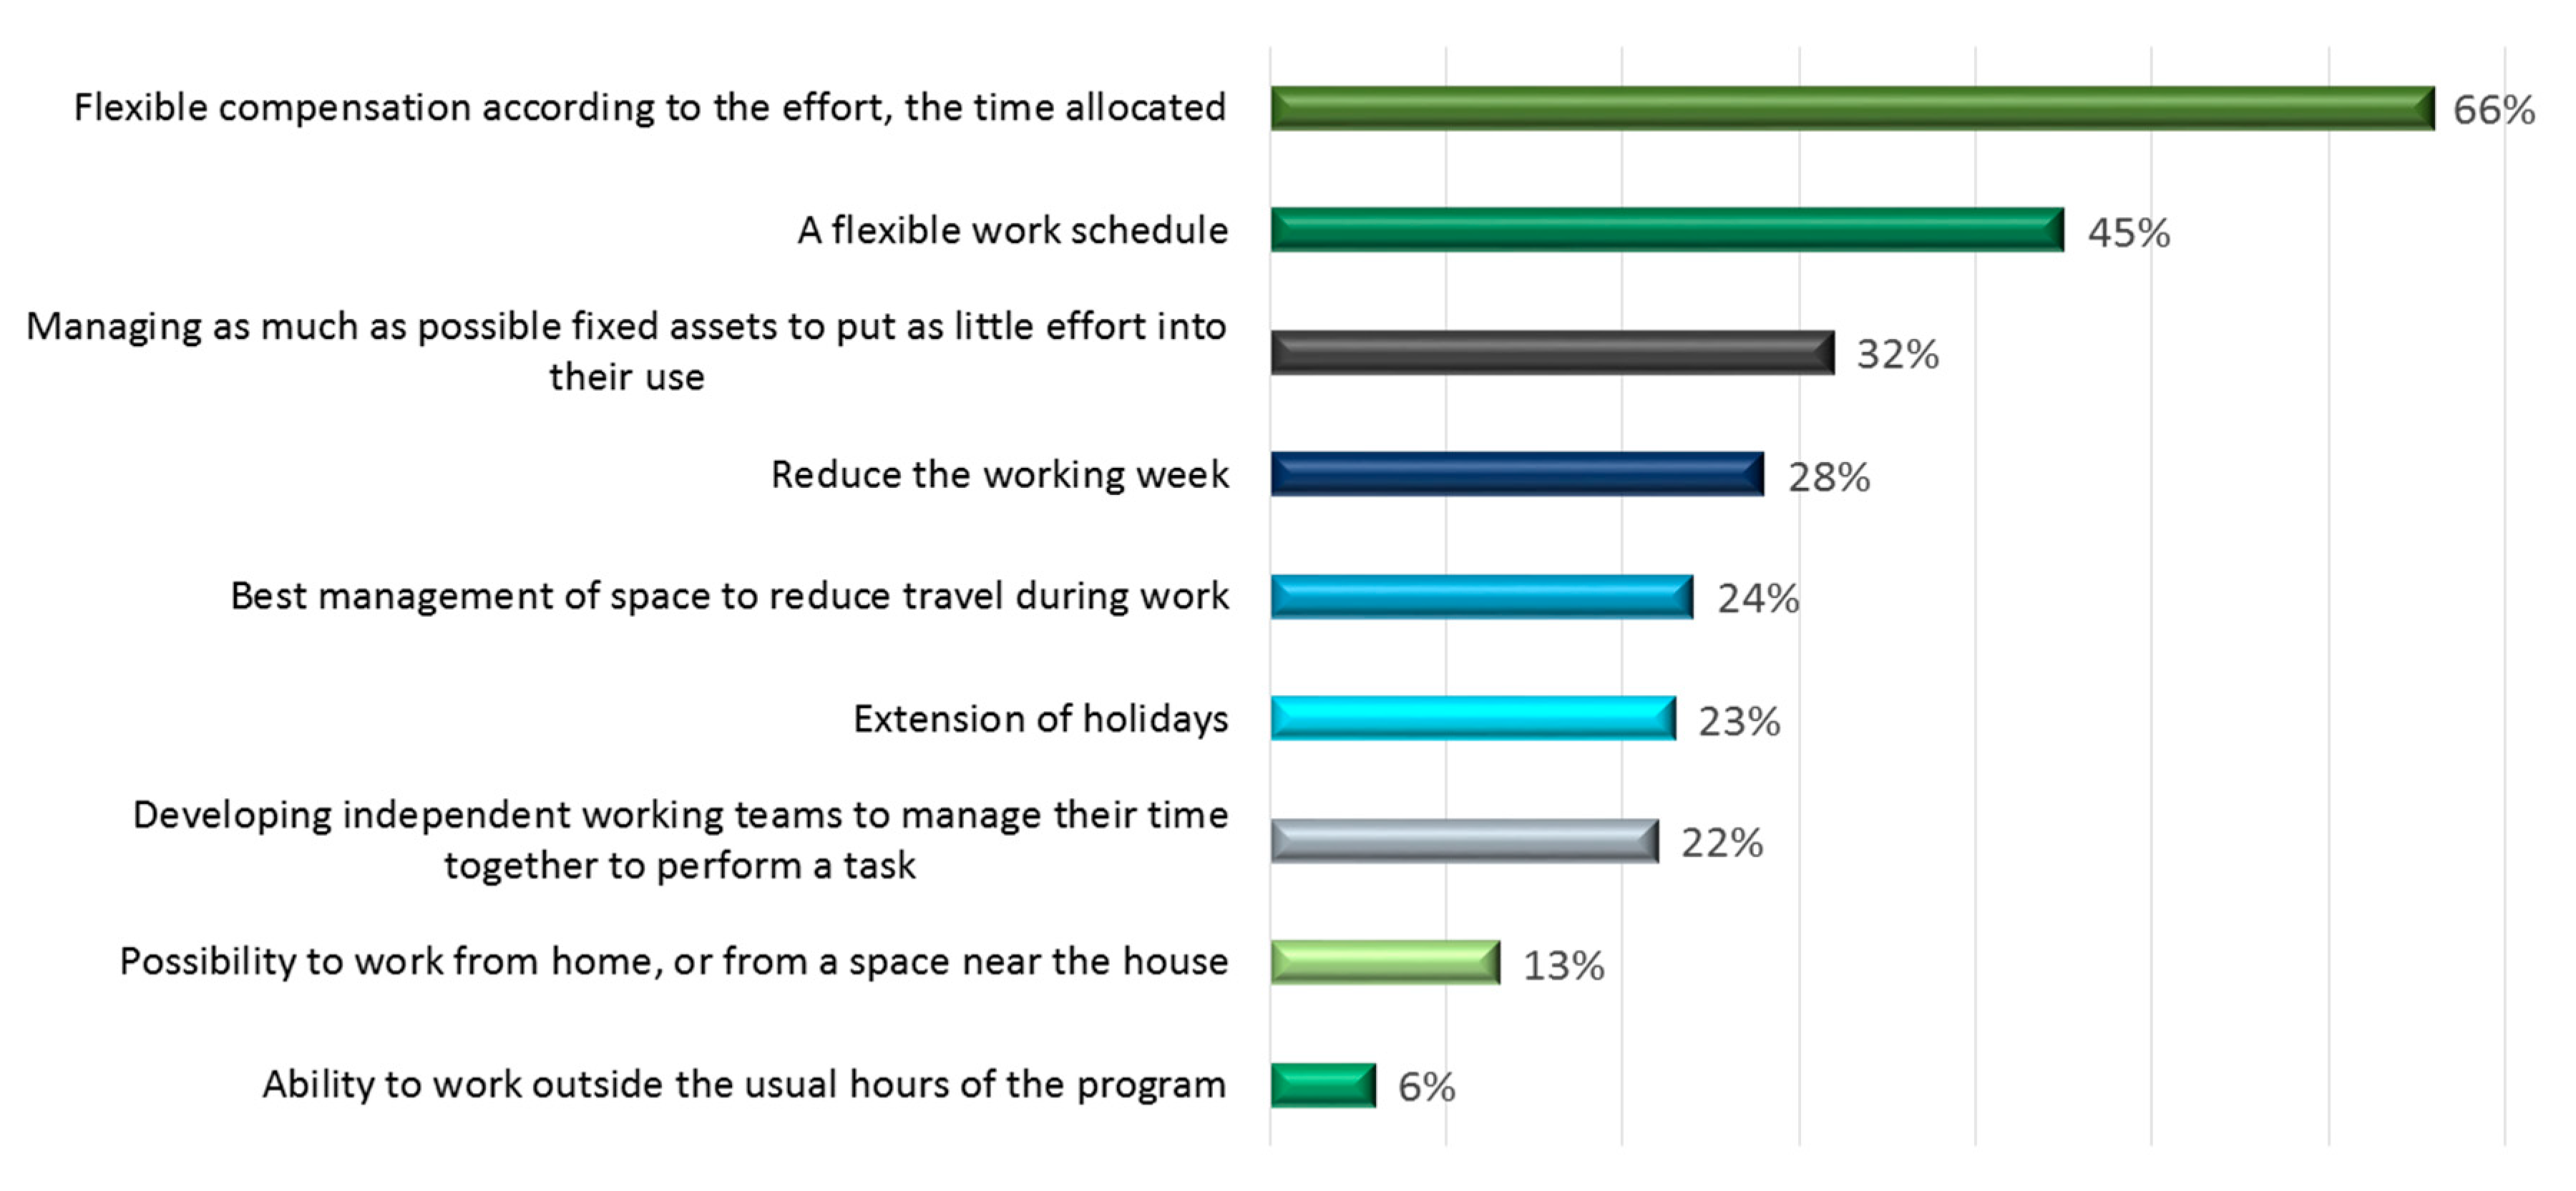
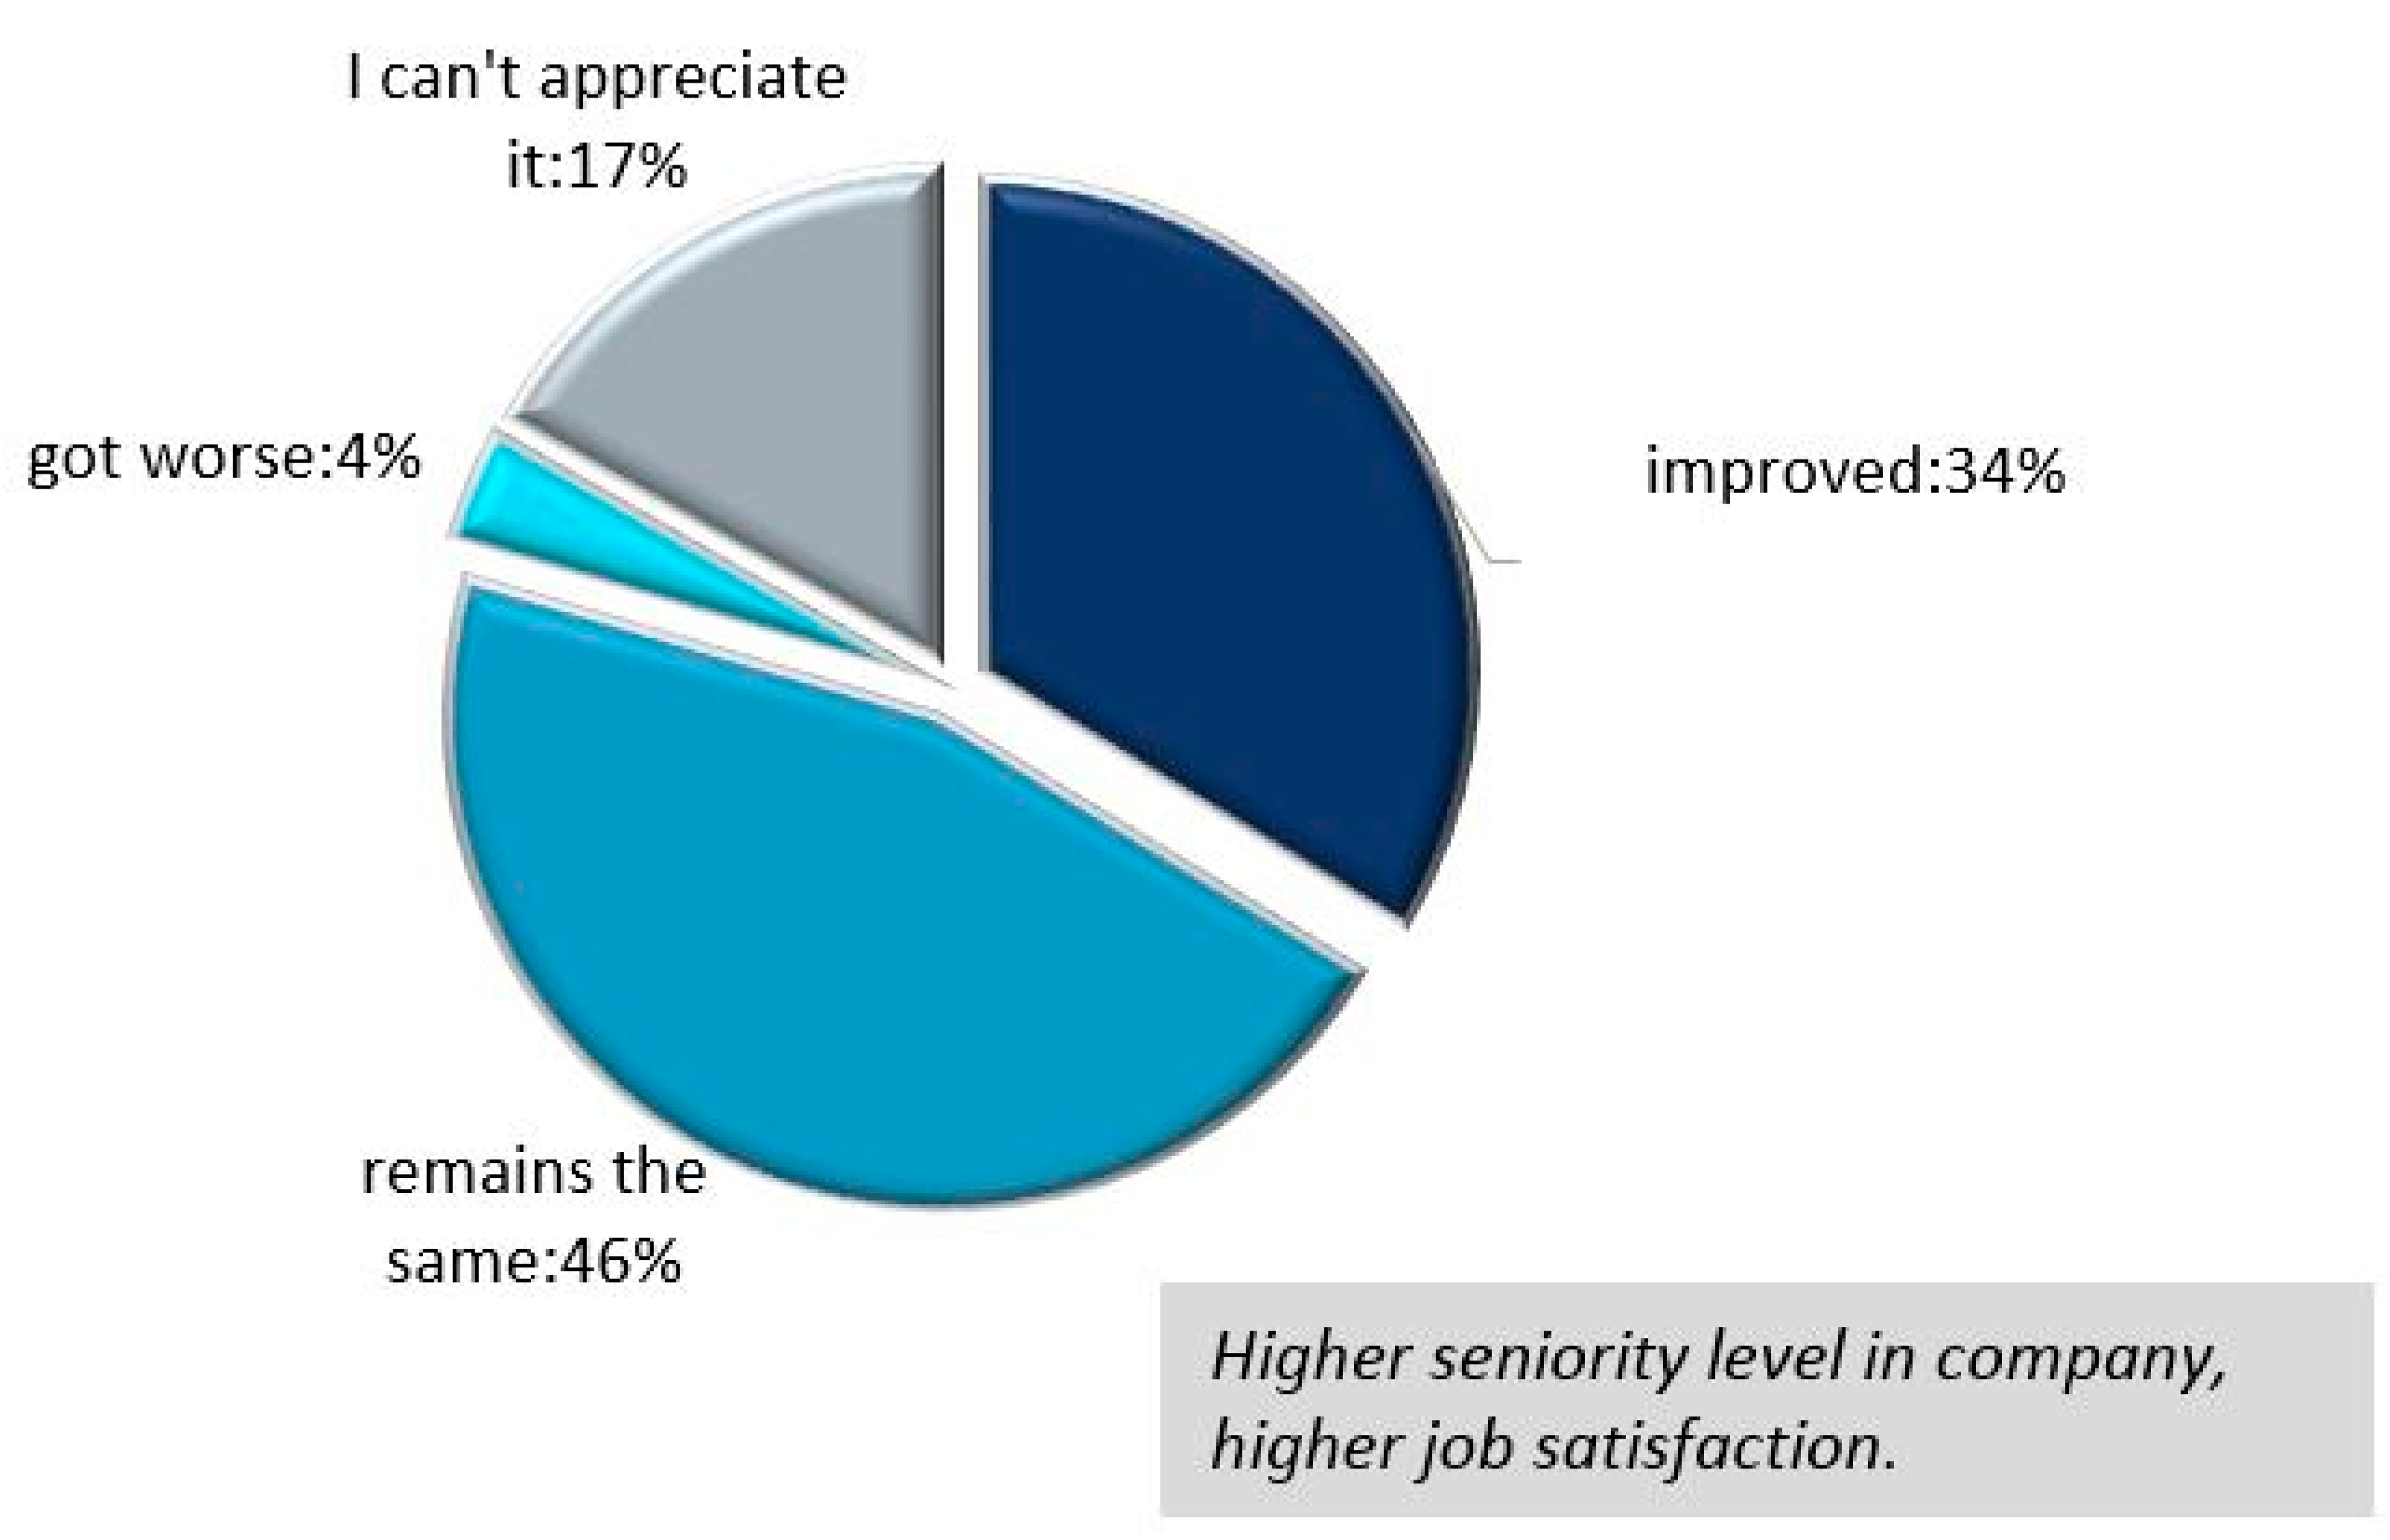
4.2. Analysing the Main Characteristics of Work Flexibility and Job Satisfaction from the Perspective of Romanian Employees

Investigating what are the main elements of work flexibility present among Romanian organizations, 81% of employees mentioned team working, 47% indicated computer usage, followed by teleworking (24%) and job rotation (20%) (Figure 4).
In line with our objectives and examining the particularities of different forms of work flexibility, it can be highlighted that flexible employment was found only to a very small extent, only 3% of employees declared to work based on part-time contract, and only 1% of employees work on the basis of fixed duration contract with full time (Figure 5).
Also, flexible time arrangements seem to have a relatively small prevalence among Romanian organizations—almost 40% of employees declared they work in a flexible manner and in shifts, while an even smaller proportion declared to have flexible working hours per day and per week, flexible number of days per week, or work outside normal working hours. Only 55 of interviewed respondents declared to have more than one job (Figure 6).
The functional flexibility related to employee training is found only to a small extent in Romanian companies—only a third of employees testify that they have attended training courses paid by their own employer or they have benefited from on the job training. A very small proportion (13%) of the Romanian employees invest in themselves by paying courses from their own funds (Figure 7).
From the new types of workspaces assuring an increased level of flexibility, home working and partial home working are the most commonly known and used among employees and companies (Figure 8).
Numerical flexibility though flexible compensation and working time flexibility through flexible work schedule have been mentioned as main measures needed in order to increase work flexibility. Teleworking has been stipulated by only 13% of employees (Figure 9).
Romanian employees tend to be satisfied and very satisfied with their current job, almost 70% of them declaring this. Regarding salary, a higher proportion (31%) of them declare themselves neutral, and only 54% of them consider that the salary level is satisfactory for them (Figure 10).
Investigating the correlation between job satisfaction and salary satisfaction, it can be stated that job satisfaction is directly correlated with salary—the higher the salary, the higher the satisfaction. This fact was highlighted by a positive and highly statistically significant value of both Kendall and Spearman correlation coefficients of the ranks of both Kendall and Spearman, the association being one of medium intensity (Table 2).
Asked how they evaluated the motivation system in Romanian companies, most of respondents (46%) declared that it has not changed and only 34% of them said that it has improved (Figure 11).
For Romanian employees, bonuses, a potential good salary, work attractiveness and job stability have been identified as the highest motivational factors. It is worth mentioning that a mix of financial-non-financial incentives, together with bonuses and salaries, work attractiveness, and job stability were ranked on the first positions.
Therefore, it seems that, compared to previous years in which the focus was on non-financial incentives, in the recent period, financial incentives tend to return as important for Romanian employees (Figure 12).
Romanian employees mentioned the importance of financial incentives, even if it is known that this type of measure will produce effects only in the short-term, the relevance of functional flexibility through the participation to training courses, and the working time flexibility through a flexible program as the main measures in increasing employee work motivation (Figure 13).
Taking into account one of our objectives regarding the way in which new types of workspaces (FO, CW, HOT, HOP) influence job performance, job satisfaction, personal time and space management, level of comfort, level of organizational performance, level of personal and professional relationships, level of professional development, and the overall level of work motivation.
This part of the analysis has a direct correspondence to our research questions and refers to hypotheses H4–H8. The survey evaluates the best workplace from the employee point of view, targeting two clusters-one of employees working in offices, at the level of which a choice of a different work space than the one in which they are currently working has been forced, and the second one of respondents who do not work in offices at the level of which there is the possibility to choose, including the space in which they currently work as a desirable space. For both clusters of employees, the impact on job performance, job satisfaction, personal time and space management, level of comfort, level of organizational performance, level of personal and professional relationships, level of professional development, and the overall level of work motivation was assessed.
However, from the perspective of work flexibility, we have undertaken in the analysis only the first cluster of employees working in offices (individual office, office space with up to 10 units, and office space with more than 10 units); these forms of working space flexibility are very important (Figure 14).
Home working have been mentioned as the perfect space for increasing employee productivity (42.1%), employee comfort (36.8%), and personal time and space management (34.7%).
Partial home working is seen as optimal solution for increasing professional development by learning new things (35.1%), for increasing the organizational performance (33.8%), and for strengthening social and professional relationships (31.2%).
High percentages of positive contributions were assigned for CW in terms of personal and professional relationship improvement, as well as learning and professional development, while FO was designated to lead to personal and professional relationship improvement.
In terms of work motivation, almost one third of employees (29.8%) mentioned partial home working as the perfect mix between higher productivity (produced from working from home) and the social development obtained through the interaction of new people/colleagues.
Therefore, the new ways of working are well known and frequently used, and there is great openness and interest in them. Home working has the most appreciations mainly in terms of labor productivity, comfort, and time and space management, while partial home working has highly appreciated in terms of organizational performance, relationships, learning and personal development. In terms of relationships, learning and personal development contributions were also made by co-working and flex-office. However, the most suitable solution, which results from the study, is a mix between working from home and working in company offices.

4.3. A Brief Overview on the Main Differences Regarding Work Flexibility among Romanian Employees

According to another objective of our research, we have investigated the main differences regarding work flexibility characteristics among Romanian employees, the main findings being synthesized as follows (Table 3):
  • The functional flexibility through training courses paid by the employer is more widespread in large companies, among employees from age group 26–35 years being mostly higher education specialists and technicians, or working in west and center regions, while employees from Bucharest-Ilfov tend to pay for training courses themselves. Employees from age group 55 years old benefited from on-th- job training;
  • The lack of flexible working time arrangements has been pointed out by men, by employees aged 36–55 years old, by unqualified workers, by workers with small level of seniority in the company, being more prevalent in South-East region;
  • The contractual flexibility is more widespread among young employees under the age of 26 years old, among men who are more inclined to have a flexible remuneration, depending on the effort and the allocated time, together with the extension of holidays and also among employees with a high level of seniority;
  • The new ways of working tend to be more commonly known among employees from micro companies, to be relevant for both qualified and unqualified workers, to be appreciated by employees from the age group 36–45 years old. Home working and partial home working are more present in the north-east region, while co-working and flex office are more prevalent in the north-west;
  • Teleworking has been designated as a main measure to increase work flexibility by men, by young employees, by employees from the central region, by employees from middle management, by those with between 3–5 years of experience in management positions, and by those with medium earnings. Teleworking is also important for small companies and for limited liability companies.
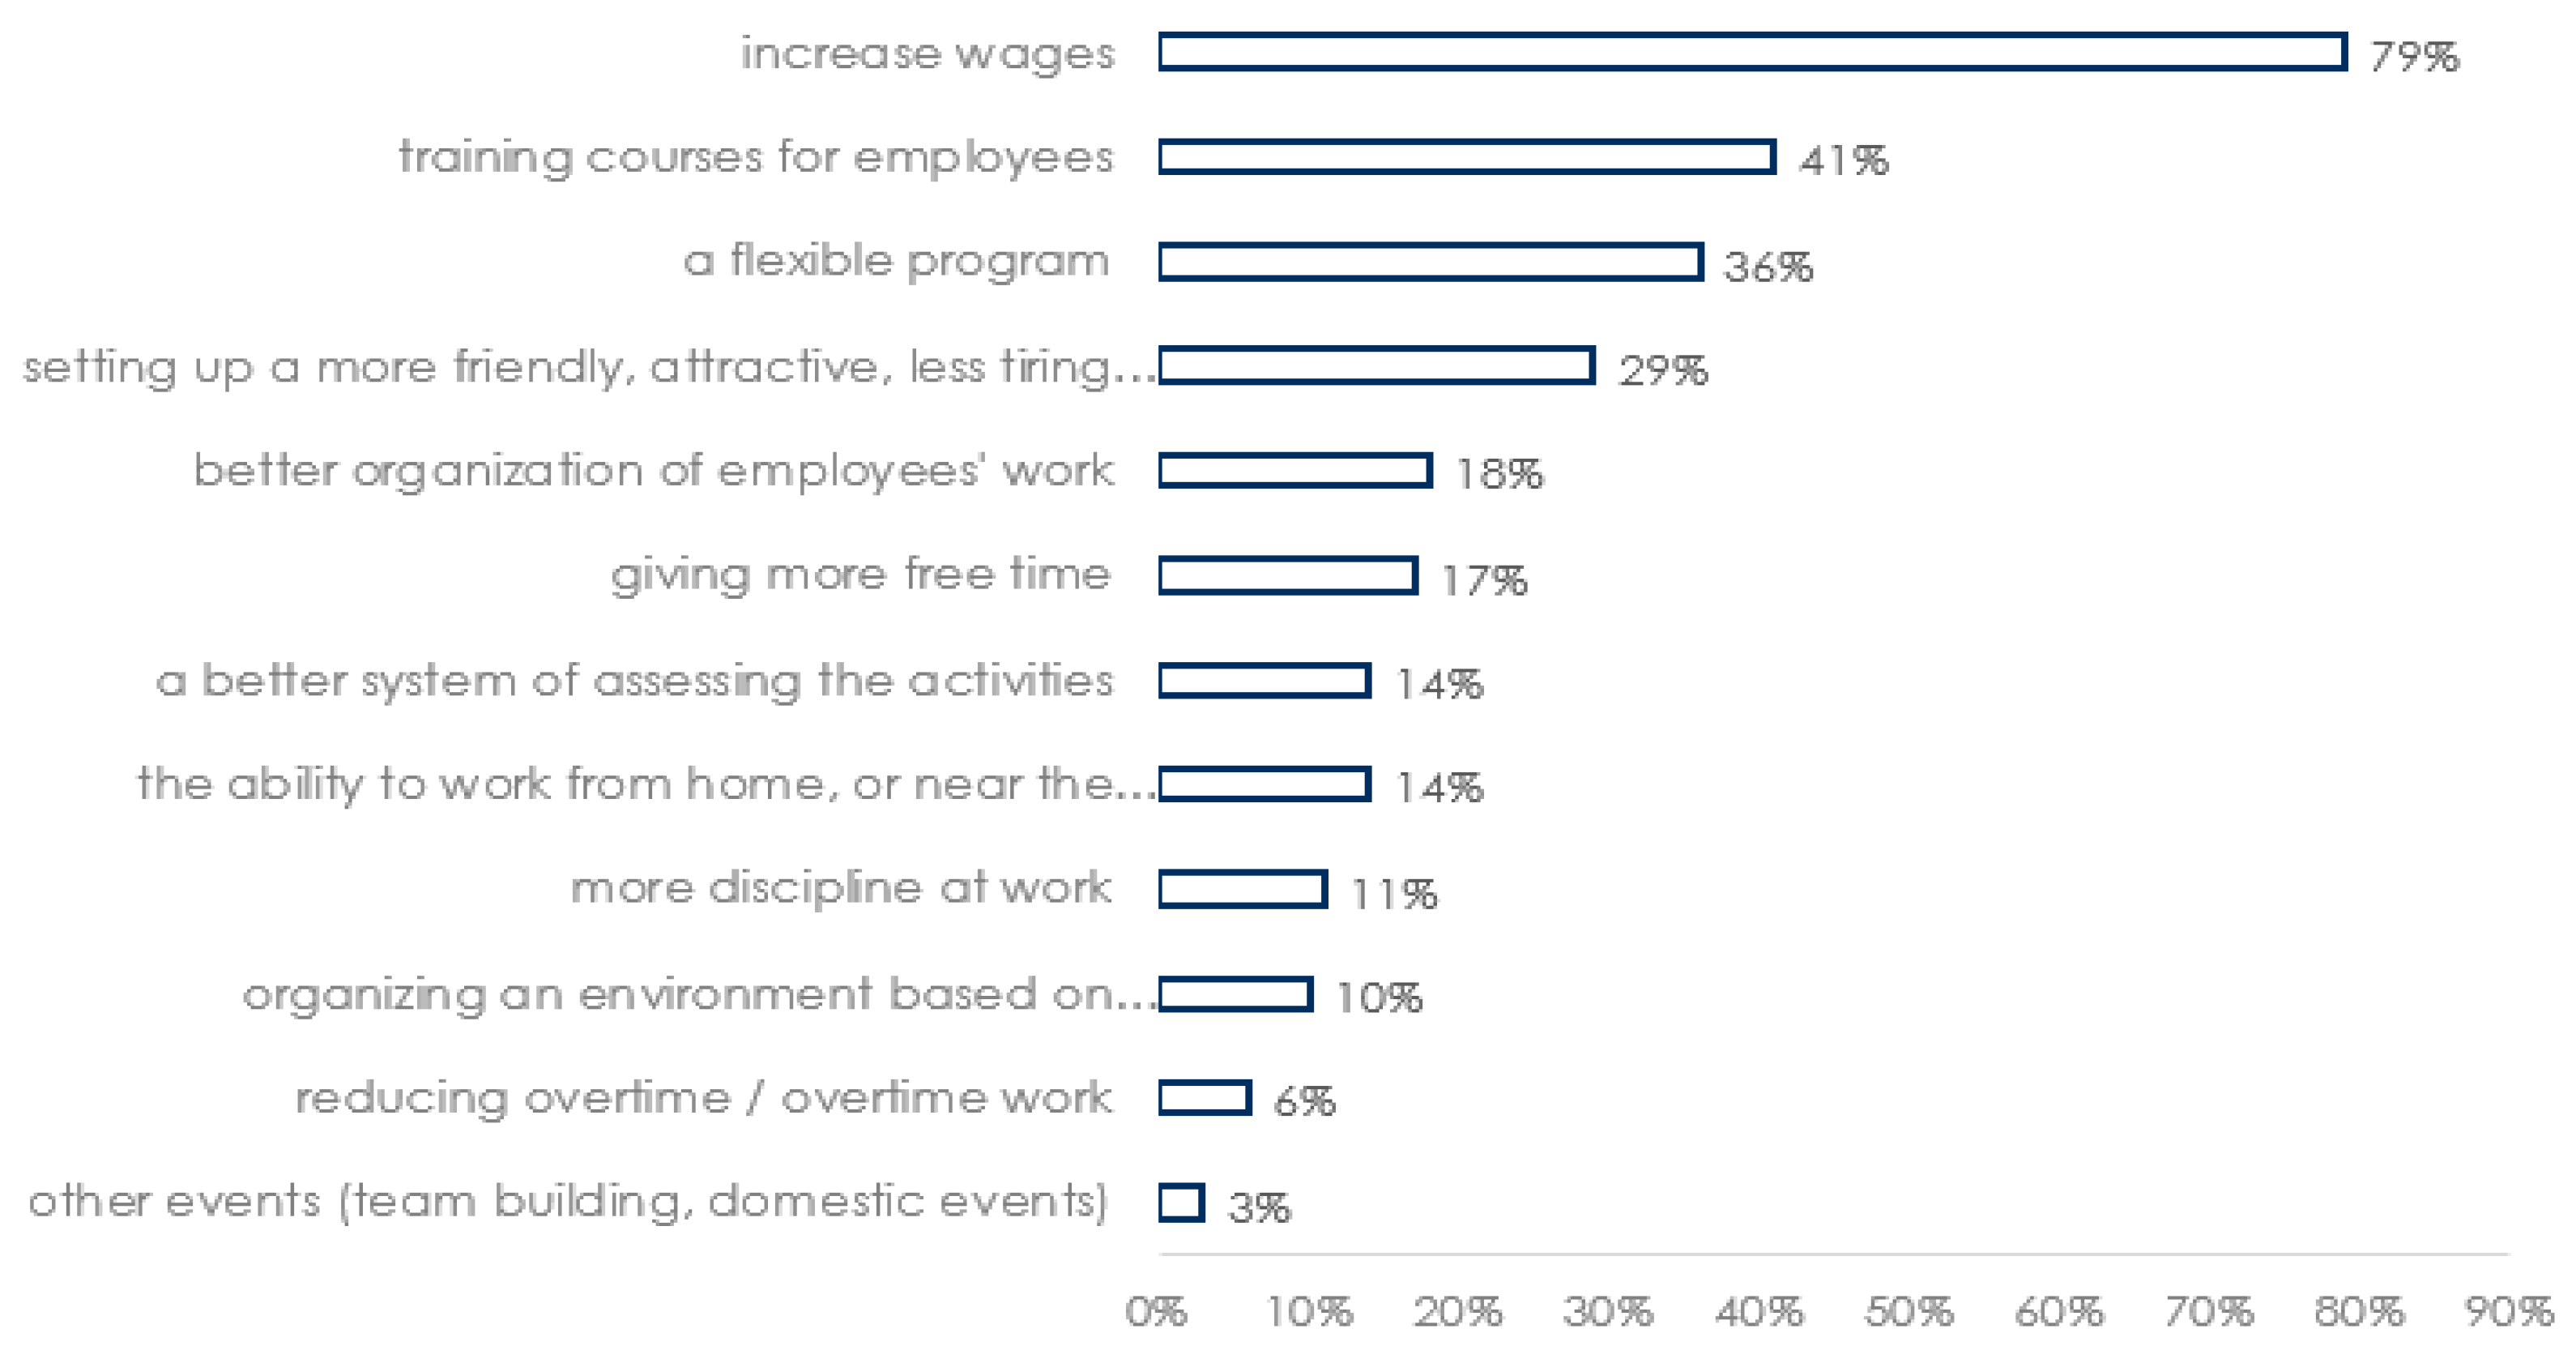
  • A flexible working schedule, flexible remuneration and the extension of holidays were considered relevant methods for increasing work flexibility among men, higher education specialists, and employees in medium and high-level management;
  • Teamwork is important as a measure in increasing work flexibility for those employees with high salaries belonging to middle management;
  • Updating job posts according to new tasks is more common in large companies and among those with high salaries and those with more than 10 years’ experience.

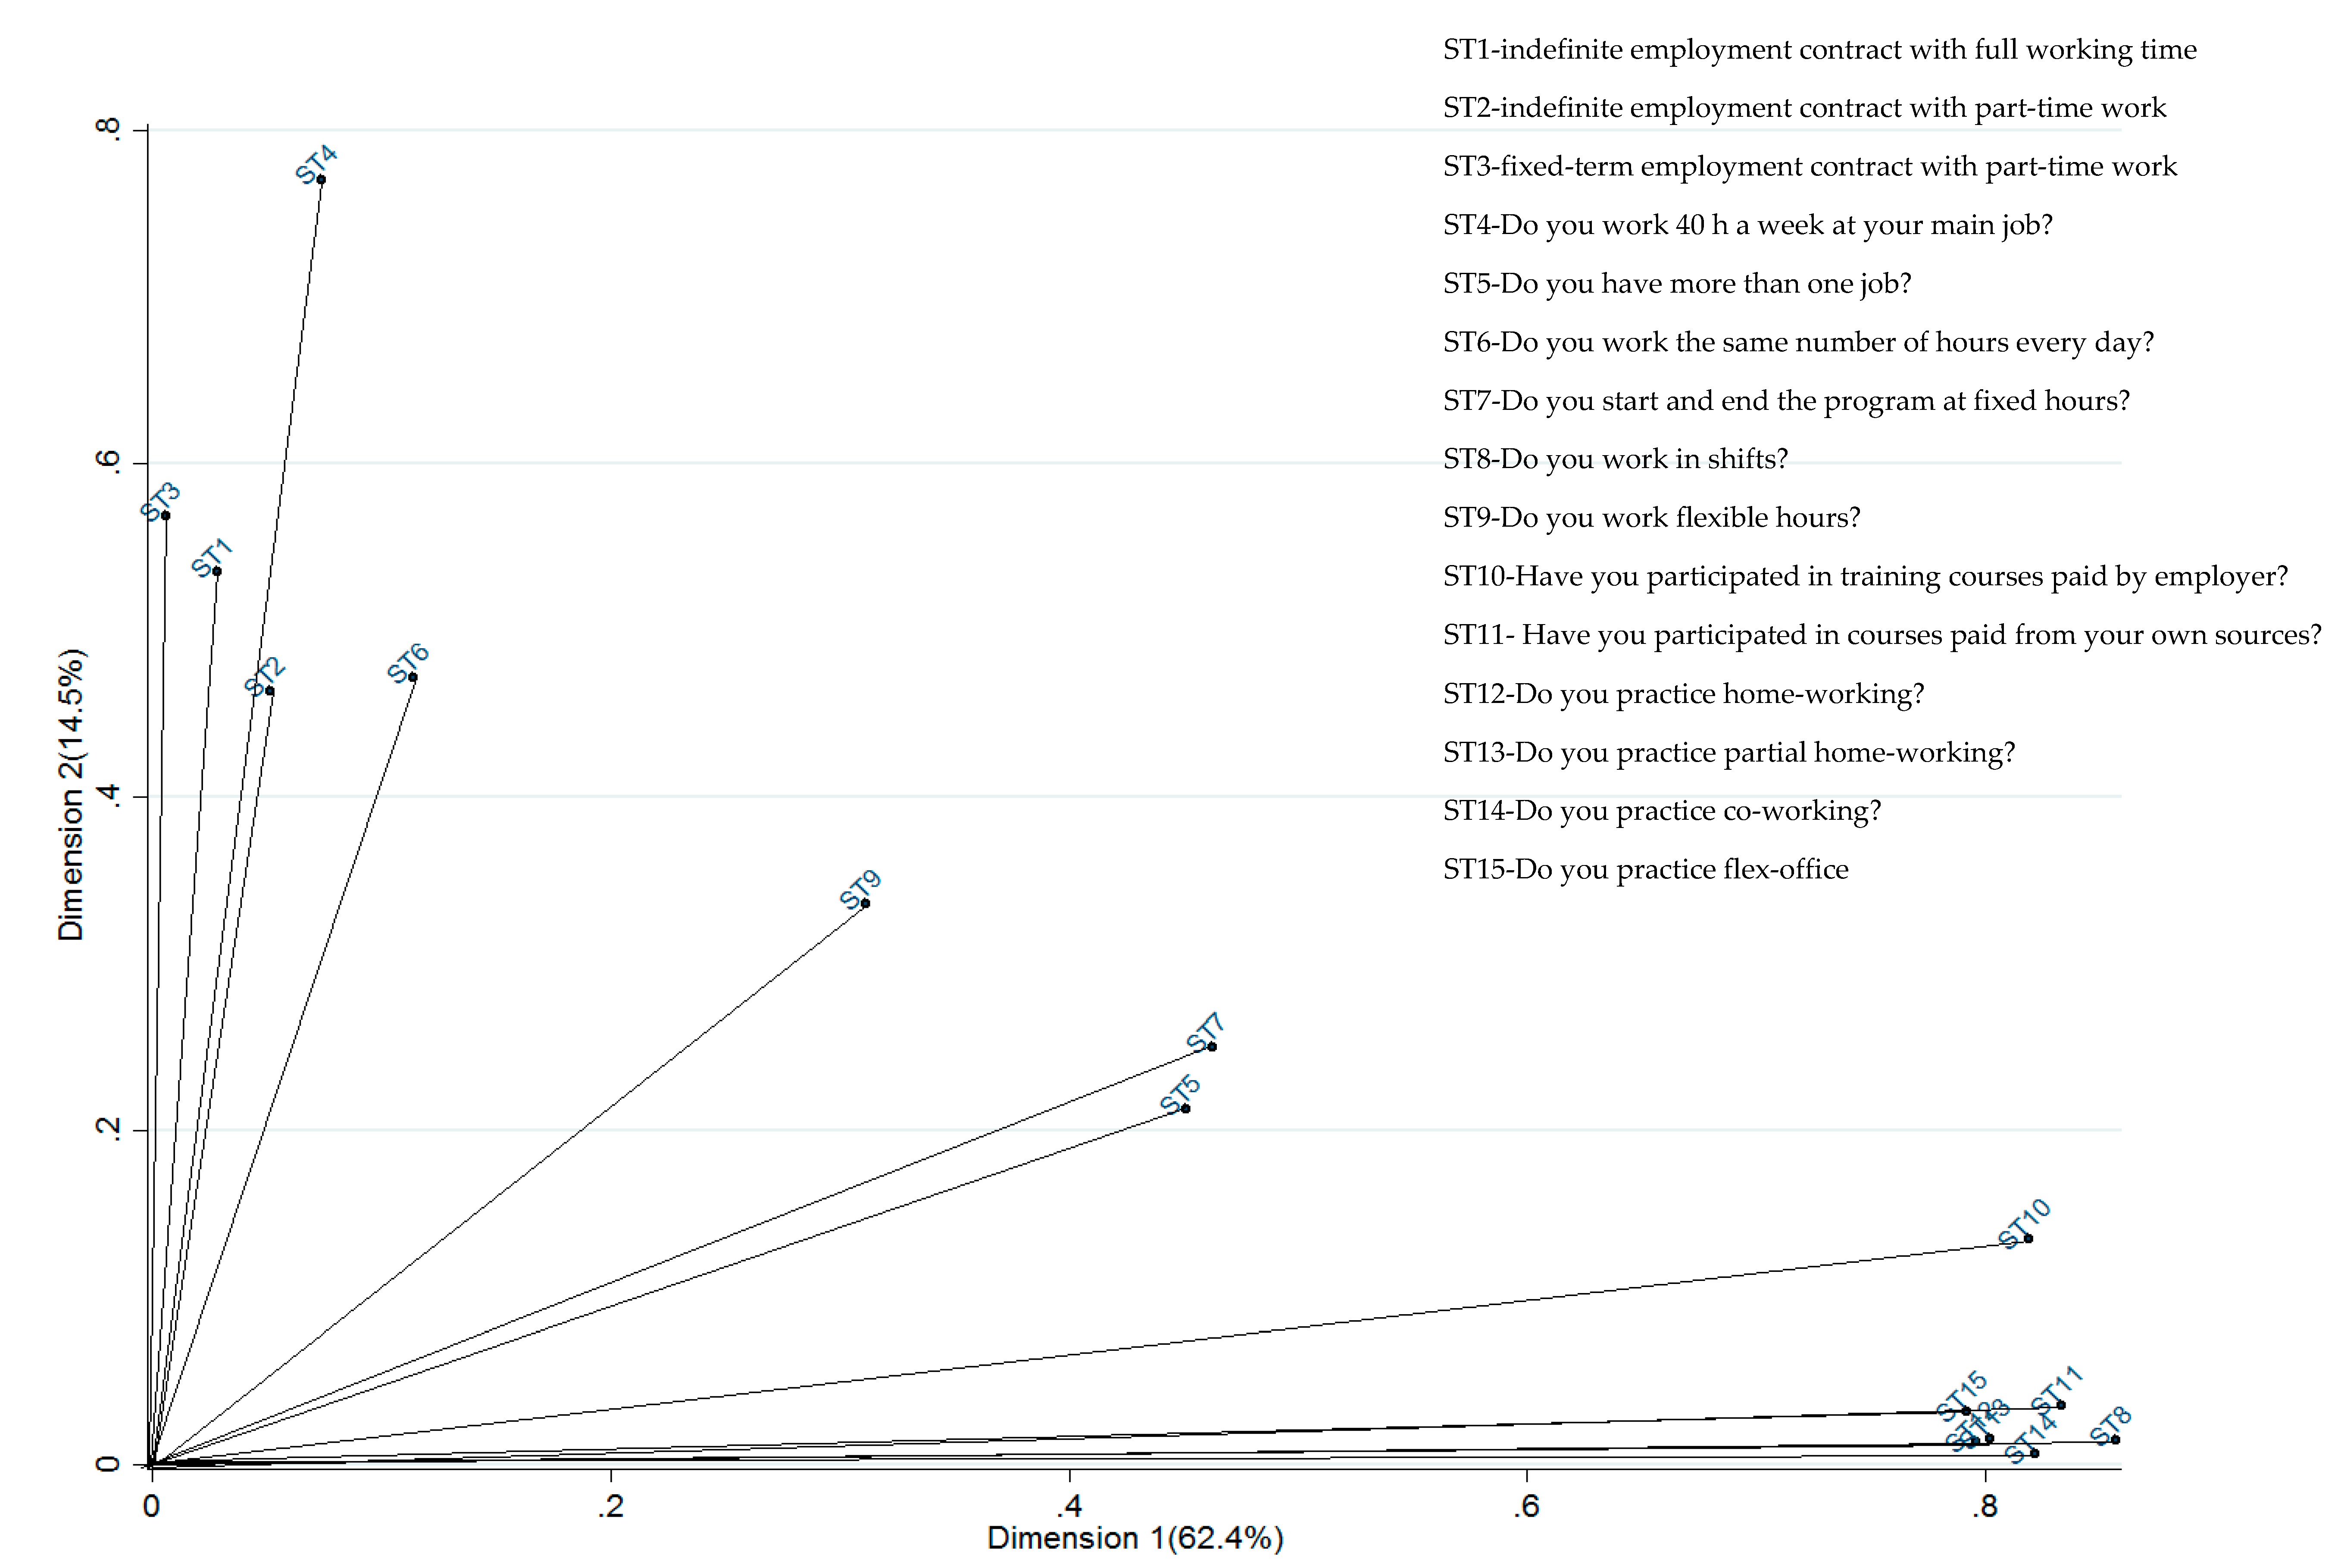
4.4. Building to Measure the Romanian Employee Flexibility Using Multiple Correspondence Analysis (MCA)

In line with the research question, “Overall is there a high level of work flexibility among Romanian employees?” and trying to test the hypothesis H1, the present section used the MCA for building a first multi-dimensional work flexibility indicator for Romanian employees aiming to capture the phenomenon from different angles. The research has been structured into two main stages.
In the first stage, all 18 items with 56 modalities from four dimensions of flexibility have been included in the analysis in order to provide a first indication of the of the association patterns with the principle component. In the second stage, we have reversed some items of contractual flexibility and working time flexibility dimensions in order to achieve the monotonicity axiom. Also, in this step, the number of variables was reduced to meet the consistency properties of the principal component. Therefore, we have eliminated the presence of fixed-term employment contracts with full working time, working the same number of days per week, and the presence of job training in order to assure the first axis ordering consistency (FAOC-I) applying MCA to 15 items.
Knowing from literature that several forms of work flexibility support sustainability and acknowledging that the contractual flexibility can support sustainability only under specific conditions, however, the main goal of the paper was to offer a global perspective from different point of view of individuals work flexibility level by building a global index highlighting the contribution of the main existent types of work flexibility among Romanian organizations.
It is worth mentioning that, even if contractual flexibility could support sustainability only in particular situations, while the other dimensions of work flexibility exhibited positive impact of sustainable HRM, the contribution of this component in the overall measure of work flexibility is the smallest, and therefore, the impact could be considered negligible.
The empirical results of final MCA based on Burt matrix are presented in Table 4. The MCA performed on the remaining variables led to an increase in the explanatory power of the first factor, which rose from 54% to 62.4%. The second dimension explained another 14.5%, cumulating a total of 79.94% of principal inertia (Table 4).
The value of Cronbach’s Alpha (0.73) supported our hypothesis of building a composite flexibility indicator, the value being superior to the threshold of 0.7.
In order to determine the CFI for each employee, based on the functional form of the CFi previously expressed, the weights (factorial scores on first axis presented in Appendix A) attributed to the variable modalities were used. Analyzing the weights from Appendix A, we can determine the relevance that the analysis attributes to each type of flexibility. As a rule of thumb, we consider values larger than two as an indication of key flexibility factors. Therefore, we find employees who practice all the new workspaces such as home-working, partial home-working, co-working, and flex-office and who have also participated in paid courses from their own resources as having the highest level of flexibility.
Analyzing the discriminating power of each indicator in each of the factorial axis, we can we easily see that the most discriminating indicators, in the first axis, are (Figure 15)
Do you work in shifts? (0.857)
Have you participated in paid courses from your own resources? (0.833)
Do you practice co-working? (0.822)
Have you participated in training courses paid for by your employer? (0.819)
Do you practice partial home working? (0.802)
The most discriminating indicators, in the second axis are
Do you work 40 h a week at your main job? (0.77)
You are an employee on the basis of a fixed-term employment contract with part-time work (0.568)
You are an employee on the basis of an indefinite employment contract with full working time (0.534)
You are an employee on the basis of an indefinite employment contract with part-time work (0.463)
Analyzing the joint category plot (Figure 16), it can be observed that the closer the response category’s vector position is to the origin, the more similar the response profile is to the average profile [126]. A feature of MCA when using binary variables is that the positive and negative point for each variable is situated 180 degrees away from the origin on the map [130]. The interest is in seeing “which” side each point falls on relative to the other variables, and we can mention that the response categories for presence of work flexibility are mostly on the positive side of Dimension 1, and those for absence of work flexibility on the negative side, in all areas except for indefinite employment contract with full working time. This separation of “1s” and “0s” on either side of Dimension 1 shows that, with the exception of indefinite employment contract with full working time, the most important difference in the sample is between having and not having work flexibility. This separation also implies that areas are positively correlated except for an indefinite employment contract with full working time.
After analyzing the signs of the weights, we concluded that a negative sign reduces flexibility, while a positive sign positively contributes to employee flexibility. Using these weights, we created the CFI of each employee. To avoid having negative values of CFI, we estimated the average of the negative values of the CFI and add the absolute value of this average to the CFI of each employee to obtain the positive CFI scores.
Analyzing the relative contribution of the variables to the composite flexibility indicator, we can highlighted that working in shifts, participation in courses paid from the own resources, co-working, and participation in courses paid by the employer contribute the most to the construction of the first axis which is the axis of working time flexibility and functional flexibility mix (Table 5).
Following the MCA procedure, we can finally calculate the CFI for each employee as the average of its weight categories corresponding to the average of standardized scores on the first factorial axis.
The extreme values of the CFI calculated are −0.933 (the employee with the lowest level of work flexibility) and 3.026 (the employee with the highest level of work flexibility) among Romanian employees, stipulating that
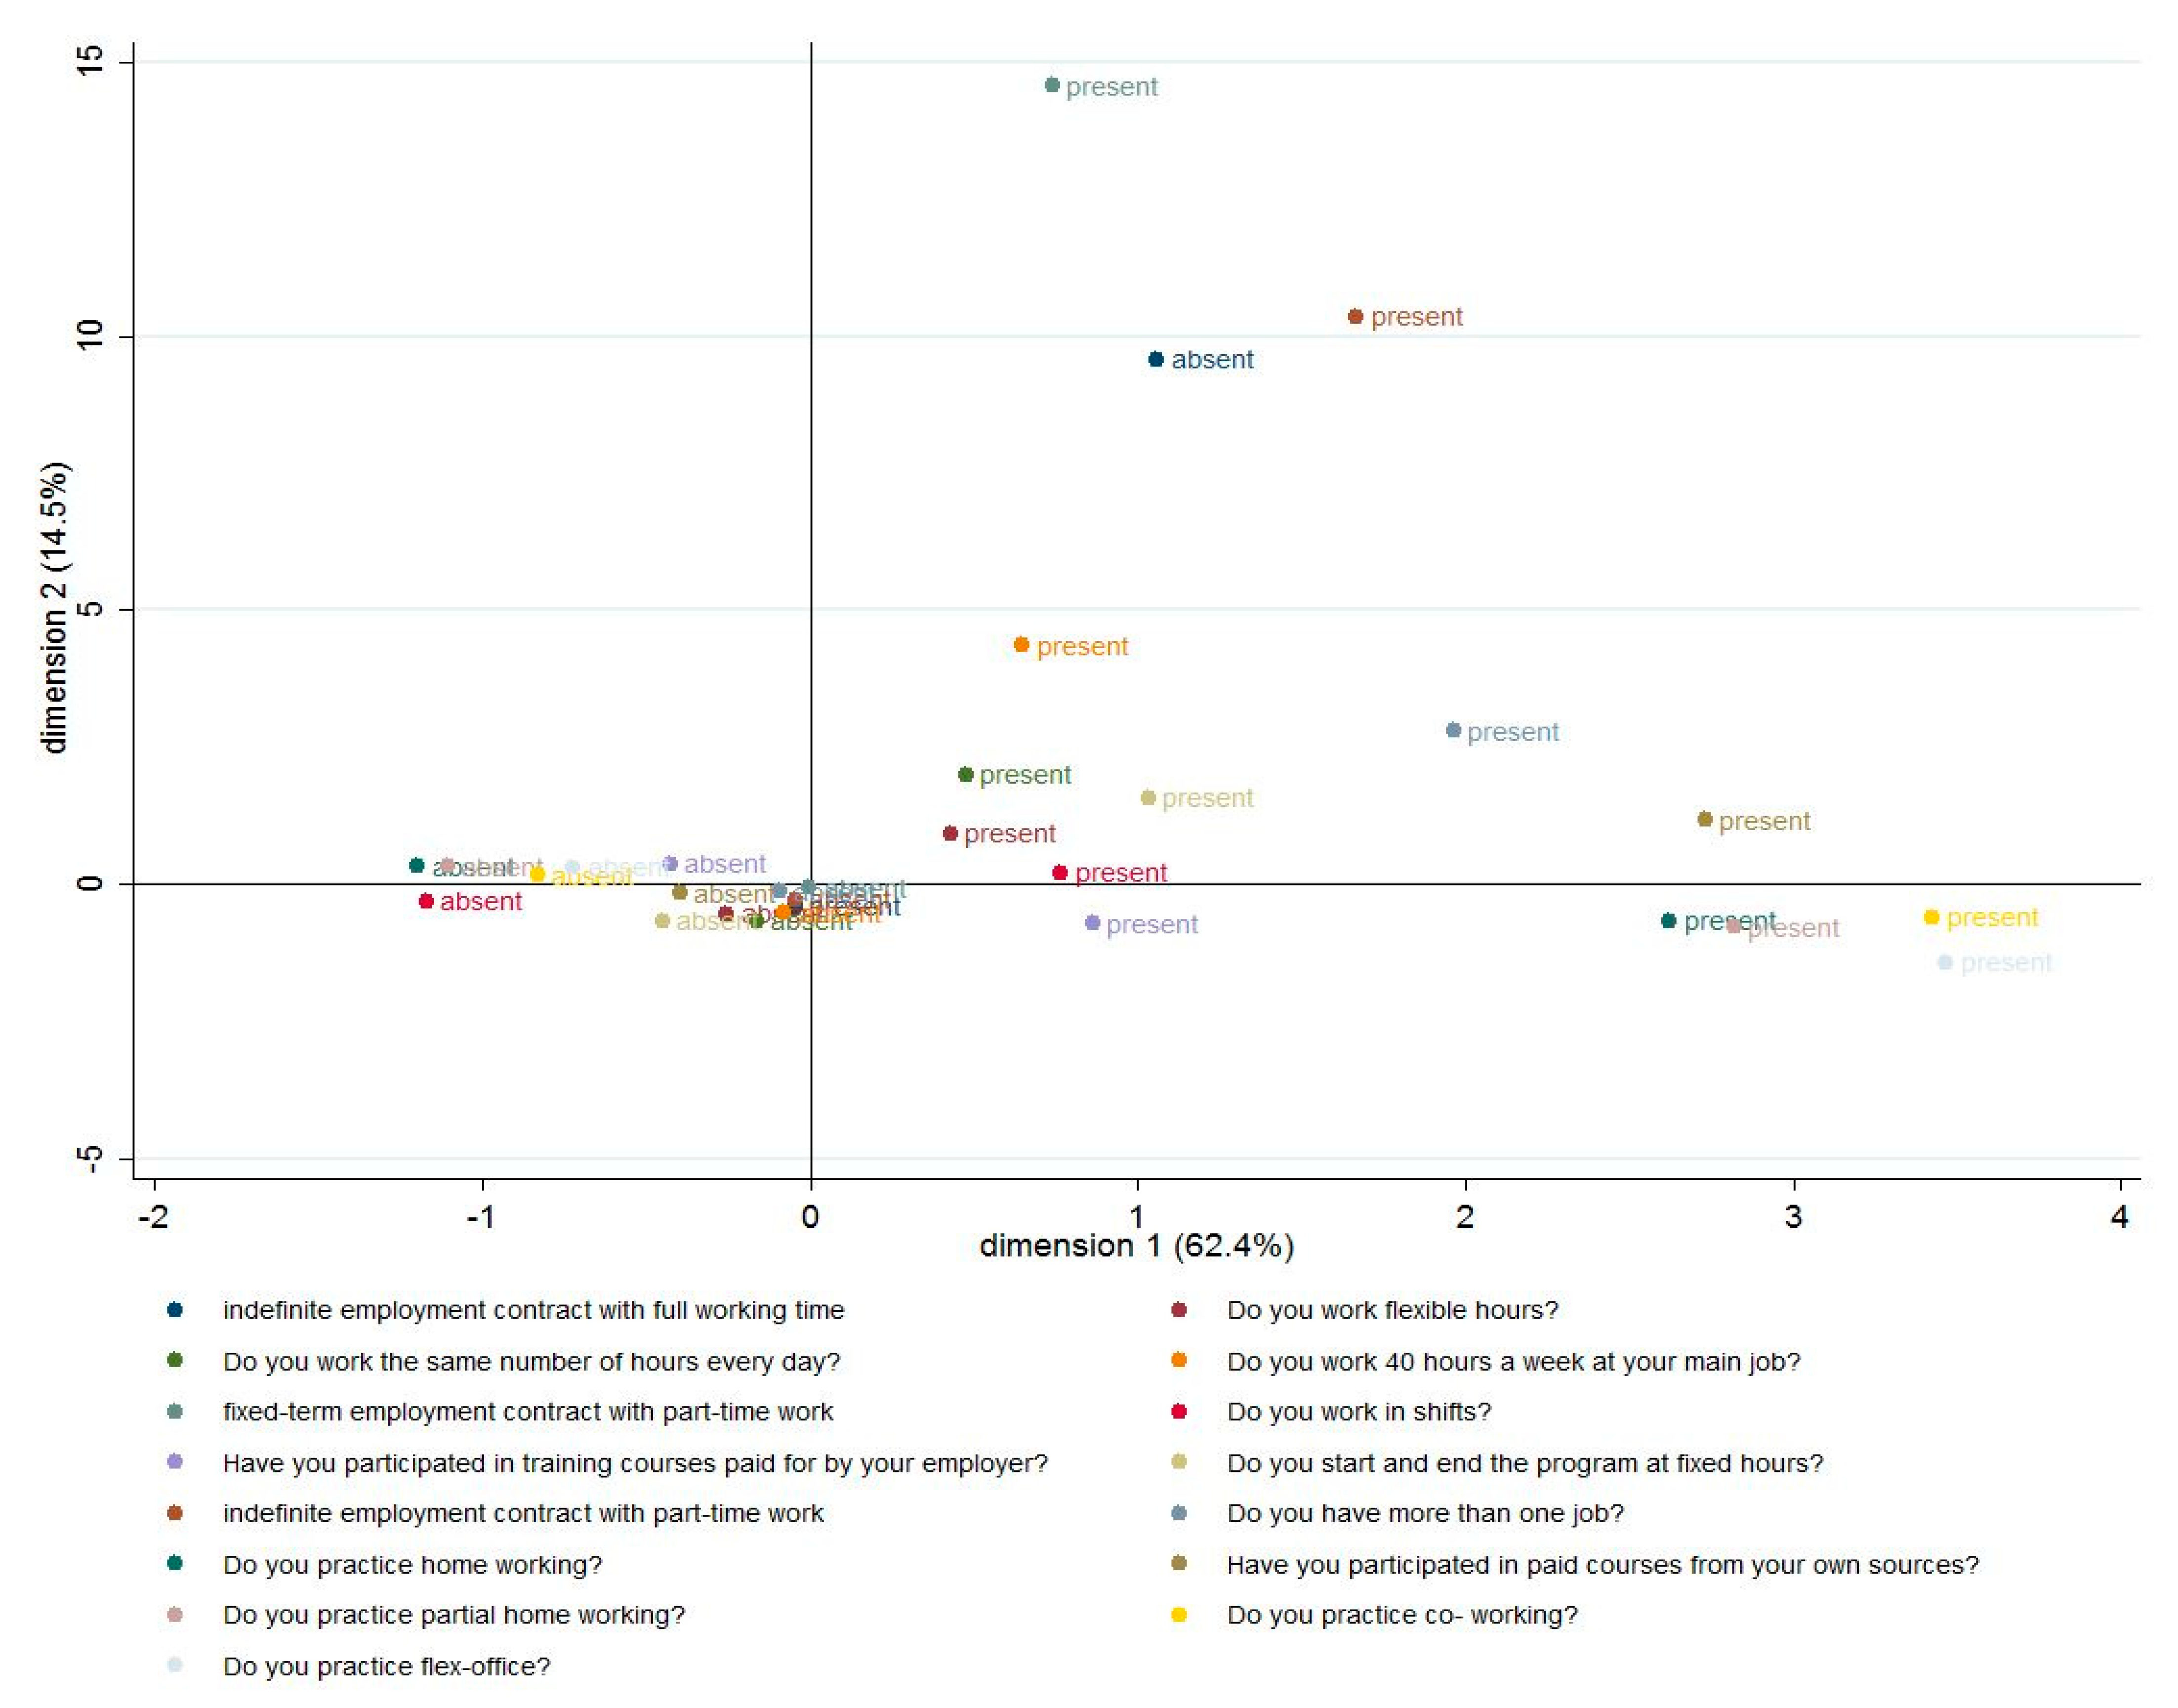
  • An employee that has the smallest CFI value (−0.933) has an indefinite employment contract with full working time, working 40 h a week at the job, having usually only one job, working the same number of hours every day, starting and ending the program at fixed hours, working in shifts and not working in flexible hours, not participating in training courses paid for by the employer or with its own resources, and not practicing any forms of workspace (HOT, HOP, CW, FO).
  • An employee that has the highest CFI value (3.026) has an indefinite employment contract with part-time work or a fixed-term employment contract with part-time work, not working 40 h a week at the job, having more than one job, not working the same number of hours every day, not starting and ending the program at fixed hours, not working in shifts and working in flexible hours, participating in training courses paid for by the employer or with its own resources, and practicing all types of workspace (HOT, HOP, CW, FO).
To facilitate interpretation, we have rescaled the work flexibility indicator to take values between 0 and 100, where 0—lowest level of flexibility and 100—highest level of flexibility. The average level of flexibility index among interviewed Romanian employees was computed to be 50.22 revealing a medium level of flexibility, with significant differences among demographic variables. Analyzing the main descriptive statistics (Table 6), we can mention that the average level of flexibility index among interviewed Romanian employees was computed to be 50.22, revealing a medium level of work flexibility among Romanian employees, while most of Romanian employees (n = 85 employees) rather exhibited a small level of work flexibility, while for medium and high level, the frequencies are balanced (n = 69 employees respectively 66 employees). The empirical results of Chi-Square test revealed that there are no statistically significant differences among three categories of employees (employees with low, medium, and high flexibility), the distribution being equilibrated. However, only 30% of Romanian employees registered a higher level of work flexibility, the index value being higher than the threshold of 70.
Analyzing the variations in the work flexibility index according to regions of development, company size, the legal regime of the company, the activity sector, and the main occupation of the employee, we can mentioned that the ANOVA analysis supported the hypothesis of statistical differences for all the variables, with the only exception of the company size. Therefore, employees from the center and Bucharest-Ilfov; from national companies or public institutions; from companies activating in wholesale, services, or constructions; being general managers, directors, or a person holding a senior or a middle management position; or being a higher education specialist have a higher level of work flexibility.
The correlation coefficient between work flexibility indicator and the overall level of job and salary satisfaction revealed in both cases a positive statistically significant relationship but weak as intensity (Figure 17).

4.5. Flexible Working Increases Job Satisfaction? An Empirical Analysis among Romanian Employees Based on Binomial Logistic Regression Models{ TC “4.6.4. Contribuții Privind Evidențierea Impactului Elementelor de Flexibilitatea în Muncă Asupra Nivelului General de Motivare al Angajaților Români Utilizând Modelul de Regresie Logistică Binomială” \f C \l “3” }

In line with our research questions and aiming to test the hypotheses H2–H3, we have investigated the impact of work flexibility, considered as an overall measure as well as individual components, highlighting its implications on job satisfaction as one of the main outcomes of sustainable HRM. If the focus is the transition to sustainable HRM, it makes sense to identify the characteristics of sustainable HRM that could lead to an increase in the outcomes of sustainable HRM. Therefore, in this context, we anchored work flexibility and its implication on job satisfaction. The empirical results are presented in Table 7. In order to capture the impact of both overall measure and individual forms of work flexibility, two logistic regression models have been estimated.
The empirical results of the first model highlighting the influence of individual forms of flexibility on the overall level of job satisfaction among Romanian employees revealed salary satisfaction exhibited a positive and statistically significant impact on the job satisfaction, revealing that employees who are satisfied with received earnings tend to be satisfied with their job.
The empirical results highlighted that gender and occupation as individual characteristics and company size and company activity sector as employment related characteristics significantly influenced the overall level of job satisfaction of Romanian employees.
Women are more satisfied with their job compared to men, while compared to job satisfaction of specialists with higher education, people with senior management positions, technicians, and skilled and unskilled workers tend to be less satisfied with their jobs.
Compared to micro-enterprises, employees of small companies with up to 10 employees are more satisfied with their current job, while employees from services tend to be less satisfied with their jobs in comparison with those from agriculture, a sign of the coefficient being a negative one.
Age and seniority of employees do not significantly impact the degree of satisfaction with their current job, the probabilities of the coefficients being higher than the maximum significance threshold of 10%.
Analyzing now the impact of different forms of work flexibility on job satisfaction, the empirical results revealed that contractual flexibility captured by indefinite employment contract with part-time work or fixed-term employment contract with full time or part –time does not reflect any impact on the satisfaction of Romanian employees regarding their job, the probabilities of the coefficients being greater than the maximum significance level of 10%.
Elements of working time arrangements statistically impacted the overall level of job satisfaction even, revealing a certain pattern. Romanian employees are more satisfied working the same number of hours per day, but more willing to have a flexibility in the number of days per week, and this behavior significantly influence the overall level of their satisfaction. In the last few years, more and more Romanian employers allowed their own employees to either work from home or have a shorter Friday, or a totally free day, and this is also reflected in the level of satisfaction.
Functional flexibility statistically and positively impacted the overall level of job satisfaction mainly through the channel of training courses paid by the employer who lead to an increase in the general job satisfaction of employees.
Workspace flexibility statistically and positively impacted the overall level of job satisfaction through its channels of home working, partial home-working and co-working. For Romanian employees, it has become essential that employers allow a mix of home and office working, as well as working in rented spaces, in an environment with several social relations, characterized by important community relations and resource sharing (resource sharing), to increase the level of satisfaction and also the longer-term retentive degree.
The empirical results of the second model, highlighting the influence of multidimensional flexibility composite indicator on the overall level of job satisfaction among Romanian employees, confirmed that salary satisfaction preserved the same positive and statistically significant impact on job satisfaction.
Technicians and unskilled workers tend to be less satisfied with their job, while the level of job satisfaction tends to decrease with the age, employees from the age group 46–55 years old being less satisfied with their jobs compared with the youth.
Employees from national companies tend to be less satisfied with their jobs compared with those ones from limited liability companies.
The impact of the overall measure of work flexibility on the overall level of job satisfaction was positive and highly significant, revealing that a higher level of work flexibility, taking into account a combination of different forms, increases the employee level of job satisfaction. A 10 unit increase in the work flexibility index increases the log odds of job satisfaction by 0.26.
The Hosmer and Lemeshow test (Appendix B), which shows whether the model adequately describes the data, highlights a good fit of the data because the probability is above the 5% threshold.
The classification table provides us with information about the classification of individuals. Thus, of those who declared themselves satisfied, the model correctly classifies 140 people, with a percentage of 92.1%, while of those who declared themselves dissatisfied or neutral, the model correctly classifies a number of 55 individuals, cumulating in a success rate of 82.1%. In total, the model correctly classifies a percentage of 89% (Table 8).

4.6. A Brief Overview on the Main Empirical Results

Summarizing the most relevant empirical results of our research, we should mention that:
Hypothesis 1 was supported by the fact that the average value of the composite index of work flexibility registered the value of 50.22, pointing out a medium level of work flexibility among Romanian employees. Additionally, in order to respond to the following research questions: “What is the level of work flexibility registered by most employees?” and “How many employees have a high level of work flexibility?”, we can say that almost 40% of Romanian employees exhibited a small level of work flexibility, and only one third of Romanian employees registered a higher level of work flexibility, the index value being higher than the threshold of 70.
Hypothesis 2 was only partially supported by the empirical results.
Contractual flexibility proxies by indefinite employment contract with part-time work or fixed-term employment contract with full time or part time does not support hypothesis H2, not leading to an increase in the job satisfaction due to the coefficients’ lack of significance.
Working time arrangements only partially supported H2. Although both were working the same number of hours per day, and the same number of days per week, Romanian employees are more willing to have flexibility in the number of days per week, behavior that significantly influences the overall level of their satisfaction. In the last few years, more and more Romanian employers allowed their own employees to either work from home or have a shorter Friday or a totally free day, and this is reflected also in the level of satisfaction. Working time arrangements brings its share of contribution to sustainable HRM through flexible number of days per week leading to an increase in the overall level of job satisfaction.
Functional flexibility supported hypothesis H2 through the statistically significant coefficient of training courses paid by the employer who lead to an increase in the general job satisfaction of employees. The functional flexibility brings its share of contribution to sustainable HRM through the channel of employee development, an important characteristic of HRM.
Workspace flexibility supported H2 through the statistically and positive impact of home working, partial home working and co-working, leading to an increase in overall job satisfaction. For Romanian employees, it becomes essential that this mix of home and office working, as well as working in rented spaces, in an environment with several social relations, characterized by important community relations and resource sharing (resource sharing) to increase the level of satisfaction and also the longer-term retentive degree.
Hypothesis 3 was supported by the positive and highly significant coefficient of the work flexibility composite index, a global measure including different forms of flexibility and leading to an increase in the level of job satisfaction.
H4 was supported through a high percentage of positive contributions, confirming that HOT, as a new type of working, is associated with a higher level of job performance, a better management of personal time and space, and a higher level of comfort.
H5 was supported through a high percentage of positive contributions, confirming that HOP, as a new type of working, is associated with a higher level of organizational performance, a higher work motivation, higher personal and professional relationships, and a higher level of learning and professional development.
H6 was supported through a high percentage of positive contributions, confirming that CW, as a new type of working, is associated with higher personal and professional relationships, and higher level of learning and professional development.
H7 was supported through a high percentage of positive contributions, confirming that FO, as a new type of working, is associated with higher personal and professional relationships.
H8 was supported through high a percentage of positive contributions, confirming that HOP is associated with a higher level of work motivation.

4.7. Emphasizing the Main Implications for Sustainable HRM

In the face of current challenges, the concept of HRM needs to be redefined, with sustainable HRM being a more appropriate approach to actual human resource management. Sustainable HRM aims at long-term objectives and results, being characterized by employee and environmental care, employee participation and development, external partnership, flexibility, compliance with labor regulations, cooperation between employees, equity, and equality, without affecting profitability.
Among the main characteristics of sustainable HRM, two core characteristics: employee development and a mix of flexible working time and new types of workspaces are particularly important from the perspective of their impact on two main outcomes of sustainable HRM: job satisfaction and job performance.
In the light of achieving sustainable HRM, the positive influence of employee development on job satisfaction as an important outcome of sustainable HRM can be revealed.
Employees are key stakeholders in the formation and development of the organization’s human and social capital and are a key source of knowledge and support for the development and implementation of sustainable HRM.
Employees working desired hours tend to be more motivated and spend a longer period of time without changing jobs. In recent years, this paradigm shift conduced to an increase on employee autonomy, interruptions during work schedules to meet employee needs, employee participation on decision making, workspace modelling, increasing employee creativity and productivity. Job performance and satisfaction influences sustainable HR practices, so their knowledge is essential to be able to redefine HRM according to current needs. If an organization wants to practice sustainable HRM, it should focus on developing employees in sustainability, by engaging them through taskforces, trainings and in the sustainability strategy’s design and implementation.
Employee development needs to be oriented mainly in the acquiring of skills and capacities that employees can use in the future and seeing employees as a main asset as well as agents of change [3]. Hirsig et al. [43] and Stankevičiūtė and Savanevičie [3] highlighted the importance of investment in training and education for human resources, creating a win–win situation both for employees (future employability and career opportunities) and for employer (profitability and success).
The presence of sustainability in HRM can be revealed through employee development via on the job training, which can be seen as a cost saving approach, leading in turn to higher job motivation [43] as well as from the perspective of attracting new employees [3] sending the message that the company is interested in their long term retention.
From the perspective of sustainable HRM, flexible employment forms hardly support the idea of sustainability and do not highlighted any impact of job satisfaction at the level of Romanian employees.
A mix of flexible working times and new types of workspaces represents a potential solution for sustainable HRM, increasing the level of job satisfaction and resulting in lesser use of company cars and reduced need for large buildings, both of which will help the environment. Other than that, employees will benefit from increased freedom and control which will lead to a better work-life balance and lower levels of stress.
Therefore, if the challenge is to redesign the actual human resource management in order to achieve the desideratum of sustainable HRM, the attention needs to be on a mixture of employee development-flexible and time-flexible places leading to an increase in both employee job satisfaction and organizational performance, as important outcomes of sustainable HRM. Sustainable HRM should strive to be involved with the sustainability strategy from the beginning, which will positively influence their perceived possibilities for putting sustainability on the map and their role in enthusing, facilitating and motivating employees for sustainability.

5. Conclusions and Policy Implications

5.1. Main Conclusions of the Research

Over time, the global market has undergone important changes in the nature of the work that employees and organizations have to deal with, such as more knowledge-intensive content, rapid technological change, constant innovation, and more flexible jobs and time programs.
The role of the employee become even more important. Employees working desired hours tend to be more motivated and spend a longer period of time without changing jobs. In recent years this paradigm shift conduced to an increase on employee autonomy, interruptions during work schedules to meet employee needs, employee participation on decision making, workspace modelling, increasing employee creativity and productivity. The knowledge of job performance and satisfaction as important outcomes of is essential to be able to redefine HRM according to current needs.
Work flexibility offers to employees a balance between professional and personal life, leading to job satisfaction and performance, with positive consequences of the well-being of the organization. Work flexibility is very important, digital transformations and technology allowing a carrying out of activities based on an internet connection in many areas.
In such a context, the paper investigated the relationship between employee development and worktime and workspace flexibility as relevant characteristics of sustainable HRM, job satisfaction and job performance among Romanian employees in order to identify how to redesign HRM in the face of “future work” challenges. Thus, the paper aims to examine the impact of different types of flexibility—functional, working time and workspace flexibility in order to highlight the relevance of employee development and employee flexibility as important aspects of sustainable HRM in increasing the overall level of employee job satisfaction.
In order to do that, an employee flexibility composite indicator taking into account the main four types of flexibility has been developed on the basis of Romanian employees’ points of view gathered by a national representative survey using the multiple correspondence analysis. Furthermore, the impact of both individual types of flexibility as well as employee flexibility composite indicator on the overall level of job satisfaction has been quantified using binary logistic regression models. Within the research, special attention was granted to the impact of new types of workspaces (FO, CW, HOT, HOP) on the job performance, job satisfaction, organizational performance, professional growth and development, social and professional relationships, and personal professional performance as well as on the overall level of work motivation.
The empirical results revealed that the main forms of work flexibility mentioned by Romanian employees were work in team, computer usage, teleworking and job rotation. Analyzing the response provided by the respondents, it can be highlighted that flexible forms of employment or functional flexibility were present on the Romanian labor market only in a small extent, a larger field being won by working time flexibility and workspace flexibility.
The functional flexibility related to employee training was found only to a small extent within Romanian companies, only a third of employees benefiting from training course paid by their own employer.
A little more than one third of Romanian employees declared to work in a flexible manner and an even smaller proportion declared to benefit from flexible working hours, flexible number of days per week, working in shifts, or work outside normal working hours.
In terms of workspace flexibility, the new types of workspaces were highly appreciated by employees, creating a great openness and interest in them.
Home working has the most appreciations mainly in terms of labor productivity, comfort and time and space management, while partial home working has highly appreciated in terms of organizational performance, relationships, learning and personal development. In terms of relationships, learning and personal development, contributions were also made by co-working and flex-office. However, the most suitable solution, which results from the study, is a mix between working from home and working in company offices, with accents in rented spaces co-working.
Another important result of our research was the composite index of work flexibility for employees, whose average value pointed out an almost medium level of work flexibility with Romanian organizations, while only a third of Romanian employees exhibited a higher level of work flexibility. The research pointed out significant differences among demographic variables. Therefore, employees from the center and Bucharest-Ilfov; from national companies or public institutions; from companies activating in wholesale, services, or constructions; general managers, directors, or a person holding a senior or a middle management position; or higher education specialists have a higher level of work flexibility.
The empirical analysis of logistic regression analysis pointed out the role of functional flexibility, working time and workspace flexibility together with the flexibility composite indicator in increasing the level of job satisfaction. Therefore, if the challenge is to redesign actual human resource management in order to include the concept of sustainability, attention needs to be on employee development together with the mix of flexible working time and workspaces that will increase the employee job satisfaction, thus leading to sustainable HRM.
Romanian employees mentioned the importance of financial incentives even if it is known that this type of measure will produce effects only on short-term, the relevance of functional flexibility through the participation to training courses and the working time flexibility through a flexible program as the main measures in increasing employee work motivation.
The empirical results of logistic regression analysis pointed out the role of two core characteristics of sustainable HRM: employee development and a mix of flexible working time and new types of workspaces are particularly important from the perspective of their impact on two main outcomes of sustainable HRM, job satisfaction, and job performance.
Contractual flexibility does not reflect any impact on the satisfaction of Romanian employees regarding their job.
Working time arrangements statistically impacted the overall level of job satisfaction, revealing a certain pattern. Romanian employees are more satisfied working the same number of hours per day but more willing to have a flexibility in the number of days per week, and this behaviour significantly influence the overall level of their satisfaction. In the last few years, more and more Romanian employers allowed their own employees to either work from home or have a shorter Friday or a totally free day and this is reflected also in the level of satisfaction.
Functional flexibility statistically and positively impacted the overall level of job satisfaction mainly through the channel of training courses paid by the employer who lead to an increase in the general job satisfaction of employees.
Workspace flexibility statistically and positively impacted the overall level of job satisfaction through its channels of home working, partial home-working and co-working. For Romanian employees, it has become essential that employers allow a mix of home and office working, as well as working in rented spaces, in an environment with several social relations, characterized by important community relations and resource sharing (resource sharing), to increase the level of satisfaction and also the longer-term retentive degree
Also, the overall measure of work flexibility exhibited a positive impact on job satisfaction, revealing that a higher level of work flexibility, in a combination of different forms, increases the employee level of job satisfaction.
Therefore, if the challenge is to redesign the actual human resource management in order to achieve the desideratum of sustainable HRM, the attention needs to be on a mix of employee development-flexible and time-flexible places, leading to an increase in both employee job satisfaction and organizational performance, as important outcomes of sustainable HRM.

5.2. Policy Implications

In the context of today’s economy, when professionals can choose from a wide range of offers available on the labor market, employers must reinvent themselves and begin to offer potential employee’s alternative benefits, other than simply financial ones. Most of the time, the flexibility of the organization can determine both the employee’s longevity and, more importantly, their motivation to work hard and to be productive. Employer flexibility benefits not only the employees, but also the organization that offers it. Rigidity removes talent, and in a free, growing market, potential employees have the opportunity to explore their options before they choose a position.
The labor market is constantly changing, atypical work acquiring a significant influence, especially in these current times of the coronavirus crisis restrictions. A Gallup article published in early April 2020 has already indicated a change, “three out of five US workers who did their homework during the coronavirus pandemic would prefer to continue working as far away as possible,” while 41% said they would prefer to return to work or the office to work as they did before the crisis.
Covid-19 produced major changes, including work. All these changes will result in a work reorganization, as long as flexibility do not change performance targets. In time of coronavirus crisis working at home became the new normal, work flexibility must be “business as usual” and not just something to resort to in times of crisis.
After the coronavirus crisis passes, its effects will be felt in both the long term and short term. Related to work, some managers consider continuing their work from home because they have noticed an increase in productivity from employees and lower costs. It is obvious that most employees will notice changes regarding work compared to the period before crisis. In Australia, the country that has managed this health crisis very well, it is being discussed that the work week will be reduced to four days a week as a new measure regarding work flexibility in order to restart the economy as soon as possible, but also to protect citizens. Other organizations are considering work flexibility, a four-day work week with the fifth day being dedicated to volunteering.
In the event of a crisis, we can respond with either resilience or resistance. According to Mercer’s 2020 Global Talent Trends Study [130] in times of actual crisis, companies said they planned to increase strategic partnerships (40%), use more variable talent pools (39%), and invest in automation (34%). Flexible operation is a crucial component, only 44% of companies consider systematically evaluating jobs for their adaptation, making flexibility dependent on the job, rather than on a person’s circumstances. Resilience is influenced by the type of industry involved. According to a COVID-19 survey, the sectors that have been significantly impacted following disruptions are healthcare (56%), retail (56%), mining (55%), manufacturing (46%), and automation (43%). Clearly, business models that are difficult to digitize, highly dependent on people, or that rely heavily on global supply chains are the most exposed. In contrast, the least affected sectors are professional services (4%), high technology (5%), education (9%), insurance (10%), and telecommunications (12%). Depending on how long the situation continues, many of them will feel the effects of limited funding for discretionary projects and value-added services.
The state of emergency has removed some preconceived notions. For example, it turns out that we can work from home, and very well at that. Therefore, this crisis is a great opportunity for companies and employees to reinvent themselves.

Author Contributions

Conceptualization, A.A.D., I.C., and S.-A.A.; methodology, A.A.D. and S.-A.A.; software, A.A.D.; validation, A.A.D., S.-A.A., and A.P.; formal analysis, I.C. and A.P.; investigation, A.A.D. and S.-A.A.; resources, I.C.; data curation, S.-A.A., I.C., and A.P.; writing—original draft preparation, A.A.D., S.-A.A., A.P., and I.C.; writing—A.A.D., S.-A.A., A.P., and I.C.; visualization, A.A.D.; supervision, A.A.D. and S.-A.A. All authors have read and agreed to the published version of the manuscript.

Funding

This research received no external funding.

Conflicts of Interest

The authors declare no conflict of interest.

Appendix A

Table A1. The results of multiple correspondence analysis (final weights).
Dim. 1
Contractual flexibilityYou are employee on the basis of an indefinite employment contract with full working timeyes−0.045
no1.058
You are employee on the basis of an indefinite employment contract with part-time workyes1.667
no−0.047
You are employee on the basis of a fixed-term employment contract with part-time workyes0.738
no−0.003
Working time flexibilityDo you work 40 h a week at your main job?yes0.649
no−0.079
Do you have more than one job?yes1.963
no−0.093
Do you work the same number of hours every day?yes0.474
no−0.162
Do you start and end the program at fixed hours?yes1.031
no−0.451
Do you work in shifts?yes0.766
no−1.171
Do you work flexible hours?yes0.430
no−0.255
Functional flexibilityHave you participated in training courses paid for by your employer?yes0.863
no−0.429
Have you participated in paid courses from your own sources?yes2.732
no−0.398
Workspace flexibilityDo you practice home working?yes2.625
no−1.199
Do you practice partial home working?yes2.819
no−1.106
Do you practice co-working?yes3.426
no−0.832
Do you practice flex-office?yes3.468
no−0.724

Appendix B

Table A2. Hosmer and Lemeshow test for models I and II.
Hosmer and Lemeshow Test
Chi-SquaredfSig.
Model I9.22180.324
Model II3.42190.905
Sig. = Significance.
Table A3. Model summary.
Model Summary
−2 Log LikelihoodCox & Snell R SquareNagelkerke R Square
Model I121.917 a0.4910.693
Model II137.608 a0.4430.625
a Estimation terminated at iteration number 20 because maximum iterations has been reached. Final solution cannot be found.

References

  1. Stankevičiūtė, Z.; Savanevičienė, A. Designing Sustainable HRM: The Core Characteristics of Emerging Field. Sustainability 2018, 10, 4798. [Google Scholar] [CrossRef] [Green Version]
  2. De Prins, P.; Van Beirendonck, L.; De Vos, A.; Segers, J. Sustainable HRM: Bridging theory and practice through the ‘Respect Openness Continuity (ROC)’-model. Manag. Rev. 2014, 25, 263–284. [Google Scholar] [CrossRef]
  3. Ehnert, I.; Harry, W.; Zink, K.J. Sustainability and HRM. An Introduction to the Field. In Sustainability and Human Resource Management: Developing Sustainable Business Organizations; Ehnert, I., Harry, W., Zink, K.J., Eds.; Springer: Berlin/Heidelberg, Germany, 2014; pp. 3–32. ISBN 978-3-642-37524-8. [Google Scholar]
  4. Macke, J.; Genari, D. Systematic literature review on sustainable human resource management. J. Clean. Prod. 2019, 208, 806–815. [Google Scholar] [CrossRef]
  5. Sisson, K.; Storey, J. The Realities of Human Resource Management: Managing the Employment Relationship; Open University Press: Maidenhead, UK, 2000. [Google Scholar]
  6. Strenitzerová, M.; Achimský, K. Employee Satisfaction and Loyalty as a Part of Sustainable Human Resource Management in Postal Sector. Sustainability 2019, 11, 4591. [Google Scholar] [CrossRef] [Green Version]
  7. Esfahani, S.A.; Rezaii, H.; Koochmeshki, N.; Sharifi-Parsa, S. Sustainable and Flexible Human Resource Management for innovative organizations. AD-Minist. 2017, 30, 195–215. [Google Scholar] [CrossRef]
  8. Kazlauskaite, R.; Buciuniene, I. The Role of Human Resources and Their Management in the Establishment of Sustainable Competitive Advantage. Eng. Econ. 2008, 5, 78–85. [Google Scholar]
  9. Cohen, E.; Taylor, S.; Muller-Camen, M. HRM’s role in corporate social and environmental sustainability. SHRM Rep. 2012, 1, 1–16. [Google Scholar]
  10. Zaugg, R.; Blum, A.; Norbert, T. Sustainability in Human Resource Management. In Evaluation Report; IOP Press: Bristol, UK, 2001; Volume 1. [Google Scholar]
  11. Park, L.Y. EOR-Based HRM System and Organizational Ambidexterity. Acad. Manag. 2017. [Google Scholar] [CrossRef]
  12. Nyameh, J. Impact of Sustainable Human Resource Management and organizational performance. Int. J. Asian Soc. Sci. 2013, 3, 1287–1292. [Google Scholar]
  13. Schuler, R.S.; Jackson, S.E. Linking competitive strategies with human resource management practices. Acad. Manag. Exec. 1987, 1, 207–219. [Google Scholar] [CrossRef]
  14. Delery, J.E.; Doty, D.H. Modes of theorizing in strategic human resource management: Tests of universalistic, contingency, and configurational performance predictions. Acad. Manag. J. 1996, 39, 802–835. [Google Scholar] [CrossRef]
  15. Purcell, J. Understanding the People and Performance Link, Unlocking the Black Box; CIPD Press: London, UK, 2003. [Google Scholar]
  16. Appelbaum, E.; Bailey, T.; Berg, P.; Kalleberg, A. Manufacturing Advantage: Why High Performance Work Systems Pay Off; Cornell University Press: Ithaca, NY, USA, 2000. [Google Scholar]
  17. Snell, S.A.; Dean, J.W. Integrated manufacturing and human resource management: A human capital perspective. Acad. Manag. J. 1992, 35, 467–504. [Google Scholar]
  18. Armstrong, M. A Handbook of Human Resource Management Practice, 10th ed.; Kogan Page Ltd.: London, UK; Philadelphia, PA, USA, 2006. [Google Scholar]
  19. Lorincova, S.; Hitka, M.; Starchon, P.; Stachova, K. Strategic Instruments for Sustainability of Human Resource Management in Small and Medium-Sized Enterprises Using Management Data. Sustainability 2018, 10, 3687. [Google Scholar] [CrossRef] [Green Version]
  20. Dirisu, J.; Worlu, R.; Osibanjo, A.; Salau, O.; Borishade, T.; Meninwa, S.; Atolagbe, T. An integrated dataset on organisational culture, job satisfaction and performance in the hospitality industry. Data Brief 2018, 19, 317–321. [Google Scholar] [CrossRef] [PubMed]
  21. Raziq, A.; Maulabakhsh, R. Impact of working environment on job satisfaction. Proc. Econ. Financ. 2015, 23, 717–725. [Google Scholar] [CrossRef]
  22. Al Mamun, C.A.; Hasan, M.N. Factors affecting employee turnover and sound retention strategies in business organization: A conceptual view. Probl. Perspect. Manag. 2017, 15, 63–71. [Google Scholar]
  23. Cantele, S.; Zardini, A. Sustainability a Competitive Advantage for Small Businesses? An Empirical Analysis of Possible Mediators in the Sustainability–Financial Performance Relationship. J. Clean. Prod. 2018, 182, 166–176. [Google Scholar] [CrossRef]
  24. Delmas, M.A.; Pekovic, S. Environmental Standards and Labor Productivity: Understanding the Mechanisms that Sustain Sustainability. J. Organ. Behav. 2013, 34, 230–252. [Google Scholar] [CrossRef] [Green Version]
  25. Pintão, S.; Chaves, C.; Branco, M.C. Employees’ recognition of corporate sustainability: A case study. Corp. Gov. 2018, 18, 104–118. [Google Scholar] [CrossRef]
  26. Dongho, K. Employee Motivation: “Just Ask Your Employees”. Seoul J. Bus. 2006, 12, 19–35. [Google Scholar]
  27. Monusova, G.A. Job satisfaction: International comparisons. World Econ. Int. Relat. 2008, 12, 74–83. [Google Scholar]
  28. Bakotic, D.; Babic, T.B. Relationship between working conditions and job satisfaction: The case of Croatian ship building company. Int. J. Bus. Soc. Sci. 2013, 4, 206–213. [Google Scholar]
  29. Chatzopoulou, M.; Vlachvei, A.; Monovasilis, T. Employee’s motivation and satisfaction in light of economic recession: Evidence of Grevena Prefecture-Greece. Proc. Econ. Financ. 2015, 24, 136–145. [Google Scholar] [CrossRef] [Green Version]
  30. Chang, R.D.; Zuo, J.; Zhao, Z.Y.; Soebarto, V.; Lu, Y.; Zillante, G.; Gan, X.L. Sustainability attitude and performance of construction enterprises: A China study. J. Clean. Prod. 2018, 172, 1440–1451. [Google Scholar] [CrossRef]
  31. Chatterjee, S.; DuttaGupta, S.; Upadhyay, P. Sustainability of microenterprises: An empirical analysis. Benchmarking 2018, 25, 919–931. [Google Scholar] [CrossRef]
  32. Gianni, M.; Gotzamani, K.; Tsiotras, G. Multiple perspectives on integrated management systems and corporate sustainability performance. J. Clean. Prod. 2017, 168, 1297–1311. [Google Scholar] [CrossRef]
  33. Roxas, B.; Ashill, N.; Chadee, D. Effects of entrepreneurial and environmental sustainability orientations on firm performance: A study of small businesses in the Philippines. J. Small Bus. Manag. 2017, 55, 163–178. [Google Scholar] [CrossRef]
  34. Chandrasekar, K. Workplace environment and its impact organizational performance in public sector organizations. Int. J. Enterp. Comput. Bus. Syst. 2011, 1, 1–15. [Google Scholar]
  35. Giovanis, E. Do the flexible employment arrangements increase job satisfaction and employee loyalty? Evidence from Bayesian networks and instrumental variables. Int. J. Comput. Econ. Econom. 2019, 9, 84–115. [Google Scholar]
  36. Kot-Radojewska, M.; Timenko, I.V. Employee loyalty to the organization in the context of the form of employment. Oeconomia Copernic. 2018, 10, 511–527. [Google Scholar] [CrossRef]
  37. Gazioglu, S.; Tansel, A. Job satisfacion in Britain: Individual and job related factors. Appl. Econ. 2006, 38, 1163–1171. [Google Scholar] [CrossRef] [Green Version]
  38. Kozica, A.M.F.; Kaiser, S. A sustainability perspective on flexible HRM: How to cope with paradoxes of contingent work. Manag. Rev. 2012, 23, 239–261. [Google Scholar] [CrossRef]
  39. Halpern, D.F. Public Policy, Work, and Families: The Report of the APA Presidential Initiative on Work and Families; American Psychological Association: Washington, DC, USA, 2004. [Google Scholar]
  40. Kalleberg, A. Nonstandard Employment Relations: Part-Time, Temporary and Contract Work. Annu. Rev. Sociol. 2000, 16, 341–365. [Google Scholar]
  41. Reilly, P. Flexibility at Work. In Balacing the Interests of Employer and Employee; Gower House: London, UK, 2001. [Google Scholar]
  42. Origo, F.; Pagani, L. Is Work Flexibility a Stairway to Heaven? The Story Told by Job Satisfaction in Europe. Work. Pap. Ser. 2006, 97, 1–19. [Google Scholar]
  43. Casuneanu, I. Improving the flexibility of the labor force in Romanian enterprises using the practices in the field from some EU countries. Theor. Appl. Econ. 2013, XX, 110–122. [Google Scholar]
  44. Hirsig, N.; Rogovsky, N.; Elkin, M. Enterprise Sustainability and HRM in Small and Medium-Sized Enterprises. In Sustainability and Human Resource Management: Developing Sustainable Business Organizations; Ehnert, I., Harry, W., Zink, K.J., Eds.; Springer: Berlin/Heidelberg, Germany, 2014; pp. 127–152. [Google Scholar]
  45. Aziri, B. Job satisfaction. A literature review. Manag. Res. Pract. 2011, 3, 77–86. [Google Scholar]
  46. Peariasamy, T.; Mansor, N.N.A. On-the-job knowledge sharing: How to train employees to share job knowledge. J. Kemanus. 2008, 12, 87–101. [Google Scholar]
  47. Vroom, V.H. Work and Motivation; John Wiley and Sons: New York, NY, USA, 1964. [Google Scholar]
  48. Hoppock, R. Job Satisfaction; Harper and Brothers: New York, NY, USA, 1935. [Google Scholar]
  49. O’Keefe, S.M. Amid COVID-19, Let’s Rethink Workplace Flexibility. Gallup. Available online: https://www.gallup.com/workplace/310214/amid-covid-let-rethink-workplace-flexibility.aspx (accessed on 8 May 2020).
  50. Cheremond, R.J. As the Pandemic Resets Major Work Trends, HR Leaders Need to Rethink Workforce and Employee Planning, Management, Performance and Experience Strategies. Gartner. Available online: https://www.gartner.com/smarterwithgartner/9-future-of-work-trends-post-covid-19/ (accessed on 7 April 2020).
  51. World Health Organization. Covid-19 Strategy Update. Available online: https://www.who.int/docs/default-source/coronaviruse/covid-strategy-update-14april2020.pdf?sfvrsn=29da3ba0_19 (accessed on 7 May 2020).
  52. Buheji, M.; Ahmed, D.A.A. Planning for “The New Normal”—Foresight and Management of the Possibilities of Socio-economic. Spillovers due to COVID-19 Pandemic. Bus. Manag. Strategy 2020, 11, 160–179. [Google Scholar] [CrossRef]
  53. Adams-Prassl, A.; Boneva, T.; Golin, M.; Rauh, C. Inequality in the Impact of the Coronavirus Shock: Evidence from Real Time Surveys; IZA DP No. 13183; IZA: Bonn, Germany, 2020. [Google Scholar]
  54. Chaturvedi, S. COVID-19 pandemic: Are we witnessing the first world war? Indian J. Public Health 2020, 64, 99–101. [Google Scholar]
  55. Spurk, D.; Straub, C. Flexible employment relationships and careers in times of the COVID-19 pandemic. J. Vocat. Behav. 2020, 119, 103435. [Google Scholar] [CrossRef]
  56. Shan, C.; Tang, D.Y. The Value of Employee Satisfaction in Disastrous Times: Evidence from COVID-19. Available online: https://ssrn.com/abstract=3560919 (accessed on 10 July 2020).
  57. Akkermans, J.; Richardson, J.; Kraimer, M.L. The Covid-19 crisis as a career shock: Implications for careers and vocational behavior. J. Vocat. Behav. 2020, 119, 103434. [Google Scholar] [CrossRef] [PubMed]
  58. Linkedin Learning. 2019 Workplace Learning Report. Available online: https://learning.linkedin.com/content/dam/me/business/en-us/amp/learning-solutions/images/workplace-learning-report-2019/pdf/workplace-learning-report-2019.pdf (accessed on 15 April 2020).
  59. Brenan, M. U.S. Workers Discovering Affinity for Remote Work. Gallup. Available online: https://news.gallup.com/poll/306695/workers-discovering-affinity-remote-work.aspx (accessed on 3 April 2020).
  60. Aniţei, M.; Stoica, I.; Samsonescu, M. Particularities of Personality Traits and Perceived Stress at Workplace for the Young Workers in Romania. Procedia Soc. Behav. Sci. 2013, 84, 1010–1014. [Google Scholar] [CrossRef] [Green Version]
  61. Shepard, E.; Clifton, T.; Kruse, D. Flexible working hours and productivity: Some evidence from pharmaceutical industry. Ind. Relat. 1996, 35, 123–139. [Google Scholar]
  62. McNeilly, K.; Goldsmith, R.E. The moderating effects of gender and performance on job satisfaction and intentions to leave in the sales force. J. Bus. Res. 1991, 22, 219–232. [Google Scholar] [CrossRef]
  63. Clark, A.E. Job satisfaction and gender: Why are women so happy at work? Labour Econ. 1997, 4, 341–372. [Google Scholar] [CrossRef]
  64. Tang, N.; Cousins, C. Working time, gender and family: An East-West European comparison. Gend. Work Organ. 2005, 12, 527–550. [Google Scholar] [CrossRef]
  65. Pook, L.A.; Füstös, J.; Marian, L. The impact of gender bias on job satisfaction Components of job satisfaction and advancement in post-liberation Hungary, Poland, and Romania. Hum. Syst. Manag. 2003, 22, 37–50. [Google Scholar]
  66. Matei, A.I.; Fataciune, M. Exploring the Job Satisfaction of Public and Private Employees in Romania. In Proceedings of the 10th International Conference on Business Administration, Catalonia, Spain, 13 April 2016; pp. 138–145. [Google Scholar]
  67. Yousef, D.A. Organizational Commitment: A Mediator of the Relationships of Leadership Behavior with Job Satisfaction and Performance in a Non-Western Country. J. Manag. Psychol. 2000, 15, 6–24. [Google Scholar] [CrossRef]
  68. Matei, M.C.; Abrudan, M.M. Adapting Herzberg’s Two Factor Theory to the Cultural Context of Romania. Procedia Soc. Behav. Sci. 2016, 221, 95–104. [Google Scholar] [CrossRef] [Green Version]
  69. Săveanu, T.; Săveanu, S.M. Do we really hate our jobs? Determinants of determinants of job satisfaction in Romania. Ann. Fac. Econ. 2011, 1, 723–729. [Google Scholar]
  70. Suciu, L.E.; Mortan, M.; Lazar, L. Vroom’s Expectancy Theory. An Empirical Study: Civil Servant’s Performance Appraisal Influencing Expectancy. Transylv. Rev. Adm. Sci. 2013, 9, 180–200. [Google Scholar]
  71. Analoui, F. What motivates senior managers? The case of Romania. J. Manag. Psychol. 2000, 15, 324–340. [Google Scholar] [CrossRef]
  72. Tampu, L.D. Key Facts about Motivation on Romanian Employers. Bus. Econ. 2016, 1, 217–227. [Google Scholar]
  73. Cristescu, A.; Stanilă, L.; Andreica, M.E. Motivation of the public employee in Romania in the context of the economic crisis. Theor. Appl. Econ. 2013, 20, 49–64. [Google Scholar]
  74. Possenriede, D.S.; Plantenga, J. Temporal and Locational Flexibility of Work, Working-Time Fit, and Job Satisfaction. IZA Discussion Paper 2014, No. 8436. Available online: http://ftp.iza.org/dp8436.pdf (accessed on 11 April 2020).
  75. Almer, E.D.; Kaplan, S.E. The Effects of Flexible Work Arrangements on Stressors, Burnout, and Behavioral Job Outcomes in Public Accounting. Behav. Res. Account. 2002, 14, 1–34. [Google Scholar] [CrossRef]
  76. Casey, P.R.; Grzywacz, J.G. Employee health and well-being: The role of flexibility and work-family balance. Psychol. Manag. J. 2008, 11, 31–47. [Google Scholar] [CrossRef]
  77. Jijena Michel, R.D.; Jijena Michel, C.E. Work Schedule Flexibility, Work-Family Enrichment and Job Satisfaction. J. Behav. Sci. 2015, 25, 78–90. [Google Scholar]
  78. Casuneanu, I.; Lefter, V.; Davidescu, A.A.M. Does Company Size Matter? An Empirical Investigation on Job Satisfaction and Work Flexibility based on Romanian Employees’ Opinions. Int. J. Acad. Res. Bus. Soc. Sci. 2019, 9, 362–382. [Google Scholar] [CrossRef]
  79. Buzea, C. Equity Theory Constructs in a Romanian Cultural Context. Hum. Resour. Dev. Q. 2014, 25, 421–439. [Google Scholar] [CrossRef]
  80. Pavalache-Ilie, M. Organizational citizenship behaviour, work satisfaction and employees’ personality. Sci. Direct Procedia Soc. Behav. Sci. 2014, 127, 489–493. [Google Scholar] [CrossRef] [Green Version]
  81. Campbell, J.P. Modeling the Performance Prediction Problem in Industrial and Organizational Psychology. In Handbook of Industrial and Organizational Psychology; Dunnette, M.D., Lough, L.M., Eds.; American Psychological Association: Worcester, MA, USA, 1990; pp. 687–732. [Google Scholar]
  82. Waldman, D.A.; Spangler, W.D. Putting together the pieces: A closer look at the determinants of job performance. Hum. Perform. 1989, 2, 29–59. [Google Scholar] [CrossRef]
  83. Ng, T.W.H.; Feldman, D.C. Age, work experience, and the psychological contract. J. Organ. Behav. 2009, 30, 1053–1075. [Google Scholar] [CrossRef]
  84. Campbell, J.P.; McCloy, R.A.; Oppler, S.H.; Sager, C.E. A Theory of Performance. In Personnel Selection in Organizations; Wiely: Hoboken, NJ, USA, 1993; pp. 35–70. [Google Scholar]
  85. Bercu, A.M.; Onofrei, A.M. The Empirical Research on Civil Servants’ Motivation: Evidence from Romania. Manag. Glob. Transit. 2017, 15, 399–417. [Google Scholar] [CrossRef]
  86. Mihalcea, A. Leadership, personality, job satisfaction and job performance. Procedia Soc. Behav. Sci. 2014, 127, 443–447. [Google Scholar] [CrossRef] [Green Version]
  87. Ölçer, F.; Florescu, M.S. Mediating effect of job satisfaction in the relationship between psychological empowerment and job performance. Bus. Excell. Manag. 2015, 5, 5–32. [Google Scholar]
  88. Tampu, D.L.I.; Cochina, I. Motivation & Employee Performance. Proc. Int. Manag. Conf. 2015, 9, 812–821. [Google Scholar]
  89. Bal, P.M.; De Lange, A.H. From flexibility human resource management to employee engagement and perceived job performance across the lifespan: A multisample study. J. Occup. Organ. Psychol. 2014, 88, 126–154. [Google Scholar] [CrossRef]
  90. Martínez-Sánchez, A.; Pérez-Pérez, M.; De-Luis-Carnicer, P.; Vela-Jiménez, M.J. Telework, human resource flexibility and firm performance. New Technol. Work Employ. 2007, 22, 208–223. [Google Scholar] [CrossRef]
  91. Bran, C.; Udrea, C.I. The Influence of Motivation and Flexibility on Job Performance. Eur. Proc. Soc. Behav. Sci. 2016, 136–143. [Google Scholar]
  92. Beltrán-Martín, I.; Roca-Puig, V.; Escrig-Tena, A.; Bou-Llusar, J.C. Human Resource Flexibility as a Mediating Variable between High Performance Work Systems and Performance. J. Manag. 2008, 34, 1009–1044. [Google Scholar] [CrossRef] [Green Version]
  93. Lepak, D.P.; Takeuchi, R.; Snell, S.A. Employment Flexibility and Firm Performance: Examining the Interaction Effects of Employment Mode, Environmental Dynamism, and Technological Intensity. J. Manag. 2003, 29, 681–703. [Google Scholar]
  94. Valverde, M.; Tregaskis, O.; Brewster, C. Labor flexibility and firm performance. Int. Adv. Econ. Res. 2000, 6, 649–661. [Google Scholar] [CrossRef]
  95. Manzoor, F.; Wei, L.; Bányai, T.; Nurunnabi, M.; Subhan, Q.A. An Examination of Sustainable HRM Practices on Job Performance: An Application of Training as a Moderator. Sustainability 2019, 11, 2263. [Google Scholar] [CrossRef] [Green Version]
  96. Casuneanu, I. The Romanian employee motivation system: An empirical analysis. Int. J. Math. Models Methods Appl. Sci. 2011, 5, 931–938. [Google Scholar]
  97. Carvalho, A.; Cabral-Cardoso, C. Flexibility through HRM in management consulting firms. Pers. Rev. 2008, 37, 332–349. [Google Scholar] [CrossRef] [Green Version]
  98. Dex, S.; Scheibl, F. Flexible and family friendly arrangements in SMEs: The business case. Br. J. Ind. Relat. 2001, 38, 411–431. [Google Scholar] [CrossRef]
  99. Lefter, V.; Davidescu, A.A.M.; Casuneanu, I. Identifying the Main Factors of Workplace Flexibility Among Romanian Employees. Solut. Bus. Cult. Relig. East. Eur. Beyond 2017, 115–128. [Google Scholar] [CrossRef]
  100. Dima, A.M.; Țuclea, C.E.; Vrânceanu, D.M.; Țigu, G. Sustainable Social and Individual Implications of Telework: A New Insight into the Romanian Labor Market. Sustainability 2019, 11, 3506. [Google Scholar] [CrossRef] [Green Version]
  101. Lefter, V.; Casuneanu, I. Revealing the Main Characteristics of Work Flexibility. An Empirical Analysis Based on Romanian Employees’ Perspective. Ovidius Univ. Ann. Econ. Sci. Ser. 2018, 18, 471–476. [Google Scholar]
  102. Lefter, V.; Casuneanu, I.; Enache, A.O. Analyzing the Link Between Work Flexibility, Job Satisfaction and Job Performance Among Romanian Employees. Ovidius Univ. Ann. Econ. Sci. Ser. 2018, 18, 477–482. [Google Scholar]
  103. Orpen, C. Effect of flexible working hours on employee satisfaction and performance: A field experiment. J. Appl. Psychol. 1981, 66, 113–115. [Google Scholar] [CrossRef]
  104. Solanki, K.R. Flextime association with job satisfaction, work productivity, motivation & employees stress levels. J. Hum. Resour. Manag. 2013, 1, 9–14. [Google Scholar]
  105. Al Omar, A.; Lolli, J.; Chen-McCain, S.L.; Dickerson, J. A Comparison between Full and Part-Time Lodging Employees on Job Satisfaction, Organizational Commitment, and Job Performance. In Proceedings of the International CHRIE Conference-Refereed Track, Denver, CO, USA, 29 July 2011. [Google Scholar]
  106. Govender, L.; Migiro, S.O.; Kyule, A.K. Flexible Work Arrangements, Job Satisfaction and Performance. J. Econ. Behav. Stud. 2018, 10, 268–277. [Google Scholar]
  107. Burtaverde, V. Psychometric properties of the hexaco PI-R on a Romanian sample. The relationship with work outcomes and general outcomes. Rom. J. Exp. Appl. 2015, 6, 31–58. [Google Scholar]
  108. Bowling, N.A. Is the job satisfaction–job performance relationship spurious? A meta-analytic examination. J. Vocat. Behav. 2007, 71, 167–185. [Google Scholar] [CrossRef]
  109. Judje, T.A.; Joyce, E.B.; Thoresen, C.J.; Patton, K.P. The Job Satisfaction–Job Performance Relationship. Psychol. Bull. 2001, 127, 376–407. [Google Scholar]
  110. Christen, M.; Iyer, G.; Soberman, D. Job Satisfaction, Job Performance, and Effort: A Reexamination Using Agency Theory. J. Mark. 2001, 70, 137–150. [Google Scholar] [CrossRef]
  111. Katzell, R.A.; Barrett, R.S.; Parker, T.C. Job satisfaction, job performance, and situational characteristics. J. Appl. Psychol. 1961, 45, 65–72. [Google Scholar] [CrossRef]
  112. O’Leary, P.; Wharton, N.; Quinlan, T. Job satisfaction of physicians in Russia. Int. J. Health Care Qual. Assur. 2009, 22, 221–231. [Google Scholar] [CrossRef]
  113. Norris, D.R.; Niebuhr, R.E. Organization tenure as a moderator of the job satisfaction-job performance relationship. J. Vocat. Behav. 1984, 24, 169–178. [Google Scholar] [CrossRef]
  114. Petty, M.M.; McGee, G.W.; Cavender, J.W. A Meta-Analysis of the Relationships between Individual Job Satisfaction and Individual Performance. Acad. Manag. Rev. 1984, 9, 712–721. [Google Scholar] [CrossRef]
  115. Neagu, M. Motivation and organizational commitment as predictors of workplace performance in a bread factory from Romania. Rom. J. Exp. Appl. Psychol. 2010, 1, 13–23. [Google Scholar]
  116. Burlacu, M.I.; Birsan, A. The Monthly Salary as a Motivational Factor from the Perpective of the Degree of Satisfaction and the Quality of Life. Proc. Int. Manag. Conf. 2016, 10, 418–427. [Google Scholar]
  117. Tanasescu, C.E.; Leon, R.D. Human Resources Practices in the Romanian Banking System: Rewards, Job Satisfaction, and Job Performance. Manag. Dyn. Knowl. Econ. 2019, 7, 469–483. [Google Scholar] [CrossRef]
  118. Wallace, C. Work Flexibility in Eight European countries: A cross-national comparison. Czech Sociol. Rev. 2003, 39, 773–794. [Google Scholar]
  119. Serban, A.C.; Better, A. Employability through Labour Market Flexibility. The Case of Romania. Procedia Soc. Behav. Sci. 2012, 46, 4539–4543. [Google Scholar] [CrossRef] [Green Version]
  120. Ionescu, A.; Horga, M.G.; Nancu, D. Firm Financial Performance: An Empirical Investigation on Romanian SMEs. Ovidius Univ. Ann. Econ. Sci. Ser. 2013, 1, 1299–1303. [Google Scholar]
  121. Asselin, L.M. Multidimensional Poverty Composite: Indicator of Multidimensional Poverty; Institut de mathematique Gauss: Levis, QC, Canada, 2002. [Google Scholar]
  122. Asselin, L.M.; Anh, V.T. Multidimensional Poverty and Multiple Correspondence Analysis. In Quantitative Approaches to Multidimensional Poverty Measurement; Kakwani, N., Silber, J., Eds.; Palgrave Macmillan: London, UK, 2008. [Google Scholar]
  123. Ki, J.B.; Bocar, F.; Faye, S. Pauvrete Multidimensionnelle au Senegal: Une Approche par le Besoine de Base. PEP Working Paper. 2005. Available online: https://idl-bnc-idrc.dspacedirect.org/handle/10625/29985 (accessed on 1 October 2005).
  124. Ningaye, P.; Ndjanyou, L. Multidimensional Poverty in Cameroon: Its Determinants and Spatial Distribution. In Final Report to AERC Presented during the 2006 December Biannual Workshop; AERC: Auburn, CA, USA, 2006. [Google Scholar]
  125. Njong, M.A.; Ningaye, P.M. Characterising Weights in the Measurement of Multidimensional Poverty: An Application of Data-Driven Approaches in Cameroonian Data; OPHI Working Paper; Oxford Poverty & Human Development Initiative: London, UK, 2008; No. 21. [Google Scholar]
  126. Ezzari, A.; Verme, P. A Multiple Correspondence Analysis Approach to the Measurement of Multidimensional Poverty in Morroco, 2001–2007; The World Bank: Washington, DC, USA, 2013; pp. 181–209. [Google Scholar]
  127. Canuel, M.; Abdous, B.; Belanger, D.; Gosselin, P. Development of Composite Indices to Measure the Adoption of Pro-Environmental Behaviours across Canadian Provinces. PLoS ONE 2014, 9, e101569. [Google Scholar] [CrossRef] [Green Version]
  128. Costa, A.O.; Oliveira, L.B.; Lins, M.P.E.; Silva, A.C.M.; Araujo, M.S.M.; Pereira, A.O.; Rosa, L.P. Sustainability analysis of biodiesel production: A review on different resources in Brazil. Renew. Sustain. Energy Rev. 2013, 27, 407–412. [Google Scholar] [CrossRef]
  129. Saunier, O.; Mathieu, A.; Didier, D.; Tombette, M.; Quélo, D.; Winiarek, V.; Bocquet, M. An inverse modeling method to assess the source term of the Fukushima Nuclear Power Plant accident using gamma dose rate observations. Atmos. Chem. Phys. 2013, 13, 11403–11421. [Google Scholar] [CrossRef] [Green Version]
  130. Mercer’s 2020 Global Talent Trends Study. Available online: https://www.mercer.com/our-thinking/career/global-talent-hr-trends.html (accessed on 18 April 2020).
Figure 1. The conceptual framework of theoretical considerations between work flexibility, job satisfaction, and job performance.
Sustainability 12 06086 g001
Figure 2. The scheme of employee flexibility composite indicator (CFI).
Sustainability 12 06086 g002
Figure 3. Dashboard of the Romanian employee sample profile.
Sustainability 12 06086 g003
Figure 4. Main elements of work flexibility present in Romanian companies.
Sustainability 12 06086 g004
Figure 5. Types of Romanian employee contracts.
Sustainability 12 06086 g005
Figure 6. Characteristics of working time flexibility in Romanian companies.
Sustainability 12 06086 g006
Figure 7. Main forms of functional flexibility.
Sustainability 12 06086 g007
Figure 8. Main forms of workspace flexibility.
Sustainability 12 06086 g008
Figure 9. Main measures to be taken to increase the work flexibility.
Sustainability 12 06086 g009
Figure 10. Distribution of employees according to the level of satisfaction with the current job and salary.
Sustainability 12 06086 g010
Figure 11. In your opinion, compared to the previous year, how the motivation system in your company changed?
Sustainability 12 06086 g011
Figure 12. The most important motivational factors for the Romanian employees.
Sustainability 12 06086 g012
Figure 13. Main measures that need to be taken in order to improve the motivation of the employees of the organization.
Sustainability 12 06086 g013
Figure 14. The impact of new forms of workspace.
Sustainability 12 06086 g014
Figure 15. Multiple correspondence analysis (MCA) dimension discrimination measure.
Sustainability 12 06086 g015
Figure 16. Joint category plot of the explored variable categories.
Sustainability 12 06086 g016
Figure 17. The relationship between work flexibility index and salary and job satisfaction level.
Sustainability 12 06086 g017
Table 2. The level of correlation between job satisfaction and salary satisfaction.
How Satisfied Are You with Your Current Job?How Satisfied Are You with the Salary You Receive?
Kendall’s tau_bHow Satisfied Are You with Your Current Job?Correlation Coefficient1.0000.601 **
Sig. (2-tailed) 0.000
Spearman’s rhoHow Satisfied Are You with the Salary You Receive?Correlation Coefficient1.0000.662 **
Sig. (2-tailed) 0.000
**. Correlation is significant at the 0.01 level (two-tailed). Sig. = Significance.
Table 3. The empirical results of the main differences regarding work flexibility characteristics.
Gender
Sig. (Mann–Whitney Test)
Regions
Sig. (Kruskal–Wallis Test)
Age
Sig. (Kruskal–Wallis Test)
Main Occupation
Sig. (Kruskal–Wallis Test)
Length of Service
Sig. (Kruskal–Wallis Test)
Experiment in Management Positions
Sig. (Kruskal–Wallis Test)
Salary
Sig. (Kruskal–Wallis Test)
Company Size
Sig. (Kruskal–Wallis Test)
Company Legal Status
Sig. (Kruskal–Wallis Test)
Sector of Activity
Sig. (Kruskal–Wallis Test)
Contractual flexibility
(type of contracts).
0.1720.5810.000 *0.6430.018 **0.3810.7130.8840.6210.423
Main forms of work flexibility present at the job
Rotation of stations.0.4170.081 ***0.2280.2720.8840.4330.6550.2890.9590.572
Teamwork.0.1940.2350.5810.084 ***0.8620.2370.098 ***0.3000.5810.318
Computer usage.0.8550.084 ***0.073 ***0.038 **0.7950.3610.1400.3420.5420.862
Teleworking (remote work, at home or at a nearby office).0.050 **0.000 *0.038 **0.072 ***0.3850.001 *0.022 **0.081 ***0.009 *0.523
Improving of work organization of work.0.8620.2410.033 **0.9311.0000.6200.5590.6160.5280.714
Updating job post according to new tasks.0.2850.1770.5230.9920.3110.020 **0.074 ***0.098 ***0.3710.727
Main elements regarding the working time flexibility
Do you work 40 h per week at the main job?0.2430.2720.007 *0.8820.094 ***0.9100.5420.8130.8310.098 ***
Do you have more than one job?0.7230.3870.5710.035 **0.3110.4510.3320.4890.019 **0.674
Do you work the same number of hours every day?0.5230.055 **0.4190.2980.5530.4460.3750.6300.2600.122
Do you work the same number of days every week?0.3150.1650.9210.8100.4270.4330.4100.8420.2510.637
Start and finish the program at fixed hours?0.086 ***0.000 *0.011 *0.054 **0.003 *0.6450.1790.3760.5140.069 ***
Are you working in shifts?0.9460.016 **0.2190.000 *0.7910.1650.0030.0600.1940.003 *
Do you work flexible?0.1220.000 *0.3950.5360.5050.5220.3930.8700.2390.494
Have you been consulted about changes in work organization and your working conditions?0.061 ***0.000 *0.5210.050 **0.6980.4030.5500.090 ***0.2630.920
Is your work evaluated periodically?0.8180.000 *0.7150.082 ***0.3110.9270.3590.1870.7730.050 **
Do you think you are well informed about the health and safety risks of your workplace?0.2910.001 *0.1380.1220.1510.5450.5830.2030.5560.407
Main forms of functional flexibility
Attending training courses paid by the employer.0.8900.001 *0.040 **0.042 **0.1250.000 *0.036 **0.029 **0.6210.419
Attending paid training courses from your own sources.0.1520.046 **0.4690.000 *0.3920.030 **0.017 **0.3540.6590.187
Benefit from on-the-job training.0.1510.5420.018 **0.054 **0.6000.7860.2230.3720.8090.885
Level of satisfaction associated with the working conditions of current job.0.8950.051 **0.002 **0.1610.7860.5050.011 *0.4600.3640.337
Main measures that need to be taken to increase the flexibility of employing the workforce and the working time of employees
A flexible work schedule.0.3200.4830.2880.093 ***0.6080.3180.2690.7180.1280.764
The ability to work from home or from a space near home (teleworking).0.049 **0.1100.072 ***0.5730.3100.8750.6490.6740.043 **0.887
Independent working teams to manage their time together to identify a task
(work team autonomy).
0.1160.8370.2070.6320.2630.7710.2640.9180.7340.738
Flexible remuneration, depending on the effort and the allocated time.0.025 **0.6710.6080.074 ***0.4270.2490.4720.1840.3730.165
Ability to work outside of regular program hours.0.3040.8320.5510.8080.1850.6800.6600.9820.7720.593
Better management of the space to minimize travel during work.0.7900.2240.5220.4420.8750.1930.9880.3370.3770.695
Better management of fixed assets (technologies, equipment) to put as little effort into their use.0.1320.069 ***0.6370.6130.4980.8400.6090.7790.063 ***0.563
Extending holidays.0.090 ***0.1730.6610.078 ***0.2000.7970.1380.6540.5620.221
Reduction of work week.0.9090.2380.2270.6830.6840.4510.7750.6180.6280.683
New ways of working
Home working.0.032 **0.000 *0.011 *0.000 *0.4590.011 *0.016 **0.017 **0.058 ***0.049 **
Partial home working.0.050 **0.000 *0.005 *0.000 *0.6270.011 *0.015 **0.012 **0.1200.048 **
Co working.0.043 **0.000 *0.009 *0.000 *0.4930.011 *0.005 *0.018 **0.096 ***0.084 **
Flex office.0.079 ***0.000 *0.004 *0.000 *0.5410.011 *0.007 *0.016 **0.080 ***0.109
Note: *** Correlation is significant at the 0.10 level (two-tailed). ** Correlation is significant at the 0.05 level (two-tailed). * Correlation is significant at the 0.01 level (two-tailed).
Table 4. Inertia decomposition of flexibility variables.
DimensionPrincipal InertiaPercentCumulating Percent
Dim. 10.038462.462.4
Dim. 20.009014.5476.94
Dim. 30.00162.5779.51
Dim. 40.00010.1579.66
Dim. 50.00000.0779.73
Total0.0616100
Table 5. The relative contribution of the variables to the first dimension.
VariablesRelative Contribution (%) to the First Dimension
You are employee on the basis of an indefinite employment contract with full working time.0.39
You are employee on the basis of an indefinite employment contract with part-time work.0.71
You are employee on the basis of a fixed-term employment contract with part-time work.0.08
Do you work 40 h a week at your main job?1.03
Do you have more than one job?6.25
Do you work the same number of hours every day?1.58
Do you start and end the program at fixed hours?6.41
Do you work in shifts?11.87
Do you work flexible hours?4.31
Have you participated in training courses paid for by your employer?11.35
Have you participated in paid courses from your own sources?11.54
Do you practice home working?11.03
Do you practice partial home working?11.11
Do you practice co-working?11.39
Do you practice flex-office?10.97
100.00
Table 6. Descriptive statistics of composite index of work flexibility.
FrequencyPercentValid PercentCumulative Percent
Valid≤35.008538.638.638.6
35.01–70.006931.431.470.0
70.01+6630.030.0100.0
Total220100.0100.0
Table 7. The empirical results of the relationship between work flexibility and job satisfaction.
Model IModel II
VariablesBSig.Exp (B)BSig.Exp (B)
Degree of satisfaction regarding salary (ref = otherwise)
satisfied
4.6450.000 ***104.0773.6990.000 ***40.427
Work flexibility composite indicator 0.0260.020 **1.026
Control variables
Gender (ref = male)
female
1.1310.100 *3.0990.3210.5581.378
Occupation (ref = higher education specialist) 0.108 0.030
general manager, director or a person holding a senior management position−3.1460.086 *0.043−1.1140.5010.328
person holding a middle management position (head of department, head of office)−0.5760.7520.5621.3820.5993.985
technician−2.8310.035 **0.059−3.6480.004 ***0.026
employed in public services (hospital, public catering, police, firefighters)−0.5180.6240.5960.6690.4911.951
qualified worker−2.5300.008 ***0.080−1.1200.1380.326
unqualified worker−2.8700.019 **0.057−2.8030.009 ***0.061
Age (ref = under 26) 0.879 0.559
26–35 years−0.5760.7000.562−2.1950.1370.111
36–45 years−0.9390.5470.391−2.4410.1110.087
46–55 years−1.0920.4780.335−2.5080.095 *0.081
Over 55 years−1.8460.4030.158−1.9590.2720.141
Seniority (ref = less than 1 year) 0.109 0.185
1–3 years−0.4690.6830.6250.4600.6611.585
3–5 years−0.9460.4460.3880.1310.9121.140
5–10 years−0.8410.4680.4310.2420.8241.274
Over 10 years1.2810.2813.6011.6900.1115.419
Company size (ref = 1–9 employees) 0.048 0.118
10–49 employees1.5200.070 *4.5740.6600.3571.934
50–249 employees−0.8850.3290.413−0.9220.2500.398
Over 250 employees0.7100.4052.0330.5450.5011.724
Company activity sector (ref = agriculture) 0.088 0.124
Manufacturing industry−0.9040.6250.405−0.0320.9850.969
Wholesale−2.8460.2020.058−2.3830.2330.092
Retail−3.0060.1270.049−1.6390.3150.194
Services−3.4460.065 *0.032−2.3470.1400.096
construction−0.2580.8940.772−0.1630.9210.849
Another sector−1.0380.6070.354−1.0000.5860.368
Company legal regime (ref = limited liability company)
Stock company
0 0.357
General Partnership −0.2970.7650.743
Limited Partnership −18.6491.0000.000
Autonomous company 2.7590.19915.781
National company −2.0430.058 *0.130
Public Institution −0.8260.4800.438
Constant0.2450.9321.2772.3510.30210.492
Contractual flexibility
Type of contract (ref = based on employment contract of indefinite duration with full working time) 1.000
based on an indefinite employment contract with part-time work−0.0660.9820.936
based on a fixed-term employment contract with full working time20.2150.999601,744,208.607
based on a fixed-term employment contract with part-time work20.9111.0001,207,026,856.9
Working time flexibility
Do you work 40 h a week at your main job
?(Ref = no)
Yes
−1.0780.2790.340
Do you have more than one job? (Ref = no)
Yes
23.3230.99813,465,568,754.7
Do you work the same number of hours every day? (Ref = no)
Yes
1.5810.061 *4.861
Do you work the same number of days each week? (Ref = no)
Yes
−1.5570.083 *0.211
Do you start and end the program at fixed hours? (Ref = no)
Yes
−0.8740.2850.417
Do you work in shifts? (Ref = no)
Yes
0.4170.5321.518
Do you work flexible hours (ref = no)
Yes
0.6270.3371.872
Functional flexibility
Did you participate on training courses paid for by the employer? (Ref = no)
Yes
1.6020.024 **4.962
Did you participate on paid courses from your own sources? (Ref = no)
Yes
−0.8840.4170.413
Have you received training at work? (Ref = no)
Yes
−0.1800.8070.836
Workspace flexibility
Have you practiced home working? (Ref = no)
Yes
6.1510.014 **469.008
Did you practice home working partially? (Ref = no)
Yes
3.0310.100 *0.048
Did you practice co-working? (Ref = no)
Yes
2.1050.101 *8.203
Did you practice flex-office? (Ref = no)
Yes
−0.2190.8570.804
Note: *** Correlation is significant at the 0.10 level (two-tailed). ** Correlation is significant at the 0.05 level (two-tailed). * Correlation is significant at the 0.01 level (two-tailed).
Table 8. Classification table a. Degree of satisfaction with the current job.
ObservedPredicted
Job_SatisfPercentage Correct
ElseSatisfied t
Model Ijob_satisfElse551282.1
Satisfied1214092.1
Overall Percentage 89.0
Model IIjob_satisfElse491675.4
Satisfied1313591.2
Overall Percentage 86.4
a The cut value is 0.500.

