Article

A Proposed Index of the Implementation and Maturity of Circular Economy Practices—The Case of the Pulp and Paper Industries of Portugal and Spain

by
Inês de Abreu Ferreira
1,
Manuel de Castro Fraga
1,
Radu Godina
2,
Marta Souto Barreiros
3 and
Helena Carvalho
2,*
1
Department of Mechanical and Industrial Engineering, Faculty of Science and Technology (FCT), Universidade NOVA de Lisboa, 2829-516 Caparica, Portugal
2
Research and Development Unit in Mechanical and Industrial Engineering (UNIDEMI), Department of Mechanical and Industrial Engineering, Faculty of Science and Technology (FCT), Universidade NOVA de Lisboa, 2829-516 Caparica, Portugal
3
CELPA—Portuguese Pulp and Paper Association, Rua Marquês de Sá da Bandeira, 74-2º, 1069-076 Lisboa, Portugal
*
Author to whom correspondence should be addressed.
Sustainability 2019, 11(6), 1722; https://doi.org/10.3390/su11061722
Submission received: 7 February 2019 / Revised: 11 March 2019 / Accepted: 18 March 2019 / Published: 21 March 2019

Abstract

:
High industrial development, new consumption habits, and population growth have led to a discussion, in the various sectors of society, about resource scarcity, pollutant emissions, and waste generation. As a result, and in opposition to the linear economic model in which products are eliminated after production and consumption, a new business model emerged, called the “The Circular Economy”. This model is based on reuse, recovery, recycling, and repairing during the design and use cycle of a product. This research intends to make a study of the circular economy in the pulp and paper industries of Portugal and Spain. This sector was chosen because, in addition to representing about 2.5% of Portugal’s industrial production, it has made significant efforts to promote environmentally sustainable development. Therefore, this research intends to present the situation of the pulp and paper sector within the circular economy, making an Iberian comparison between the years 2011 and 2015. This comparison is made through the development of a comparative index based on the results of some environmental indicators. According to the research carried out, the pulp and paper sector in Portugal was about 26% higher in the implementation of the circular economy than the same sector in Spain in 2015, with the peculiarity that this difference has been decreasing in the last five years.

1. Introduction

High industrial development, new consumption habits associated with population growth, and the consequent growth of the industrial sector have led to a discussion [1] in several segments of society. This discussion addresses topics concerning resource scarcity, an increase in greenhouse gas emissions, and waste generation. Despite the efforts to promote recycling and the measures aimed at reducing the need for resource extraction, consumer goods continue to follow a linear logic: They are not reused and are often disposed in landfills after usage. These factors have led to increased resource consumption, greenhouse gas emissions, liquid effluent rejection, and overuse of space to end-of-life products. In this context, the concept of the “circular economy” emerged [2,3,4].
The circular economy is a model that aims to rethink the economic practices of today’s society [5]. Based on the principle of “closing the life cycle” of products, it aims to ensure resource efficiency and minimize the amount of unwanted emissions and waste [6]. It also promotes relationships between companies so that one can use the waste of another as a by-product in its production process [7].
In order to promote the circular economy, the European Union, in its communication Closing the loop—An EU action plan for the Circular Economy, has precise strategies and policies, both in the area of consumption and in residual management, highlighting the existing possibility of using waste as raw material in the same or in other production processes [8]. In the context of these policies, the consumption of raw materials and the production of waste have been gaining importance in the last decades, even being one of the priority areas of the European Union [9]. Portugal, within the European Union and its policies, has developed a plan—the National Waste Management Plan (NWMP)—implemented by the Portuguese Environmental Agency (APA). In this sense, since the main objective of the NWMP is environmentally sustainable development, it becomes important to characterize and study the circular economy implementation in the Portuguese industrial area, and compare it with similar industries in European countries. This is the focus of the present research. The Portuguese pulp and paper sector, which also comprises the cardboard industry, accounts for around 2.5% of the national industrial production, 4.6% of tradable goods exportation with high national added value, and 1.2% of employment in the Portuguese economy [10]. Therefore, this is the research field that this paper intends to focus on.
The main objective of this research is to develop a comparative index to support a cross-country analysis of the circular economy implementation in the pulp and paper industries of Portugal and Spain. To this end, the pulp and paper industries’ environmental and production variables will be used to evaluate the industries, considering several categories. Based on the conclusions drawn from the comparative index value, this paper aims to conclude about the implementation of the circular economy in both countries.
This article follows the following structure: The first introductory section, where the aim of the study is presented, contains relevant information about the topic under study. In Section 2, the state of the art about the circular economy concept, practices for its implementation, and indicators used in the evaluation of the circular economy concept are addressed. Next, in Section 3, the pulp and paper industries of Portugal and Spain are presented. Furthermore, the development of a comparative indicator, as well as the data collection, is presented in this section. The results related to the environmental indicators are presented in Section 4. In this section, the comparative analysis method is also used to compare the implementation of the circular economy in the sectors in two groups of Pulp and Paper companies. Simultaneously, an analysis is performed on the results obtained. Section 5 presents general conclusions about the research.

2. State of the Art

2.1. The History and the Concept of Circular Economy

Currently, the demand for products and services, and the need for resources to produce them, has increased to levels never verified before. This scenario contributes to the growth of waste production and environmental pollution [3]. This growth causes an increase in global temperature due to the emission of gases into the atmosphere [11]. This context is also conducive to economic uncertainties [12], and since the use of natural resources for production processes is always necessary, they remain limited [3].
The concept of circular economy—which has been defined and improved by different schools of thought—is not new and has already been developed in many countries over time. It has several origins and cannot be associated with a single date or author [13]. It began with practical applications for industrial processes that were developed in the late 1970s as a result of studies led by a large number of academics, thinkers, and entrepreneurs [6].
In 1982, Stahel, an architect and economist who founded the “cradle-to-cradle” (C2C) and founded the Product Life Institute in Geneva in 1970, wrote a scientific paper entitled “The product life factor”, which addresses the product life cycle and its extent—the “performance economy”—that is a crucial point in creating a sustainable society, based on resources that are finite on the planet. German chemist Michael Braungart, along with American architect Bill McDonough, continued to develop the concept and process of certification C2C, the precursor of the circular economy [6]. This concept is based on three fundamental principles: Elimination of the waste concept, use of renewable energies (mainly solar energy), and water use management that promotes healthy ecosystems and respects local impacts [6].
In contrast to the linear economy, which is a business model characterized by “extraction–use–deposition” [6], the circular economy has gained new importance [14]. The basis of the concept of circular economy is the creation of a green economy, which is in accordance with the principle of the “3 R’s”: Reduce, which supposes to reduce the number of substances, both in the extraction (as in the production) and the consumption; reuse; and recycle [15]. Although it includes the concept of the 3 R’s, the circular economy aims to create other conditions so that resources and energy flow in a circular way, maximizing the efficient use of natural resources and minimizing the deposition of waste in landfills. An example is eco-design, in which products are designed so that they can be reused, thus reducing the need to extract new natural resources at the beginning of the production process [1].

2.2. Practices for Implementation of Circular Economy—Applications in Industry

In economic systems, using the circular economy model would guarantee well-established competition [16], bringing benefits at the micro and macroeconomic levels, stimulating the growth of new business models and, consequently, job creation [6].
For the implementation of circular economy, efforts are required at three different levels: The micro (single entity), meso (association of entities), and macro (city, region, and country) levels [17,18]. It can also be applied in three main areas: Production, consumption, and waste management. It is worthwhile to say that it is very present in the area of industrial production.
The implementation of the circular economy in industrial production is inherently related to the concept of “industrial ecology”. In contrast to traditional industry, industrial ecology relies on the concepts of “eco-efficiency” in the industry and “industrial symbiosis”. Industrial symbiosis is a concept that promotes the business model in circles, based on “extraction–consumption–raw material” [19,20]. Industrial symbiosis creates closed-loop processes in which waste is seen as an input byproduct and not as an undesirable residue [20].
Industrial ecology seeks to “imitate” nature and focuses on one of the basic principles of circular economics, which is bio-mimetics. Bio-mimetics consists of the creation of cycles of materials and energy, with the principle of the use of renewable resources and energy [21]. In this way, the concepts of circular economy and “industrial ecology” are strongly related [19].

2.2.1. Eco-Efficiency

According to the World Business Council for Sustainable Development (WBCSD), eco-efficiency is “a management philosophy that encourages the business world to seek environmental improvements that enhance, in parallel, economic benefits. It focuses on business opportunities and enables companies to become more environmentally responsible and more profitable. It encourages innovation and, therefore, growth and competitiveness” [22].
Although it is not directly related to the fundamental concept of circular economy, eco-efficiency draws attention to multiple objectives of the circular economy, such as reducing resource consumption, reducing energy consumption, reducing emissions of polluting gases and effluents, and reducing waste production. Eco-efficiency is a great step towards the application of industrial ecology and, consequently, to circular economy [23].
There are several calculation methods for the quantification of eco-efficiency [24]. However, in this research, and since economic variables are the predominant form of environmental data exposure, eco-efficiency can be calculated according to a company’s sustainability reports, by the ratio of an environmental variable to an economic variable [25,26]. Therefore, Equation (1) is used to calculate the eco-efficiency indicators in this research.
Q u a n t i f i c a t i o n o f Eco-efficiency = E n v i r o n m e n t a l V a r i a b l e E c o n o m i c V a r i a b l e ( P r o d u c t i o n )

2.2.2. Industrial Symbiosis

With the emergence of industrial ecology, the study and promotion of industrial symbiosis have been developed [27]. The concept of industrial symbiosis is based on the relationships of biology. In this context, the term “symbiosis” refers to the exchange of materials and energy in a collectively beneficial way between two species. Within this line, the term “industrial symbiosis” aims at the exchange needs between industries, with the objective of achieving competitive and environmental advantages. Making this analogy, three types of transactions may occur in an industrial symbiosis relationship [28]:
  • Sharing of infrastructures;
  • Sharing common service needs;
  • By-product exchanges, where one industry uses the waste of another company as raw material.
Equation (2) was proposed to evaluate the implementation of industrial symbiosis (IIS) [29].
I S S = R I C 1 + O I Q
RIC—Rolling impact quantity (e.g., amount of waste exchanged in symbiosis);
OIQ—Output impact quantity (amount of impact that is not exchanged in symbiosis).
For the calculation of rolling impact quantity and output impact quantity an evaluation of four criteria is proposed, composed by legislation, class, use/treatment, and destination of the waste [29]. This evaluation is done following a scale (1, 3, or 5), and the evaluator is invited to assign a weight in each criterion (from 0 to 1), according to the importance given by it.

2.3. Sustainability Indicators in the Evaluation of the Circular Economy

To evaluate the successful implementation of industrial ecology, and consequently, of the circular economy, a system of indicators becomes necessary [30]. These provide guidelines for decision-making and allow us to evaluate the effectiveness of the policies implemented in an entity [18,31,32]. There are already many metrics to study how the circular economy is being implemented and developed. Iacovidou et al. [31] propose four types of metrics: Environmental, economic, social, and technical metrics. Elia et al. [30] consider four categories: Material flow, energy flow, land use and consumption, and other life cycle-based parameters.
Su et al. (2013) [32] disclose two evaluation indicator systems for the circular economy offered by Chinese governmental agencies (Ministry of Environmental Protection and the National Development and Reform Commission). The following dimensions are considered: Resource output rate, resource consumption rate, integrated resource utilization, reduction rate in waste discharge, material reducing and recycling, economic development, pollution control, and administration and management. These dimensions include indicators related to the eco-efficiency assessment, and reuse and industrial symbiosis indicators:
  • Eco-efficiency indicators: These indicators are production-based and are measured by the ratio of an input or output to the production of a given industry. Examples include: “Energy consumption per unit of production in the key industrial sector” and “Water consumption per unit of production value”.
  • Reuse and industrial symbiosis indicators: The reuse indicators are relevant because the better the performance, the less the extraction and use of new fresh inputs. Examples include: “Reuse ratio of industrial water” and “Recycling rate of industrial waste water”.
Since this research is focused on the pulp and paper sector, in this paper we chose the environmental metrics to understand the environmental benefits and impacts of adopting the circular economy model. The environmental variable can be composed by inputs, which are the resources used in the production process, or by outputs, which are the “harmful consequences” that the same process causes in the environment. Environmental metrics can be analyzed by different perspectives. One of the most widely known and used metrics in environmental assessment is related to greenhouse gas emissions (CO2, CH4, N2O, etc.). In addition, for assessing the environmental impact of various pollutants, there is a combined single metric called “pollutant emissions metric”. The resource depletion metric includes the consumption of resources, such as primary energy consumption, specific energy consumption, and renewable energy generation, among others. However, the depletion of resources other than energy-based ones is also very important to analyze, such as: Water consumption or water lost through waste treatment, or disposal or specific material consumption. Non-energy raw materials are essential inputs to all industries. The amount of raw materials used to produce a product is of growing importance due to pressures related to their future availability [31].

3. Materials and Methods

3.1. The Pulp and Paper Industry in Portugal

The group of entities related to the production of pulp for paper and different types of paper is called the “paper industry” or “pulp and paper” sector. This activity extends to almost the entire life cycle of paper products, from the production of raw materials (forest production) to the treatment of end-of-life products, through the recycling or energy recovery of waste.
CELPA—Associação da Indústria Papeleira—represents the largest private owners and managers of the Portuguese forest, and the producers of 100% of the national production of virgin fiber pulp and 90% of the national production of paper and paperboard (CELPA, 2015). In national terms, CELPA members export to more than 140 countries, representing 4.6% of the total Portuguese exports of goods.
In addition to the theme of waste being fundamental to the application of the concept of circular economy, it is a cross-cutting theme that affects all industrial sectors, and the paper industry is no exception. Increasingly, there is an attempt to adopt a sustainable and balanced waste management, opting for the principles of waste minimization, creating good conditions for their selective collection, and always favoring the techniques of valorization to avoid landfill and other disposal methods, in order to protect the various natural resources. The successive improvement in the environmental performance of the paper sector is due to an intense investment program, started more than 20 years ago as a result of the environmental protection policy of this sector.
The production of solid waste, resulting from the industrial processes, is directly related to the production pattern of pulp and paper. Furthermore, other types of waste are produced, such as those resulting from the demolition and construction of buildings which, due to their occasional nature, have significant annual variations. These residues can be processual and non-processual. Processual waste results directly from the production of pulp and paper, and is considered specific to this activity. It is important to note that all the process waste that is produced in the paper industry is considered to be non-hazardous.
Waste is treated in different ways and can be disposed of or valorized. However, for waste to be valorized by other industries, it is necessary to classify these substances as a by-product. “By-product” means substances or objects that result from a production process in which the main objective is not its production (production residue). Those substances or objects can be directly used, without being processed (other than the normal industrial practice), in other applications and industries [33].
The associated companies of CELPA have worked, at technical and scientific levels, in the identification and development of solutions to promote the classification of processual residues as by-products for their use as raw materials in other production processes. The use of residues as by-products from the pulp and paper industry is the subject of rigorous studies and laboratory tests to demonstrate that they can be used in other products/markets.
To develop the present research, data was collected from primary sources through unstructured interviews with members of CELPA, with the purpose of knowing the characteristics of the pulp and paper industry. Additionally, interviews were done with two experts from CELPA in order to select the indicators and validate the results. Secondary data was collected from the statistical bulletin of ASPAPEL—Asociacón Española de fabricantes de pasta, papel y carton [34] —for the calculation of the indicators that characterize the circular economy in Spain. These data can be accessed through its website. For Portugal, the data used was taken and made available by CELPA and its statistical bulletin. The data available is relevant to the period between 2011 and 2015 and, as such, the calculation of indicators is relative to this period.

3.2. Comparative Indicator Developement

To develop a comparative index to assess the circular economy implementation in the pulp and paper industry, the following steps were made:
  • Step 1—Selection of eco-efficiency, and reuse and industrial symbiosis indicators. To assure that the indicators selected were related with the pulp and paper industry, the dimensions and environmental indicators proposed by Su et al. [32] were analyzed and discussed with experts from CELPA. Then, the availability or not of data for a particular indicator was considered to select the final set of indicators.
  • Step 2—Computing the indicator values. Secondary data was used to compute the indicators. As the indicators had different units, subsequently, it became necessary to normalize them, that is, to size all categories of indicators so that their values were between 0 and 1. Standardization was achieved by grouping the results of the same category indicators’, and each result was divided by the highest value of the indicator of the same category. The normalized indicator of value 1 represent the worst result, and value 0 represent the best value.
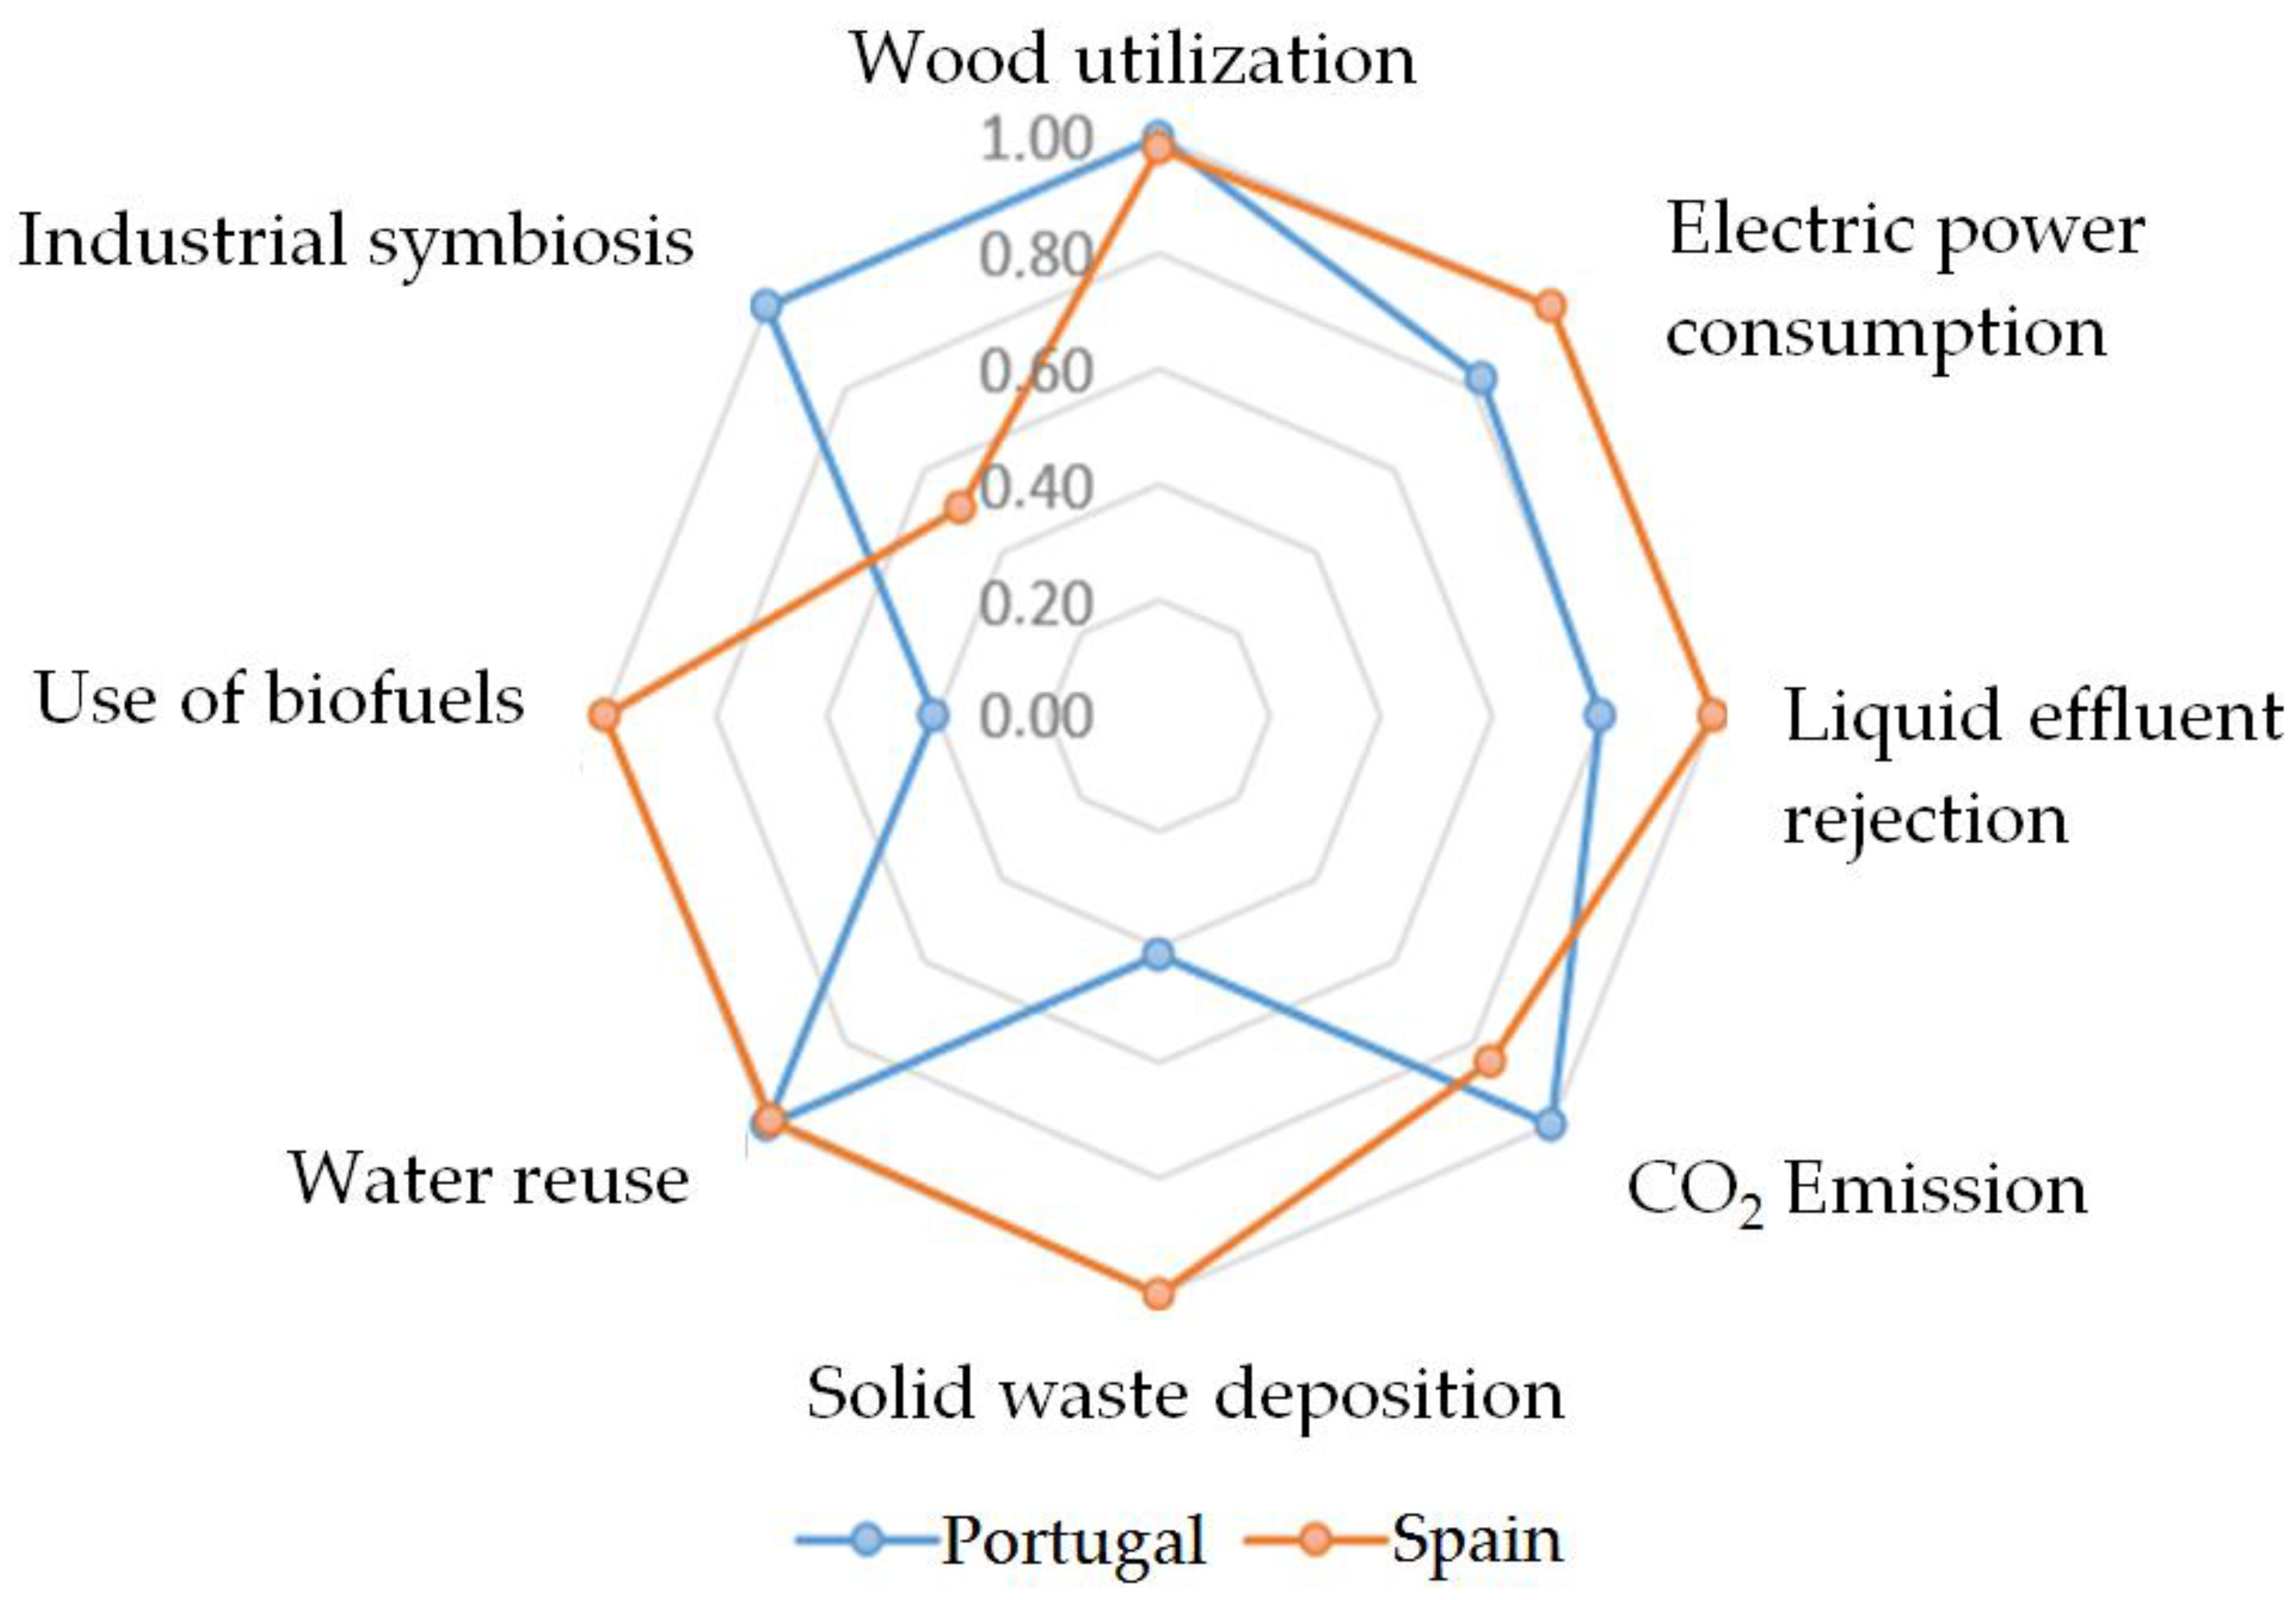
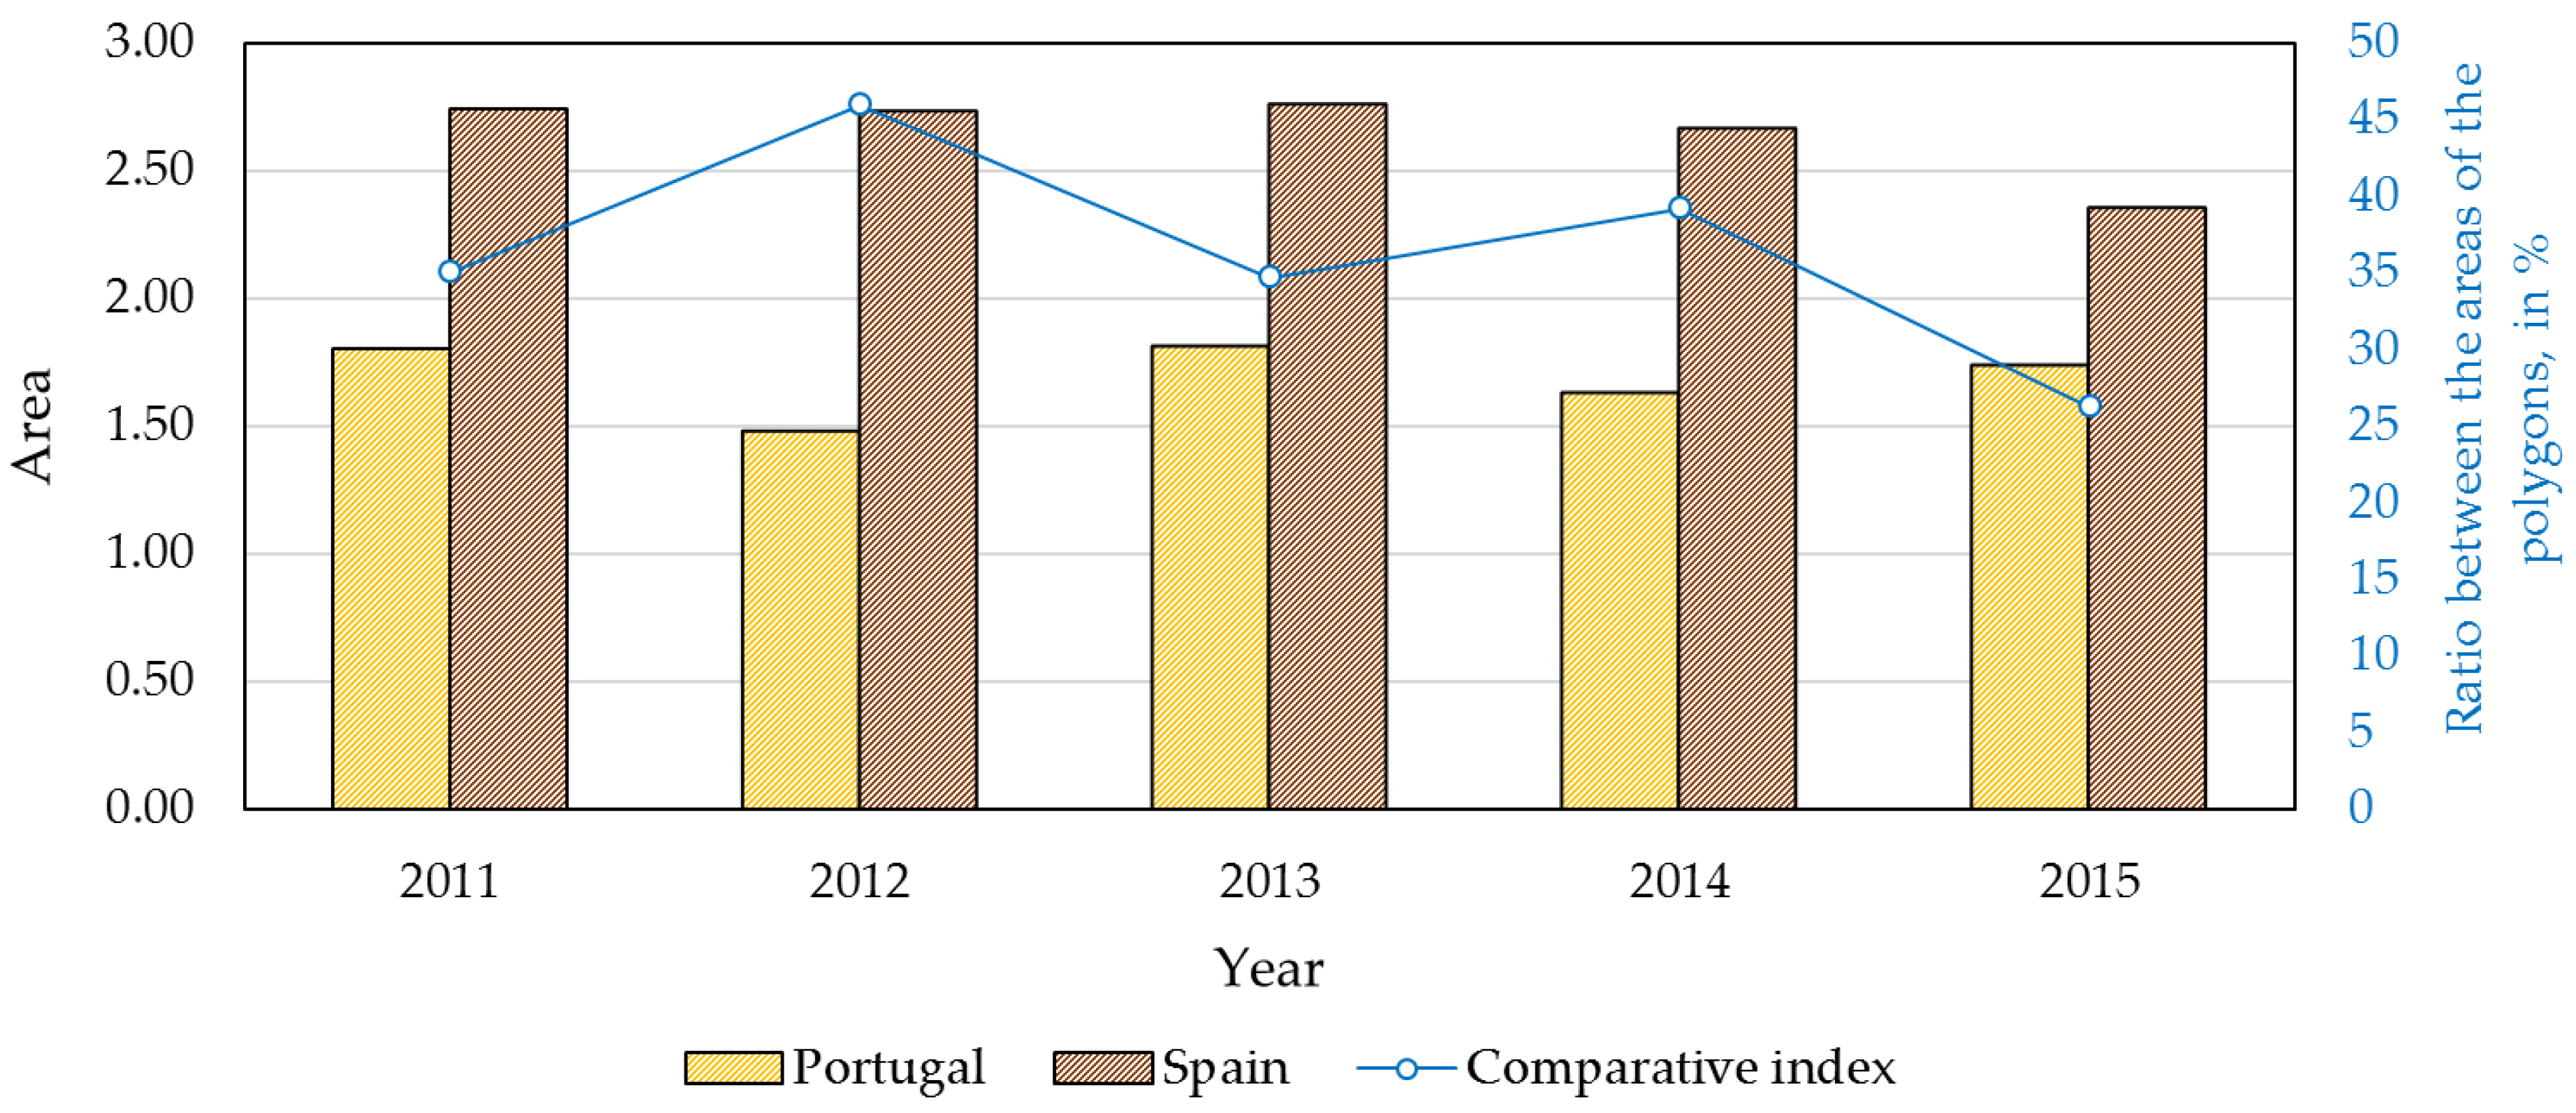
  • Step 3—Computing the comparative index. The comparative index is a function of all the indicators selected in step 1. To combine the different indicator’s values, they were combined in a radar chart graph (or spider diagram). Then, the comparative index is a function of the polygon area generated in the graph formed by the different categories of indicators that compose it.
This method allowed us to overcome difficulties in analyzing different indicators—calculated by the ratio between environmental and economic variables (e.g., produced tones and financial results)—that when presented in isolation are not sufficient to make a rapid and intuitive comparison about the environmental performance between sectors. The radar chart consists of a polygon whose vertices are the different categories of indicators that compose it. The radar chart has equidistant axes in the same center, so that they all have the same angle. The adjacent axes of the graph along with the line formed by the distance of two points form triangles of at least one known angle. The advantages of using the radar chart as a performance comparison tool are visual explanations about the level of performance achieved, supporting a quick comparison of attributes [35,36].
The radar chart is already being used to compare the relative performance of companies considering a set of sustainability indicators [37]. The use of a radar chart (or spider diagram) allows us to compare the Portuguese and Spanish pulp and paper industries because the polygon area gives a proxy of the level of implementation of the circular economy within the industry in each country. Finally, a comparative index is computed, consisting of the ratio of the areas of the graphs, which represent the set of industries to be compared.
For the generation of the comparative index (IC), the procedure used is the calculation of the area of the polygon [38]. For this, it is necessary to calculate the area of all triangles formed in the radar chart and proceed with their sum. After calculating the area of each triangle, and after adding the areas of all triangles that form the polygon, it is possible to calculate the composite index of the circular economy implementation. This index is intended to compare, quantitatively, the performance of two groups within the same category of indicators. In this case, the larger the area of the polygon in comparison to another, the less the implementation of the circular economy of one sector in relation to another. This quantification, as presented in Equation (3), is given as a percentage.
I C = ( 1 A T A T 1 ) × 100
A T —represents the total area that is occupied by the polygon;
A T 1 —represents the total area that is occupied by the largest polygon (worst result).
The comparative index values are on a scale of 0% to 100%, where 0% means that the two groups have the same overall performance (that is, both groups have the same polygon area), 50% means that the best performer group presents two-times better circular economy implementation than the one registered in the worst group, and 100% means that one of the groups presents the maximum performance possible for all the indicators (this is, a value of 0 for the polygon area).

3.3. Data Collection

The inputs (“resource utilization”) and outputs (“pollution impact”) typical of the pulp and paper industry which will be used to calculate the indicators are described in Table 1. Since these two categories intend to measure the resource efficiency and control the emissions of undesirable substances, the lower this indicator, the better the performance of the same. Table 2 lists the indicators that will be calculated, according to the resources that are typically reused in the paper industry: Water reuse and the use of biofuels. The industrial symbiosis indicator is calculated according to Equation (2), previously presented in Section 2.2.2, considering the total of the produced waste and the sum of by-products used for energy valorization in other industries.
The specific secondary data that were used to calculate the indicators are presented in Table 3.

4. Results

4.1. Results of Eco-Efficiency Indicators

In the pulp and paper industry, the eco-efficiency assessment involves the quantification of the following categories of indicators: Wood utilization, energy consumption, inefficiency of water usage, CO2 emissions, and solid waste depositions in landfill. Since these indicators show the resources’ efficiencies and control undesirable substances’ emissions, the lower the indicator, the better the performance of the indicator.

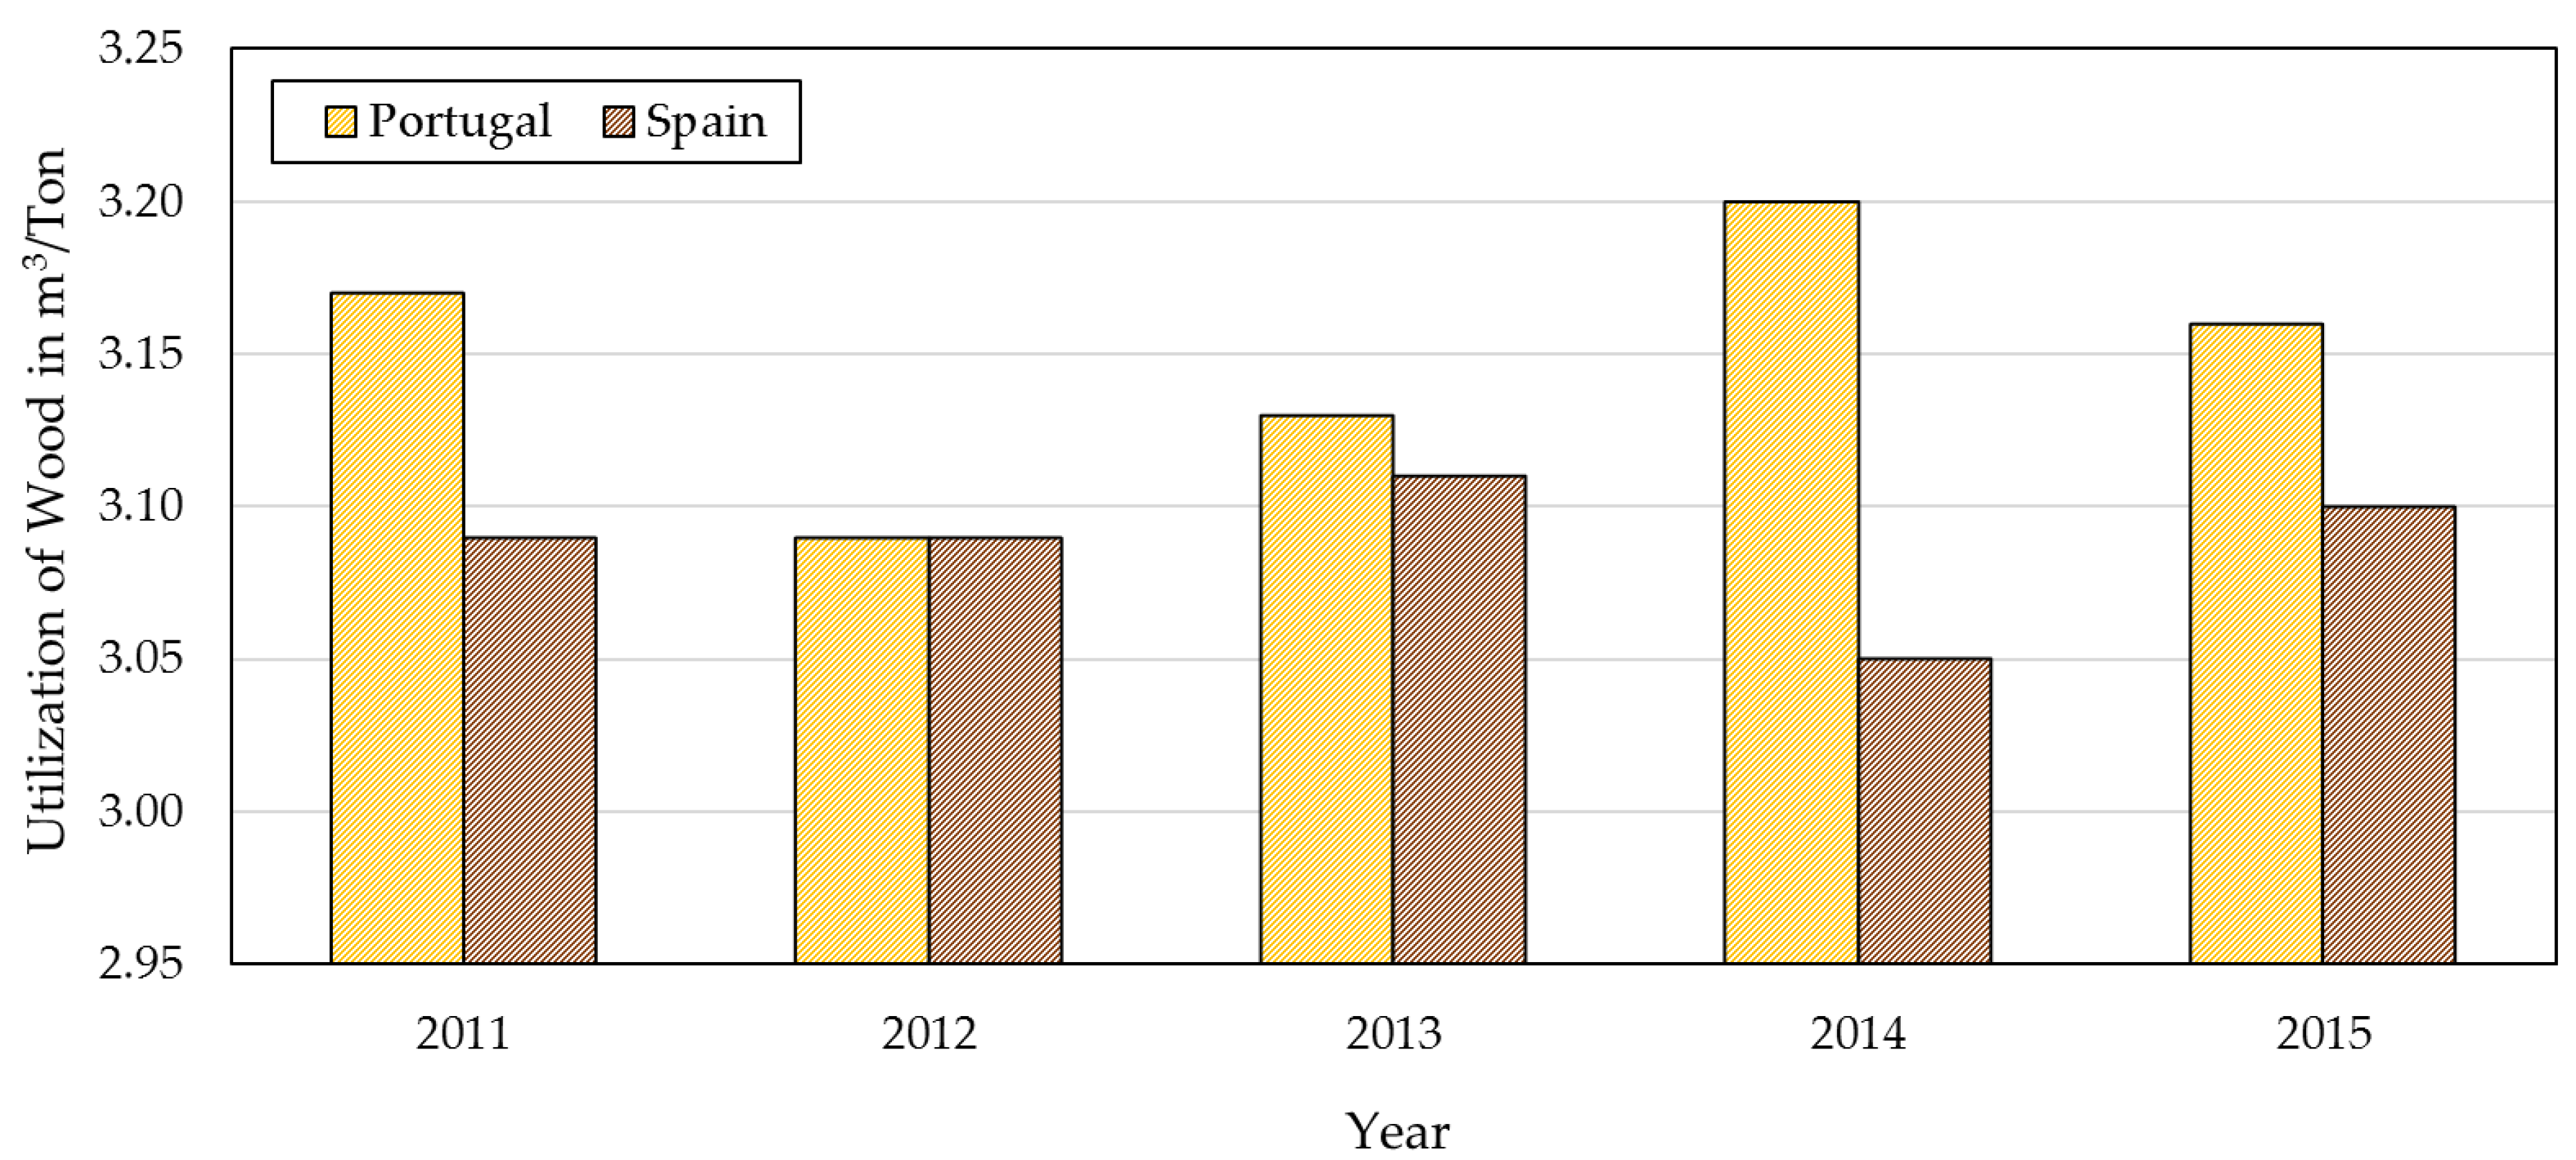
4.1.1. Wood Consumption Indicator

The wood consumption indicator indicates the consumed wood per ton of produced pulp. The results for this indicator for the two groups of pulp and paper companies are shown in Figure 1. From Figure 1, through the calculation of the averages of the five years, it can be concluded that the specific consumption of wood is 2% higher in Portugal than in the same sector in Spain. From this value, it is concluded that there are no significant differences in the specific use of wood between the two countries.
Although we do not know the details of the different technologies used in the two groups of pulp and paper companies, there are conditions/procedures during the pulp manufacturing process that may affect the efficiency of the wood utilization. These procedures include the density of wood, species of wood used, moisture present in the wood, process losses, wood shattering, and/or wood yield in the baking and bleaching process. Through the period that was studied, the variations in the wood utilization for the two groups of pulp and paper companies may have been due to the need to use imported wood (outside the Iberian Peninsula).

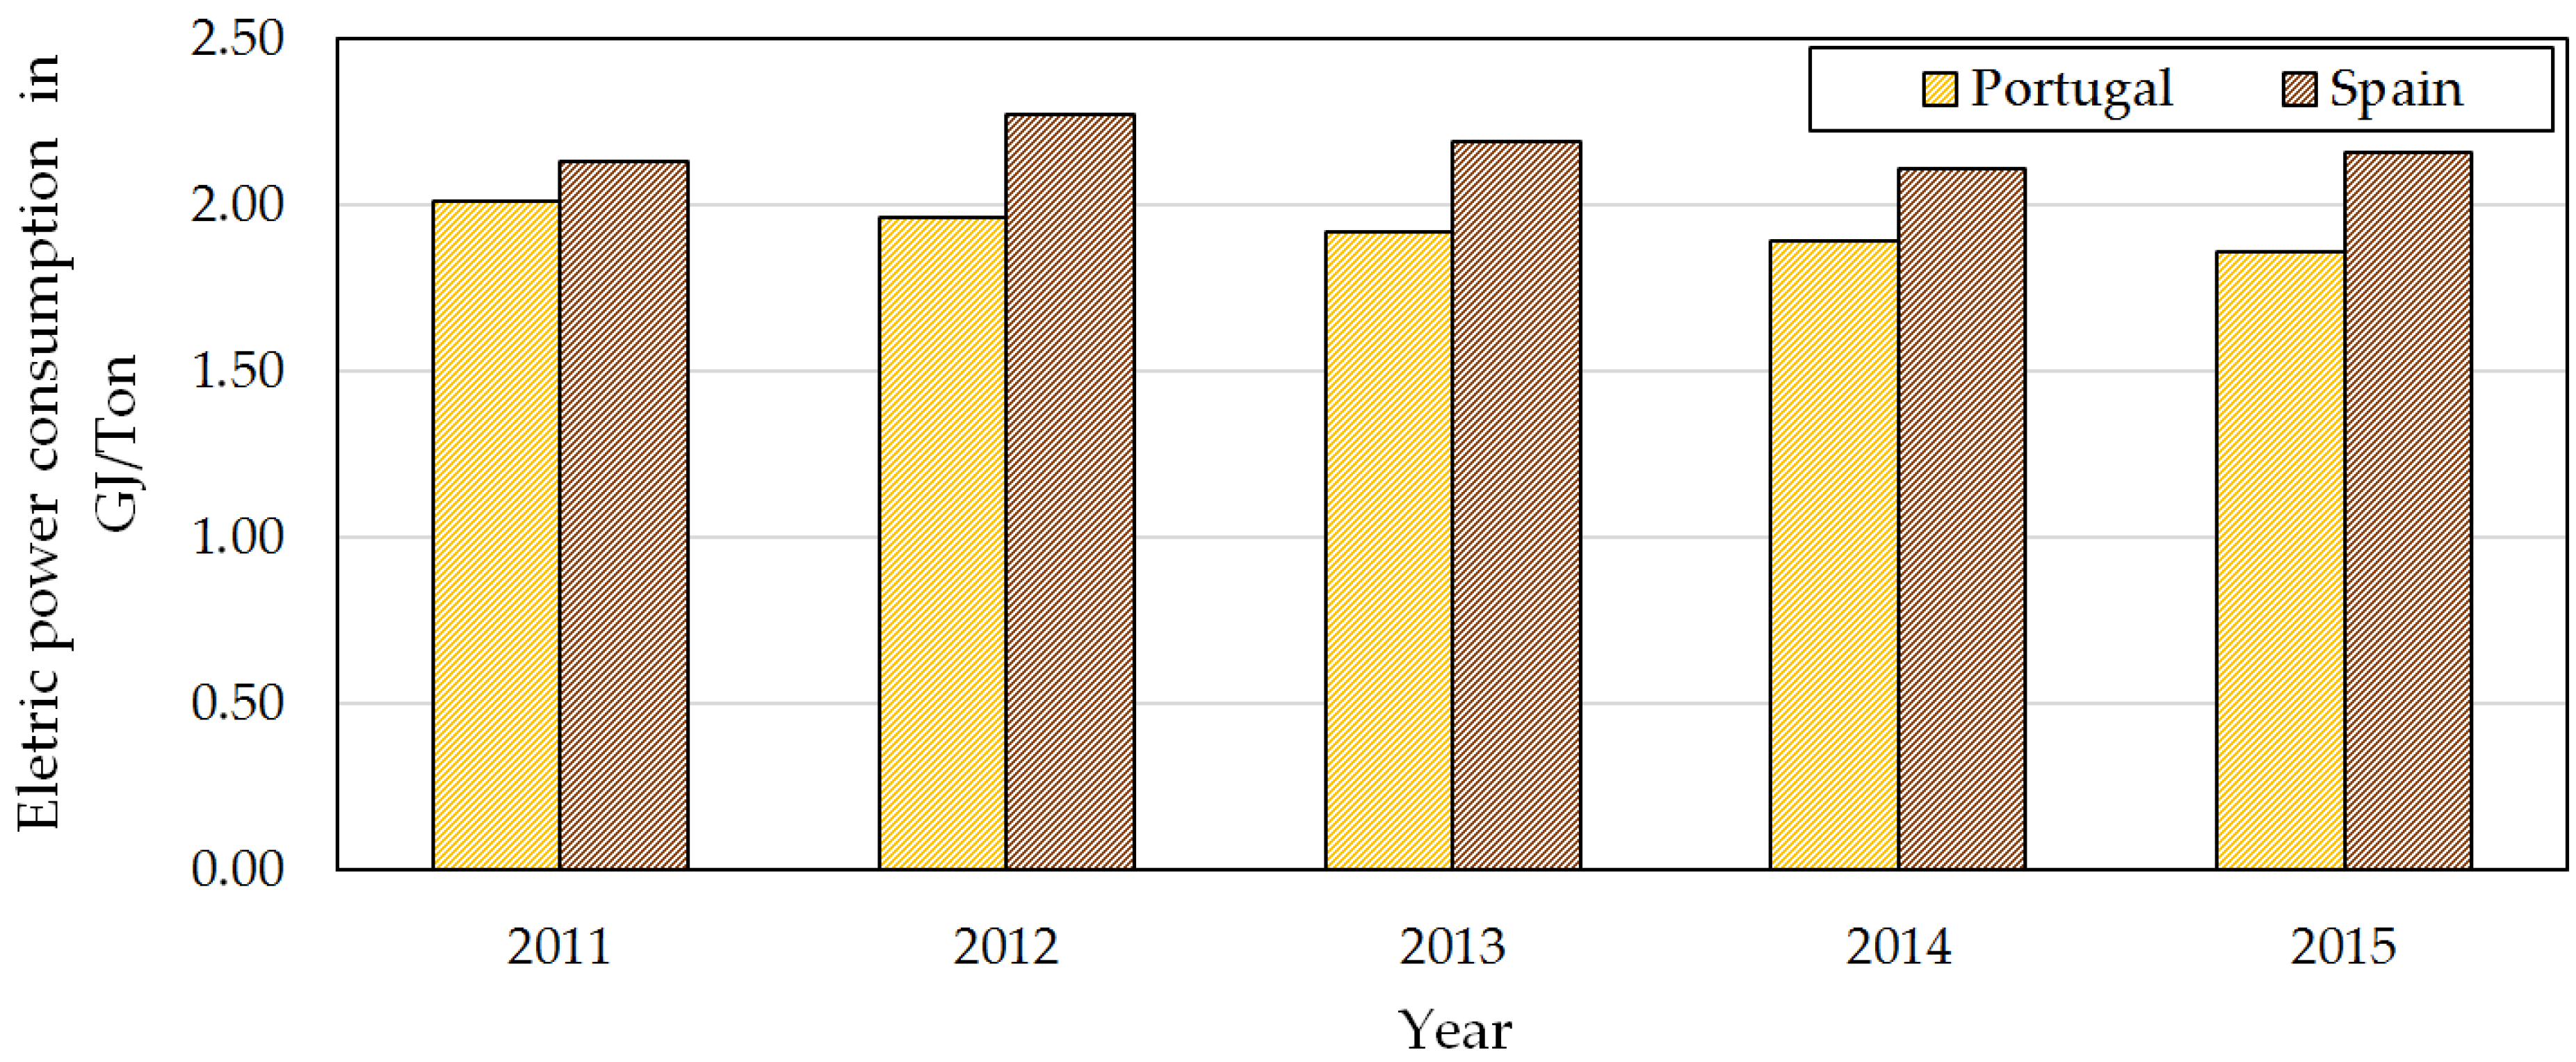
4.1.2. Energy Consumption Indicator

The energy consumption indicator gives information about the electric energy consumed per ton of pulp and paper. The values of this indicator for the two groups of pulp and paper companies are shown in Figure 2.
From the values shown in Figure 2, it is possible to verify that there is a downward tendency of about 7.5% in the specific consumption of energy in the sector in Portugal, and constant consumption of energy in the sector in Spain. After calculating the average of the years under study, it is also possible to verify that the indicator of energy consumption of the sector in Spain is higher than the one registered in Portugal by about 11.3%.
Although there are no details about the techniques used in the two groups of pulp and paper companies, there are procedures during the pulp and paper manufacturing process that may affect its energy efficiency. For example [12]: Energy efficiency levels of the pulp and paper production equipment/machines, paper and cardboard manufacturing process, level of use of systems driven by electric motors, efficiency in the production of heat and cooling, and/or level of efficiency in the industrial process.

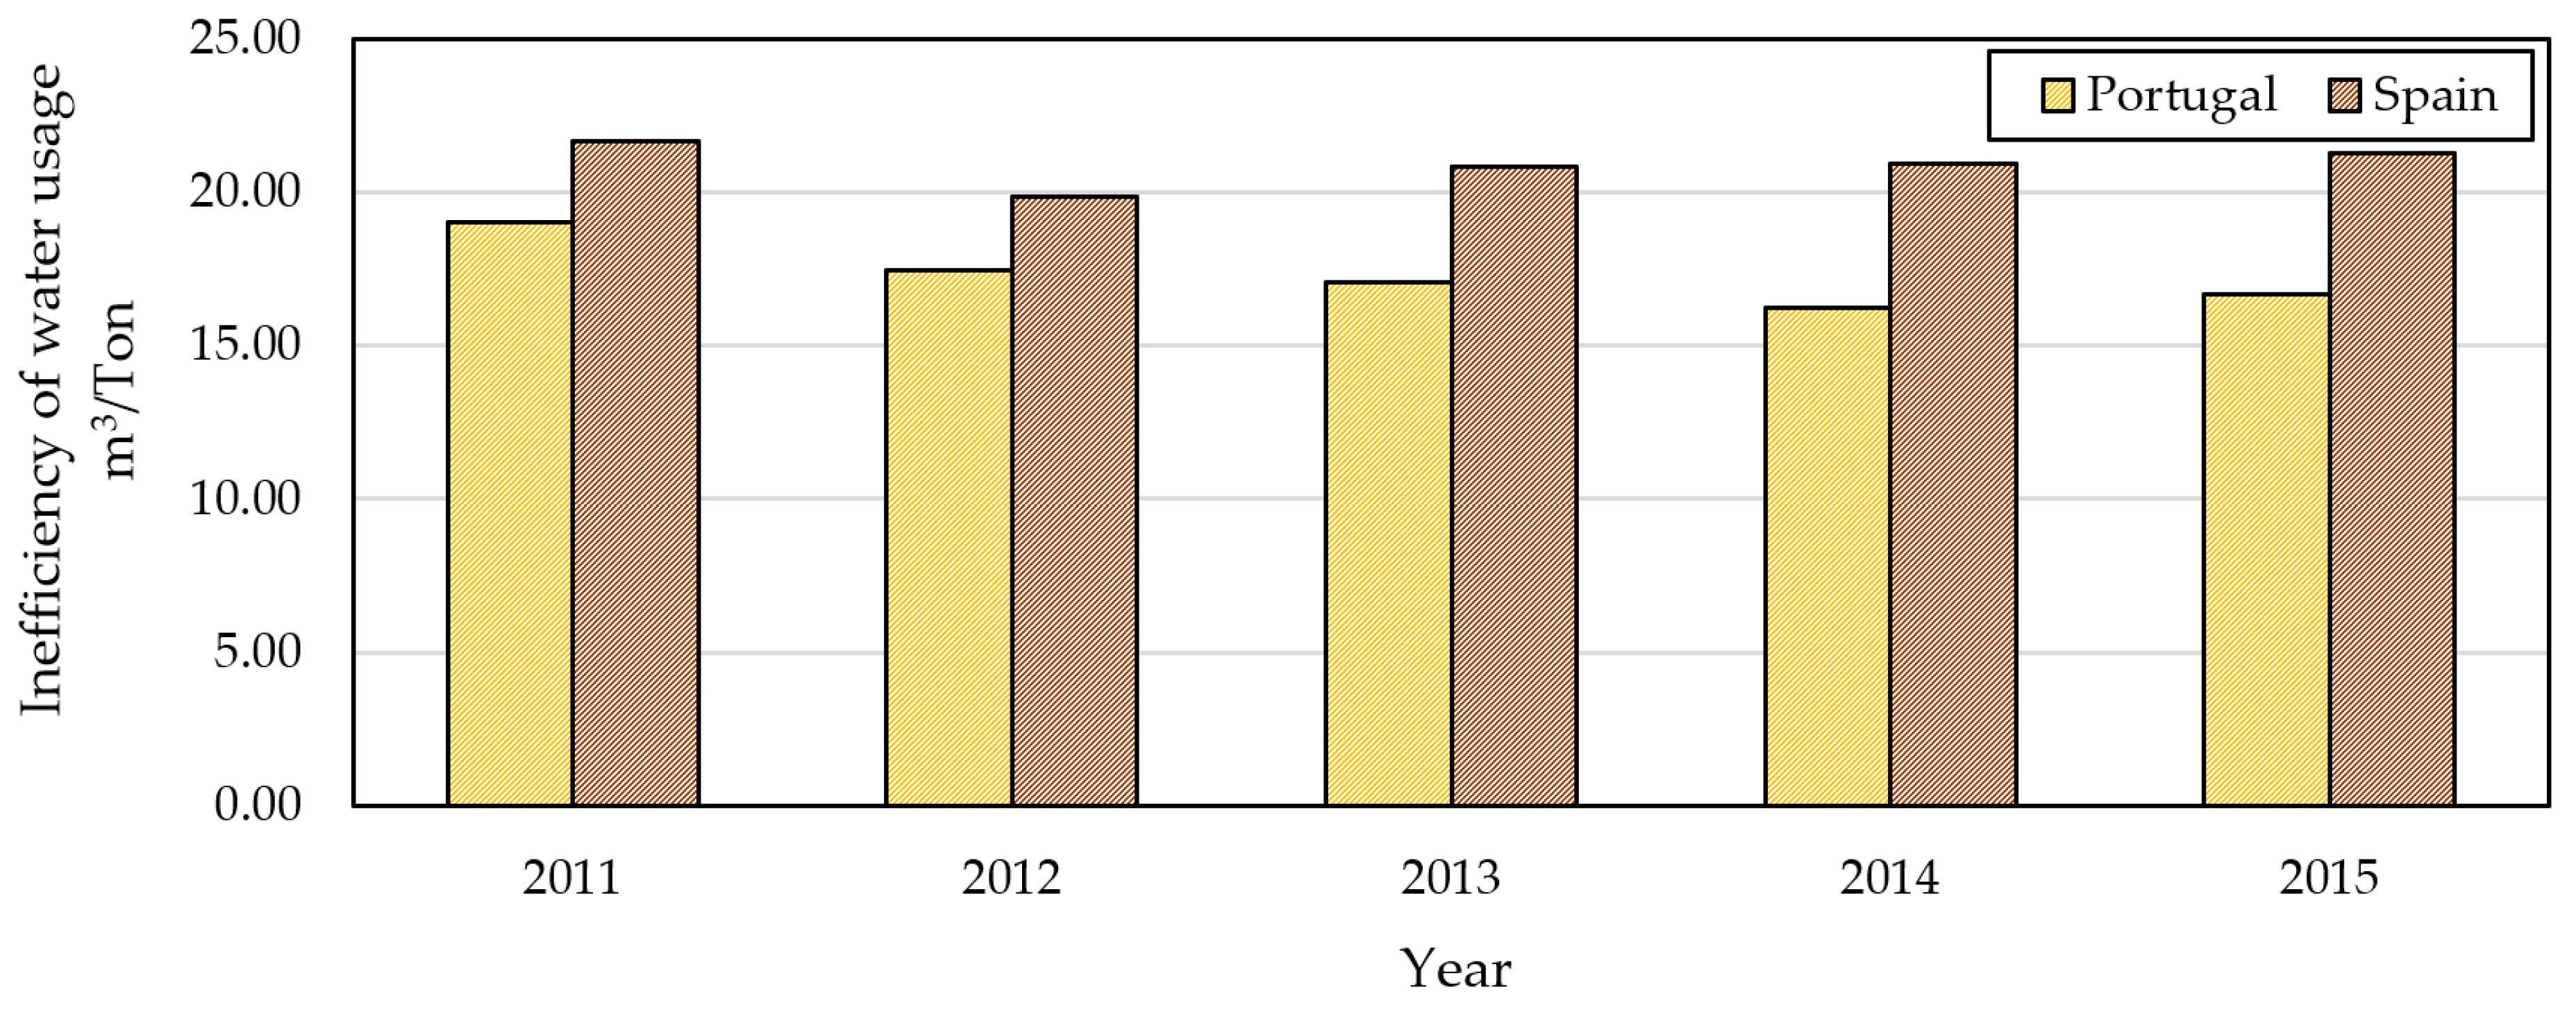
4.1.3. Inefficiency of Water Usage Indicator

The inefficiency of water usage indicator reports the amount of liquid effluents that are discarded per ton of pulp and paper. To calculate this indicator, the ratio between liquid effluent rejection and total production of pulp and paper is calculated.
Since this study aims to make a comparison between countries in the same sector, a calculation method based on the following assumptions was used to calculate the indicator for the liquid effluent rejection in the pulp and paper sector in Spain:
  • Due to its nature, pulp production uses more fresh water on a specific consumption basis than paper production. This leads to a greater liquid effluents flow than paper production;
  • The sector in Portugal produces more pulp in relation to the total production than the sector in Spain;
  • The comparison should be fair, so based on the two previous assumptions, data indicating the consumption of pulp and paper should be used in a discriminatory manner, if they are available;
  • It was not possible to find separate data for specific effluent flows from the pulp and paper sector in Portugal;
  • The sector in Spain has discriminated data for the pulp and paper production.
Following this logic, the liquid effluent rejection indicator for the period under study was calculated as follows in Equation (4):
  • The specific rejections of liquid effluents from the sector’s pulp and paper productions in Spain were multiplied by the respective pulp and paper productions in Portugal. In this way, it is possible to calculate the aggregate rejection of liquid effluents (considering that the sector in Spain had the same production levels as in Portugal).
  • The result was divided by the total production of the sector in Portugal.
    I E L S E = R E P u l p S E × P P u l p S P + R E P a p S E × P P a p e r S P P T o t a l S P
IELSE—Liquid effluent rejection indicator of the sector in Spain;
REPulpSE—Liquid effluent rejection in the sector in Spain, related to the pulp production per ton of produced pulp (m3/Ton);
PPulpSP—Pulp production in the sector in Portugal;
REPaperSE—Liquid effluent rejection in the sector in Spain, related to the paper production per ton of produced pulp (m3/Ton);
PPaperSP—Paper production in the sector in Portugal;
PTotalSP—Total production in the pulp and paper sector in Portugal.
In this way, it is possible to compare the pulp and paper sectors in the two groups of pulp and paper companies at an aggregate level in a more equitable way. The results of the indicator in Portugal and Spain for the different years are presented in Figure 3.
Based on the calculations, from the data shown in Figure 3, it can be concluded that with the specific individual consumption data per specific type of product, in the sector in Spain, if this same sector produced the same amounts of those different products, it would be about 17% less efficient in the water usage in their process than the sector in Portugal.
Although there is no information about the techniques used in both countries, these discrepancies may be due to [12]: Efficiency in industrial operations, efficiency of pulp washing, type of pulp bleaching, type of wood cooking, separation level of water circuits, pulp washing techniques, and/or level of monitoring of water spills.

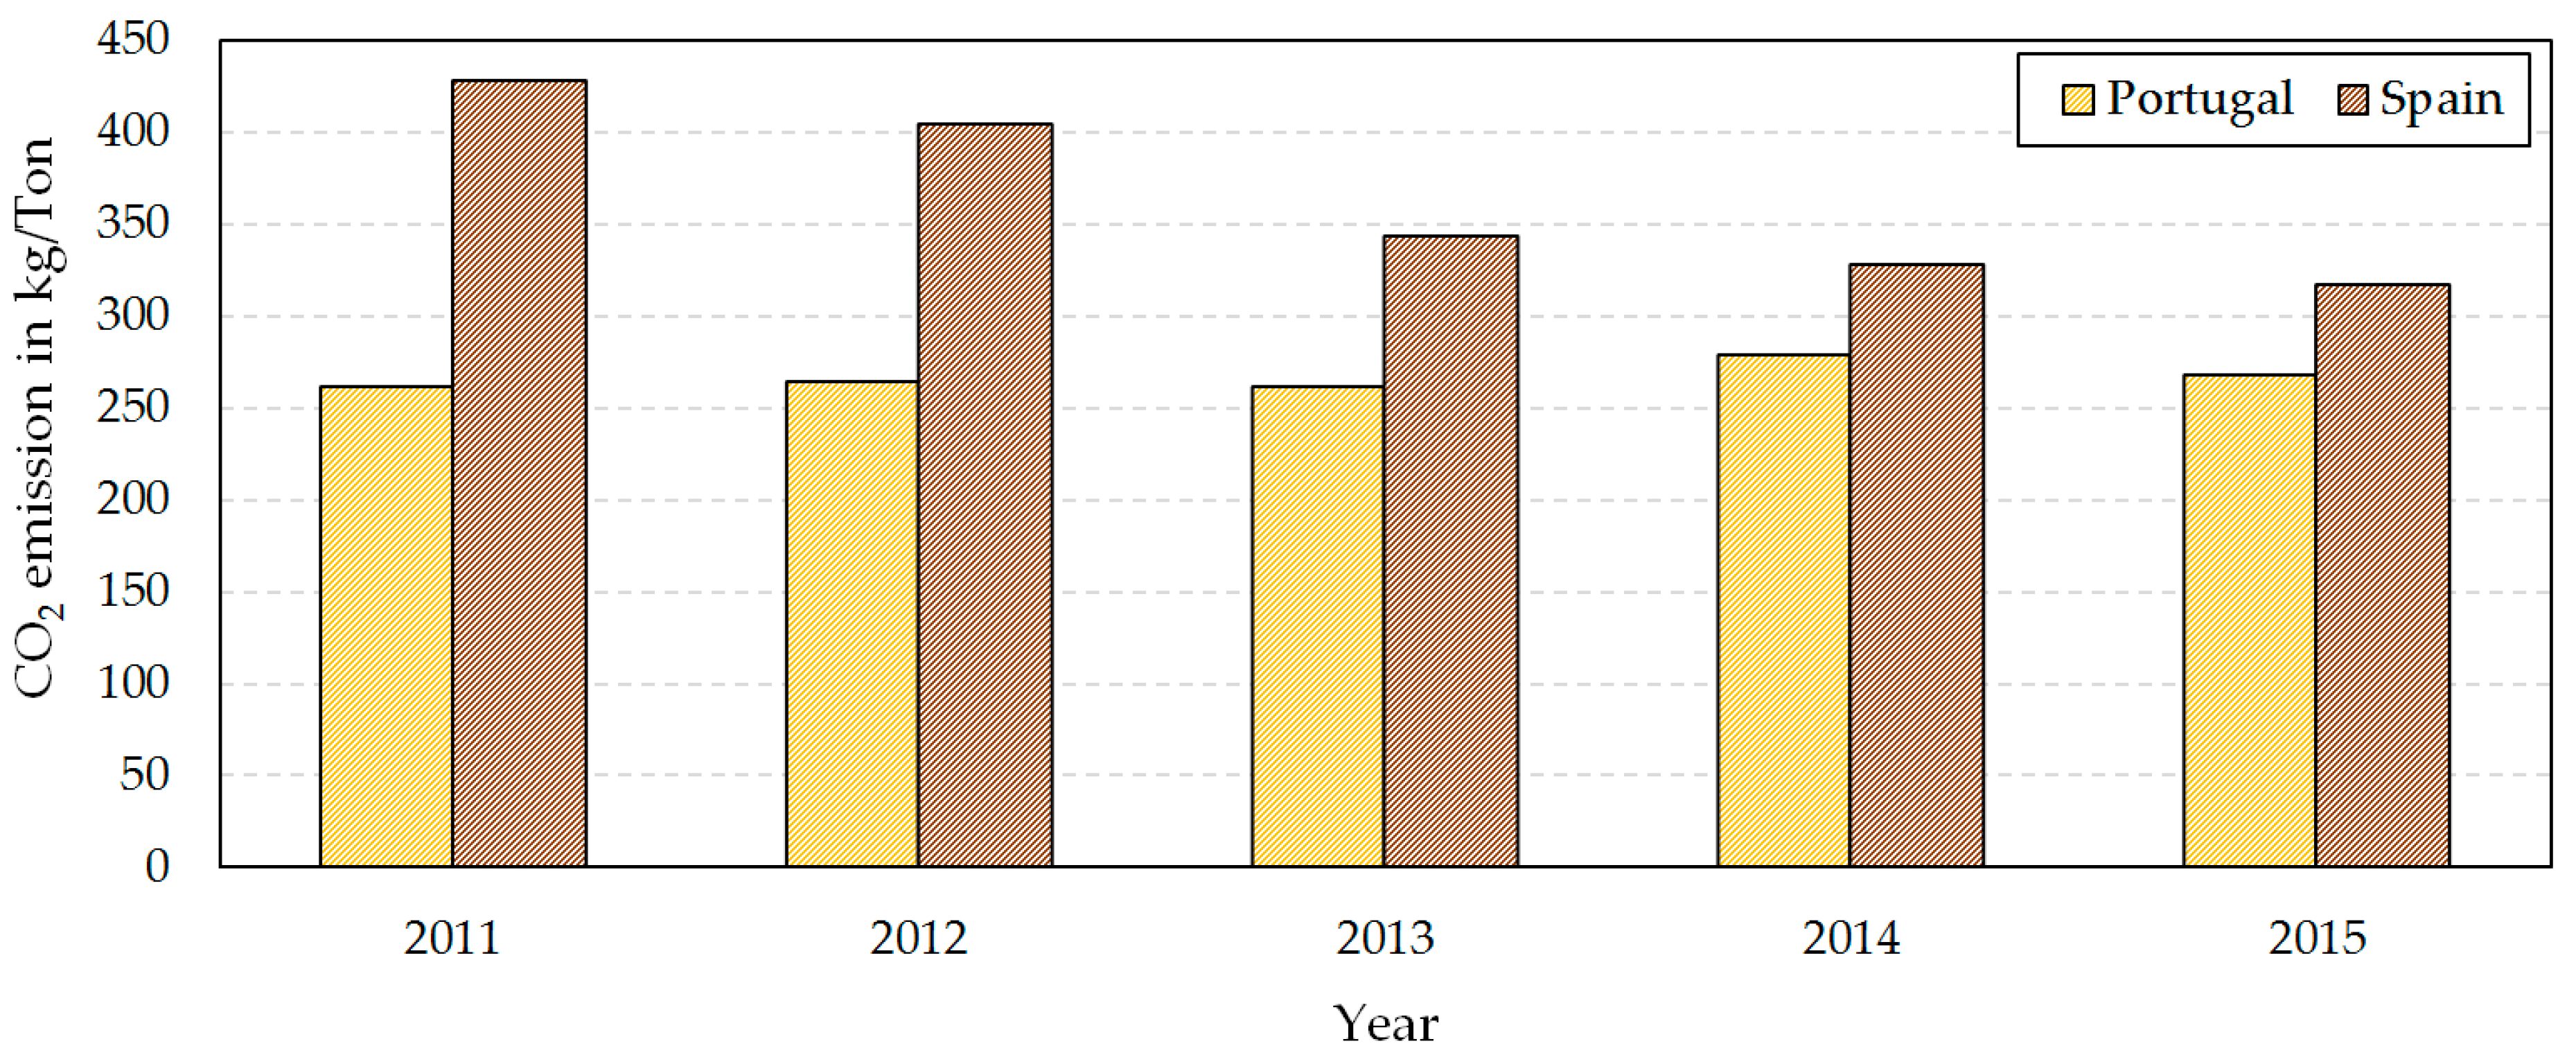
4.1.4. CO2 Emissions Indicator

The CO2 Emission indicator assesses the emission of CO2 gases that are emitted per ton of produced pulp and paper. The calculation of this indicator is made through the ratio between CO2 emissions and total production of pulp and paper. The results for both countries are shown in Figure 4.
After calculations from the data presented in Figure 4, it is possible to conclude that there was a constant performance in Portugal, and a decrease of 36% in CO2 emissions in Spain, in the period of study. However, on average, the specific emissions of CO2 in the sector in Spain are 16.8% higher than those registered in the sector in Portugal. Since most of the emissions are due to the burning of fossil fuels for energy production, these results could come from the Spanish sector’s strategy for its energy self-sufficiency.
Although there is no information about the techniques used in both countries, the causes of the differences in values may be in [12]: Practices for the use of clean energy, level of control of the emissions from biomass combustion and fossil fuels, optimization of combustion, level of gas incineration practices, and/or level of gas washing practices.

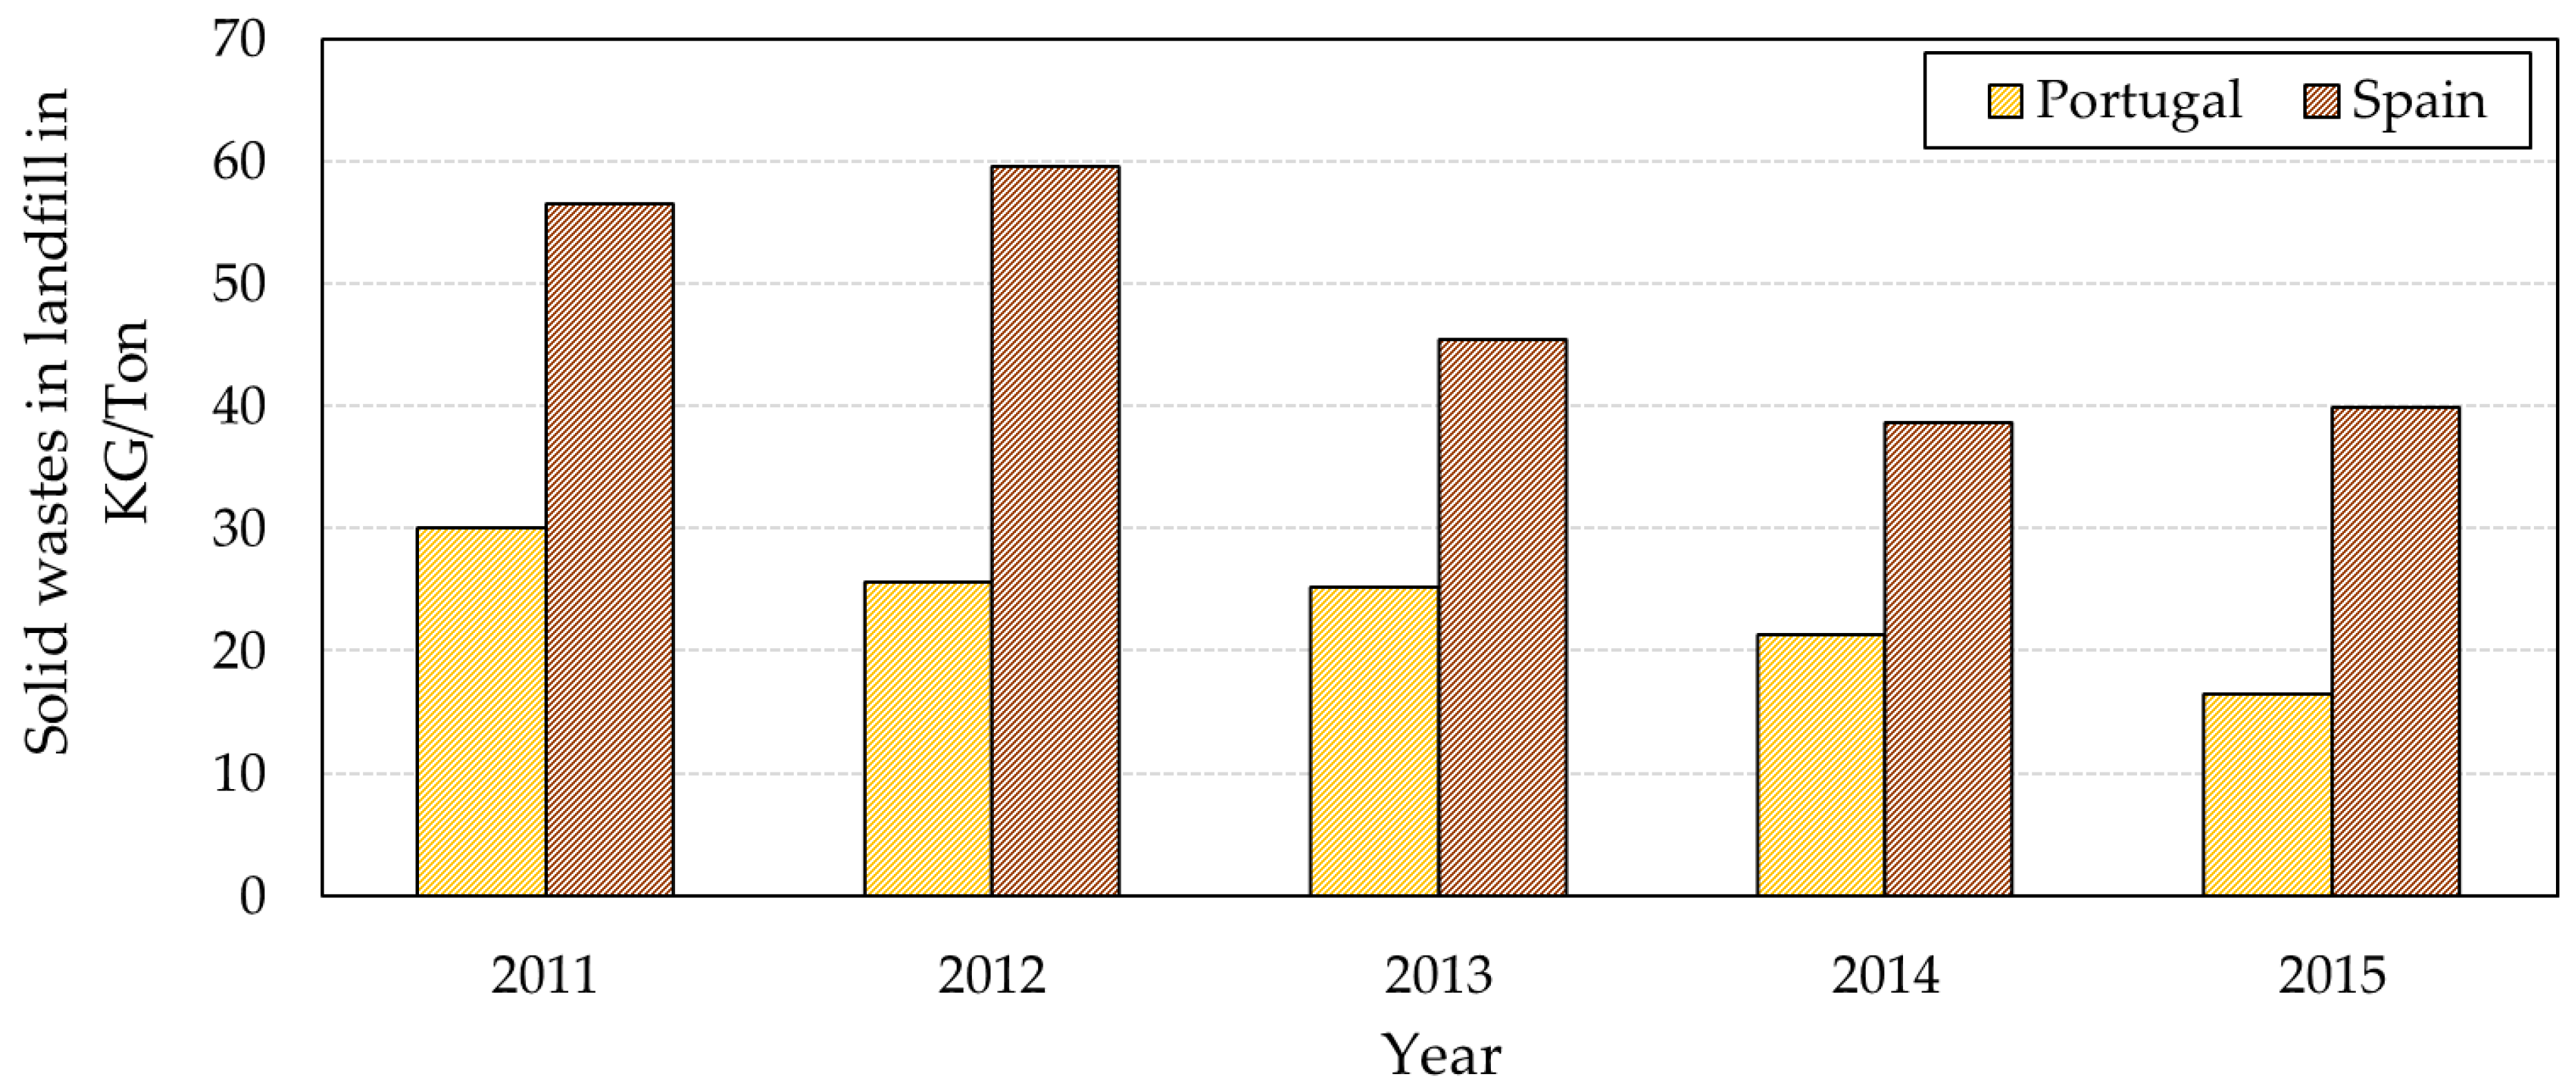
4.1.5. Solid Waste Deposition on Landfill Indicator

The solid waste disposal on landfill indicator gives information about wastes that are produced and deposited in landfills per ton of produced pulp and paper. The calculation of this indicator is made through the ratio between the total deposition of waste in landfill and the total production of pulp and paper. The results are shown in Figure 5.
From the values presented in Figure 5, it is possible to calculate a decrease of of approximately 45.8% and 29.4% in the deposition of solid residues in landfill for the Portuguese and Spanish pulp and paper companies, respectively. However, on average for the five years, it is estimated that the sector in Portugal had a solid waste deposition in landfill of about 49.5% lower than the one registered in the sector in Spain.
Although there is no information about the techniques used in the two groups of pulp and paper companies, the differences in results in both countries may have the following causes [12]: Level of implementation of industrial symbiosis, solid waste destination, level of waste assessment, waste assessment systems, and/or type of waste pretreatment prior to the reuse.

4.2. Results of Reuse and Industrial Symbiosis Indicators

Since reuse and industrial symbiosis indicators quantify the reuse of resources and not their use, these indicators have a different function from the production-based indicators. Reuse and industrial symbiosis indicators also differ in the evaluation of results, since for these, the greater the percentage obtained by the ratio between a reused resource and the total resource used, the better the environmental performance of the resource. To evaluate reuse in the pulp and paper sector, the following indicators were used: Reuse of water, use of biofuels, and industrial symbiosis.

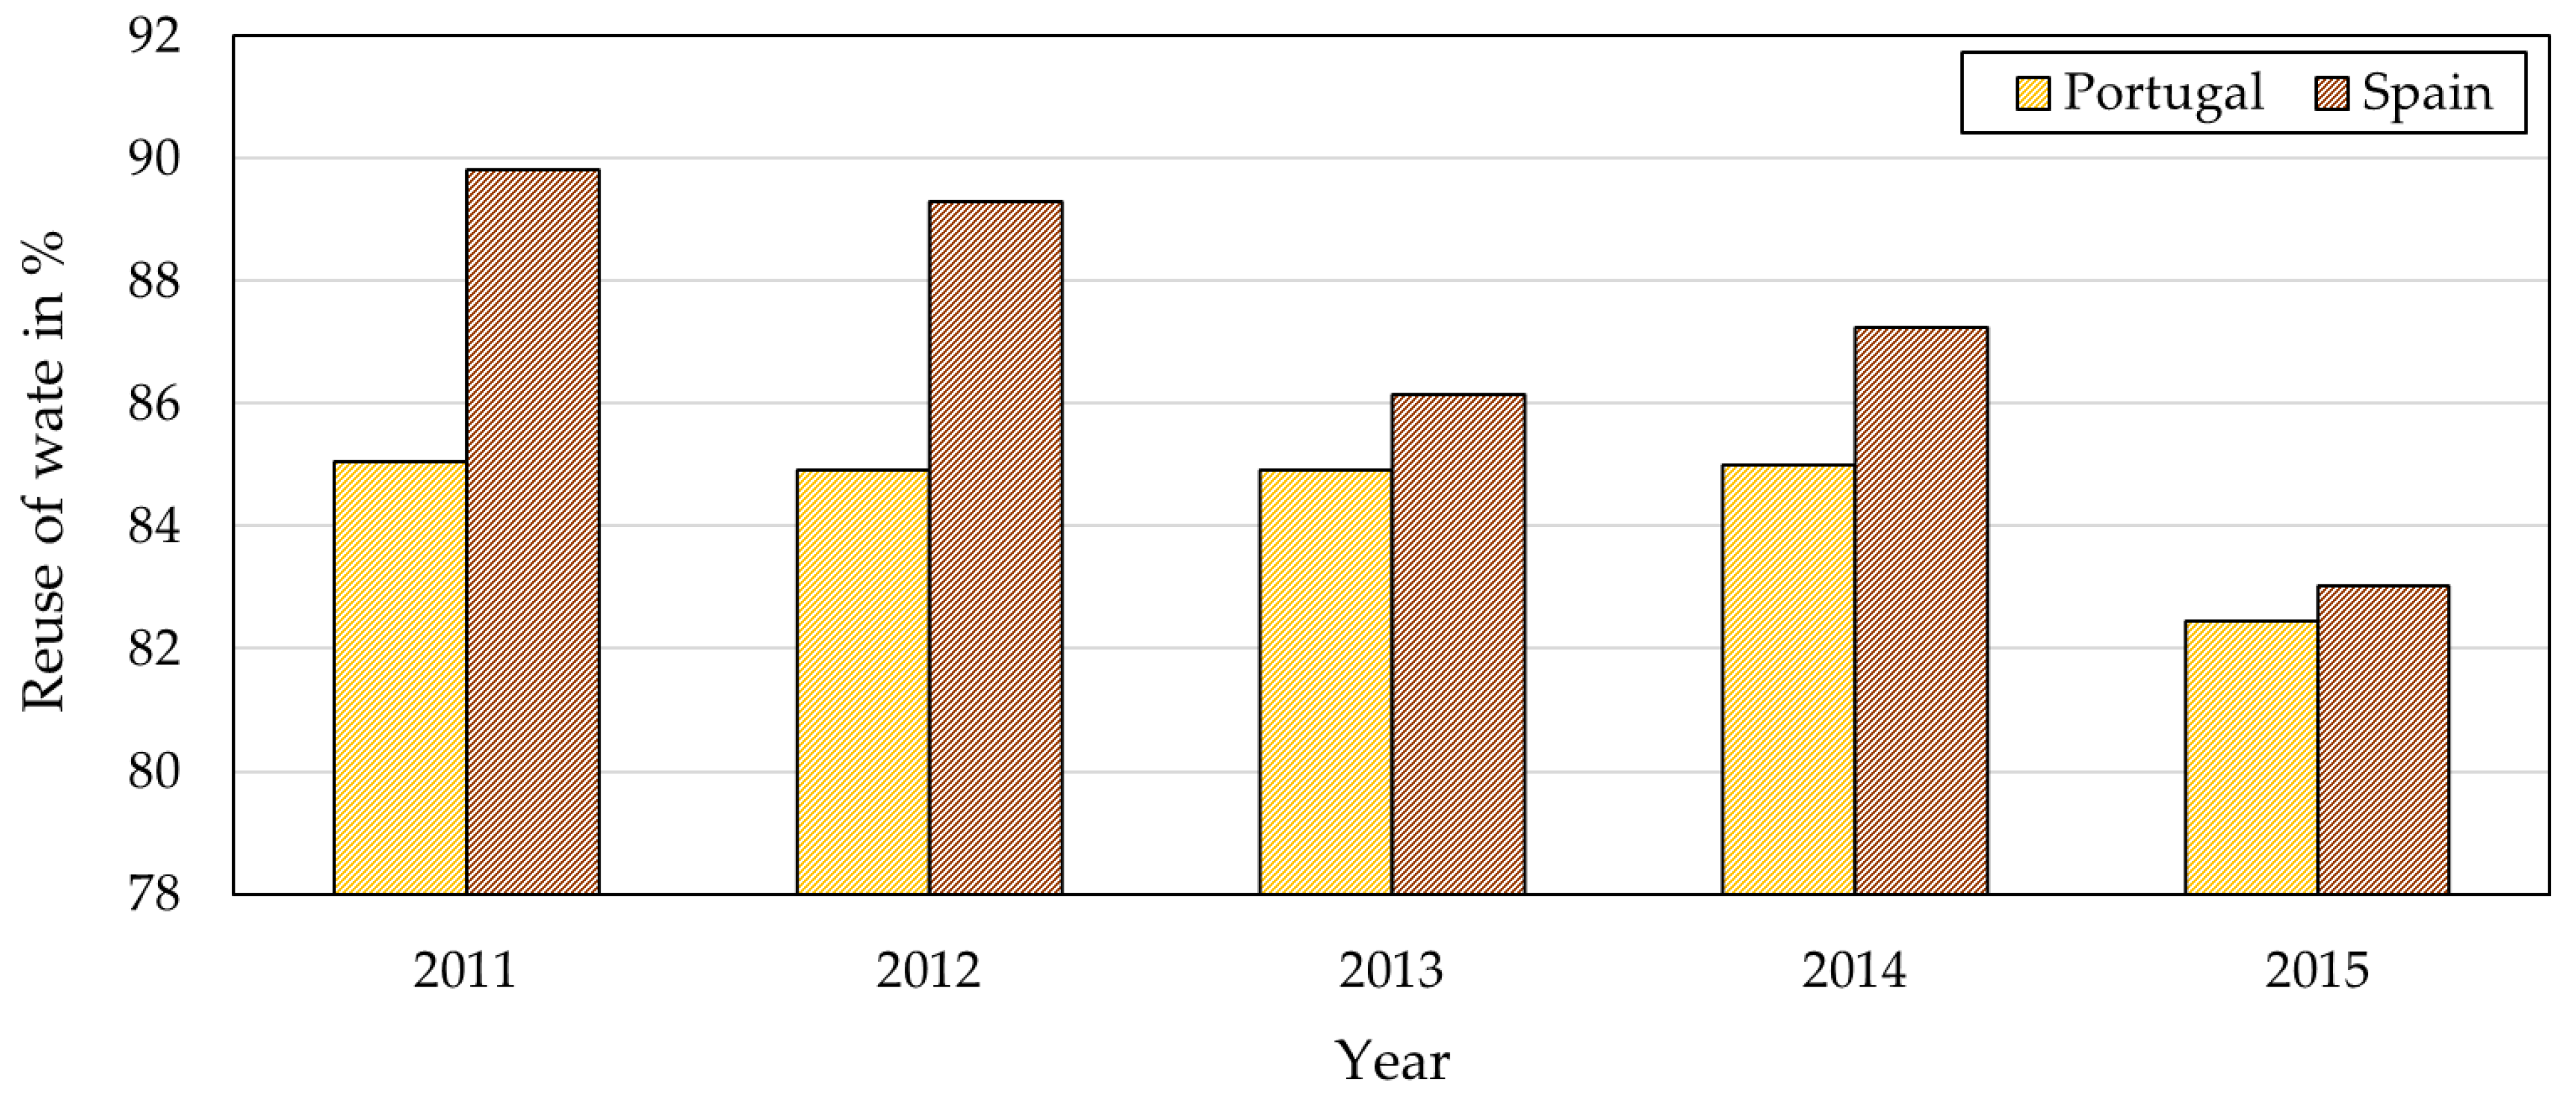
4.2.1. Water Reuse Indicator

To calculate the water reuse indicator, the ratio between the water that is rejected in the pulp, paper, and cardboard (or liquid effluent) production processes and the total volume of water that is collected is calculated. The results of the indicator are shown in Figure 6.
From Figure 6, it is possible to conclude that there is a constant trend in the water reuse numbers in both the Portuguese and Spanish sectors. There is one exception in the year 2015, where it is possible to observe a marked decrease in both countries. It is also possible to conclude, after the respective calculations, that the sector in Spain reuses an average of 2.66 percentage points more water than that which is reused in the sector in Portugal.
Although there is no information about the techniques used in the two groups of pulp and paper companies, differences in the results could have the following causes [12]: Monitoring of water waste, level of water recirculation, water use efficiency level, liquid effluent treatment level, and reusable water levels in the industry.

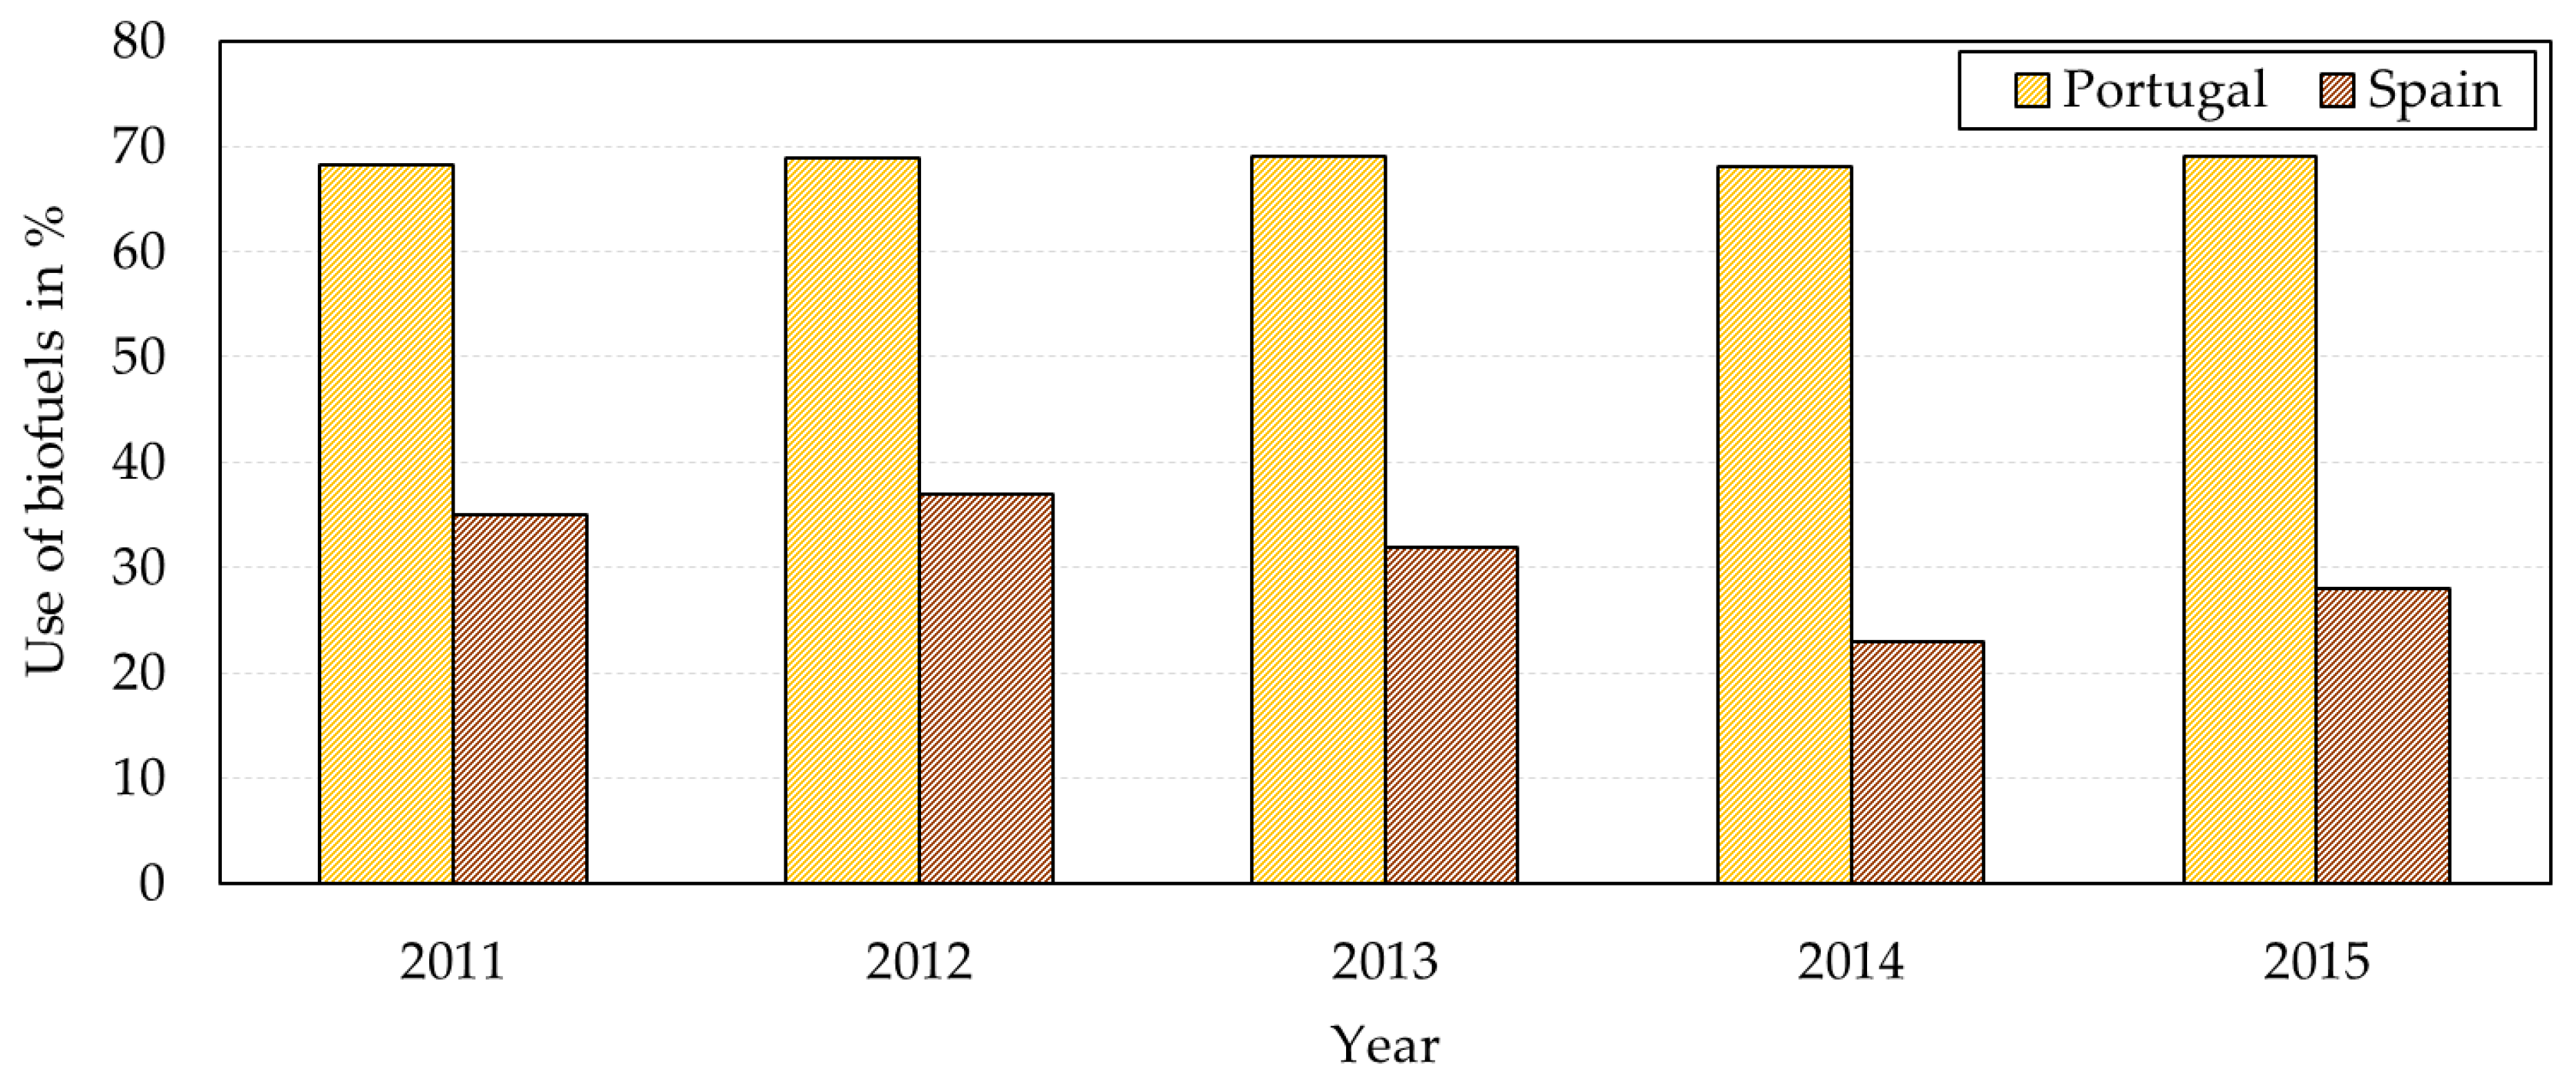
4.2.2. Use of Biofuels Indicator

The paper industry uses biofuels, such as residual biomass from forest exploitation and black liquor, in great amounts for energy production. For the sector in Portugal, these indicators were provided directly by CELPA. In the case of Spain, these data were taken directly from the statistical bulletin ASPAPEL. The results from this indicator are presented in Figure 7.
As Figure 7 shows, the biofuel utilization value of the sector in Portugal is considerably higher than in Spain, and there is a difference that exceeds 40 percentage points in some years. It is also possible to verify that the use of biofuels is constant in the sector in Portugal, and the existence of a tendency to decrease in the use of biofuels in the sector in Spain.
These results may be due to the strategy used in the sector in Spain, such as less biomass-based energy and production, more cogeneration plants supplied with natural gas, or more fuel-based boilers. The latter can be motivated by economic causes or by the lack of infrastructure that allows for greater use of biomass for energy production.

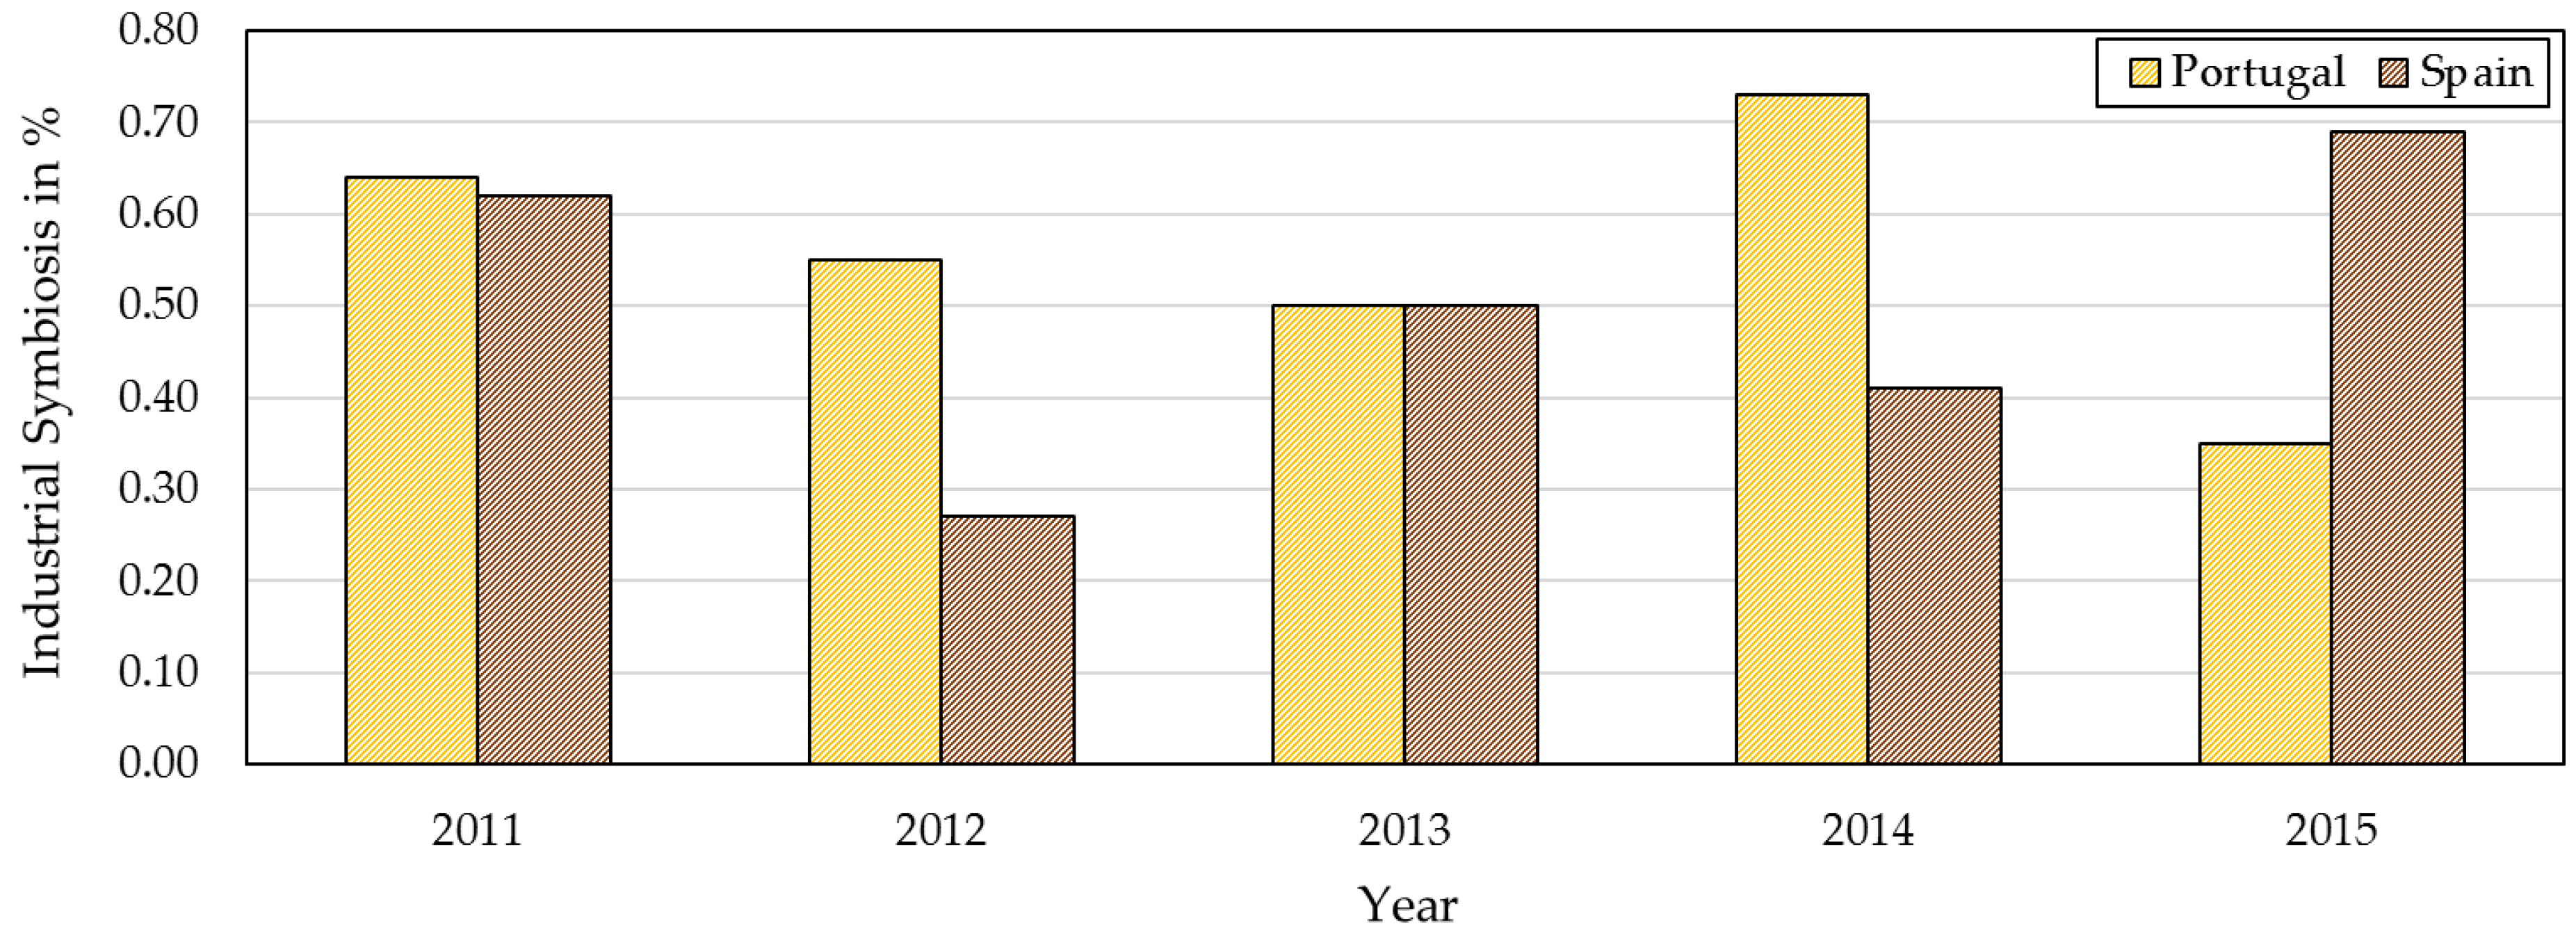
4.2.3. Industrial Symbiosis Indicator

Data regarding waste which is used in industrial symbiosis is calculated by the sum of the waste and by-products used for energy valorization for other industries, like the ones that are used in the ceramic and cement industry, as well as those used as secondary raw materials for other industries. The calculation of this indicator is made according to Equation (2).
The values for this indicator are shown for both countries in Figure 8. From this figure, it can be concluded that for the sector in Portugal, the year 2015 was the year in which there was a lower symbiotic relationship, in contrast to the year 2014 that had the best result in the period between 2011 and 2015.

4.3. Results from the Comparative Analysis of the Circular Economy

Through the elaboration of a radar chart (or spider diagram) for each of the years studied, it was possible to analyze the indicators. After calculating the areas of the indicators, the two sets of companies were compared by calculating the comparative index. These results serve as an analysis of the evolution of the circular economy implementation for the years between 2011 and 2015.
In the five years studied, when comparing to the environmental variables of the sector in Spain, the sector in Portugal stood out in the categories of: Electricity consumption, liquid effluent rejection, CO2 emissions, the use of biofuels, landfill, and industrial symbiosis. The sector in Spain had a better environmental performance in the categories of indicators related to the use of wood and water reuse.
As previously shown in Section 3.2, it is necessary to convert the indicated values to normalized values. In the case of indicators whose base is production, the normalization method is to make the ratio between each result by the less favorable value of the respective category. In this way, the smaller the area of the radar chart, the better the eco-efficiency of the sector. In order to normalize the values of the reuse and symbiosis indicators, it is necessary to divide the less favorable value by indicators of the respective category. After normalization, the set of categories of indicators presented is collected in a radar chart.
Figure 9 shows the radar chart corresponding to the last year under study, 2015. The value of the comparative index is 26.16%. Since this result represents the proxy for the level of implementation of the circular economy from one country to another, it is possible to conclude that the sector in Portugal has a 26.16% better implementation than the one registered in Spain.
Figure 10 presents the areas of the polygons that represent the implementation of the circular economy in the years under study.
The comparative index, calculated by the ratio between the areas of the polygons of the respective countries, is also represented. Based on Figure 10, it can be concluded that the area of the polygon representative of the implementation of the sector’s circular economy in Portugal is smaller than the representative polygon of the sector in Spain during the studied period. Thus, and as can be seen from the comparative index, the pulp and paper sector in Portugal has a higher implementation of the circular economy procedures when compared with Spain.
However, in spite of the successive positive results of the sector in Portugal, in relation to the sector in Spain, in the year of 2015, there was a decrease in the comparative index. Several reasons could be behind this result. However, in part, this could be explained by the implementation of the circular economy in the sector in Spain [38,39].

5. Conclusions

This research allowed us to identify, calculate, and analyze the evolution of the circular economy and eco-efficiency implementation in the pulp and paper sectors in the Iberian Peninsula between 2011 and 2015. This analysis was possible through the calculation of specific indicators of the sector under study, such as: Wood consumption, electric energy consumption, CO2 emissions, inefficiency of water usage, waste disposal in landfill, biofuel use, water reuse, and industrial symbiosis. From these, it was found that the sector in Portugal consumed 11.3% less electricity, on average, in the period under study; was 17.3% more efficient in water usage; emitted 16.8% less CO2; used 37.7 percentage points more of biofuels; sent 49.5% less waste to landfill; and has a 19.13% higher implementation of industrial symbiosis than the sector in Spain. It was also possible to conclude that the sector in Spain uses 2% less wood than the sector in Portugal, and reuses 2.7 percentage points more water than the sector in Portugal.
Radar charts representing the circular economy in the pulp and paper sectors were created for Portugal and Spain. From these results, it was possible to conclude that, through the calculation of the comparative index, the sector in Portugal had an implementation of the circular economy 34.98%, 45.89%, 34.65%, 39.13%, and 26.21% higher than the sector in Spain in the years between 2011 and 2015, respectively.
It is very important to emphasize that the most important and valuable contribution of this paper is to explain and deliver a methodology to evaluate and eventually compare the eco-efficiency performances and the degrees of circular economy implementation of an industry. The practical example used (the analysis and comparison of a group of industrial Iberian companies belonging to the pulp and paper industry) needs to be seen as an exercise to demonstrate the utilization of the method. The sectors in both countries are very different, with Portugal showing a very strong and huge capacity for pulp production as well as uncoated fine paper production (Office and Offset Paper), while in Spain, the packaging paper based on secondary (recycled) fiber is of paramount importance. These substantial differences might justify some of the obtained figures.
As a suggestion for future research, it is recommended to apply the comparative index developed in the present research by extending the study to the European pulp and paper industries, particularly in the Nordic countries. In these countries, the circular economy is in great development and under constant improvement. The comparison with these countries would be beneficial in understanding the position of Portugal in relation to an industry that is leading the way in the application of the circular economy. Another potential study could be addressing the socio-economic dimensions of the circularity of this sector, and making an association between the economic and social attributes with the proposed environmental sustainability indicators.

Author Contributions

Conceptualization, M.d.C.F.; methodology, M.d.C.F.; validation, M.S.B.; formal analysis, M.d.C.F..; investigation, M.d.C.F.; writing—original draft preparation, I.d.A.F.; writing—review and editing, R.G.; supervision, H.C.

Funding

Helena Carvalho and Radu Godina would like to acknowledge financial support from Fundação para a Ciência e Tecnologia (UID/EMS/00667/2019).

Conflicts of Interest

The authors declare no conflict of interest.

References

  1. Genovese, A.; Acquaye, A.A.; Figueroa, A.; Koh, S.C.L. Sustainable supply chain management and the transition towards a circular economy: Evidence and some applications. Omega 2017, 66, 344–357. [Google Scholar] [CrossRef] [Green Version]
  2. Carrillo-Hermosilla, J.; del Río, P.; Könnölä, T. Diversity of eco-innovations: Reflections from selected case studies. J. Clean. Prod. 2010, 18, 1073–1083. [Google Scholar] [CrossRef]
  3. Preston, F. A Global Redesign? Shaping the Circular Economy. Chatham House, 1 March 2010. [Google Scholar]
  4. Lazarevic, D.; Valve, H. Narrating expectations for the circular economy: Towards a common and contested European transition. Energy Res. Soc. Sci. 2017, 31, 60–69. [Google Scholar] [CrossRef]
  5. De Mattos, C.A.; De Albuquerque, T.L.M. Enabling Factors and Strategies for the Transition Toward a Circular Economy (CE). Sustainability 2018, 10, 4628. [Google Scholar] [CrossRef]
  6. Ellen MacArthur Foundation. Towards the Circular Economy Vol. 1: Economic and Business Rationale for an Accelerated Transition; Ellen MacArthur Foundation: Cowes, UK, 2013. [Google Scholar]
  7. Abreu, M.C.S.D.; Ceglia, D. On the implementation of a circular economy: The role of institutional capacity-building through industrial symbiosis. Resour. Conserv. Recycl. 2018, 138, 99–109. [Google Scholar] [CrossRef]
  8. European Comission EUR-Lex—52015DC0614—EN—EUR-Lex. Available online: https://eur-lex.europa.eu/legal-content/en/TXT/?uri=CELEX%3A52015DC0614 (accessed on 17 January 2019).
  9. Kirchherr, J.; Piscicelli, L.; Bour, R.; Kostense-Smit, E.; Muller, J.; Huibrechtse-Truijens, A.; Hekkert, M. Barriers to the Circular Economy: Evidence From the European Union (EU). Ecol. Econ. 2018, 150, 264–272. [Google Scholar] [CrossRef]
  10. CELPA—Associação da Indústria Papeleira. Boletim Estatístico Indústria Papeleira Portuguesa 2017; CELPA—Indústria Papeleira Portuguesa: Lisboa, Portugal, 2017; p. 93. [Google Scholar]
  11. Liu, Y.; Bai, Y. An exploration of firms’ awareness and behavior of developing circular economy: An empirical research in China. Resour. Conserv. Recycl. 2014, 87, 145–152. [Google Scholar] [CrossRef]
  12. European Comission. 2014/687/UE: Decisão de Execução da Comissão, de 26 de Setembro de 2014 , que Estabelece as Conclusões Sobre as Melhores Técnicas Disponíveis (MTD) para a Produção de Pasta de Papel, Papel e Cartão, nos Termos da Diretiva 2010/75/UE do Parlamento Europeu e do Conselho [Notificada com o Número C(2014) 6750] Texto Relevante para Efeitos do EEE; European Comission: Brussels, Belgium; Luxembourg, 2014; Volume 284. [Google Scholar]
  13. Avdiushchenko, A. Toward a Circular Economy Regional Monitoring Framework for European Regions: Conceptual Approach. Sustainability 2018, 10, 4398. [Google Scholar] [CrossRef]
  14. Jawahir, I.S.; Bradley, R. Technological Elements of Circular Economy and the Principles of 6R-Based Closed-loop Material Flow in Sustainable Manufacturing. Procedia CIRP 2016, 40, 103–108. [Google Scholar] [CrossRef] [Green Version]
  15. Cradle to Cradle Products Innovation Institute About the Institute—Cradle to Cradle Products Innovation Institute. Available online: https://www.c2ccertified.org/about (accessed on 17 January 2019).
  16. Geng, Y.; Doberstein, B. Developing the circular economy in China: Challenges and opportunities for achieving “leapfrog development”. Int. J. Sustain. Dev. World Ecol. 2008, 15, 231–239. [Google Scholar] [CrossRef]
  17. Yuan, Z.; Bi, J.; Moriguichi, Y. The Circular Economy: A New Development Strategy in China. J. Ind. Ecol. 2006, 10, 4–8. [Google Scholar] [CrossRef]
  18. Heshmati, A. A Review of the Circular Economy and Its Implementation; Forschungsinstitut zur Zukunft der Arbeit Institute: IZA: Bonn, Germany, 2015; p. 63. [Google Scholar]
  19. Guo, J.; Mao, H.; Wang, T. Ecological Industry: A Sustainable Economy Developing Pattern. J. Sustain. Dev. 2010, 3. [Google Scholar] [CrossRef]
  20. Chertow, M.R.; Ashton, W.S.; Espinosa, J.C. Industrial Symbiosis in Puerto Rico: Environmentally Related Agglomeration Economies. Region. Stud. 2008, 42, 1299–1312. [Google Scholar] [CrossRef]
  21. Korhonen, J. Four ecosystem principles for an industrial ecosystem. J. Clean. Prod. 2001, 9, 253–259. [Google Scholar] [CrossRef]
  22. Word Business Council for Sustainable Development. A Eco-Eficiência: Cria Mais Valor Com Menos Impacto; Conselho Empresarial para o Desenvolvimento Sustentável: Lisboa, Portugal, 2000; p. 36. [Google Scholar]
  23. Chiu, A.S.F.; Ward, J.V.; Massard, G. Introduction to the special issue on Advances in Life-Cycle Approachesto Business and Resource Management in the Asia-Pacific Region. J. Clean. Prod. 2009, 17, 1237–1240. [Google Scholar] [CrossRef]
  24. Oggioni, G.; Riccardi, R.; Toninelli, R. Eco-efficiency of the world cement industry: A data envelopment analysis. Energy Policy 2011, 39, 2842–2854. [Google Scholar] [CrossRef] [Green Version]
  25. Park, H.-S.; Behera, S.K. Methodological aspects of applying eco-efficiency indicators to industrial symbiosis networks. J. Clean. Prod. 2014, 64, 478–485. [Google Scholar] [CrossRef]
  26. Siitonen, S.; Tuomaala, M.; Ahtila, P. Variables affecting energy efficiency and CO2 emissions in the steel industry. Energy Policy 2010, 38, 2477–2485. [Google Scholar] [CrossRef]
  27. Bauman, Z. Consuming Life; John Wiley & Sons: Hoboken, NJ, USA, 2013; ISBN 978-0-7456-5582-6. [Google Scholar]
  28. Chertow, M.R. “Uncovering” Industrial Symbiosis. J. Ind. Ecol. 2007, 11, 11–30. [Google Scholar] [CrossRef]
  29. Felicio, M.C. Proposta de um Indicador Para Monitorar a Evolução da Simbiose Industrial em Parques eco-Industriais Segundo a Perspectiva de Sistemas Dinâmicos; Universidade de São Paulo: São Paulo, Brazil, 2013. [Google Scholar]
  30. Iacovidou, E.; Velis, C.A.; Purnell, P.; Zwirner, O.; Brown, A.; Hahladakis, J.; Millward-Hopkins, J.; Williams, P.T. Metrics for optimising the multi-dimensional value of resources recovered from waste in a circular economy: A critical review. J. Clean. Prod. 2017, 166, 910–938. [Google Scholar] [CrossRef]
  31. Elia, V.; Gnoni, M.G.; Tornese, F. Measuring circular economy strategies through index methods: A critical analysis. J. Clean. Prod. 2017, 142, 2741–2751. [Google Scholar] [CrossRef]
  32. Su, B.; Heshmati, A.; Geng, Y.; Yu, X. A review of the circular economy in China: moving from rhetoric to implementation. J. Clean. Prod. 2013, 42, 215–227. [Google Scholar] [CrossRef]
  33. APA, A.P.; do, A. APA—Políticas > Resíduos > Desclassificação de Resíduos > Subproduto. Available online: https://www.apambiente.pt/index.php?ref=16&subref=84&sub2ref=957&sub3ref=958 (accessed on 17 January 2019).
  34. ASPAPEL. Sustainability Report: 2016 Update; Asociación Española de Fabricantes de Pasta, Papel y Cartón: Madrid, Spain, 2016; p. 12. [Google Scholar]
  35. Vanteddu, G.; Chinnam, R.B.; Yang, K. A performance comparison tool for supply chain management. Int. J. Logist. Syst. Manag. 2006, 2, 342. [Google Scholar] [CrossRef]
  36. Kleijnen, J.P.C.; Smits, M.T. Performance metrics in supply chain management. J. Oper. Res. Soc. 2003, 54, 507–514. [Google Scholar] [CrossRef] [Green Version]
  37. Wiedmann, T.O.; Lenzen, M.; Barrett, J.R. Companies on the Scale. J. Ind. Ecol. 2009, 13, 361–383. [Google Scholar] [CrossRef]
  38. Pereira, C.P.; Paes, D.P.; Prata, D.M.; Monteiro, L.P. Desenvolvimento de Índice de Comparação de Ecoeficiência a partir de Ecoindicadores. Sistemas Gestão 2014, 9, 168–180. [Google Scholar] [CrossRef]
  39. Zhou, Z.; Chen, X.; Xiao, X. On Evaluation Model of Circular Economy for Iron and Steel Enterprise Based on Support Vector Machines with Heuristic Algorithm for Tuning Hyper-parameters. Appl. Math. Inf. Sci. 2013, 7, 2215–2223. [Google Scholar] [CrossRef] [Green Version]
Figure 1. Wood consumption indicators for the pulp and paper sectors in Portugal and Spain.
Sustainability 11 01722 g001
Figure 2. Energy consumption indicators for the pulp and paper sectors in Portugal and Spain.
Sustainability 11 01722 g002
Figure 3. Inefficiency of water usage for the pulp and paper sectors in Portugal and Spain.
Sustainability 11 01722 g003
Figure 4. CO2 emissions indicators for the pulp and paper sectors in Portugal and Spain.
Sustainability 11 01722 g004
Figure 5. Solid wastes disposal indicators for the pulp and paper sectors in Portugal and Spain.
Sustainability 11 01722 g005
Figure 6. Water reuse indicators for the pulp and paper sectors in Portugal and Spain.
Sustainability 11 01722 g006
Figure 7. Use of biofuels indicators for the pulp and paper sectors in Portugal and Spain.
Sustainability 11 01722 g007
Figure 8. Industrial symbiosis indicators for the pulp and paper sectors in Portugal and Spain.
Sustainability 11 01722 g008
Figure 9. Circular economy representation in the pulp and paper industries in Portugal and Spain in 2015.
Sustainability 11 01722 g009
Figure 10. Comparative indexes for the sectors in Portugal and Spain in the years under study (2011–2015).
Sustainability 11 01722 g010
Table 1. Proposed eco-efficiency indicators of inputs and outputs [32,39].
CategoryEnvironmental VariableEconomic VariableIndicatorUnits
Resource utilizationWood consumptionPulp productionWood consumption per ton of produced pulpm3/Ton
Energy consumptionPulp and paper productionEnergy consumption per ton of produced pulp and paperGJ/Ton
Pollution controlCO2 EmissionPulp and paper productionCO2 emissions per ton of produced pulp and paperTon/Ton
Inefficiency of water usagePulp and paper productionResidual water rejection per ton of produced pulp and paperm3/Ton
Waste disposal in landfillPulp and paper productionWaste disposal in landfill per ton of produced pulp and paperkg/Ton
Table 2. Proposed reuse indicators [32,39].
CategoryEnvironmental VariableIndicatorUnits
Resource utilization/ReuseWaterWater reuse rate%
Wood/EnergyUse of biofuels rate%
Table 3. Secondary specific data used to calculate the sustainability indicators.
IndicatorSpecific Data
Wood consumption- Total of wood consumption
- Pulp production
Energy consumption- Total of electric power consumption
- Total production of pulp and paper
Inefficiency of water usage- Liquid effluents rejection
- Total production of pulp and paper
CO2 Emissions- CO2 Emissions
- Total production of pulp and paper
Solid waste deposition in landfill - Solid waste deposition in landfill
- Total production of pulp and paper
Water reuse- Total water captation
- Total production of pulp and paper
Industrial symbiosis- Solid waste destination
- Total waste production

