The Social Efficiency for Sustainability: European Cooperative Banking Analysis


1
Faculty of Economics and Business (Sarriko), ECRI, University of the Basque Country, UPV/EHU, 48015 Bilbao, Spain
2
Department of Accountancy, Finance and Economics, University of Huddersfield, Huddersfield HD1 3DH, UK
3
Faculty of Economics and Business Administration, Economics Department, University of Deusto, 48014 Bilbo, Spain
4
Management and the Governance of Financial Cooperatives (MGCF), Université Paris 1 Pantheon Sorbonne, 75013 Paris, France
*
Author to whom correspondence should be addressed.
Sustainability 2018, 10(9), 3271; https://doi.org/10.3390/su10093271
Submission received: 31 July 2018
/
Revised: 5 September 2018
/
Accepted: 8 September 2018
/
Published: 13 September 2018
(This article belongs to the Special Issue Risk Measures with Applications in Finance and Economics)
Abstract
:This paper seeks to establish the relationship between economic efficiency and social efficiency to analyze the sustainability of banking in Europe. The type-effect has been analyzed, as stakeholder value banks—cooperatives and saving banks—should not be less socially and economically efficient than commercial banks. This European analysis was made using the Bankscope database, as it provides a unique insight into the stakeholder view that clarifies, by an analysis of two-stage boundaries, that there is no single model of social and economic efficiency according to the type of financial entity in Europe. These findings contribute to the social cost paradox and shared value perspective, and more broadly to stakeholder theory. It is established that a tradeoff between economic and social efficiency is not needed. There are different behaviors in different European countries. Moreover, our results could lead to the development of social indicators of the sustainability aspects of organizations without resorting to traditional accounting.
1. Introduction
The situation of financial institutions is changing: regulation, governance, digitalization, and supervision are aspects that make banks change. These changes are still ongoing, but there is a need to assess whether business models are sustainable, even in adverse scenarios. The banking crisis is now at an end, enabling us to analyze the social and economic situation of financial institutions, and lay the foundations for a new story of banking in Europe. The efficiency of banks is one of the measures used to organize this sector, and if this measure is developed to achieve sustainability it will be marked a management line towards the purpose of sustainability of financial institutions, not only doing well but also doing good for all stakeholders. Traditionally it has applied bank efficiency from a general economic perspective, but for the purpose of this analysis, new, more social and sustainable aspects have been considered. Financial institutions that adopt a more social approach based on stakeholder value, namely cooperative and savings banks, tend to be secondary in nature [1,2], although in Europe they account for more than sixty percent of the market [3]. This paper will pay attention to them and use them to show a different view of the sustainability approach in banking.
Then, although most of the research regarding bank efficiency focuses on the economical view [4,5,6], a number of papers focus on the social efficiency of financial institutions [2,7,8]. In general, a tradeoff between economic and social efficiency (probably because of the strong influence of financial theory), when one increase other decrease. But, to overcome this problem that we will address here, there are some previous theories; the paradox of social costs [9] and the shared-value perspective [10] state that sustainability should be obtained integrating both economic and social efficiencies. In line stakeholder theory [11], we establish that organizations, including financial entities, should create value for all stakeholders, and that the Triple Bottom Line [12] include the environment for future generations, as well.
To the best of our knowledge, no research has explicitly addressed the question of the social efficiency of European banks (an explanation for the concept of social efficiency is given in the next section), considering not only commercial, but also cooperative banks. Continuing with the work of previous authors [2,13,14,15], we aim to contribute, not only to empirical research on financial institutions, but also to demonstrate that achieving social efficiency does not necessarily imply a direct decline in an entity’s economic goals; this is the primary interest of our research. The purpose of credit cooperatives, framed in the Social Economy, is to create value for workers and society as a whole This is in juxtaposition to commercial banks, where the shareholder value is the main objective [13]; hence, banking specialization (type) can influence in the level of social efficiency of each entity; then, the legal form could thus determine a specific behavior in this line. The country-effect will be also considered with the aim to develop a unique social efficiency model for European banking.
From certain perspectives may exist a direct link between sustainability and environment; however, from the Triple Bottom Line [16] there are three aspects of organizations fundamental for sustainability; economic, environmental, and social. The economic aspects are already incorporated in the classical financial theory; the environmental ones are referred to externalities in general, and the social ones; the focus of this paper, raised to the society inclusions as an important element in organizations; because the interests of stakeholders have been taken into account [11] for a broad sustainability purpose. It can be debatable the primacy of the different areas in relation to sustainability, but the relationship between sustainability in a broad sense and the social value of banking activities are inseparable. The inclusion of the interests of stakeholders is fundamental nowadays because organizations, in this case, banks, should answer their needs and return to them what they are asking for, at least because they are using the societal system for a banking purpose. Then, banks should make an to be socially responsible for sustainability in line that banks should return value to the stakeholders of banks, and the society in general, what they need: employment, less risks, society supports and wellbeing; among others [2].
We used the Bankscope database to obtain the variables to analyze the social efficiency and economic efficiency (profitability) of banking. The research period is 2014 because it is a year considered “out of the financial crisis effect” (see the literature [3,17] for a comparison analysis between pre- and postcrisis). An initial postcrisis picture (2008–2013) will lay the foundations for a future longitudinal study that undoubtedly will be of great importance for banking. However, prior to this, a year-base analysis will highlight the lack of connections between European countries in social terms. Our results will consequently strengthen future banking literature, particularly from a European social perspective. We have used Data Envelopment Analysis (DEA) and a Factorial Analysis of Variance to measure the efficiency of financial institutions.
This paper makes two contributions. Firstly, whilst previous studies have focused on bank efficiency to analyze economic efficiency [4], this paper considers another important aspect, namely social efficiency. Secondly, the European case provides unique information for analyzing the banking sector as a whole; as we used the population of financial institutions, the results have no sample bias, therefore shedding light on the real banking situation in which there is a country effect within a theoretically harmonized Europe in this highly regulated sector. It is to be expected that the European unification will entail a similar behavior of the entities in the group of EU countries in terms of achieving social efficiency. The results obtained have potentially major implications in order to encourage governance based on multiple stakeholder participation in financial institutions: stakeholder value banks. The type and country effect should be analyzed in order to come up with a unique European banking efficiency model: European banking is not yet harmonized. This might contribute to the development of a sustainable European banking system in order to establish typologies, values, or regulations depending on the type of each financial institution (see a past paper [1] for an analysis of banking models in Europe).
The article is organized as follows. Section 2 reviews previous literature on the relationship between social efficiency and stakeholder theory, taking into consideration the inclusion of credit cooperatives. Section 3 explains the research hypothesis to establish the basis of the reasoning on the assumption made, the sample and methodology with the explanation of input/output data. In the next section, the empirical analysis results concerning country and type effects are shown, not only for economic efficiency/profitability, but also using social efficiency as a measure for analyzing the performance of financial institutions. After those results, the analysis of cooperative banks’ social efficiency is also addressed in Section 4. Finally, in Section 5 a discussion is shown, and Section 6 ends with the conclusions, limitations, and recommendations for further research.
2. Literature Review and Framework
The efficiency of banks is a major issue that still remains unresolved, at least the social perspective of efficiency is a gap in the bank efficiency literature; our approach is based on carry on contributions in this line [18,19]. In the last decade the focus of this social view has been linked, for example, to specific types of financial institutions, such as microfinance institutions [16,17,18]. This is due to the fact that social purpose is inherent to them, and is intended to reduce poverty. In microfinance, studies that share this aim analyzed, not only the social efficiency of this type of institution, but also the relationship with economic efficiency and profitability. They concluded that those performances are correlated (economic and social efficiency), and that socially efficient microfinance institutions are not financially less efficient. This shows that in this type of institution at least, social responsibility does not penalize financial efficiency.
In this sense, and based on the Pareto social optimum [20], the notion of social efficiency is understood as the balance between resources for the purpose of the organization and generation of value for the society with those resources. Such resources could include equity and external funding, whilst those that generate value for stakeholders could be the amount of the loans, number of clients, or economic sustainability. In this regard, the organization is understood as a set of stakeholders with an aligned purpose, therefore the higher the profits generated for an entity’s stakeholders—excepting negative externalities (Freeman, 1984)—the greater the social efficiency of an organization [2].
Then, our paper is related to the literature on bank social efficiency. In the model application of the DEA method to evaluate banks’ efficiency presented below, the social value added approach has been chosen based on value for society. In this approach the equity (or more commonly, shareholders’ equity) refers to the amount of capital contributed by the owners and accumulated reserves [2]. Bank deposits consist of total money placed into banking institutions for safekeeping providing liquidity and act as delegated monitors [21]. Both equity and deposits are defined as inputs [2] including the resources needed for bank activity [22]. The selection of outputs is based on social generation of value in banking based on stakeholders approach [19] then, customer loans, labor, social contribution, but considering the assumed risk level in the bank are defined outputs. Customer loans show the total lending of money by the bank to other entities, individuals, and/or organizations; labor refers to the number of jobs held by the entity throughout the year, and social contribution is the sum of the funds contributed by the bank to the public administration. Finally, the risk level is included as the difference between the risk admitted by each banking entity, and the provision of funds destined eventually to cover detected risk in each period. Hence, the optimal bank social efficiency trades off social value creation for stakeholders and the resources used for the activities of the bank. In the case of banking, although the values for stakeholders are based not only on market values, but also on non-market (i.e., free of charge use of financial entities dependencies, training for individuals and companies, or newsletter), and emotional ones; due to the lack of generalized and normalized non-market social values, the social efficiency inputs and outputs of this research are limited to bank accounting-base data. In this regard, a second limitation should be taken into account, because the result may not be an optimal reflection of the social value generated by financial intermediation. This may be due to the atypical interest rates in which the financial market is immersed, with results that may not correctly reflect the value induced to third parties through the financing processes. This mismatch may have occurred in 2014, when interest essentially fails to reflect loan value due to the intervention of central banks. This argument is the reason why the volume of borrowed funds has been chosen as a proxy of the output, instead of the result obtained with the loans.
Once reviewed, the concept to analyze social efficiency, we proceed to review the studies analyzed in this paper: the geographic scope, European country, and the typology of financial institution (specialization).
2.1. Country-Effect Studies in Banking
There are a few European-based studies that focus on making a contribution to bank efficiency. For example, Chortareas et al. [23] has addressed the influence of financial freedom on European bank efficiency as a country-effect. They conclude that the freedom of a European country enjoys influences efficiency: free countries will have relatively higher levels of economic efficiency (cost reduction view). Another study conducted by Lozano-Vivas et al. [24] analyzed bank efficiency in ten European countries, concluding that it is lower than expected. Moreover, their findings indicated that environmental variables play an important role in explaining differences in efficiency. More recent analyses [14] have used the estimated profit and cost efficiencies of banks within a region as a proxy for financial quality, and have concluded that regions with more efficient banks are more resilient to Europe’s financial and debt crisis. In addition, bank sector efficiency is related to economic growth. Galema and Koetter [25] used a stochastic production boundary model for European bank efficiency to indicate that the type of banking supervision (Single Supervisory Mechanism-European Central Bank (SSM-ECB) vs. National Competent Authorities (NCA) influences bank efficiency (cost and profit), SSM-ECB supervision means lower efficiencies. None of these papers have based their analyses on social aspects, a welfare state in which employment is generated, a level of infrastructure is maintained or social risks are limited. In this same line, a recent study, carried out by Fijałkowska et al. [26], established the performance between Corporate Financial Performance (CFP) and corporate social-environmental performance (CSP) for Central and Eastern European banks using the DEA as a methodology. The results suggest that a high economic efficiency entails a high socio-environmental efficiency, without necessarily creating an inverse relationship. The previous studies of Lozano-Vivas et al. [24] and Belke et al. [14] include the country-effect as a determinant for bank efficiency. We will continue their conclusions and focus on country-effect, which will contribute to the European banking harmonization level analysis. In this sense, bank taxes and risks are incorporated as outputs in the efficiency analysis.
2.2. Type-Effect Studies in Banking
In terms of type of banking institutions, a number of bank efficiency studies have been conducted. These include studies based on an analysis of Islamic banks [27,28]. In Islamic banking, the conclusions are not clear; there is no consensus over the comparison between commercial and Islamic banks in terms of financial efficiency (see for instance see a past paper [29]). There are some studies addressing savings bank efficiency [30,31]. They contend that when comparing saving banks and commercial banks it is important to control the geographical operational level, otherwise, we will establish or compare culturally, strategically, and tactically different financial institutions. Geography is therefore a relevant issue, particularly if we wish to provide an effective estimate for savings bank efficiency levels. Indeed, they display various financial characteristics with far-reaching implications for bank efficiency. Cuesta & Orea [31] have based their analysis on merger vs. no-merger, using savings banks as the sample. They conclude that although merger firms are less efficient at first, they increase their technical efficiency and exceed in the end. The efficiency of cooperative banks has already been studied by Lang and Welzel [32] using panel data of German cooperative banks. They base their study on cost efficiency, rather than social efficiency, continuing the bank efficiency view of that decade to establish the economic efficiency of cooperative banks. Bos and Kool [33] have subsequently analyzed 401 cooperative banks in the Netherlands, and conducted both profit and cost efficiency analyses. Their control factors explain less than 10% of profit efficiency, even in a relatively small, homogeneous geographical area with banks close to each other. They conclude that a number of environmental factors have an impact on estimated efficiencies; the uncontrolled 90% of profit efficiency suggests that it is based on managerial inefficiencies. Other more recent studies by Manetti & Bagnoli [7] have analyzed Italian cooperative banks (a specific type of European credit cooperatives: Italian ‘Banche di Credito Cooperativo’), and conclude that they are less efficient than traditional banks, probably because of their statutory commitments. After analyzing the distribution of value added for stakeholders (system strengthening, member, community, staff, and cooperative system), they have established that the efficiency of cooperative banks should be developed from a social point of view [34].
2.3. The Purpose of Our Study in Banking
In this line, our study considers a European bank analysis and two aspects in efficiency calculation: social efficiency and economic efficiency. Financial institution typology, studied in previous literature (Lang and Welzel [32] for cooperative banks; Tabak et al. [30] and Cuesta & Orea [31] for saving banks; and Chortareas et al. [23] and Lozano-Vivas et al. [24] for commercial banks; and Bal & Gölcükcü [35] for industrial banks), probably influences the social and economic efficiency relationship. Specifically, we have considered three types of financial institutions: commercial banks, savings banks, and cooperative banks (the former referred to as shareholder value bank and the latter two stakeholder value banks [3]), to find their differences, placing a particular focus on cooperative banks. Moreover, we have included, not only economic efficiency based on profitability (it is computed as the ratio of net income to tangible total assets), but also, and more exhaustively, social efficiency based on generation of value for bank stakeholders [36,37,38].
To sum up, the present investigation is relevant for the Stakeholder Theory [11]. On the one hand, in case there is evidence that there is no tradeoff between social and economic efficiency, the supposed social cost for shareholders would not remain a critical element to stakeholder theory and would be another contribution to the paradox of social costs [9]. On the other hand, a positive correlation between social and economic efficiency would be a “critical case” that would support stakeholder theory, in the absence of a longitudinal analysis. In turn, the fact that the economic and social efficiency of an entity may not necessarily be correlated, can contribute to justify the need for social and environmental accounting [SEA] [39] in the line of the triple bottom line [12]. This in itself will be a relevant contribution.
3. Hypothesis, Sample and Methodology
3.1. Hypothesis
The issue we face is to analyze whether type and country could influence, not only efficiency from a social perspective, but also profitability: resolving this question will contribute to stakeholder theory, and paradox of social cost and shared-value perspective. This is because some financial institutions, such as cooperative banks, are governed by stakeholders and not only shareholders (namely stakeholder value banks), where commercial banks are based more on hierarchy and linearly structured governance in which there is less or no stakeholder participation (namely shareholder value banks). To make contributions in this sense, we have resorted to statistical hypothesis testing using the hypothetical-deductive method. Prior to this, we employed the synthetic analytical method to identify the components of the problem and move them to a system of inputs and outputs.
In fact, several papers have debated the efficiency of cooperatives banks in relation to commercial banks [7,40]. There is some agreement that this type of institution is less efficient from an economic perspective, although greater social efficiency is expected [41].
Hypothesis 1 (H1).
Commercial banks have greater economic efficiency than cooperative banks.
This hypothesis is consistent both with the theory of property rights [42] and with agency theory [43,44]. As Jensen [45] points out, a shareholder-oriented and controlled entity, such as a banking institution, can orient itself in a one-dimensional way toward a single objective, which will allow for more efficient management, at least compared with multiple objective management. Multiple objectives might consider for example, the priority of workers’ interests [46] to the detriment of economic performance, as might occur when decision-making bodies do not correspond to capital, but mainly to workers and customers. Previous studies [5,13,14,47,48,49], have focused on the economic efficiency of banks that will prevail because of the sine-qua-non need for existence, the main objective of any bank. Cooperative banks focus on social aspects and are legitimated by society to create value for stakeholders [2,15,34]. Consequently, whilst it remains relevant, economic efficiency for cooperative banks is more instrumental than central.
Hypothesis 2 (H2).
Cooperatives banks have greater social efficiency than commercial banks in Europe.
Consistent with classical social theory [50] such as the stakeholder theory [11,51], cooperatives tend to devote a significant part of their efforts to social improvement, or to stakeholders rather than capital gain [34]: namely workers, asset clients, liability customers, the social environment, and the public administration, among others. “Cooperative banks have a strong connection between risk taking and the moral narrative behind their organizational purpose, as values are commonly perceived to be an integral part of the business model” [34]: p. 22. It would therefore appear that the social outputs generated should be higher than those of commercial banks [2,7,32,33]. If this hypothesis were rejected, it would seriously question the social utility of cooperative banks, reducing their remit to the mere satisfaction of workers. It will be an evidence of the existence of social costs. Alternatively, it would show that market-based social determinants are not enough to establish the real social values of organizations.
There are not cooperative banks in all European countries, in those European countries that there are enough cooperatives banks (France, Spain, Germany, Italy, Austria, Portugal, Belgium, Denmark, and Finland) the third hypothesis is:
Hypothesis 3 (H3).
Credit cooperatives have superior social efficiency than commercial banks in each European country with credit cooperatives (France, Spain, Germany, Italy, Austria, Portugal, Belgium, Denmark, and Finland—subhypothesis).
We have analyzed the differences in social efficiency for each country (France, Spain, Germany, Italy, Austria, Portugal, Belgium, Denmark, and Finland), considering that the social efficiency of cooperative banks is higher than efficiency of banks (see the literature [3] for reviewing descriptively the European banking system). Harmonization and new banking regulations provide European countries with the option of establishing a number of similarities across businesses in various European countries. However, there are cultural and environmental aspects, or technical aspects (regulation, taxes or policies) that could affect the social values of each type of financial institution. Previous studies by Lozano-Vivas et al. [24] and Belke et al. [14] include country-effect as a determinant for bank efficiency, and we will continue their research with more evidence to show the harmonization level of European banking.
Hypothesis 4 (H4).
There is a significant difference between European countries regarding the social efficiency of cooperative banks.
With the aim of establishing possible differences across countries according to type, isolating the type and analyzing the country-effect only could enable us to predict, that in general terms, cooperative banks should be more efficient socially in those countries with a greater tradition in social affairs, such as France, Spain, Italy, or Germany [52,53].
The fundamental interest of this paper lies in determining the social efficiency of financial institutions, comparing bank typologies. However, there is no doubt that a further line of research should consist of identifying the various factors in each country that may influence the country effect, and we therefore believe it is necessary to conduct a qualitative analysis with a sample of significant banks from each country. In this sense, the determinant variables should include economic growth, welfare improvement, and, albeit in a negative sense, corruption. We have therefore selected a number of variables based on the results of Manetti & Bagnoli [7], whereby mutual and territorial aspects are relevant: a corruption index [54] and welfare data [55].
Hypothesis 5.1 (H5.1).
Greater corruption level in the country is negatively correlate with the efficiency of cooperative banks.
Corruption has a negative impact on a country’s economy [56] and naturally, also on its banking system. Taking a general index of country corruption level—the Corruption Perception Index, developed by Transparency International Association (for more information see https://www.transparency.org/research/cpi/overview), we analyzed the relationship between corruption level (measure by the inverse of Corruption Perceptions Index) and cooperative bank efficiency. A negative correlation is expected, whereby higher levels of corruption in countries will probably imply less efficient banking cooperatives.
Hypothesis 5.2 (H5.2).
There is a positive and significant correlation between the social efficiency of cooperative banks and Wealth-to-Well-Being Coefficient across EU-15 countries.
Given the social approach of our research, rather than choosing an economic development measure such as GDP or its growth directly, we opted to use a social impact GDP indicator, namely the Wealth-to-Well-Being Coefficient, developed by the Boston Consulting Group, within the framework of Sustainable Economic Development Assessment (SEDA). This coefficient is obtained by comparing the SEDA score for a country’s current welfare level with the expected score given the per capita GDP and the average for all countries. This provides a relative indicator of a country’s effectiveness in converting wealth into welfare that benefits the population. Countries scoring higher than 1.0 offer greater levels of welfare than expected in accordance with their GDP, whilst those scoring below 1.0 provide lower levels of welfare than expected.
A positive relation between this indicator and the social efficiency of cooperative banks is expected, as their purpose is precisely to generate social welfare, essentially by satisfying their stakeholders’ interests [53].
Hypothesis 5.3 (H5.3).
There is a positive and significant correlation between the social efficiency of cooperative banks and the Growth-to-Well-Being Coefficient across EU-15 countries.
The Growth-to-Well-Being Coefficient was used, which was also developed by the Boston Consulting Group within the framework of SEDA. This coefficient compares each country’s increase in its SEDA score with the expected score based on its GDP growth rate, given the average between the scores for recent progress and the GDP growth rates for all countries during the same period. The coefficient reveals whether a country has been able to convert growth into increased welfare. As with the previous coefficient, countries scoring higher than 1.0 are experiencing greater improvements to welfare than forecast given their GDP growth rate between 2006 and 2015. A positive link between this indicator and the social efficiency of cooperative banks is predicted, as the higher the social efficiency of cooperative banks, the higher a country’s forecasted increase in welfare, either due to traction or orientation towards the common good.
3.2. Sample
Our analysis focused on a single model of European bank efficiency, using data from Bankscope (Bureau van Dijk), and on financial entities (commercial banks, cooperative banks, and saving banks) in 2014 (2752 financial institutions with 38,528 observations) in EU-15 countries (Austria; Belgium, Denmark, France, Finland, Germany, Greece, Ireland, Italy, Luxembourg, the Netherlands, Portugal, Spain, Sweden, and the United Kingdom). We have used all the data in the Banskscope using the criterion of activate entity, positive assets, and deposits of accounts in the analysis year; then, we used the population based on this known database (take into account the regular limitations of this type of databases). As the used data is the population we do not need to prove the independency of the data, because it is by definition independent. We have shown in the following table (see Table 1) the means of used variables, but we could provide a complete table. We have used Frontier Analyst® program for DEA analysis and SPSS for statistical analysis (univariate and multivariate analysis).
3.3. Methodology
3.3.1. Two-Stage DEA Analysis
The empirical analysis has carried out using a two-step analysis; firstly a DEA analysis was applied in order to establish the relative efficiency of bank institutions. This was followed by a Factorial Analysis of Variance to analyze the country and type-effect efficiency. A DEA analysis displays both strengths and weaknesses. On one hand, it is more flexible and there is no a pre-established relation between input and outputs that permits a quasi-real show of the relationship between variables; it is a welcome tool for extracting information from the empirical world [57] but is an untidy method for parametric regression. On the other hand, it is an extreme form method that assumes that if a DMU levels output with input, other DMUs should reach the same level (deterministic method); it does not directly imply homogeneity across DMUs, but is necessary to prevent inefficiencies stemming from nonuniform factors. Furthermore, variable selection is of fundamental importance as there are no suitable tests to estimate if the results of the analysis are stable or would vary significantly with other variables. Continuing with Stolp [57]: p. 115, “whether a given research tool is better or worse than another tool is really not the relevant point: what counts is the attitude that is brought to bear on the research”. In this sense, we have not only provided statistical results, but also results that are coherent with the real situation.
Then, in the first stage we have carried a DEA analysis with the aim to develop the bank social efficiency and bank economic efficiency. It has been used some input/output variables that are shown in the Table 2 and argue and define after it.
Social Efficiency for Sustainability should include two major inputs, namely Equity and Deposits [58], thereby allowing for the control of funds related to corporate performance. Although other variables could be included as an input based on bank production theory, such as nondepositors borrowed funds, liquid assets, or financial services, the aim of this paper is to establish social welfare goals, and therefore we opted to start with the basic and minimum sustainable bank performance based on first-level needs: from our point of view, and based on McGuire et al. [58], these are the principal funds institutions need to generate value added.
Although it is not easy due to the absence of standardized indicators measuring the social value of organizations that show the added value generated by stakeholders; social efficiency is explained using the following outputs (as per the literature [2] as an ad-hoc selection based on the interests of the most important stakeholder groups—customers, employees, and the community—customers loans [59], labor, social contribution, profit, and risk. The customer loans (CC) input is relevant for social efficiency because it is the main financial resource of households and corporations [2,34], and is therefore necessary for social value. It is desirable, but not possible, to analyze the type of credit because depending on the aim as the level of social assistance will vary [60]. Nevertheless, as they could be necessary for social value, and because there is a lack of information regarding the exact purpose of the loans, they will all be considered in the same category. The second output, labor (L) is a clear indicator of social value [34]. It is important, insofar as society is based on work, as this guarantees people (bank workers in this case) the wherewithal to live. Social contribution (using taxes) (SC) is important for social efficiency because this output represents the funds that financial institutions pay back to society with the aim of catering to citizens or society’s needs [2]. The final output is risk. The risk is a negative output and outsourced by the entities, so if at a certain moment the risk is updated, the entity itself or a stakeholder of the financial entity will deal with the risk effect; then, it is the gap between provisioned and declared risk. Technically it is calculated as the difference between the risk perceived or declared and the amount of funds provisioned to cover the risks [5,48]. The risk assumed by financial institutions has involved huge cash bailouts, so although it is based on expectations, the citations are necessary because if the assumed risk is not taken into account and not reflected, it could have a negative and direct effect on the purchasing power of citizens and countries. Risk—obtained as the inverse of the sum of the contingent risks and commitments recognized by the different institutions—has previously been incorporated by Fiordelisi et al. [5] and San-Jose et al. [2]. See Table 3 for a mathematical representation of social efficiency using DEA.
The economic view of bank efficiency has been measured using profitability, which can be conducted in a variety of ways, although, following Gutierrez-Nieto et al. [61], we measured it with a standard ratio: return on assets (ROA).
3.3.2. Second Stage: Factorial Analysis of Variance
In the second stage it has been used a Factorial Analysis of Variance applied. It is appropriate because one of the aims of this paper refers to study of the effect of two factors; country and type, and this analysis compares the means of two or more factors. Specifically, F tests are used to determine statistical significance of the factors and their interactions. Then, it also gives us information about their dependence or independence in the same experiment, which is crucial for the sustainability of European banking system, if it is based on harmony and homogenization. The tests are nondirectional in that the null hypothesis specifies that all means are equal and the alternative hypothesis simply states that at least one mean is different.
4. Results
This paper contains two levels of analysis: the first considers the overall social and economic efficiency of a European country, whilst the second is applied to specific aspects that could shed some light on the differences detected.
4.1. European Social Efficiency Analysis: A Path for Sustainability in Financial Area
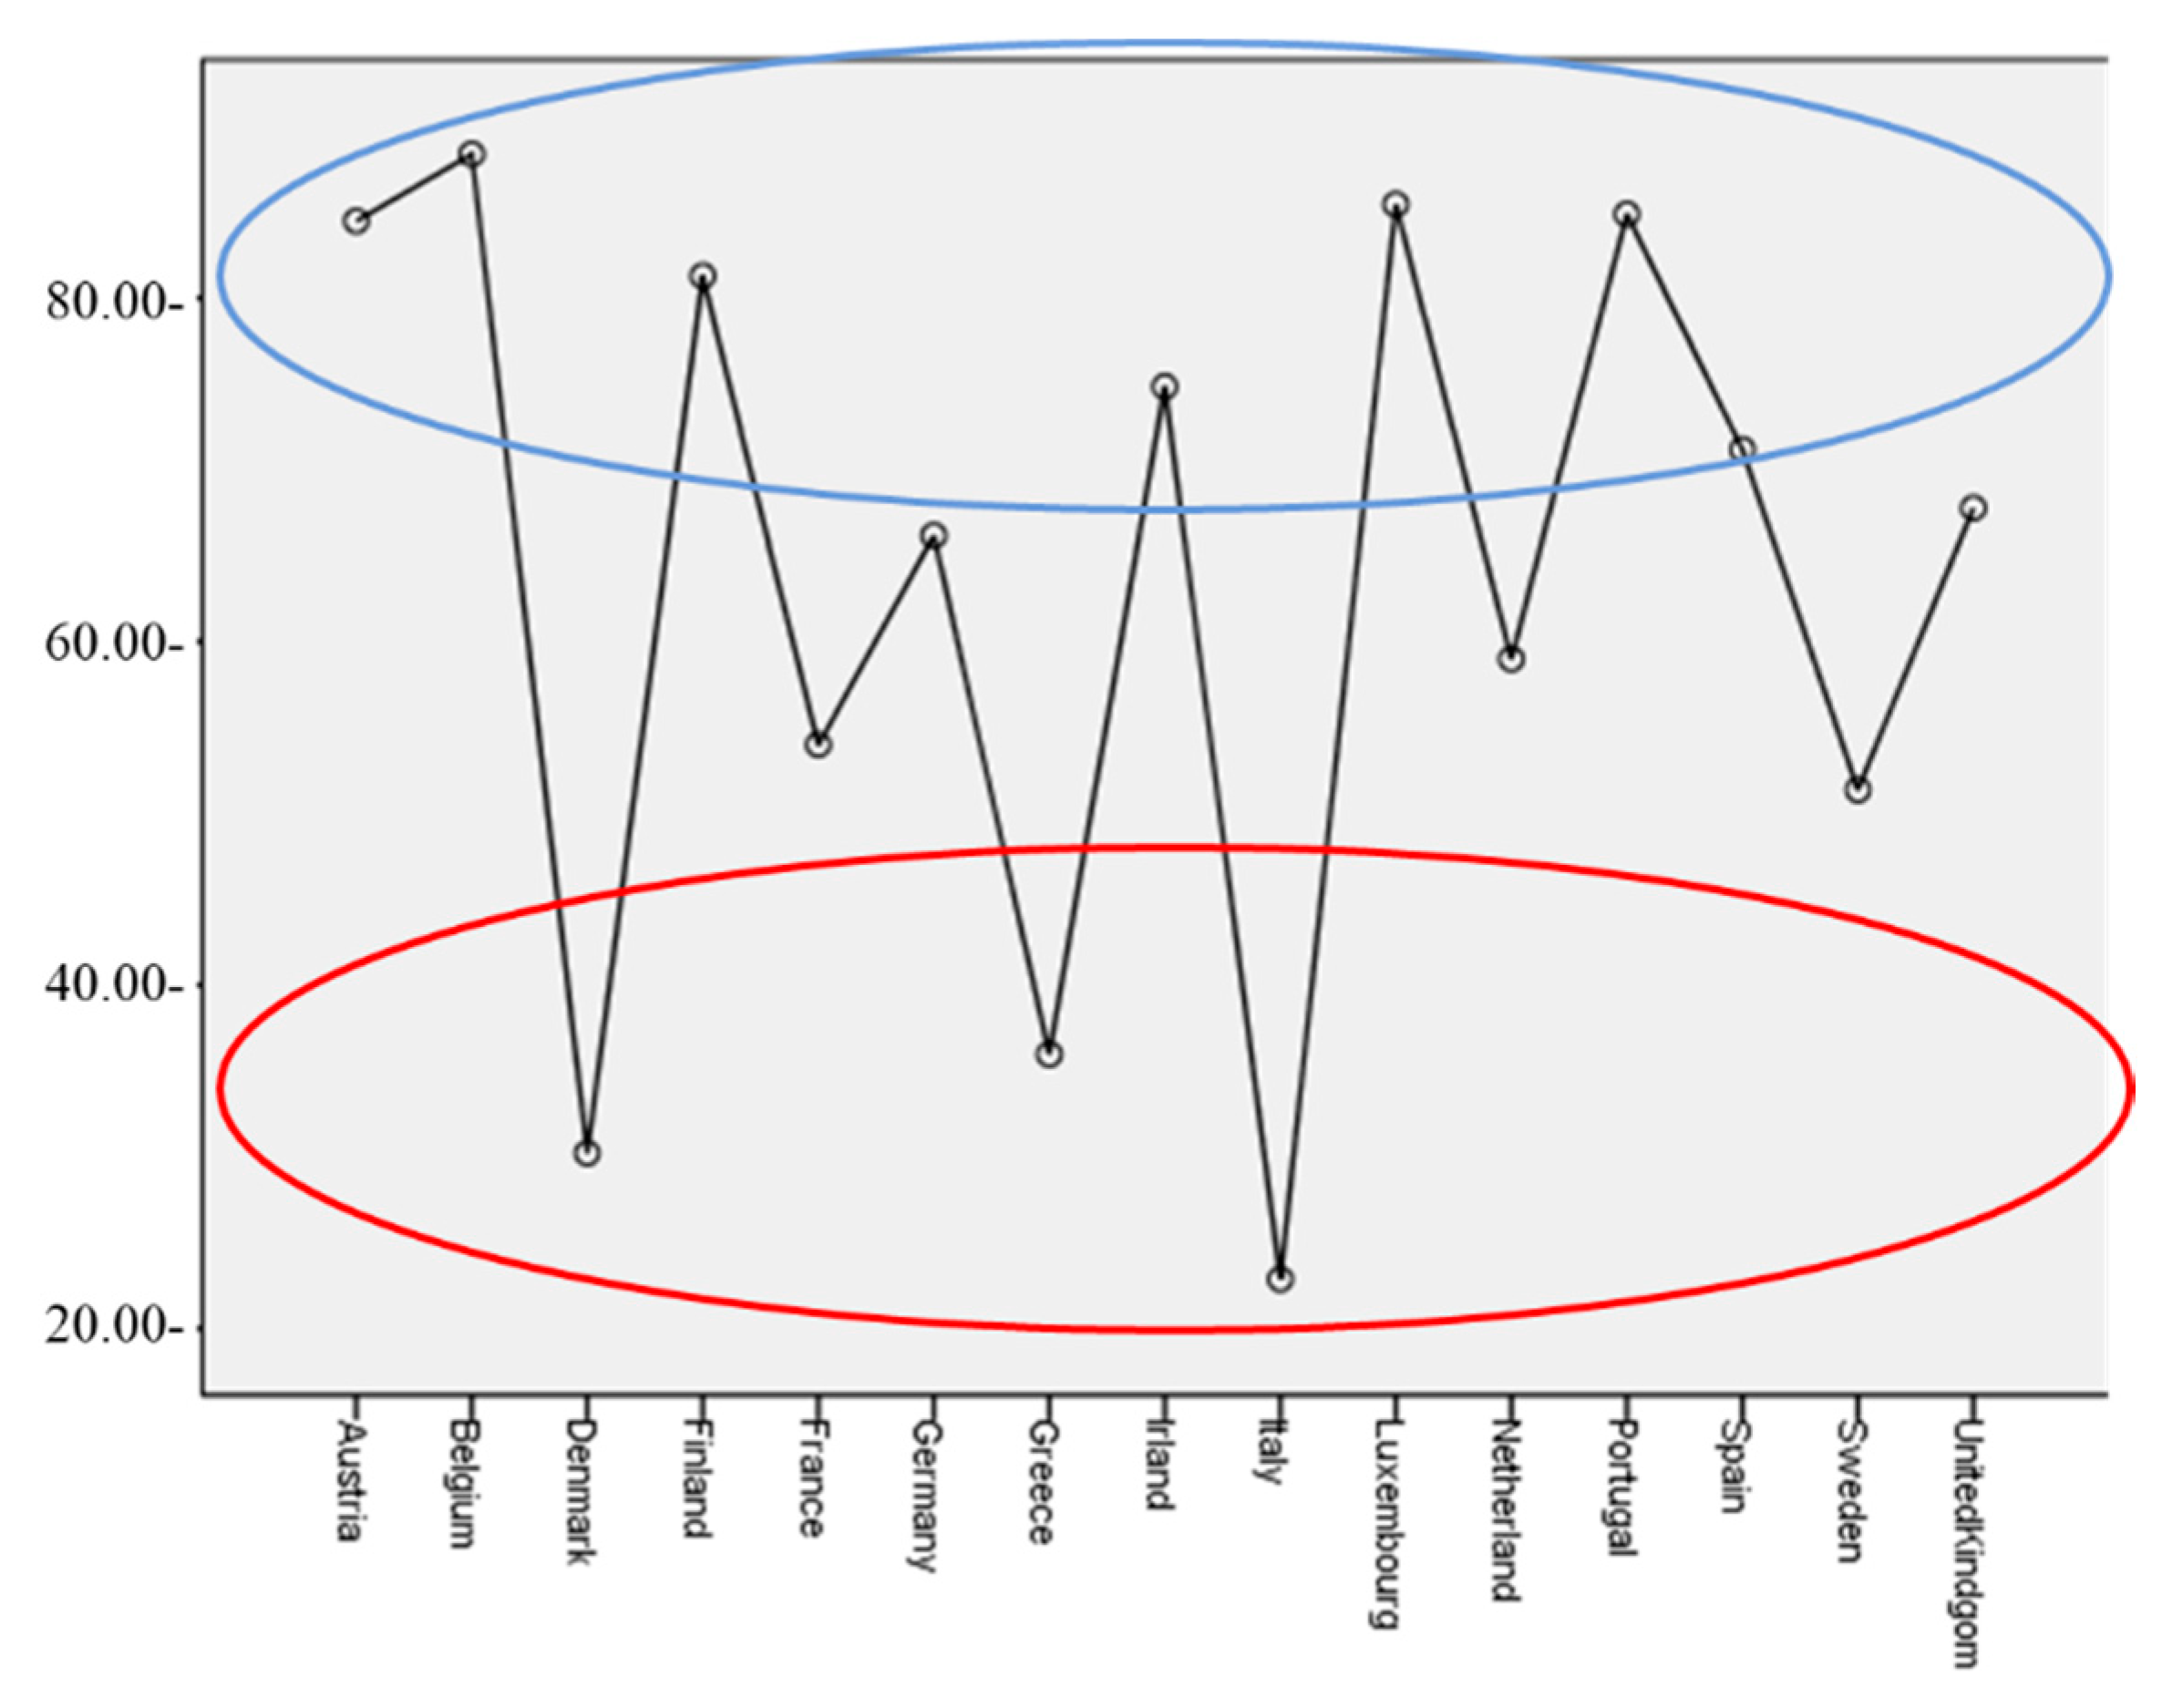
Economic efficiency has been selected using a ratio of economic performance; the intention is to provide a general analysis and consensus for economic aspects of financial institutions. The following figure (see Figure 1) shows the means of the ROA of financial entities in each of the EU-15 countries. It is clear that there are some differences in this exploratory analysis in which the banks in some countries show higher ROAs: examples include Italy and Sweden, which contrast with other countries such as Greece or Portugal. The main countries are in a third group, with neither high nor low returns.
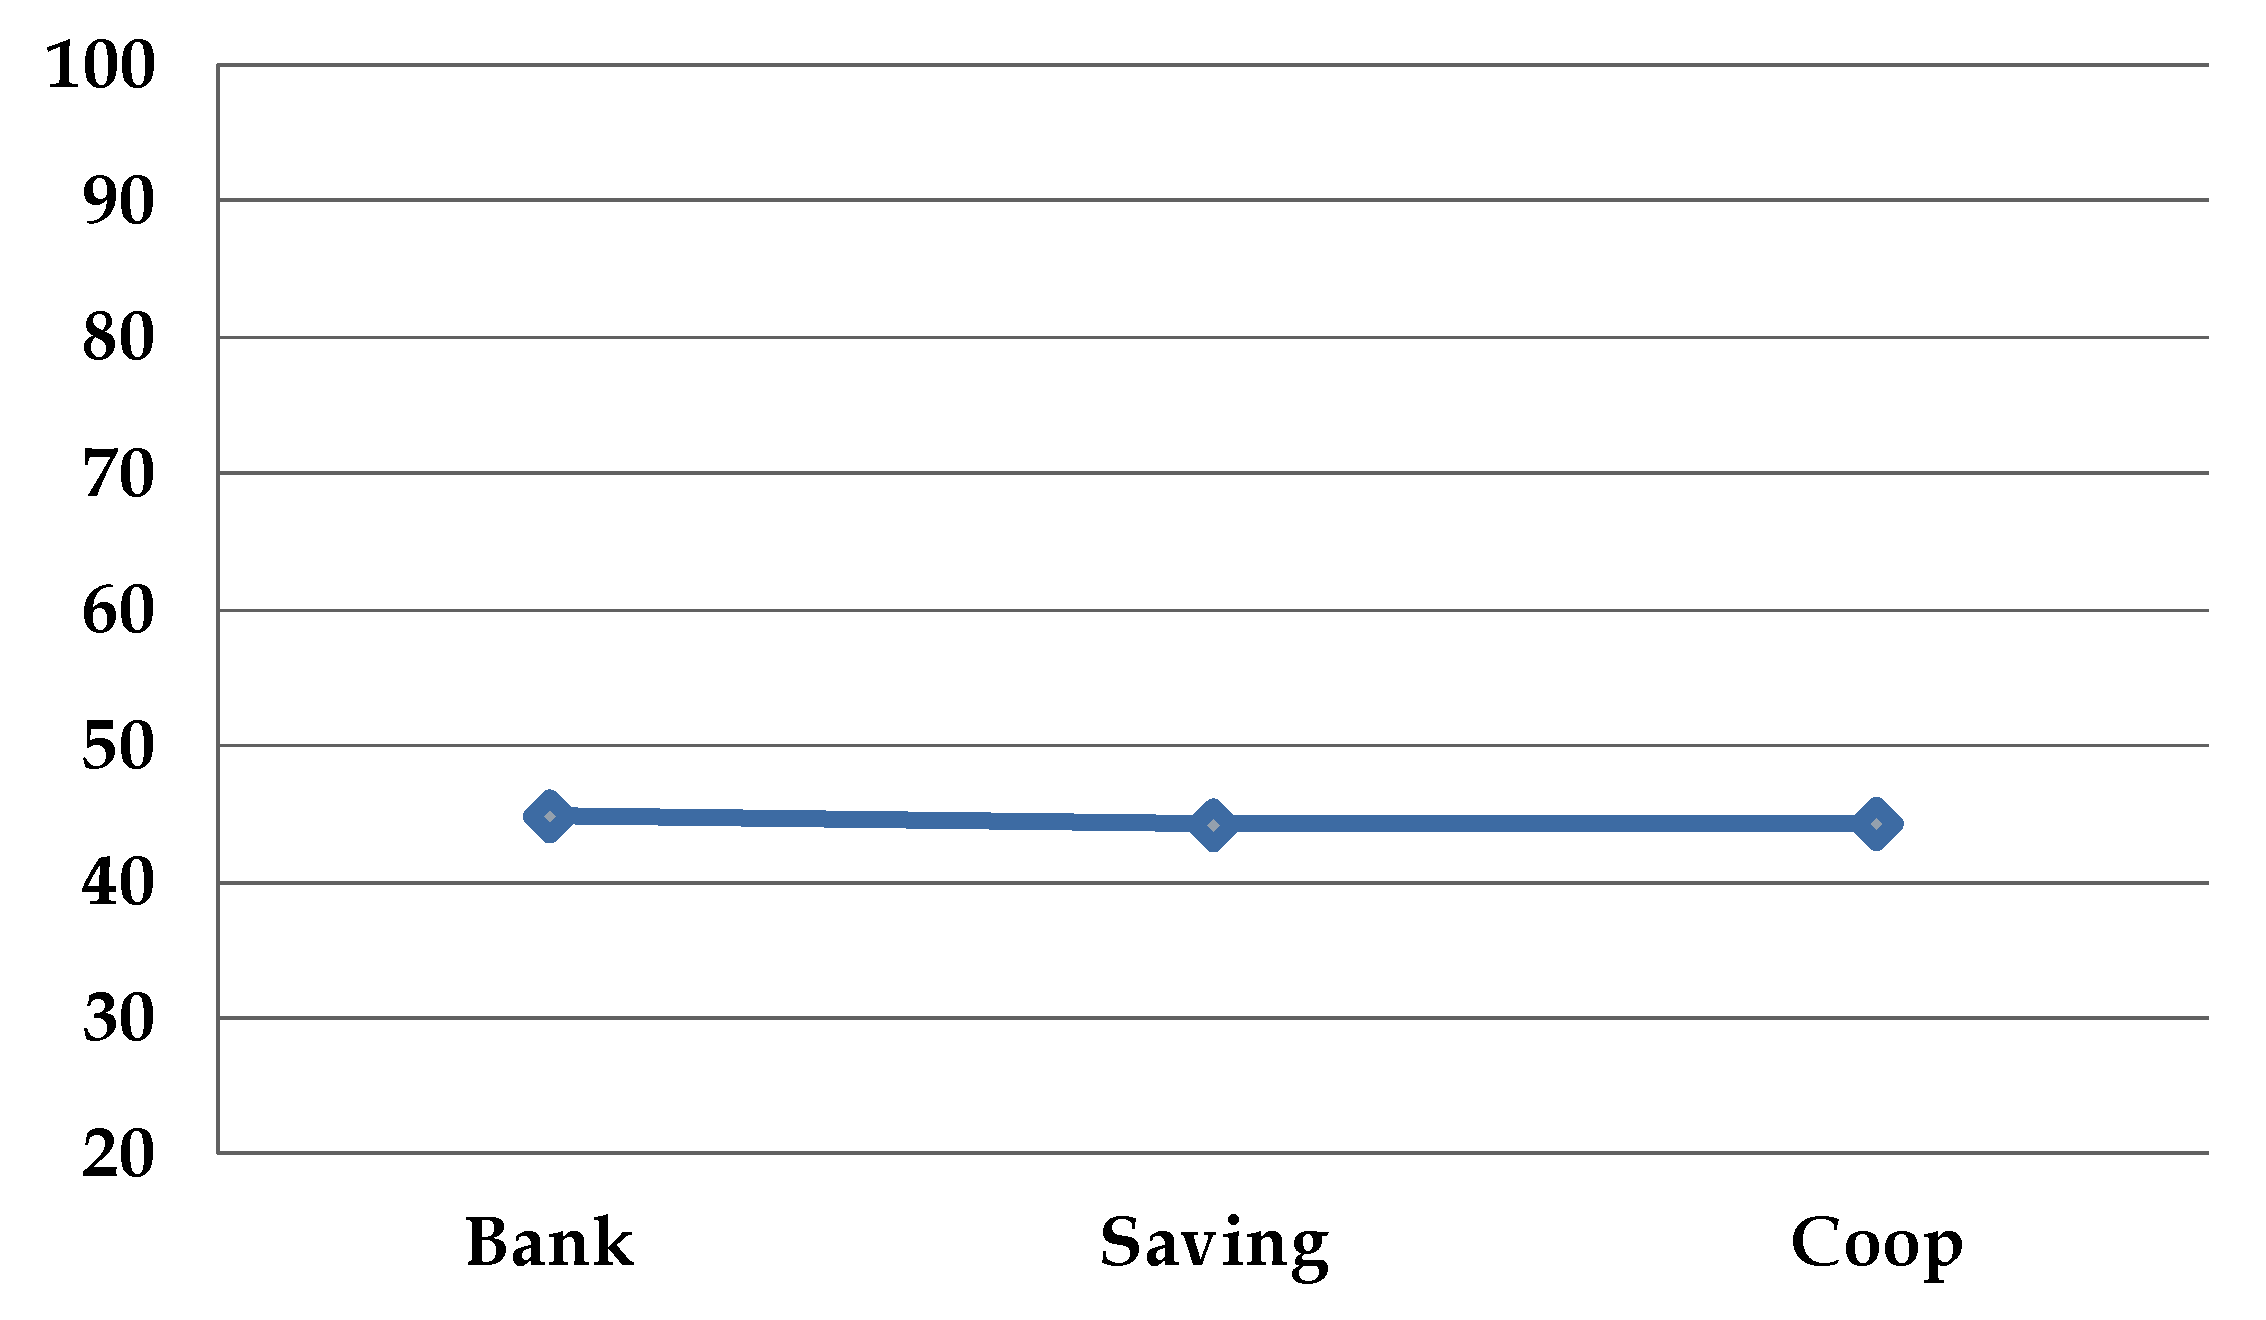
The analysis has compared the types of financial institutions with the aim of developing a unique bank efficiency model regardless of legal status. This means analysis reveals that there are no apparent differences across types in terms of economic efficiency measured by the profitability of financial entities (see Figure 2 to see the means in a visual form).
A multivariate analysis was conducted to determine both effects together, namely country (EU-15) and type (commercial banks, credit cooperatives, and savings banks). A Factorial Analysis of Variance was used whereby not only each factor is analyzed, but also their intersection (see Table 4).
We used Factorial Analysis of Variance, revealing whether the iteration between type and country influences the dependent variable (economic efficiency/profitability). When an interaction is significant, as in this case, attention should be paid to the iteration rather than the main effects. In this case, the iteration is significant, and therefore, country and type together have some influence on the profitability of the financial institution. See the Appendix A for the robustness independent test of each dependent variable. The model explains a significant variance regarding the dependent variable, ROA, albeit not individually, as type is not a good control variable, and does not make any distinction.
The same method was applied to social efficiency. Following the DEA analysis, in which the selected inputs and outputs are used (as explained in a previous section), we compared social efficiency means in accordance with the institutions’ country and type. The data used consisted of the population, thereby preventing sampling bias and data collection problems. Furthermore, the considerable size of the sample avoids normality problems. The DMUS are also higher than three times the number of inputs plus the number of outputs [57], thereby guaranteeing no sensitivity to specification. The efficiency surface is not sensitive to the sample, which means that in this case the frontier surface is robust. There is no autocorrelation (Durbin Watson is higher than 1.4: standing at more than 1.827), thereby avoiding the need to adjust or include more variables. The collinearity diagnosis establishes that the highest level of explanatory variable is 7.401, indicating no multicollinearity problem.
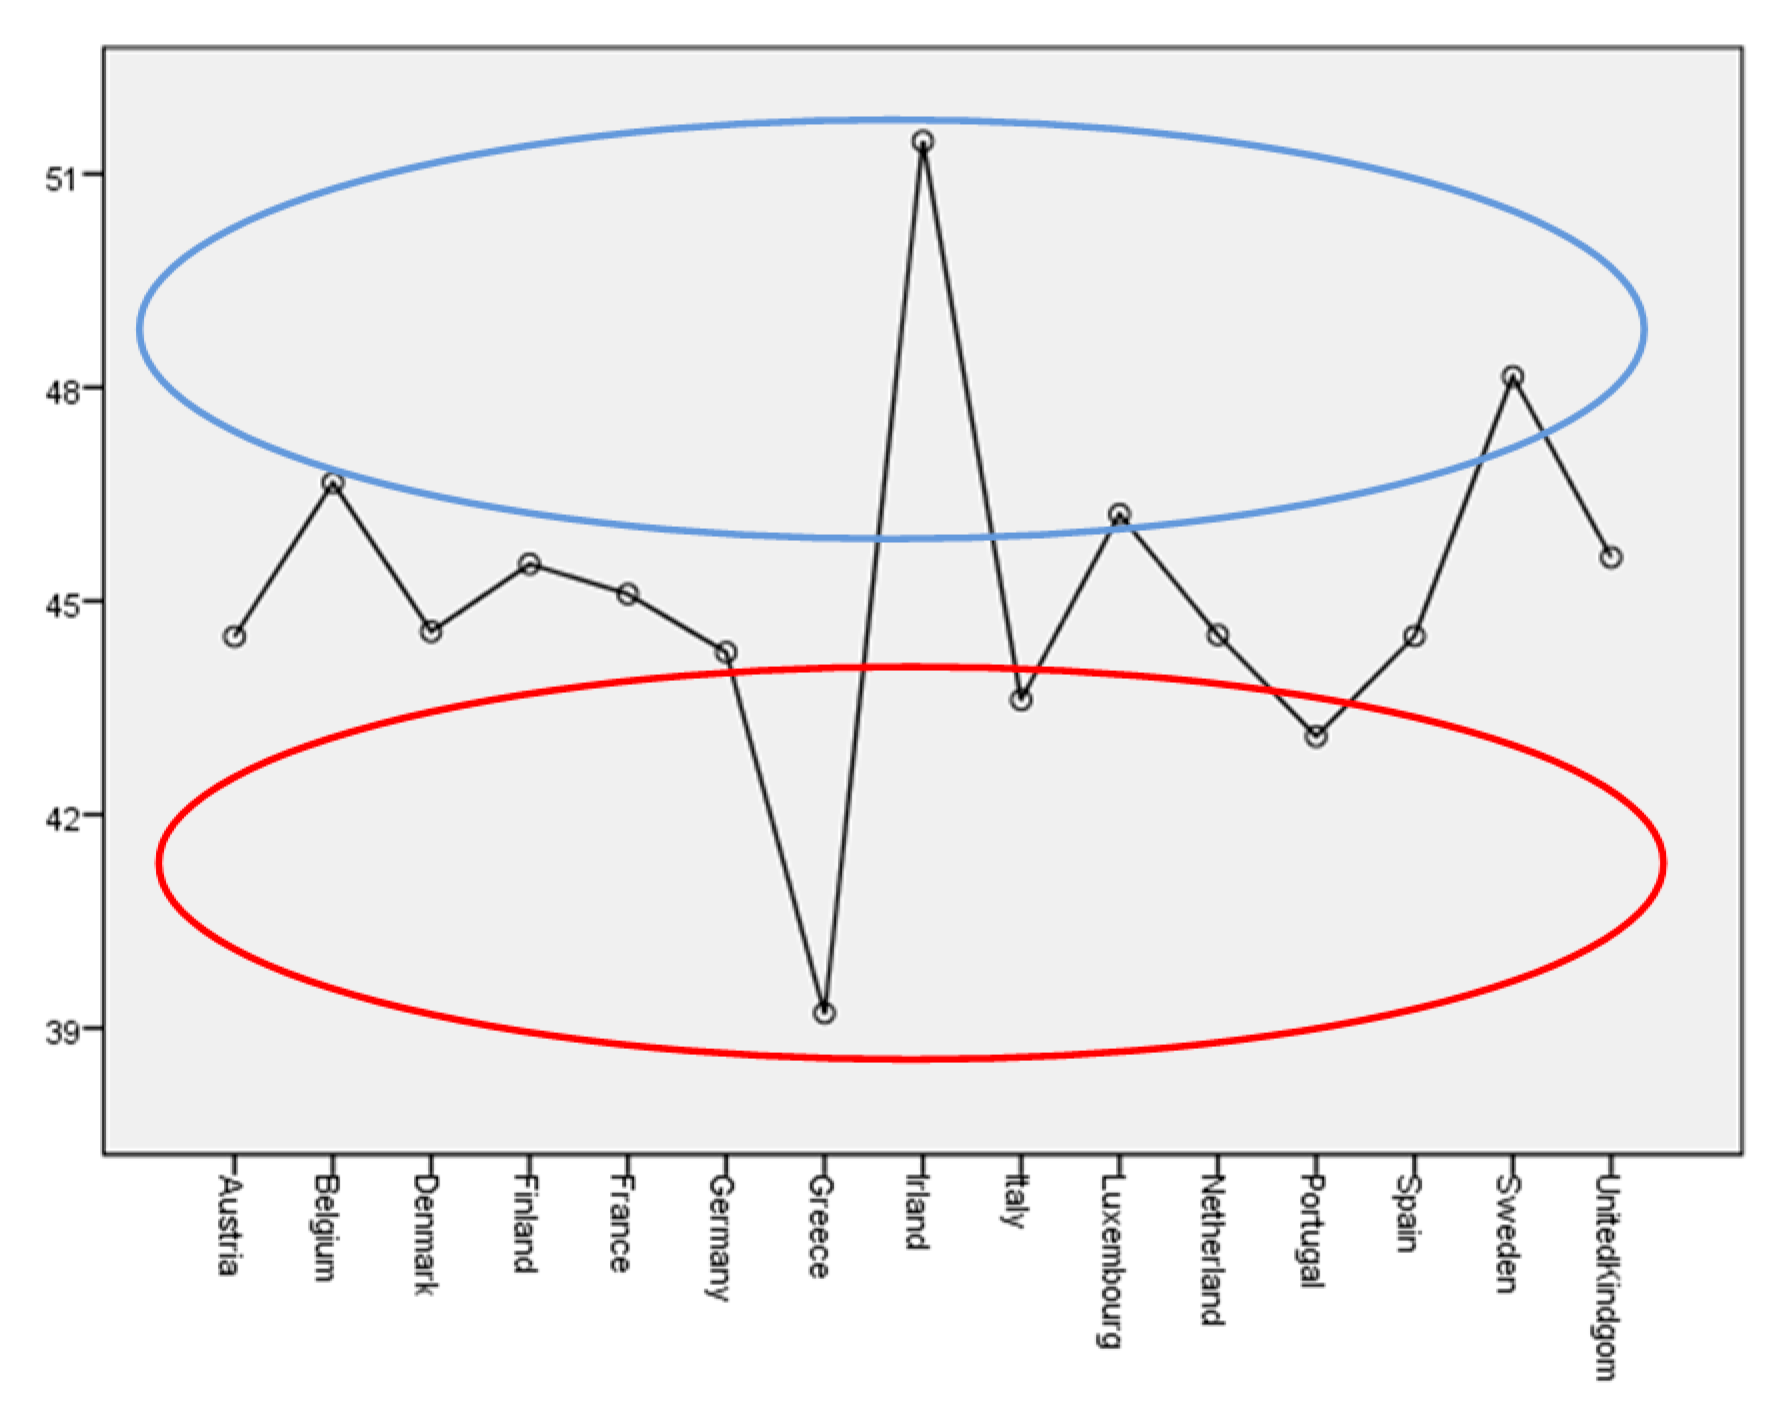
The European country effect using social efficiency as a dependent variable is shown in Figure 3, with no similarities in terms of social efficiency across those countries. They have shown visually the means of social efficiency for sustainability by country. Some countries display a high level of social efficiency, namely Austria, Belgium, Finland, France, Germany, Luxemburg, Portugal, Spain, and the UK. Other countries are not particularly efficient in social terms; examples include Denmark, Greece, and Italy.
The following figure (Figure 4) shows means by type. In general terms, commercial banks are more socially efficient than savings banks and cooperatives. We did not predict this in our hypothesis, but in this analysis at least, the initial results show the potentially social aspects of banks compared to theoretically more social typologies, such as savings banks and credit cooperatives. It should be remembered that the inputs and outputs used for developing social efficiency are based on market social value because there is no standardization of other aspects of social value in banking.
Concerning social efficiency, we carried out a multivariate analysis to establish both effects together: country and type. This involved a Factorial Analysis of Variance in which not only each factor is analyzed, but also the intersection between them (see Table 5).
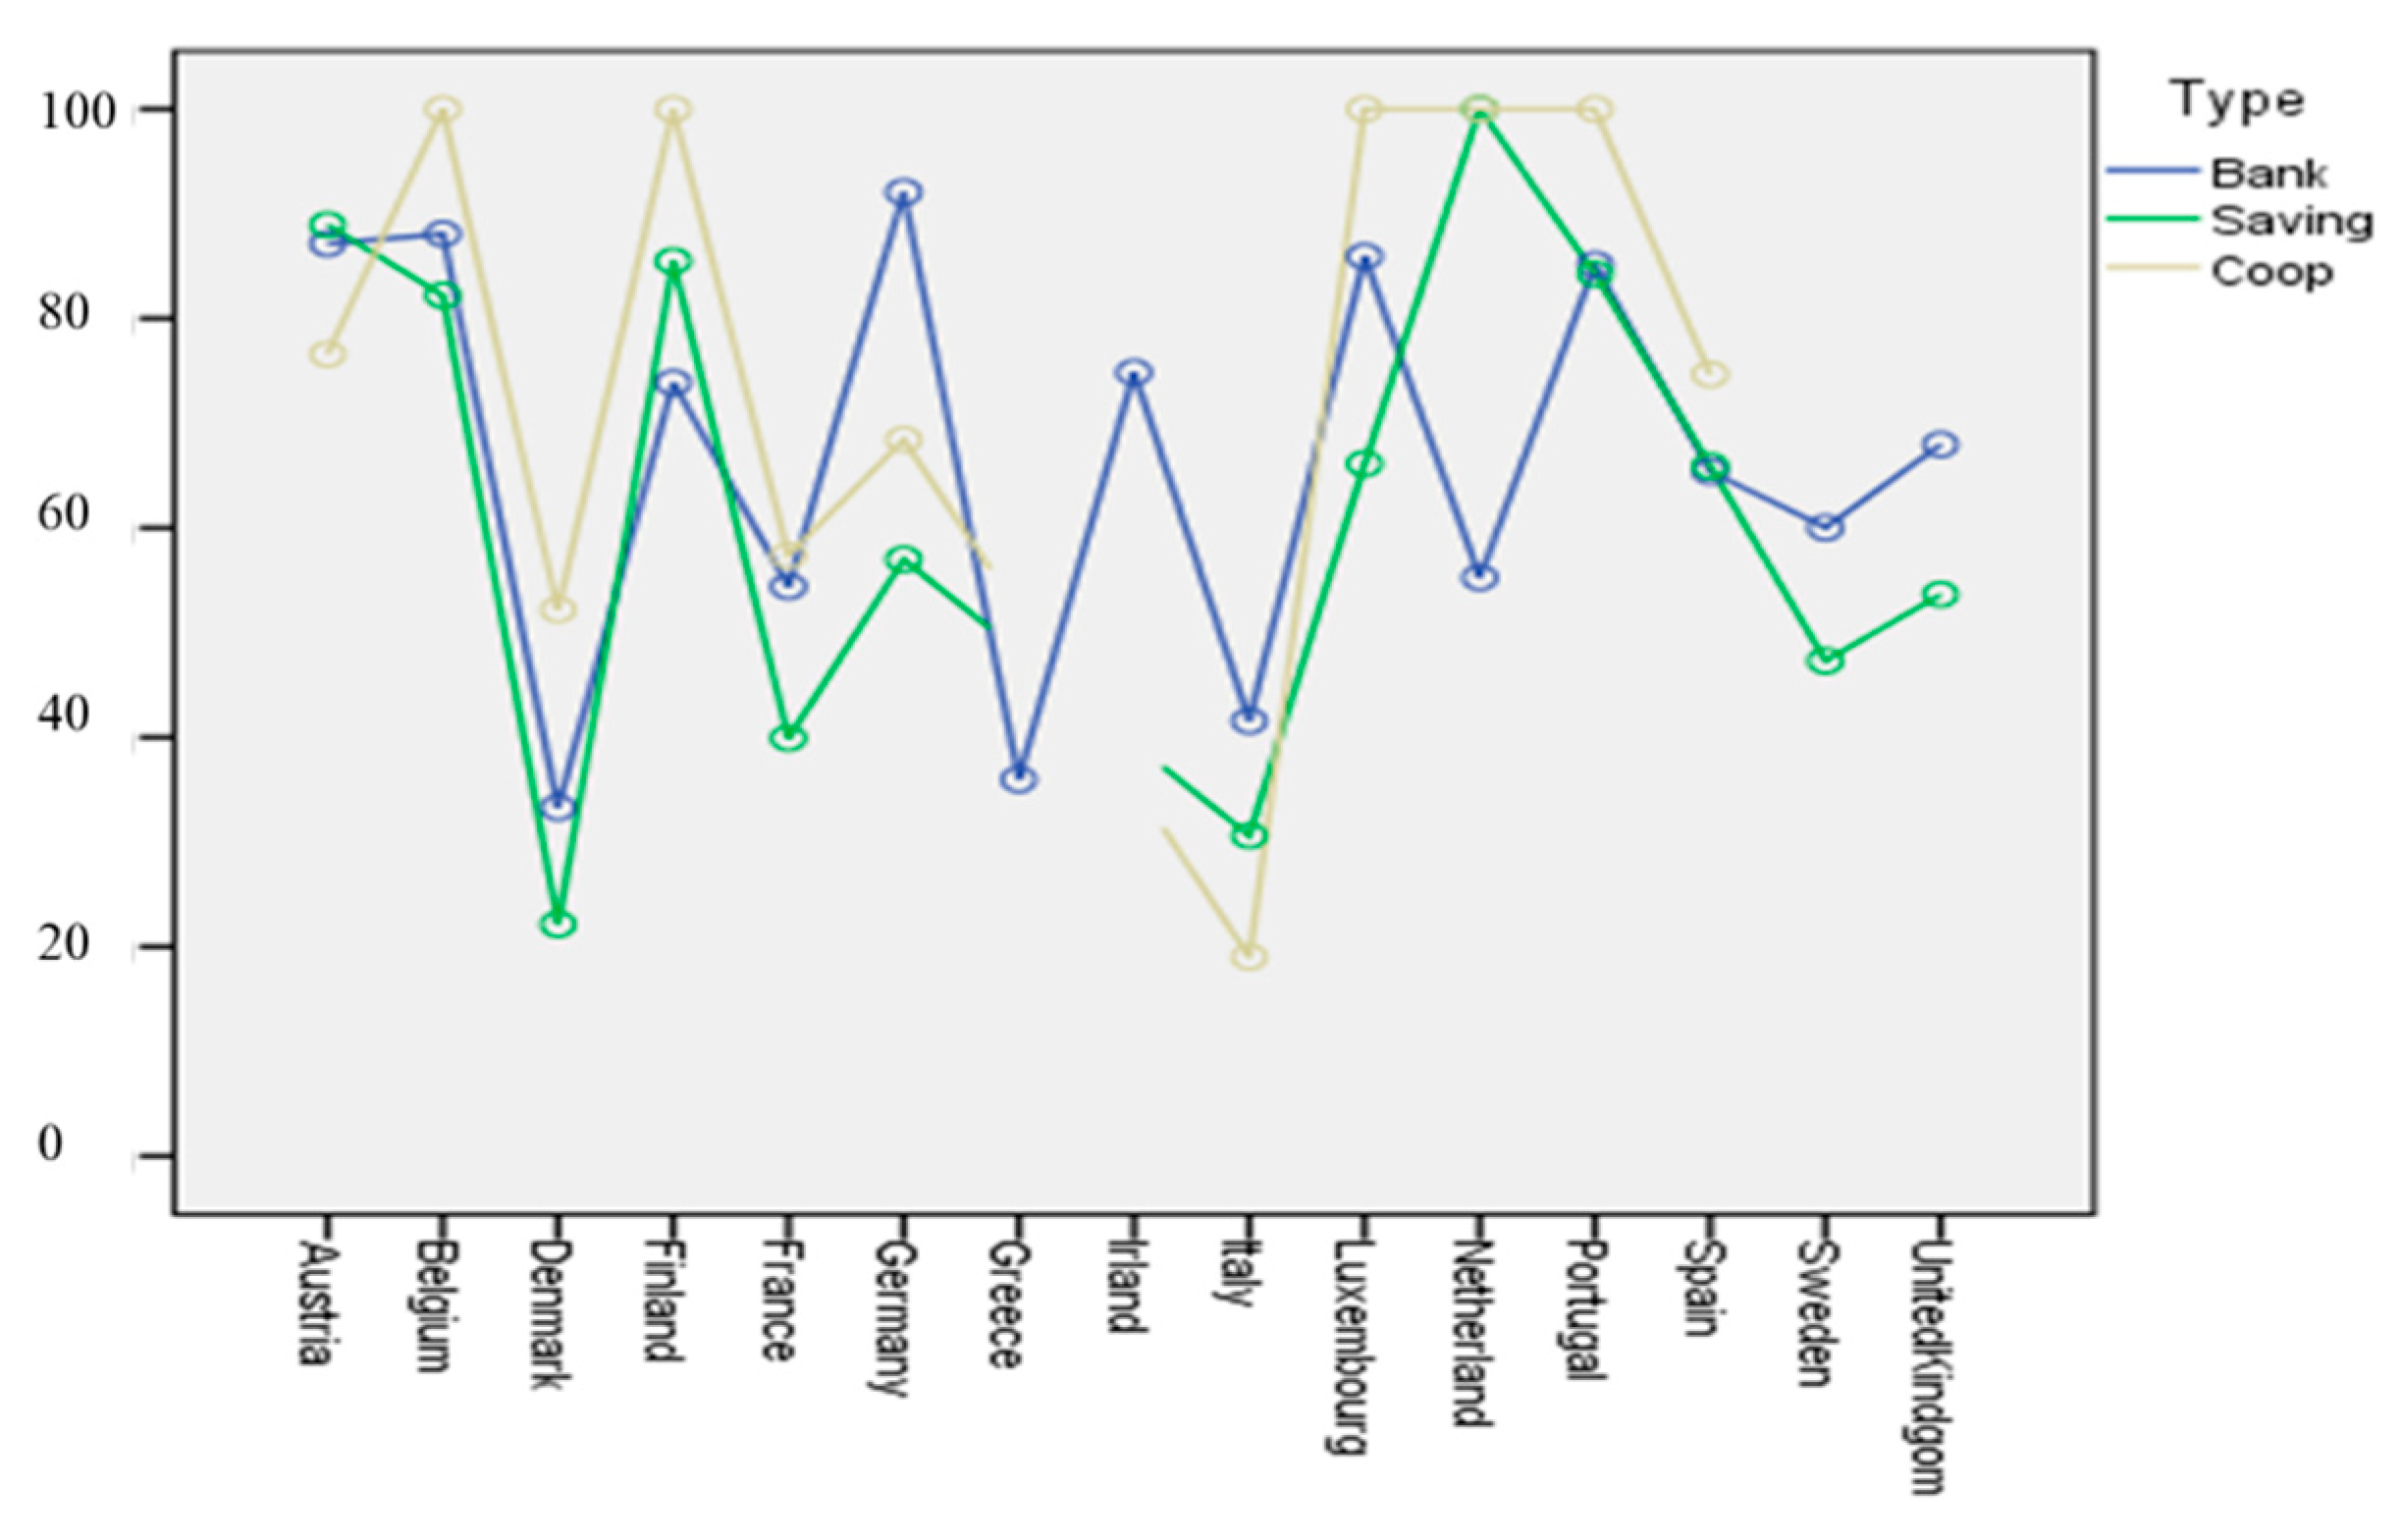
The iteration is significant, so this model explains a significant variance around social efficiency. However, country and type should not be considered separately: neither aspect is a good control variable due to the absence of differentiation. Therefore, country and type should be analyzed jointly. Figure 5 shows both variables together. It is shown visually the means of social efficiency for sustainability by type of financial entity and by country; both together.
4.2. Country Effect in Social Efficiency for Sustainability between Banks and Cooperatives
With the aim of analyzing the banking situation in each country, we conducted a comparative means analysis of social efficiency. We used three types, as shown in Table 6, which indicate those applied to banks and credit cooperatives. There are only two countries where those financial institutions differ in terms of social efficiency, namely, Germany and Italy, and the relationship is opposite to that expected (banks outperform credit cooperatives). In the other countries (France, Spain, Austria, Portugal, Belgium, Denmark, and Finland), no significant differences were observed, although in some the social efficiency of cooperatives is higher than in banks (France, Spain, Portugal, Belgium, Denmark, and Finland). Some EU-15 countries do not have enough financial entities in each type, namely Greece, Ireland, Luxembourg, Sweden, the Netherlands, and the United Kingdom.
To test the robustness of the previous results, we repeated the empirical research using a post-hoc test, such as Games-Howell [62], it was concluded that this post-hoc test is appropriate when there are doubts regarding the normality and homogeneity of variables. Similar results were achieved, as shown in Appendix B.
4.3. Analysis of Credit Cooperatives’ Social Efficiency Across European Countries
Some countries may share similarities in terms of the social efficiency of credit cooperatives. A multiple means comparison was conducted of nine European countries with sufficient data on the social efficiency of credit cooperatives. Table 7 shows those countries displaying significant differences.
4.4. Country Effect of Cooperative Bank Efficiency
We sought to identify whether there are any country variables that can act as independent variables related to the social efficiency of credit cooperatives in order to gain a deeper insight into the impact of the country effect on social efficiency (see Table 8).
Interestingly, there is a significant correlation between the social efficiency of credit cooperatives and welfare, both in global terms and in terms of the growth of European countries. However, in recent years growth has been much lower in Italy than in Germany, a trend that looks set to continue in the years to come (see current issues of the IMF World Outlook). There may be some intermediate variables, such as the corruption index, which affect both ratios: social efficiency and welfare—both static and dynamic.
4.5. Hypothesis Testing
Each hypothesis is constructed in accordance with the previous hypothesis test with the aim to understand the unforeseen results obtained, so-called constructing hypothesis by testing. But in this paper we have shown them together in chronological order to be coherent with uses and custom in publications.
Hypothesis 1 (H1).
Commercial banks have greater economic efficiency than credit cooperatives.
This is maintained the null hypothesis, because there are no significant differences between credit cooperatives and banks regarding economic efficiency.
Hypothesis 2 (H2).
Credit cooperatives have greater social efficiency than commercial banks in Europe.
The null hypothesis is not rejected; there are no significant differences among types of financial entities in terms of social efficiency.
Hypothesis 3 (H3).
Credit cooperatives have superior social efficiency than commercial banks in each European countries with credit cooperatives (France, Spain, Germany, Italy, Austria, Portugal, Belgium, Denmark, and Finland—subhypothesis).
There is some doubt regarding this relationship because there are no significant differences between credit cooperatives and banks regarding social efficiency in most European countries, and in those with significant differences; Germany and Italy, the banks are more socially efficient than credit cooperatives. So, the hypothesis is rejected.
Hypothesis 4 (H4).
There is a significant difference between European countries regarding the social efficiency of credit cooperatives.
The null hypothesis is rejected because there are differences between European countries in terms of the social efficiency of credit cooperatives (see Table 6).
Hypothesis 5.1 (H5.1).
Greater corruption level in the country is negatively correlate with the efficiency of cooperative banks.
Hypothesis 5.2 (H5.2).
There is a positive and significant correlation between the social efficiency of credit cooperatives and Wealth-to-Well-Being Coefficient across EU-15 countries.
Hypothesis 5.3 (H5.3).
There is a positive and significant correlation between the social efficiency of credit cooperatives and the Growth-to-Well-Being Coefficient across EU-15 countries.
In exploratory terms, we might contend that there is a relationship between these indexes (corruption index, wealth-to-well-being, and growth-to-well-being) and social efficiency in European countries. It is to be expected that social efficiency in those countries with less corruption will be higher, whilst those countries with high welfare coefficients will generate greater social efficiency. This indicates the possibility of linking social efficiency with specific country aspects; in other words, the connection between banking systems and country welfare (negatively or positively measured; corruption and well-being coefficients). Future research should be conducted to identify the mechanisms of the possible influence of these variables on efficiency, and to investigate whether, conversely, banking efficiency could also be a cause of greater welfare or lower levels of corruption. To confirm those aspect a regression analysis including the control variables will be necessary.
5. Discussion
This paper assesses the efficiency of banking in Europe in 2014 by using the boundary method, under European harmonization. The research focuses on social efficiency for sustainability. Specifically, we have paid attention to credit cooperatives because their strategy is based on social values for being sustainable. We have also endeavored to analyze the country-effect in Europe. We conclude that European banking is not yet harmonized. In the line of Lozano-Vivas et al. [24], we obtained evidence that allows us to encourage the development of policies towards the harmonization of the banking system in Europe, at least if we advocate a more social economy. The geographical effect and stakeholder participation based on the interest in responding to stakeholders have important implications for policymakers because one policy does not necessarily fit all. Instead, it is important to establish the determining factors that make possible a new vision of sustainability-oriented banking. We suggest certain country indexes as potential moderating variables that could establish the social efficiency in banking of some European countries; corruption and well-being index.
The paper’s contribution is relevant both to scholars and practitioners. Related to scholars, we first contribute to the literature through a preliminary exploration of how social efficiency could be developed, and how this concept establishes certain differences depending on the type of financial institution and the country (European). We introduce social efficiency for sustainability concept measured according to accounting-based data (market based social values). However, and such as second contribution the actual accounting-based data is not of a sufficiently high quality in order to show the whole social story of banking; more exhaustive data are needed to show how stakeholder interests are accomplished in banking. Cooperative banks have segregated more exhaustive internal information, a fact that could represent the most important social value of these entities; nevertheless, if they are not public and harmonized, they are not fully used. The benchmarking and improvement options and welfare for society is not possible. It is therefore necessary to develop proper social value measures for hybrid organizations that complement their economic and social results, such as credit cooperatives. Those new social indicators could be for example: first, all those costs with social function that do not have an economic interest (transactional); second, the social value generated for the stakeholders outside the market (nontransactional); and the third, the emotional value contributed to the people who interact in organizations (relational).
6. Conclusions, Limitations, and Future Research
Thus, the findings evidence that there is no tradeoff between social efficiency and economic efficiency, although we have not been able to confirm that there is a positive relationship between them. We contribute to the applicability of the stakeholder theory since one of its main obstacles is eliminated: the possible conflict between economic and social efficiency. We falsify the condition of necessity; which means that there does not always have to be opposition between social and economic efficiency. This evidences that social costs are a paradox; another new contribution from the banking sector in this case. However, we cannot confirm that there is correlation between economic efficiency and social efficiency as proposed by the shared-value perspective.
Finally, our research has a series of limitations. The social value metric based only on accounting-based data, the selected inputs and outputs that inform social efficiency are not accepted by all researchers due to the lack of literature on this topic. Our study is also limited to punctual data analysis, the situation in 2014. This is because our aim was to lay the foundations for a deeper longitudinal analysis in postcrisis Europe. Furthermore, the reporting bias is one of the most important limitations because of difficulties to obtaining population data about social for sustainability elements.
In addition to the aforementioned need for future social measures to demonstrate the social value of banks and a longitudinal analysis, a further area of research could consist of analyzing the country effect in relation to institution effect. This research could be conducted in line with the work of Belke et al. [14]. A comparative analysis of transnational financial institutions would enable us to determine the degree of stability of this efficiency in the various countries they operate in, or in contrast, whether they are highly differential. A further aspect for consideration could be the extent to which they correlate with the development indexes of these countries. Such analyses would enable us to determine the degree to which attempts to harmonize the European Banking Union are proving successful, as well as the role the possible country-based differentiation in efficiencies could play as a risk absorption mechanism. Despite being of major interest for the topic addressed here, the work should focus on non-cooperative banks, as transnationality is not a defining feature of cooperative credit institutions.
Author Contributions
All of the authors contributed significantly to the completion of this manuscript. L.S.-J. contributed to designing the theoretical verifications, collected and analyzed the data, prepared the manuscript and writing and editing the article, J.L.R. contributed to generating the research ideas and is responsible for analyzing and reviewing the data and writing the results of the article, while E.L. analyzes the data, supervise the results and contribution for society, and was involved in the discussion of results. All authors have read and approved the manuscript.
Funding
This research was funded by UPV/EHU (GIU15/10 and US17/24) and Management and the Governance of Financial Cooperatives-Sorbonne (Axe 2).
Acknowledgments
We would like to thank the two anonymous reviewers for their valuable comments.
Conflicts of Interest
The authors declare no conflict of interest.
Appendix A

Table A1.
Robustness Statistics: profitability and Social Efficiency.
| Test/Variable | Profitability | Social Efficiency | ||
|---|---|---|---|---|
| Type-Effect | Country-Effect | Type-Effect | Country-Effect | |
| Welch | 2.961 | 15.593 *** | 24.103 *** | 80.930 *** |
| Brown-Forsythe | 4.191 * | 5.752 *** | 22.994 *** | 68.427 *** |
Note: Significant at * p < 0.05; *** p < 0.001.
Appendix B
Table A2.
Games–Howell test.
| Social Efficiency: Type-Effect | p | 95% Confidence Level | ||||
| Games-Howell | Bank | Saving | 10.585 | 2.122 | 0.000 | 5.61 |
| Coop | 13.133 | 1.911 | 0.000 | 8.65 | ||
| Saving | Bank | −10.585 | 2.122 | 0.000 | −15.56 | |
| Coop | 2.549 | 1.790 | 0.329 | −1.65 | ||
| Coop | Bank | −13.133 | 1.911 | 0.000 | −17.62 | |
| Saving | −2.549 | 1.790 | 0.329 | −6.75 | ||
| Profitability: type-effect | p | 95% confidence level | ||||
| Games-Howell | Bank | Saving | 0.658 | 0.278 | 0.048 | 0.01 |
| Coop | 0.549 | 0.274 | 0.112 | −0.10 | ||
| Saving | Bank | −0.658 | 0.278 | 0.048 | −1.31 | |
| Coop | −0.109 | 0.102 | 0.536 | −0.35 | ||
| Coop | Bank | −0.549 | 0.274 | 0.112 | −1.19 | |
| Saving | 0.109 | 0.102 | 0.536 | −0.13 | ||
| Social Efficiency: country-effect | Mean Differences | Standard Error | p | |||
| Games-Howell Test. | F | p | ||||
| Austria | 0.925 | 0.402 | Bank-Saving | −1.792 | 8.943 | 0.978 |
| Coop-Bank | 10.556 | 9.519 | 0.516 | |||
| Coop-Saving | 12.347 | 11.238 | 0.522 | |||
| Belgium | 0.374 | 0.693 | Bank-Saving | 5.884 | 18.644 | 0.948 |
| Coop-Bank | −11.916 | 5.545 | 0.113 | |||
| Coop-Saving | 17.800 | 17.800 | 0.645 | |||
| Denmark | 3.526 | 0.036 | Bank-Saving | 11.128 | 6.977 | 0.260 |
| Coop-Bank | −18.907 | 18.316 | 0.580 | |||
| Coop-Saving | −30.035 | 17.618 | 0.274 | |||
| Finland | 0.797 | 0.461 | Bank-Saving | −11.607 | 12.772 | 0.640 |
| Coop-Bank | −26.120 | 10.002 | 0.055 | |||
| Coop-Saving | 14.513 | 7.942 | 0.199 | |||
| France | 1.968 | 0.143 | Bank-Saving | 14.484 | 6.852 | 0.101 |
| Coop-Bank | −2.968 | 5.655 | 0.859 | |||
| Coop-Saving | 17.452 * | 6.852 | 0.039 | |||
| Germany | 38.708 | 0.000 | Bank-Saving | 35.071 * | 2.751 | 0.000 |
| Coop-Bank | 23.639 * | 2.473 | 0.000 | |||
| Coop-Saving | 11.433 * | 2.189 | 0.000 | |||
| Italy | 24.645 | 0.000 | Bank-Saving | 10.946 | 6.649 | 0.233 |
| Coop-Bank | 22.540 * | 4.635 | 0.000 | |||
| Coop-Saving | −11.594 | 5.028 | 0.069 | |||
| Luxemburg | 0.601 | 0.552 | ||||
| Netherland | 1.197 | 0.322 | ||||
| Portugal | 0.405 | 0.668 | Bank-Saving | 0.903 | 8.666 | 0.994 |
| Coop-Bank | −14.837 | 7.985 | 0.187 | |||
| Coop-Saving | −15.739 * | 3.367 | 0.000 | |||
| Spain | 0.566 | 0.570 | Bank-Saving | −0.514 | 12.426 | 0.999 |
| Coop-Bank | −9.270 | 9.205 | 0.577 | |||
| Coop-Saving | −8.756 | 11.474 | 0.729 | |||
| Sweden | 1.873 | 0.176 | ||||
| United Kingdom | 0.148 | 0.702 | ||||
| When there are less than two entities is not possible to apply this test. | ||||||
Note: Significant at * p < 0.05.
References
- Ayadi, R.; Groen, W.P.D. Stress Testing, Transparency, and Uncertainty in European Banking. Oxf. Handb. Econ. Inst. Transpar. 2014. [Google Scholar] [CrossRef]
- San-Jose, L.; Retolaza, J.L.; Torres Pruñonosa, J. Efficiency in Spanish banking: A multistakeholder approach analysis. J. Int. Financ. Mark. Inst. Money 2014, 32, 240–255. [Google Scholar] [CrossRef] [Green Version]
- Ayadi, R.; Llewellyn, D.T.; Schmidt, R.H.; Arbak, E.; De Groen, W.P. Investigating Diversity in the Banking Sector in Europe: Key Developments, Performance and Role of Cooperative Banks; CEPS: Brussels, Belgium, 2010; ISBN 978-94-6138-042-5. [Google Scholar]
- Berger, A.N.; Humphrey, D.B. Efficiency of financial institutions: International survey and directions for future research. Eur. J. Oper. Res. 1997, 98, 175–212. [Google Scholar] [CrossRef]
- Fiordelisi, F.; Marques-Ibanez, D.; Molyneux, P. Efficiency and risk in European banking. J. Bank. Financ. 2011, 35, 1315–1326. [Google Scholar] [CrossRef] [Green Version]
- Ramly, Z.; Chan, S.-G.; Mustapha, M.Z.; Sapiei, N.S. Women on boards and bank efficiency in ASEAN-5: The moderating role of the independent directors. Rev. Manag. Sci. 2017, 11, 225–250. [Google Scholar] [CrossRef]
- Manetti, G.; Magnoli, L. Mutual and social efficiency of italian co-operative banks: An empirical analysis. Ann. Public Coop. Econ. 2013, 84, 289–308. [Google Scholar] [CrossRef]
- Lebovics, M.; Hermes, N.; Hudon, M. Are Financial and Social Efficiency Mutually Exclusive? A Case Study of Vietnamese Microfinance Institutions. Ann. Public Coop. Econ. 2016, 87, 55–77. [Google Scholar] [CrossRef]
- Pava, M.L.; Krausz, J. The association between corporate social-responsibility and financial performance: The paradox of social cost. J. Bus. Ethics 1996, 15, 321–357. [Google Scholar] [CrossRef]
- Porter, M.E.; Kramer, M.R. Creating Shared Value. How to reinvent capitalism—And unleash a wave of innovation and growth. Harv. Bus. Rev. 2011, 89, 62–77. [Google Scholar]
- Freeman, R.E. Strategic Management: A Stakeholder Approach; Pitman: Boston, MA, USA, 1984; ISBN 978-0-273-01913-8. [Google Scholar]
- Elkington, J. Partnerships from cannibals with forks: The triple bottom line of 21st-century business. Environ. Qual. Manag. 1998, 8, 31–51. [Google Scholar] [CrossRef]
- Fiordelisi, F. Shareholder value efficiency in European banking. J. Bank. Financ. 2007, 31, 2151–2171. [Google Scholar] [CrossRef]
- Belke, A.; Haskamp, U.; Setzer, R. Regional bank efficiency and its effect on regional growth in “normal” and “bad” times. Econ. Model. 2016, 58, 413–426. [Google Scholar] [CrossRef] [Green Version]
- Wijesiri, M.; Martínez-Campillo, A.; Wanke, P. Is there a trade-off between social and financial performance of public commercial banks in India? A multi-activity DEA model with shared inputs and undesirable outputs. Rev. Manag. Sci. 2017, 1–26. [Google Scholar] [CrossRef]
- Elkington, J. Towards the sustainable corporation: Win-win-win business strategies for sustainable development. Calif. Manag. Rev. Berkeley 1994, 36, 90. [Google Scholar] [CrossRef]
- Tsionas, E.G.; Mamatzakis, E.C. Adjustment costs in the technical efficiency: An application to global banking. Eur. J. Oper. Res. 2017, 256, 640–649. [Google Scholar] [CrossRef]
- Gutierrez-Goiria, J.; San-Jose, L.; Retolaza, J.L. Social Efficiency in Microfinance Institutions: Identifying How to Improve It. J. Int. Dev. 2017, 29, 259–280. [Google Scholar] [CrossRef]
- Bibi, U.; Balli, H.O.; Matthews, C.D.; Tripe, D.W.L. Impact of gender and governance on microfinance efficiency. J. Int. Financ. Mark. Inst. Money 2018, 53, 307–319. [Google Scholar] [CrossRef]
- Chang, H.F. A Liberal Theory of Social Welfare: Fairness, Utility, and the Pareto Principle. Yale Law J. 2000, 110, 173–235. [Google Scholar] [CrossRef]
- Casu, B.; Molyneux, P. A comparative study of efficiency in European banking. Appl. Econ. 2003, 35, 1865–1876. [Google Scholar] [CrossRef] [Green Version]
- Gorton, G.; Pennacchi, G. Financial Intermediaries and Liquidity Creation. J. Financ. 1990, 45, 49–71. [Google Scholar] [CrossRef]
- Chortareas, G.E.; Girardone, C.; Ventouri, A. Financial freedom and bank efficiency: Evidence from the European Union. J. Bank. Financ. 2013, 37, 1223–1231. [Google Scholar] [CrossRef]
- Lozano-Vivas, A.; Pastor, J.T.; Pastor, J.M. An Efficiency Comparison of European Banking Systems Operating under Different Environmental Conditions. J. Product. Anal. 2002, 18, 59–77. [Google Scholar] [CrossRef]
- Galema, R.; Koetter, M. European Bank Efficiency and Performance: The Effects of Supranational Versus National Bank Supervision. In The Palgrave Handbook of European Banking; Palgrave Macmillan: London, UK, 2016; pp. 257–292. ISBN 978-1-137-52143-9. [Google Scholar]
- Fijałkowska, J.; Zyznarska-Dworczak, B.; Garsztka, P.; Fijałkowska, J.; Zyznarska-Dworczak, B.; Garsztka, P. Corporate Social-Environmental Performance versus Financial Performance of Banks in Central and Eastern European Countries. Sustainability 2018, 10, 772. [Google Scholar] [CrossRef]
- Alam, N.; Rizvi, S.A.R. Empirical Research in Islamic Banking: Past, Present, and Future. In Islamic Banking; Palgrave CIBFR Studies in Islamic Finance; Palgrave Macmillan: Cham, Switzerland, 2017; pp. 1–13. ISBN 978-3-319-45909-7. [Google Scholar]
- Widiarto, I.; Emrouznejad, A. Social and financial efficiency of Islamic microfinance institutions: A Data Envelopment Analysis application. Socioecon. Plan. Sci. 2015, 50, 1–17. [Google Scholar] [CrossRef] [Green Version]
- Johnes, J.; Izzeldin, M.; Pappas, V.; Tsionas, M. Measuring Efficiency Convergence in Islamic and Conventional Banks: Cross-Country Evidence. 2017. Available online: https://ssrn.com/abstract=2960018 (accessed on 30 August 2018).
- Tabak, B.M.; Miranda, R.B.; Fazio, D.M. A geographically weighted approach to measuring efficiency in panel data: The case of US saving banks. J. Bank. Financ. 2013, 37, 3747–3756. [Google Scholar] [CrossRef]
- Cuesta, R.A.; Orea, L. Mergers and technical efficiency in Spanish savings banks: A stochastic distance function approach. J. Bank. Financ. 2002, 26, 2231–2247. [Google Scholar] [CrossRef]
- Lang, G.; Welzel, P. Mergers Among German Cooperative Banks: A Panel-based Stochastic Frontier Analysis. Small Bus. Econ. 1999, 13, 273–286. [Google Scholar] [CrossRef]
- Bos, J.W.B.; Kool, C.J.M. Bank efficiency: The role of bank strategy and local market conditions. J. Bank. Finance 2006, 30, 1953–1974. [Google Scholar] [CrossRef] [Green Version]
- Minto, A. The spirit of the law over its letter: The role of culture and social norms in shielding cooperative banks from systemic shocks. Law Financ. Mark. Rev. 2016, 10, 16–26. [Google Scholar] [CrossRef]
- Bal, H.; Gölcükcü, A.; Bal, H.; Gölcükcü, A. Data Envelopment Analysis: An Application to Turkish Banking Industry. Math. Comput. Appl. 2002, 7, 65–72. [Google Scholar] [CrossRef]
- Freeman, R.E. The New Story of Business: Towards a More Responsible Capitalism. Bus. Soc. Rev. 2017, 122, 449–465. [Google Scholar] [CrossRef]
- Freeman, R.E.; Ginena, K. Rethinking the Purpose of the Corporation: Challenges from Stakeholder Theory. Notizie di Politeia 2015, 31, 9–18. [Google Scholar]
- San-Jose, L.; Retolaza, J.L.; Freeman, R.E. Stakeholder Engagement at Extanobe: A Case Study of the New Story of Business. In Stakeholder Engagement: Clinical Research Cases; Issues in Business Ethics; Springer: Cham, Switzerland, 2017; pp. 285–310. ISBN 978-3-319-62784-7. [Google Scholar]
- Gray, R. Rob Social, environmental and sustainability reporting and organisational value creation? Whose value? Whose creation? Account. Audit. Account. J. 2006, 19, 793–819. [Google Scholar] [CrossRef]
- Amonarriz, C.A.; Landart, C.I.; Cantín, L.N. Cooperatives proactive social responsibility in crisis time: How to behave? REVESCO Rev. Estud. Coop. 2017. [Google Scholar] [CrossRef]
- Richez-Battesti, N.; Leseul, G. Cooperative Banks in France: Emergence, Mutations and Issues. In Credit Cooperative Institutions in European Countries; Contributions to Economics; Springer: Cham, Switzerland, 2016; pp. 55–81. ISBN 978-3-319-28783-6. [Google Scholar]
- Demsetz, H. Toward a Theory of Property Rights. In Classic Papers in Natural Resource Economics; Palgrave Macmillan: London, UK, 1974; pp. 163–177. ISBN 978-1-349-41750-6. [Google Scholar] [Green Version]
- Jensen, M.C.; Meckling, W.H. Theory of the firm: Managerial behavior, agency costs and ownership structure. J. Financ. Econ. 1976, 3, 305–360. [Google Scholar] [CrossRef] [Green Version]
- Galbraith, J.K. The New Industrial State; Princeton University Press: Princeton, NJ, USA, 2015; ISBN 978-1-4008-7318-0. [Google Scholar]
- Jensen, M.C. Value Maximization, Stakeholder Theory, and the Corporate Objective Function. Bus. Ethics Q. 2002, 12, 235–256. [Google Scholar] [CrossRef]
- Parmar, B.L.; Keevil, A.; Wicks, A.C. People and Profits: The Impact of Corporate Objectives on Employees’ Need Satisfaction at Work. J. Bus. Ethics 2017. [Google Scholar] [CrossRef]
- Asmild, M.; Zhu, M. Controlling for the use of extreme weights in bank efficiency assessments during the financial crisis. Eur. J. Oper. Res. 2016, 251, 999–1015. [Google Scholar] [CrossRef] [Green Version]
- Hughes, J.P.; Lang, W.W.; Mester, L.J.; Moon, C.-G.; Pagano, M.S. Do bankers sacrifice value to build empires? Managerial incentives, industry consolidation, and financial performance. J. Bank. Financ. 2003, 27, 417–447. [Google Scholar] [CrossRef] [Green Version]
- Luo, Y.; Tanna, S.; De Vita, G. Financial openness, risk and bank efficiency: Cross-country evidence. J. Financ. Stable 2016, 24, 132–148. [Google Scholar] [CrossRef]
- Reckwitz, A. Toward a Theory of Social Practices: A Development in Culturalist Theorizing. Eur. J. Soc. Theory 2002, 5, 243–263. [Google Scholar] [CrossRef]
- Freeman, R.E.; Harrison, J.S.; Wicks, A.C.; Parmar, B.L.; Colle, S.D. Stakeholder Theory: The State of the Art; Cambridge University Press: Cambridge, MA, USA, 2010; ISBN 978-1-139-48411-4. [Google Scholar]
- Kalmi, P. The Role of Stakeholder Banks in the European Banking Sector. In Institutional Diversity in Banking; Palgrave Macmillan Studies in Banking and Financial Institutions; Palgrave Macmillan: Cham, Switzerland, 2017; pp. 33–50. ISBN 978-3-319-42072-1. [Google Scholar]
- Monzon, J.L.; Chaves, R. The European social Economy: Concept and dimensions of the third sector. Ann. Public Coop. Econ. 2008, 79, 549–577. [Google Scholar] [CrossRef]
- Transparency International. Corruption Perceptions Index-Transparency 278 International’s Corruption. Available online: https://www.transparency.org (accessed on 5 September 2018).
- Boston Consulting Group. Welfare data (Wealth-279 to-Well-Being Coefficient and Growth-to-Well-Being Coefficient, as Static and Improvement 280 Coefficient of Welfare). Available online: https://www.bcg.com/ (accessed on 1 July 2018).
- Mauro, P. Corruption and Growth. Q. J. Econ. 1995, 110, 681–712. [Google Scholar] [CrossRef]
- Stolp, C. Strengths and weaknesses of data envelopment analysis: An urban and regional perspective. Comput. Environ. Urban Syst. 1990, 14, 103–116. [Google Scholar] [CrossRef]
- McGuire, J.B.; Sundgren, A.; Schneeweis, T. Corporate Social Responsibility and Firm Financial Performance. Acad. Manag. J. 1988, 31, 854–872. [Google Scholar] [CrossRef]
- Preston, L.E.; O’Bannon, D.P. The Corporate Social-Financial Performance Relationship: A Typology and Analysis. Bus. Soc. 1997, 36, 419–429. [Google Scholar] [CrossRef]
- Cowton, C.J.; San-Jose, L. On the Ethics of Trade Credit: Understanding Good Payment Practice in the Supply Chain. J. Bus. Ethics 2017, 140, 673–685. [Google Scholar] [CrossRef]
- Gutiérrez-Nieto, B.; Serrano-Cinca, C.; Molinero, C.M. Social efficiency in microfinance institutions. J. Oper. Res. Soc. 2009, 60, 104–119. [Google Scholar] [CrossRef] [Green Version]
- Everitt, P.D.; Landau, S.; Everitt, B.S.; Landau, S.L.; Everitt, D. A Handbook of Statistical Analyses Using SPSS; Taylor & Francis: Abingdon, UK, 2004; ISBN 978-1-58488-369-2. [Google Scholar]
Figure 1.
Profitability (ROA) analysis in European Countries: profile graph.

Figure 2.
Economic Efficiency/Profitability: analysis by type of financial institution.

Figure 3.
Social Efficiency for sustainability analysis in European Countries: profile graph.

Figure 4.
Social Efficiency for sustainability: analysis by type of financial institution.

Figure 5.
Country and type effect for social efficiency for sustainability: profile graph.

Table 1.
Descriptive data of variables by country and type.
| COUNTRY | TYPE | N | Equity | Deposits | Asset | Loan | Labor | Taxes | Risk | Profit |
|---|---|---|---|---|---|---|---|---|---|---|
| France | Banks | 79 | 11,826 | 74,306 | 272,855 | 97,700 | 4956 | 362 | 1450 | 773 |
| Savings | 18 | 5639 | 43,552 | 71,487 | 39,844 | 1717 | 156 | 318 | 327 | |
| Cooperatives | 65 | 20,790 | 114,126 | 378,549 | 141,292 | 7435 | 493 | 1235 | 1133 | |
| Spain | Banks | 18 | 55,545 | 365,233 | 761,873 | 427,455 | 22,327 | 1306 | 10,418 | 3527 |
| Savings | 14 | 9520 | 83,080 | 155,008 | 78,666 | 3196 | 203 | 5467 | 354 | |
| Cooperatives | 51 | 516 | 4887 | 6795 | 3563 | 209 | 4 | 71 | 25 | |
| Germany | Banks | 99 | 7438 | 60,928 | 149,962 | 53,575 | 2532 | 127 | 598 | 254 |
| Savings | 503 | 3114 | 24,988 | 42,113 | 23,894 | 1550 | 85 | 97 | 100 | |
| Cooperatives | 909 | 394 | 3167 | 5847 | 2837 | 187 | 13 | 25 | 22 | |
| Italy | Banks | 66 | 9488 | 62,522 | 148,561 | 81,743 | 4879 | 266 | 5205 | 380 |
| Savings | 31 | 2153 | 15,631 | 50,069 | 40,795 | 1115 | 71 | 1499 | 52 | |
| Cooperatives | 382 | 785 | 4247 | 9715 | 5762 | 309 | 6 | 479 | 14 | |
| Austria | Banks | 36 | 4210 | 30,123 | 56,079 | 32,972 | 3021 | 111 | 717 | 282 |
| Savings | 14 | 910 | 8114 | 13,098 | 8878 | 403 | 15 | 130 | 49 | |
| Cooperatives | 20 | 2631 | 14,004 | 37,343 | 18,372 | 914 | 26 | 541 | 29 | |
| Portugal | Banks | 15 | 5873 | 48,710 | 82,291 | 51,937 | 3235 | 87 | 18 | 25 |
| Savings | 79 | 820 | 11,514 | 13,060 | 5568 | 115 | 1 | 1 | 2 | |
| Cooperatives | 3 | 1918 | 16,340 | 23,189 | 11,100 | 1451 | 60 | 14 | 44 | |
| Belgium | Banks | 16 | 10,705 | 97919 | 184,819 | 92,915 | 3196 | 331 | 2574 | 979 |
| Savings | 3 | 2761 | 46,869 | 55,820 | 37,353 | 269 | 67 | 145 | 288 | |
| Cooperatives | 2 | 1004 | 6282 | 7499 | 4283 | 39 | 0 | 0 | 87 | |
| Denmark | Banks | 26 | 7709 | 36,334 | 159,356 | 92,389 | 1616 | 131 | 1449 | 362 |
| Savings | 29 | 287 | 1769 | 2310 | 1291 | 116 | 2 | 127 | 14 | |
| Cooperatives | 7 | 215 | 1107 | 1535 | 935 | 72 | 0 | 112 | 7 | |
| Finland | Banks | 13 | 6085 | 33,763 | 157,186 | 43,221 | 1133 | 144 | 331 | 581 |
| Savings | 14 | 158 | 1313 | 1807 | 1306 | 49 | 3 | 1 | 11 | |
| Cooperatives | 2 | 26,512 | 148,147 | 414,478 | 228,474 | 8930 | 1036 | 0 | 2649 |
Table 2.
Inputs and outputs of Social and Economic (Profitability) Efficiencies.
| INPUTS | OUTPUTS | |
|---|---|---|
| Social Efficiency for sustainability (SE) Definition: it is the balance between resources (input) and generation of value (outputs) for the society with those resources (inputs), being sustainable socially. | Equity (E) Deposits (D) | Customer Loans (CC) Labor (L) * Social Contribution/Taxes (SCT) Risk (R) ** |
| Economic Efficiency (EE) Profitability Definition: it is the balance between the resources (assets) used to obtain the net profit. | Total Assets (TA) | Net Profit (P) *** |
Notes: * the labor (L) is measure by headcounts. ** risk (R) is measured by obtained as the inverse of the sum of the contingent risks and commitments recognized by the different institutions. *** It is the benefit after taxes. The other variables are from the book accounts of banks without transformations.
Table 3.
Data Envelopment Analysis (DEA) mathematical model for social efficiency.
| Variables/Data | Equation |
|---|---|
| j = number of DMUs θ = efficiency rating yrj = amount of output r used by j unit [Customer Loans CC, Labor L, Social Contribution-Taxes SCT and Risk R) Xij = amount of input i used by j unit (Equity E and Deposits D) r = number of outputs from 1 to s i = number of inputs from 1 to m ur = coefficient or weight assigned by DEA to output r vi = coefficient or weight assigned by DEA to input i | For each DMU from 1 to n the Social Efficiency (maximizing the outputs) is shown as: |
Table 4.
Multivariate analysis of economic efficiency: Factorial Analysis of Variance.
| Origin | Type III of Sum of Squares | df | Quadratic Means | F | Sig. | Partial to Squared Eta |
|---|---|---|---|---|---|---|
| Corrected Model | 3443.086 | 38 | 90.608 | 8.088 | 0.000 | 0.102 |
| Intersection | 319,453.149 | 1 | 319,453.149 | 28,517.022 | 0.000 | 0.913 |
| Type | 35.510 | 2 | 17.755 | 1.585 | 0.205 | 0.001 *** |
| Country | 1876.861 | 14 | 134.061 | 11.967 | 0.000 | 0.058 |
| Type * Country | 861.991 | 22 | 39.181 | 3.498 | 0.000 | 0.028 ** |
| Error | 30,357.940 | 2710 | 11.202 | |||
| Total | 5,453,484.370 | 2749 | ||||
| Total corrected | 33,801.026 | 2748 |
Note: * Significant at p < 0.05; ** p < 0.01; *** p < 0.001.
Table 5.
Multivariate analysis of social efficiency for sustainability: Factorial Analysis of Variance.
Table 5.
Multivariate analysis of social efficiency for sustainability: Factorial Analysis of Variance.
| Origin | Type III of Sum of Squares | df | Quadratic Means | F | Sig. | Partial to Squared Eta |
|---|---|---|---|---|---|---|
| Corrected Model | 1132,242.643 | 38 | 29,795.859 | 24.510 | 0.000 | 0.256 |
| Intersection | 718,533.603 | 1 | 718,533.603 | 591.069 | 0.000 | 0.179 |
| Type | 3223.202 | 2 | 1611.601 | 1.326 | 0.266 | 0.001 *** |
| Country | 377,493.668 | 14 | 26,963.833 | 22.181 | 0.000 | 0.103 |
| Type * Country | 81,397.755 | 22 | 3699.898 | 3.044 | 0.000 | 0.024 ** |
| Error | 3,294,415.588 | 2710 | 1215.652 | |||
| Total | 13,873,241.818 | 2749 | ||||
| Total corrected | 4,426,658.231 | 2748 |
Note: * Significant at p < 0.05; ** p < 0.01; *** p < 0.001.
Table 6.
Means comparison (Tamhane) between financial institution categories by country.
| COUNTRY | TYPE | N | Mean Social Efficiency (SD) | Levene | F (Sign) (Inter-Groups) | Tamhane (Three Types, But Banks vs. Coop Shown Only) |
|---|---|---|---|---|---|---|
| France | Banks | 79 | 54.406 (35.542) | 9.695 *** | 1.968 (0.143) | No Sign. |
| Cooperatives | 65 | 57.374 (32.239) | ||||
| Spain | Banks | 18 | 65.397 (31.103) | 2.117 * | 0.566 (0.570) | No Sign. |
| Cooperatives | 51 | 74.667 (39.751) | ||||
| Germany | Banks | 99 | 92.064 (20.980) | 306.977 *** | 38.708 (0.000) | Sign. *** |
| Cooperatives | 909 | 68.425 (38.932) | ||||
| Italy | Banks | 66 | 41.555 (36.515) | 32.982 *** | 24.645 (0.000) | Sign. *** |
| Cooperatives | 382 | 19.015 (22.112) | ||||
| Austria | Banks | 36 | 87.144 (28.237) | 3.400 ** | 0.925 (0.402) | No Sign. |
| Cooperatives | 20 | 76.589 (37.001) | ||||
| Portugal | Banks | 15 | 85.163 (30.927) | 2.857 * | 0.405 (0.668) | No Sign. |
| Cooperatives | 3 | 100.000 (0.000) | ||||
| Belgium | Banks | 16 | 88.083 (22.179) | 1.997 | 0.374 (0.693) | No Sign. |
| Cooperatives | 2 | 100.000 (0.000) | ||||
| Denmark | Banks | 26 | 33.277 (30.964) | 10.621 * | 3.526 (0.036) | No Sign. |
| Cooperatives | 7 | 52.184 (45.718) | ||||
| Finland | Banks | 13 | 73.880(36.061) | 4.034 * | 0.797 (0.461) | No Sign |
| Cooperatives | 2 | 100.000 (0.000) |
Note: * Significant at p < 0.05; ** p < 0.01; *** p < 0.001.
Table 7.
Credit Cooperatives’ social efficiency by country: a matrix of significance by pair comparisons among countries.
Table 7.
Credit Cooperatives’ social efficiency by country: a matrix of significance by pair comparisons among countries.
| Country/Country | N | Mean | SD | I | D | Fr | G | S | A | B | Fi | P |
|---|---|---|---|---|---|---|---|---|---|---|---|---|
| Italy | 382 | 19.015 | 22.112 | 1 | 0.980 | 0.000 | 0.000 | 0.000 | 0.000 | 0.000 | 0.000 | 0.000 |
| Denmark | 7 | 52.184 | 45.718 | 1 | 1.00 | 1.00 | 1.00 | 1.00 | 0.696 | 0.696 | 0.696 | |
| France | 65 | 57.374 | 32.239 | 1 | 0.311 | 0.382 | 0.814 | 0.000 | 0.000 | 0.000 | ||
| Germany | 909 | 68.425 | 38.932 | 1 | 1.00 | 1.00 | 0.000 | 0.000 | 0.000 | |||
| Spain | 51 | 74.667 | 39.751 | 1 | 1.00 | 0.001 | 0.001 | 0.001 | ||||
| Austria | 20 | 76.589 | 37.001 | 1 | 0.321 | 0.321 | 0.321 | |||||
| Belgium | 2 | 100 | 0 | 1 | 1.00 | 1.00 | ||||||
| Finland | 2 | 100 | 0 | 1 | 1.00 | |||||||
| Portugal | 3 | 100 | 0 | 1 | ||||||||
| Total | 1441 | 55.237 | 41.237 |
Table 8.
Correlations among country indexes and country social efficiency means.
| Indexes of Nine Countries: Italy, Denmark, France, Germany, Spain, Austria, Belgium, Finland, Portugal | Mean (Deviation) | Correlations Statistics (Pearson) with Social Efficiency 72.02 (26.946) | Significance |
|---|---|---|---|
| Corruption level (measure by the inverse of Corruption Perceptions Index- taken from Transparency International Corruption index) + | 21.11 (19.601) | −6.22 | *** |
| Wealth-to-Well-Being Coefficient | 1.083 (0.070) | 0.799 | *** |
| Growth-to-Well-Being Coefficient | 0.96 (0.221) | 0.721 | *** |
Note: Significant at *** p < 0.001; + other proxies could be used to test, such as indexes from World Bank (http://info.worldbank.org/governance/wgi/#home).
© 2018 by the authors. Licensee MDPI, Basel, Switzerland. This article is an open access article distributed under the terms and conditions of the Creative Commons Attribution (CC BY) license (http://creativecommons.org/licenses/by/4.0/).
Share and Cite
MDPI and ACS Style
San-Jose, L.; Retolaza, J.L.; Lamarque, E. The Social Efficiency for Sustainability: European Cooperative Banking Analysis. Sustainability 2018, 10, 3271. https://doi.org/10.3390/su10093271
AMA Style
San-Jose L, Retolaza JL, Lamarque E. The Social Efficiency for Sustainability: European Cooperative Banking Analysis. Sustainability. 2018; 10(9):3271. https://doi.org/10.3390/su10093271
Chicago/Turabian StyleSan-Jose, Leire, Jose Luis Retolaza, and Eric Lamarque. 2018. "The Social Efficiency for Sustainability: European Cooperative Banking Analysis" Sustainability 10, no. 9: 3271. https://doi.org/10.3390/su10093271
Note that from the first issue of 2016, this journal uses article numbers instead of page numbers. See further details here.