IPO Underpricing After the 2008 Financial Crisis: A Study of the Chinese Stock Markets


1
School of Economics, Peking University, Beijing 100871, China
2
Discipline of International Business, The University of Sydney, Sydney 2006, Australia
3
School of Business, Wuyi University, Nanping 354300, China
4
Political Economics Institute, Wuhan University of Science and Technology, Wuhan 430065, China
5
Zhongshan Institute, University of Electronic Science and Technology of China, Zhongshan 528402, China
*
Authors to whom correspondence should be addressed.
Sustainability 2018, 10(8), 2844; https://doi.org/10.3390/su10082844
Submission received: 16 July 2018
/
Revised: 6 August 2018
/
Accepted: 9 August 2018
/
Published: 10 August 2018
(This article belongs to the Special Issue Risk Measures with Applications in Finance and Economics)
Abstract
:A firm’s capability of raising funding is closely related to its sustainable development. With a more efficient allocation of funding among the whole society, social resources will be better utilized. Initial Public Offering (IPO) can indeed be an effective means of raising capital for corporate ventures. Using 1069 firms which completed IPOs on Chinese stock exchanges between 1st January 2004 and 1st January 2013, we investigate the difference in IPO underpricing before and after the 2008 financial crisis. Based on OLS regression models, we find that the IPOs are less underpriced in the post-crisis period. We examine the moderating effects of firm size on the difference in IPO underpricing between pre- and post-crisis periods, finding that small firms experienced less IPO underpricing than large firms after the financial crisis. After applying different model specifications such as Robust and OProbit regressions, the results remain consistent. Our study contributes to understanding the dynamics and influences of the financial crisis on firms’ IPO cost from the perspective of information asymmetry.
1. Introduction
Initial Public Offering (IPO) is an important channel for firms to obtain direct funding in capital markets [1,2]. With the rapid development of Chinese stock markets over the past 20 years, many firms have adopted IPO as an effective source of capital funding. During IPOs, information asymmetry is a serious issue which hinders the process of funding from potential investors [3]. Potential investors possess less information than the firm who undertakes the IPO [4]. Potential investors face a higher level of uncertainty regarding the firm’s profitability and performance. As investors are more exposed to risk, they will only submit purchase orders at a discounted stock price. To encourage potential investors to participate in IPOs, the underwriter of the IPO firm has to set an offer price lower than the intrinsic value of the share price [3,5]. The difference between the intrinsic value and the offer price serves as a risk premium of information asymmetry for potential investors. IPO underpricing is regarded as an indirect cost for firms during the process of capital funding [6]. Ritter (1987) has shown that increasing information disclosure before IPOs could reduce the cost of capital funding in U.S. stock markets [6]. Ang and Brau (2002) found a negative relationship between the transparency of a firm’s information and IPO costs, significantly influencing corporate financial performance and sustainable development [7]. A firm’s capability of raising initial funding is closely related to its sustainable development. With a more effective allocation of funding among the whole society, social resources will be better utilized by firms with a higher efficiency, thus creating more values. Moreover, the IPO market plays a critical part in sustainable economic growth. If the IPO market dries up, this can have long lasting negative effects on the evolution of innovative industries. Innovative firms might run into liquidity problems, and the speed of commercialization of technological innovations might slow down. Ultimately, a country’s economic growth path can be negatively affected [8].
The 2008 financial crisis is typically regarded as the worst financial crisis since the Great Depression of the 1930s [9,10,11]. The global financial crisis of 2008 was caused by the expansion of subprime mortgages to high-risk borrowers under the situation of information asymmetry. In other words, there was asymmetry of information spun throughout the 2008 financial crisis. The crisis not only resulted in the collapse of famous and giant financial institutions, such as Lehman Brothers, but also impeded global credit markets and required intensive government interventions. After the crisis, governments around the world introduced a series of regulatory proposals and policies to require more information disclosure and increase the transparency of transactions [12]. Besides, the ensuing period after the 2008 financial crisis was driven by a revolution of information and communication technology (ICT). With the developments and advances in technology, information about firms became more transparent after the crisis [12].
While there is an extensive body of research on the determinants of IPO underpricing and the impacts of the financial crisis separately [3,7,13,14,15,16,17,18], the extant literature has paid little attention to the relationship between financial crisis and a firm’s funding costs or IPO underpricing issues. Song and Lee (2012) studied the long-term effect of the 1998 Asian financial crisis on corporate cash holdings [19]. They divided the sample into well-established firms before the crisis and IPO firms during and after the crisis, finding that the crisis has dramatically changed firms’ cash-holding policies. IPO companies engaging in aggressive income-increasing earnings management are proved to have a significantly worse market-based performance. For these companies, personal liquidity concerns are an important factor in IPO decisions during the economic crisis [20]. Blocker and Sandner (2009) found that the financial crisis is related to a 20% decrease in the average amount of funds raised per funding round [8]. So far, there is no study investigating the role of the financial crisis on IPO underpricing from the aspect of information asymmetry. The collapse of Lehman Brothers in September 2008 and other events leading to the financial crisis provide a good research opportunity to address this question in greater detail. To fill the literature gap, we investigate the influence of information on a firm’s cost of capital funding. Our main study addresses the specific role played by the global financial crisis of 2008.
Utilizing 1069 firms going public on Chinese stock exchanges between January 2004 and January 2013, we study the difference in IPO underpricing before and after the financial crisis of 2008. The results suggest that IPOs are significantly less underpriced in the post-crisis period. Moreover, our empirical study goes beyond the original model of IPO underpricing by revealing the moderating effects of firm size on the relationship between the financial crisis and IPO underpricing. It is found that small firms experienced less IPO underpricing than large firms after the financial crisis.
Firstly, to the best of our knowledge and the literature in hand, this study is one of the few to study the nexus between the financial crisis and IPO underpricing from an empirical perspective [8,19,20]. Previous literature has studied the influences of financial crisis on cash holding and market-based performance. Blocker and Sandner (2009) studied the effect of crisis on the funding of US internet start-ups [8]. However, IPO firms cover a much wider range of industries. Different from the previous research, this study directly focuses on the funding cost of a firm and provides a new insight into the analysis of IPO costs. Secondly, publicly traded equity represents one of the most important sources of external capital to facilitate firm investment [21]. Although previous research has identified a significant relationship between information and a firm’s IPO cost, we revisit this topic from a novel perspective of financial crisis and highlight the impact of information transparency in reducing a firm’s cost of capital funding. Thirdly, we find that firms of different sizes are affected by the financial crisis to different degrees, which reveals that firm size plays an important role in the process of IPOs.
The remainder of this study is organized as follows: Section 2 presents the development of our hypotheses and provides the details of our theoretical arguments. Section 3 details the data and research methods used in our study. Section 4 reports the results of the empirical estimations and robustness checks. Section 5 presents the discussion and draws conclusions.
2. Theories and Hypotheses
2.1. Literature Review
Firms adopt an Initial Public Offering (IPO) as an efficient tool to raise direct funding in capital markets [1,2]. Normally, initially offered shares are underpriced compared with the market price. IPO underpricing refers to the difference between the price at which the shares are sold to investors during the offering procedure and the price at which the shares are traded in the secondary market. IPO underpricing has been empirically investigated in numerous countries and the results reveal that this phenomenon occurs all over the world [19,20,21,22,23]. A firm’s information and the IPO costs significantly influence corporate financial performance and sustainable development [7]. It is commonly acknowledged that the root of underpricing is information asymmetry [3,5,16]. The theory of information asymmetry is used to illustrate the asymmetric distribution of relevant information on the market in the incomplete information market. The concept of information asymmetry originates from George A. Akerlof (1978) [24]. According to the theory of information economics, both borrowers and lenders face information asymmetry in the process of financing. Information asymmetry results in moral hazard and adverse selection [25]. The information asymmetry between different participants has produced different theoretical bases. First is the principal-agent theory which involves information asymmetry between the issuers and the underwriters, assuming that the underwriters have more information about the potential market demand and market conditions than the issuers. Issuers do not have this information due to their lack of market demand information and they have to negotiate the price to ensure the success of the issuance. Therefore, the underpricing is the remuneration for the underwriters. Secondly, the information asymmetry between the issuers and the investors points to the signaling theory [26]. High-quality company initiative signaling strategies further promote IPO underpricing. High-quality companies use IPO underpricing as a signal of its value to attract potential investors in the secondary market. These high-quality companies adopt subsequent issuances to compensate for the cost of underpricing. Thirdly, the information asymmetry among different investors results in Rock’s “winner curse” hypothesis [5]. Investors who lack information are more likely to subscribe for new shares with higher prices than value, and are faced with “winner curses”.
More importantly, information asymmetry has severe impacts on companies’ funding cost and financing capability. Myers and Majluf (1984) have suggested that when the capital market is not perfect, there is information asymmetry between the company’s external investors and insiders, which makes the cost of external financing higher than the cost of internal financing [27]. In order to ensure investors’ lack of information, issuers have to underprice the shares during the IPO process. Because of the increase in financing costs, the company’s net present value drops. As a result, the company’s investment level will be reduced. Hubbard (1998) obtained a full picture of the relationship between imperfections in capital markets and corporate investment [28]. In summary, research on the capital market information asymmetry model and incentive problems shows that information cost determines the degree of financing constraints faced by firms. Therefore, reducing information asymmetry not only enhances firms’ capability of raising funding, but also helps in resource allocations and contributes to sustainable economic growth.
The degree of IPO underpricing in developing countries is much greater than in developed countries. The average underpricing level in developed countries is around 15%, and the average underpricing level in some emerging countries is around 60%, while the IPO underpricing level in China’s stock market is even higher [19]. The average IPO underpricing was closer to 100% from 1987 to 1995 [29,30]. The Chinese IPO process is the same as that in Western countries. The IPO process includes several procedures such as selecting underwriters, setting the offer price, allocating the shares, and trading on the secondary market [31]. Nevertheless, IPOs in China require approval from the CSRC, which is different from the Securities and Exchange Commission’s registration requirements for initial offerings in the U.S. [32,33]. The CSRC examines the quality of new securities, such as evaluating their issuers’ profitability and potential risks. New issuers can only begin the IPO process after they obtain CSRC approval. Moreover, the institutional environment in China is very different from that in North America and Europe. For example, the Chinese Government can control the IPO offer price via the “Guidance window”. Firms in China are more subject to government regulations than in Western countries [34].
2.2. The 2008 Financial Crisis and IPO Underpricing
The financial crisis became clearly visible in September 2008, when the bankruptcy of Lehman Brothers was announced. Immediately after that, the giant insurance company American International Group (AIG) suffered a liquidity crisis following a downgrade in its credit rating. Following this, many other financial institutions in the US and around the world were severely affected, losing large portions of their value, and could only be saved from bankruptcy by government funds. Stock prices declined, and a recession began [8]. The global financial crisis of 2008 was caused by the expansion of subprime mortgages to high-risk borrowers. Borrowers have an advantage of information over lenders because the former knows more about the investment projects that they want to undertake. Before the financial crisis, the market was typified by massive information asymmetry and built up innumerable layers of bad mortgages [7,35]. In other words, there was asymmetry of information spun throughout the 2008 financial crisis. After the crisis, governments around the world introduced a series of regulatory proposals and policies to require more information disclosure and increase the transparency of transactions. The degree of IPO underpricing in developing countries is much greater than in developed countries. The average underpricing level in developed countries is around 15%, and the average underpricing level in some emerging countries is around 60%, while the IPO underpricing level in China’s stock market is even higher [19]. The average IPO underpricing was closer to 100% from 1987 to 1995 [29,30]. The Chinese IPO process is the same as that in Western countries. The IPO process includes several procedures such as selecting underwriters, setting the offer price, allocating the shares, and trading on the secondary market [31]. Nevertheless, IPOs in China require approval from the CSRC, which is different from the Securities and Exchange Commission’s registration requirements for initial offerings in the U.S. [32,33]. The CSRC examines the quality of new securities, such as evaluating their issuers’ profitability and potential risks. New issuers can only begin the IPO process after they obtain CSRC approval. Moreover, the institutional environment in China is very different from that in North America and Europe. For example, the Chinese Government can control the IPO offer price via the “Guidance window”. Firms in China are more subject to government regulations than in Western countries [34].
Meanwhile, the world experienced an ICT (information and communication technology) surge in 2009 [9,36], which logically suggests that the period following the 2008 financial crisis has been driven by revolutions and developments in ICT. Due to the changes in regulation and advances in technology, information about firms became more transparent after the crisis. IPO underpricing is regarded as an indirect cost for firms during the process of capital funding [6,37]. Ritter (1987) has shown that increasing information disclosure before IPOs could reduce the cost of capital funding in the U.S. stock market [6]. Ang and Brau (2002) found a negative relationship between the transparency of a firm’s information and its IPO costs [7]. Thus, we formulate Hypothesis 1:
Hypothesis 1.
IPO underpricing decreases after the 2008 financial crisis compared with the period before the crisis.
2.3. Moderating Effect of Firm Size
Firm size is an important issue in the relationship between IPO underpricing and information asymmetry. Larger firms, as compared to smaller firms, represented less uncertainty and asymmetric information for potential investors before the financial crisis [3]. After the financial crisis, information and communication technologies (ICTs) have experienced a great surge of revolution. The development of ICTs has more significant impacts on small firms than on large firms [36,38]. Moreover, after the financial crisis, small firms have been subject to stricter regulations and have been required to disclose more information [39,40]. The asymmetric information of small firms is supposed to have decreased to a greater extent after the crisis. Therefore, we argue that firm size moderates the difference in IPO underpricing between pre- and post-crisis periods. Then, we derive Hypothesis 2:
Hypothesis 2.
IPO underpricing decreases more for smaller firms after the 2008 financial crisis.
3. Data and Methods
3.1. Sample Selection
Our sample includes 1069 firms completing IPOs on Chinese stock exchanges between 1 January 2004 and 1 January 2013. We have chosen this time window because the policy restricting maximum return on the first day of IPO to 44% was issued in 2013 and implemented in 2014 by Shanghai and Shenzhen stock exchanges. We have collected firm information and IPO trading data from the China Stock Market Accounting Research (CSMAR) database (http://www.gtarsc.com/) [41].
3.2. Variable Measurement
To distinguish the difference in IPO underpricing before and after the crisis, we have chosen the year of 2008 as the relevant cutoff, which is excluded in the time window. The variable, post-crisis, is a dummy coded as 1 if the year is after 2008 and 0 otherwise [34,42].
The dependent variable in our analysis is IPO underpricing. There is an excess rate of return on the stock offerings in China, which means that the offer price is significantly lower than the closing price on the first day of IPO. Underpricing refers to the difference between the price initially offered and the closing price on the first day of trading [42,43,44,45,46]. IPO underpricing is commonly measured by the return on the first day of IPO, illustrating the degree of undervaluation of the offer price [6]. The market adjusted return excluding the factor of market price is a more accurate indicator of IPO underpricing [47]. Thus, we use the market adjusted return on the first day of IPO to represent IPO underpricing, calculated as follows:
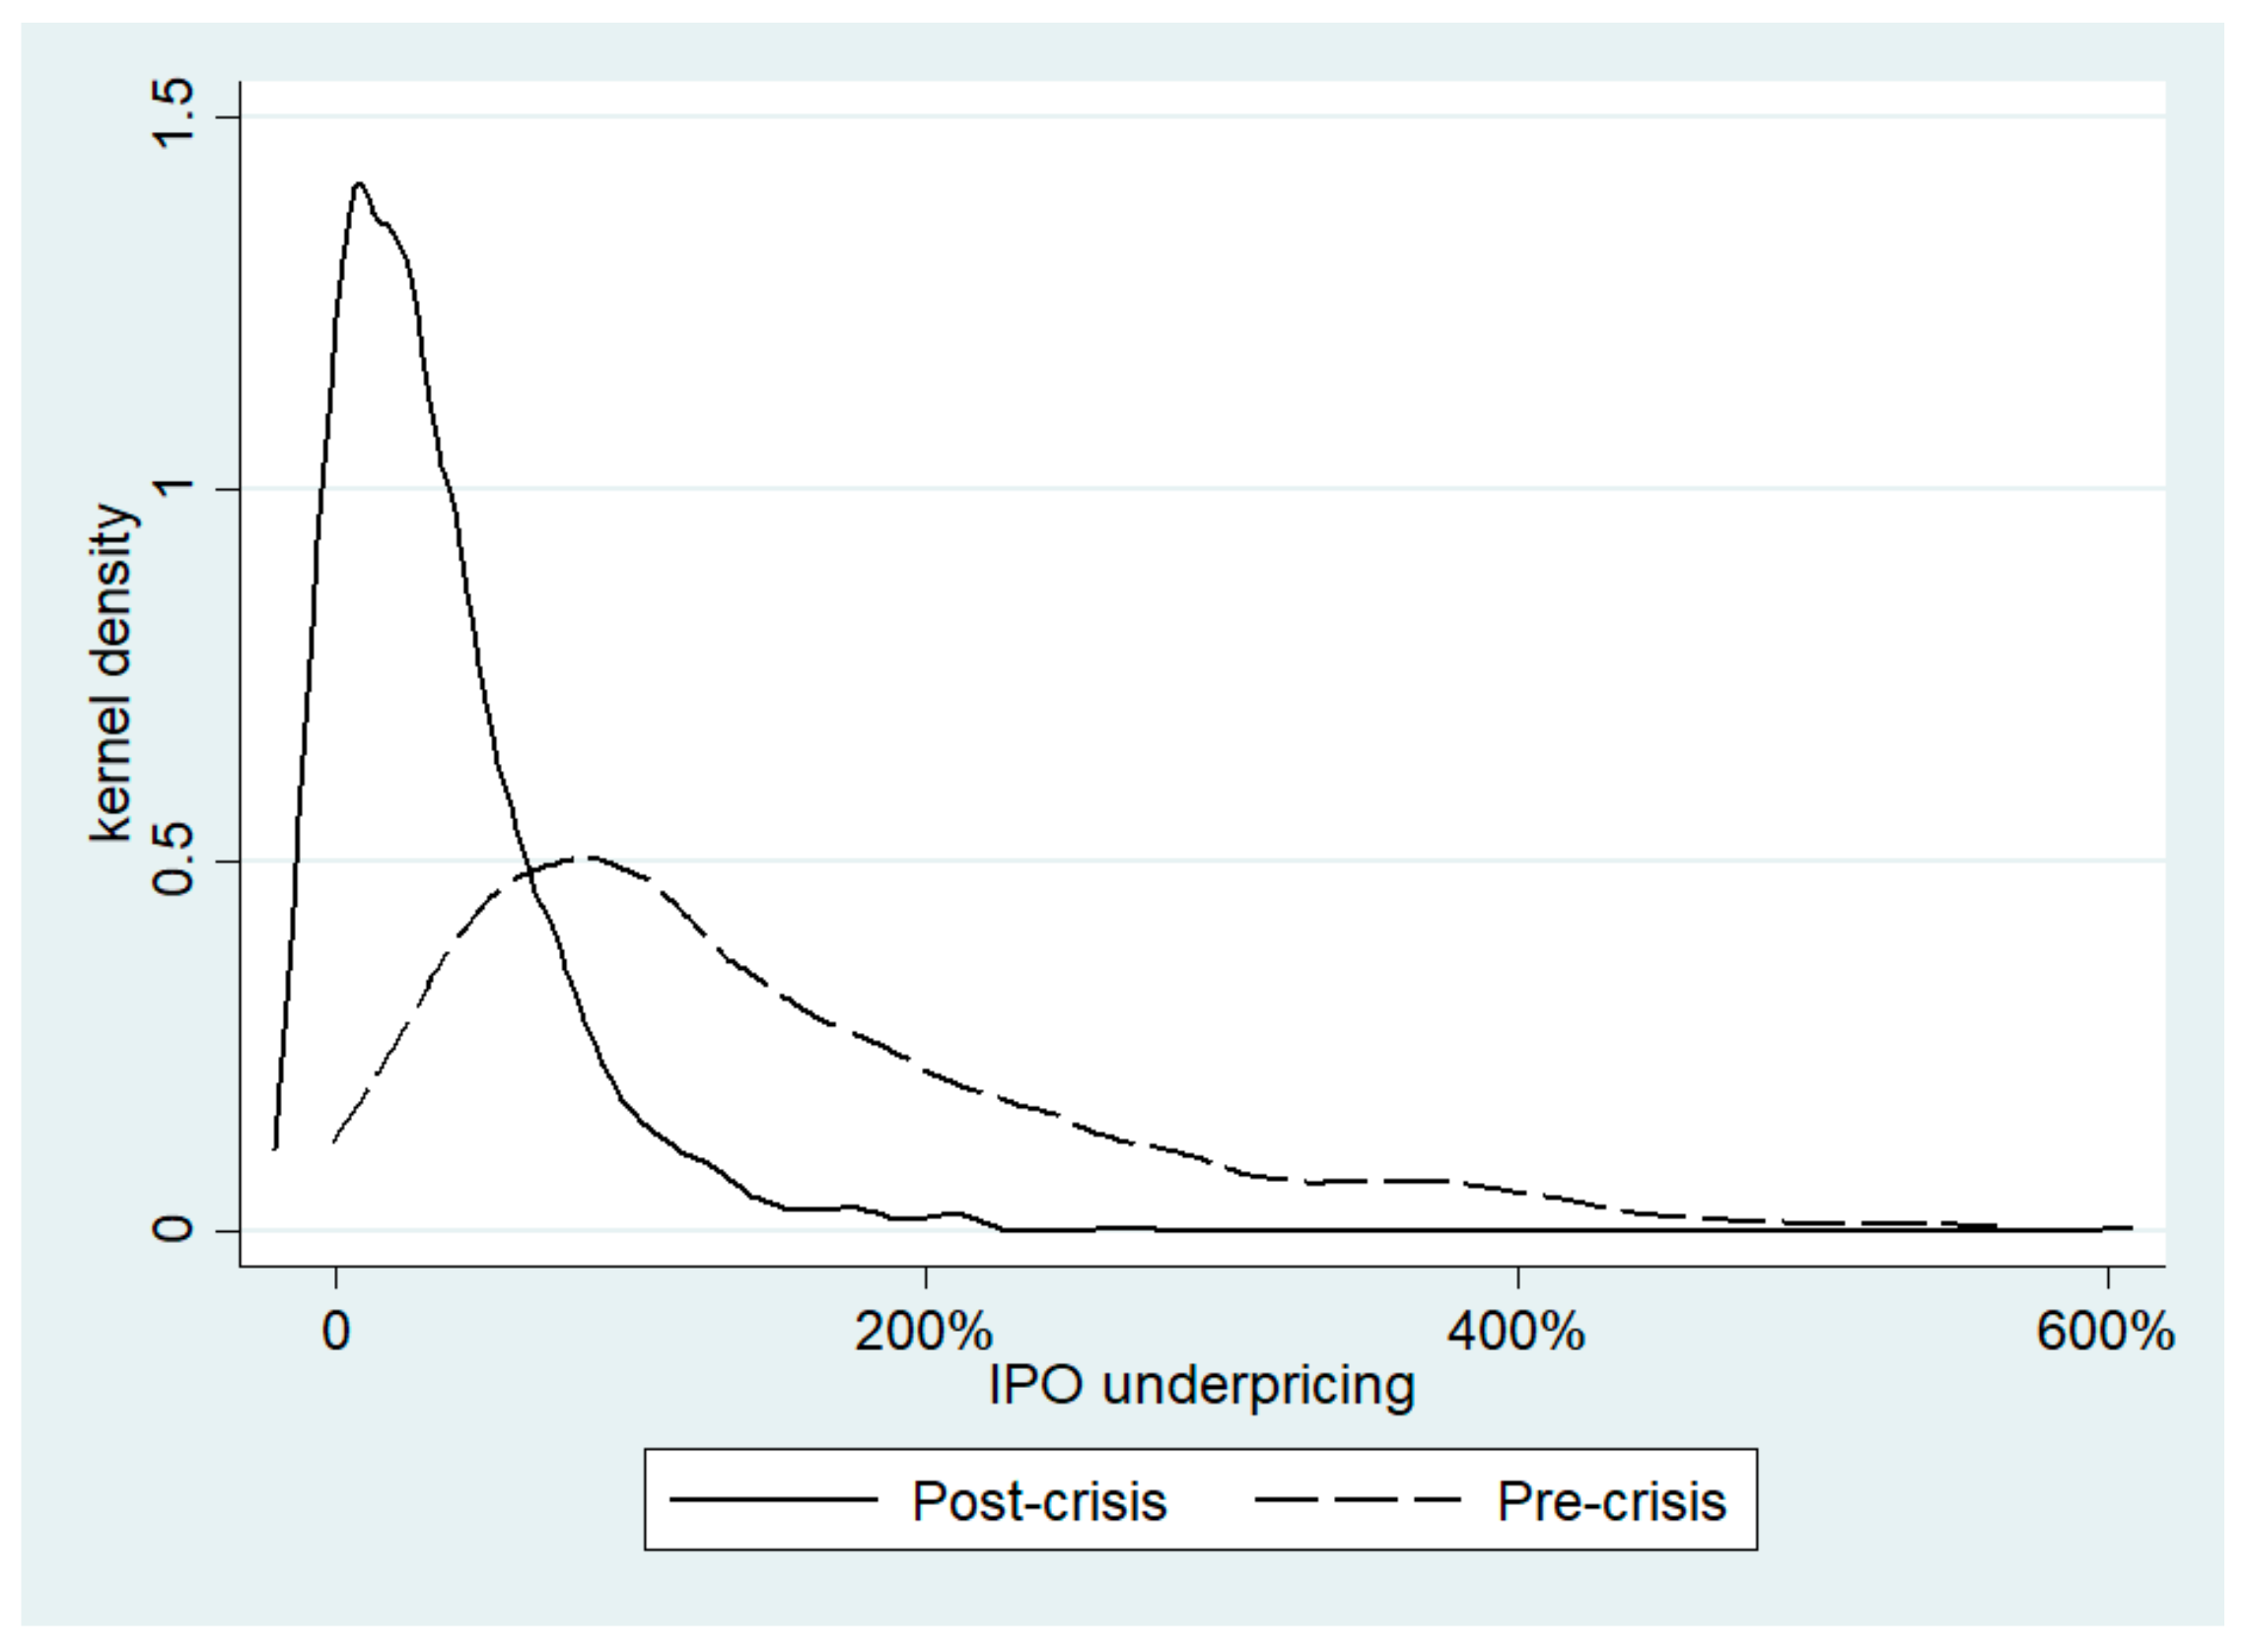
where the subscript t denotes the first day of IPO. Figure 1 depicts the Kernel density of IPO underpricing before and after the financial crisis. As is shown, the kernel density of IPO underpricing in the pre-crisis period is located to the right of that in the post-crisis period. Thus, we can observe from Figure 1 that the average IPO underpricing after the financial crisis was lower than that before the crisis.
Following previous studies, such as Arthurs et al. (2008) and Jia et al. (2014) [33,48], we control for the effect of firm size and value, including the firm’s number of staff, capital at registration, and net value per share before IPO [49,50]. Underwrite cost indicates that the direct cost of IPO is controlled in our analysis [51]. We also introduce several variables to control for offering and trading conditions, including IPO volume, IPO price, lottery rate, and turnover on the first day of IPO [52,53]. Table 1 presents the description of the variables in our analysis. Table 2 shows the statistical summary of these variables. The mean of IPO underpricing before the crisis is 1.464 and after the crisis is 0.358. As would be expected, IPO underpricing decreased by a noticeable degree after the crisis. To avoid the problem of collinearity of the variables, we estimate the Variance Inflating Factor (VIF) and report the statistics in Table 3. Table 3 shows that all values of VIF are less than 10, which confirms that there are no collinearity issues among the variables.
3.3. Research Design
To obtain sophisticated results, this paper employs the Ordinary Least Square model (OLS) to perform an empirical analysis for Hypothesis 1. Model 1 (Equation (2)) examines the difference in IPO underpricing between pre- and post-crisis periods. We take the logarithms of capital at registration and the underwrite cost.
To examine Hypothesis 2, we use two variables—the number of staff and capital at registration to measure firm size, which indicates that smaller firms are equal to the firms with a smaller number of staff and less capital at registration. Then, we introduce their interaction terms and post-crisis into Model 2 (Equation (3)) and Model 3 (Equation (4)) to test the argument, respectively.
In addition, Robust and Ordered Probit (OProbit) regressions are used for robustness checks to test whether the results are stable. Robust regression has the same model specifications as the OLS model. To perform the OProbit regressions, the values of IPO underpricing are categorized into five quartiles with ordered scores from 1 to 5 [54]. If the results obtained from two different model specifications are the same, we can safely conclude that the results from the analysis are robust.
4. Results
4.1. Regression Analyses and Results
Table 4 provides the OLS regression results of the three models. Model 1 shows the difference in IPO underpricing between pre- and post-crisis periods. The estimated coefficient of POST is significantly negative and equal to −0.948, indicating that the average of IPO underpricing in the Chinese stock market decreased by 94.80% after the financial crisis. Model 2 adds the two-way interaction firm’s number of staff and post-crisis. The joint effect of a firm’s number of staff and post-crisis is significantly positive (β = 0.003, p < 0.10). Consistent with the result in Model 2, Model 3 shows that the estimated interaction coefficient of a firm’s capital at registration and post-crisis is statistically significantly positive (β = 0.152, p < 0.01). The results of Models 2 and 3 validate that firm size moderates the difference in IPO underpricing between pre- and post-crisis periods. Specifically, small firms experienced less IPO underpricing than large firms after the financial crisis, because small firms reduced information asymmetry to a greater degree in the post-crisis period.
4.2. Robustness Checks
To better prove Hypothesis 1, we calculate the IPO underpricing tendency of each year in our data and display the result in Table 5. From Table 5, it can be observed that from the year 2008, the underpricing tendency exhibits a downwards trend, which supports the hypothesis that IPO underpricing decreases after the 2008 financial crisis compared with the period before the crisis.
To satisfy the normality distribution of the residuals in OLS models, we use Robust regression to check the validity of our results [55]. Model 1 in Table 6 shows the difference in IPO underpricing between pre- and post-crisis periods. The estimated coefficient of POST is significantly negative. Model 2 adds the two-way interaction firm’s number of staff and post-crisis to the Robust regression. The joint effect of a firm’s number of staff and post-crisis is significantly positive (β = 0.014, p < 0.05). Model 3 shows that the estimated interaction coefficient of a firm’s capital at registration and post-crisis is statistically significantly positive (β = 0.042, p < 0.01). Overall, the empirical results of Robust regressions are consistent with our Hypotheses 1 and 2.
As the empirical analysis is tested by OLS models, we use Ordered Probit (OProbit) regressions to check whether the results of the main effect and interaction terms are robust. The results of the robustness checks are shown in Table 7. Model 1 tests the main effect between financial crisis and IPO underpricing; the results show that the coefficient of post-crisis is negative and significant (β = −2.150, p < 0.01), which is consistent with the result of the OLS analysis. Models 2 and 3 test the moderating effect of firm size, where the number of staff is positively significant (β = 0.006, p < 0.10). However, the moderating effect of capital at registration is positive but not significant in the confidence interval from 0 to 0.1. The result is less than 0.152 and the difference is not quite significant compared with the OLS result. Thus, the magnitude of this result can still be regarded as robust, though the significance reduces due to the different calculation methods involved in the analyses. The values of Pseudo R-square in the three models are not less than 0.350, which reflects enough explanatory power of the whole regression. Therefore, the checks confirm that the results of Hypotheses 1 and 2 are robust.
5. Discussion
5.1. Contributions and Implications
In the context of the Chinese IPO process, this paper makes unique contributions. Firstly, to the best of our knowledge and the literature in hand, this study pioneers in studying the relationship between the 2008 financial crisis and IPO underpricing from an empirical perspective. Thus, this study provides a new insight into the analysis of IPO cost.
Secondly, although previous research has identified a significant relationship between information asymmetry and a firm’s IPO cost, we revisit this topic from the novel perspective of the 2008 financial crisis and highlight the impact of information transparency in reducing a firm’s cost of capital funding. This paper contributes to understanding the dynamics and influences of the financial crisis on the stock market from the perspective of information asymmetry.
Thirdly, we find that firms of different sizes are differently affected by the financial crisis, which reveals that firm size plays an important role in the IPO process. In this sense, our study has practical implications for firms going through the IPO process in a transitional economy with developing information technology and improving capital market regulations.
5.2. Limitations and Future Study Directions
Although several interesting findings are presented in our study, the possible limitations should be noted. Firstly, although we clearly address the impact of the 2008 financial crisis on Chinese stock markets, some scholars have argued that China withstood this great recession. They point out that the huge stimulus package put in place by the Chinese government in 2008 meant that China suffered relatively little from the financial crisis. The Chinese government also used state-owned enterprises as a fiscal instrument to implement an aggressive stimulus program in 2009. Further investigation in other developing countries is encouraged to examine the robustness of our findings.
Moreover, we have tested the moderating effects of firm size in the relationship between financial crisis and IPO underpricing. The finding shows that firm-level characteristics are associated with the degree of information asymmetry. However, environmental and institutional factors could also result in the varying degrees of information asymmetry and thus moderate the effect of financial crisis on the IPO process. An examination of these factors may provide deeper insights and is worthy of consideration in future analyses.
6. Conclusions
Utilizing 1069 firms completing IPOs on Chinese stock exchanges between January 2004 and January 2013, we have studied the difference in IPO underpricing before and after the financial crisis of 2008. The results suggest that IPOs are significantly less underpriced in the post-crisis period. Moreover, our empirical study goes beyond the original model of IPO underpricing by revealing the moderating effects of firm size on the relationship between the financial crisis and IPO underpricing. The findings demonstrate that small firms experienced less IPO underpricing than large firms after the 2008 financial crisis. In order to check the robustness, we have calculated the IPO underpricing tendencies each year and performed Robust and OProbit regressions. All results suggest that our empirical analyses are consistent.
IPO is still a relatively new but important activity in emerging markets such as China, but it has become an element vital to the economy. Many questions are left unanswered, thus offering good opportunities for future research. Does the influence of financial crises on IPO activity differ among regions and industries? How do IPO firms receiving funding during the financial crisis differ from firms that had received funding before the financial crisis? How do firms respond to the changes posed by the financial crisis and the difficulties encountered in the search for IPO funding? In addition to IPO firms, will the financial crisis have a similar impact on the funding process of newly emerged business such as start-ups?
Author Contributions
In this study, R.L. conceived and designed the study framework; Y.L. prepared the data for the analysis and provided the method; W.L. analyzed the data; S.-B.T. revised the paper.
Funding
This study was supported by the National Social Science Foundation of China (Grant no. 17CGJ002).
Acknowledgments
We deeply thank anonymous reviewers for their insightful suggestions and constructive comments. We are grateful to the editors for their patient work for our manuscript.
Conflicts of Interest
The authors declare no conflict of interest.
References
- Daily, C.M.; Certo, S.T.; Dalton, D.R.; Roengpitya, R. IPO underpricing: A meta-analysis and research synthesis. Entrep. Theory Pract. 2003, 27, 271–295. [Google Scholar] [CrossRef]
- Reilly, F.K.; Hatfield, K. Investor experience with new stock issues. J. Financ. Anal. 1969, 25, 73–80. [Google Scholar] [CrossRef]
- Ritter, J.R.; Welch, I. A review of IPO activity, pricing, and allocation. J. Financ. 2002, 57, 1795–1828. [Google Scholar] [CrossRef]
- Easley, D.; O’hara, M. Information and the cost of capital. J. Financ. 2004, 59, 1553–1583. [Google Scholar] [CrossRef]
- Rock, K. Why new issues are underpriced. J. Financ. Econ. 1986, 15, 187–212. [Google Scholar] [CrossRef]
- Ritter, J.R. The costs of going public. J. Financ. Econ. 1987, 19, 269–281. [Google Scholar] [CrossRef]
- Ang, J.S.; Brau, J.C. Firm transparency and the costs of going public. J. Financ. Res. 2002, 25, 1–17. [Google Scholar] [CrossRef]
- Block, J.; Sandner, P. What is the effect of the financial crisis on venture capital financing? Empirical evidence from US Internet start-ups. Venture Cap. 2009, 11, 295–309. [Google Scholar] [CrossRef] [Green Version]
- Taylor, J.B. The Financial Crisis and the Policy Responses: An Empirical Analysis of What Went Wrong; National Bureau of Economic Research: Cambridge, MA, USA, 2009. [Google Scholar]
- Vyas, D. The timeliness of write-downs by U.S. financial institutions during the financial crisis of 2007–2008. J. Account. Res. 2011, 49, 823–860. [Google Scholar] [CrossRef]
- Kirkpatrick, G. The corporate governance lessons from the financial crisis. OECD J. Financ. Mark. Trends 2009, 1, 61–87. [Google Scholar] [CrossRef]
- Erkens, D.H.; Hung, M.; Matos, P. Corporate governance in the 2007–2008 financial crisis: Evidence from financial institutions worldwide. J. Corp. Financ. 2012, 2, 389–411. [Google Scholar] [CrossRef]
- Beatty, R.P.; Ritter, J.R. Investment banking, reputation, and the underpricing of initial public offerings. J. Financ. Econ. 1986, 15, 213–232. [Google Scholar] [CrossRef] [Green Version]
- Su, D. Adverse-selection versus signaling: Evidence from the pricing of Chinese IPOs. J. Econ. Bus. 2004, 56, 1–19. [Google Scholar] [CrossRef]
- Benveniste, L.M.; Wilhelm, W.J., Jr. A comparative analysis of IPO proceeds under alternative regulatory environments. J. Financ. Econ. 1990, 28, 173–207. [Google Scholar] [CrossRef]
- Loughran, T.; Ritter, J. Why has IPO underpricing changed over time? Financ. Manag. 2004, 33, 5–37. [Google Scholar] [CrossRef]
- Reinhart, C.M.; Rogoff, K.S. Is the 2007 US sub-prime financial crisis so different? An international historical comparison. Am. Econ. Rev. 2008, 98, 339–344. [Google Scholar] [CrossRef] [Green Version]
- Reinhart, C.M.; Rogoff, K.S. The aftermath of financial crises. Am. Econ. Rev. 2009, 99, 466–472. [Google Scholar] [CrossRef] [Green Version]
- Song, K.R.; Lee, Y. Long-term effects of a financial crisis: Evidence from cash holdings of East Asian firms. J. Financ. Quant. Anal. 2012, 47, 617–641. [Google Scholar] [CrossRef]
- Ahmad-Zaluki, N.A.; Campbell, K.; Goodacre, A. Earnings management in Malaysian IPOs: The East Asian crisis, ownership control, and post-IPO performance. Inter. J. Account. 2011, 46, 111–137. [Google Scholar] [CrossRef] [Green Version]
- He, J.J.; Tian, X. The dark side of analyst coverage: The case of innovation. J. Financ. Econ. 2013, 109, 856–878. [Google Scholar] [CrossRef]
- Engelen, P.J.; Van Essen, M. Underpricing of IPOs: Firm-, issue-and country-specific characteristics. J. Bank Financ. 2010, 34, 1958–1969. [Google Scholar] [CrossRef]
- Hahn, T.; Ligon, J.A.; Rhodes, H. Liquidity and initial public offering underpricing. J. Bank Financ. 2013, 12, 4973–4988. [Google Scholar] [CrossRef]
- Akerlof, G.A. The market for “lemons”: Quality uncertainty and the market mechanism. Uncertain. Econ. 1978, 235, 237–251. [Google Scholar] [CrossRef]
- Baron, D.P. A model of the demand for investment banking advising and distribution services for new issues. J. Financ. 1982, 37, 955–976. [Google Scholar] [CrossRef]
- Allen, F.; Faulhaber, G.R. Signalling by underpricing in the IPO market. J. Financ. Econ. 1989, 23, 303–323. [Google Scholar] [CrossRef]
- Myers, S.C.; Majluf, N.S. Corporate financing and investment decisions when firms have information that investors do not have. J. Financ. Econ. 1984, 13, 187–221. [Google Scholar] [CrossRef]
- Hubbard, R.G. Capital Market Imperfections and Investment. J. Econ. Lit. 1998, 36, 193–225. [Google Scholar]
- Su, D.; Fleisher, B.M. An empirical investigation of underpricing in Chinese IPOs. Pac.-Basin. Financ. J. 1999, 7, 173–202. [Google Scholar] [CrossRef]
- Su, D.; Fleisher, B.M. Why does return volatility differ in Chinese stock markets? Pac.-Basin. Financ. J. 1999, 7, 557–586. [Google Scholar] [CrossRef]
- Certo, S.T.; Holcomb, T.R.; Holmes, R.M., Jr. IPO research in management and entrepreneurship: Moving the agenda forward. J. Manag. 2009, 35, 1340–1378. [Google Scholar] [CrossRef]
- Tian, L. Regulatory underpricing: Determinants of Chinese extreme IPO returns. J. Empir. Financ. 2011, 18, 78–90. [Google Scholar] [CrossRef]
- Jia, M.; Zhang, Z. Donating money to get money: The role of corporate philanthropy in stakeholder reactions to IPOs. J. Manag. Stud. 2014, 51, 1118–1152. [Google Scholar] [CrossRef]
- Liu, W.; Wei, Q.; Huang, S.-Q.; Tsai, S.-B. Doing Good Again? A Multilevel Institutional Perspective on Corporate Environmental Responsibility and Philanthropic Strategy. Int. J. Environ. Res. Public Health 2017, 14, 1283. [Google Scholar] [CrossRef] [PubMed]
- Crotty, J. Structural causes of the global financial crisis: A critical assessment of the ‘new financial architecture’. Camb. J. Econ. 2009, 33, 563–580. [Google Scholar] [CrossRef]
- Southern, A.; Tilley, F. Small firms and information and communication technologies (ICTs): Toward a typology of ICTs usage. New Tech. Work Employ. 2000, 15, 138–154. [Google Scholar] [CrossRef]
- Welch, I. Seasoned offerings, imitation costs, and the underpricing of initial public offerings. J. Financ. 1989, 44, 421–449. [Google Scholar] [CrossRef]
- Cragg, P.; King, M.; Hussin, H. IT alignment and firm performance in small manufacturing firms. J. Strat. Inf. Syst. 2002, 11, 109–132. [Google Scholar] [CrossRef]
- Berglöf, E.; Pajuste, A. What do firms disclose and why? Enforcing corporate governance and transparency in Central and Eastern Europe. Oxf. Rev. Econ. Pol. 2005, 21, 178–197. [Google Scholar] [CrossRef]
- Hackston, D.; Milne, M.J. Some determinants of social and environmental disclosures in New Zealand companies. Account. Audit. Account. J. 1996, 9, 77–108. [Google Scholar] [CrossRef]
- China Stock Market Accounting Research (CSMAR) Database. Available online: http://www.gtarsc.com/ (accessed on 27 September 2017).
- Ivashina, V.; Scharfstein, D. Bank lending during the financial crisis of 2008. J. Financ. Econ. 2010, 97, 319–338. [Google Scholar] [CrossRef]
- Brautzsch, H.U.; Günther, J.; Loose, B.; Ludwig, U.; Nulsch, N. Can R&D subsidies counteract the economic crisis?–Macroeconomic effects in Germany. Res. Policy 2015, 44, 623–633. [Google Scholar]
- Ibbotson, R.G. Price performance of common stock new issues. J. Financ. Econ. 1975, 2, 235–272. [Google Scholar] [CrossRef]
- Ibbotson, R.G.; Sindelar, J.L.; Ritter, J.R. Initial public offerings. J. Corp. Appl. Financ. 1988, 1, 37–45. [Google Scholar] [CrossRef]
- Ritter, J.R. Initial public offerings. Contemp. Financ. Dig. 1998, 2, 5–30. [Google Scholar]
- Aggarwal, R.K.; Krigman, L.; Womack, K.L. Strategic IPO underpricing, information momentum, and lockup expiration selling. J. Financ. Econ. 2002, 66, 105–137. [Google Scholar] [CrossRef]
- Arthurs, J.D.; Hoskisson, R.E.; Busenitz, L.W.; Johnson, R.A. Managerial agents watching other agents: Multiple agency conflicts regarding underpricing in IPO firms. Acad. Manag. J. 2008, 51, 277–294. [Google Scholar] [CrossRef]
- Booth, J.R.; Chua, L. Ownership dispersion, costly information, and IPO underpricing. J. Financ. Econ. 1996, 41, 291–310. [Google Scholar] [CrossRef]
- Jegadeesh, N.; Weinstein, M.; Welch, I. An empirical investigation of IPO returns and subsequent equity offerings. J. Financ. Econ. 1993, 34, 153–175. [Google Scholar] [CrossRef]
- Ting, Y.U.; Tse, Y.K. An empirical examination of IPO underpricing in the Chinese A-share market. China Econ. Rev. 2006, 17, 363–382. [Google Scholar]
- Chang, E.; Chen, C.; Chi, J.; Young, M. IPO underpricing in China: New evidence from the primary and secondary markets. Emerg. Mark. Rev. 2008, 9, 1–16. [Google Scholar] [CrossRef]
- Darmadi, S.; Gunawan, R. Underpricing, board structure, and ownership: An empirical examination of Indonesian IPO firms. Manag. Financ. 2013, 39, 181–200. [Google Scholar] [CrossRef]
- Liu, W.; Shi, H.-B.; Zhang, Z.; Tsai, S.-B.; Zhai, Y.; Chen, Q.; Wang, J. The Development Evaluation of Economic Zones in China. Int. J. Environ. Res. Public Health 2018, 15, 56. [Google Scholar] [CrossRef] [PubMed]
- Verardi, V.; Croux, C. Robust regression in Stata. Stata J. 2009, 9, 439–453. [Google Scholar] [CrossRef]
Figure 1.
Kernel density estimation (KDE) estimates the probability density function of IPO underpricing. The solid curve demonstrates the density function of IPO before the financial crisis and the dashed curve demonstrates the density function of IPO before the financial crisis.
Figure 1.
Kernel density estimation (KDE) estimates the probability density function of IPO underpricing. The solid curve demonstrates the density function of IPO before the financial crisis and the dashed curve demonstrates the density function of IPO before the financial crisis.


Table 1.
Description of variables.
| Variable Abbreviation | Variable Definition | Dimension |
|---|---|---|
| IPO underpricing | Market adjusted IPO underpricing | % |
| POST | Time indicator of Post-crisis | N/A |
| NOS | Number of staffs | Ten Thousand |
| NVPS | Net value per share | Yuan |
| CAR | Capital at registration | Million Yuan |
| IPOV | IPO volume | Billion |
| IPOP | IPO price | Yuan |
| UC | Underwrite cost | Million Yuan |
| TOFD | Turnover on the first day of IPO | % |
| LR | Lottery rate of IPO | % |
Table 2.
Statistical summary of variables.
| Variables | Pre-Crisis | Post-Crisis | ||
|---|---|---|---|---|
| Mean | S.D. | Mean | S.D. | |
| IPO underpricing | 1.464 | 1.068 | 0.358 | 0.431 |
| NOS | 1.258 | 5.284 | 0.304 | 1.822 |
| NPVS | 2.472 | 0.894 | 3.089 | 1.171 |
| CAR | 6500 | 35481 | 741.0 | 10041 |
| IPOV | 0.396 | 1.385 | 0.120 | 1.006 |
| IPOP | 10.24 | 5.810 | 26.06 | 14.90 |
| UC | 66.84 | 153.6 | 57.00 | 57.81 |
| TOFD | 0.675 | 0.109 | 0.701 | 0.204 |
| LR | 0.389 | 0.592 | 1.456 | 3.059 |
| Observations | 188 | 881 | ||
Table 3.
Summary of the variance inflating factor.
| Variable | VIF | VIF |
|---|---|---|
| Ln(CAR) | 5.03 | 0.19899 |
| Ln(UC) | 5.01 | 0.199618 |
| NOS | 3.03 | 0.329525 |
| IPOV | 3.01 | 0.332324 |
| IPOP | 2.32 | 0.430528 |
| POST | 1.66 | 0.601727 |
| NVPS | 1.27 | 0.789147 |
| TOFD | 1.17 | 0.856115 |
| LR | 1.17 | 0.856265 |
| Mean VIF | 2.63 |
Table 4.
Estimation results of OLS regressions.
| Variables | Model 1 | Model 2 | Model 3 |
|---|---|---|---|
| POST | −0.948 *** | −0.971 *** | −3.893 *** |
| (0.055) | (0.056) | (0.596) | |
| NOS | 0.004 | 0.003 | 0.020 * |
| (0.010) | (0.010) | (0.011) | |
| NVPS | −0.045 *** | −0.048 *** | −0.045 *** |
| (0.016) | (0.016) | (0.016) | |
| Ln(CAR) | 0.048 | 0.044 | −0.076 * |
| (0.030) | (0.030) | (0.039) | |
| IPOV | 0.003 | −0.025 | −0.020 |
| (0.026) | (0.030) | (0.026) | |
| IPOP | 0.003 * | 0.003 * | 0.003 * |
| (0.002) | (0.002) | (0.002) | |
| Ln(UC) | −0.305 *** | −0.291 *** | −0.239 *** |
| (0.055) | (0.056) | (0.056) | |
| TOFD | 1.035 *** | 1.032 *** | 1.049 *** |
| (0.091) | (0.091) | (0.090) | |
| LR | −0.004 | −0.005 | −0.007 |
| (0.006) | (0.006) | (0.006) | |
| NOS × POST | 0.003 * | ||
| (0.001) | |||
| Ln(CAR) × POST | 0.152 *** | ||
| (0.031) | |||
| Observations | 1069 | 1069 | 1069 |
| R-squared | 0.481 | 0.483 | 0.493 |
| Adj R-squared | 0.477 | 0.478 | 0.488 |
Standard errors in parentheses; *** p < 0.01, ** p < 0.05, * p < 0.1.
Table 5.
IPO underpricing tendency.
| 2004 | 2005 | 2006 | 2007 | 2008 (Cutoff) | 2009 | 2010 | 2011 | 2012 |
|---|---|---|---|---|---|---|---|---|
| 0.738 | 0.505 | 0.802 | 1.822 | 1.234 | 0.718 | 0.412 | 0.216 | 0.267 |
Table 6.
Estimation results of Robust regressions.
| Variables | Model 1 | Model 2 | Model 3 |
|---|---|---|---|
| POST | −0.543 *** | −0.552 *** | −1.365 *** |
| (0.0269) | (0.0274) | (0.297) | |
| NOS | −0.00534 | −0.00828 * | −0.00147 |
| (0.00497) | (0.00493) | (0.00521) | |
| NVPS | −0.0187 ** | −0.0179 ** | −0.0158 ** |
| (0.00777) | (0.00776) | (0.00776) | |
| Ln(CAR) | 0.0218 | 0.0227 | −0.0130 |
| (0.0150) | (0.0149) | (0.0194) | |
| IPOV | 0.0123 | 0.000772 | 0.00852 |
| (0.0127) | (0.0148) | (0.0129) | |
| IPOP | 0.00122 | 0.00125 | 0.00124 |
| (0.000807) | (0.000800) | (0.000806) | |
| Ln(UC) | −0.109 *** | −0.102 *** | −0.0943 *** |
| (0.0272) | (0.0273) | (0.0280) | |
| TOFD | 0.830 *** | 0.811 *** | 0.817 *** |
| (0.0451) | (0.0447) | (0.0450) | |
| LR | −0.00923 *** | −0.0169 *** | −0.0175 *** |
| (0.00305) | (0.00303) | (0.00306) | |
| NOS × POST | 0.0140 ** | ||
| (0.00710) | |||
| Ln(CAR) × POST | 0.0419 *** | ||
| (0.0153) | |||
| Observations | 1069 | 1069 | 1069 |
| R-squared | 0.565 | 0.577 | 0.583 |
| Adj R-squared | 0.562 | 0.573 | 0.579 |
Standard errors in parentheses; *** p < 0.01, ** p < 0.05, * p < 0.1.
Table 7.
Estimation results of OProbit regressions.
| Variables | Model 1 | Model 2 | Model 3 |
|---|---|---|---|
| POST | −2.150 *** | −2.191 *** | −3.913 *** |
| (0.136) | (0.139) | (1.382) | |
| NOS | 0.018 | 0.013 | 0.026 |
| (0.022) | (0.021) | (0.022) | |
| NVPS | −0.039 | −0.045 | −0.038 |
| (0.036) | (0.036) | (0.036) | |
| Ln(CAR) | 0.177 *** | 0.164 ** | 0.101 |
| (0.068) | (0.069) | (0.091) | |
| IPOV | 0.037 | 0.022 | 0.042 |
| (0.073) | (0.067) | (0.072) | |
| IPOP | 0.008 ** | 0.008 ** | 0.008 ** |
| (0.004) | (0.004) | (0.004) | |
| Ln(UC) | −0.409 *** | −0.394 *** | −0.374 *** |
| (0.124) | (0.124) | (0.127) | |
| TOFD | 6.310 *** | 6.295 *** | 6.297 *** |
| (0.309) | (0.309) | (0.308) | |
| LR | −0.492 *** | −0.504 *** | −0.499 *** |
| (0.045) | (0.045) | (0.045) | |
| NOS × POST | 0.006 * | ||
| (0.003) | |||
| Ln(CAR) × POST | 0.091 | ||
| (0.071) | |||
| Observations | 1069 | 1069 | 1069 |
| LR Chi-square | 1203.27 | 1205.96 | 1204.91 |
| Pseudo R-square | 0.350 | 0.351 | 0.351 |
Standard errors in parentheses; *** p < 0.01, ** p < 0.05, * p < 0.1.
© 2018 by the authors. Licensee MDPI, Basel, Switzerland. This article is an open access article distributed under the terms and conditions of the Creative Commons Attribution (CC BY) license (http://creativecommons.org/licenses/by/4.0/).
Share and Cite
MDPI and ACS Style
Li, R.; Liu, W.; Liu, Y.; Tsai, S.-B. IPO Underpricing After the 2008 Financial Crisis: A Study of the Chinese Stock Markets. Sustainability 2018, 10, 2844. https://doi.org/10.3390/su10082844
AMA Style
Li R, Liu W, Liu Y, Tsai S-B. IPO Underpricing After the 2008 Financial Crisis: A Study of the Chinese Stock Markets. Sustainability. 2018; 10(8):2844. https://doi.org/10.3390/su10082844
Chicago/Turabian StyleLi, Rui, Wei Liu, Yong Liu, and Sang-Bing Tsai. 2018. "IPO Underpricing After the 2008 Financial Crisis: A Study of the Chinese Stock Markets" Sustainability 10, no. 8: 2844. https://doi.org/10.3390/su10082844
Note that from the first issue of 2016, this journal uses article numbers instead of page numbers. See further details here.