President Trump Tweets Supreme Leader Kim Jong-Un on Nuclear Weapons: A Comparison with Climate Change †


1
School of Mathematics and Statistics, University of Sydney, Sydney, NSW 2006, Australia
2
Department of Finance, Asia University, Taichung 413, Taiwan
3
School of Business and Law, Edith Cowan University, Perth, WA 6027, Australia
4
Discipline of Business Analytics, University of Sydney Business School, Sydney, NSW 2006, Australia
5
Institute of Advanced Sciences, Yokohama National University, Yokohama 240-8501, Japan
6
Econometric Institute, Erasmus School of Economics, Erasmus University Rotterdam, 3080 Rotterdam, The Netherlands
7
Department of Economic Analysis and ICAE, Complutense University of Madrid, 28080 Madrid, Spain
*
Author to whom correspondence should be addressed.
†
The analysis in the paper was undertaken with the R sentiment package.
Sustainability 2018, 10(7), 2310; https://doi.org/10.3390/su10072310
Submission received: 10 May 2018
/
Revised: 27 June 2018
/
Accepted: 28 June 2018
/
Published: 4 July 2018
(This article belongs to the Special Issue Risk Measures with Applications in Finance and Economics)
Abstract
:A set of 125 tweets about North Korea’s Supreme Leader Kim Jong-Un by President Trump from 2013 to 2018 are analysed by means of the data mining technique, sentiment analysis. The intention is to explore the contents and sentiments of the messages contained, the degree to which they differ, and their implications about President Trump’s understanding and approach to international diplomacy. The results suggest a predominantly positive emotion in relation to tweets about North Korea, despite the use of questionable nicknames such as “Little Rocket Man”. A comparison is made between the tweets on North Korea and climate change, madefrom 2011–2015, as Trump has tweeted many times on both issues. It is interesting to find that Trump’s tweets on North Korea have significantly higher positive polarity scores than his tweets on climate change.
Keywords:
sentiment analysis; polarity; scientific verification; emotion; joy; sadness; climate changeJEL Classification:
A1; C88; C44; Z01. Introduction
“Mentally Deranged U.S. Dotard” Tweets “Little Rocket Man”
A series of 125 tweets by President Trump on the topic of North Korea’s Supreme Leader Kim Jong-Un are analysed by means of textual analysis using data mining techniques. The tweets date from 3 April 2018 to 10 March 2018. The analysis features the use of an R library package which facilitates sentiment analysis, ‘sentiment’. The tweets were taken from an on-line sample available at https://twitter.com/search?q=donald%20Trump%20North%20Korea&src=typd&lang.
Data mining refers to the process of analysing data sets to reveal patterns, and usually involves methods that are drawn from statistics, machine learning, and database systems. There are two broad approaches to text mining and document analysis for extracting sentiment: the lexicon based approach and the text classification approach. The former involves using the semantic orientation of words or phrases in the document to calculate the orientation of the document. The latter approach could be described as a statistical or machine learning approach.
Text data mining involves the analysis of patterns in text data. Sentiment analysis is concerned with the emotional context of a text, and seeks to infer whether a section of text is positive or negative, or the nature of the emotions involved. There are a variety of methods and dictionaries that exist for undertaking the sentiment analysis of a piece of text.
Although sentiment is often framed in terms of being a binary distinction (positive versus negative), it can also be analysed in a more nuanced manner. We decided to apply the R package ‘sentiment’, which distinguishes between five different emotions, namely joy, sadness, anger, fear and surprise.
There are many different forms of sentiment analysis, but many use the same basic approach. They begin by constructing a list of words or dictionary associated with different emotions, count the number of positive and negative words in a given text, and then analyse the mix of positive and negative words to assess the general emotional tenor of the text. In our analysis we have used the inbuilt lexicon in the ‘sentiment’ package. This means we can compare our results with previous analyses we have undertaken using the same method. If we had so wished, we could have built our own lexicon, and this would have improved the accuracy of the fit, but would have been more data-set specific. We preferred to have consistency in the series of analyses we are undertaking using this method.
The purpose of the paper is not to compare different automated sentiment analysis packages, but to evaluate tweets using a specific and convenient Sentiment Analysis package. A comparison of the performance of alternative automated sentiment analysis packages will be considered in future research.
2. Research Method
The paper is a companion to other recent analyses of President Trump’s tweets on the topic of climate change and his State of the Union Address 2018 [1,2]. It features the use of an R library package called ‘sentiment’. The ‘sentiment’ package was written by De Vries (2012), is now archived from the current release of R, and can be loaded from ‘Github.com’. The details of the seniment package are available in De Vries (2012) [3]. It is a dictionary-based method which calculates sentiment scores using affinity dictionaries. The program splits strings into words (by default at space), calculates an affinity score for each word, and returns the average, using a scale from +5 to −5.
The paper uses this package because it is more finely grained, categorizes five different sentiment emotions, namely joy, sadness, anger, fear and surprise, and reveals greater information about the emotional tenor of the text or string that is analysed.
The process of performing sentiment analysis requires textual input in a machine-readable format. Pre-processing is required to transform the text into single words, followed by what are common pre-processing steps: stopword removal, stemming, removal of punctuation, and conversion to lower case.
The limitations of the analysis should be borne in mind. The context of ‘natural language processing’, of which sentiment analysis is a component, is important. The use of sarcasm and other types of ironic language, including puns and backhanded compliments, are inherently problematic for machines to detect, when viewed in isolation. This is a potential issue, in particular, in the analysis of President Trump’s tweets. Nevertheless, current methods are revealing, as will be seen in the next section which presents the results.
2.1. Results of the Analysis
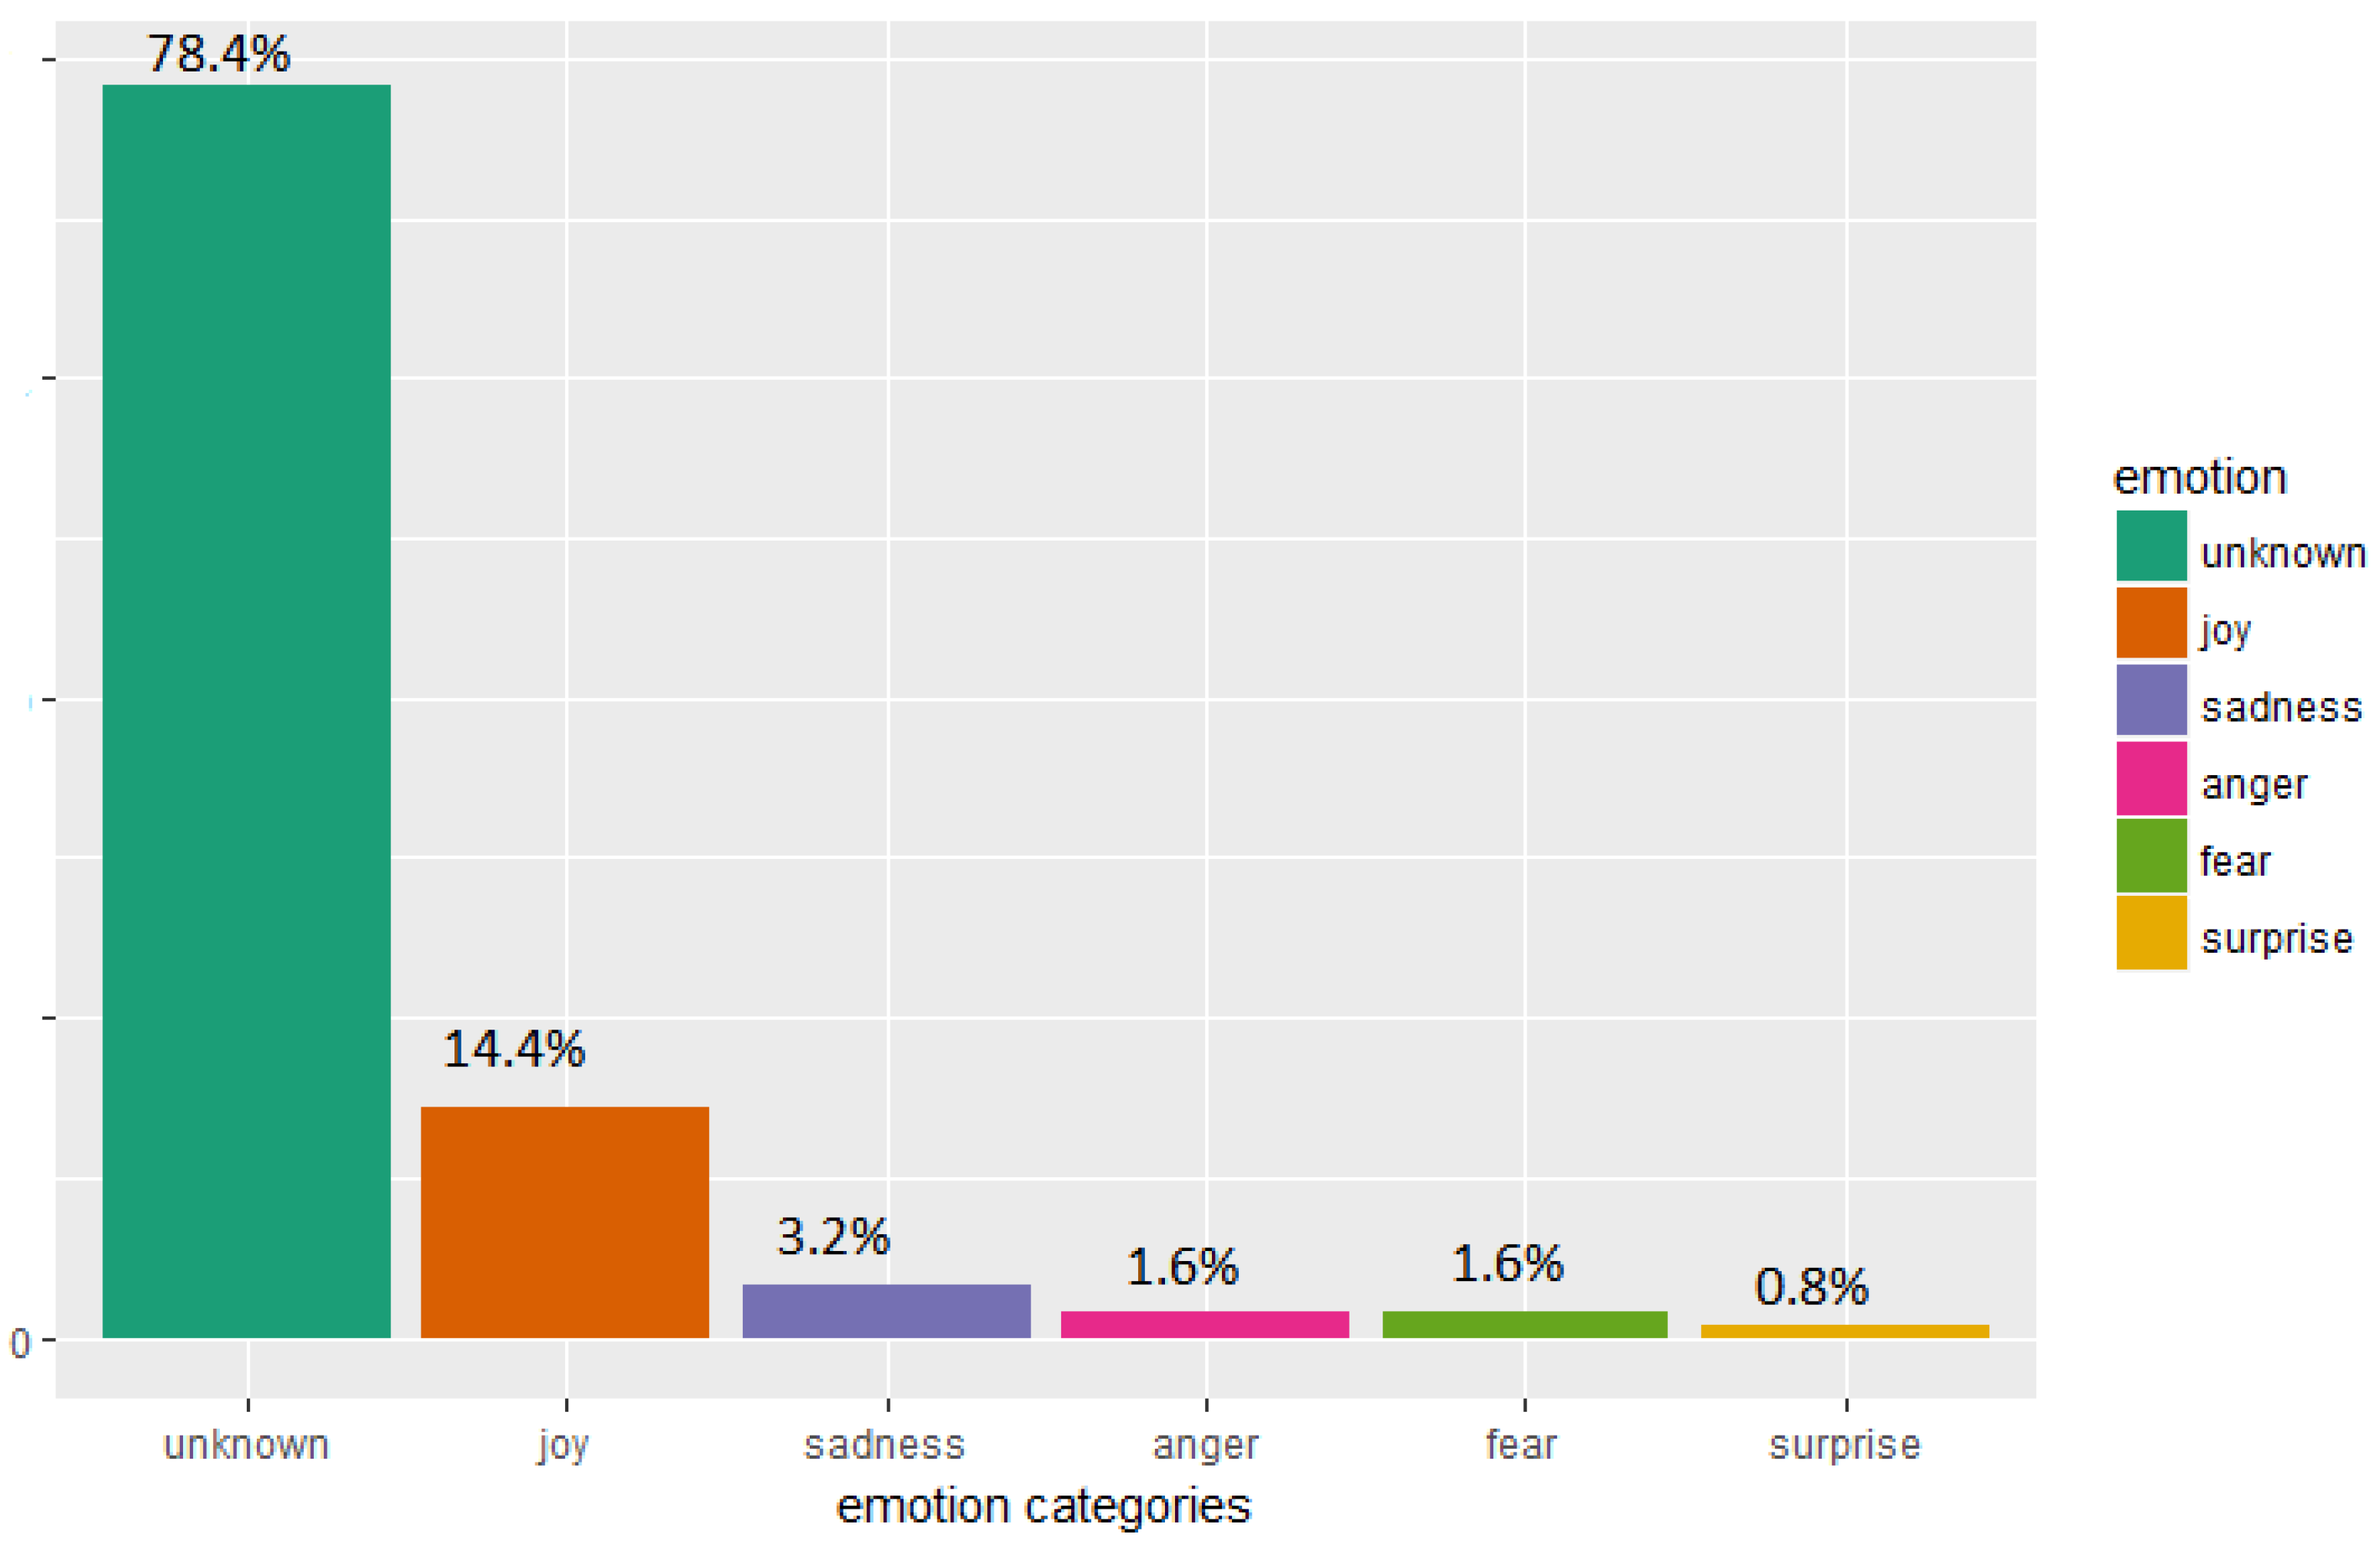
The process commences with the results of the application of the sentiment package to President Trump’s 125 tweets. The emotional content of these is shown in Figure 1 . Ignoring the ‘unknown’ category, the predominant emotion recognised in Figure 1 is ‘joy’, which accounts for 14.4 per cent of the total, followed by ‘sadness’ at 3.2 percent. ‘Anger’ and ‘fear’ both account for 1.6 percent, and ‘surprise’ accounts for 0.8 per cent. 78.4 per cent of the tweets are not classified, but 14.4 per cent is classified as being ‘joy’, which is a positive emotion.
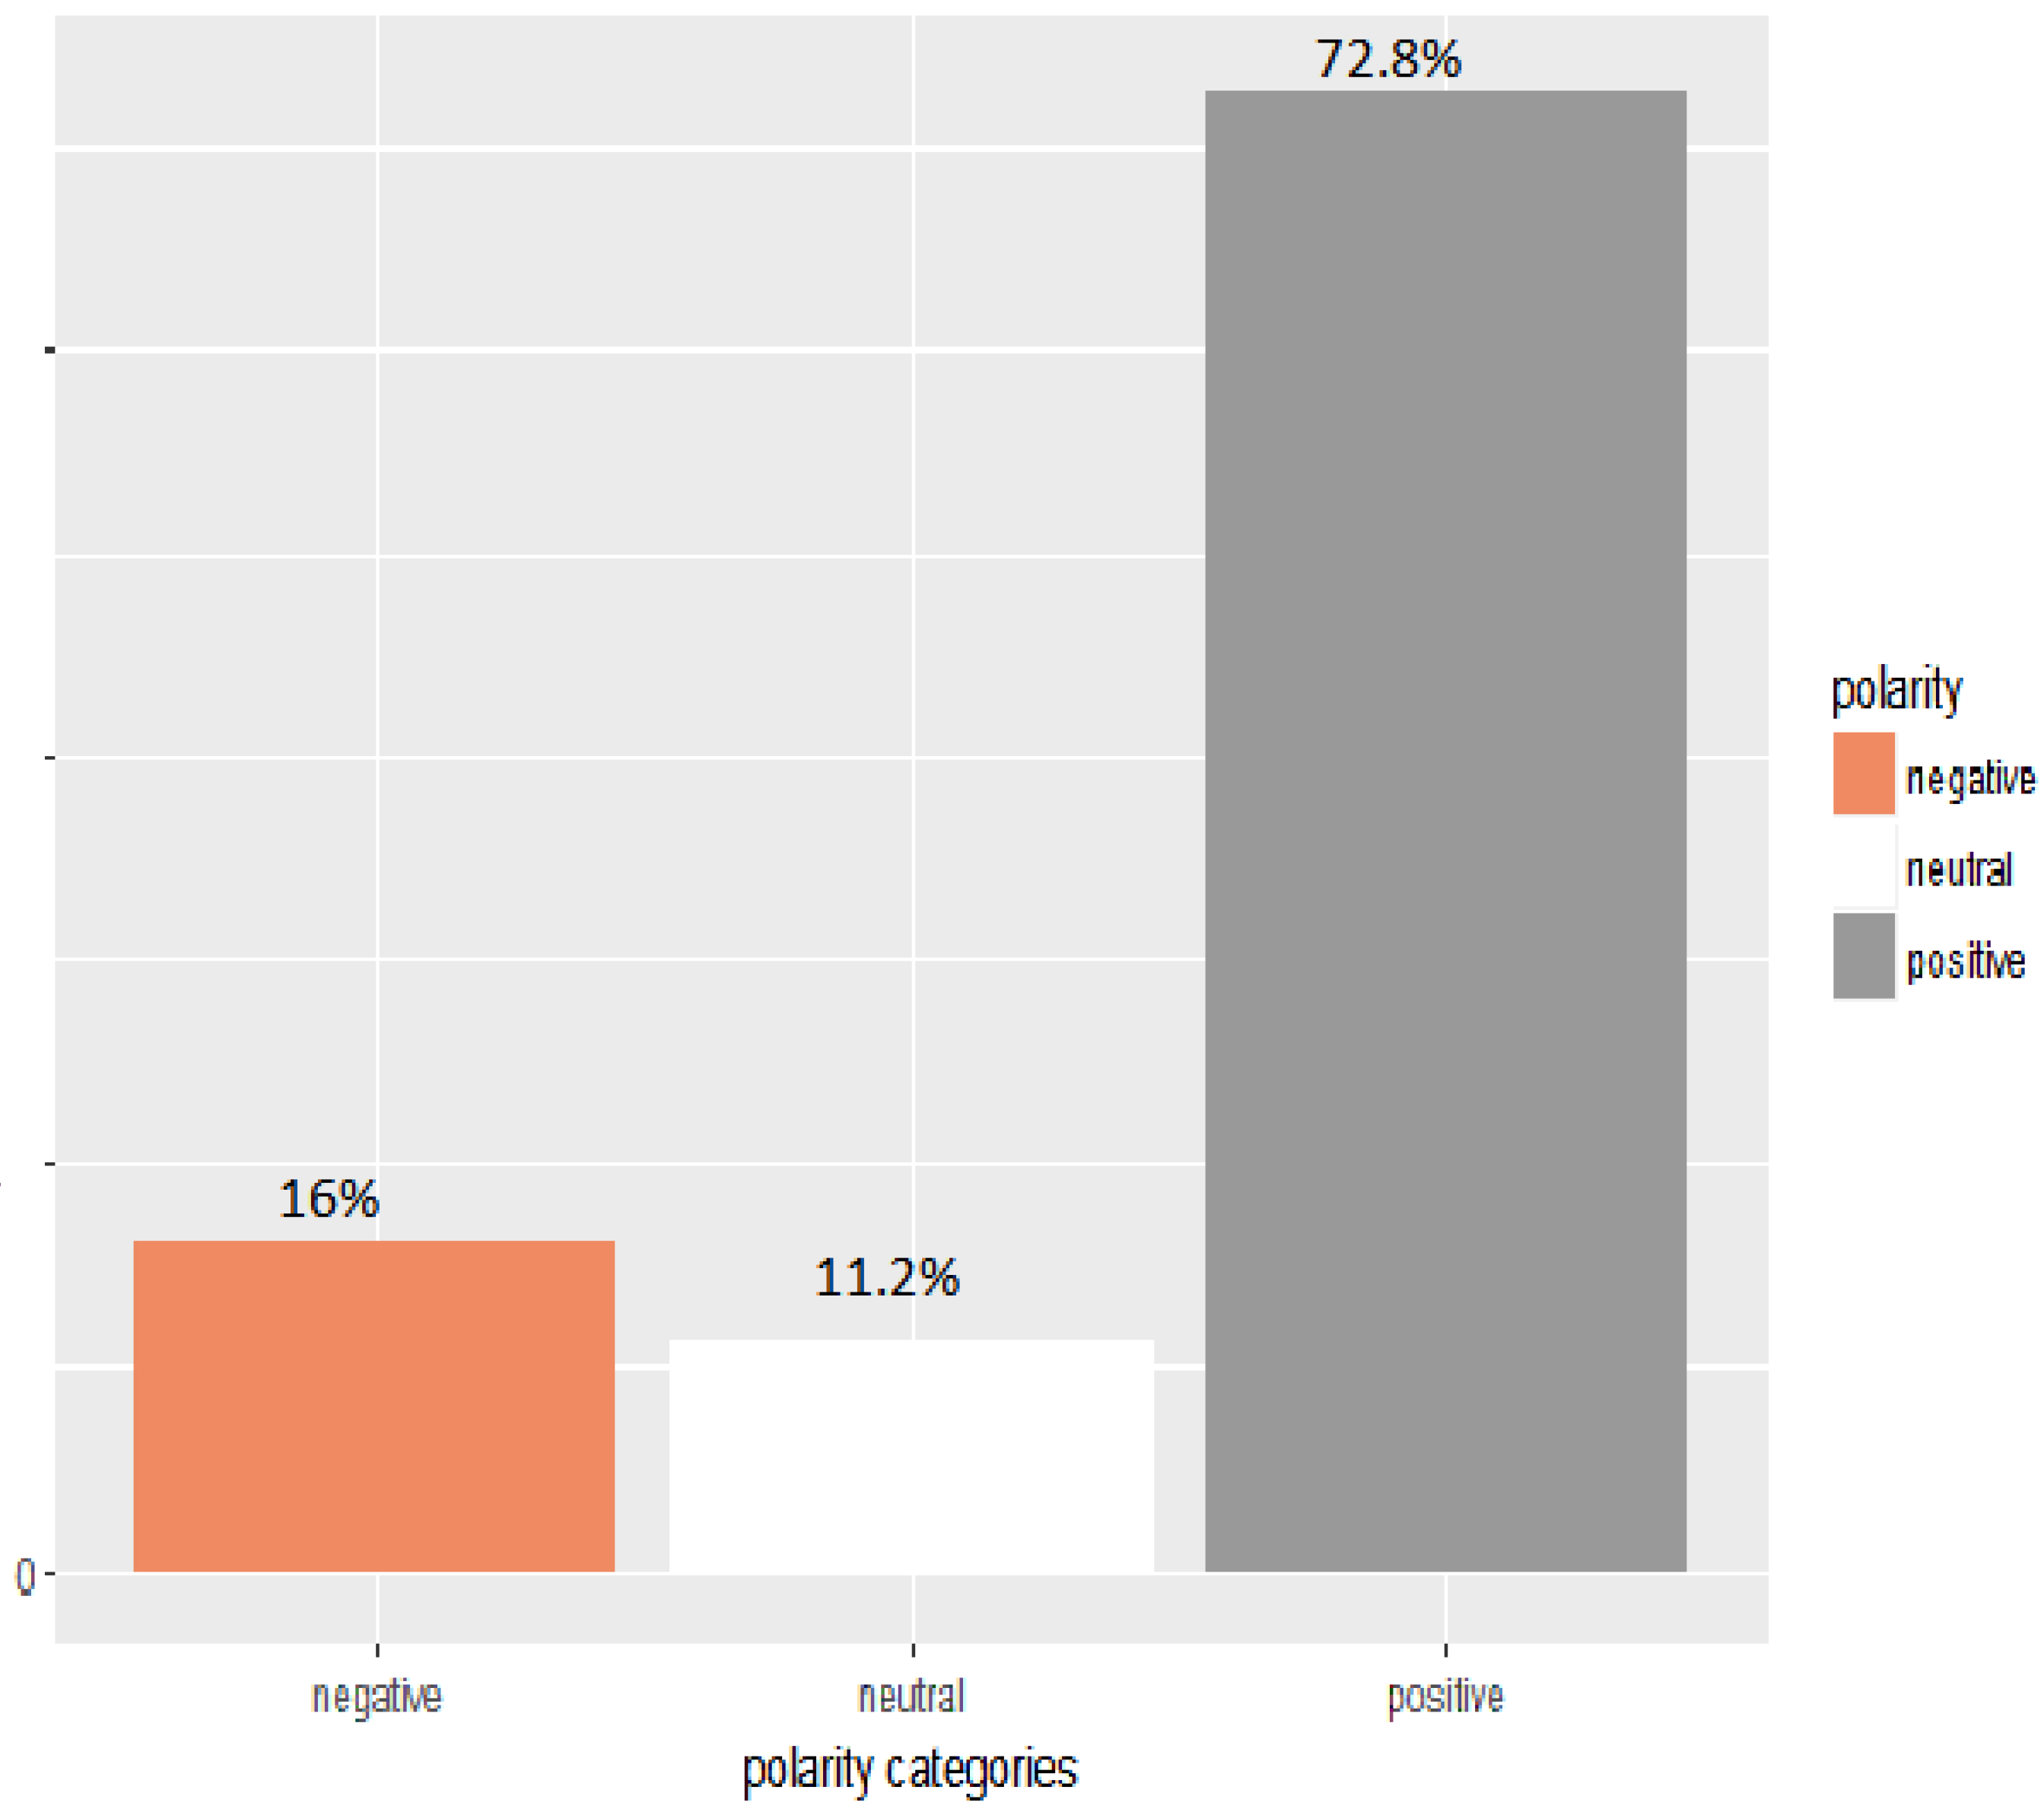
Figure 2 classifies the tweets by President Trump according to whether they are negative, neutral or positive. The majority of the classifications in Figure 2 is positive, accounting for 72.8 per cent, while 16 per cent is negative.
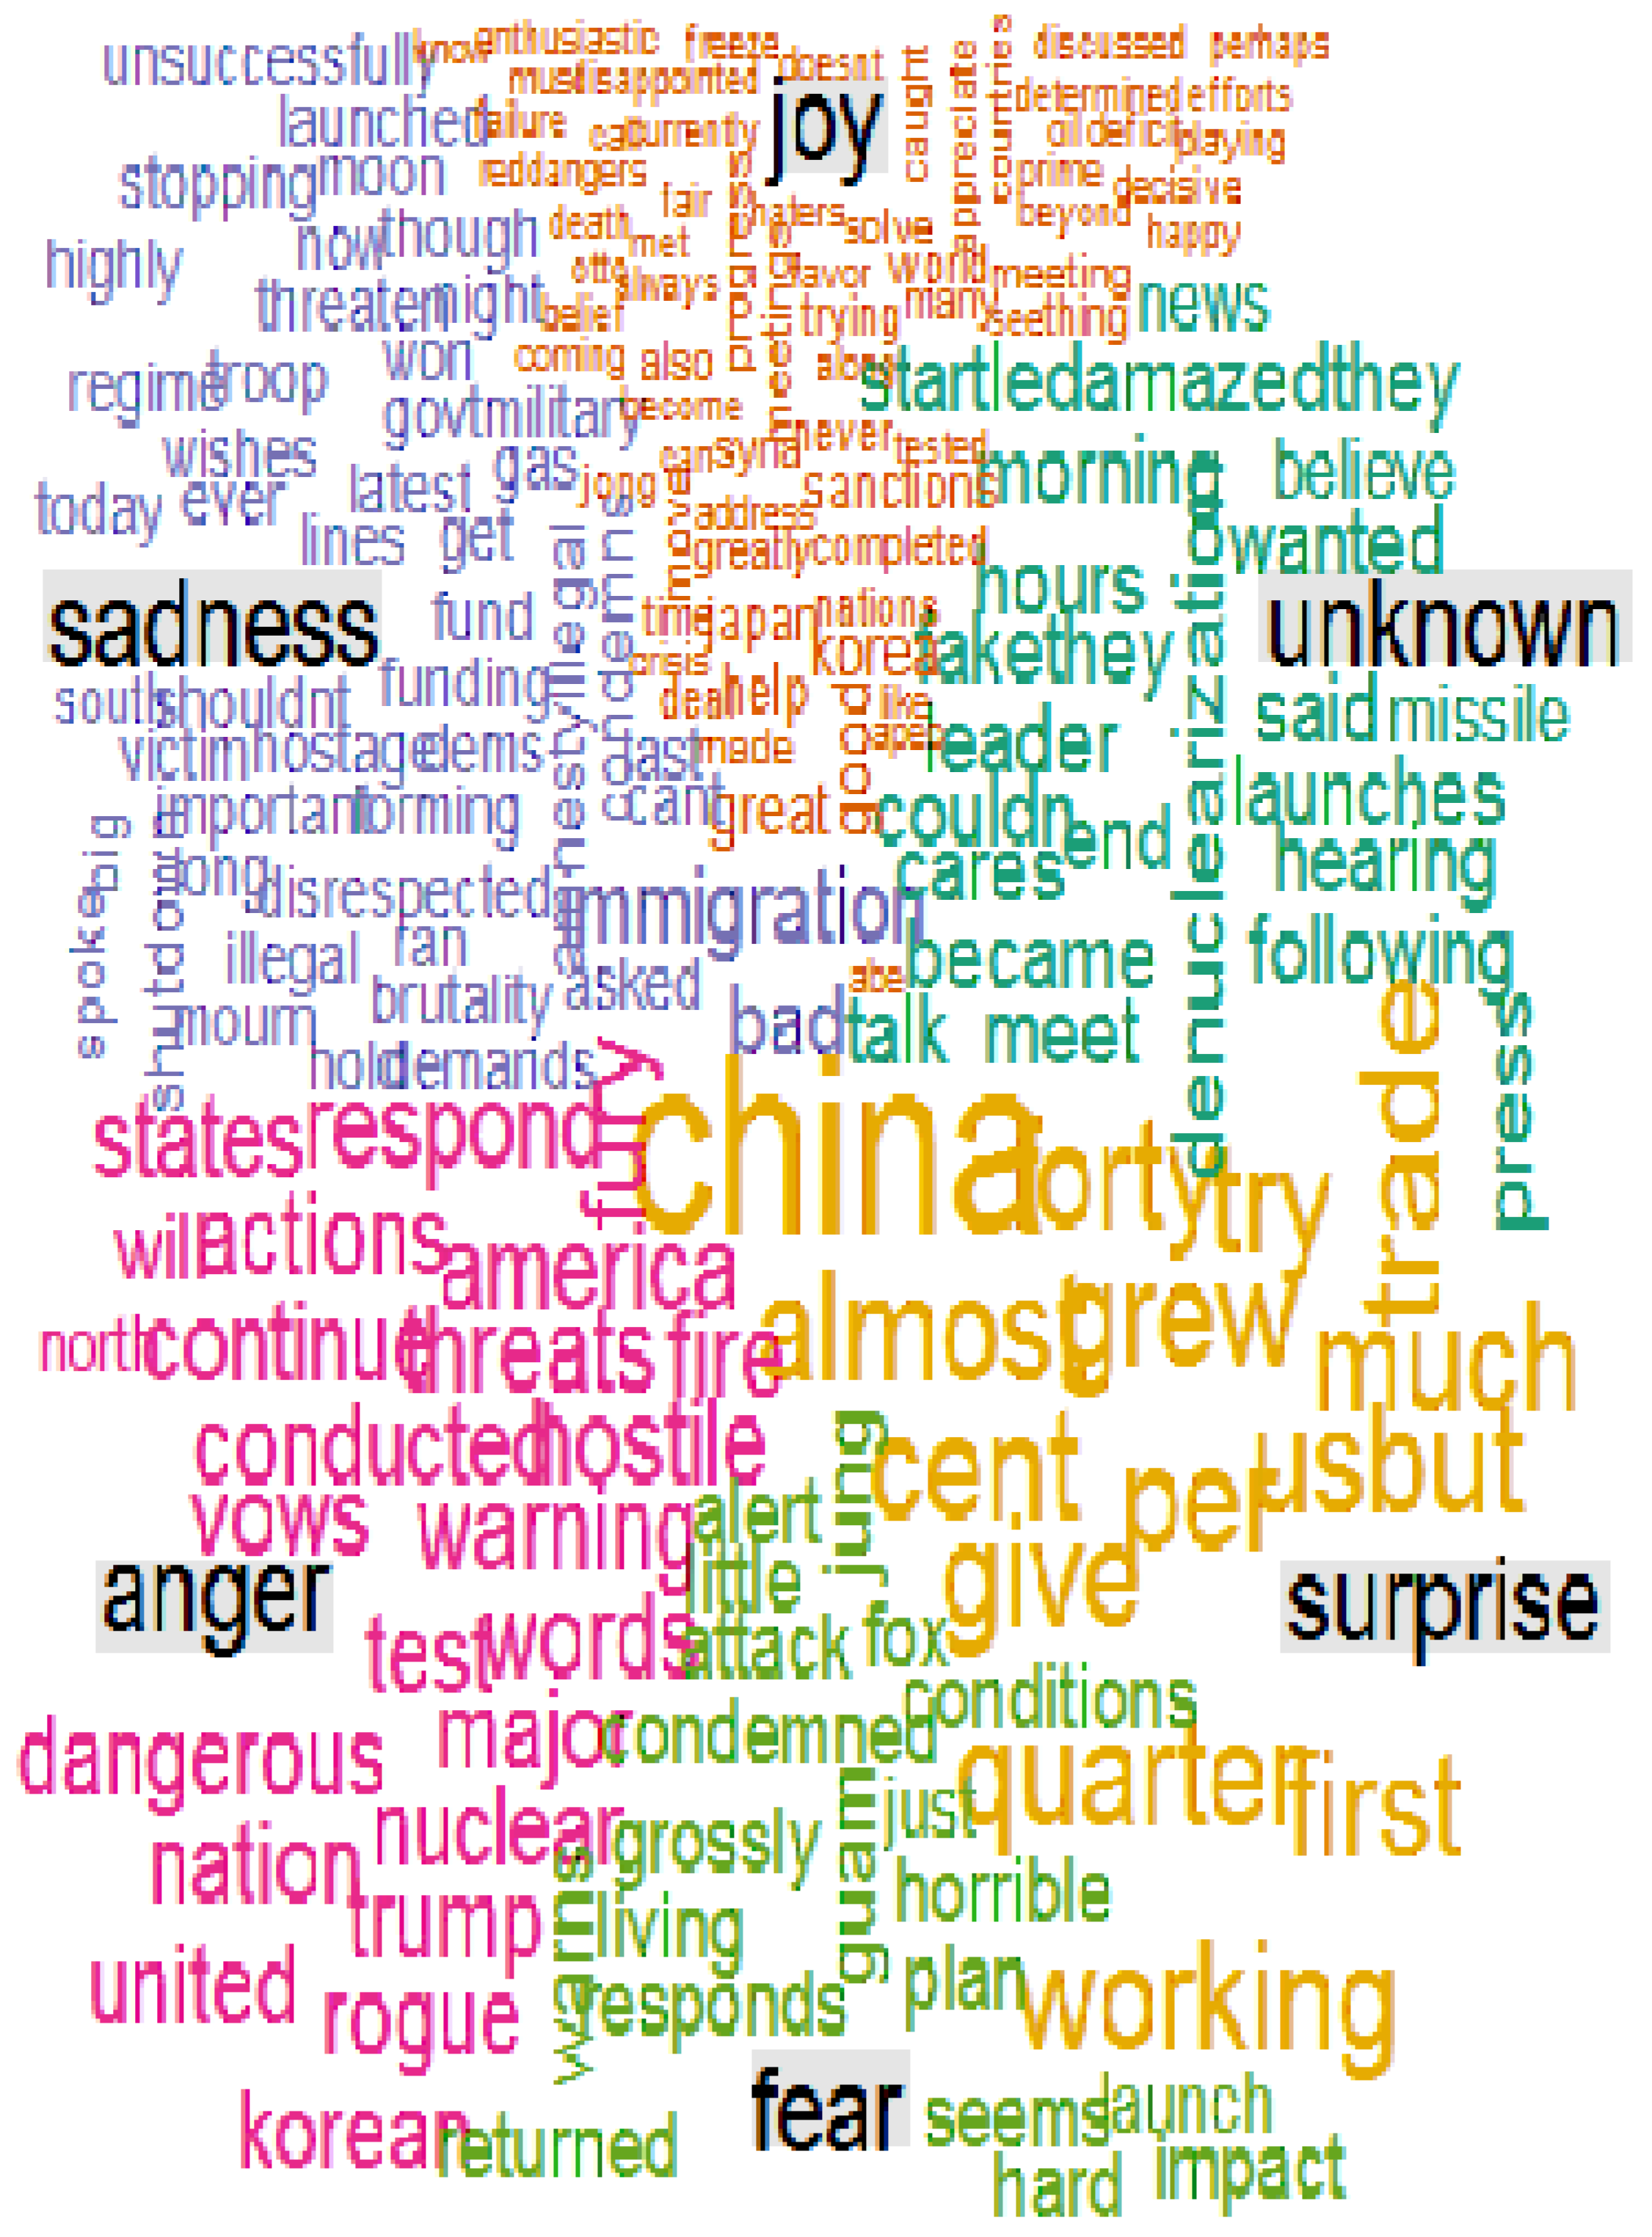
Figure 3 shows a word cloud analysis of Trump’s tweets. A word cloud is another form of visual representation of text data in which tags are single words, and their relative sizes and colours represent their weighting or importance in the context of the text considered.
The most prominent words in the word cloud in Figure 3 are ‘China’, ‘trade’, ‘US’, ‘working’ and ‘percent’. If we move around the cloud in an anti-clockwise manner, words in the ‘joy’ section include ‘enthusiastic’, ‘freeze’, ‘fair’, ‘Syria’, ‘sanctions’, ‘korea’, ‘discussed’, ‘completed’, ‘deal’, and so forth. In the ‘sadness’ section, we have ‘unsuccessful’, ‘launched’, ‘moon’, ‘threaten’, ‘regime; ‘military’, ‘gas’, ‘victim’, ‘hostage’, ‘immigration’, ‘brutality’, and so on.
In the ‘anger’ section below, we have ‘America’, ‘threats’, ‘respond’, ‘hostile’, ‘conducted’, ‘nuclear’, ‘test’, ‘dangerous’,‘rogue’, ‘korean’, and so on. In the ‘fear’ section, we see ‘alert’, ‘attack’, ‘condemned’, ‘grossly’, ‘launch’, ‘impact’, and so on. In the ‘surprise’ section, we have ‘China’, ‘working’, ‘grew’, ‘US’, ‘per cent’, ‘trade’, and so forth. The ‘unknown’ section has a diverse grouping of words, with ‘news’ and ‘sadness’, ‘launches’, ‘talk’, ‘meet’, ‘press’, and ‘working’, given prominence.
2.2. Bootstrapped t Tests
In a companion paper, Allen et al. [1] use sentiment analysis to analyse some of President Trump’s tweets on the topic of climate change, takn from 2011 to 2015. On a global issues scale, it is worth comparing the sentiment scores of his tweets on North Korea and Supreme Leader Kim Jong-Un, with his tweets on climate change. We use bootstrapped t tests because the number of tweets analysed are different, namely 125 in the North Korean sample and 115 in the climate change sample.
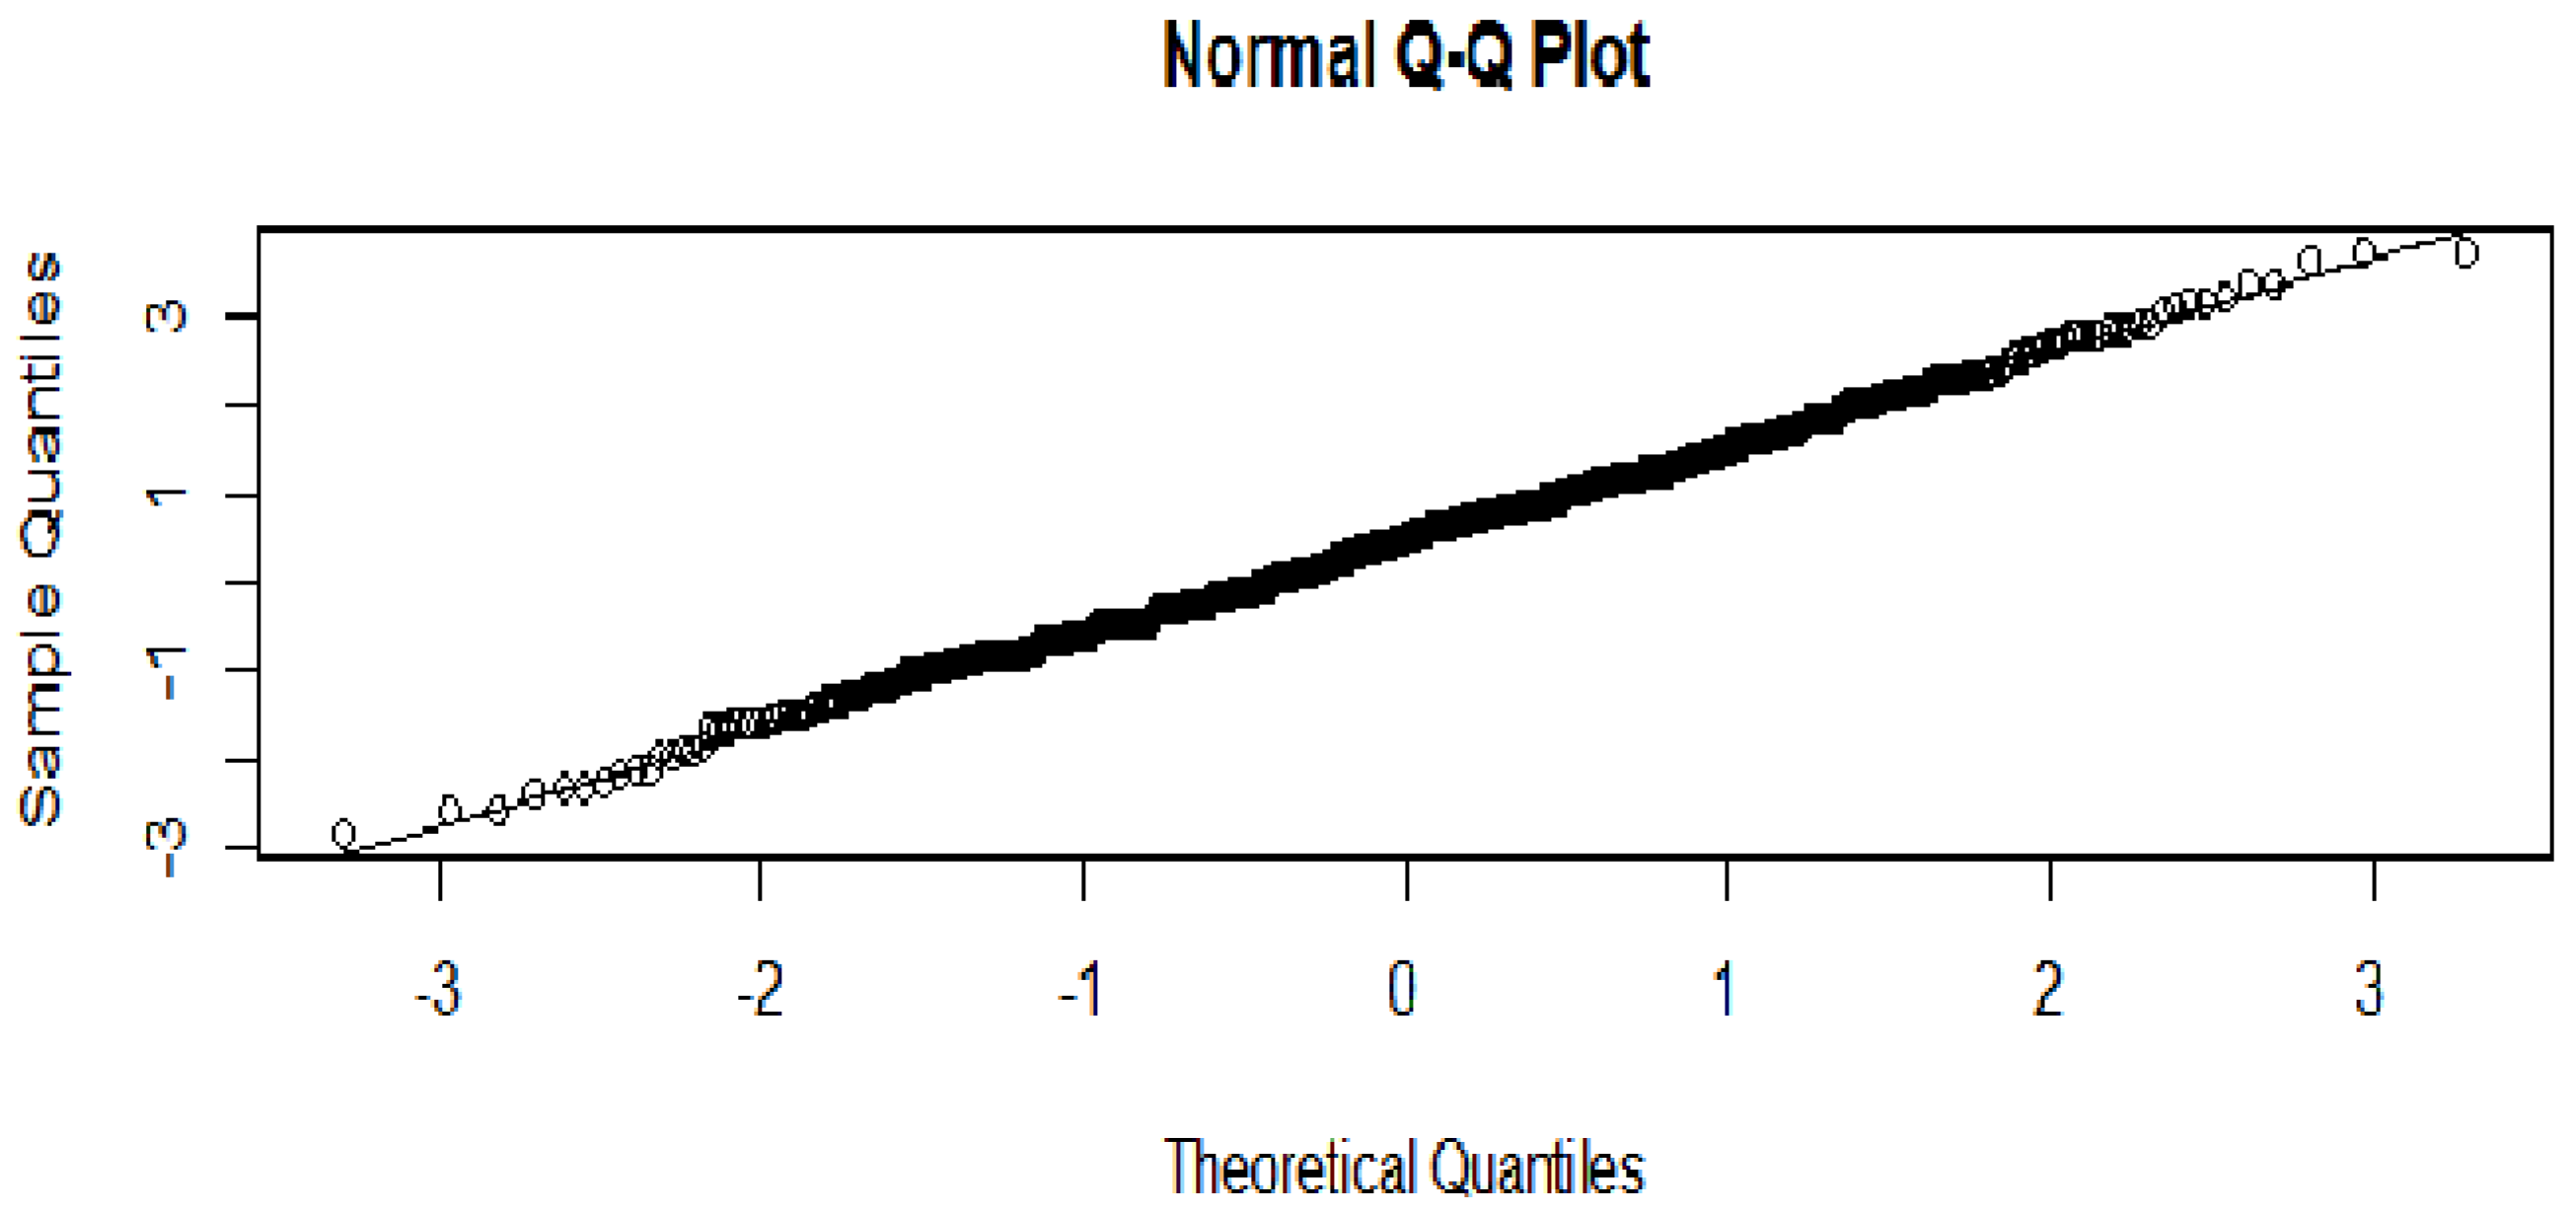
The results presented in Table 1 show that there is no significant difference in the bootstrapped t tests, using 1000 samples with replacement. Figure 4 shows that the bootstrapped t test vector QQ plot is consistent with a Gaussian distribution.
A comparison was also made of the ‘polarity’ scores for President Trump’s North Korean and Supreme Leader Kim Jong-Un tweets and his climate tweets. The mean polarity score for his North Korean Supreme Leader Kim Jong-Un tweets is 13.59, and 9.46 for his climate change tweets. The results are shown in Table 2. In terms of the results of the bootstrapped t tests, his tweets on North Korea have significantly higher positive polarity scores than his tweets on climate change.
3. Conclusions
This paper featured a sentiment analysis of 125 of President Trump’s tweets on North Korea’s Supreme Leader Kim Jong-Un. The sentiment analysis classified this series of tweets into five different emotional categories, with a large proportion of the total, 78 per cent, remaining unclassified. A comparison with the results in a companion paper featuring an analysis of President Trump’s climate change tweets, using the ‘joy’ score reveals no significant differences in the scores for the two sets of tweets using bootstrapped t tests.
However, when the the coarser polarity classification is applied, using three categories, namely positive, negative and neutral, all the tweets can be classified. The results suggest that President Trump is far more positive in his tweets about North Korea than he is about climate change. This is confirmed by the results of the bootstrapped t tests.
In comparing the tweets on North Korea and climate change, on which Trump has tweeted many times, it is interesting to note that the tweets on North Korea have significantly higher positive polarity scores than his tweets on climate change.
It seems clear that President Trump likes to convey positive messages via his twitter feed, even when he faces thorny diplomatic challenges, as exemplified by North Korea’s Supreme Leader Kim Jong-Un, or difficult scientific policy issues, such as climate change. It remains to be seen whether positive tweet sentiments assist or add to the complications faced in the resolution of these pressing and difficult global issues. “Stay tuned!”
Author Contributions
Conceptualization, M.M.; Data curation, D.E.A.; Methodology, D.E.A. and M.M.; Software, D.E.A.; Validation, M.M.; Writing—original draft, D.E.A.; Writing—review and editing, M.M.
Acknowledgments
The authors are most grateful for the helpful comments and suggestions of three reviewers. For financial support, the first author acknowledges the Australian Research Council, and the second author is most grateful to the Australian Research Council, Ministry of Science and Technology (MOST), Taiwan, and the Japan Society for the Promotion of Science.
Conflicts of Interest
The authors declare no conflict of interest.
References
- Allen, D.E.; McAleer, M. Fake News and Indifference to Scientific Fact: President Trump’s Confused Tweets on Global Warming, Climate Change and Weather; Econometric Institute Research Paper EI2018-24; Econometric Institute, Erasmus School of Economics (ESE), Erasmus University Rotterdam: Rotterdam, The Netherlands, 2018. [Google Scholar]
- Allen, D.E.; McAleer, M.; Reid, D.M. Fake News and Indifference to Truth: Dissecting Tweets and State of the Union Addresses by Presidents Obama and Trump; Tinbergen Institute Discussion Paper, TI 2018-020/III; Tinbergen Institute: Amsterdam, The Netherlands; Rotterdam, The Netherlands, 2018. [Google Scholar]
- De Vries, A. Sentiment Package. 2012. Available online: https://github.com/andrie/sentiment/blob/master/DESCRIPTION (accessed on 1 February 2018).
Figure 1.
Trump’s North Korea tweet sentiment.

Figure 2.
Trump’s Korea tweet sentiment polarity.

Figure 3.
Trump’s North Korea tweets word cloud.

Figure 4.
QQ plot of t: vector ‘joy’ comparisons.


Table 1.
Bootstrapped t test of the differences in the means in Trump’s North Korea Tweets: emotion score ‘joy’ mean and Trump Climate Change Tweets emotion score ‘joy’.
Table 1.
Bootstrapped t test of the differences in the means in Trump’s North Korea Tweets: emotion score ‘joy’ mean and Trump Climate Change Tweets emotion score ‘joy’.
| Trump’s North Korea Tweets ‘Joy’ vs. Trump’s Climate Change ‘Joy’ | |||
|---|---|---|---|
| mean t = 0.467 | mean p-value = 0.4521 | ||
| probability vect | 1st Quartile | median | 3rd Quartile |
| probability | 0.2016 | 0.4215 | 0.6936 |
| t vector | −0.2823 | 0.4941 | 1.1632 |
Table 2.
Bootstrapped t test of the differences in means in Trump’s North Korea Tweets; positive polarity score mean and Trump’s Climate Change Tweets positive polarity score.
Table 2.
Bootstrapped t test of the differences in means in Trump’s North Korea Tweets; positive polarity score mean and Trump’s Climate Change Tweets positive polarity score.
| Trump’s North Korea Tweets; Positive Polarity score versus Trump’s Climate Change Positive Polarity score | |||
|---|---|---|---|
| mean t = 3.35 | mean p-value = 0.0181 | ||
| probability vect | 1st Quartile | median | 3rd Quartile |
| probability | 0 | 0.0001 | 0.008 |
| t vector | 2.67 | 3.34 | 3.996 |
© 2018 by the authors. Licensee MDPI, Basel, Switzerland. This article is an open access article distributed under the terms and conditions of the Creative Commons Attribution (CC BY) license (http://creativecommons.org/licenses/by/4.0/).
Share and Cite
MDPI and ACS Style
Allen, D.E.; McAleer, M. President Trump Tweets Supreme Leader Kim Jong-Un on Nuclear Weapons: A Comparison with Climate Change †. Sustainability 2018, 10, 2310. https://doi.org/10.3390/su10072310
AMA Style
Allen DE, McAleer M. President Trump Tweets Supreme Leader Kim Jong-Un on Nuclear Weapons: A Comparison with Climate Change †. Sustainability. 2018; 10(7):2310. https://doi.org/10.3390/su10072310
Chicago/Turabian StyleAllen, David E., and Michael McAleer. 2018. "President Trump Tweets Supreme Leader Kim Jong-Un on Nuclear Weapons: A Comparison with Climate Change †" Sustainability 10, no. 7: 2310. https://doi.org/10.3390/su10072310
Note that from the first issue of 2016, this journal uses article numbers instead of page numbers. See further details here.